Revision Notes
Cambridge O Level Statistics: Formation of Frequency Distributions (4040) – Revision Notes
Condensed notes on class limits, class boundaries, mid-points and class intervals for grouped frequency tables in Cambridge O Level Statistics.
- Subject
- Statistics
- Level
- O LEVELS
- Topic
- Formation of data into ungrouped or grouped frequency distributions
- Author
- Marlbridge Academic Team
- Updated
- Reviewed by
- Sajawal Zahid (what this means)
Aligned to Cambridge O Level Statistics (4040), For examination in 2025-2027. Official specification .
Syllabus page (what it covers and how it is assessed): Cambridge O Level Statistics.
Syllabus points this page covers
4040
- 3.1 Class measures for grouped frequency distributions
Found an error? Report a correction.
Need help with this topic? Request a free trial class for O Level Statistics (4040).
These revision notes cover section 3.1 of the Cambridge O Level Statistics (4040) syllabus for examination in 2025, 2026 and 2027: class measures for grouped frequency distributions, meaning class limits, boundaries and mid-points, and class intervals. For the wider topic read the study guide. When you are ready to test yourself, use the practice questions, the Cambridge O Level Statistics hub, the printable checklist and the free diagnostics.
Drawing the polygons and histograms that come after this step is covered separately in the frequency polygons and histograms notes. Using mid-points to estimate a mean is in the averages study guide.
The four class measures
| Measure | Meaning | How you find it |
|---|---|---|
| Class interval | The range of values that one row of the table covers | Read it from the table heading |
| Class limits | The lowest and highest values that can be written in that class, as printed | Read them from the table |
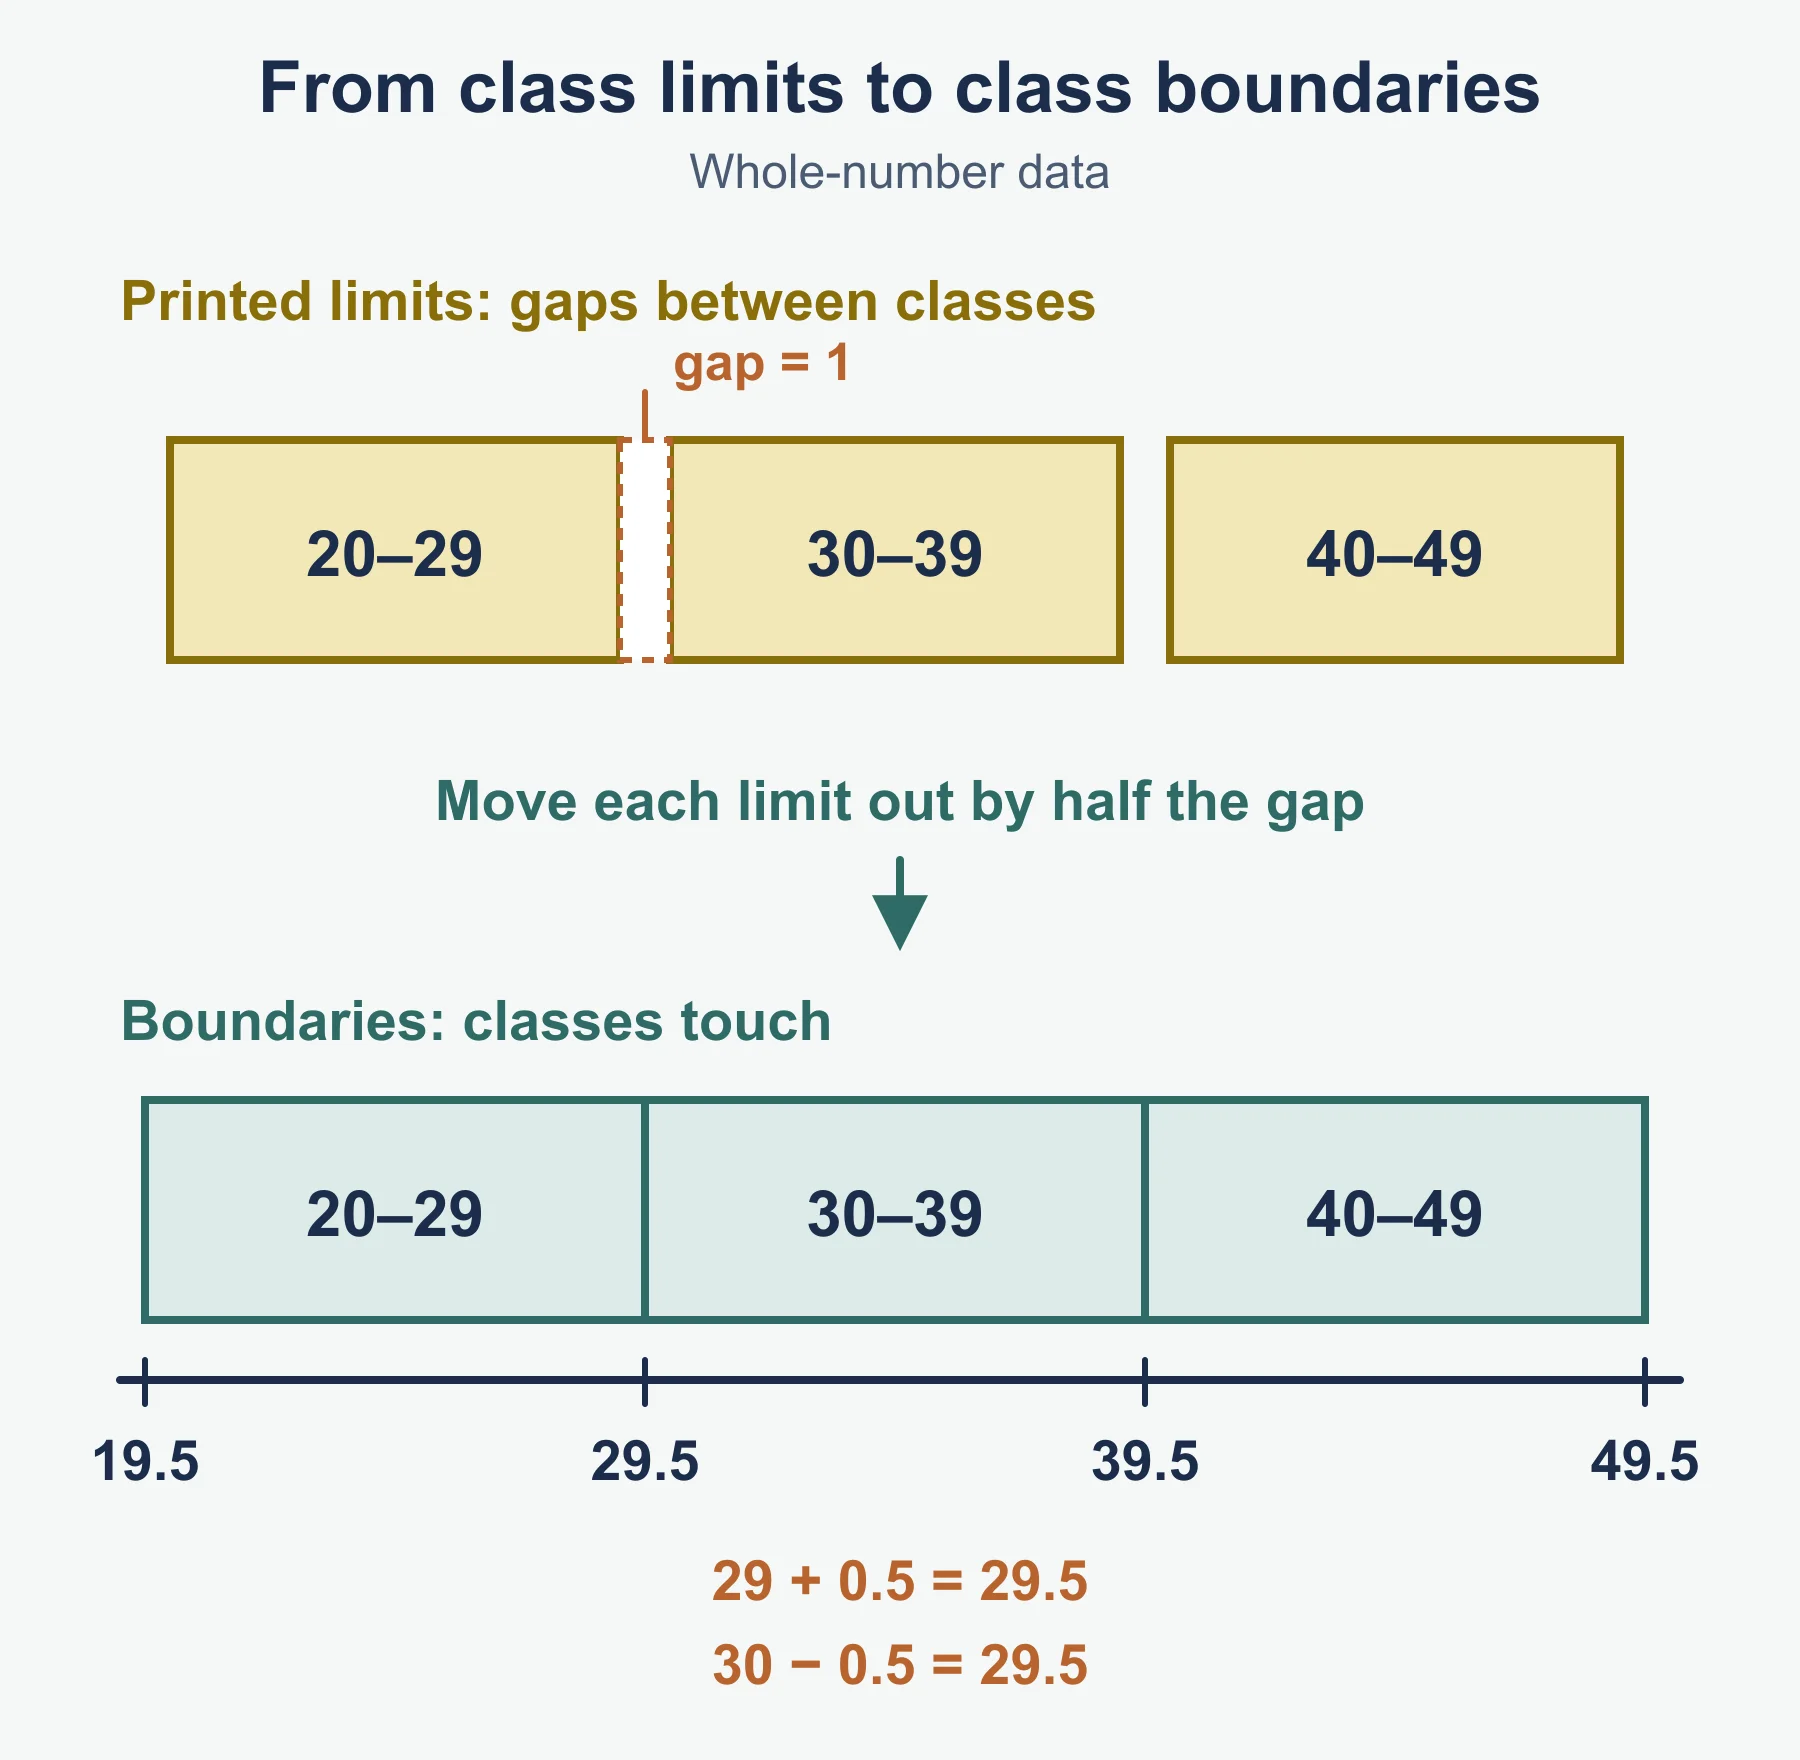
| Class boundaries | The exact edges of the class on the number line, with no space left between neighbouring classes | Move each limit out by half of the gap between classes |
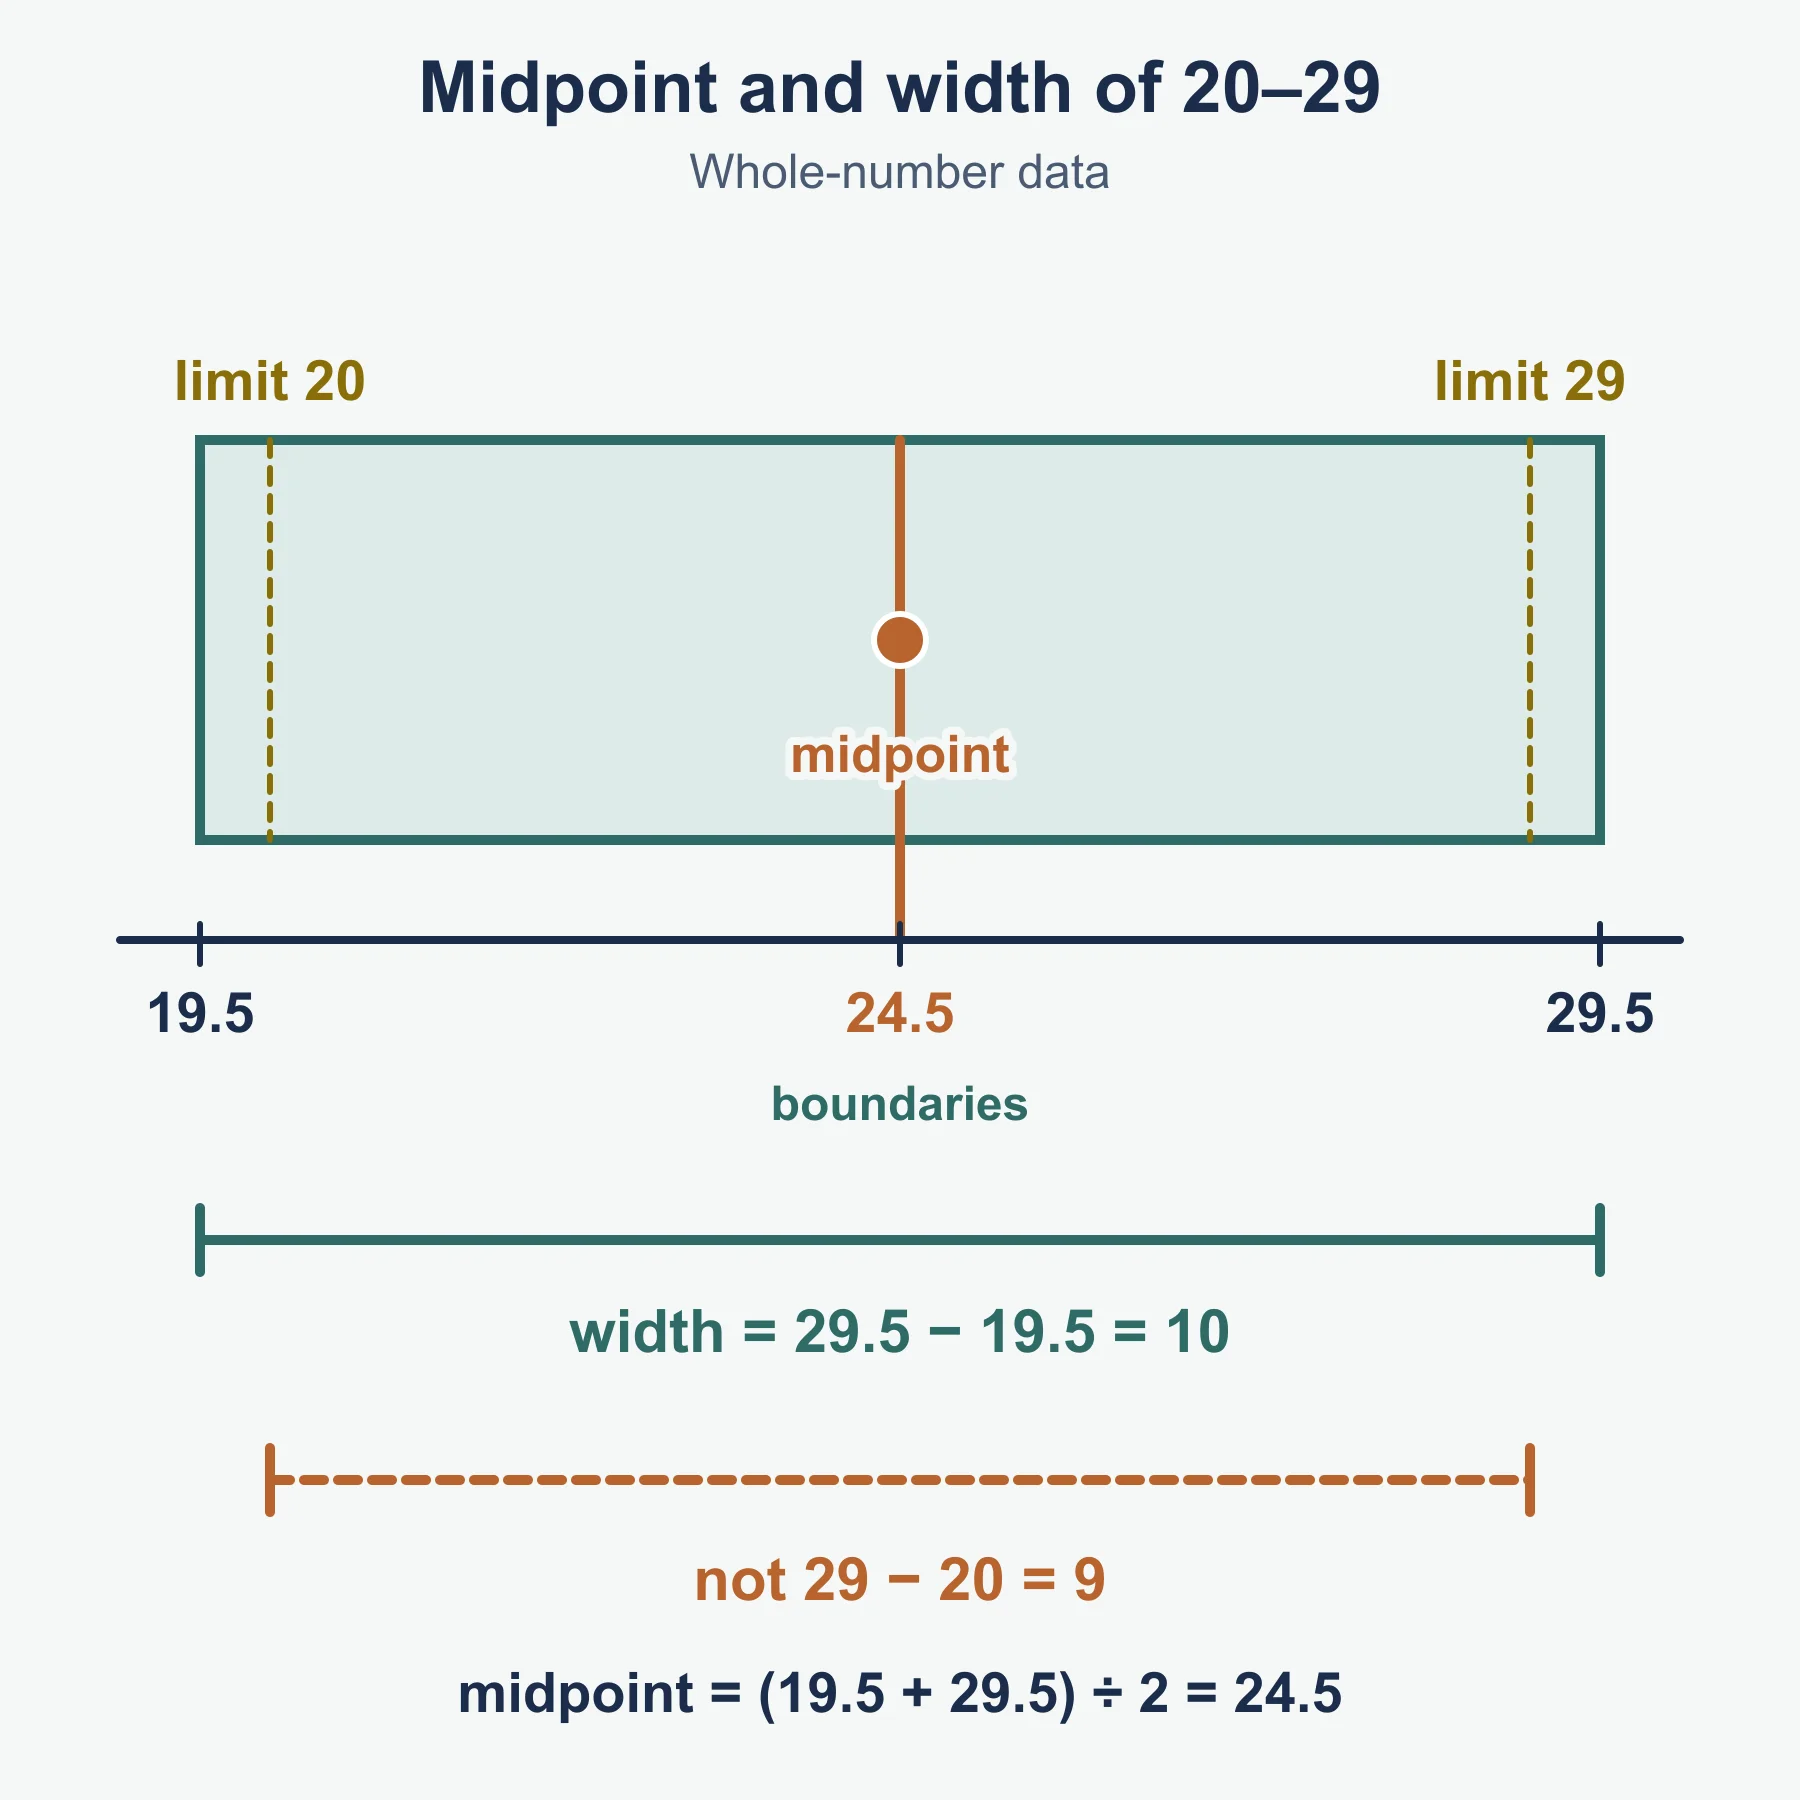
| Class mid-point | The value halfway across the class | Add the two boundaries and halve |
The words “class interval” are used in two ways. Sometimes they mean the class itself, such as 20-29. Sometimes they mean its width. Check which one the question wants. When the question says “width”, it wants a number.
Three ways a class is written
| Style | Example | Used for | Boundaries |
|---|---|---|---|
| Limits with a hyphen | 40-44 | Data recorded in steps, such as whole kilograms | Not printed: work them out |
| Limits with decimals | 2.0-2.4 | Data recorded to a set number of decimal places | Not printed: work them out |
| Inequality | 135 ≤ h < 145 | Continuous measurements | Already printed: 135 and 145 |
A class written as an inequality needs no adjustment. The numbers you see are the boundaries. A class with a hyphen needs the half-gap step below.
Formulas to recall
| Quantity | Rule |
|---|---|
| Gap between classes | Next lower limit minus this upper limit |
| Lower boundary | Lower limit minus half of the gap |
| Upper boundary | Upper limit plus half of the gap |
| Class width | Upper boundary minus lower boundary |
| Mid-point | (lower boundary + upper boundary) ÷ 2 |
| Class width, shortcut | Next lower limit minus this lower limit (when classes touch or are separated by one equal gap) |
Method in steps: from limits to measures
- Write down the stated lower and upper limits.
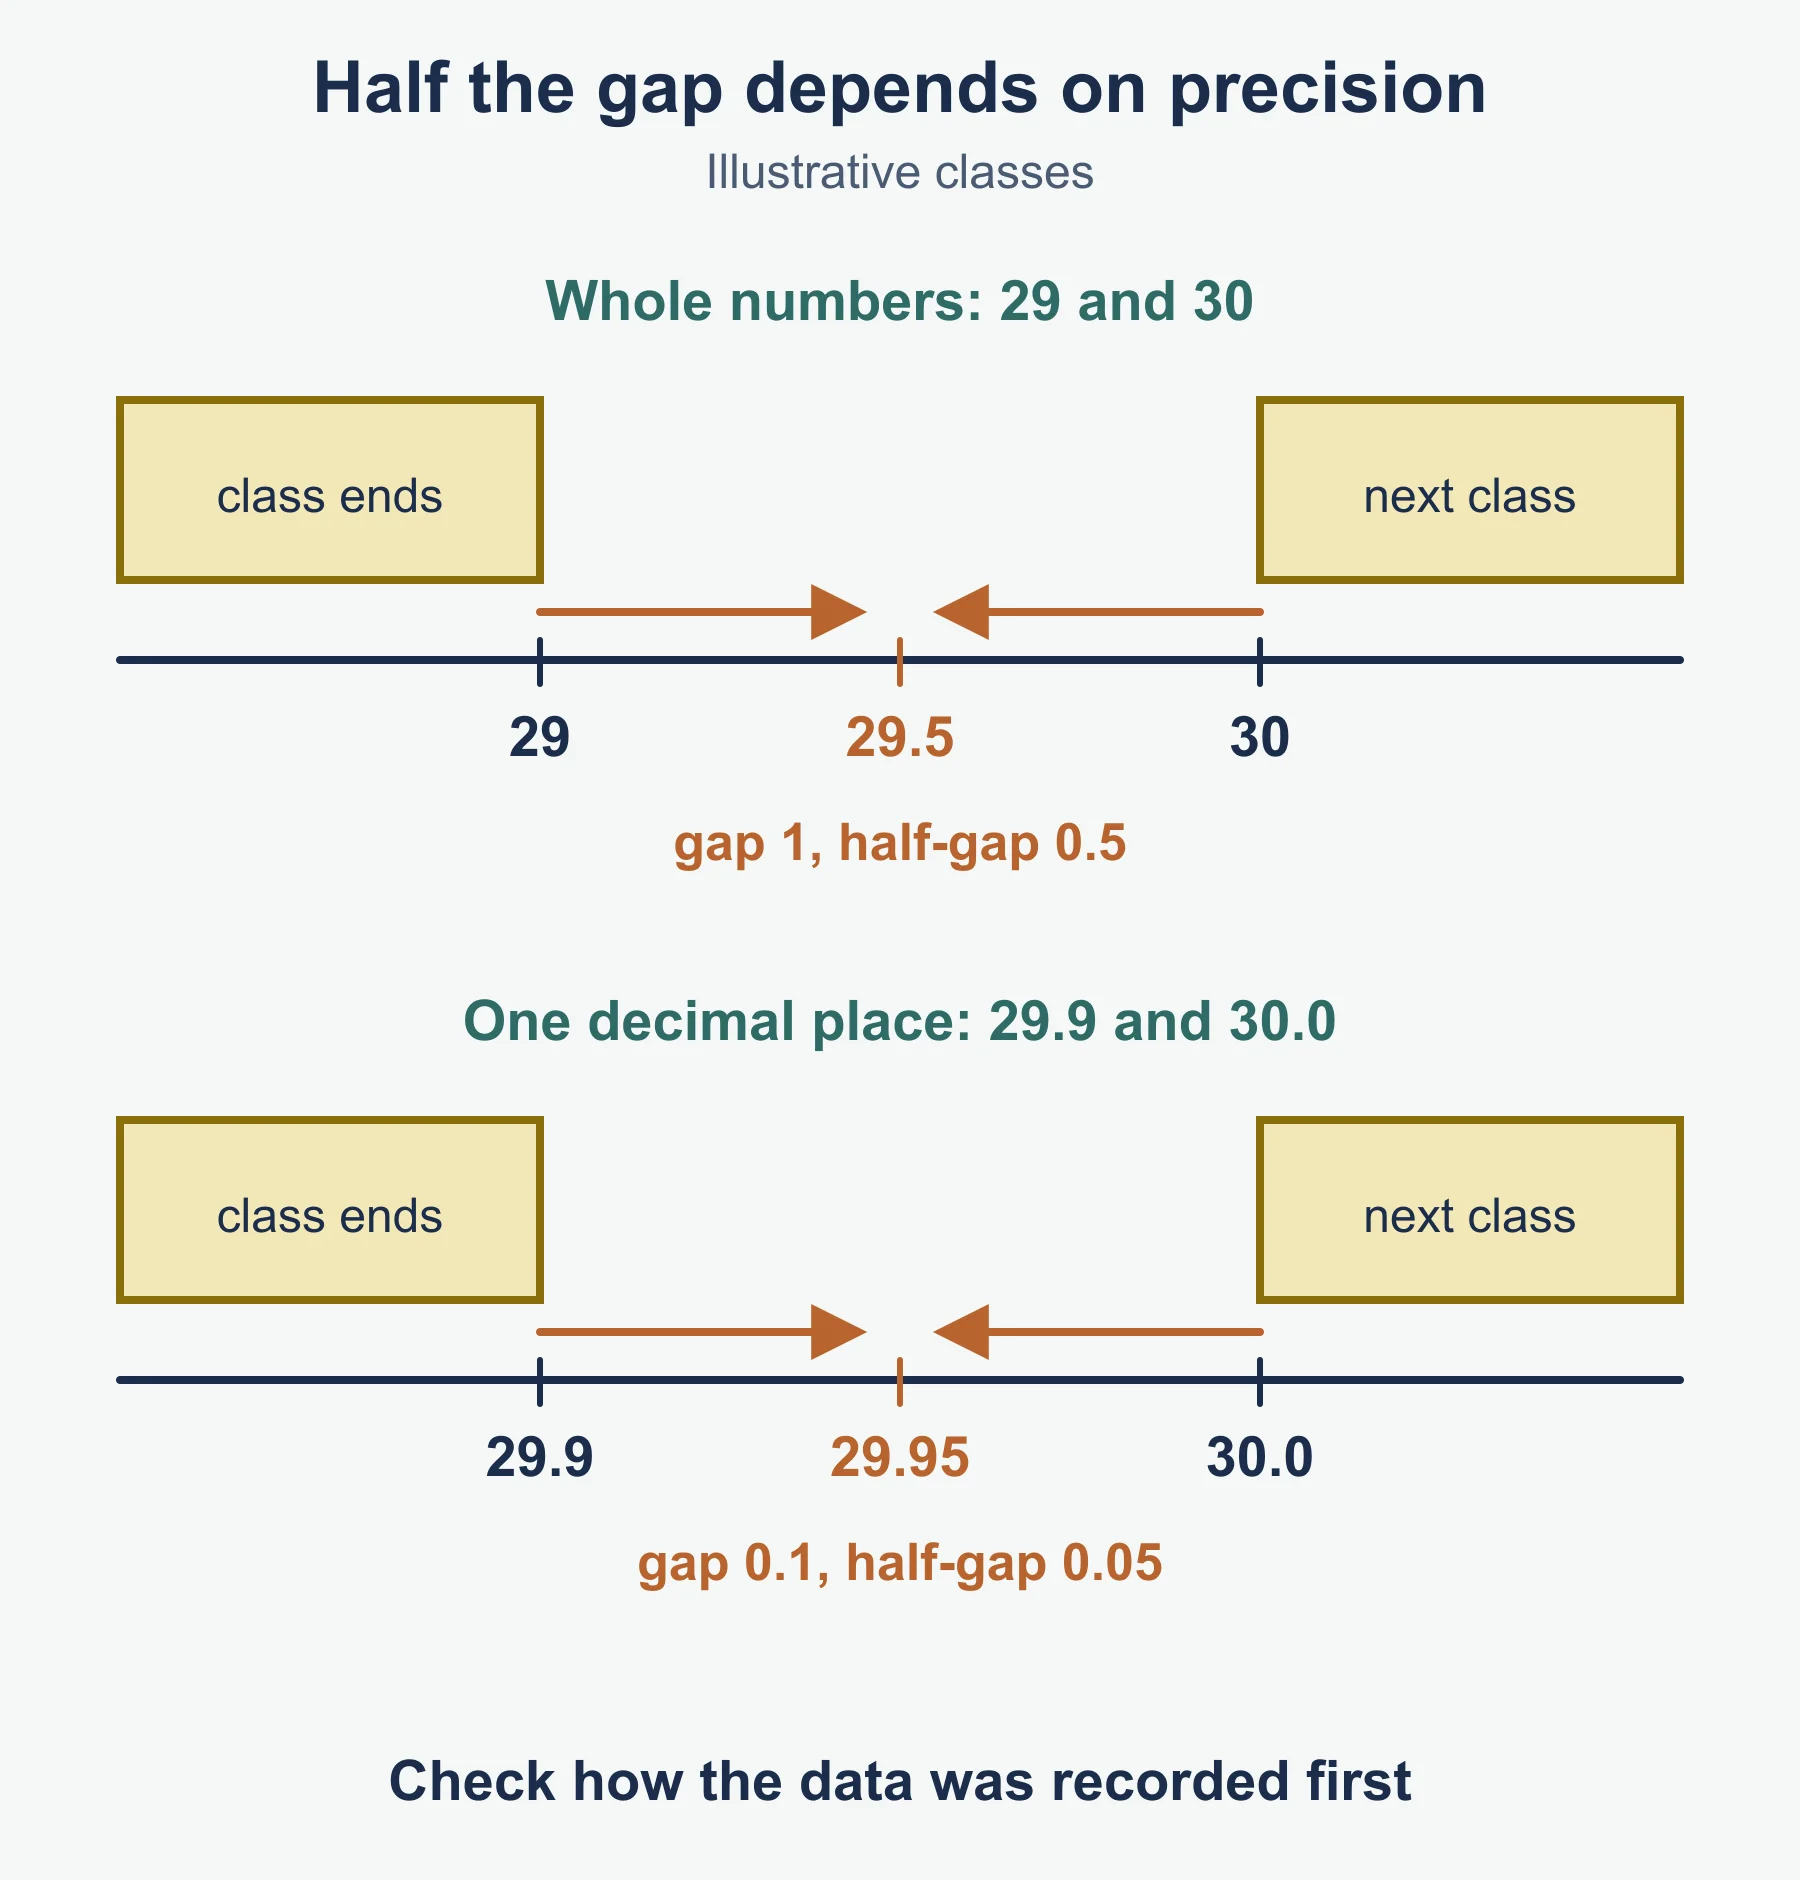
- Find the gap to the next class. For whole numbers it is 1, for one decimal place it is 0.1, for two decimal places it is 0.01.
- Halve the gap. Subtract it from the lower limit and add it to the upper limit.
- Subtract the boundaries to get the width.
- Add the boundaries and halve to get the mid-point.
- Check: the width of the class and the distance between its mid-point and each boundary should agree. The mid-point is exactly half a width from each edge.
Small worked reminders
Whole kilograms. Masses are recorded to the nearest kilogram and one class is 40-44. The next class starts at 45, so the gap is 1 and the half-gap is 0.5. Boundaries: 39.5 and 44.5. Width: 44.5 − 39.5 = 5. Mid-point: (39.5 + 44.5) ÷ 2 = 42.
One decimal place. Lengths in metres are recorded to 1 d.p. and one class is 2.0-2.4. The next class starts at 2.5, so the gap is 0.1 and the half-gap is 0.05. Boundaries: 1.95 and 2.45. Width: 0.5. Mid-point: 2.2.
Inequality form. For 135 ≤ h < 145 the boundaries are 135 and 145. Width: 10. Mid-point: 140.
Ages in completed years. A class of 10-14 contains people whose age last birthday is 10, 11, 12, 13 or 14. Someone who is 14 years 11 months is still in it. The exact ages covered run from 10 up to, but not including, 15. Width: 5. Mid-point: 12.5. The mid-point of the printed limits would be 12, so do not use limits for ages unless the question tells you to.
Unequal widths. Classes 0 ≤ x < 10, 10 ≤ x < 30 and 30 ≤ x < 60 have widths 10, 20 and 30 and mid-points 5, 20 and 45.
Must-know distinctions
| Idea | Do not confuse it with | Test |
|---|---|---|
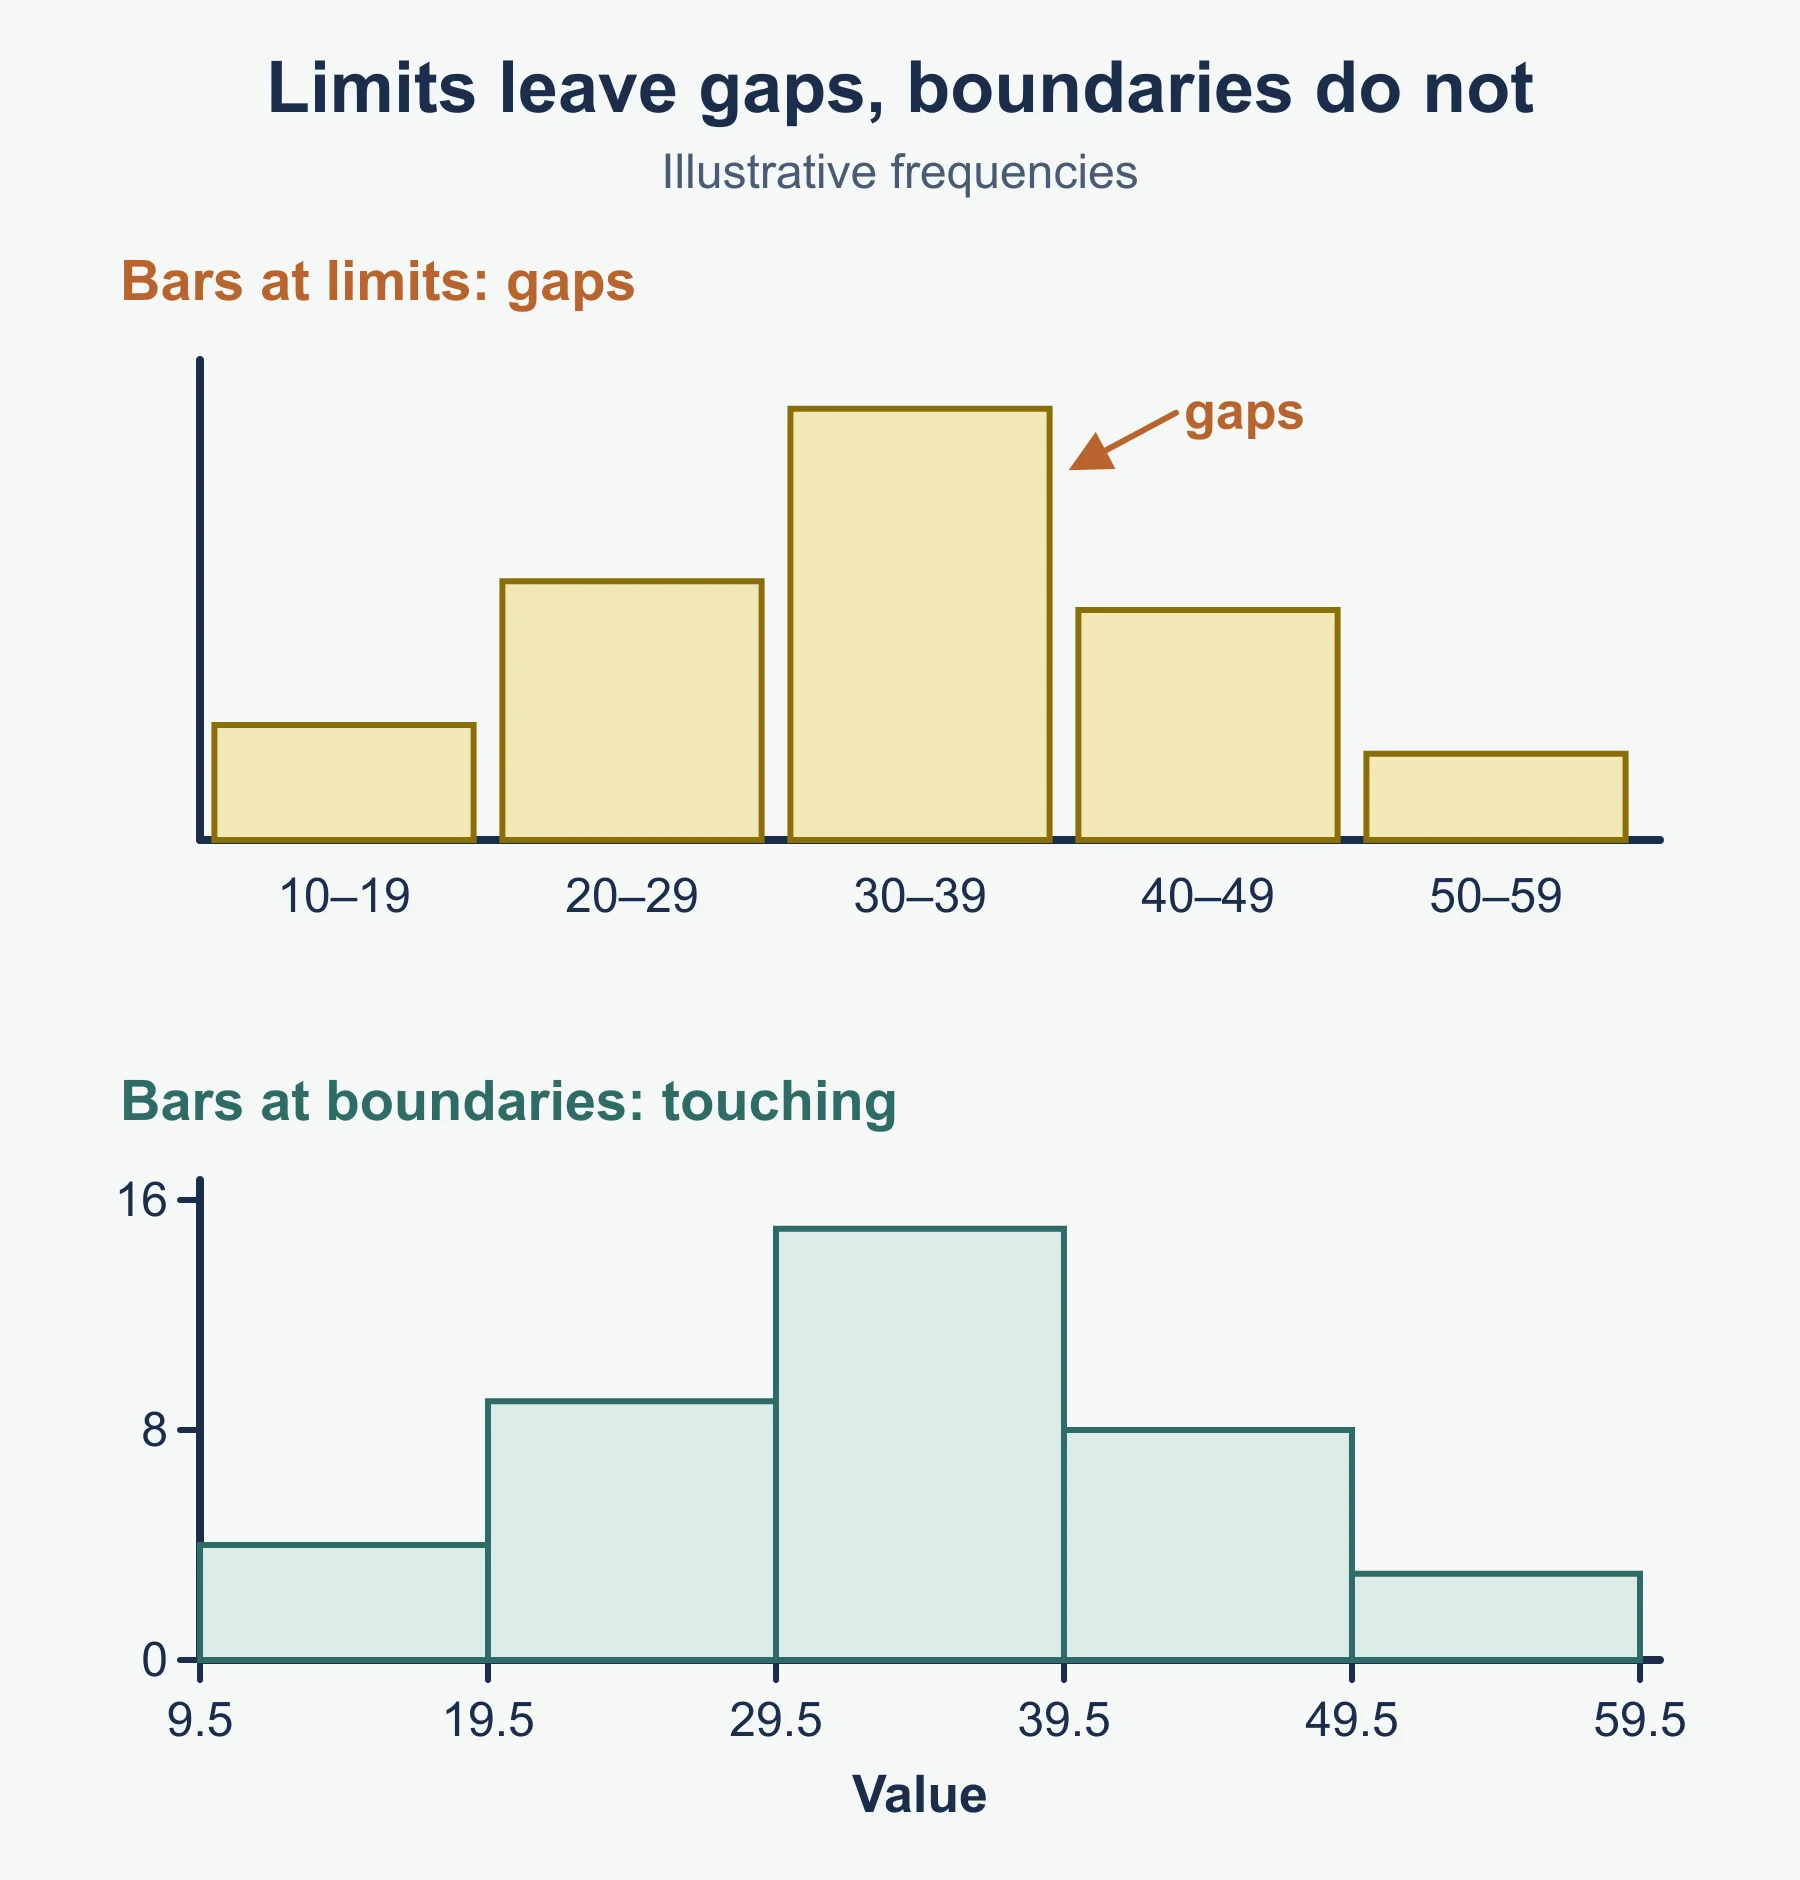
| Limits | Boundaries | Limits have gaps between classes. Boundaries meet. |
| Width | Upper limit minus lower limit | 40-44 has width 5, not 4 |
| Mid-point from limits | Mid-point from boundaries | For whole-number classes with a gap of 1 they give the same answer, but boundaries are safer |
| Discrete count | Continuous measurement | A count is exact. A measurement was rounded when it was recorded. |
| Mid-point | Class width divided by two | A mid-point is a position on the scale. A half-width is a distance. |
Choosing class intervals
Classes have to follow some rules, whatever their width:
- Every value in the data must fit in one class.
- No value may fit in two classes. Classes like 10-20 and 20-30 break this, because 20 could go in either.
- There should be no missing class in the middle of the range, even if its frequency is zero.
- Equal widths make the table easy to read and compare. Unequal widths are used when some parts of the range are crowded and others are thin.
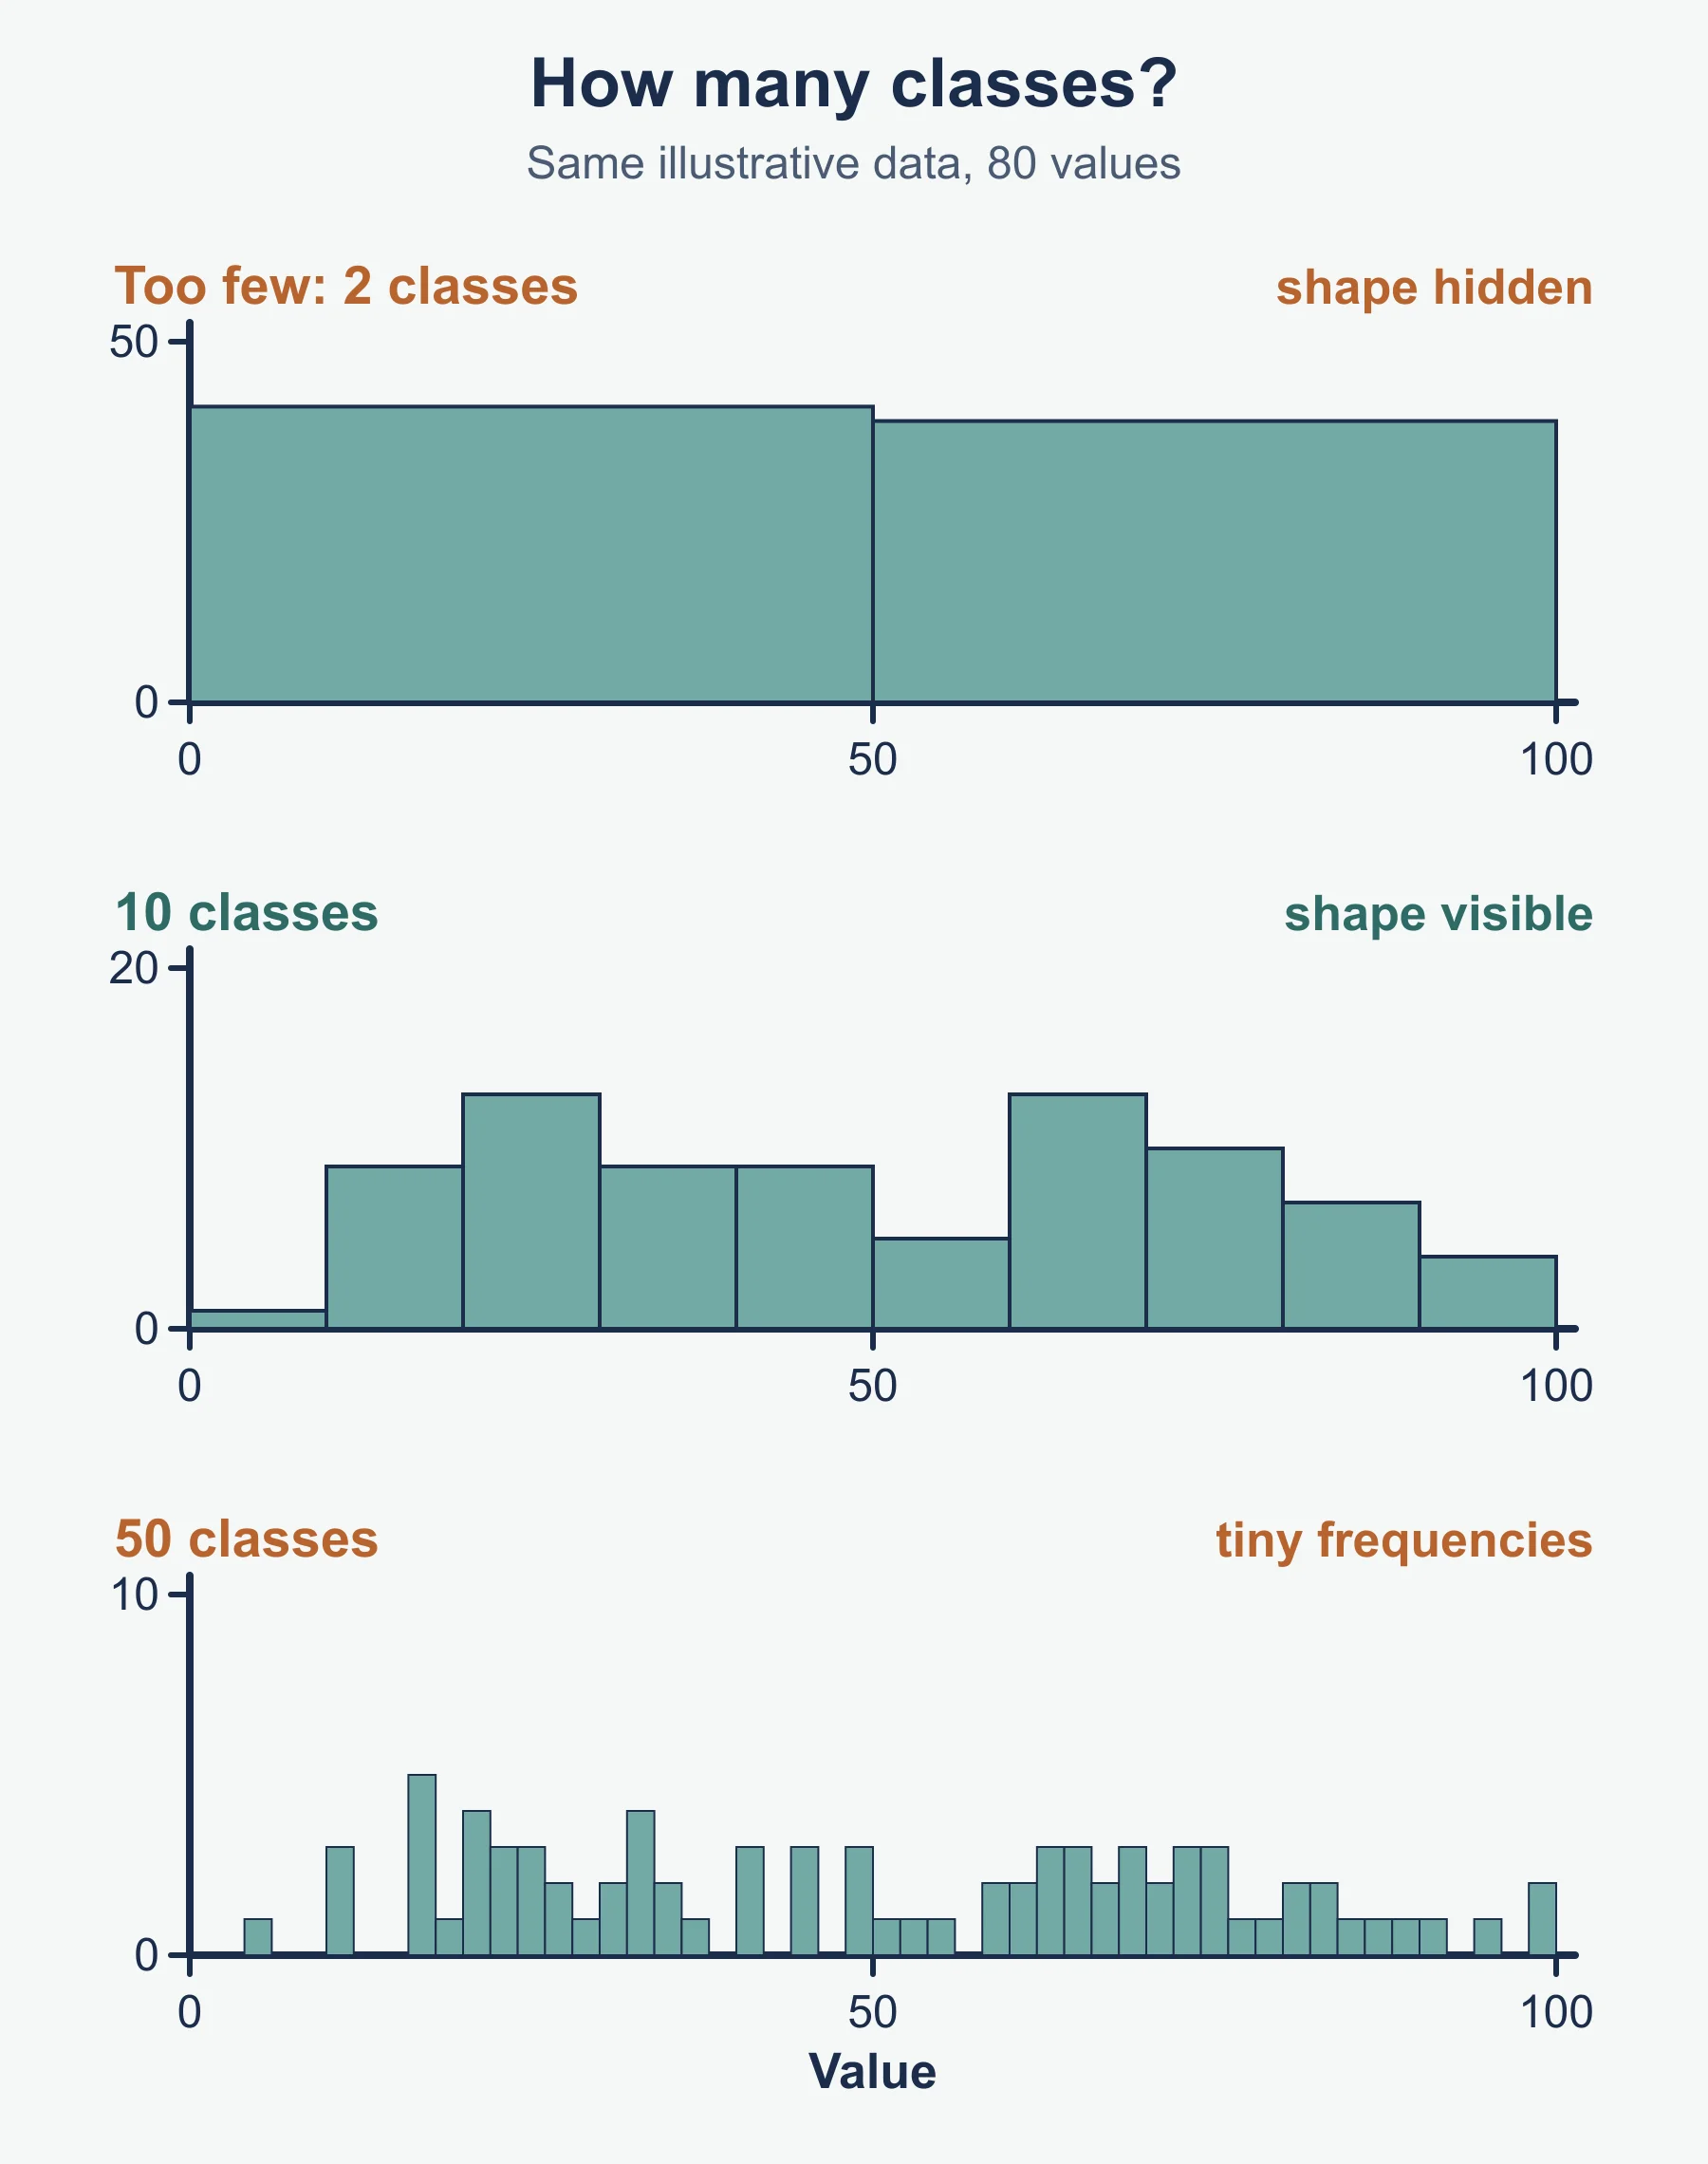
There is no official rule for the number of classes. A common working guide is somewhere around five to ten, but the right choice depends on how many values you have and how widely they are spread. Too many classes leave rows with one or no values and hide the shape. Too few classes squeeze different features into one row. When asked to comment on a choice, refer to the actual numbers: the range, the number of observations and the number of classes this gives.
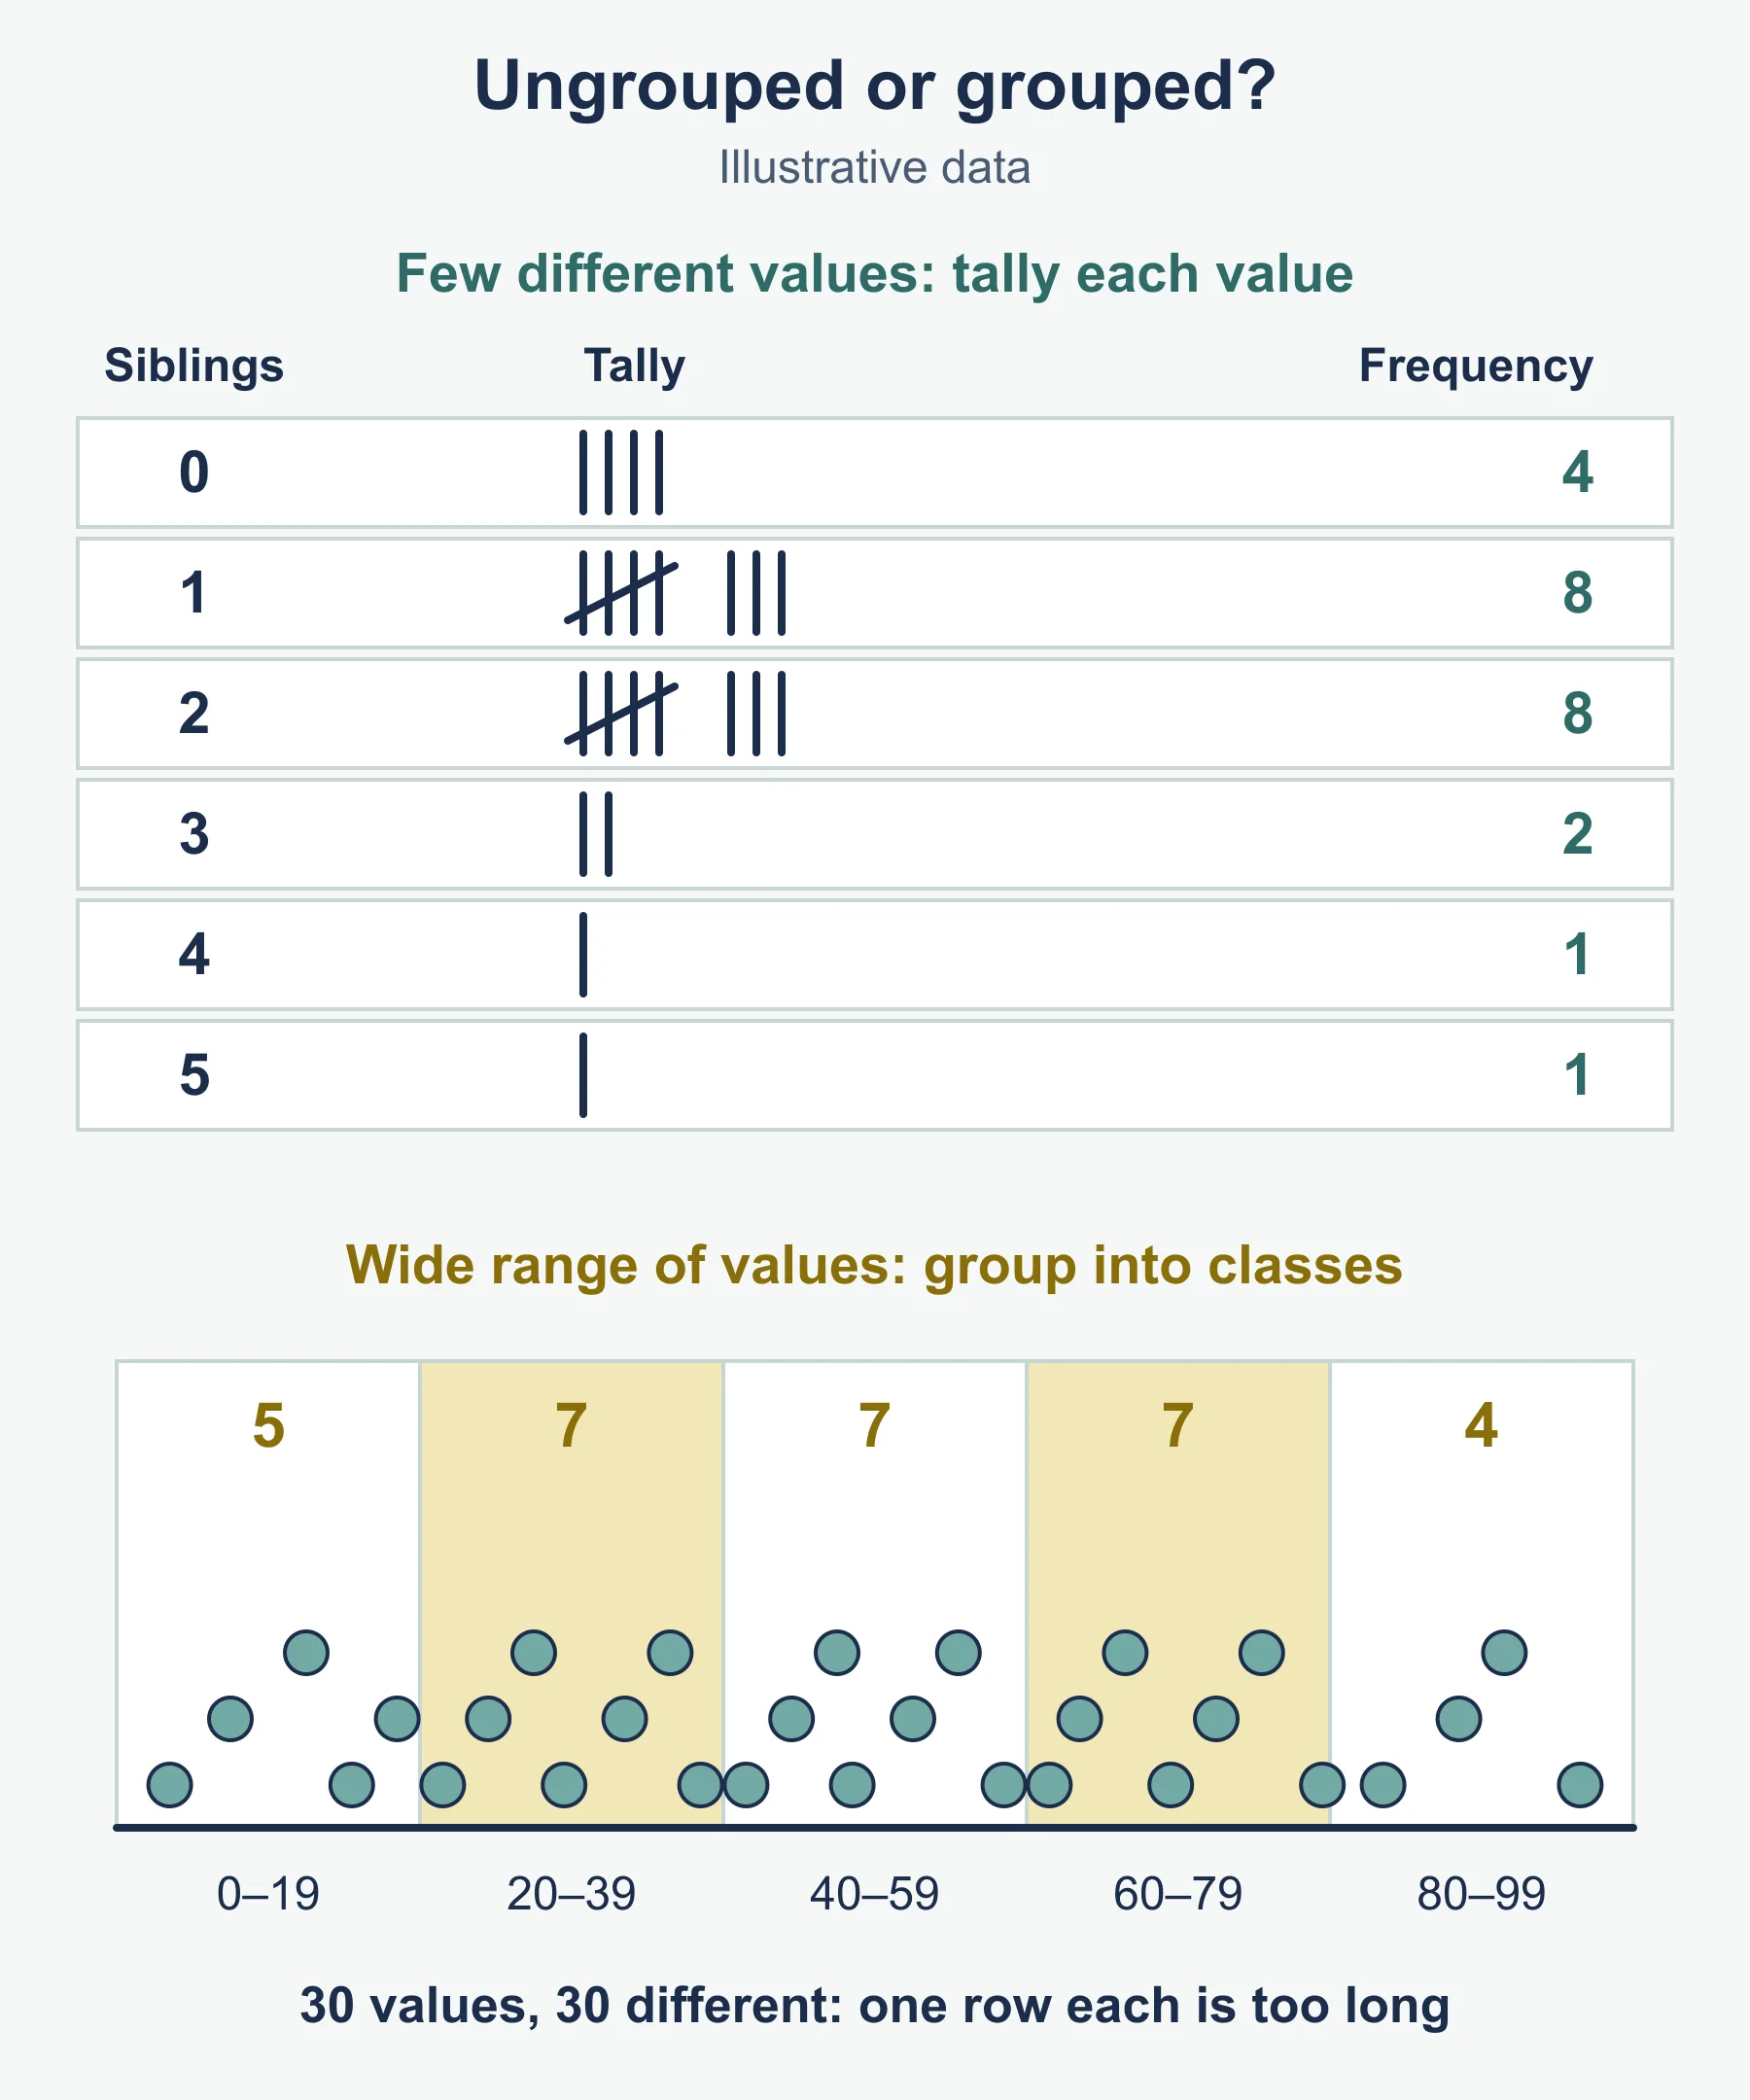
Ungrouped tables list each separate value. They suit counts with a small number of different values. A grouped table suits a wide range of values or measurements.
Quick self-test
- A class is written 35-39 and the next is 40-44. State the boundaries and width of 35-39.
- Find the mid-point of the class 35-39 using its boundaries.
- Lengths are recorded to 1 d.p. and a class is 7.5-8.4. State its boundaries.
- A whole-number class has a lower boundary of 18.5 and a width of 5. State its limits.
- A class has a mid-point of 62 and a width of 8. State its boundaries.
- A table has classes 0-10, 10-20 and 20-30 for whole-number data. Give the fault.
- State the width of the class 50 ≤ m < 65 and its mid-point.
- A person aged 29 years 10 months is recorded by age last birthday. In which of the classes 20-29 and 30-39 does the person belong?
- Why are boundaries needed even when the printed limits are clear?
- A grouped table of 12 values has 11 classes. Comment.
Answers
- The gap is 1, so the half-gap is 0.5. Boundaries are 34.5 and 39.5. Width is 5.
- (34.5 + 39.5) ÷ 2 = 37.
- The gap is 0.1, so the half-gap is 0.05. Boundaries are 7.45 and 8.45.
- The upper boundary is 18.5 + 5 = 23.5. The limits are 19 and 23.
- Half the width is 4. The boundaries are 62 − 4 = 58 and 62 + 4 = 66.
- The classes overlap. A value of 10 or 20 could be placed in two rows.
- Width is 65 − 50 = 15. Mid-point is (50 + 65) ÷ 2 = 57.5.
- The class 20-29, because the age last birthday is 29.
- Boundaries show where one class stops and the next starts, so there is no gap. Widths and mid-points are found from them.
- Too many classes. With 12 values, most rows would hold one value or none, so the shape of the data would not show.
Where marks are usually lost
- Calculating the width as upper limit minus lower limit, giving 4 instead of 5 for a class like 40-44.
- Writing 44 and 45 as the boundaries, when the boundary between two classes is the half-way value 44.5.
- Using a half-gap of 0.5 for data recorded to one decimal place, instead of 0.05.
- Adjusting an inequality class that is already in boundary form.
- Treating ages as if they were rounded to the nearest year, when the question says age last birthday.
- Giving a mid-point that is not between the boundaries, usually from an arithmetic slip. Do a quick look-back to check.
- Saying “too many classes” or “too few” with no reference to the data.
- Writing a class width for unequal classes as one value for the whole table.
Frequently asked questions
How do you find class boundaries in a grouped frequency table? Find the gap between one class’s upper limit and the next class’s lower limit, halve it, then subtract the half-gap from the lower limit and add it to the upper limit. For a whole-number class of 40-44 this gives boundaries of 39.5 and 44.5.
How do you calculate the mid-point of a class? Add the lower and upper class boundaries and divide by two. For the class 40-44 recorded to the nearest kilogram, the mid-point is (39.5 + 44.5) ÷ 2 = 42.
What does “class interval” mean in statistics? The term is used in two ways: sometimes it means the class itself, such as 20-29, and sometimes it means the class width. When a question asks for the width, it wants a number.
How do you handle ages recorded as age last birthday? A class such as 10-14 holds exact ages from 10 up to, but not including, 15, so its width is 5 and its mid-point is 12.5. Using the printed limits would wrongly give a mid-point of 12.
How many classes should a grouped frequency table have? There is no official rule in Cambridge O Level Statistics 4040. A common working guide is around five to ten, but the right choice depends on how many values there are and how widely they are spread.
Official syllabus
Cambridge O Level Statistics (4040), syllabus for examination in 2025, 2026 and 2027, Cambridge University Press & Assessment (Cambridge International). Section 3.1: class measures for grouped frequency distributions, including class limits, boundaries and mid-points, and class intervals.
Get free revision emails (optional)
Occasional emails with practice questions, worked explanations and links to free resources for the qualification and subjects you choose. No spam, and you can unsubscribe from any email. The free tools on this site never need an email.
Related resources
-
Study guides
Cambridge O Level Statistics: Formation of Frequency Distributions (4040)
Topic 3 of Cambridge O Level Statistics 4040: class limits, boundaries, midpoints and intervals, grouped vs ungrouped tables, and choosing class widths.
Statistics · Cambridge · O Level
Read guide -
Practice questions
Cambridge O Level Statistics: Formation of Frequency Distributions (4040) – Practice Questions
Original questions with worked answers on class limits, boundaries, mid-points and class intervals, for Cambridge O Level Statistics (4040).
Statistics · Cambridge · O Level
Try questions -
Study guides
Cambridge O Level Statistics: Frequency polygons and histograms (4040)
Step-by-step guide to frequency polygons and histograms for Cambridge O Level Statistics, with frequency density, unequal class widths and worked examples.
Statistics · Cambridge · O Level
Read guide
Related articles
-
teaching
A Level tuition in Dubai: Cambridge or Pearson Edexcel International A Level?
Schools in Dubai and Abu Dhabi teach either Cambridge International AS & A Level or Pearson Edexcel International A Level. How the two are structured, why it matters for tuition, and how online classes from Lahore work.
9 October 2026
-
curriculum guides
Choosing subjects at IGCSE and A Level
How subject choices at 14 and 16 affect university options later, and how to keep pathways open without overloading a timetable.
28 July 2026
Studying this with a teacher
Working through Statistics O LEVELS?
This page is free and stays free. If you would rather be taught it, Marlbridge runs Statistics classes one-to-one and in small groups of up to 15, online in your own time zone. The first trial class is free. WhatsApp replies within an hour (8am–11pm Pakistan time, every day); email the same day.
Cambridge Statistics teachers at Marlbridge