
Study Guides
OCR AS Level Economics: Trends in macroeconomic indicators (H060)
OCR AS Level Economics (H060) study guide to trends in macroeconomic indicators: reading data, UK phases, and comparing economies.
- Subject
- Economics
- Level
- AS LEVEL
- Topic
- Trends in macroeconomic indicators
- Author
- Marlbridge Academic Team
- Updated
- Reviewed by
- Salman Ahmad (what this means)
Aligned to OCR AS Level Economics (H060), For first assessment in 2016. Official specification .
Syllabus page (what it covers and how it is assessed): OCR AS Level Economics.
Syllabus points this page covers
H060
- 4.4 Trends in macroeconomic indicators
Found an error? Report a correction.
Want a teacher for this? Marlbridge teaches Economics online. Request a free trial class.
This guide follows the OCR AS Level Economics (H060) specification, for first assessment in 2016. It covers the topic Trends in macroeconomic indicators, in the Area of Study Economic policy objectives and indicators of macroeconomic performance, within Component 02, Macroeconomics. The specification asks you to explain the key trends in UK macroeconomic performance in the last 20 years and to evaluate the current performance of the UK economy compared with other developed, emerging and developing economies. All countries and figures in the worked examples are invented. The short account of the UK is broad-brush: check exact figures against the latest release from the Office for National Statistics.
Use it with the revision notes and the practice questions. The other topics in this Area of Study are taught in economic growth, GDP and recession, unemployment and employment and inflation, deflation and index numbers. See also the balance of payments guide, the OCR AS Economics hub, the printable checklist and the free 10-minute diagnostics.
What this unit covers
| Outcome in the specification | Where it is covered |
|---|---|
| Explain the key trends in UK macroeconomic performance in the last 20 years | Sections 1 to 5 |
| Evaluate the current performance of the UK economy compared with other developed economies | Sections 6 and 7 |
| Evaluate the current performance of the UK economy compared with emerging and developing economies | Sections 6 and 7 |
The specification does not list a fixed set of indicators for this topic. The sensible set is the one the rest of the Area of Study builds: real GDP and its growth rate, employment and unemployment, and inflation. Add the balance of payments and the budget position from the global context and fiscal policy topics when a question gives you that data.
1. What a trend is
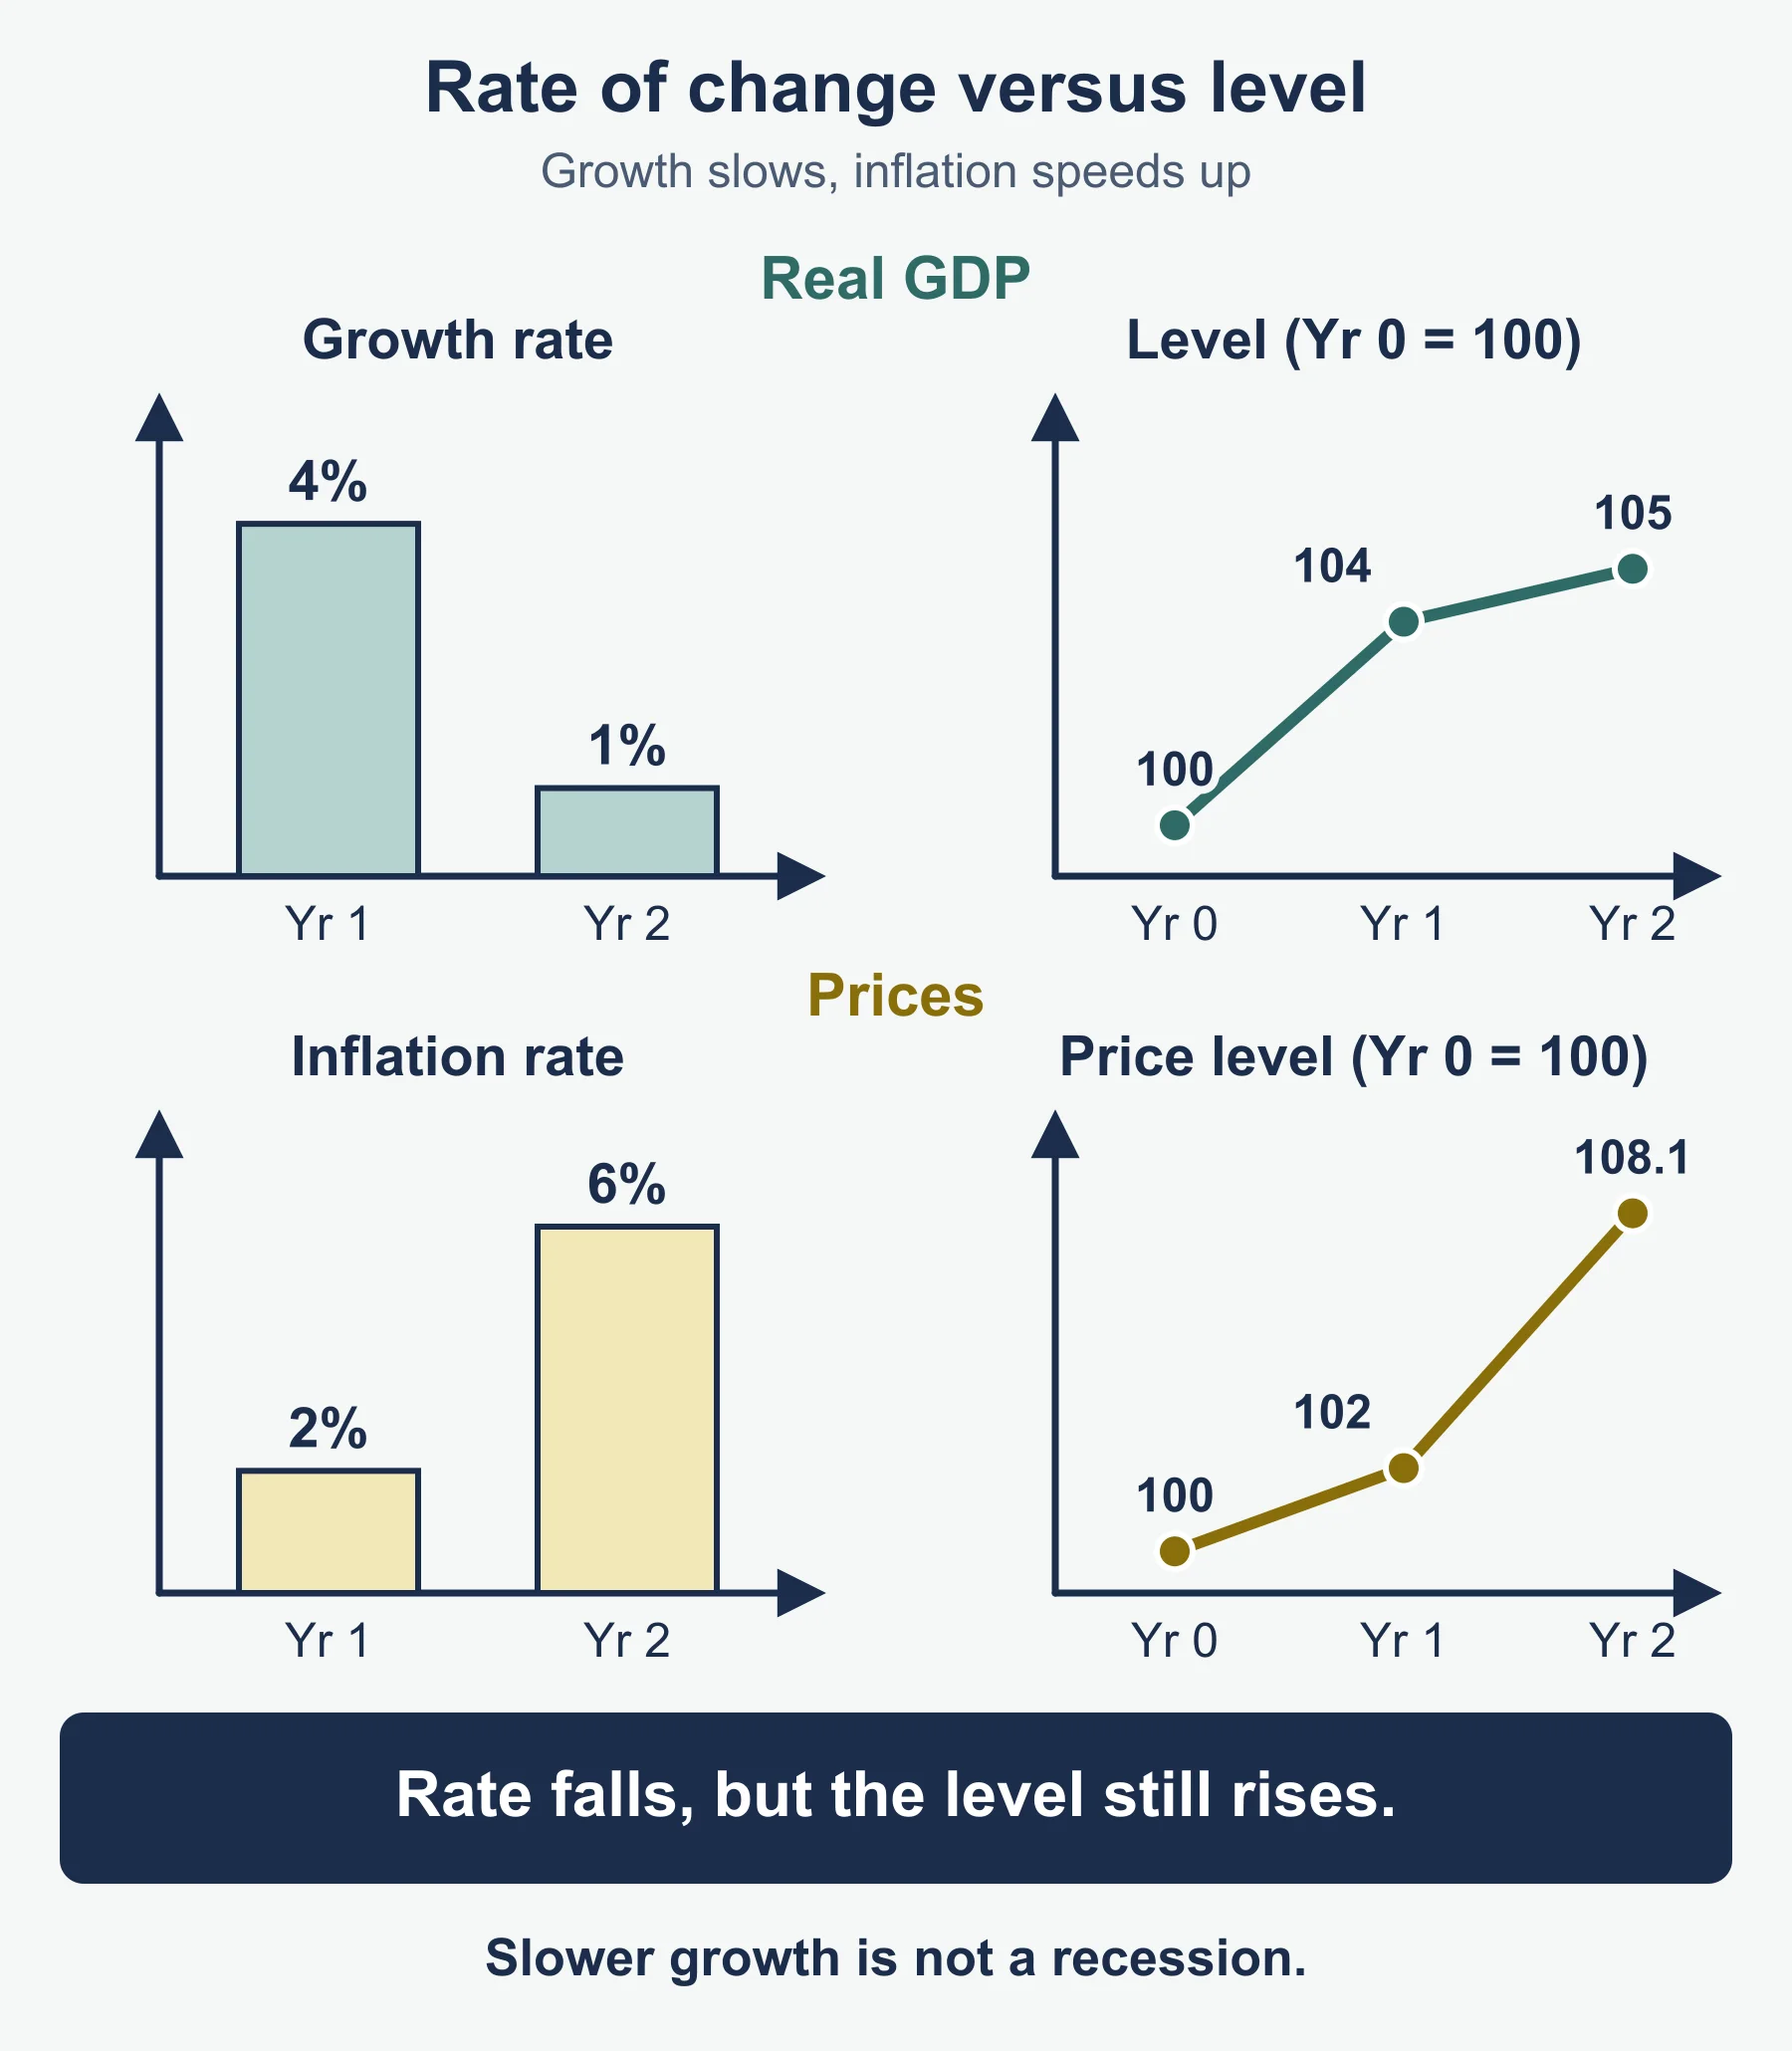
A trend is the general direction of a data series over several years once short-term noise is set aside. Economists look at three features together.
- Level. Where the series stands, such as real GDP at 108.8 or unemployment at 5.4%.
- Rate of change. How fast it moves, such as growth of 2.0% a year.
- Pattern. Whether the series rises steadily, falls, or swings around a path. A swing around the long-run path is the economic cycle.
Say which you are describing. A common slip is to say “unemployment is falling” when the data shows it is still higher than before a recession. The rate is falling but the level has not recovered.
2. Reading a real GDP series
Real GDP removes the effect of price changes, so it is the right series for trends in output. Worked example 1 uses Country P, a developed economy, with real GDP indexed to 100 in year 1.
| Year | Growth in real GDP (%) | Real GDP index |
|---|---|---|
| 1 | not given | 100.0 |
| 2 | 3.0 | 103.0 |
| 3 | 2.9 | 106.0 |
| 4 | 2.0 | 108.1 |
| 5 | -5.2 | 102.5 |
| 6 | -2.0 | 100.4 |
| 7 | 1.8 | 102.2 |
| 8 | 2.3 | 104.6 |
| 9 | 2.1 | 106.8 |
| 10 | 1.9 | 108.8 |
| 11 | 2.2 | 111.2 |
| 12 | 2.0 | 113.4 |
Worked example 1.
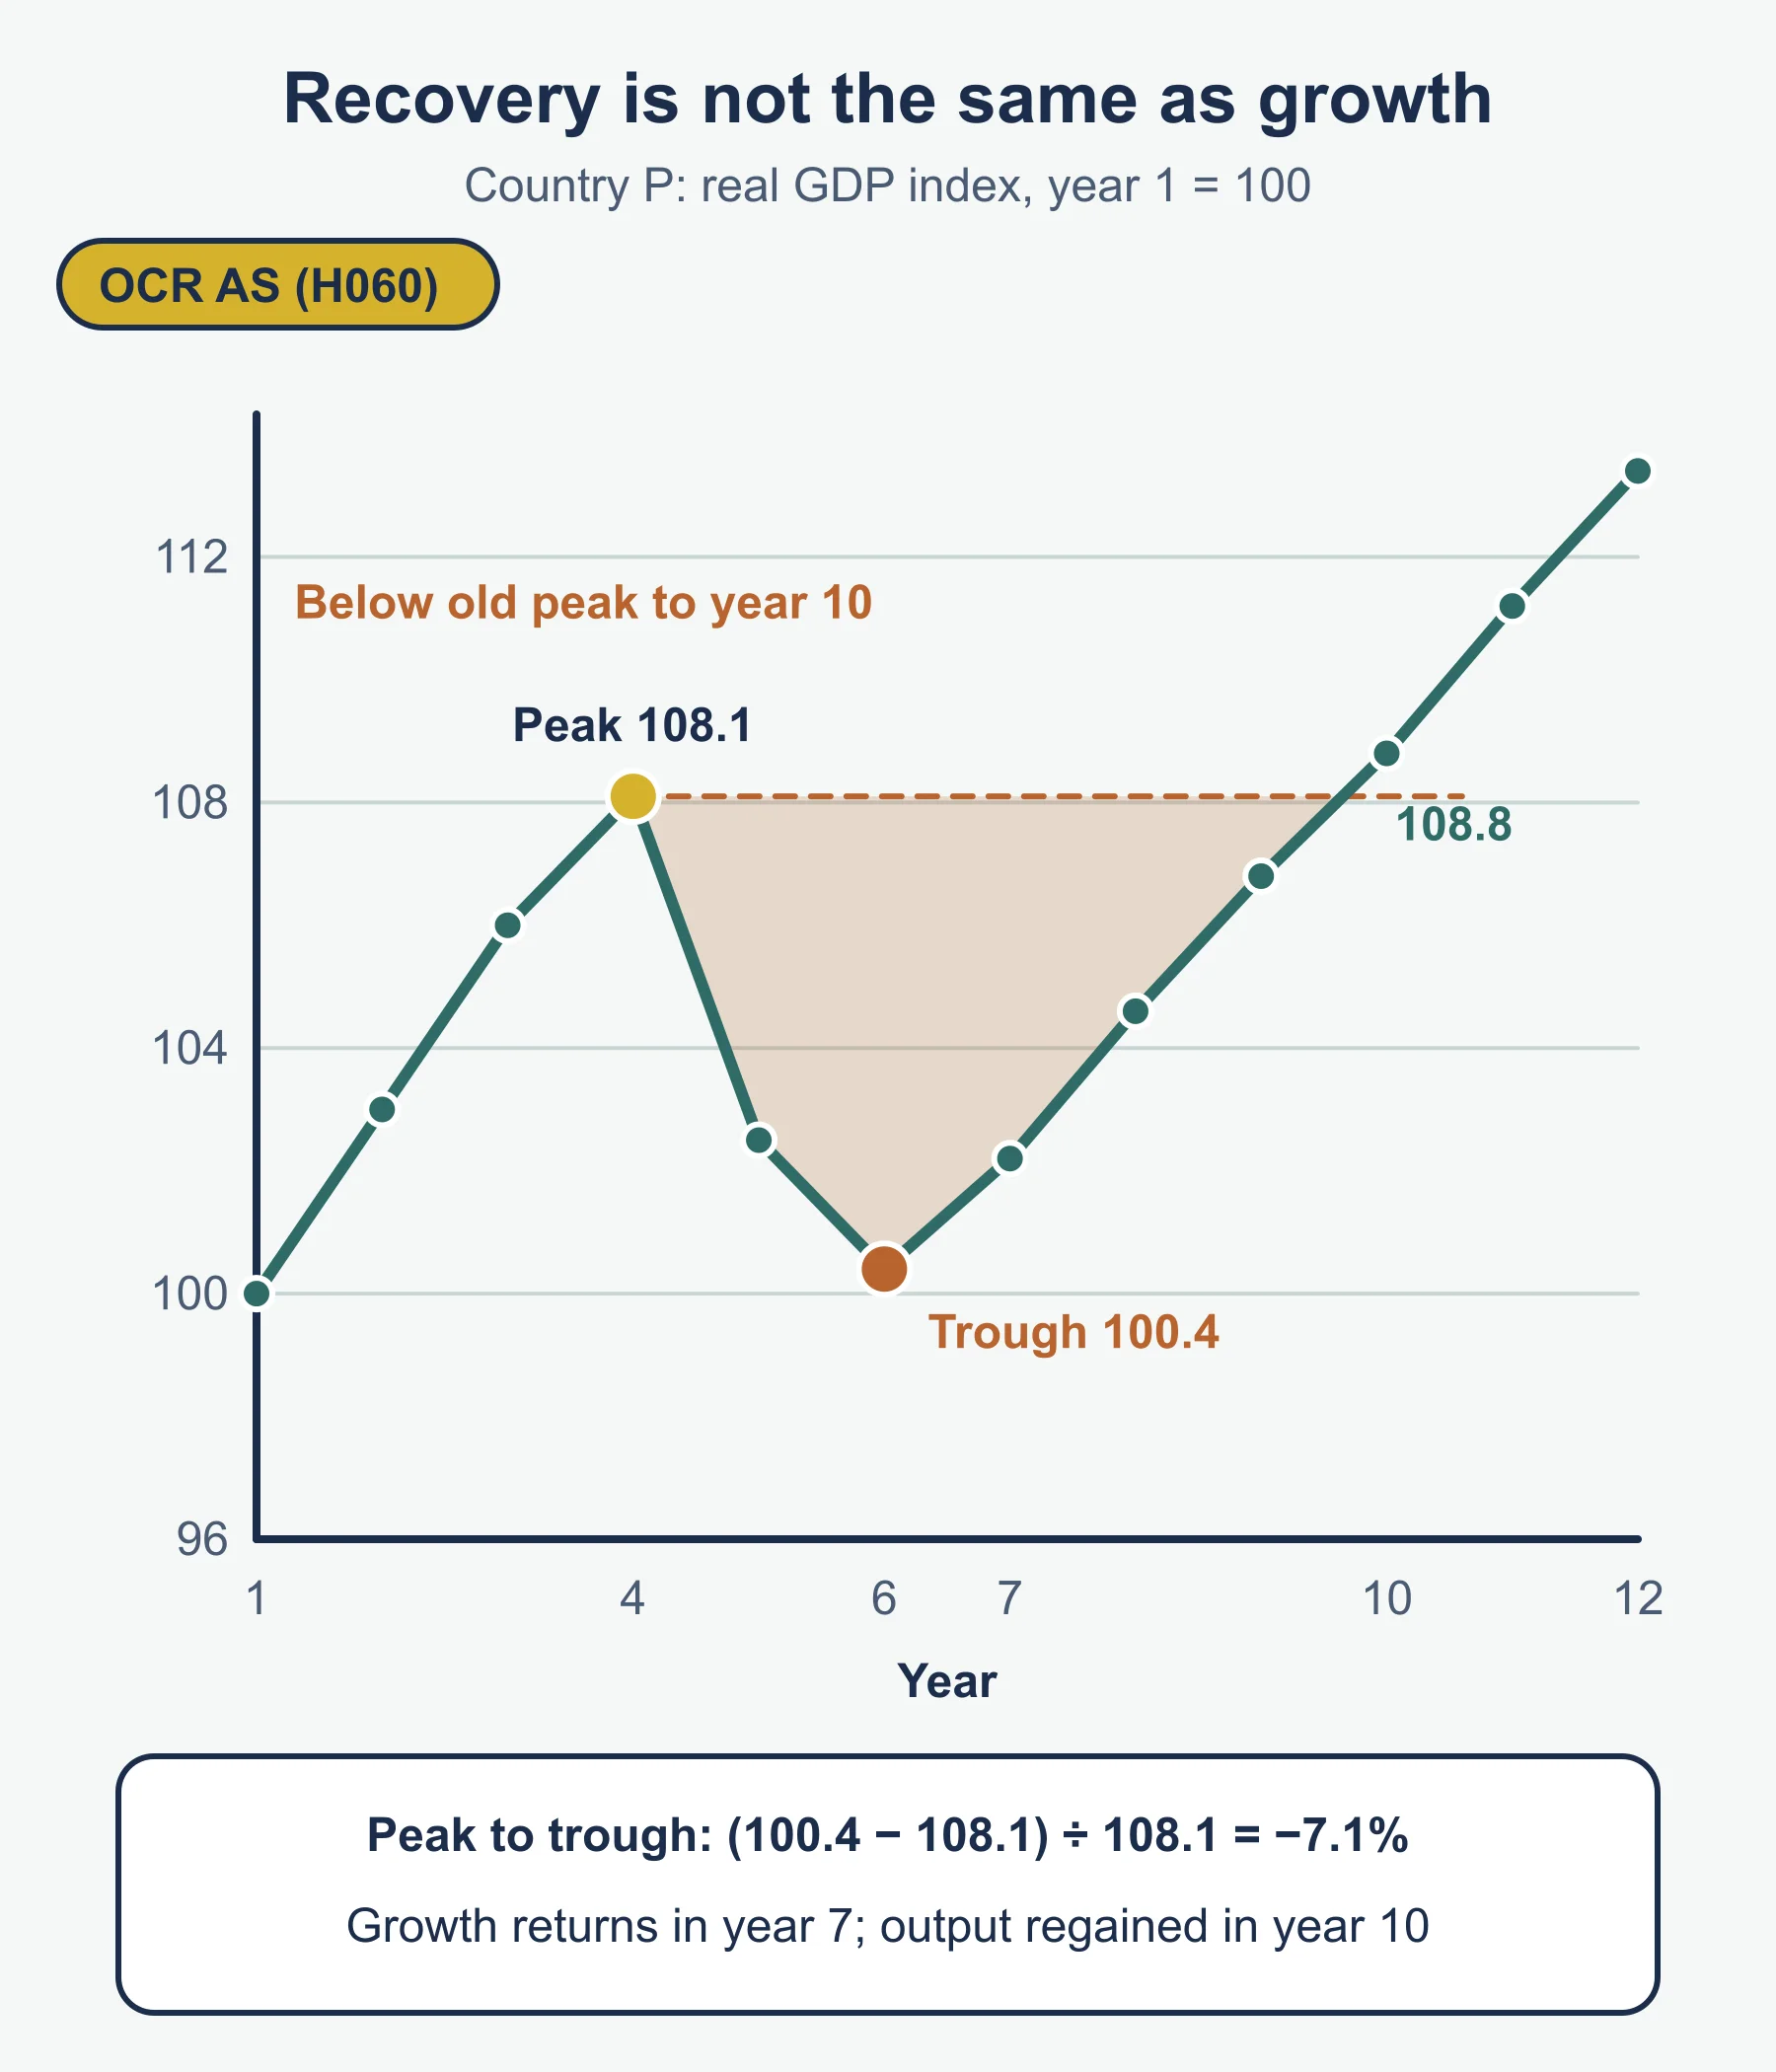
- Peak: year 4, at 108.1.
- Trough: year 6, at 100.4. Peak-to-trough change = (100.4 - 108.1) / 108.1 = about -7.1%. Output fell for two years running, so this is a recession on the usual definition of falling real GDP.
- Recovery: growth returned in year 7, but output stayed below the year 4 peak until year 10 (108.8 against 108.1). Growth resumed three years before the lost output was made up.
- Output in year 12 is about 4.9% above the old peak.
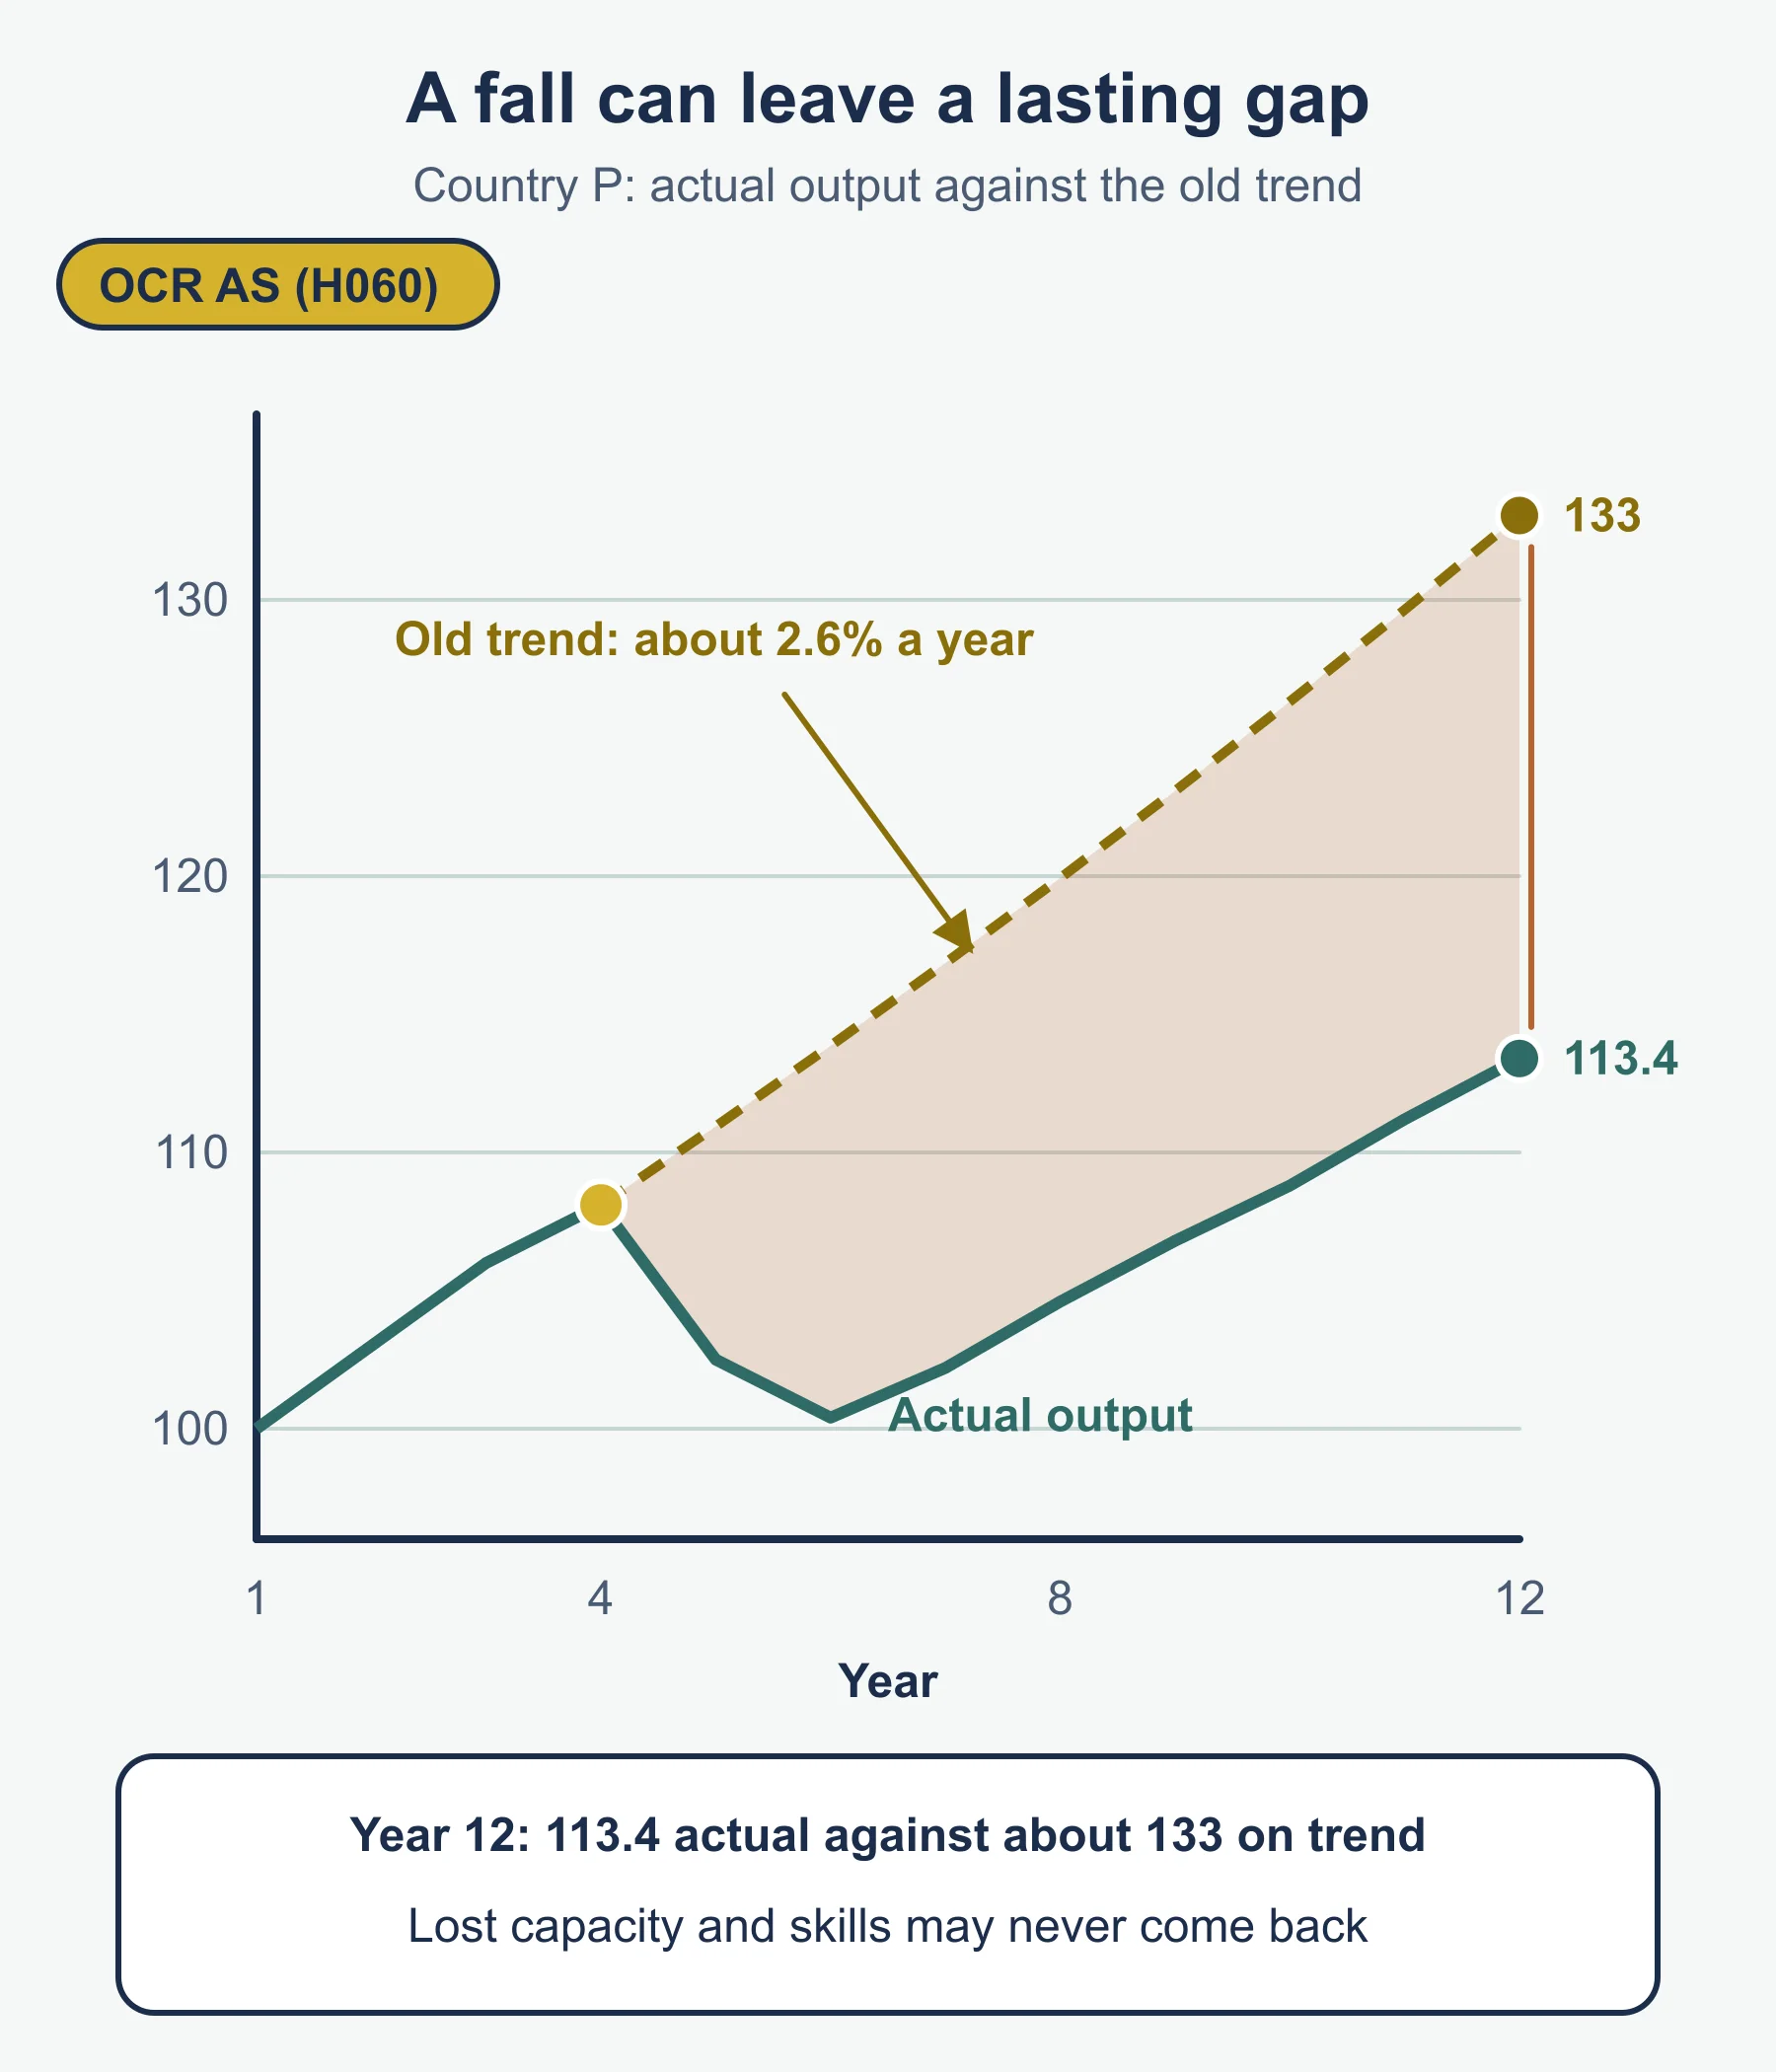
Evaluation. Positive growth does not mean the economy is back to where it was. Growth of 1.8% in year 7 is a recovery from a low base. The pre-recession trend (about 2.6% a year across years 1 to 4) would have put real GDP near 133 by year 12. Actual output is 113.4, so it is far below the path it was on. A fall in output can leave a lasting gap if capacity is lost, for example when firms close and workers lose skills.
3. Average growth over a period
To describe a long period in one figure, use average annual growth. The correct method for a growth rate is the compound one, because each year’s growth builds on the last.
Average annual growth = ((final index / first index) to the power of 1/n) - 1, where n is the number of yearly steps.
Worked example 2. Country P, years 1 to 12: n = 11 steps. (113.4 / 100) to the power of 1/11 = 1.01153, so average growth is about 1.15% a year. Adding the eleven growth rates and dividing by 11 gives 1.18%, which is slightly too high because it ignores compounding. For years 1 to 4 the compound average is 2.63%; for years 6 to 12 it is 2.05%. So the economy grew more slowly after the recession than before it. That is a trend worth stating.
4. Reading growth, unemployment and inflation together
Indicators move together in patterns that the AD/AS model explains. Worked example 3 adds two more series for Country P.
| Year | 1 | 2 | 3 | 4 | 5 | 6 | 7 | 8 | 9 | 10 | 11 | 12 |
|---|---|---|---|---|---|---|---|---|---|---|---|---|
| Unemployment (%) | 5.0 | 4.8 | 4.7 | 5.2 | 7.9 | 8.6 | 8.1 | 7.4 | 6.6 | 5.9 | 5.4 | 5.0 |
| Inflation (%) | 2.0 | 2.2 | 2.4 | 3.1 | 1.1 | 0.4 | 2.8 | 2.3 | 1.6 | 1.8 | 2.1 | 2.0 |
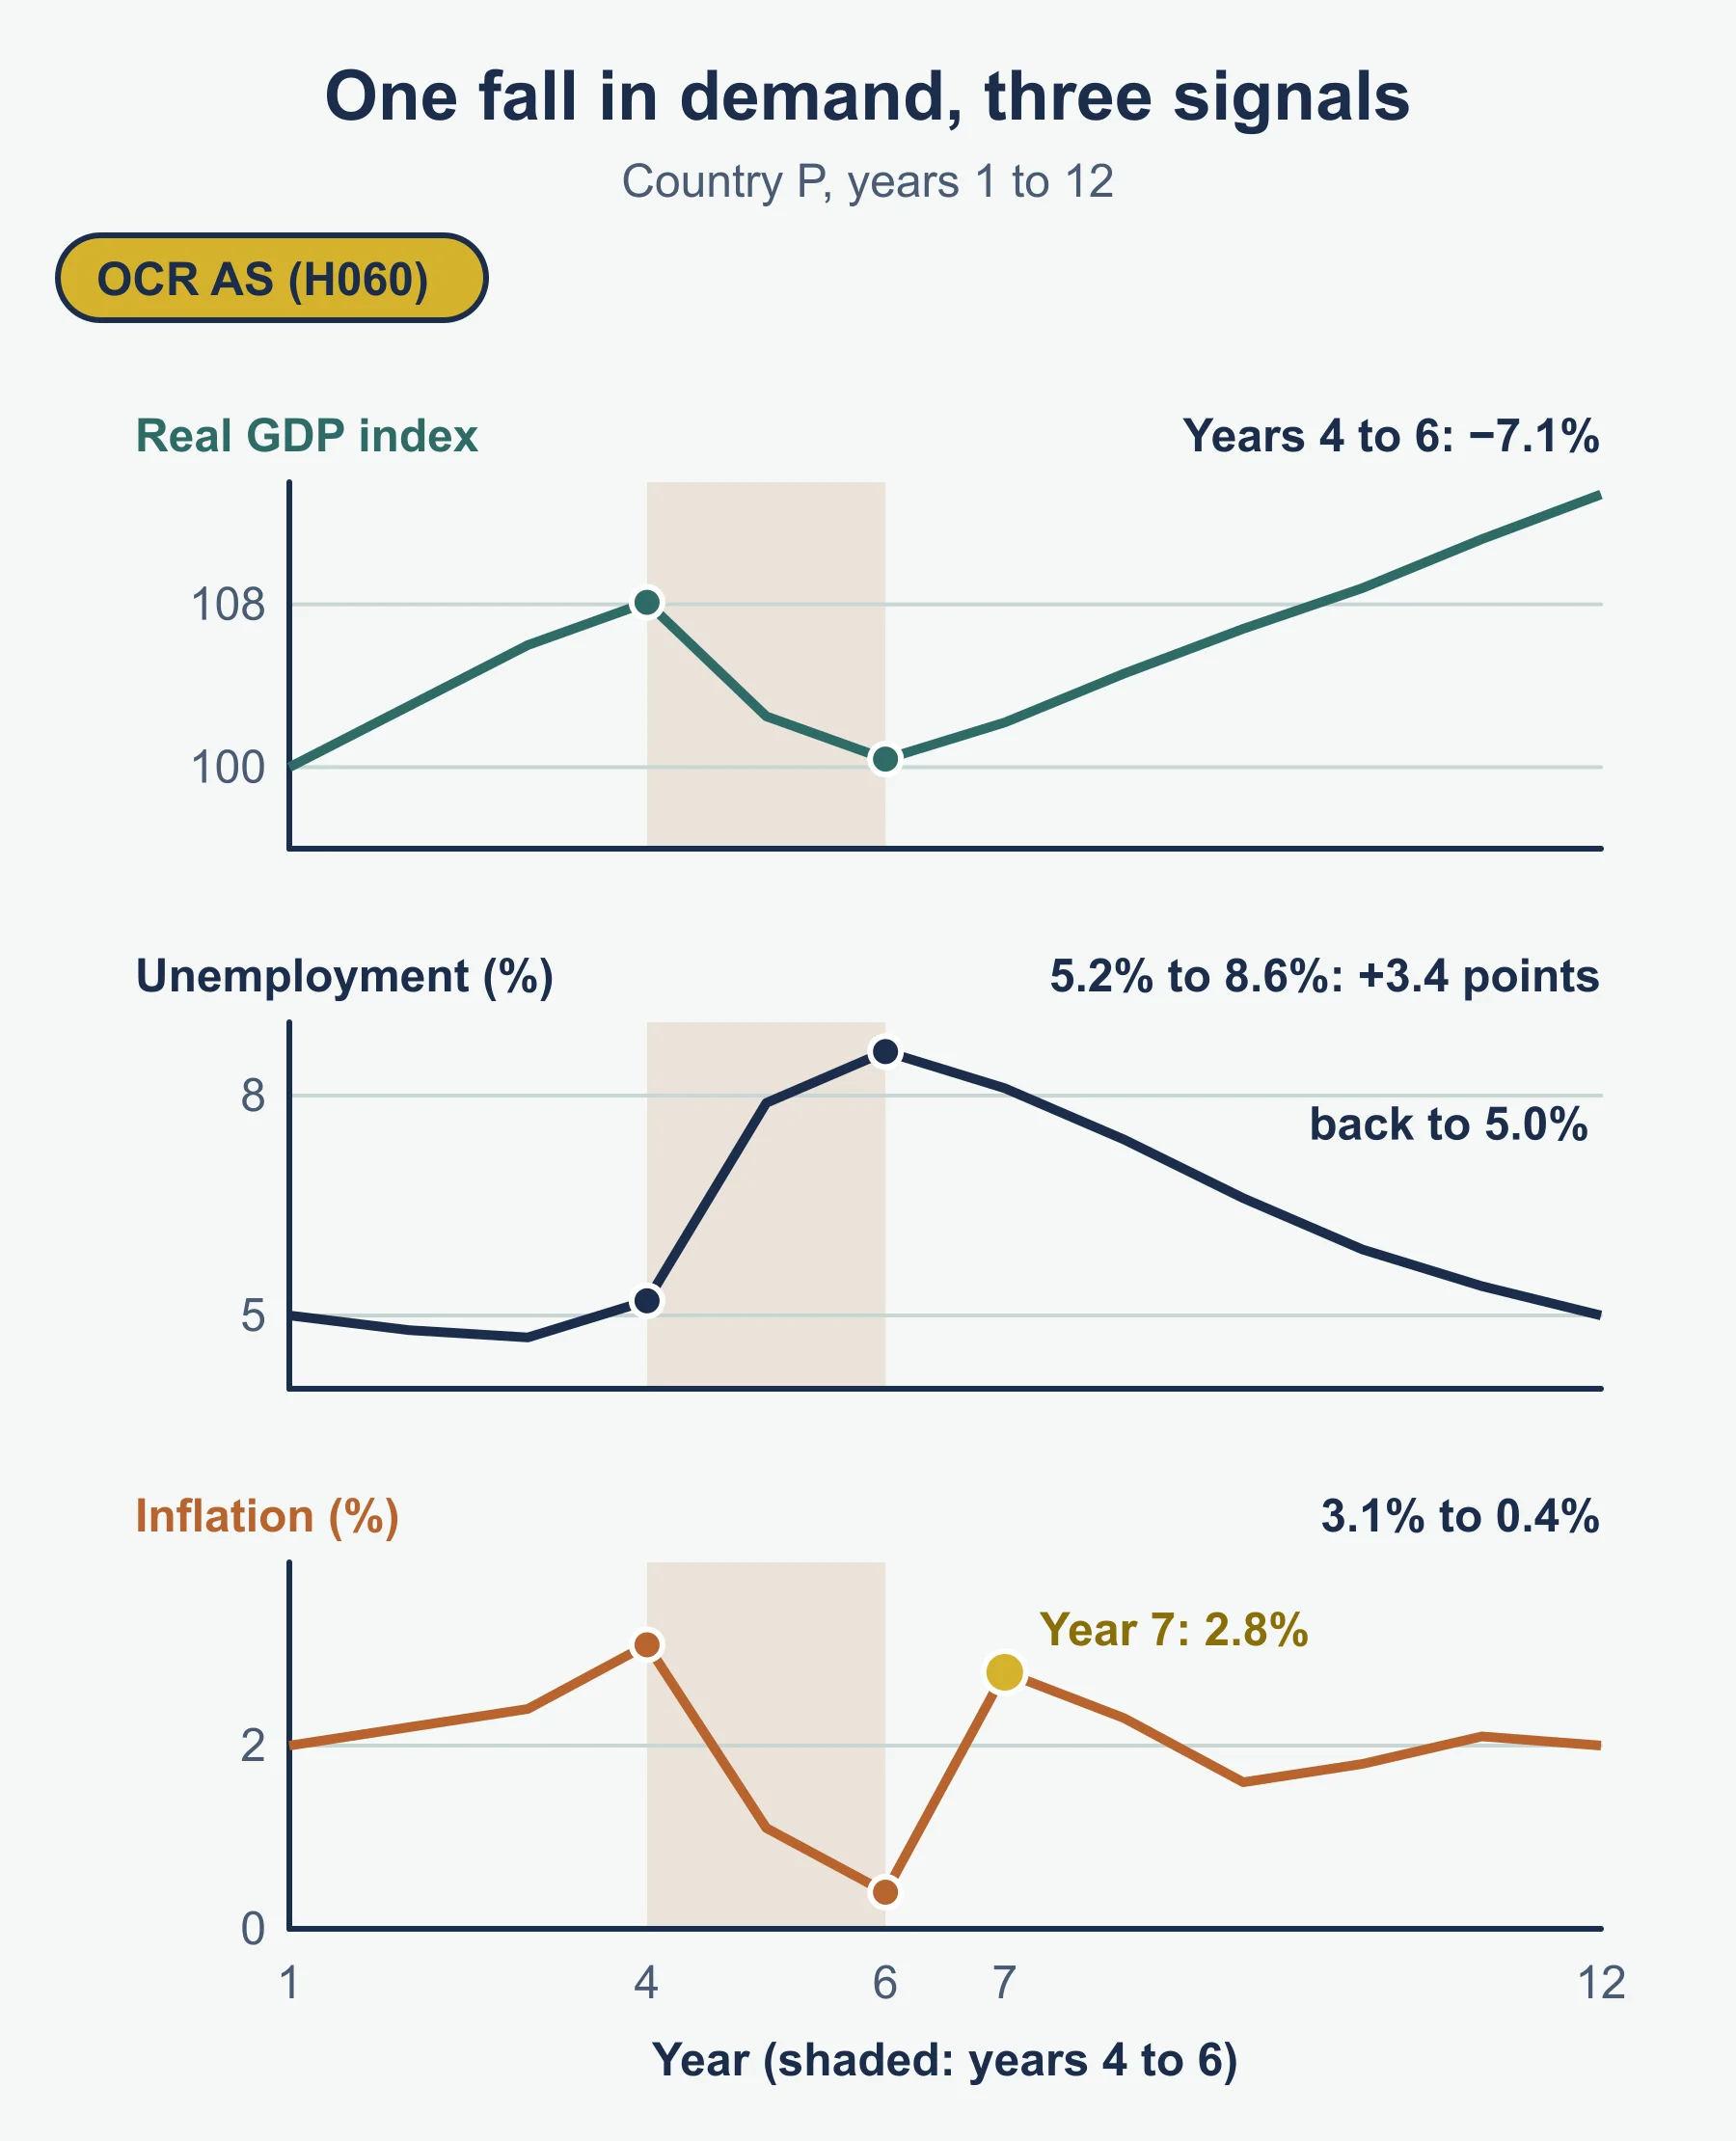
Worked example 3. Describe the trends in years 4 to 12.
- Years 4 to 6: output fell by about 7.1% (year 4 to year 6), unemployment rose by 3.4 percentage points from 5.2% to 8.6%, and inflation fell from 3.1% to 0.4%. A fall in aggregate demand (an inward shift of AD) explains all three at once.
- Year 7: inflation jumps to 2.8% while unemployment is still 8.1%. This could be a cost shock, such as higher import prices after a fall in the exchange rate, so unemployment and inflation are both high together. Say “could be” unless the data names the cause.
- Years 8 to 12: unemployment falls steadily back to 5.0% and inflation settles near 2%. Unemployment takes longer to recover than output because firms rehire cautiously and some job losses are structural.
5. The UK over about the last 20 years
The specification wants “key trends”, so organise what you know into phases and link each phase to a cause. The phases below are the usual way to organise UK macroeconomic history from the mid-2000s. They are a summary, not a data source.
| Phase | Broad pattern | Likely explanations |
|---|---|---|
| Mid-2000s | Steady growth, low unemployment, inflation close to the 2% CPI target, a current account deficit, rising household debt and house prices | Strong consumption and credit growth, cheap imports |
| 2008 to 2009 | A deep recession after the financial crisis; unemployment rose, but by less than the fall in output suggested | Collapse in confidence and lending; firms kept workers on or cut hours |
| Early 2010s to 2019 | Slow recovery, weak productivity growth, stagnant real wages for some years, falling unemployment, budget deficit reduced by fiscal consolidation | Low investment, damaged banking system, tight fiscal policy, low Bank Rate (cut to 0.5% in March 2009 and held low) |
| 2020 to 2021 | A very sharp fall in output followed by a rebound; unemployment rose by far less than output fell; a very large budget deficit | Public health restrictions; furlough support; Bank Rate cut to 0.1% in March 2020 |
| 2021 onwards | Inflation rose sharply (CPI peaked at 11.1% in October 2022) and Bank Rate was raised to 5.25% by August 2023; growth was weak and the labour market tight | Energy and import price rises, supply bottlenecks, strong demand after the lockdowns, policy tightening |
Three trends run across the whole period, and each links to something you study elsewhere. First, the UK has run a current account deficit almost throughout (see the balance of payments). Second, productivity growth has been much slower since the 2008 to 2009 recession than before it, which limits the long-run growth of potential output. Third, policy has swung between very loose (low rates, large deficits) and tighter settings, so the same period shows both the problem of low inflation and the problem of high inflation.
6. Comparing the UK with other economies
The specification names three comparison groups.
- Developed economies have high income per head and a large services sector. Comparison with them asks whether the UK is doing better or worse than economies at a similar stage.
- Emerging economies are industrialising quickly and usually have high growth rates and fast-rising incomes, often from a lower base.
- Developing economies have low income per head, and often depend on a few primary products. Their growth and inflation are often more volatile.
When you compare, use rates and levels for the same period and the same definition. Worked example 4 uses three invented economies over years 1 to 12: P (developed), Q (emerging) and R (developing).
| Economy | Real GDP index, year 12 | Average annual real growth | GDP per head, year 1 (cu) | GDP per head, year 12 (cu) |
|---|---|---|---|---|
| P | 113.4 | 1.15% | 36,000 | 38,645 |
| Q | 241.3 | 8.34% | 4,500 | 10,167 |
| R | 137.6 | 2.94% | 1,200 | 1,272 |
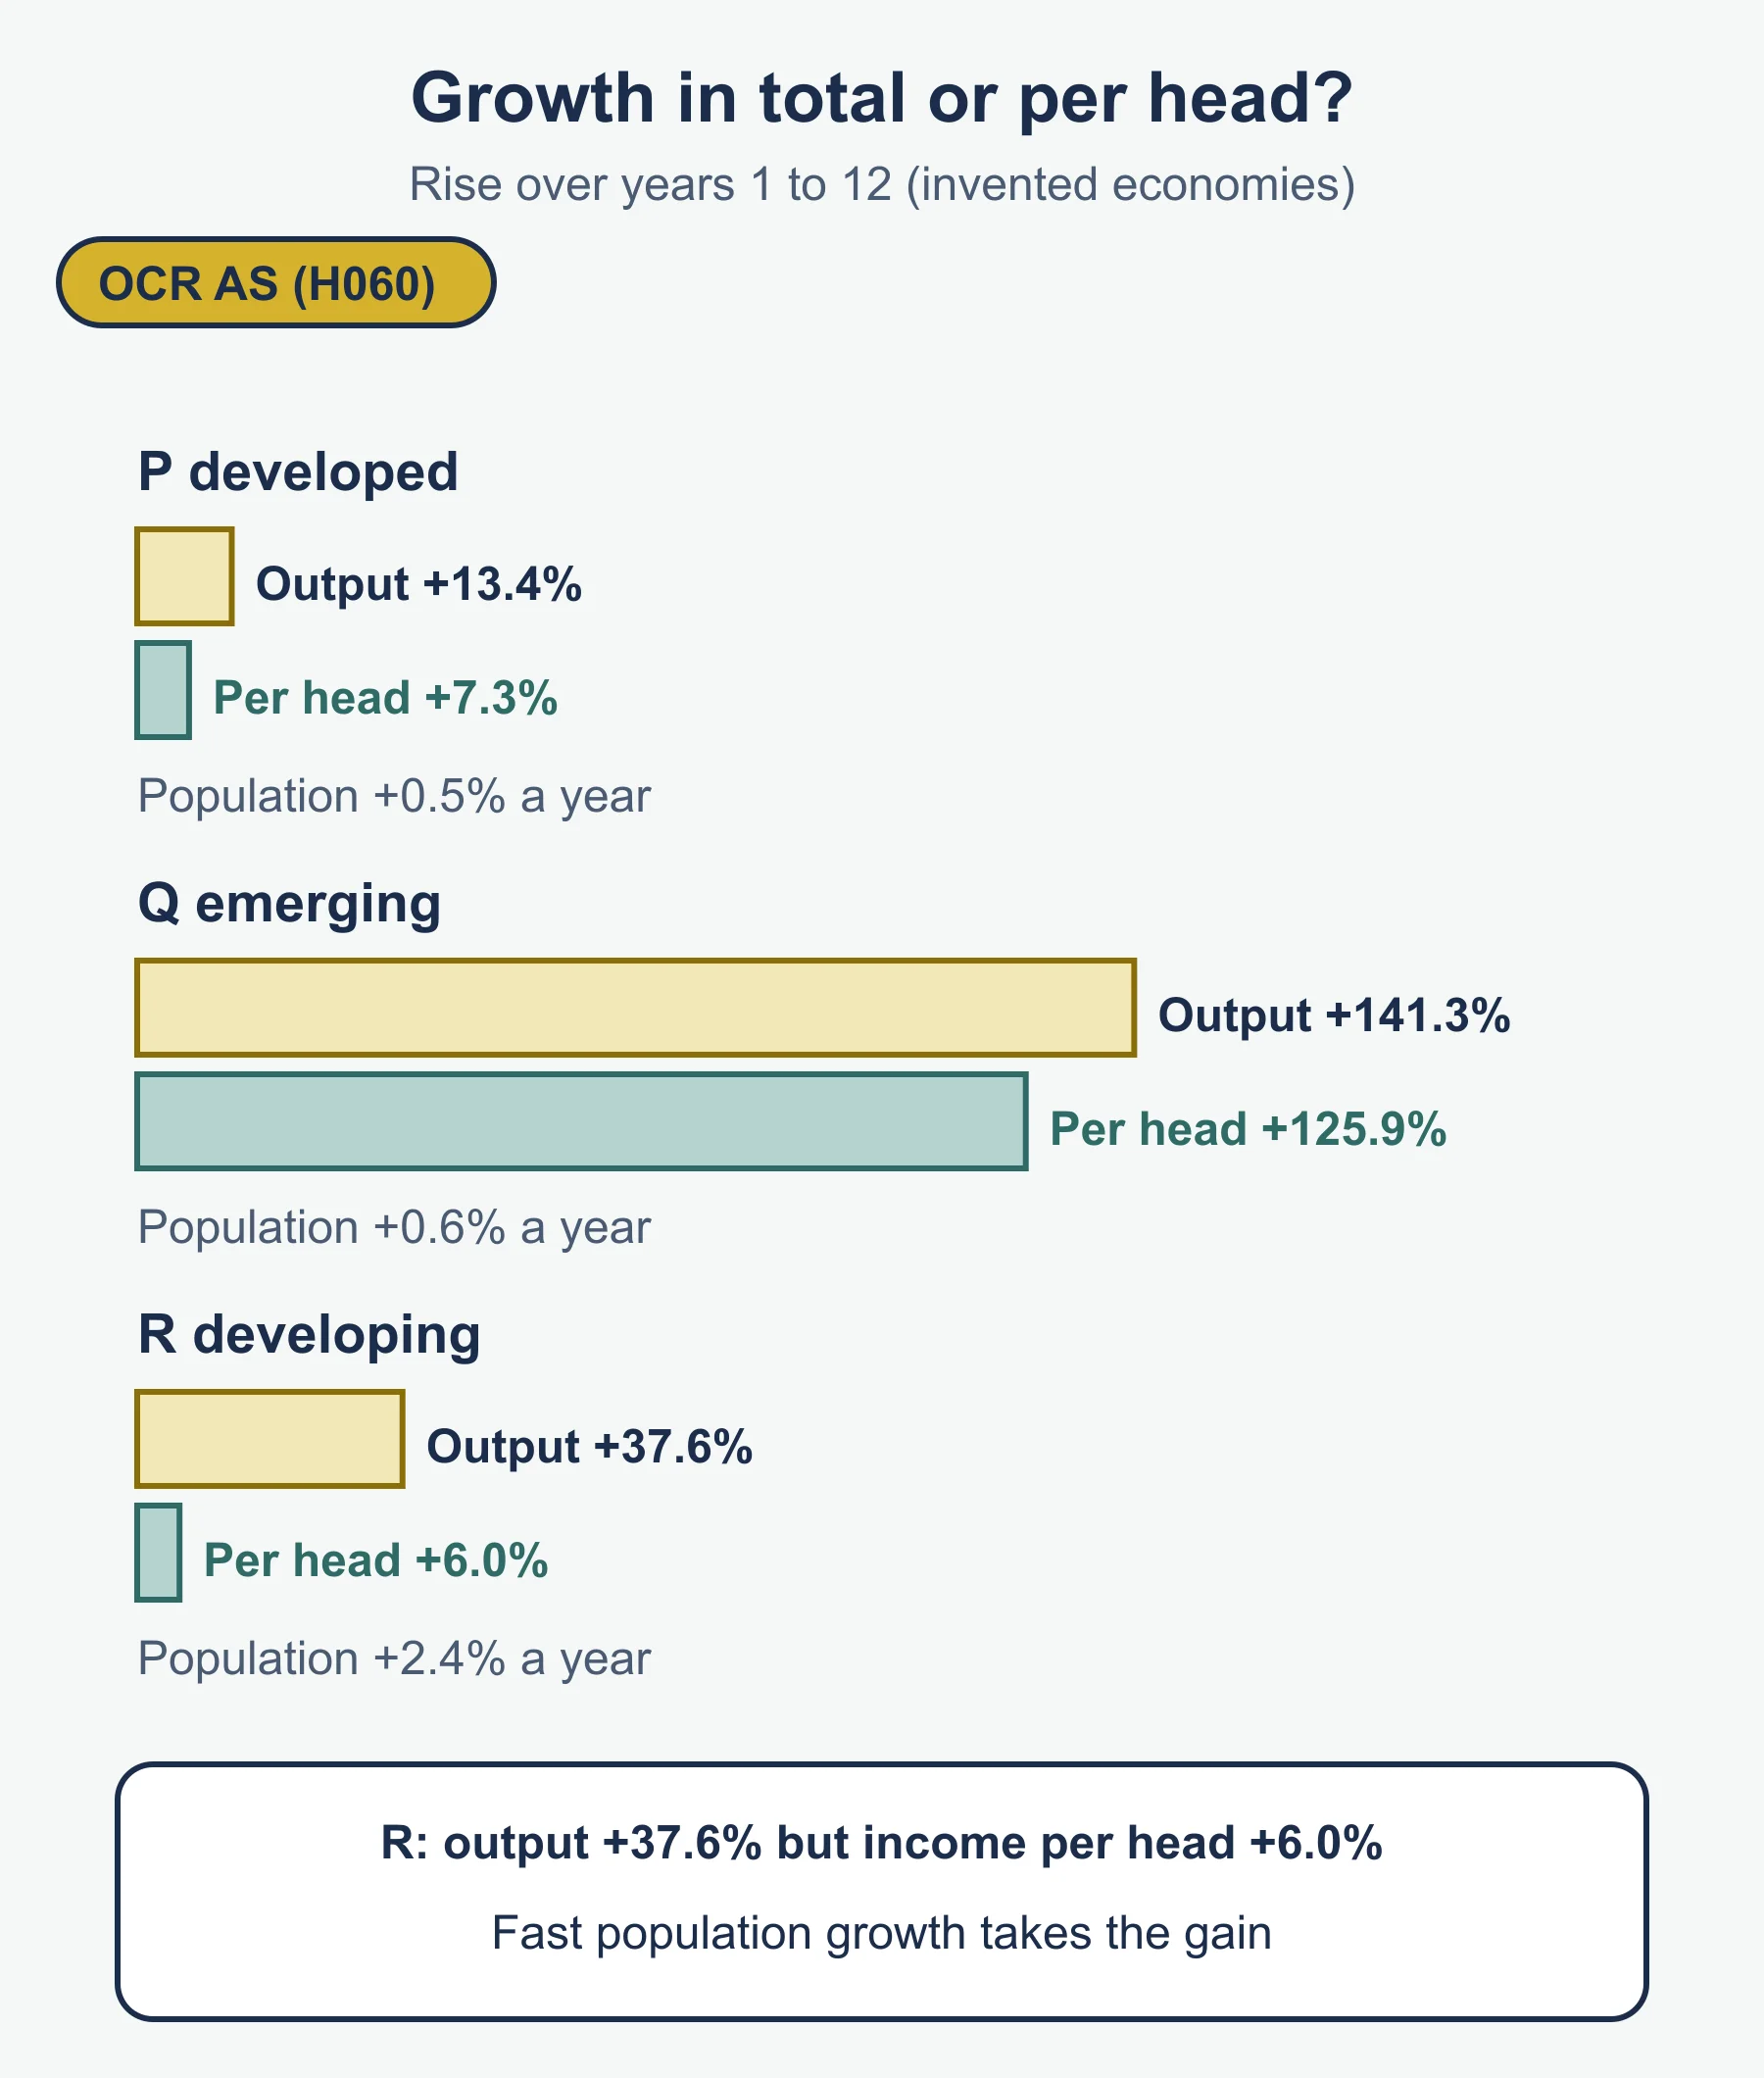
Population grew by 0.5% a year in P, 0.6% a year in Q and 2.4% a year in R.
Worked example 4.
- Q grew fastest by far: output more than doubled. Its income per head rose by 126%, so it began to catch up. Q’s income per head moved from 12.5% to 26.3% of P’s.
- R grew faster than P in total output (2.94% against 1.15%), but its population grew much faster, so income per head rose by only 6.0%. R’s income per head stayed at roughly 3.3% of P’s.
- P grew slowly but from a high level. A gap of 38,645 against 10,167 is still huge in absolute terms.
Evaluation. Headline growth hides a lot. Fast growth from a low base is easier than slow growth from a high base. Per-head figures show living standards better than totals. Income per head says nothing about distribution. Comparisons also depend on exchange rates, because converting at market exchange rates can overstate or understate real purchasing power.
7. Writing an evaluation of UK performance
For “evaluate the current performance of the UK economy compared with…” questions, use this frame.
- Choose indicators that match the question: growth, unemployment, inflation, and if relevant the current account.
- State the comparison with data from the question: higher, lower or similar, using the same year and definition.
- Explain why the gap might exist: structure of the economy, stage of development, policy, a shock that hit one economy harder.
- Qualify the data: one year may be unrepresentative, definitions differ, small countries distort averages, and revisions change figures.
- Conclude with a judgement on overall performance, naming which indicator weighs most and why.
Common errors
- Describing a rate as if it were a level, such as “unemployment is low because it fell”.
- Averaging growth rates by simple addition over long periods without saying it is approximate.
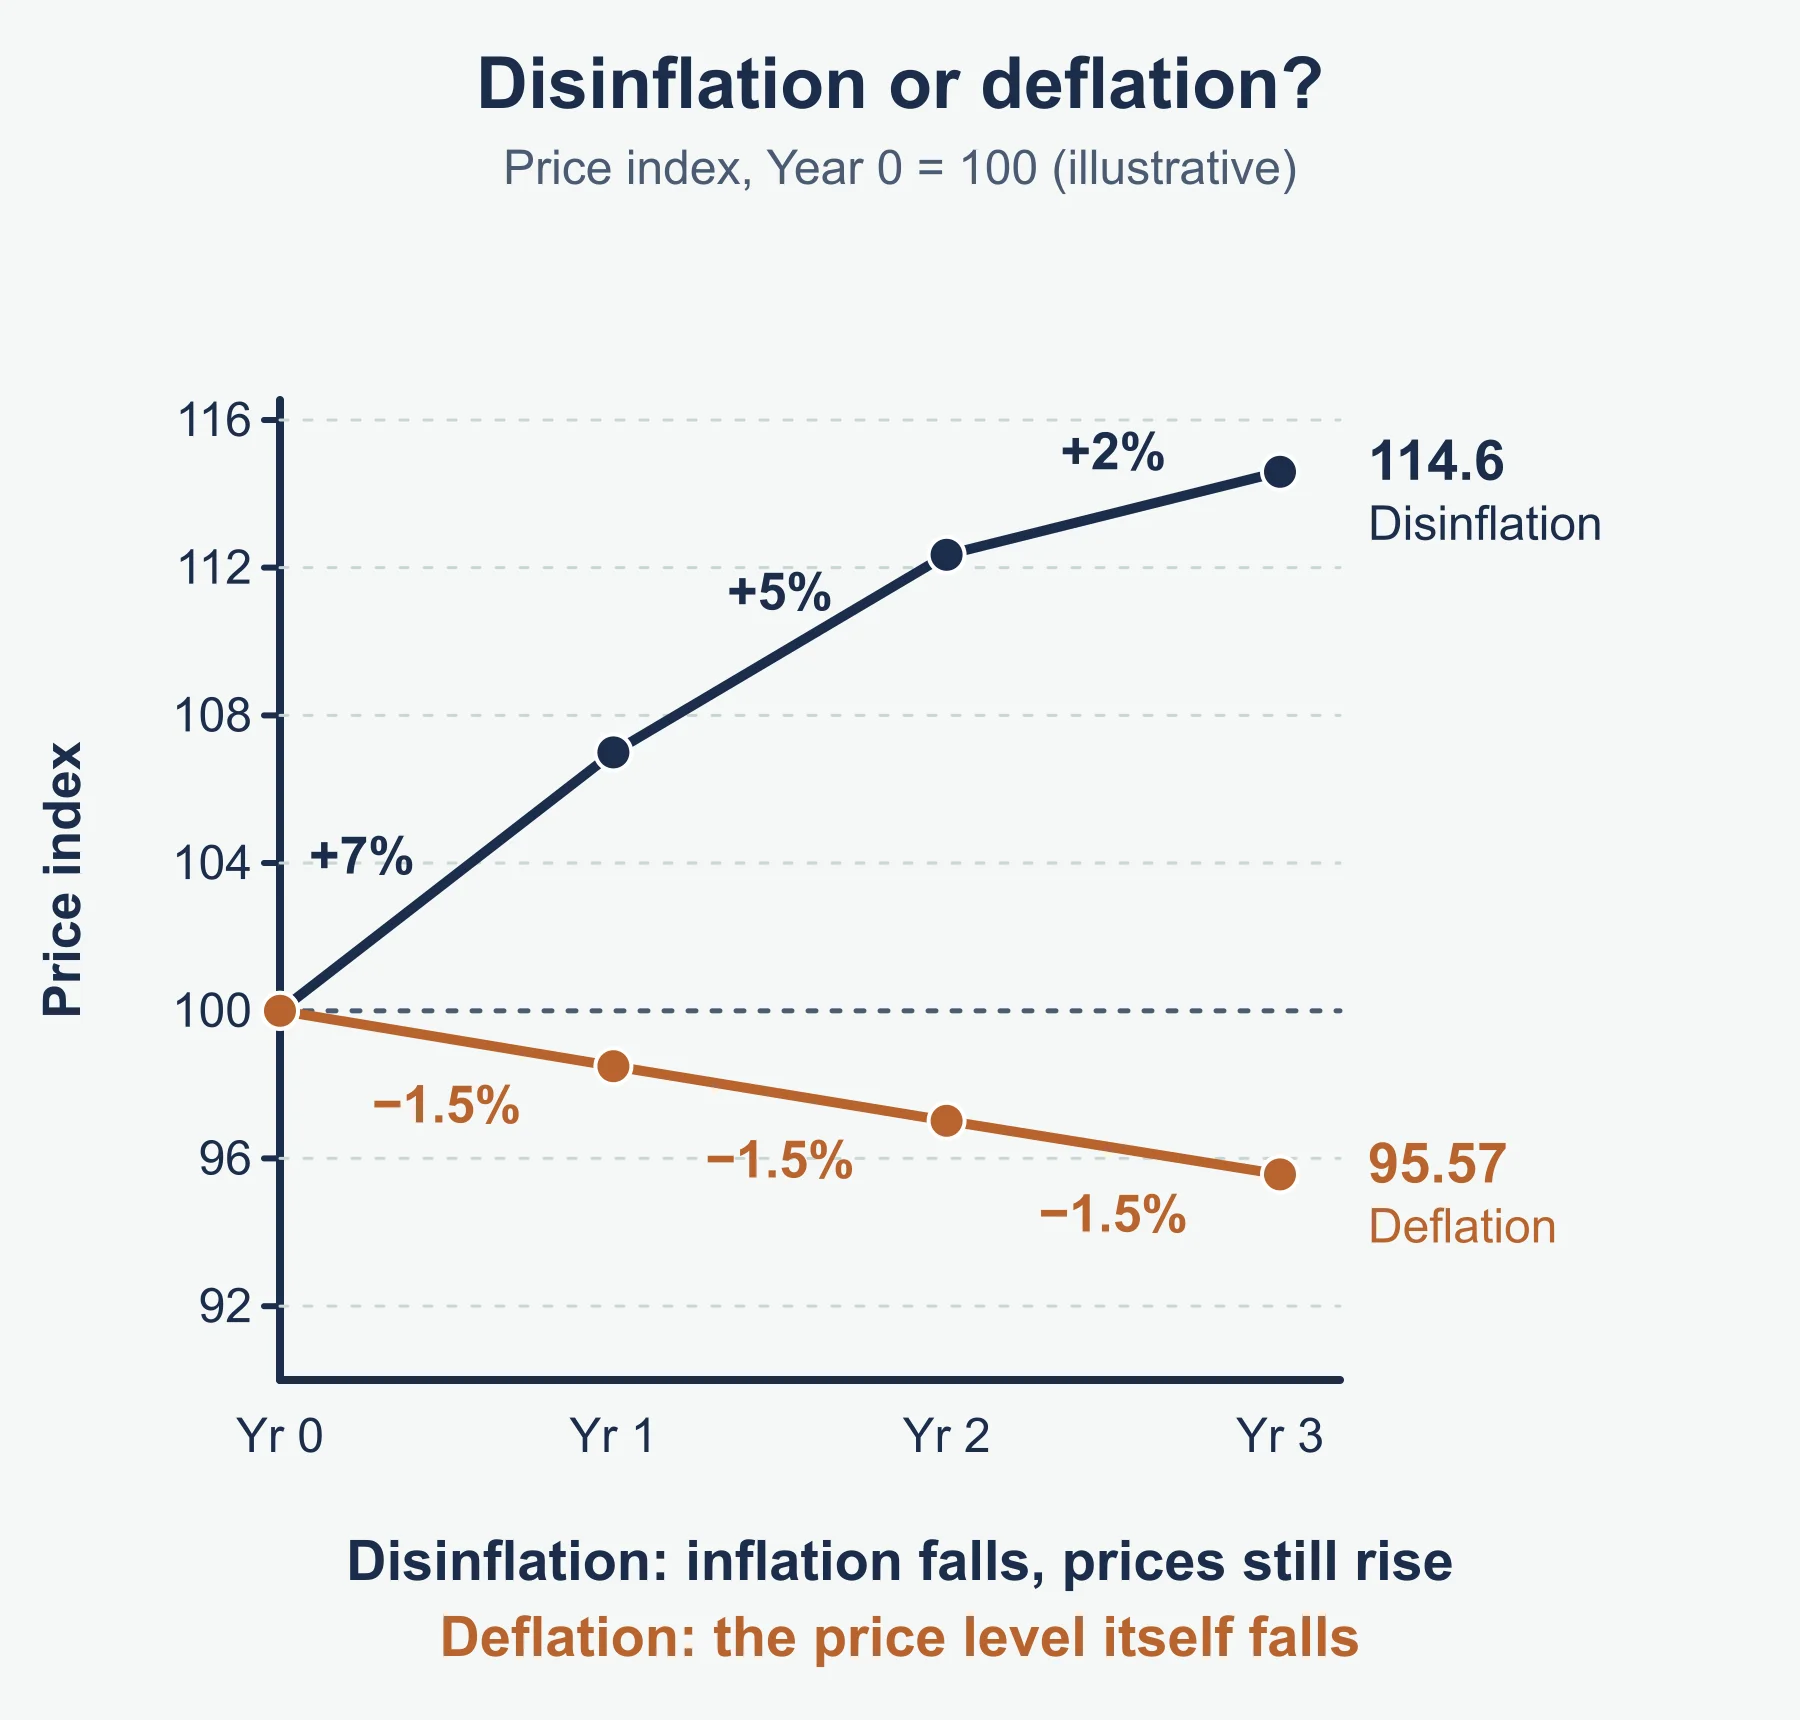
- Treating a fall in the inflation rate as falling prices. Prices fell only if inflation is negative.
- Comparing an emerging economy’s growth rate with the UK’s without mentioning the different starting levels.
- Quoting remembered UK figures without a source or year when the question gives data.
Frequently asked questions
What is a trend in macroeconomic data? A trend is the general direction of a data series over several years once short-term noise is set aside. Economists look at its level, its rate of change and its pattern, such as swings around a long-run path.
Which indicators should you use to judge macroeconomic performance? The OCR AS Level Economics (H060) specification does not list a fixed set for this topic. The sensible set is real GDP and its growth rate, employment and unemployment, and inflation, with the balance of payments and budget position where relevant.
How do developed, emerging and developing economies differ? Developed economies have high income per head and a large services sector. Emerging economies are industrialising quickly with high growth, often from a lower base. Developing economies have low income per head and often depend on a few primary products.
How do you evaluate UK economic performance against other countries? Choose indicators that match the question, state the comparison using the data, explain why gaps might exist, qualify the data, and conclude with a judgement naming which indicator weighs most.
Why can comparing growth rates between countries mislead? Fast growth from a low base is easier than slow growth from a high base, per-head figures show living standards better than totals, income per head says nothing about distribution, and results depend on exchange rates and definitions.
Official syllabus
This guide follows the OCR AS Level in Economics (H060) specification, for first assessment in 2016, published by OCR (Oxford Cambridge and RSA Examinations). The topic Trends in macroeconomic indicators sits in the Area of Study Economic policy objectives and indicators of macroeconomic performance, Component 02, Macroeconomics.
Get free revision emails (optional)
Occasional emails with practice questions, worked explanations and links to free resources for the qualification and subjects you choose. No spam, and you can unsubscribe from any email. The free tools on this site never need an email.
Related resources
-
Practice questions
OCR AS Level Economics: Trends in macroeconomic indicators (H060) – Practice Questions
Original OCR AS Level Economics practice questions with worked answers on trends in macroeconomic indicators and international comparison.
Economics · OCR · AS Level
Try questions -
Revision notes
OCR AS Level Economics: Trends in macroeconomic indicators (H060) – Revision Notes
Condensed OCR AS Level Economics revision notes on trends in macroeconomic indicators: reading data, UK phases and international comparison.
Economics · OCR · AS Level
Revise topic -
Study guides
OCR A Level Economics: Aggregate supply and the AD/AS model (H460)
Study guide to aggregate supply, the AD/AS diagram, its assumptions and macroeconomic equilibrium for OCR A Level Economics (H460), with worked examples.
Economics · OCR · AS Level
Read guide
Related articles
-
teaching
A Level tuition in Dubai: Cambridge or Pearson Edexcel International A Level?
Schools in Dubai and Abu Dhabi teach either Cambridge International AS & A Level or Pearson Edexcel International A Level. How the two are structured, why it matters for tuition, and how online classes from Lahore work.
9 October 2026
-
curriculum guides
Choosing subjects at IGCSE and A Level
How subject choices at 14 and 16 affect university options later, and how to keep pathways open without overloading a timetable.
28 July 2026
Studying this with a teacher
Working through Economics AS LEVEL?
This page is free and stays free. If you would rather be taught it, Marlbridge runs Economics classes one-to-one, online in your own time zone. One-to-one only for this course: Rs 6,000 per class in Pakistan, with other currencies on the fees page. The first trial class is free. WhatsApp replies within an hour (8am–11pm Pakistan time, every day); email the same day.
OCR Economics teachers at Marlbridge
