
Revision Notes
AQA GCSE Economics: Economic growth, employment and unemployment (8136) – Revision Notes
Condensed AQA GCSE Economics revision notes for 3.2.2.2 and 3.2.2.3: growth, GDP, real GDP and GDP per capita, unemployment measures, types and policies.
- Subject
- Economics
- Level
- GCSE
- Topic
- Economic growth, GDP, real GDP and GDP per capita; employment and unemployment
- Author
- Marlbridge Academic Team
- Updated
- Reviewed by
- Salman Ahmad (what this means)
Aligned to AQA GCSE Economics (8136), For first teaching from September 2017. Official specification .
Syllabus page (what it covers and how it is assessed): AQA GCSE Economics.
Syllabus points this page covers
8136
- 3.2.2.2 Economic growth
- 3.2.2.3 Employment and unemployment
Found an error? Report a correction.
Need help with this topic? Request a free trial class for GCSE Economics (8136).
These notes condense sections 3.2.2.2 Economic growth and 3.2.2.3 Employment and unemployment of the AQA GCSE Economics (8136) specification for first teaching from September 2017. The specification has no tiers, so everything here is for all candidates. For how the four objectives fit together and conflict, read the government objectives revision notes. Course links: AQA GCSE Economics hub, checklist and free diagnostics. Figures in worked examples are invented for practice unless a real UK fact is stated.
Part A: Economic growth (3.2.2.2)
Key terms
| Term | Meaning |
|---|---|
| Economic growth | A rise in the quantity of goods and services an economy produces over time |
| GDP (gross domestic product) | The total value of all goods and services produced in a country in a year |
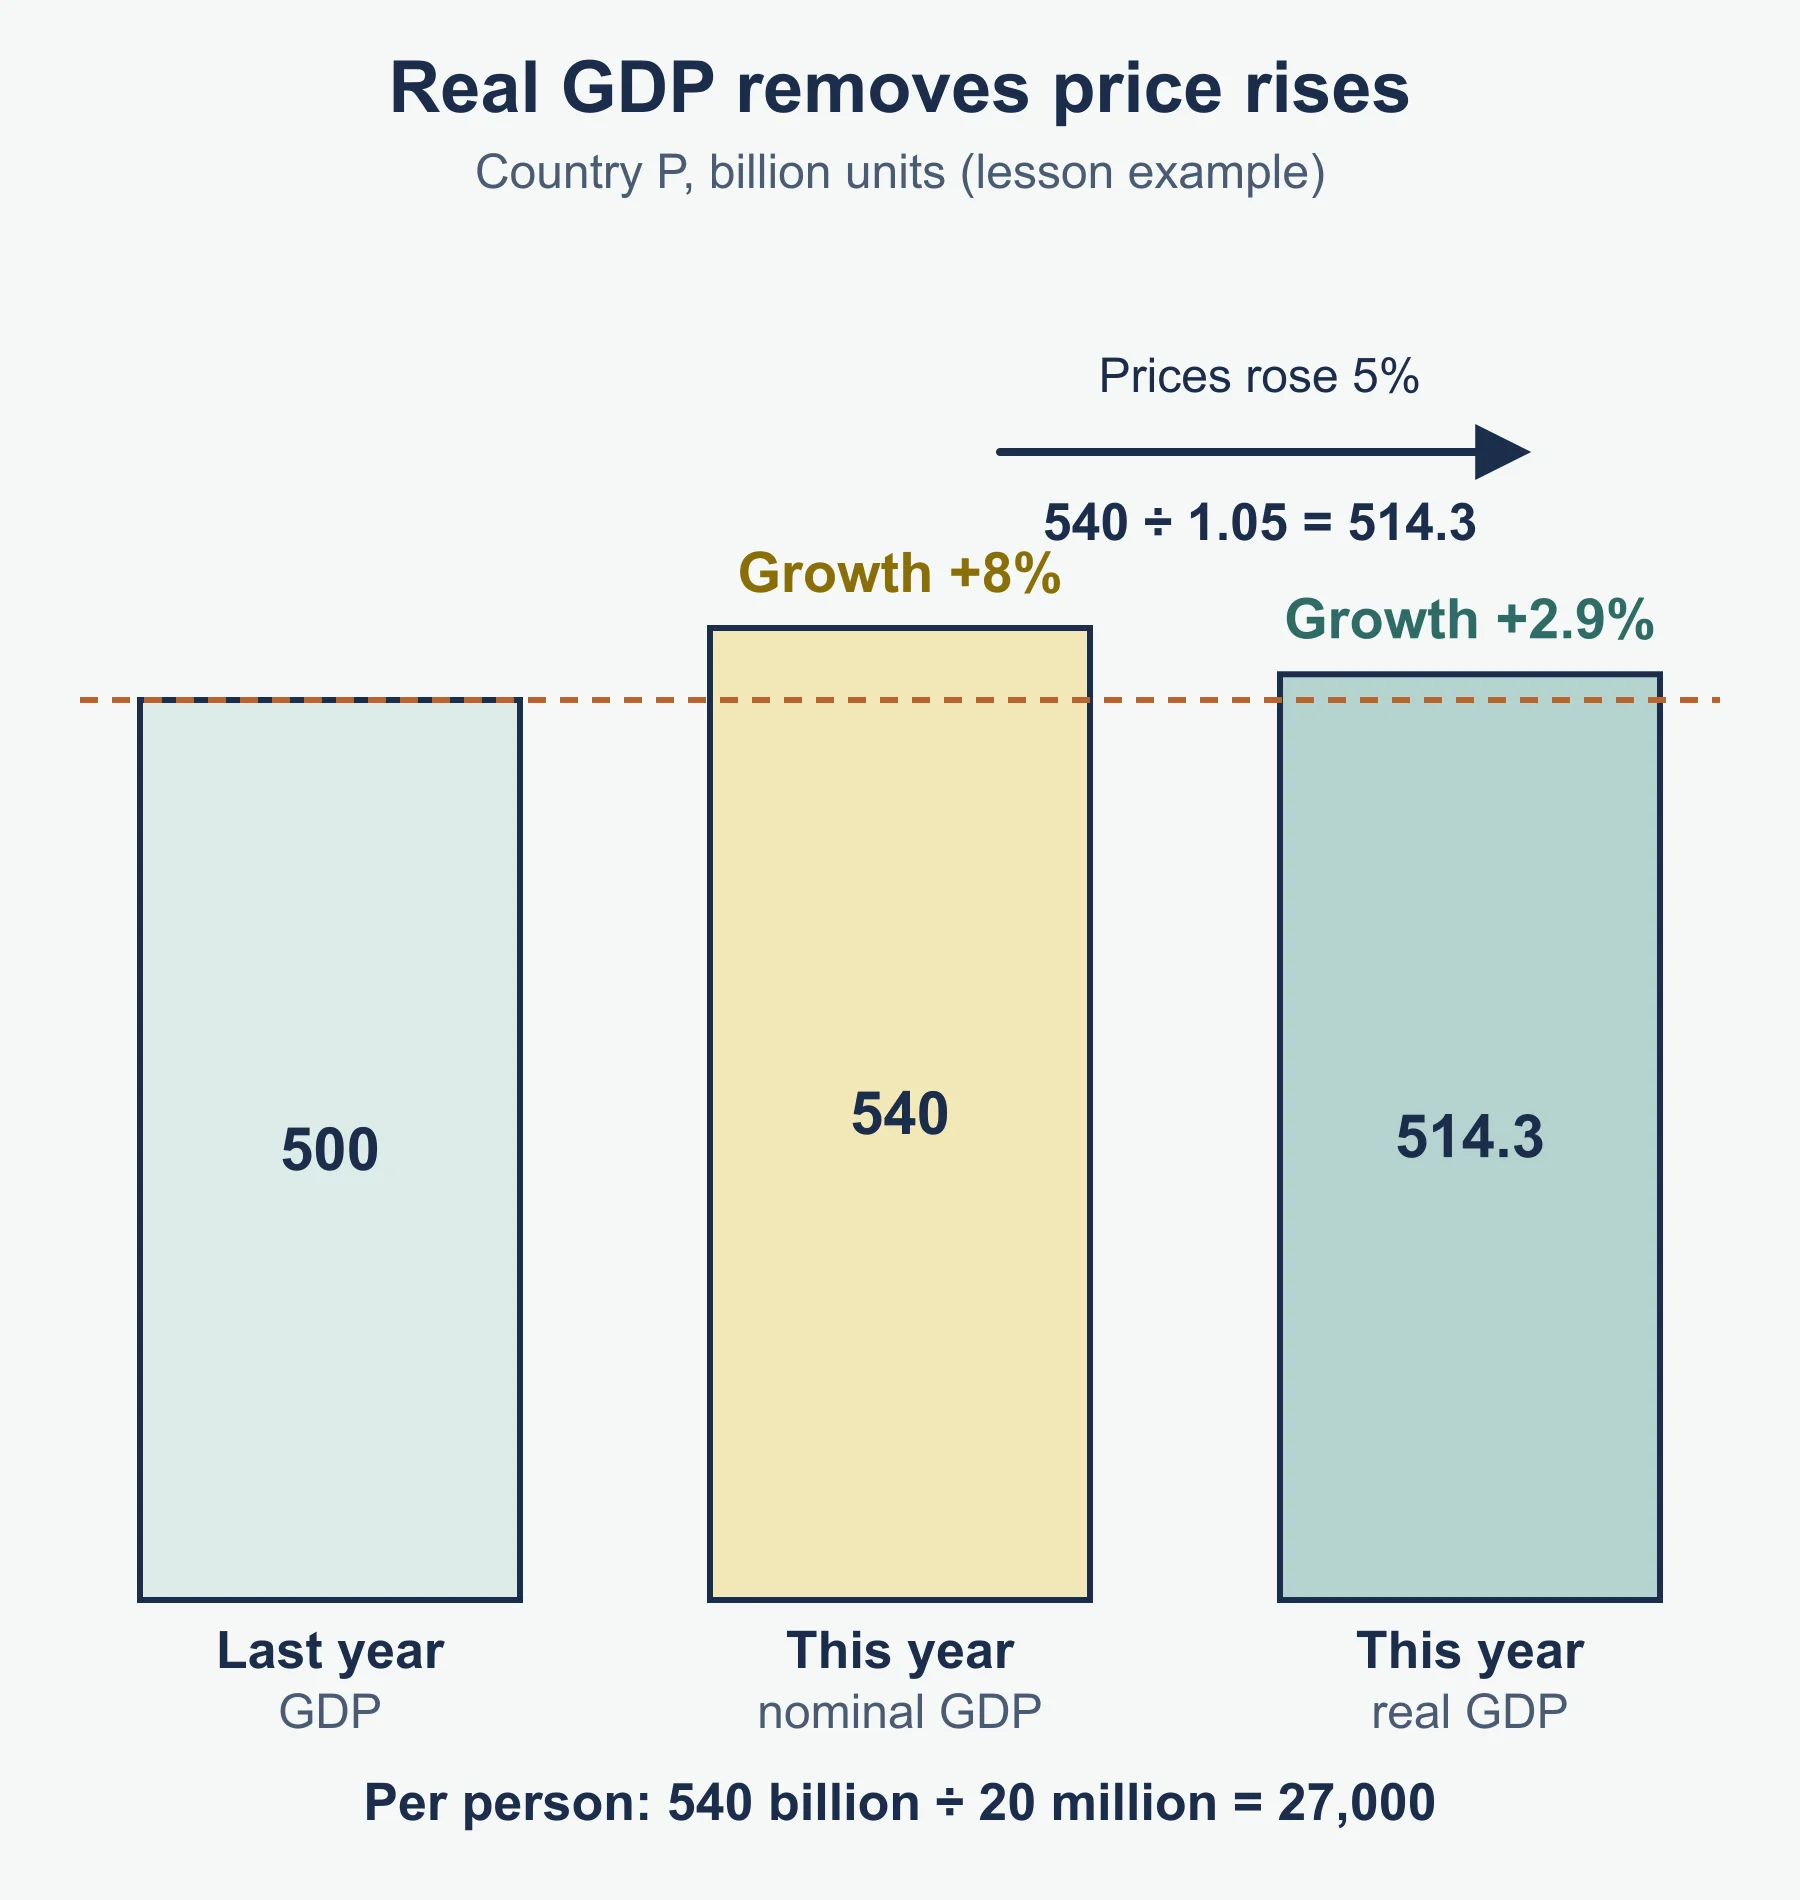
| Nominal GDP | GDP at the prices of the year it was produced, so it includes the effect of price rises |
| Real GDP | GDP adjusted for inflation (measured at constant prices), so only changes in output remain |
| GDP per capita | GDP divided by the population: average output (or income) per person |
| Recession | In the UK, two quarters in a row in which real GDP falls |
The growth rate is the percentage change in real GDP, normally over a year.
Why growth matters (its significance)
- Higher output means higher average incomes, so living standards can rise.
- Firms need more workers, so unemployment tends to fall.
- Tax revenue rises without raising tax rates, which pays for public services or reduces borrowing.
- Firms earn more profit, which funds investment and more growth later.
- Negative growth (a recession) brings falling output, job losses and lower tax revenue.
Causes of growth
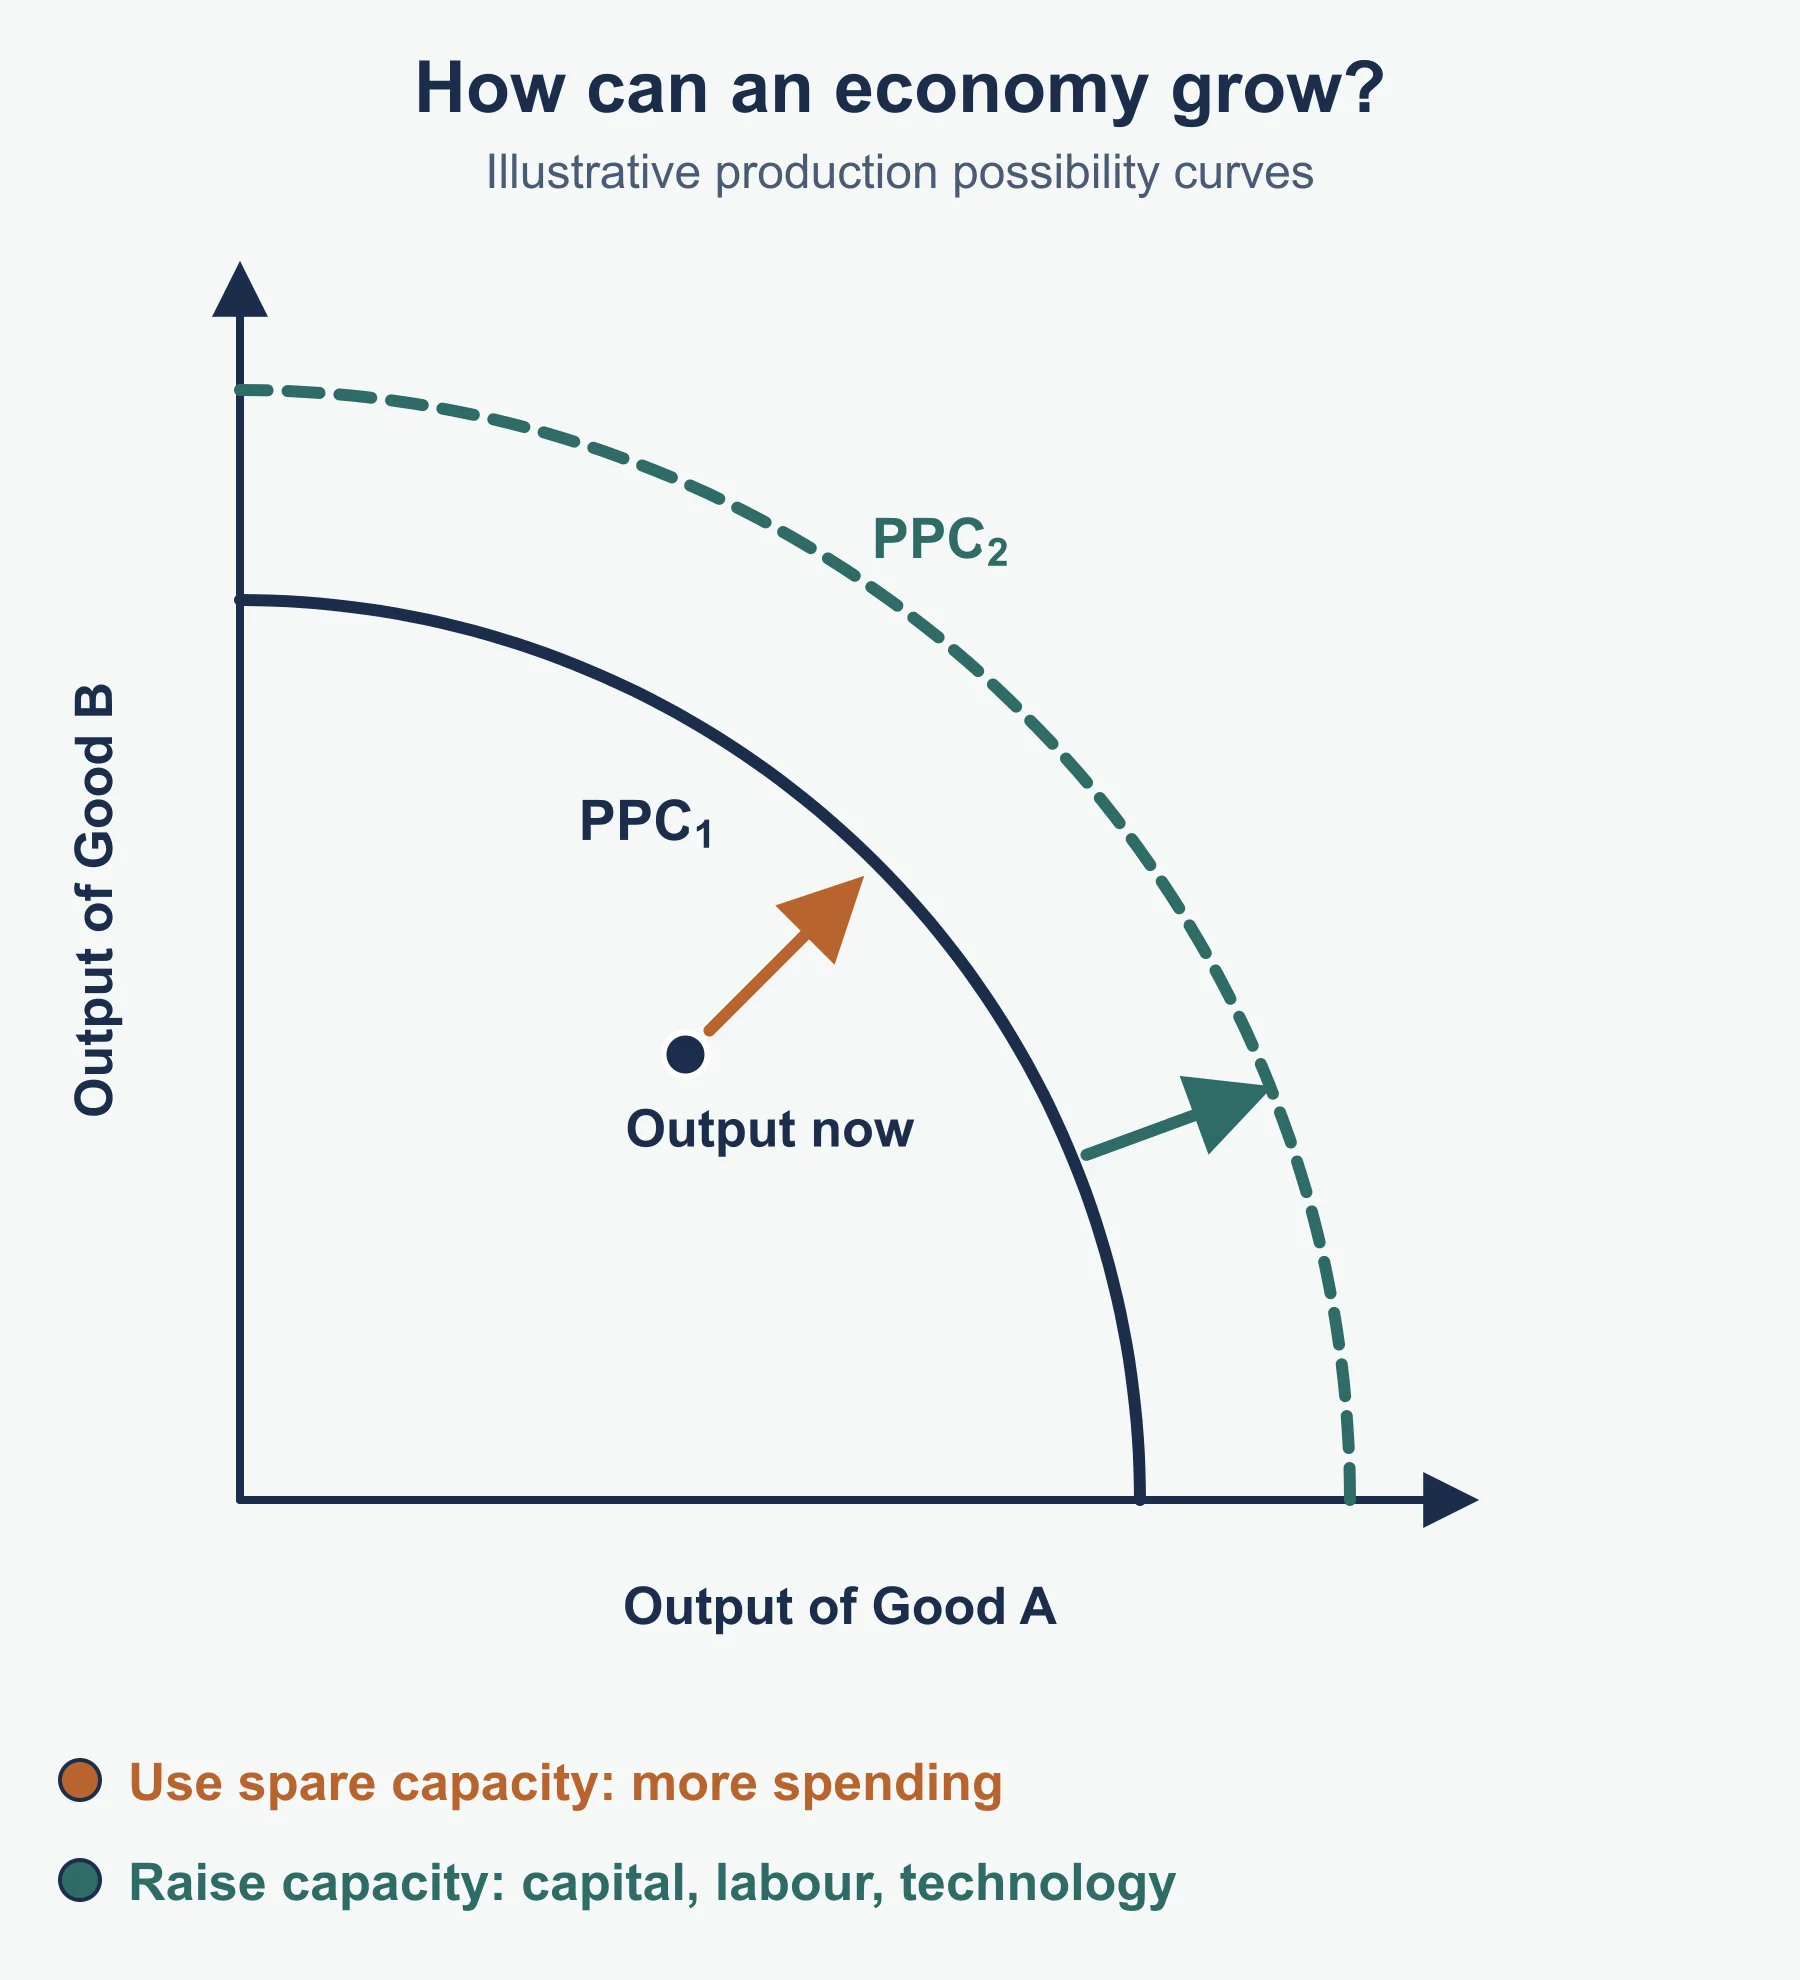
| Short run: using spare capacity | Long run: raising capacity |
|---|---|
| More spending by consumers | More and better capital (investment) |
| More investment by firms | New technology |
| More government spending | A larger or better-skilled workforce (education, training, migration) |
| More demand for exports | Better use of natural resources and higher productivity |
Benefits and costs of growth
| Benefits | Costs |
|---|---|
| Higher incomes and living standards | Pollution, congestion and climate damage |
| More jobs | Finite resources used up faster |
| More tax revenue for health and education | Demand-pull inflation if demand grows faster than capacity |
| Firms can invest and expand | Imports rise, which can worsen the current account |
| The gains may go mainly to some groups, widening inequality |
Government policies for growth
- Fiscal policy: higher government spending (for example on roads and rail) or lower taxes raise demand.
- Monetary policy: lower interest rates encourage borrowing, spending and investment.
- Supply-side policies: education and training, lower taxes on business profits and deregulation raise productive capacity, so growth can last without pushing up prices.
Calculations you must be able to do
1. Growth rate. Real GDP rises from £1,600bn to £1,640bn. Growth = (1,640 − 1,600) ÷ 1,600 × 100 = 40 ÷ 1,600 × 100 = 2.5%.
2. Nominal into real. Nominal GDP rises from £2,000bn to £2,100bn (a 5% rise). Over the year the price level rises by 3% (a price index goes from 100 to 103). Real GDP in Year 2, at Year 1 prices = 2,100 ÷ 1.03 = £2,038.8bn. Real growth = 38.8 ÷ 2,000 × 100 = 1.9% (to 1 d.p.). Quick check: nominal growth minus inflation is 5 − 3 = 2%, which is close. Only real GDP shows whether more was actually produced.
3. GDP per capita. Country P: GDP £2,720bn, population 68 million. £2,720bn ÷ 68 million = £40,000 per person. Country Q: GDP £600bn, population 10 million, so £60,000. Q has the smaller economy but the higher average output per person. Compare living standards with per capita figures, not total GDP.
4. Growth from an index. A real GDP index (base year = 100) reads 100, 104, 103 in three years. Year 2 growth = 4 ÷ 100 × 100 = 4.0%. Year 3 growth = (103 − 104) ÷ 104 × 100 = −0.96%, so output fell. The fall is 1 index point but 0.96%, because you divide by the previous year, not by 100.
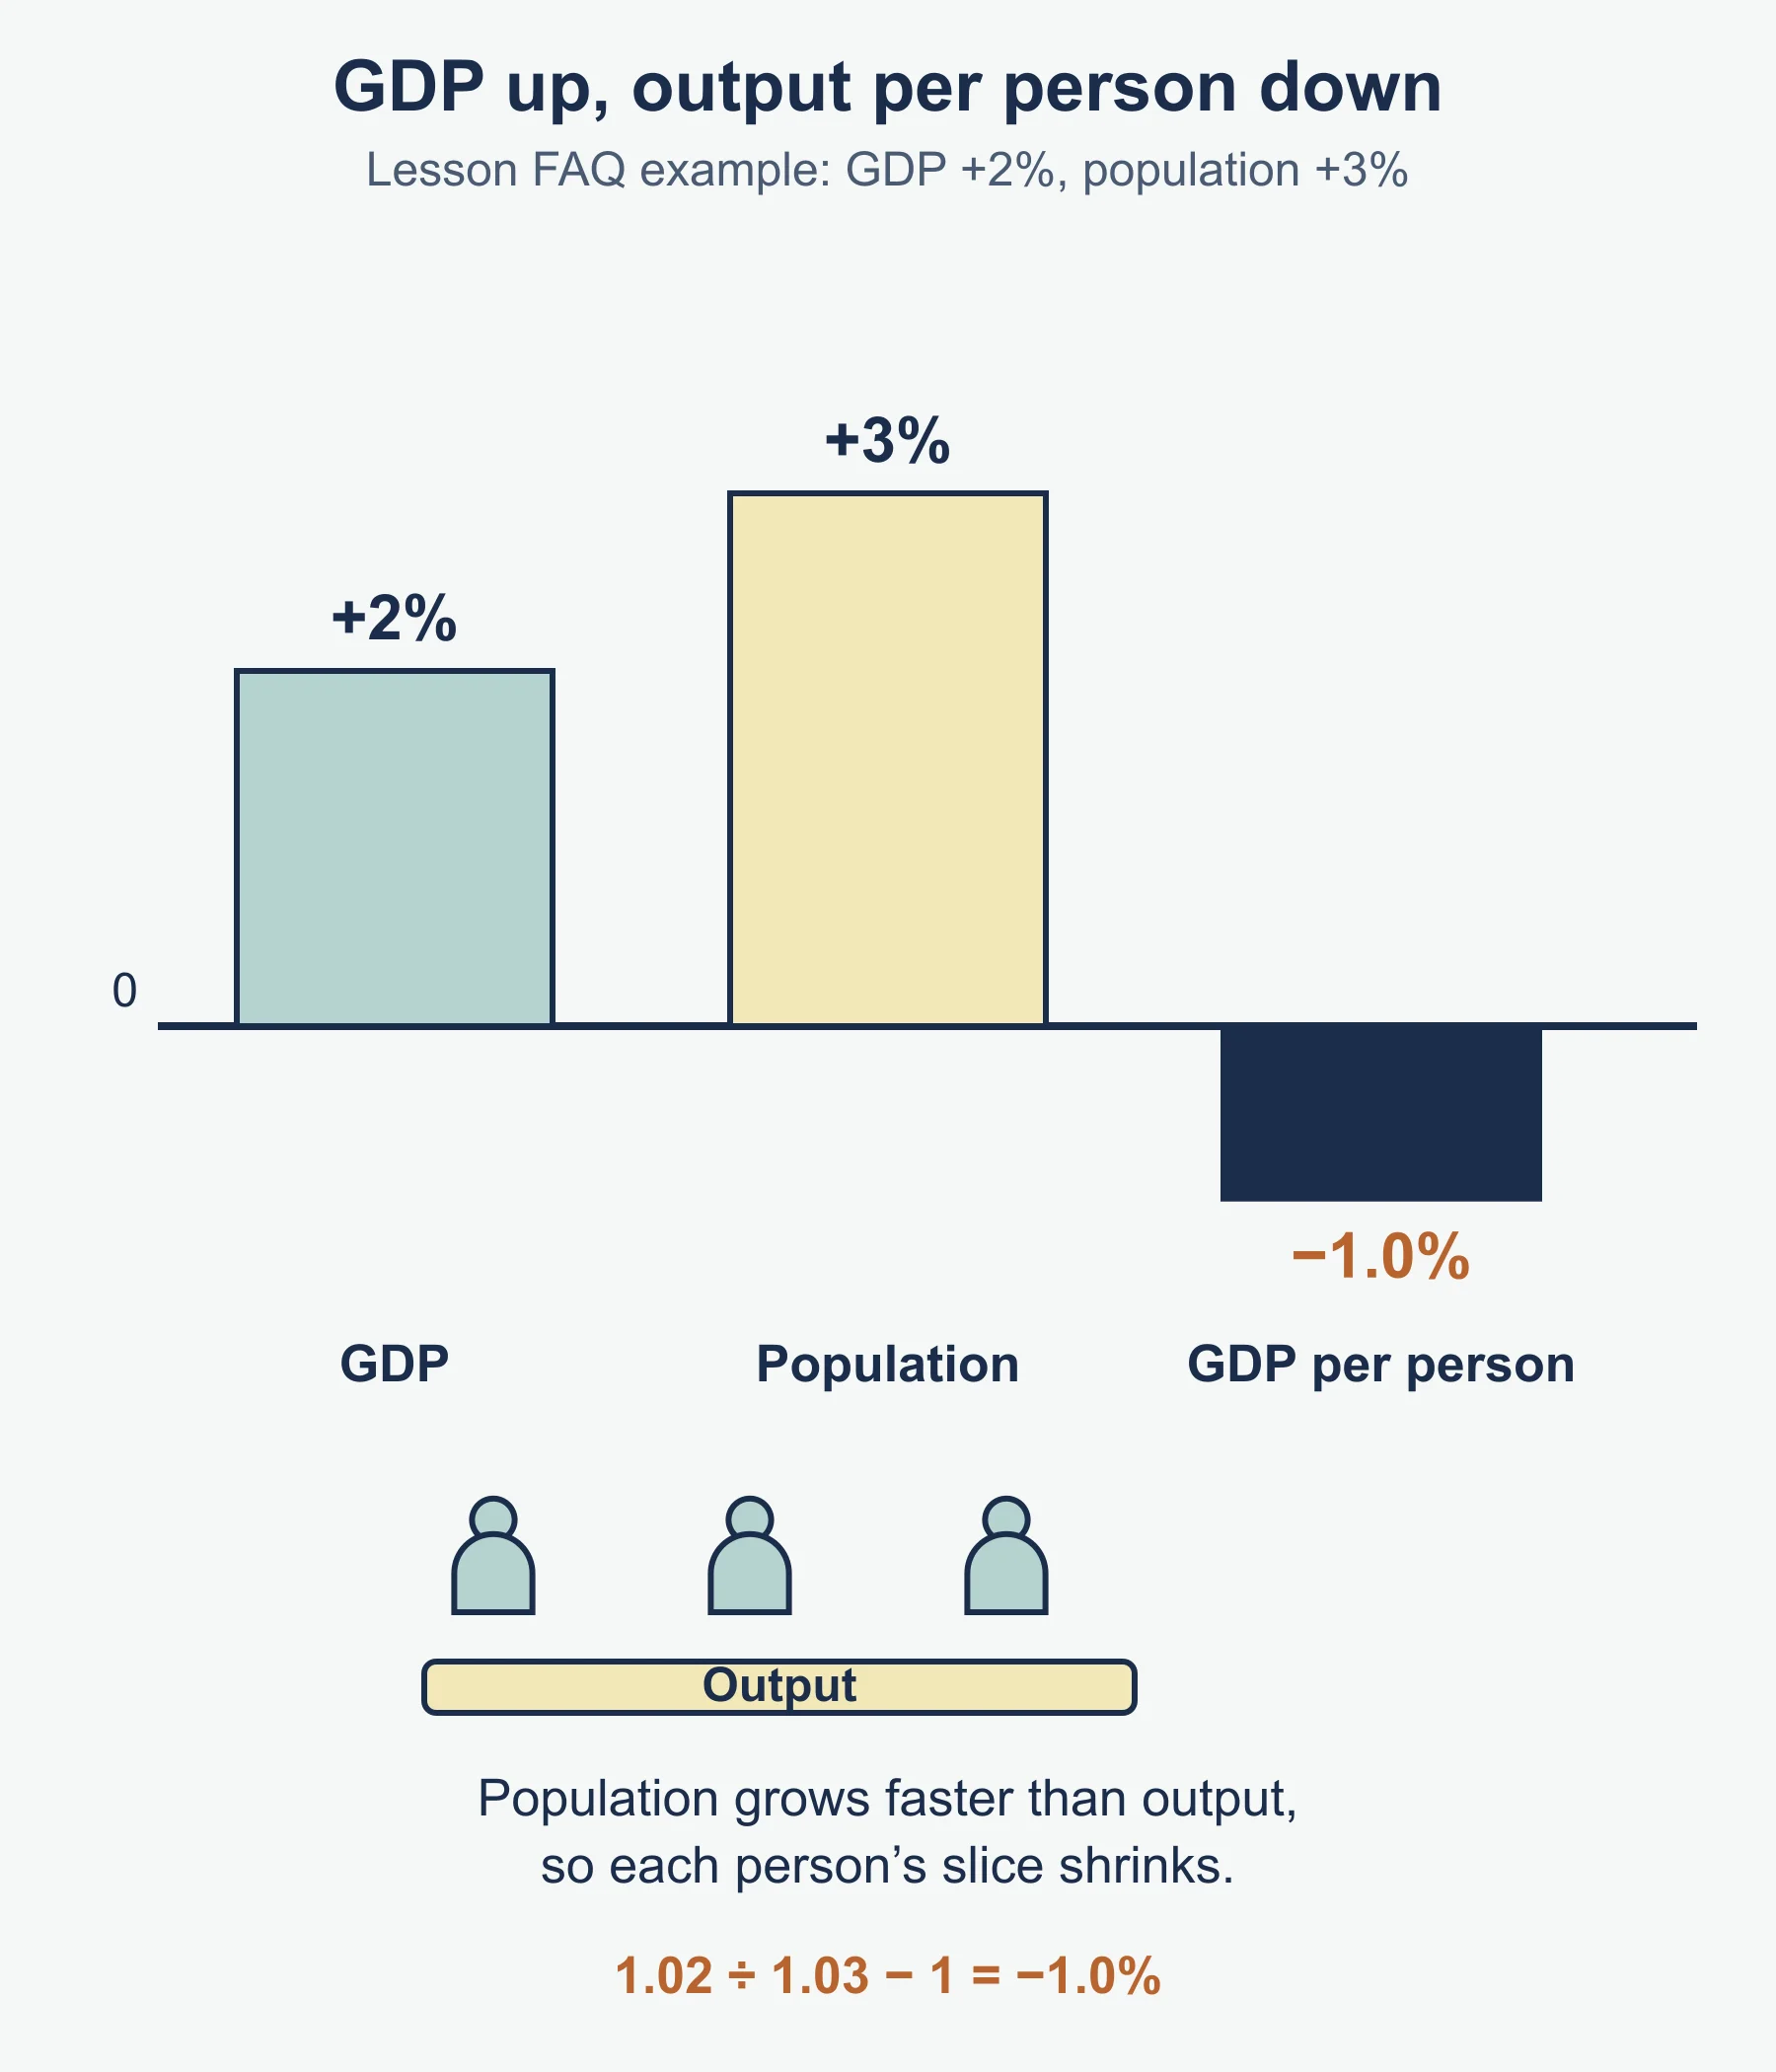
5. Per capita growth. Real GDP rises by 2% and the population by 1%. Output per person rises by about 1% (exactly 1.02 ÷ 1.01 = 1.0099, a rise of 0.99%).
Exam traps (growth)
- A fall in the growth rate (say from 3% to 1%) is still growth. Output only falls when the rate is negative.
- Nominal GDP can rise purely because prices rose. Always ask whether a figure is real or nominal.
- Total GDP says nothing about the average person: use GDP per capita.
- GDP per capita is an average. It hides how income is shared, and it leaves out unpaid work and environmental damage.
Part B: Employment and unemployment (3.2.2.3)
Key terms
| Term | Meaning |
|---|---|
| Employed | Doing paid work (full-time, part-time or self-employed) |
| Unemployed | Of working age, without a job, available for work and actively looking for it |
| Economically inactive | Not working and not looking (for example students, retired people, carers, long-term sick) |
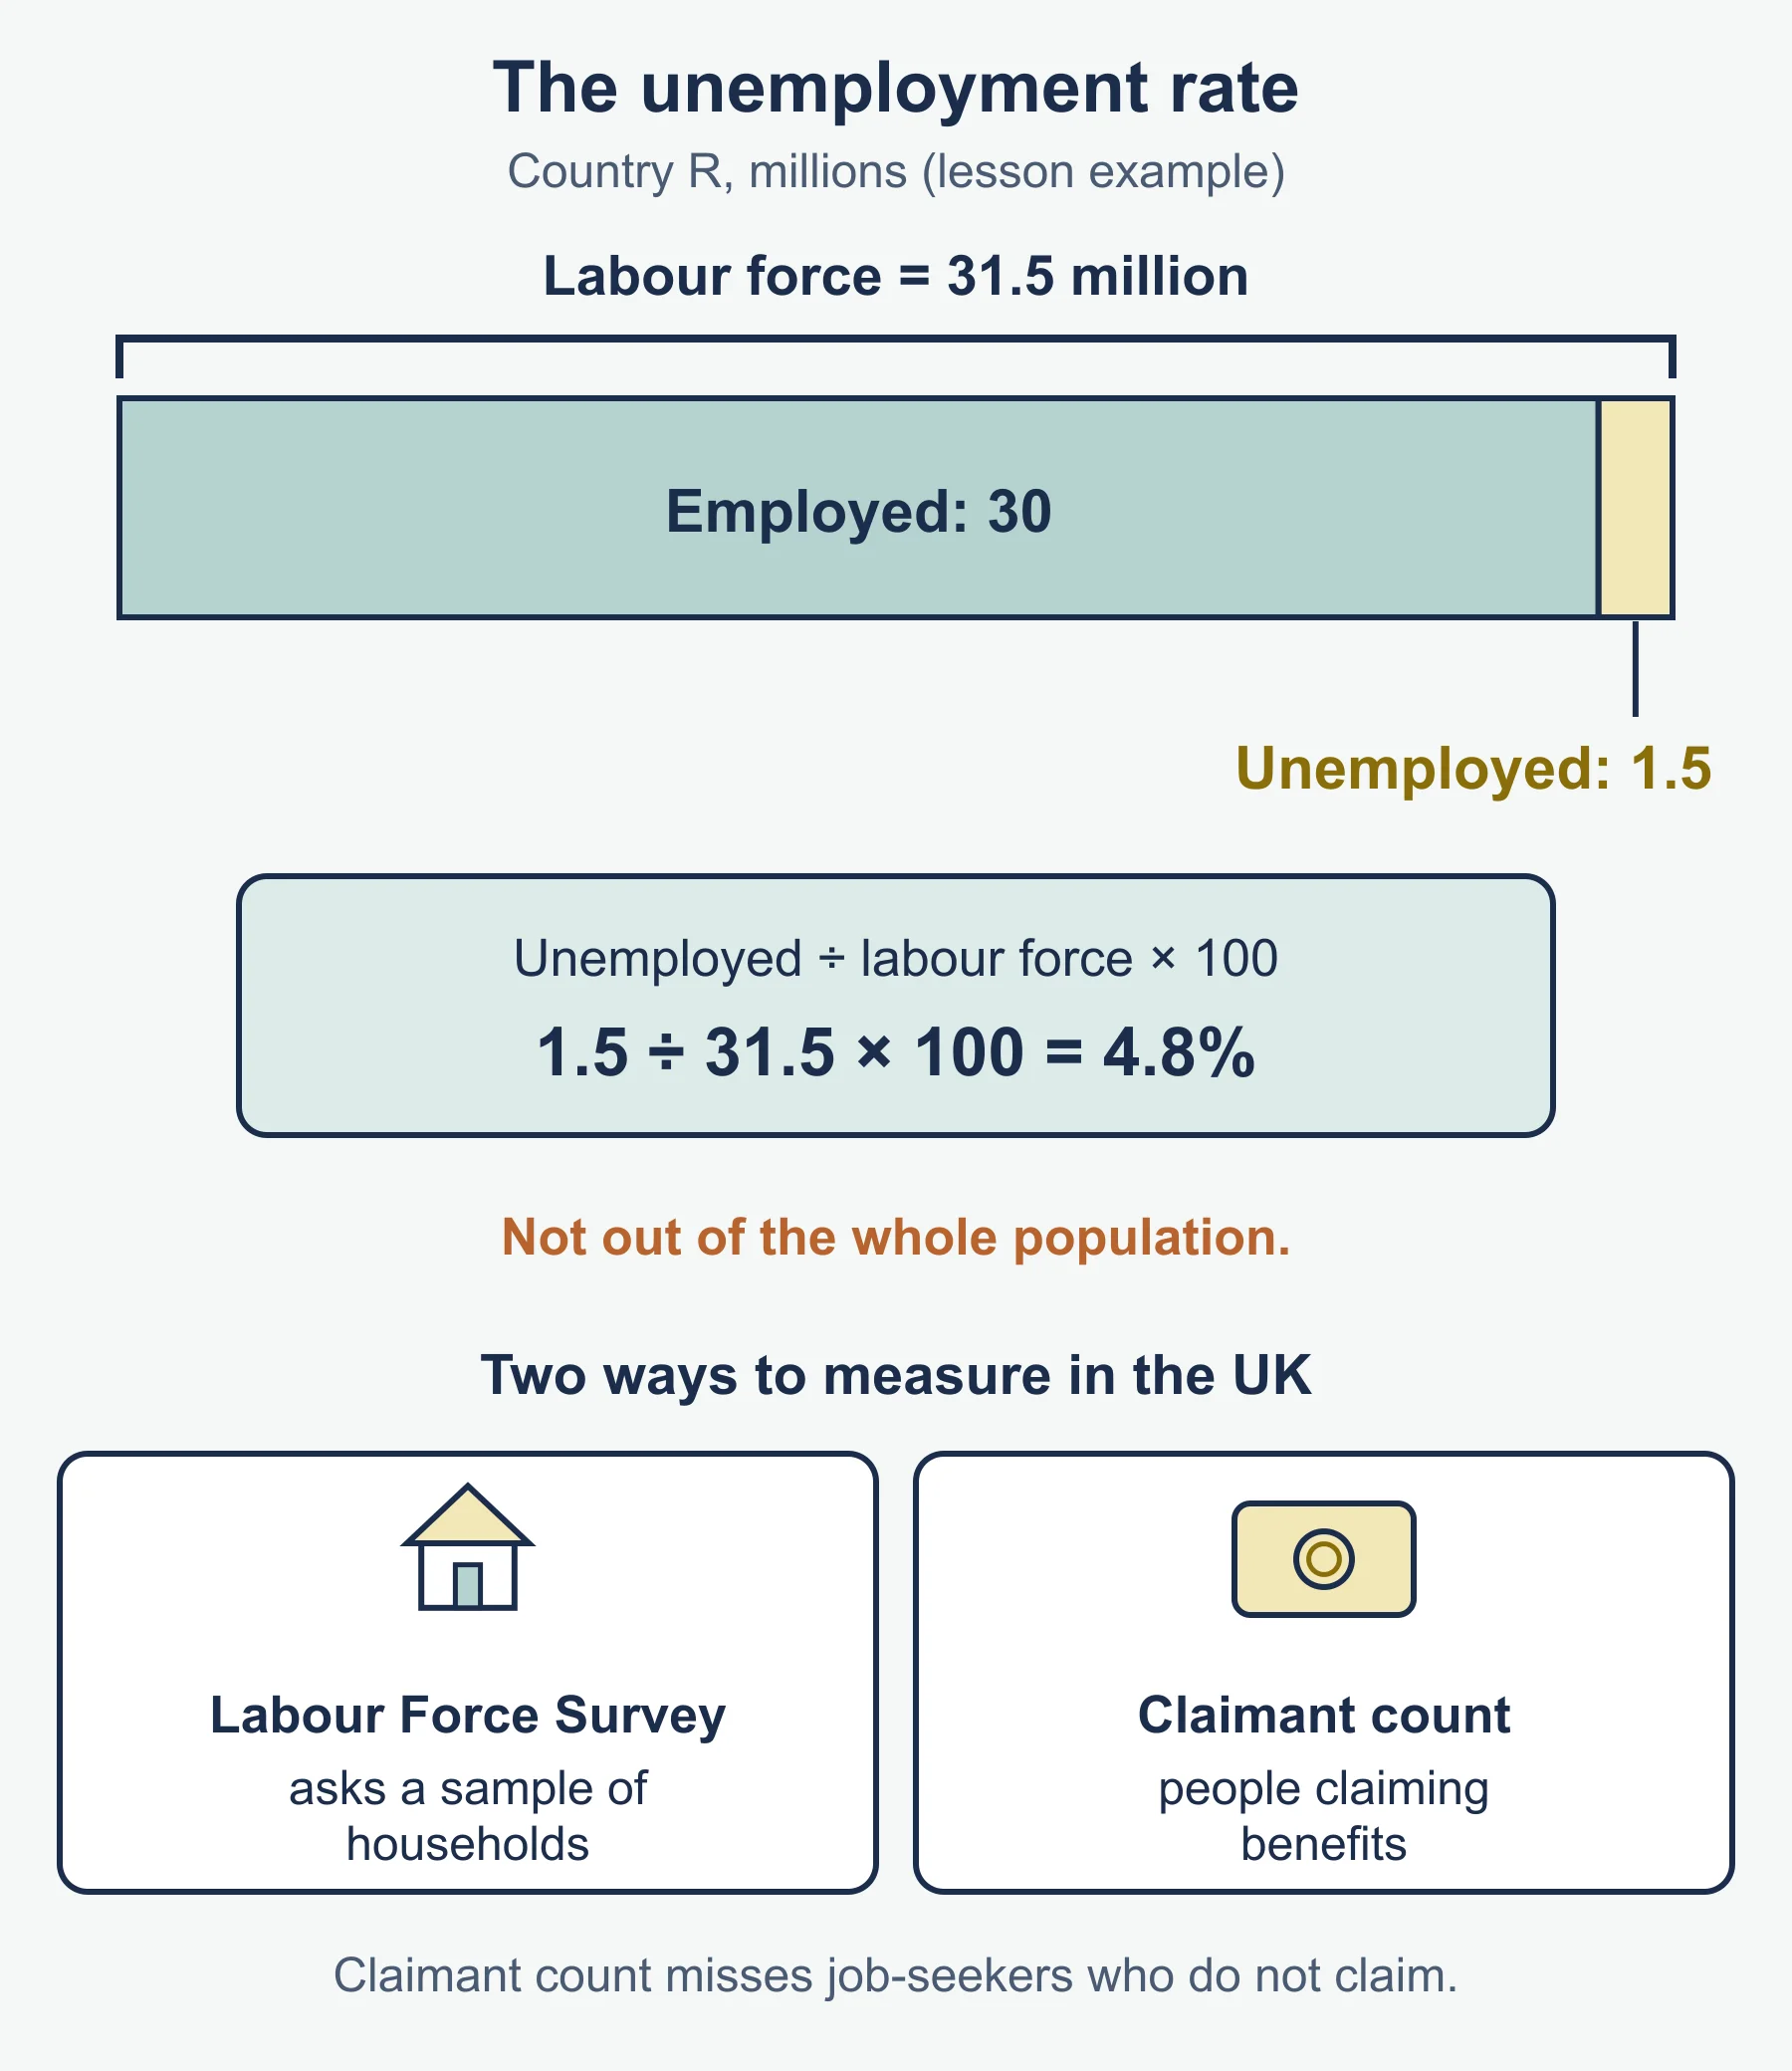
| Labour force | Employed plus unemployed |
| Unemployment rate | Unemployed ÷ labour force × 100 |
| Full employment | Almost everyone who wants a job has one; a small amount of unemployment remains, so it is not zero |
How UK unemployment is measured
| Measure | How it works | Weakness |
|---|---|---|
| Claimant Count | Counts people claiming benefits because they are unemployed | Misses unemployed people who do not or cannot claim; changes to benefit rules change the count |
| Labour Force Survey (ILO measure) | An ONS survey of households asks whether people are out of work, have looked for work in the last four weeks and could start within two weeks | Based on a sample, so it is an estimate; it is the official headline rate |
The ILO measure is usually higher than the Claimant Count, because many unemployed people are not claiming benefit.
Types and causes of unemployment
| Type | Cause | Example |
|---|---|---|
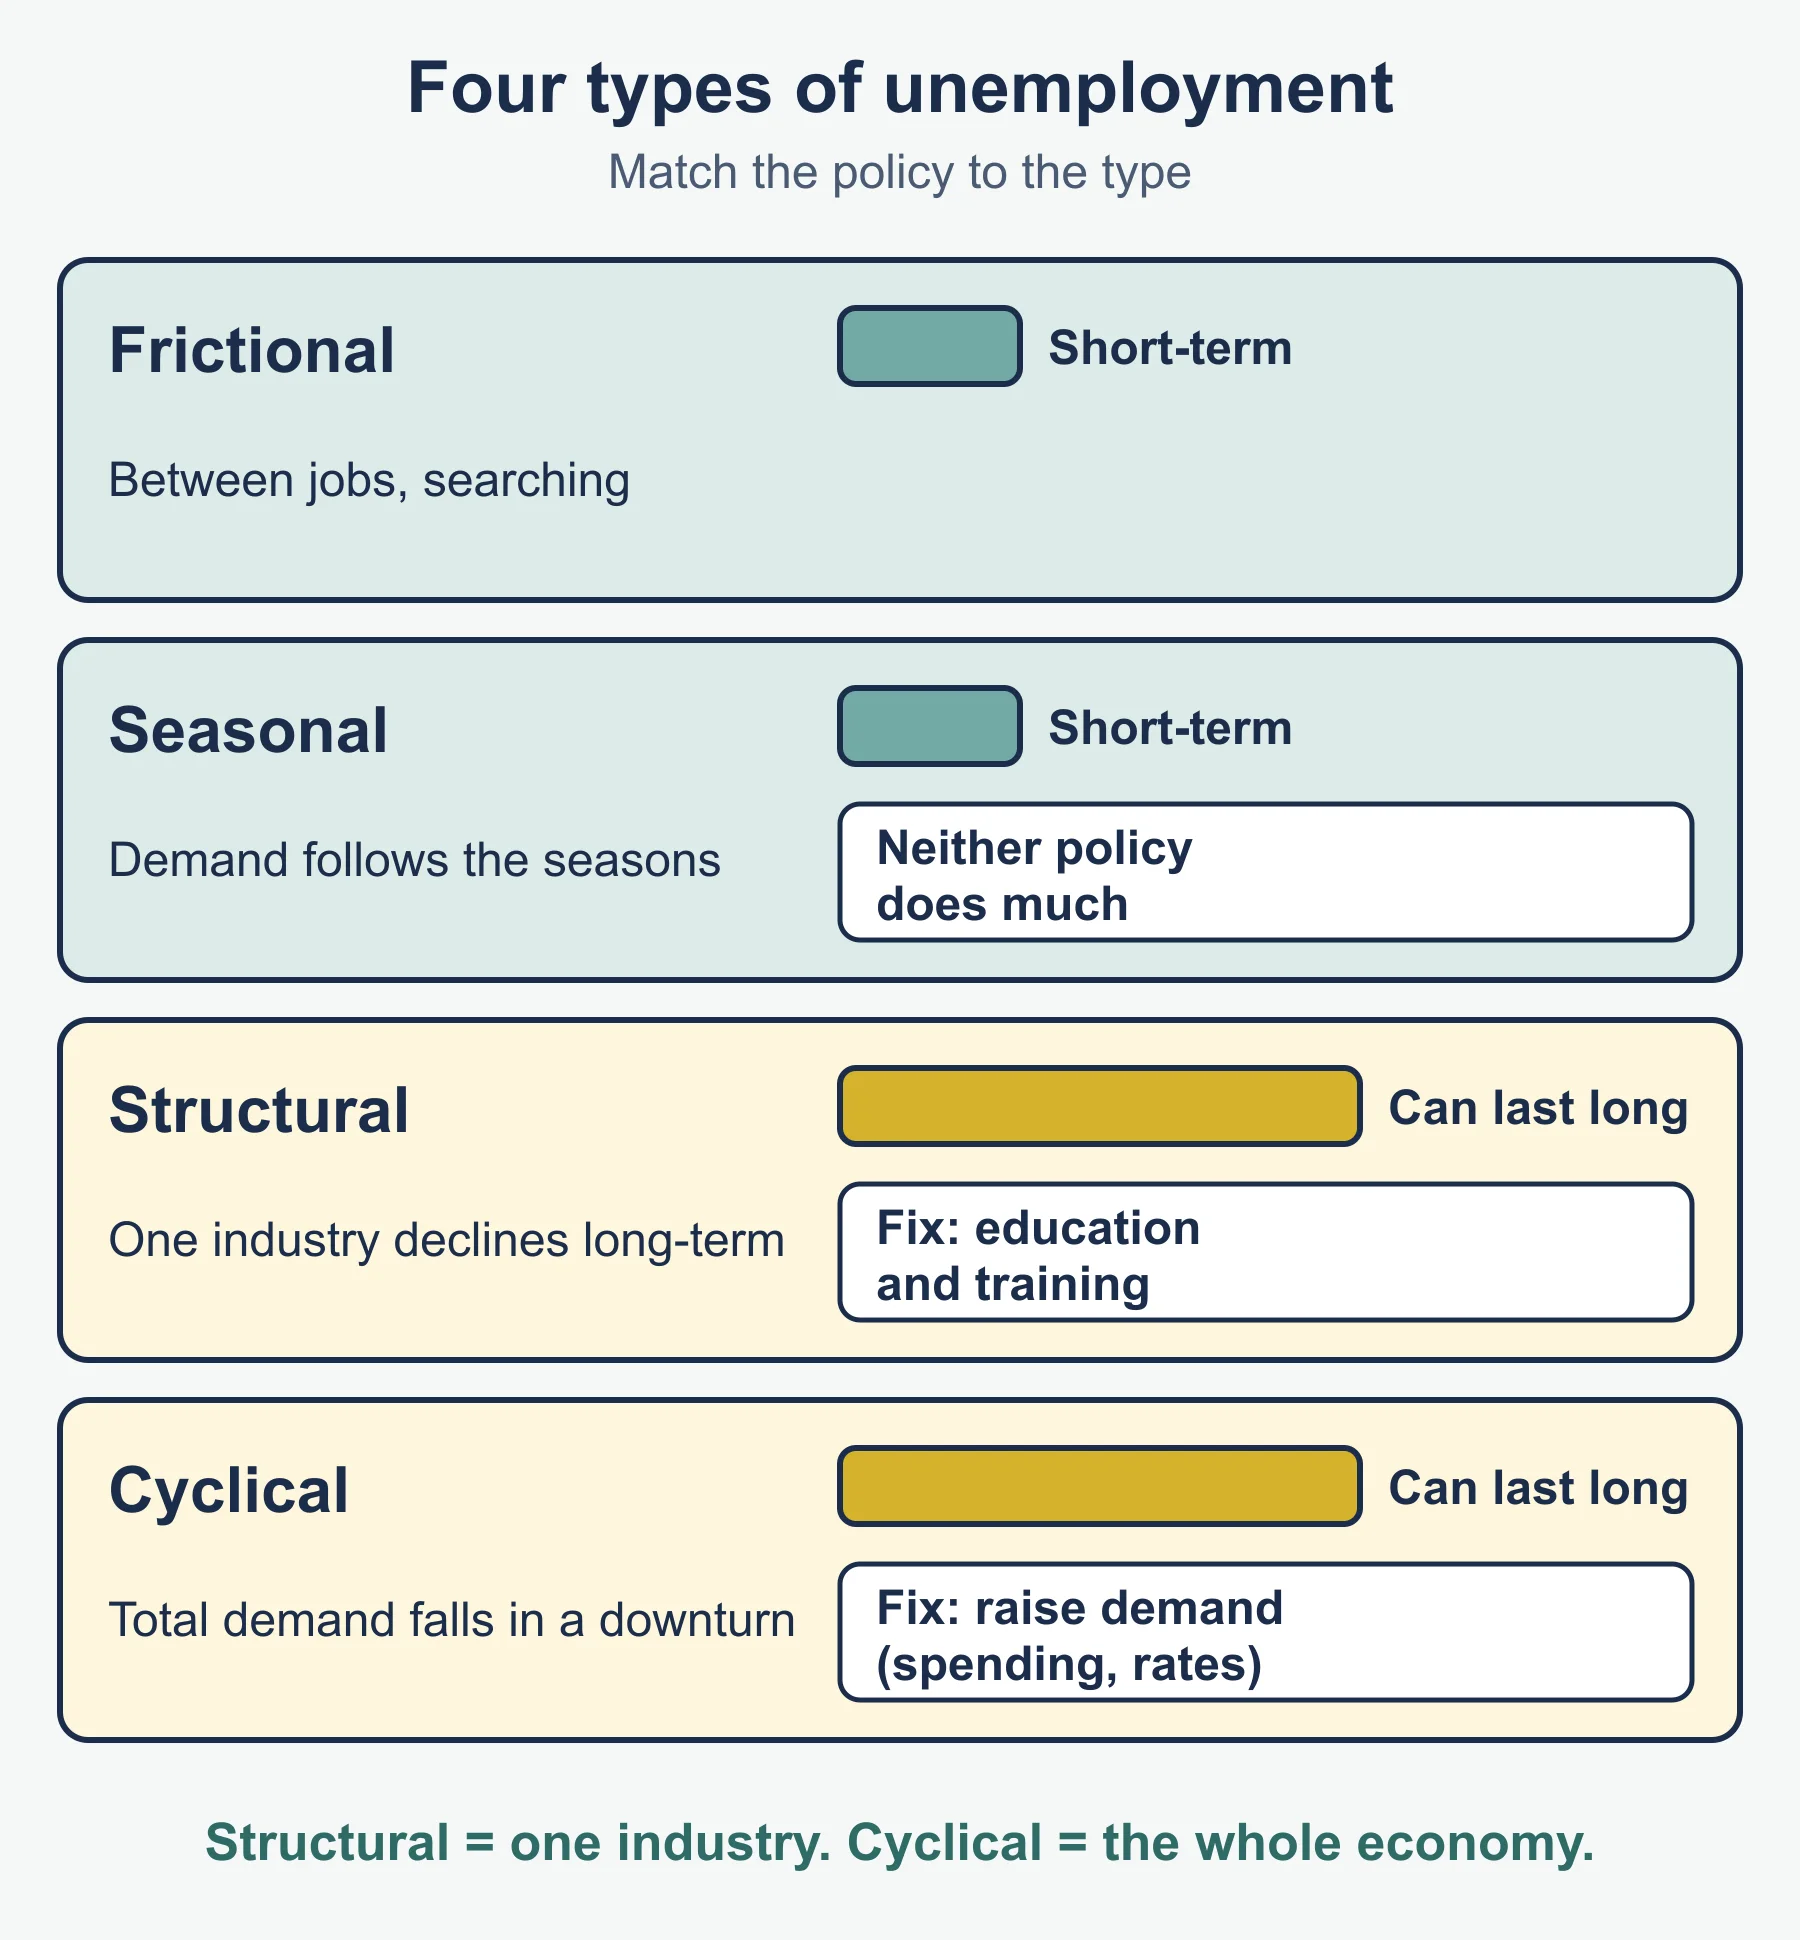
| Structural | Long-term decline of an industry, so workers’ skills or location no longer match the jobs available | Closure of coal mines and shipyards; jobs lost as shops move online |
| Seasonal | Demand for some labour changes with the time of year | Seaside hotel staff in winter, fruit pickers outside harvest |
| Frictional | Workers are between jobs while they search | A graduate taking two months to find a first job |
| Cyclical | Too little total demand in a downturn or recession, so firms in many industries cut jobs | Job losses across the economy in the 2008–09 recession |
Structural and cyclical unemployment are the most serious because they can last a long time. Frictional and seasonal unemployment are usually short.
Consequences for different groups
| Group | Effects |
|---|---|
| Unemployed people and families | Lower income, debt, loss of skills, stress and poorer health; harder to find work the longer it lasts |
| Firms | Fewer sales as spending falls; but more applicants and less pressure to raise wages |
| Government | Spends more on benefits and receives less income tax, National Insurance and VAT, so borrowing may rise |
| Local communities | Areas with high unemployment can face falling spending in shops, more poverty and more crime |
| The economy | Lost output: labour that could produce goods is wasted, so the economy is inside its production possibility frontier |
Government policies to reduce unemployment
- Cyclical: raise demand. Cut interest rates (monetary), or raise government spending or cut taxes (fiscal).
- Structural: supply-side measures such as training and retraining, apprenticeships, help with moving to where jobs are, and support for new industries in affected regions.
- Frictional: better information about vacancies (for example Jobcentre Plus) to shorten the search.
- Conflict: policies that boost demand may raise inflation and draw in imports.
Calculations you must be able to do
1. Rate from employed and unemployed. 31.2 million employed and 1.3 million unemployed. Labour force = 31.2 + 1.3 = 32.5 million. Rate = 1.3 ÷ 32.5 × 100 = 4.0%.
2. Number up, rate down. Year 1: 1.50 million unemployed in a labour force of 30 million, a rate of 5.0%. Year 2: 1.53 million unemployed in a labour force of 32 million, a rate of 1.53 ÷ 32 × 100 = 4.8% (to 1 d.p.). More people are unemployed, but the rate fell because the labour force grew faster.
3. Percentage points. The rate falls from 5.0% to 4.8%: that is 0.2 percentage points, or a 4% fall in the rate (0.2 ÷ 5.0 × 100).
Exam traps (unemployment)
- Divide by the labour force, not the whole population.
- Students and retired people are economically inactive, not unemployed.
- Full employment does not mean zero unemployment.
- Name the type of unemployment before choosing a policy: a cut in interest rates does little for a miner whose skills no longer match any local job.
Quick self-test
- Define economic growth and say how it is measured.
- What is the difference between nominal and real GDP?
- Real GDP rises from £800bn to £828bn. Find the growth rate.
- GDP is £1,500bn and the population is 50 million. Find GDP per capita.
- The growth rate falls from 2% to 0.5%. Is output falling?
- Give two costs of economic growth.
- Give two differences between the Claimant Count and the ILO measure.
- A fruit picker is out of work in winter. Which type of unemployment is this?
- 0.9 million unemployed and 29.1 million employed. Find the unemployment rate.
- Suggest one policy for structural unemployment and explain why it suits that type.
Answers
- A rise in the output of goods and services over time, measured by the percentage change in real GDP.
- Nominal GDP uses current prices, so it rises with inflation. Real GDP removes the effect of price changes.
- 28 ÷ 800 × 100 = 3.5%.
- £1,500bn ÷ 50 million = £30,000.
- No. Output is still rising, but more slowly.
- Any two: pollution, using up finite resources, inflation, a worse current account, unequal gains.
- The Claimant Count counts benefit claimants; the ILO measure comes from a survey. The ILO measure includes people who are looking for work but not claiming, so it is usually higher.
- Seasonal unemployment.
- Labour force = 30 million. 0.9 ÷ 30 × 100 = 3.0%.
- Retraining, because structural unemployment comes from a mismatch between workers’ skills and the jobs available; extra demand would not fix that mismatch.
Where marks are usually lost
- Using nominal GDP as evidence that output rose.
- Comparing countries’ living standards with total GDP.
- Calling a slower growth rate a recession.
- Dividing unemployed by population, or by the number employed.
- Listing types of unemployment without the cause of each.
- Stating a policy with no chain of effects, or no conflict with another objective.
Frequently asked questions
What is a recession in the UK? In the UK, a recession is two quarters in a row in which real GDP falls. A slower growth rate on its own is not a recession.
What is the difference between the Claimant Count and the ILO measure? The Claimant Count counts people claiming unemployment benefits. The ILO measure comes from the Labour Force Survey and is usually higher, because many unemployed people do not claim.
Are students and retired people unemployed? No. They are economically inactive, because they are not working and not looking for work.
What is the difference between a percentage point and a percentage change? If the unemployment rate falls from 5.0% to 4.8%, that is a fall of 0.2 percentage points, but a percentage fall of 4%.
Does full employment mean zero unemployment? No. Full employment means almost everyone who wants a job has one; a small amount of unemployment remains.
Official syllabus
AQA GCSE Economics (8136) specification, for first teaching from September 2017 (Version 1.0), published by AQA: sections 3.2.2.2 Economic growth and 3.2.2.3 Employment and unemployment.
Get free revision emails (optional)
Occasional emails with practice questions, worked explanations and links to free resources for the qualification and subjects you choose. No spam, and you can unsubscribe from any email. The free tools on this site never need an email.
Related resources
-
Study guides
AQA GCSE Economics: Economic growth, employment and unemployment (8136)
Study guide to AQA GCSE Economics 8136 sections 3.2.2.2 and 3.2.2.3: GDP, real GDP, GDP per capita, causes of growth, unemployment types and policies.
Economics · AQA · GCSE
Read guide -
Practice questions
AQA GCSE Economics: Economic growth, employment and unemployment (8136) – Practice Questions
Twelve original practice questions with worked answers for AQA GCSE Economics 8136 sections 3.2.2.2 and 3.2.2.3: GDP calculations, growth and unemployment.
Economics · AQA · GCSE
Try questions -
Study guides
AQA GCSE Economics: Government objectives, conflicts and ethical considerations (8136)
Study guide to AQA GCSE Economics 3.2.2.1: the four main objectives, how they conflict, inequality, the environment and ethics, with worked examples.
Economics · AQA · GCSE
Read guide
Related articles
-
teaching
A Level tuition in Dubai: Cambridge or Pearson Edexcel International A Level?
Schools in Dubai and Abu Dhabi teach either Cambridge International AS & A Level or Pearson Edexcel International A Level. How the two are structured, why it matters for tuition, and how online classes from Lahore work.
9 October 2026
-
curriculum guides
Choosing subjects at IGCSE and A Level
How subject choices at 14 and 16 affect university options later, and how to keep pathways open without overloading a timetable.
28 July 2026
Studying this with a teacher
Working through Economics GCSE?
This page is free and stays free. If you would rather be taught it, Marlbridge runs Economics classes one-to-one and in small groups of up to 15, online in your own time zone. The first trial class is free. WhatsApp replies within an hour (8am–11pm Pakistan time, every day); email the same day.
AQA Economics teachers at Marlbridge
