
Study Guides
AQA GCSE Economics: Economic growth, employment and unemployment (8136)
Study guide to AQA GCSE Economics 8136 sections 3.2.2.2 and 3.2.2.3: GDP, real GDP, GDP per capita, causes of growth, unemployment types and policies.
- Subject
- Economics
- Level
- GCSE
- Topic
- Economic growth, GDP, real GDP and GDP per capita; employment and unemployment
- Author
- Marlbridge Academic Team
- Updated
- Reviewed by
- Salman Ahmad (what this means)
Aligned to AQA GCSE Economics (8136), For first teaching from September 2017. Official specification .
Syllabus page (what it covers and how it is assessed): AQA GCSE Economics.
Syllabus points this page covers
8136
- 3.2.2.2 Economic growth
- 3.2.2.3 Employment and unemployment
Found an error? Report a correction.
Need help with this topic? Request a free trial class for GCSE Economics (8136).
Economic growth is a rise in the quantity of goods and services an economy produces over time, usually measured as the percentage change in real GDP. Unemployment is the number of people who want work and are actively looking for it but do not have a job. In AQA GCSE Economics (8136), sections 3.2.2.2 and 3.2.2.3 ask you to explain why growth matters, calculate GDP, real GDP and GDP per capita, name the four types of unemployment and judge the policies a government can use.
Both sections sit in 3.2 How the economy works, which is assessed on Paper 2. The specification has no tiers. Countries and numbers below are invented to illustrate the ideas. Pair this guide with the revision notes and the practice questions. For how growth and employment fit alongside the other objectives, see the government objectives guide. Course links: AQA GCSE Economics hub, checklist and free diagnostics.
Syllabus coverage
| Specification point | What you must be able to do |
|---|---|
| 3.2.2.2 The significance of economic growth | Explain what economic growth is and why it matters to an economy |
| 3.2.2.2 Causes, costs and benefits | Explain what causes growth and weigh its costs against its benefits |
| 3.2.2.2 Measurement | Tell GDP, real GDP and GDP per capita apart and do simple calculations with them |
| 3.2.2.2 Policies | Explain government policies to achieve growth |
| 3.2.2.3 Measurement of unemployment | Explain employment and unemployment and how they are measured |
| 3.2.2.3 Types, causes and consequences | Explain structural, seasonal, frictional and cyclical unemployment and the consequences for different groups |
| 3.2.2.3 Policies | Explain government policies to reduce unemployment |
What is economic growth and why does it matter?
Growth means the economy is producing more goods and services than before. When output rises, firms need more workers, incomes rise, and the government collects more tax without raising tax rates. That extra revenue can pay for schools, hospitals and benefits. Growth is one of the government’s four principal objectives because it is the main way living standards rise over time.
GDP, real GDP and GDP per capita
| Measure | What it shows | Why it matters |
|---|---|---|
| GDP | Total value of goods and services produced in a country in a year | The size of the economy |
| Real GDP | GDP adjusted for inflation | Shows whether output really rose, not just prices |
| GDP per capita | GDP divided by the population | A rough guide to the average standard of living |
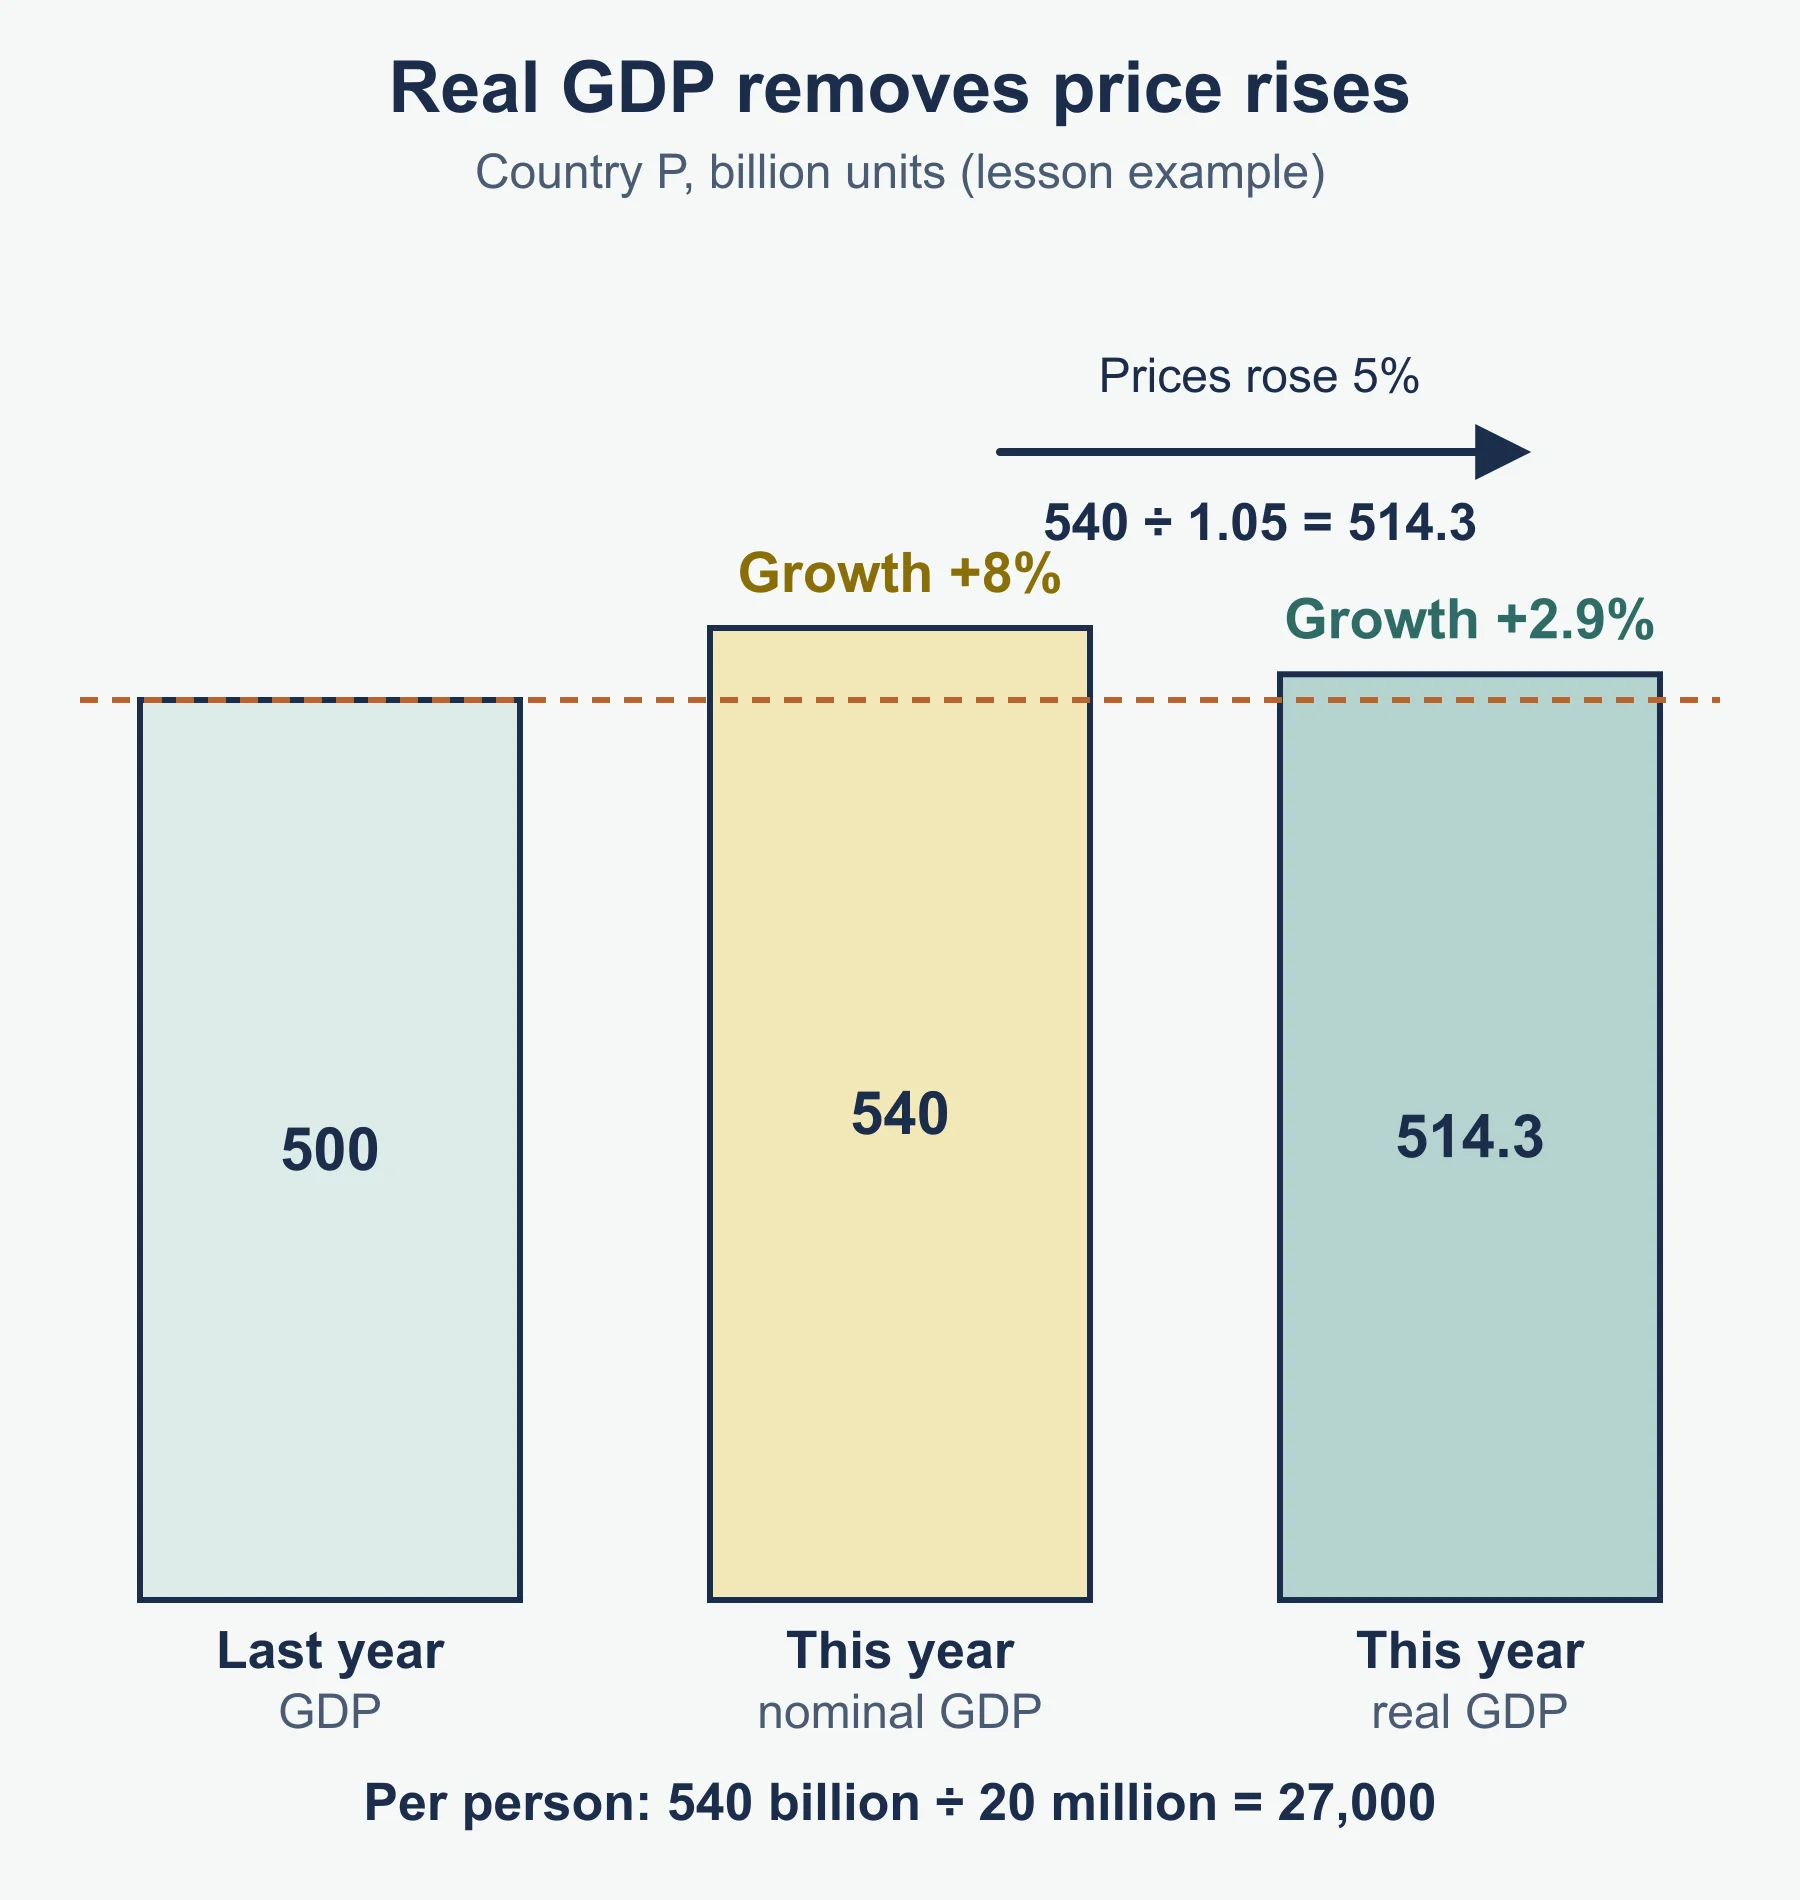
Worked example (illustrative). Country P’s nominal GDP rose from 500 to 540 (billion units) in a year when prices rose by 5%.
- Nominal growth = (540 − 500) ÷ 500 × 100 = 8%.
- Real growth is roughly nominal growth minus inflation: 8% − 5% = about 3%. More precisely, real GDP = 540 ÷ 1.05 = 514.3, so real growth = (514.3 − 500) ÷ 500 × 100 = 2.9%.
- If the population is 20 million, GDP per capita = 540 billion ÷ 20 million = 27,000 per person.
Real GDP is the better guide to growth because a rise in nominal GDP can come entirely from higher prices. GDP per capita is a better guide to living standards than total GDP because a large country can have a large GDP but a low output per person.
What causes economic growth?
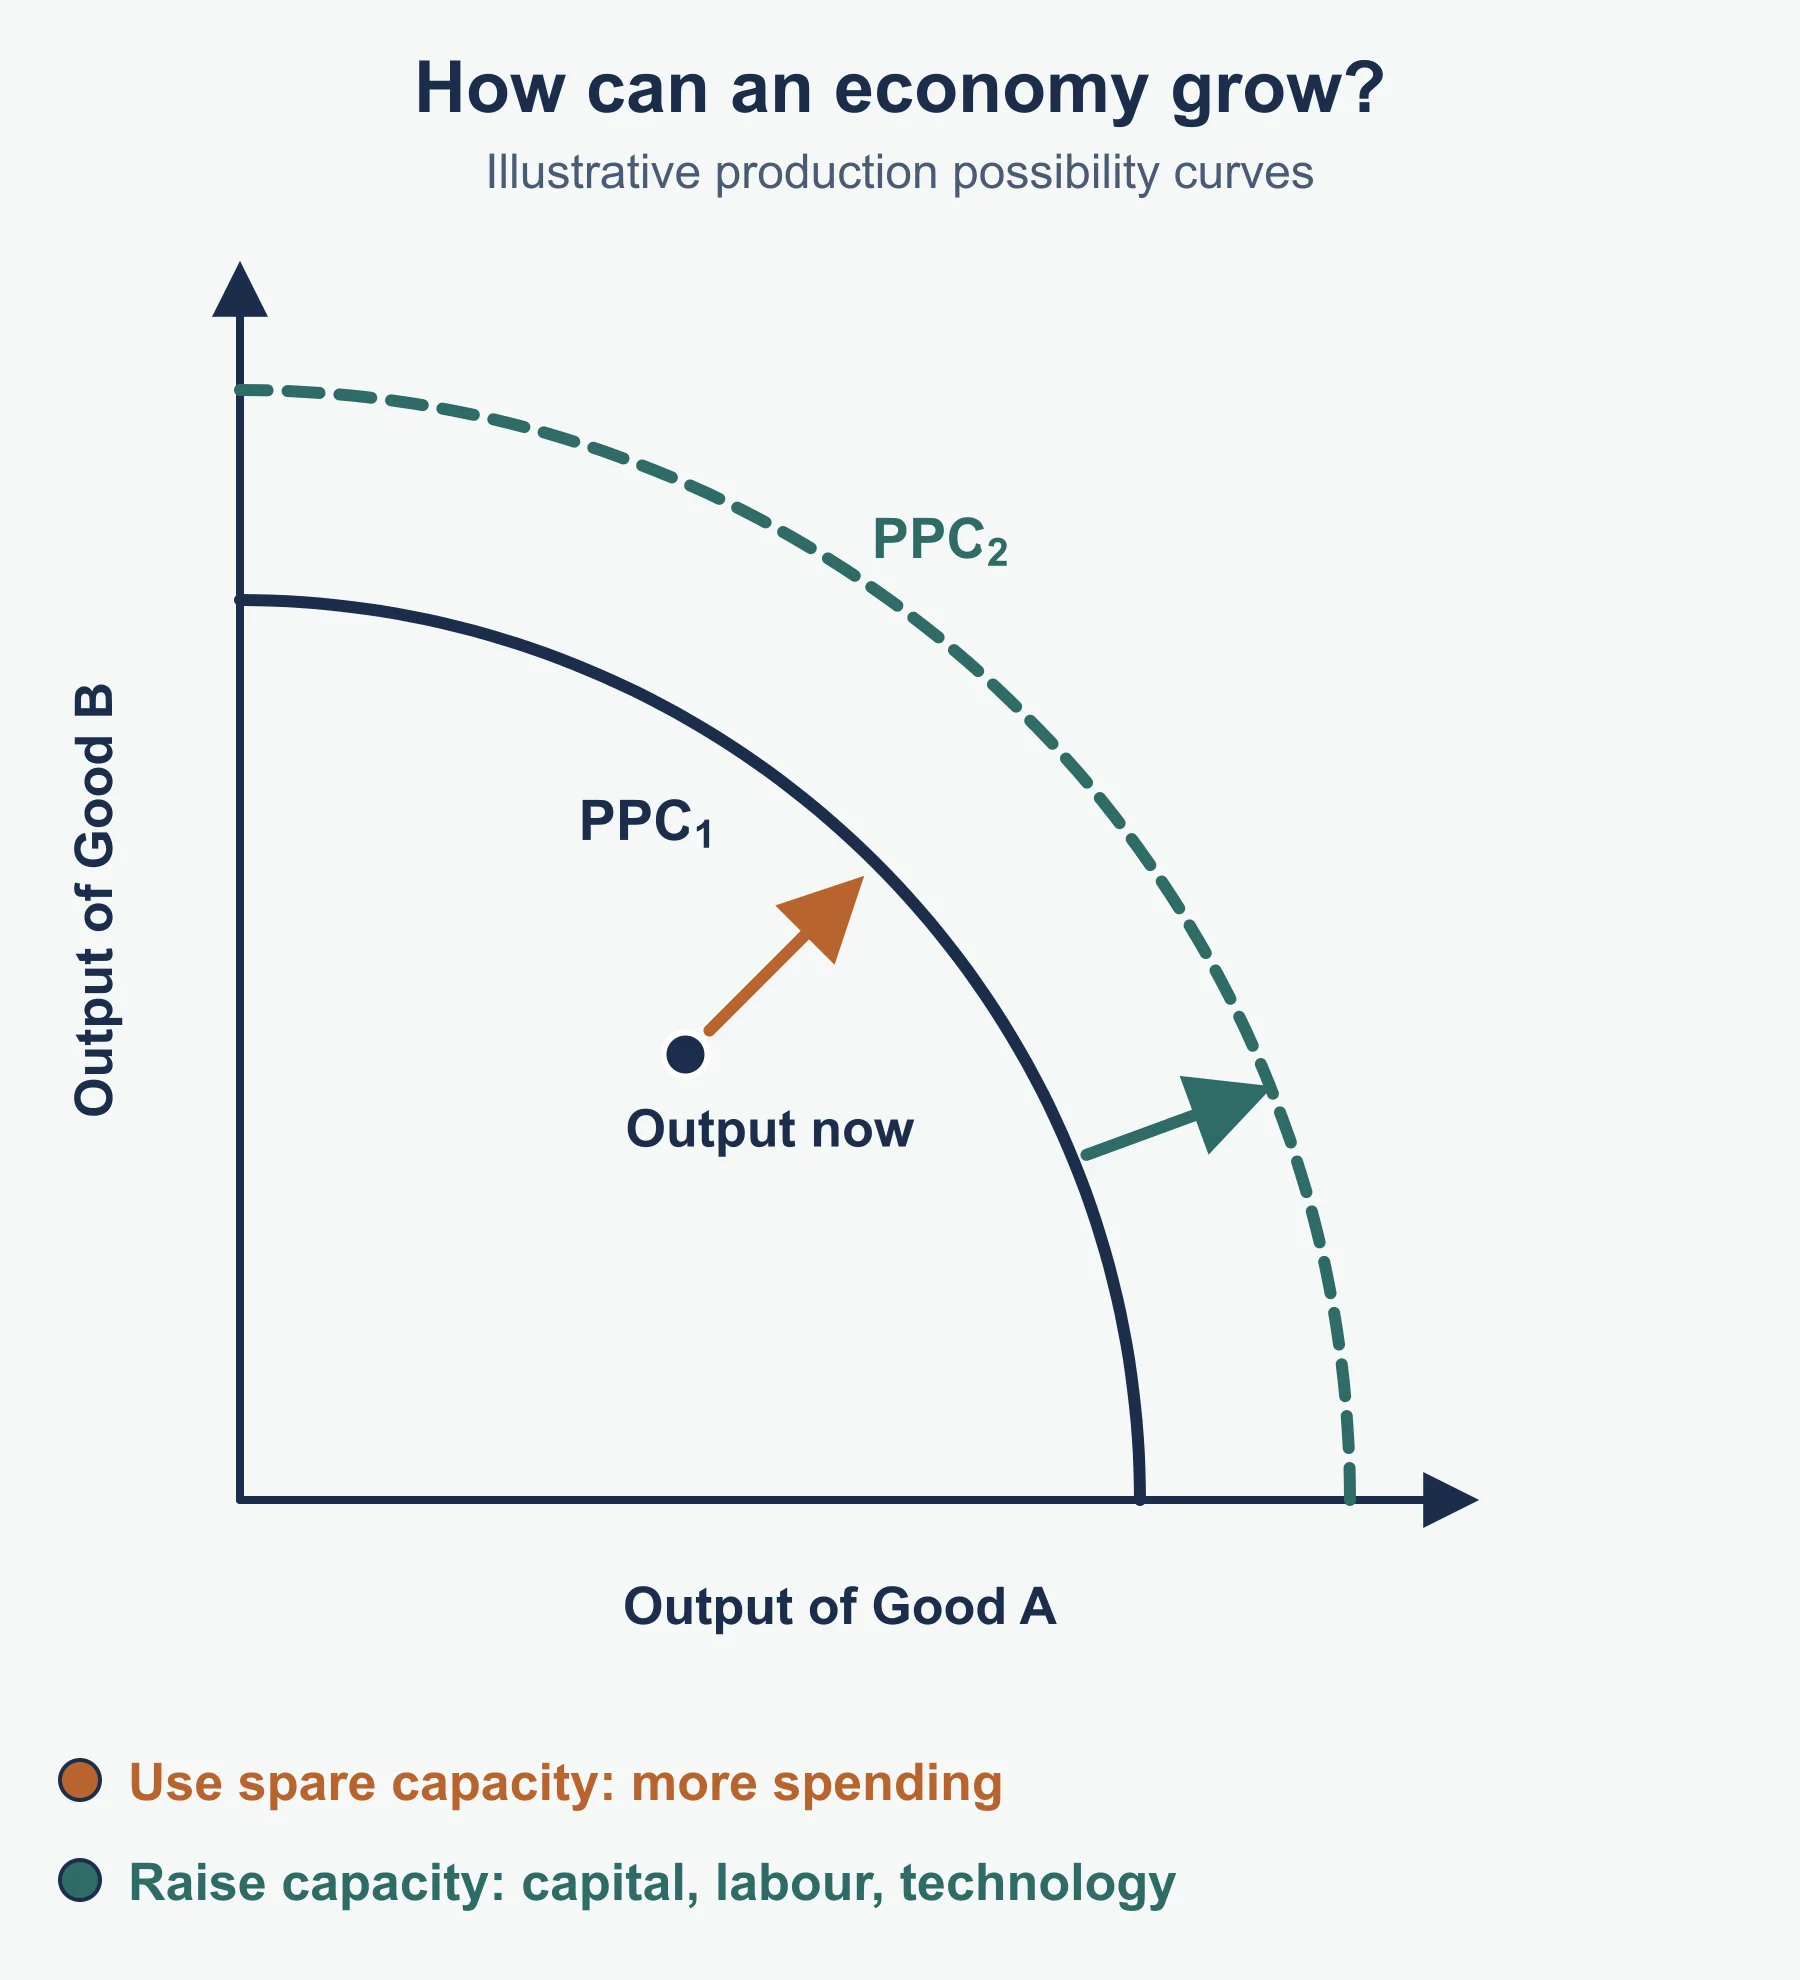
Growth happens when an economy can produce more (its productive capacity rises) or when it uses more of the capacity it already has. Common causes are:
- More or better capital — investment in machinery, technology and infrastructure.
- More or better labour — a larger workforce, or workers with more skills through education and training.
- New technology — producing more output from the same inputs.
- Higher spending — more consumer spending, investment, government spending or exports raises demand, so firms produce more.
What are the benefits and costs of growth?
| Benefits | Costs |
|---|---|
| Higher incomes and living standards | Pollution and use of finite resources |
| More jobs, so lower unemployment | Inflation if demand grows faster than output |
| More tax revenue for public services | Gains may be unequal, widening inequality |
| Firms earn more profit to reinvest | Congestion and pressure on housing |
A good answer weighs these. For example, growth that comes from new green technology may raise output with less pollution, so the cost depends on the type of growth.
How can the government promote growth?
- Lower interest rates (monetary policy) make borrowing cheaper, so consumers spend and firms invest more.
- Higher government spending or lower taxes (fiscal policy) raise demand.
- Supply-side policies such as education and training, or lower taxes on business profits, raise productive capacity so growth can last without causing inflation.
Each has a trade-off: demand-side policies can push up inflation, and supply-side policies take years to work.
How is unemployment measured?
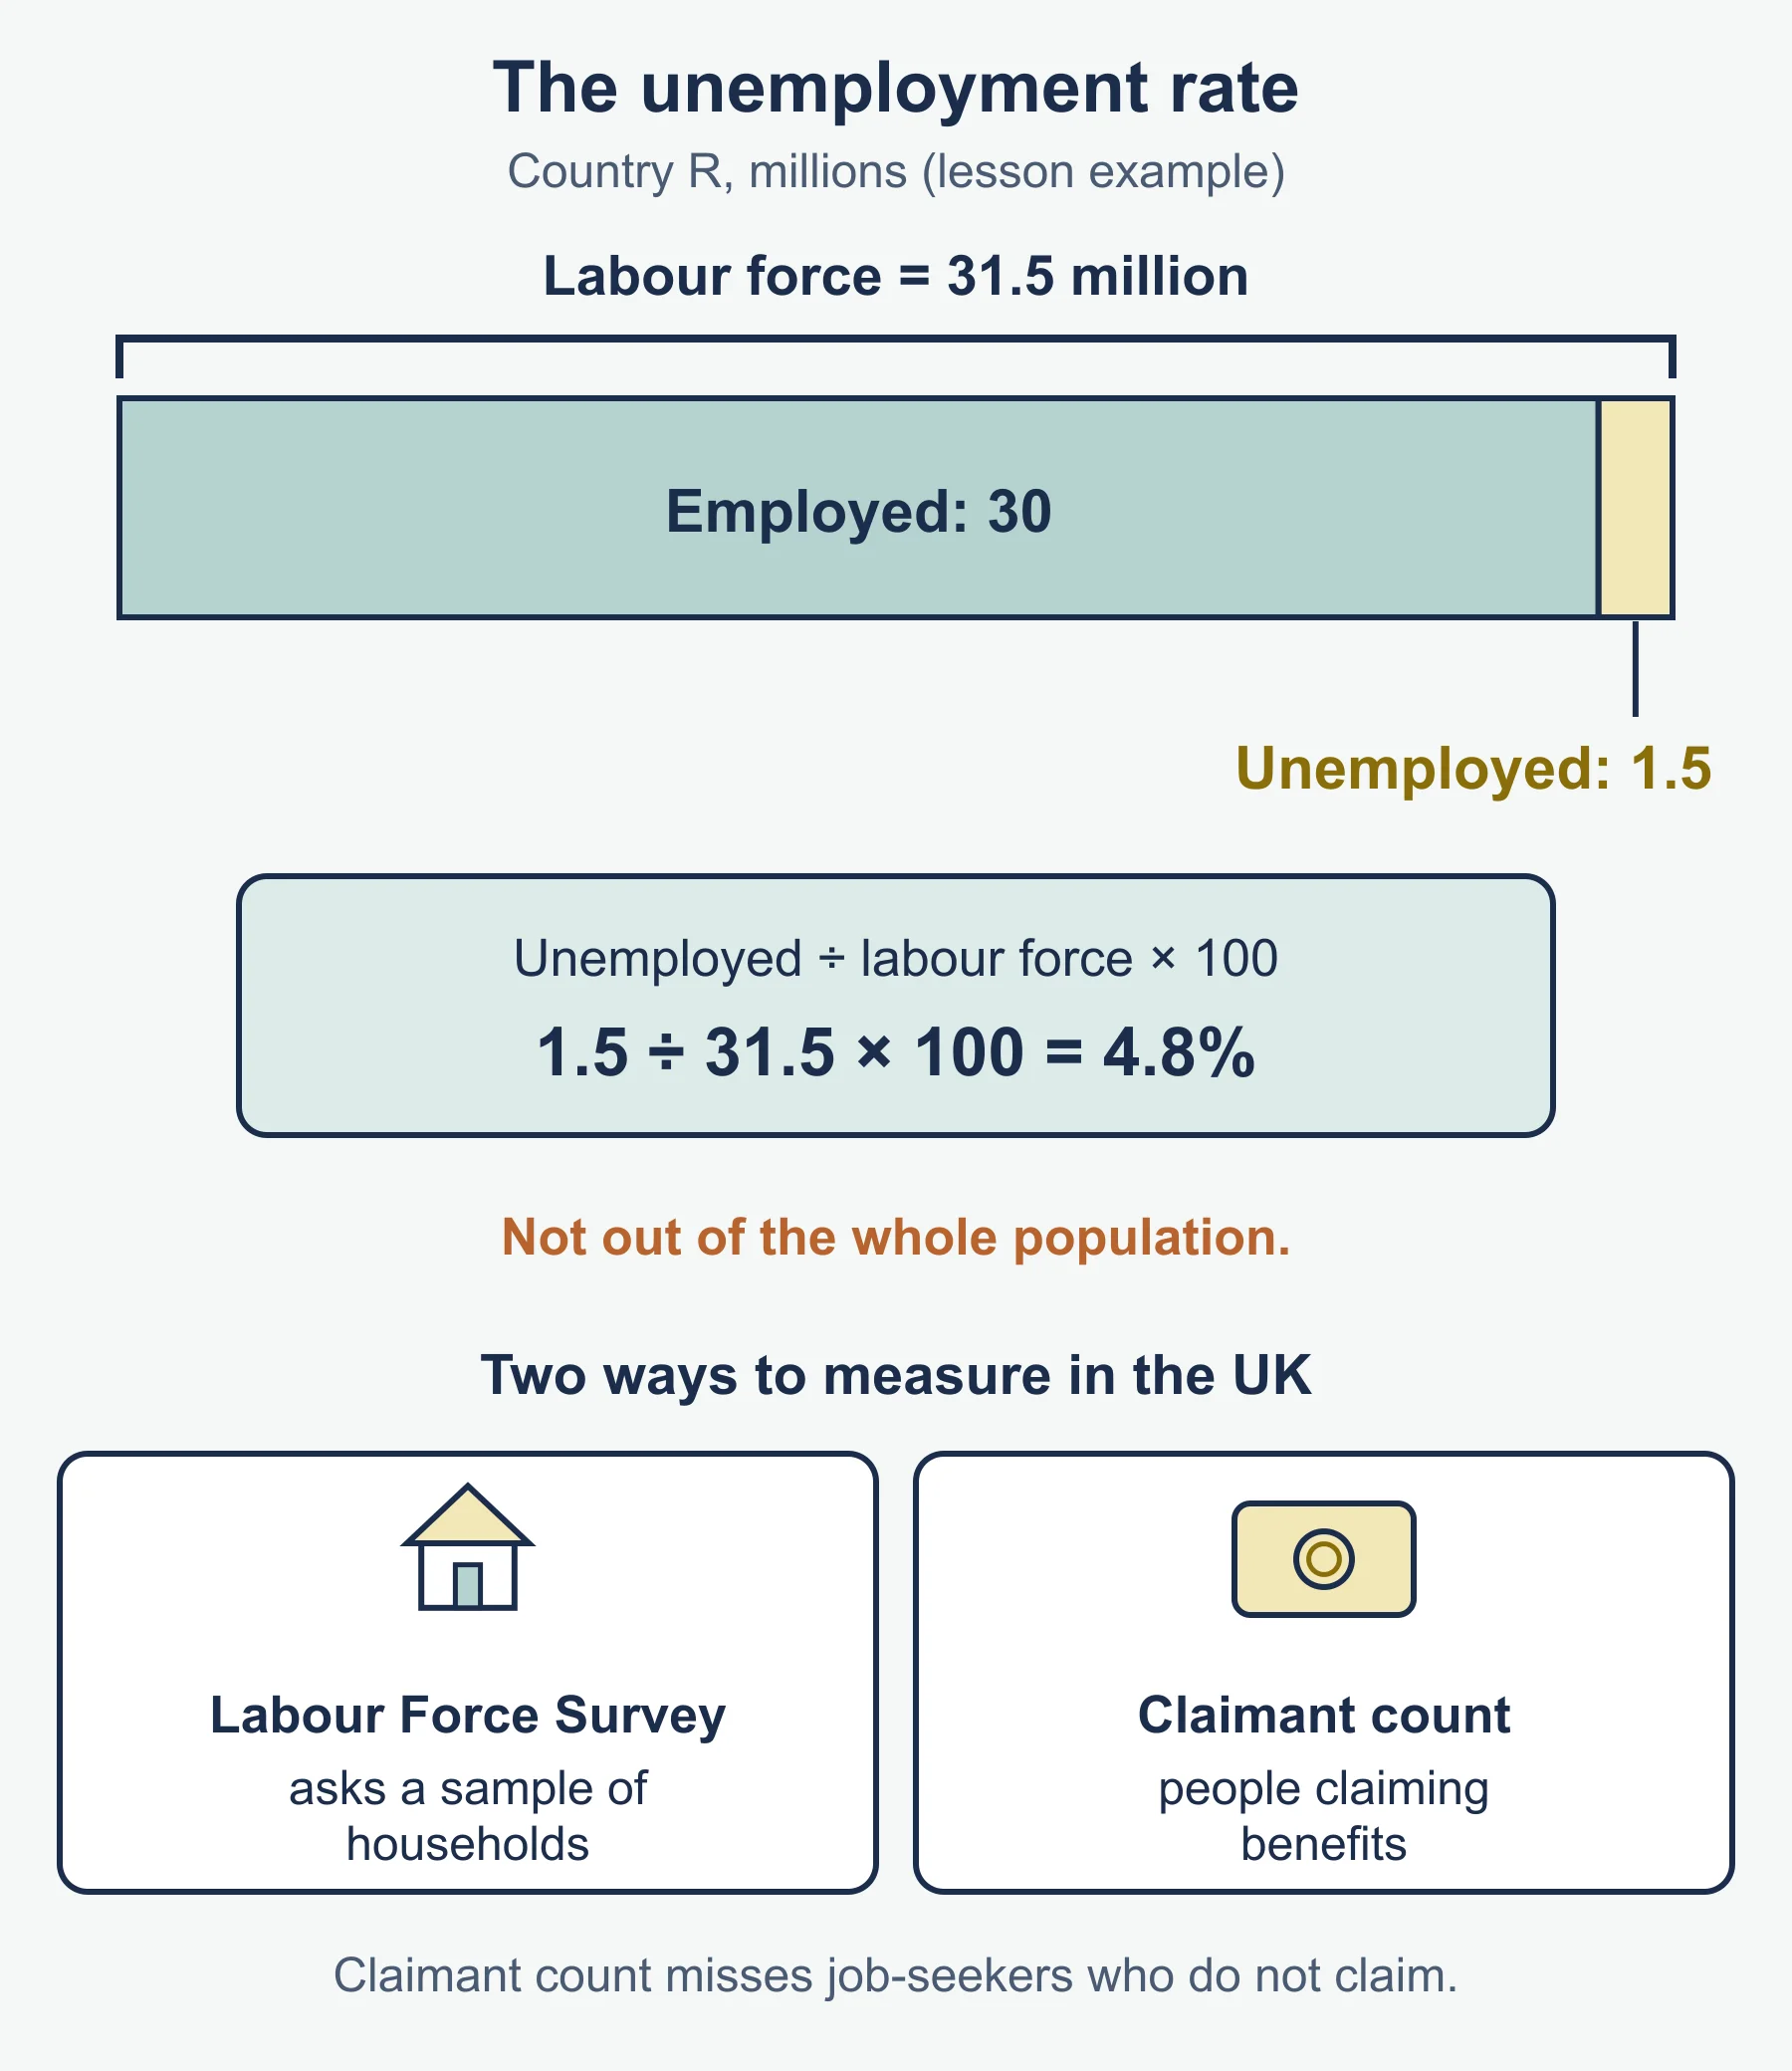
A person is unemployed if they are of working age, want a job, are available to start and are actively seeking work, but do not have a job. The unemployment rate is the number unemployed as a percentage of the labour force (the employed plus the unemployed).
Worked example (illustrative). Country R has 30 million employed and 1.5 million unemployed. Labour force = 31.5 million. Unemployment rate = 1.5 ÷ 31.5 × 100 = 4.8% (1 d.p.).
In the UK, unemployment is measured in two ways: the Labour Force Survey, which asks a sample of households whether people are looking for work, and the claimant count, which counts people claiming unemployment-related benefits. The claimant count misses people who are looking for work but cannot or do not claim benefits.
What are the four types of unemployment?
| Type | Cause | Example |
|---|---|---|
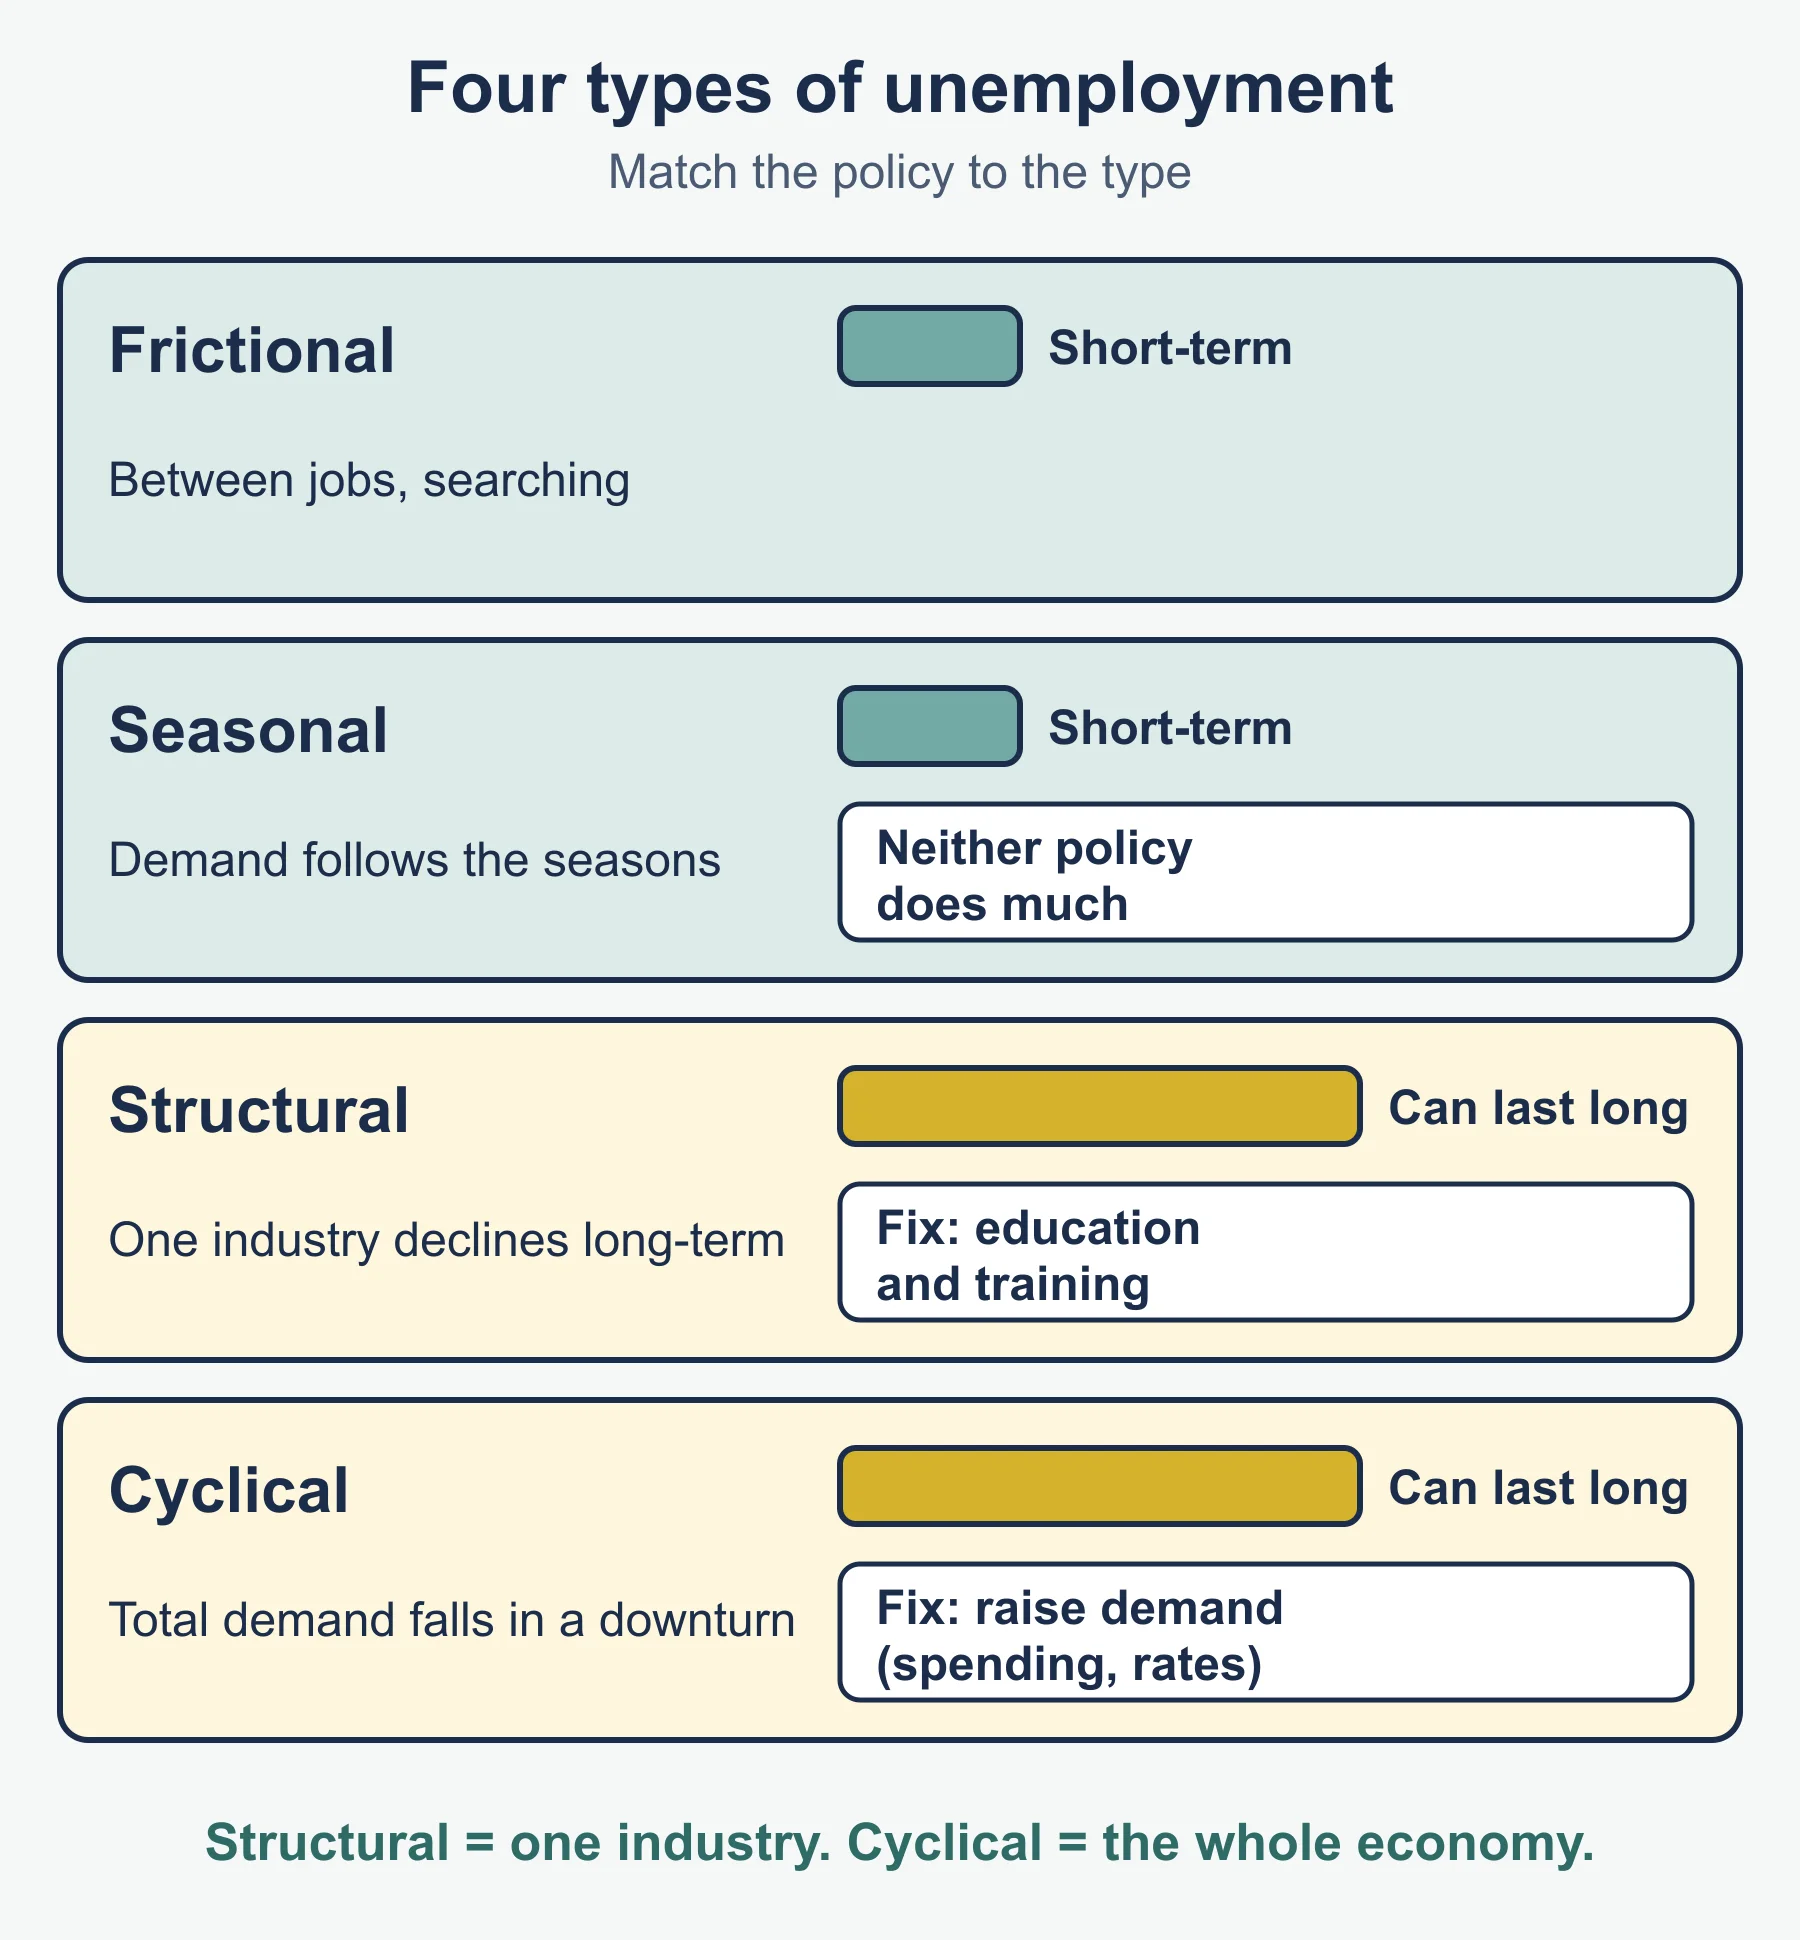
| Frictional | People are between jobs while they search for the right one | A graduate taking two months to find a first job |
| Seasonal | Demand for some jobs rises and falls with the seasons | Beach-resort staff laid off in winter |
| Structural | Long-term decline of an industry, so workers’ skills no longer match the jobs available | Coal miners after mines close |
| Cyclical | A fall in total demand during a downturn or recession | Factory workers laid off when sales fall across the economy |
Frictional and seasonal unemployment are usually short-term. Structural and cyclical unemployment are more serious because they can last for a long time.
What are the consequences of unemployment?
- For the unemployed: lower income, loss of skills and confidence, and poorer health.
- For firms: lower spending in the economy means fewer sales, although firms may find it easier to recruit.
- For the government: less income tax and VAT is collected while more is spent on benefits.
- For the economy: output is lost because resources are left idle, so the economy produces less than it could.
Which policies reduce unemployment?
| Policy | How it works | Limitation |
|---|---|---|
| Lower interest rates | Cheaper borrowing raises spending, so firms hire more | Can raise inflation; weak if confidence is low |
| Higher government spending | Creates jobs directly and raises demand | Increases borrowing |
| Lower taxes | Leaves people more to spend | Less tax revenue |
| Education and training | Gives workers the skills new industries need (tackles structural unemployment) | Slow to work and costly |
Match the policy to the type: training suits structural unemployment, while extra demand suits cyclical unemployment. Neither does much for seasonal unemployment.
Common errors
- Using nominal GDP to judge whether output has grown.
- Dividing by the population when the question asks for total GDP.
- Calculating the unemployment rate out of the whole population instead of the labour force.
- Confusing structural with cyclical unemployment: structural is about one industry’s decline, cyclical is about the whole economy.
- Listing benefits of growth without weighing any cost.
Frequently asked questions
Is real GDP growth the same as economic growth? In GCSE answers, yes: economic growth is measured as the percentage increase in real GDP, because real GDP removes the effect of price rises.
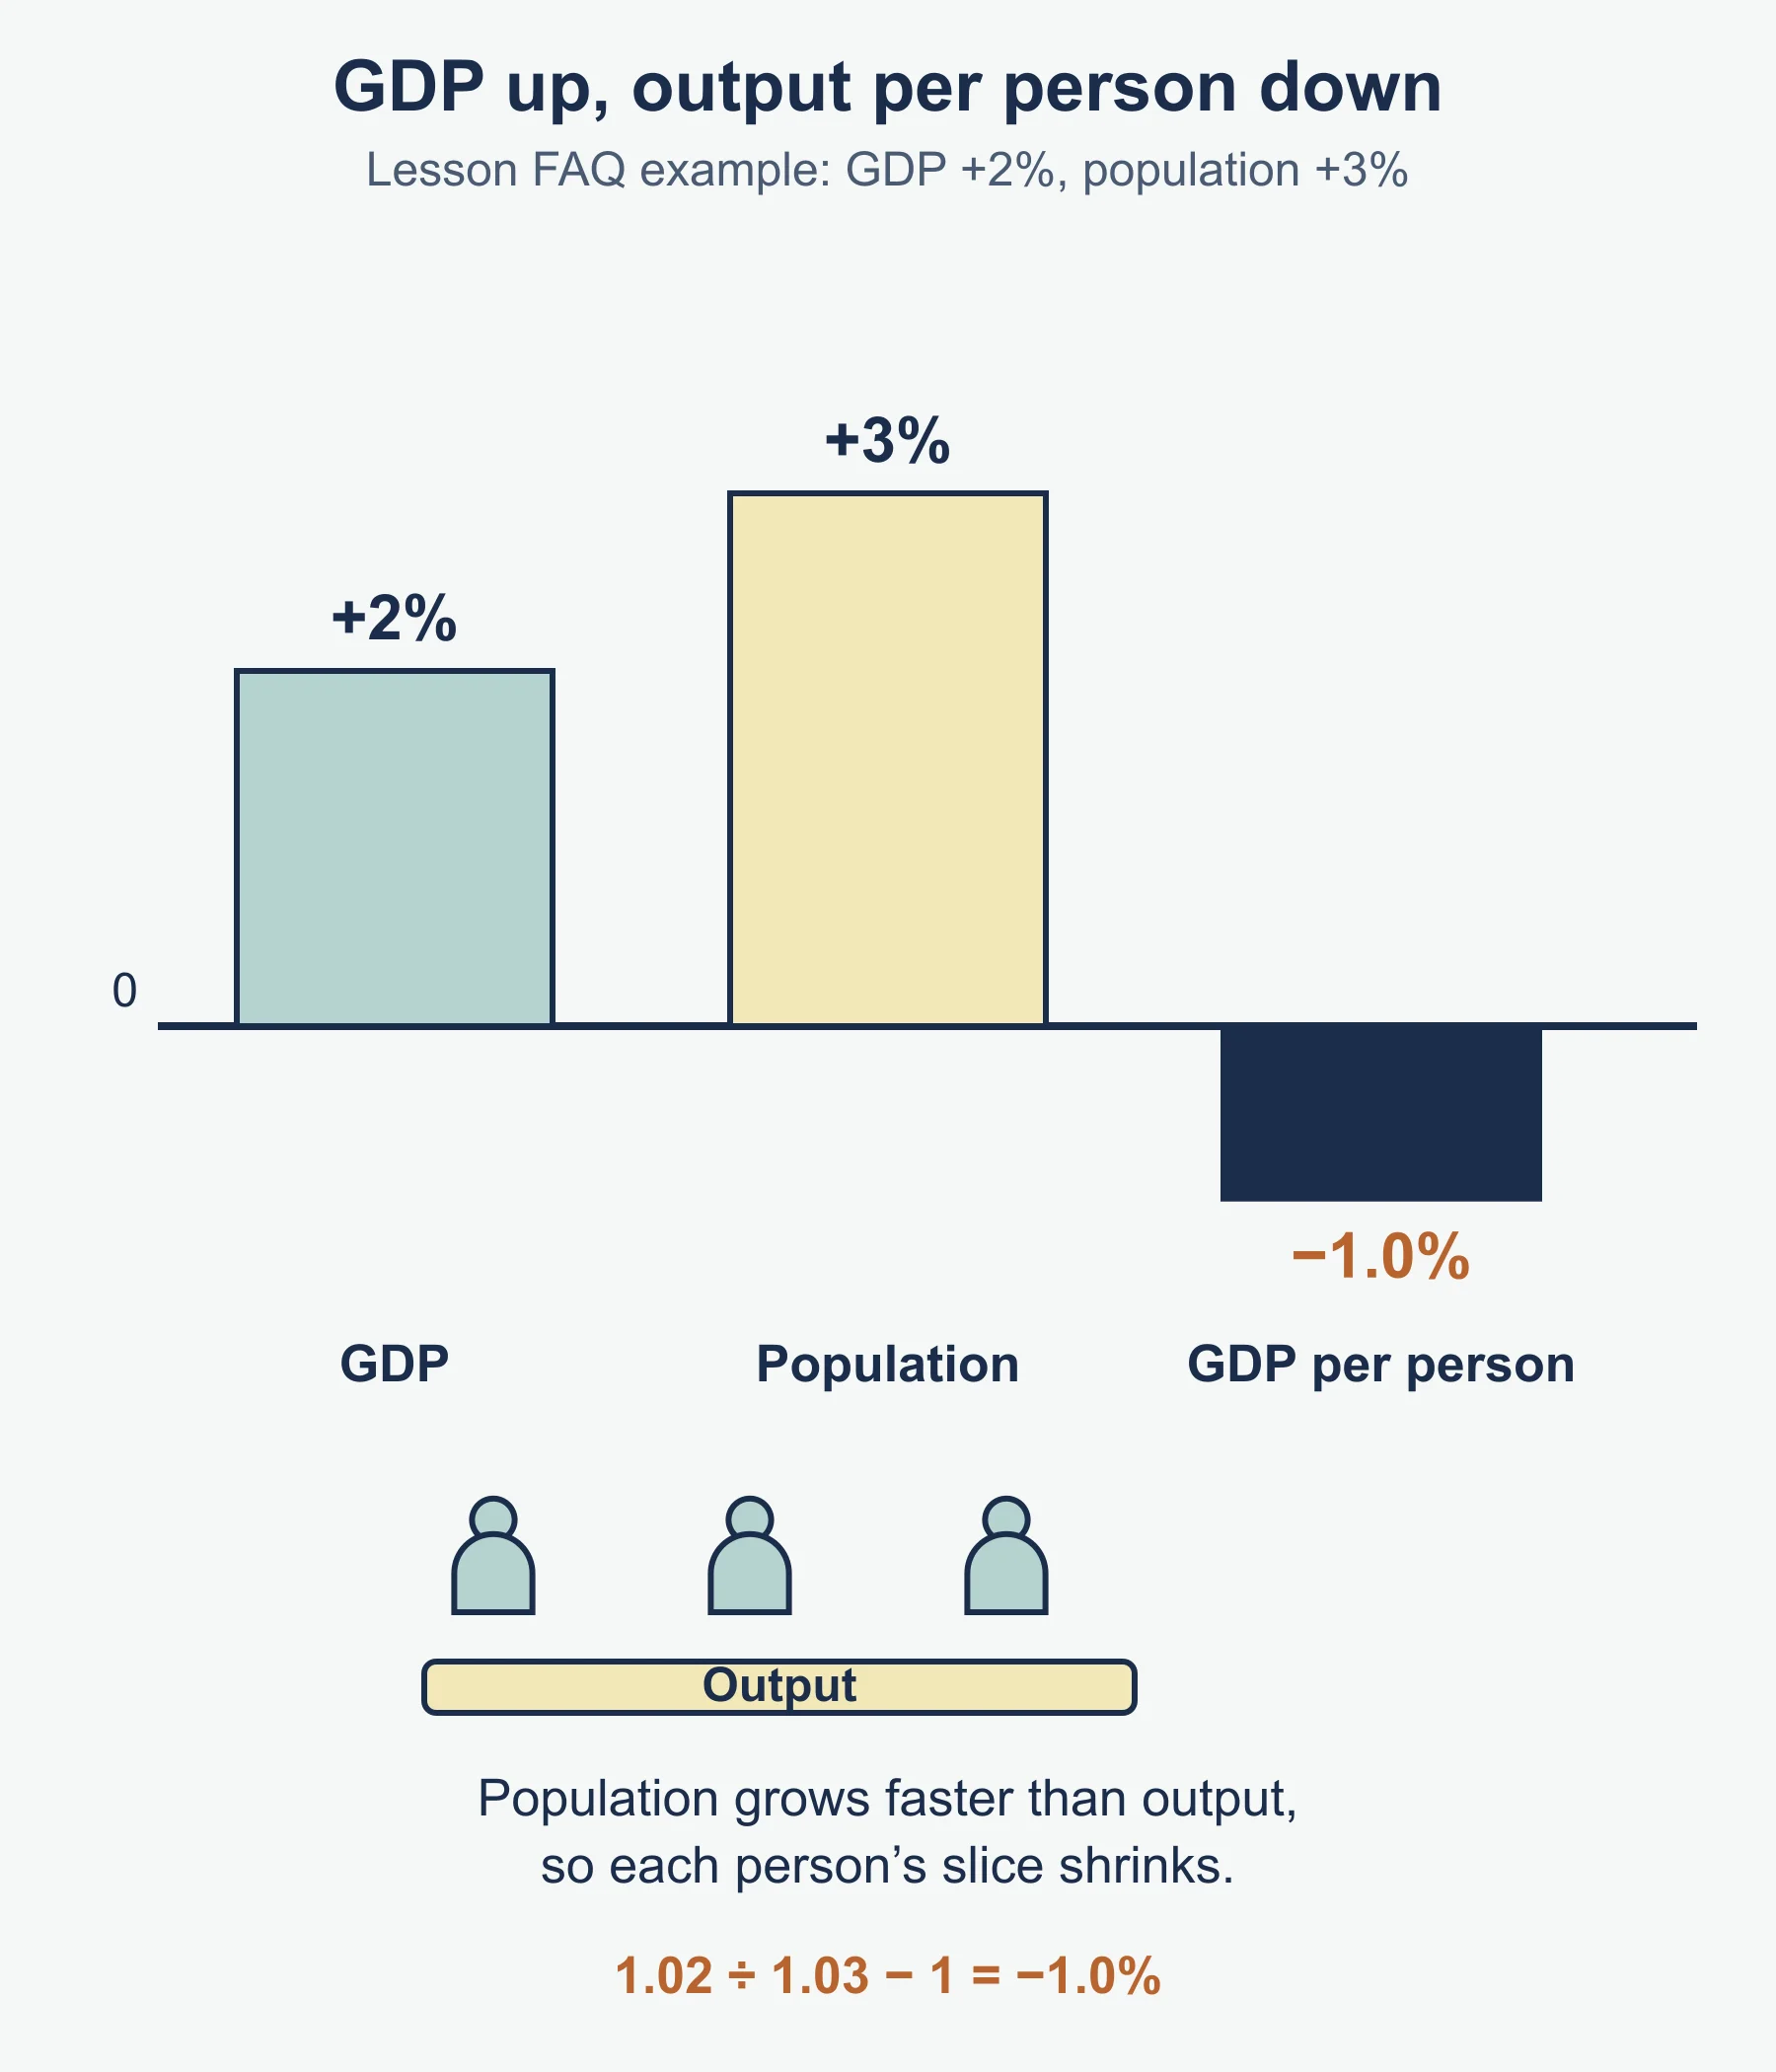
Why is GDP per capita a better measure of living standards? It shares output among the population. If GDP rises by 2% but the population rises by 3%, output per person has fallen.
Can unemployment ever be zero? No. Some frictional and seasonal unemployment always exists, which is why full employment does not mean zero unemployment.
Which type of unemployment rises in a recession? Cyclical unemployment, because total demand falls across the economy.
Official syllabus
AQA GCSE Economics (8136) specification, for first teaching from September 2017, published by AQA: sections 3.2.2.2 Economic growth and 3.2.2.3 Employment and unemployment.
Get free revision emails (optional)
Occasional emails with practice questions, worked explanations and links to free resources for the qualification and subjects you choose. No spam, and you can unsubscribe from any email. The free tools on this site never need an email.
Related resources
-
Practice questions
AQA GCSE Economics: Economic growth, employment and unemployment (8136) – Practice Questions
Twelve original practice questions with worked answers for AQA GCSE Economics 8136 sections 3.2.2.2 and 3.2.2.3: GDP calculations, growth and unemployment.
Economics · AQA · GCSE
Try questions -
Revision notes
AQA GCSE Economics: Economic growth, employment and unemployment (8136) – Revision Notes
Condensed AQA GCSE Economics revision notes for 3.2.2.2 and 3.2.2.3: growth, GDP, real GDP and GDP per capita, unemployment measures, types and policies.
Economics · AQA · GCSE
Revise topic -
Study guides
AQA GCSE Economics: Government objectives, conflicts and ethical considerations (8136)
Study guide to AQA GCSE Economics 3.2.2.1: the four main objectives, how they conflict, inequality, the environment and ethics, with worked examples.
Economics · AQA · GCSE
Read guide
Related articles
-
teaching
A Level tuition in Dubai: Cambridge or Pearson Edexcel International A Level?
Schools in Dubai and Abu Dhabi teach either Cambridge International AS & A Level or Pearson Edexcel International A Level. How the two are structured, why it matters for tuition, and how online classes from Lahore work.
9 October 2026
-
curriculum guides
Choosing subjects at IGCSE and A Level
How subject choices at 14 and 16 affect university options later, and how to keep pathways open without overloading a timetable.
28 July 2026
Studying this with a teacher
Working through Economics GCSE?
This page is free and stays free. If you would rather be taught it, Marlbridge runs Economics classes one-to-one and in small groups of up to 15, online in your own time zone. The first trial class is free. WhatsApp replies within an hour (8am–11pm Pakistan time, every day); email the same day.
AQA Economics teachers at Marlbridge
