
Study Guides
A Level Business: The nature of marketing and Market research (Cambridge 9609)
Full study guide to Cambridge A Level Business 9609 sections 3.1 and 3.2: demand and supply, markets, segmentation, CRM, sampling and market research data.
- Subject
- Business
- Level
- AS LEVEL
- Topic
- Marketing
- Author
- Marlbridge Academic Team
- Updated
- Reviewed by
- Salman Ahmad (what this means)
Aligned to Cambridge A Level Business (9609), For examination in 2026, 2027 and 2028. Official specification .
Syllabus page (what it covers and how it is assessed): Cambridge A Level Business.
Syllabus points this page covers
9609 (AS Level)
- 3.1 The nature of marketing
- 3.2 Market research
Found an error? Report a correction.
Need help with this topic? Request a free trial class for A Level Business (9609).
This guide covers sections 3.1 (The nature of marketing) and 3.2 (Market research) of the Cambridge International AS & A Level Business 9609 syllabus for examination in 2026, 2027 and 2028. Both sections are AS Level content, and the syllabus says A Level papers assume knowledge of the AS content. Every numbered point in the syllabus is covered below. The shortest treatments are 3.1.4 (product classification) and 3.2.3 (sampling), because each lists only one or two points.
Use it with the revision notes and the practice questions. The older topic-level pages are the Marketing overview, the overview revision notes and the overview practice set; those also cover the marketing mix (3.3), which this guide does not. Course hub: Cambridge A Level Business. Printable list: checklist. To find weak spots first, try the free diagnostics.
What the syllabus lists
| Section | Content you must be able to use |
|---|---|
| 3.1.1 | Marketing objectives; link to corporate objectives |
| 3.1.2 | Factors affecting demand and supply; demand, supply and price together |
| 3.1.3 | Consumer and industrial markets; local, national, international; product and customer (market) orientation; market share and growth; implications of changes |
| 3.1.4 | Classification of products; B2C and B2B marketing |
| 3.1.5 | Mass and niche markets; advantages and disadvantages |
| 3.1.6 | Geographic, demographic, psychographic segmentation; advantages and disadvantages |
| 3.1.7 | Aims, costs and benefits of CRM |
| 3.2.1 | Purposes: market features (size, growth, competitors); customer characteristics, profiles, wants, needs |
| 3.2.2 | Primary and secondary research; usefulness of each |
| 3.2.3 | Need for and limitations of sampling |
| 3.2.4 | Reliability; quantitative and qualitative data; tables, charts, graphs |
3.1.1 Marketing objectives and corporate objectives
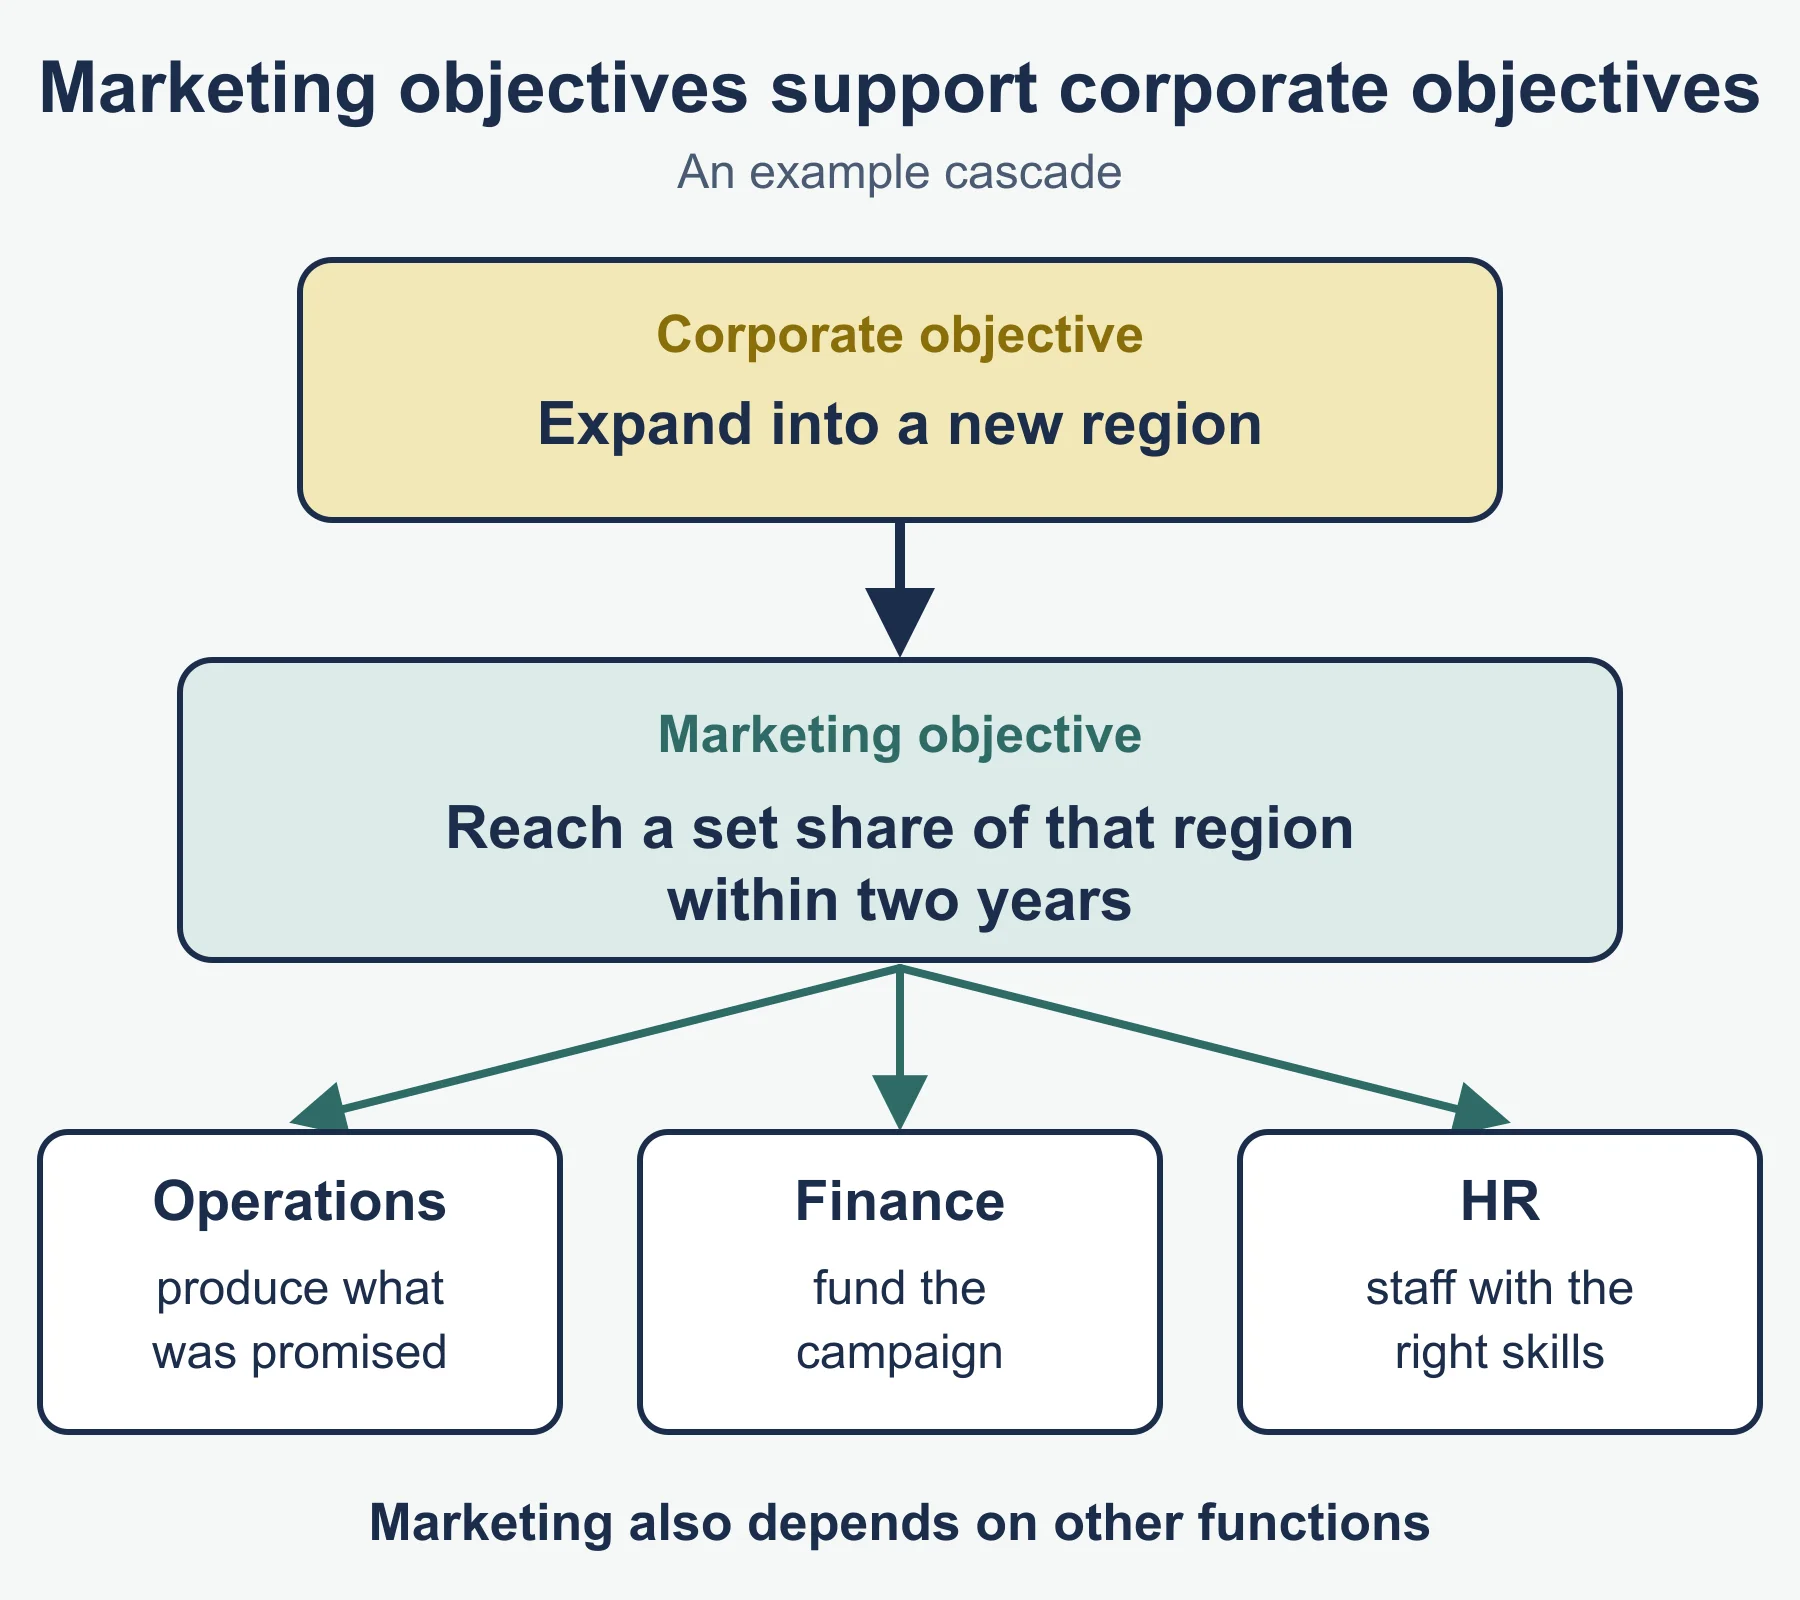
Marketing is the business activity that finds out what customers need and then provides for it. Marketing objectives are targets for the marketing function, for example to raise market share, enter a new segment or increase brand awareness. They must support the corporate objectives, which are the targets for the whole business, such as profit or growth. A corporate objective of expanding in a new region might give the marketing department an objective of reaching a set share of that region within two years. Marketing also depends on other functions: operations must produce what was promised, finance must fund the campaign, and human resources must supply staff with the right skills.
3.1.2 Demand and supply
Demand is the quantity customers are willing and able to buy at a given price. Factors influencing it include price, income, the price of substitutes and complements, tastes and fashion, advertising, and population. Supply is the quantity firms will offer at a given price. Factors include costs of production, technology, the number of producers, expected profit, and external events that disrupt output.
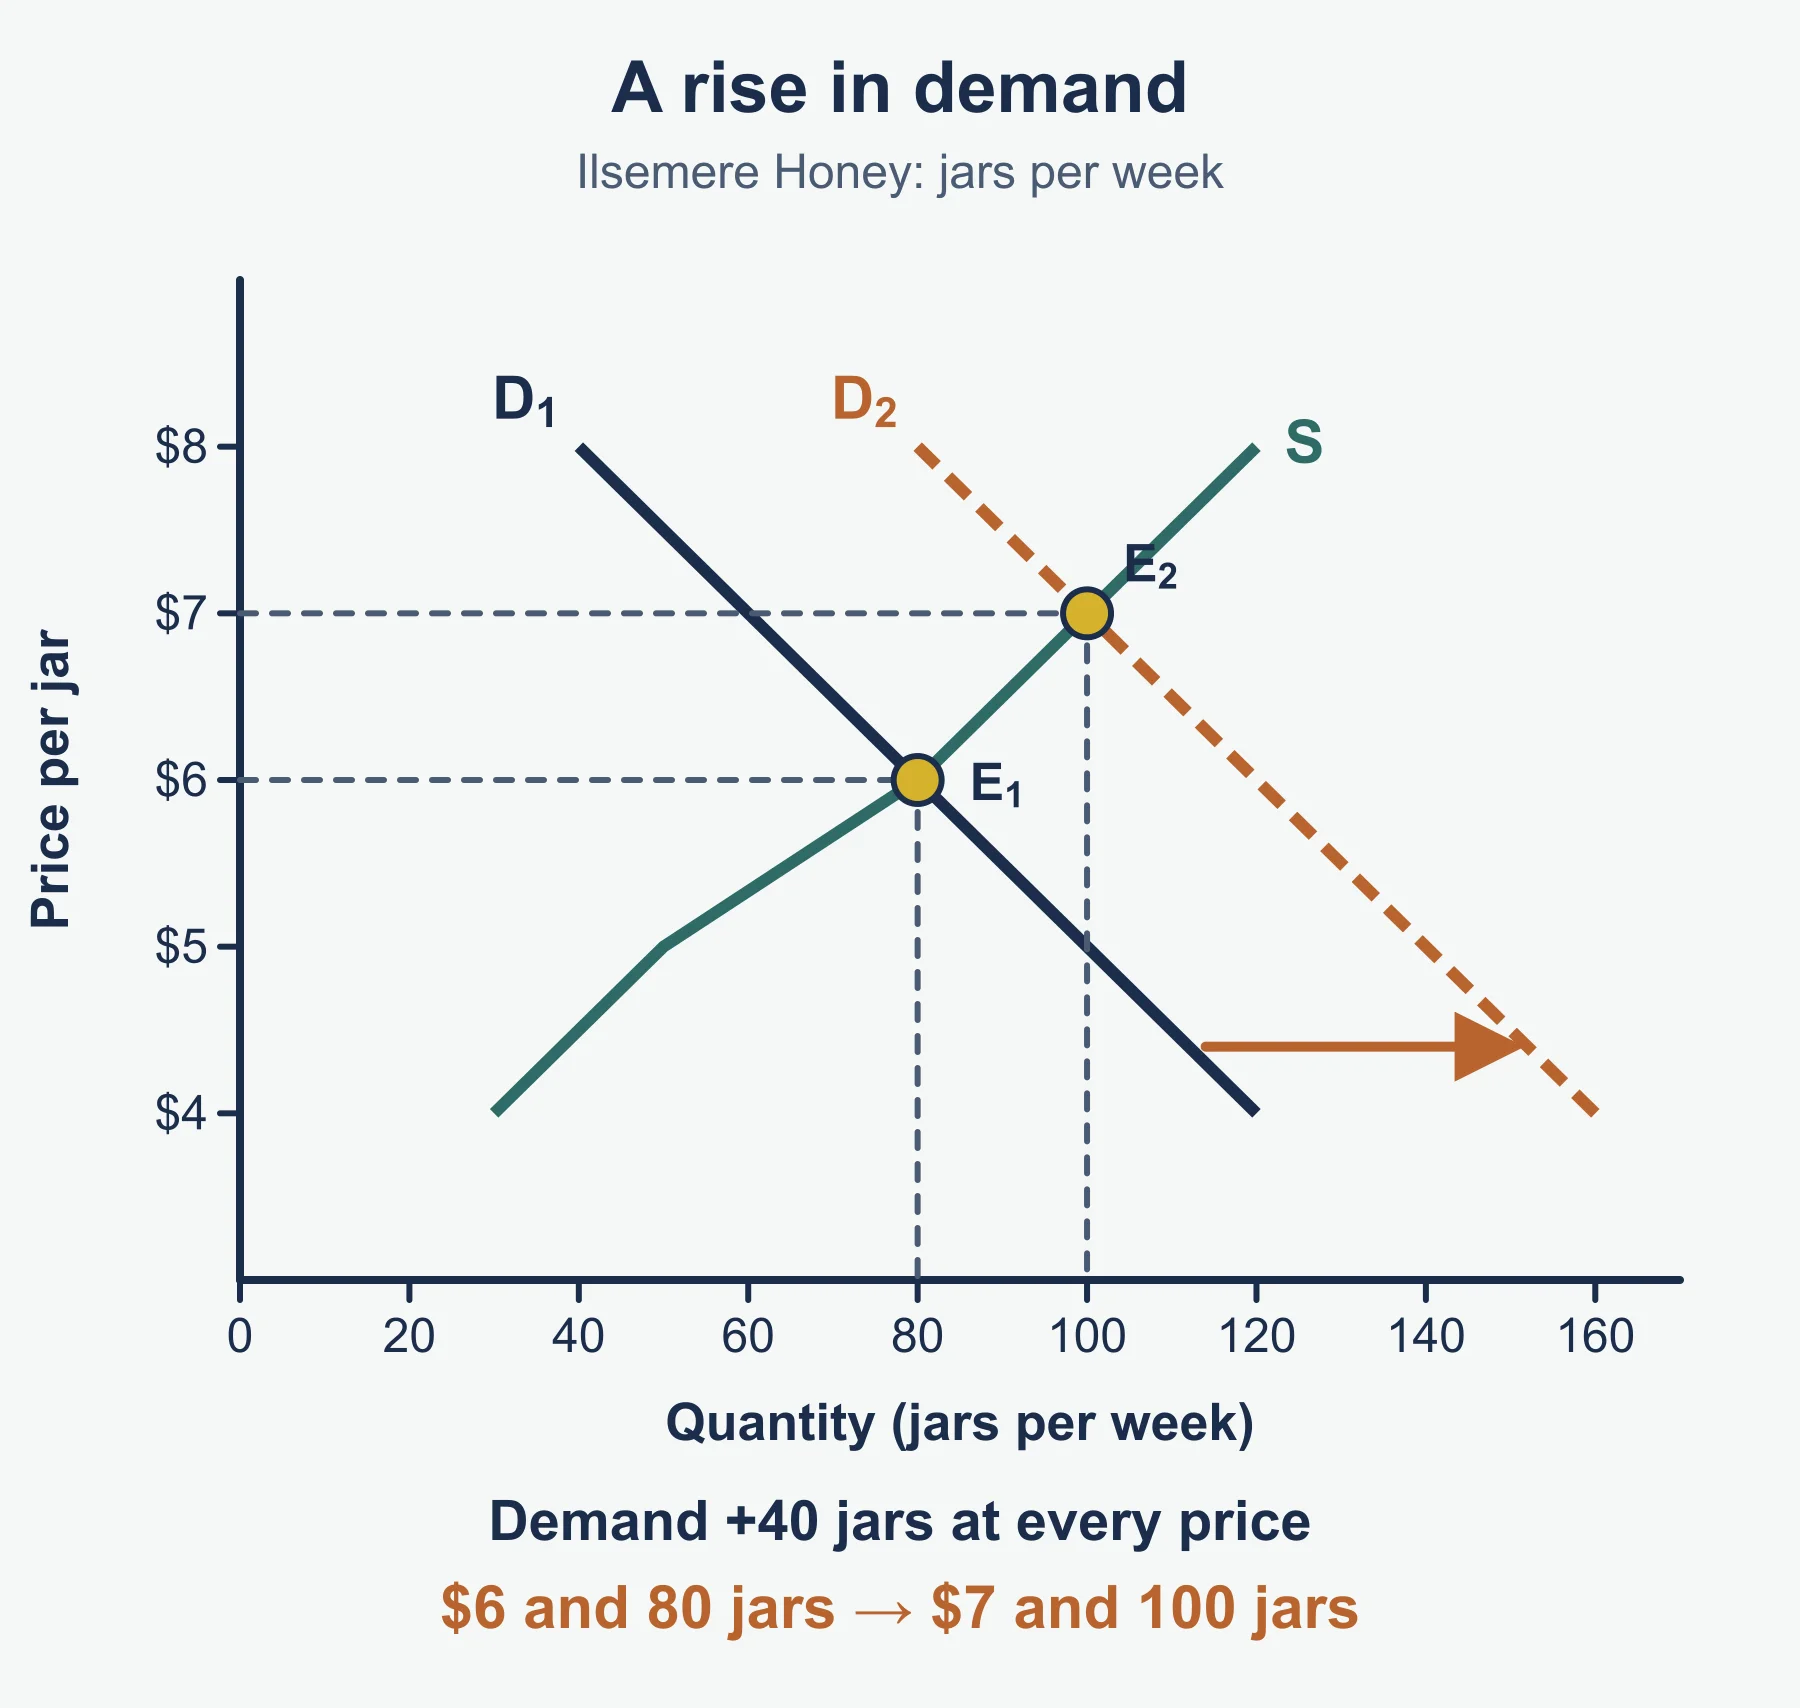
Worked example. Ilsemere Honey sells jars at weekend fairs. The table shows the weekly quantity demanded and supplied at each price.
| Price per jar ($) | 4 | 5 | 6 | 7 | 8 |
|---|---|---|---|---|---|
| Quantity demanded | 120 | 100 | 80 | 60 | 40 |
| Quantity supplied | 30 | 50 | 80 | 100 | 120 |
Demand equals supply at a price of 6, so the equilibrium quantity is 80 jars. At 4, demand exceeds supply by 90 jars (120 - 30), so shortages push the price up. At 8, supply exceeds demand by 80 jars (120 - 40), so surpluses push the price down.
Now suppose a local food programme raises demand by 40 jars at every price. Demand becomes 160, 140, 120, 100 and 80. At the old price of 6, demand (120) exceeds supply (80) by 40. At 7, demand and supply are both 100. The new equilibrium is a price of 7 and 100 jars: a rise in demand raises both price and quantity. A fall in supply (for example, a poor flower season) shifts the supply column down and raises price while cutting quantity. State the direction of each change, then explain it.
3.1.3 Markets
Markets differ in several ways. Consumer markets sell to final users; industrial markets sell to other organisations that use the product to make something else or to run their operations. Markets can be local, national or international, and the scale changes the competitors, the transport and legal issues, and the likely customer tastes.
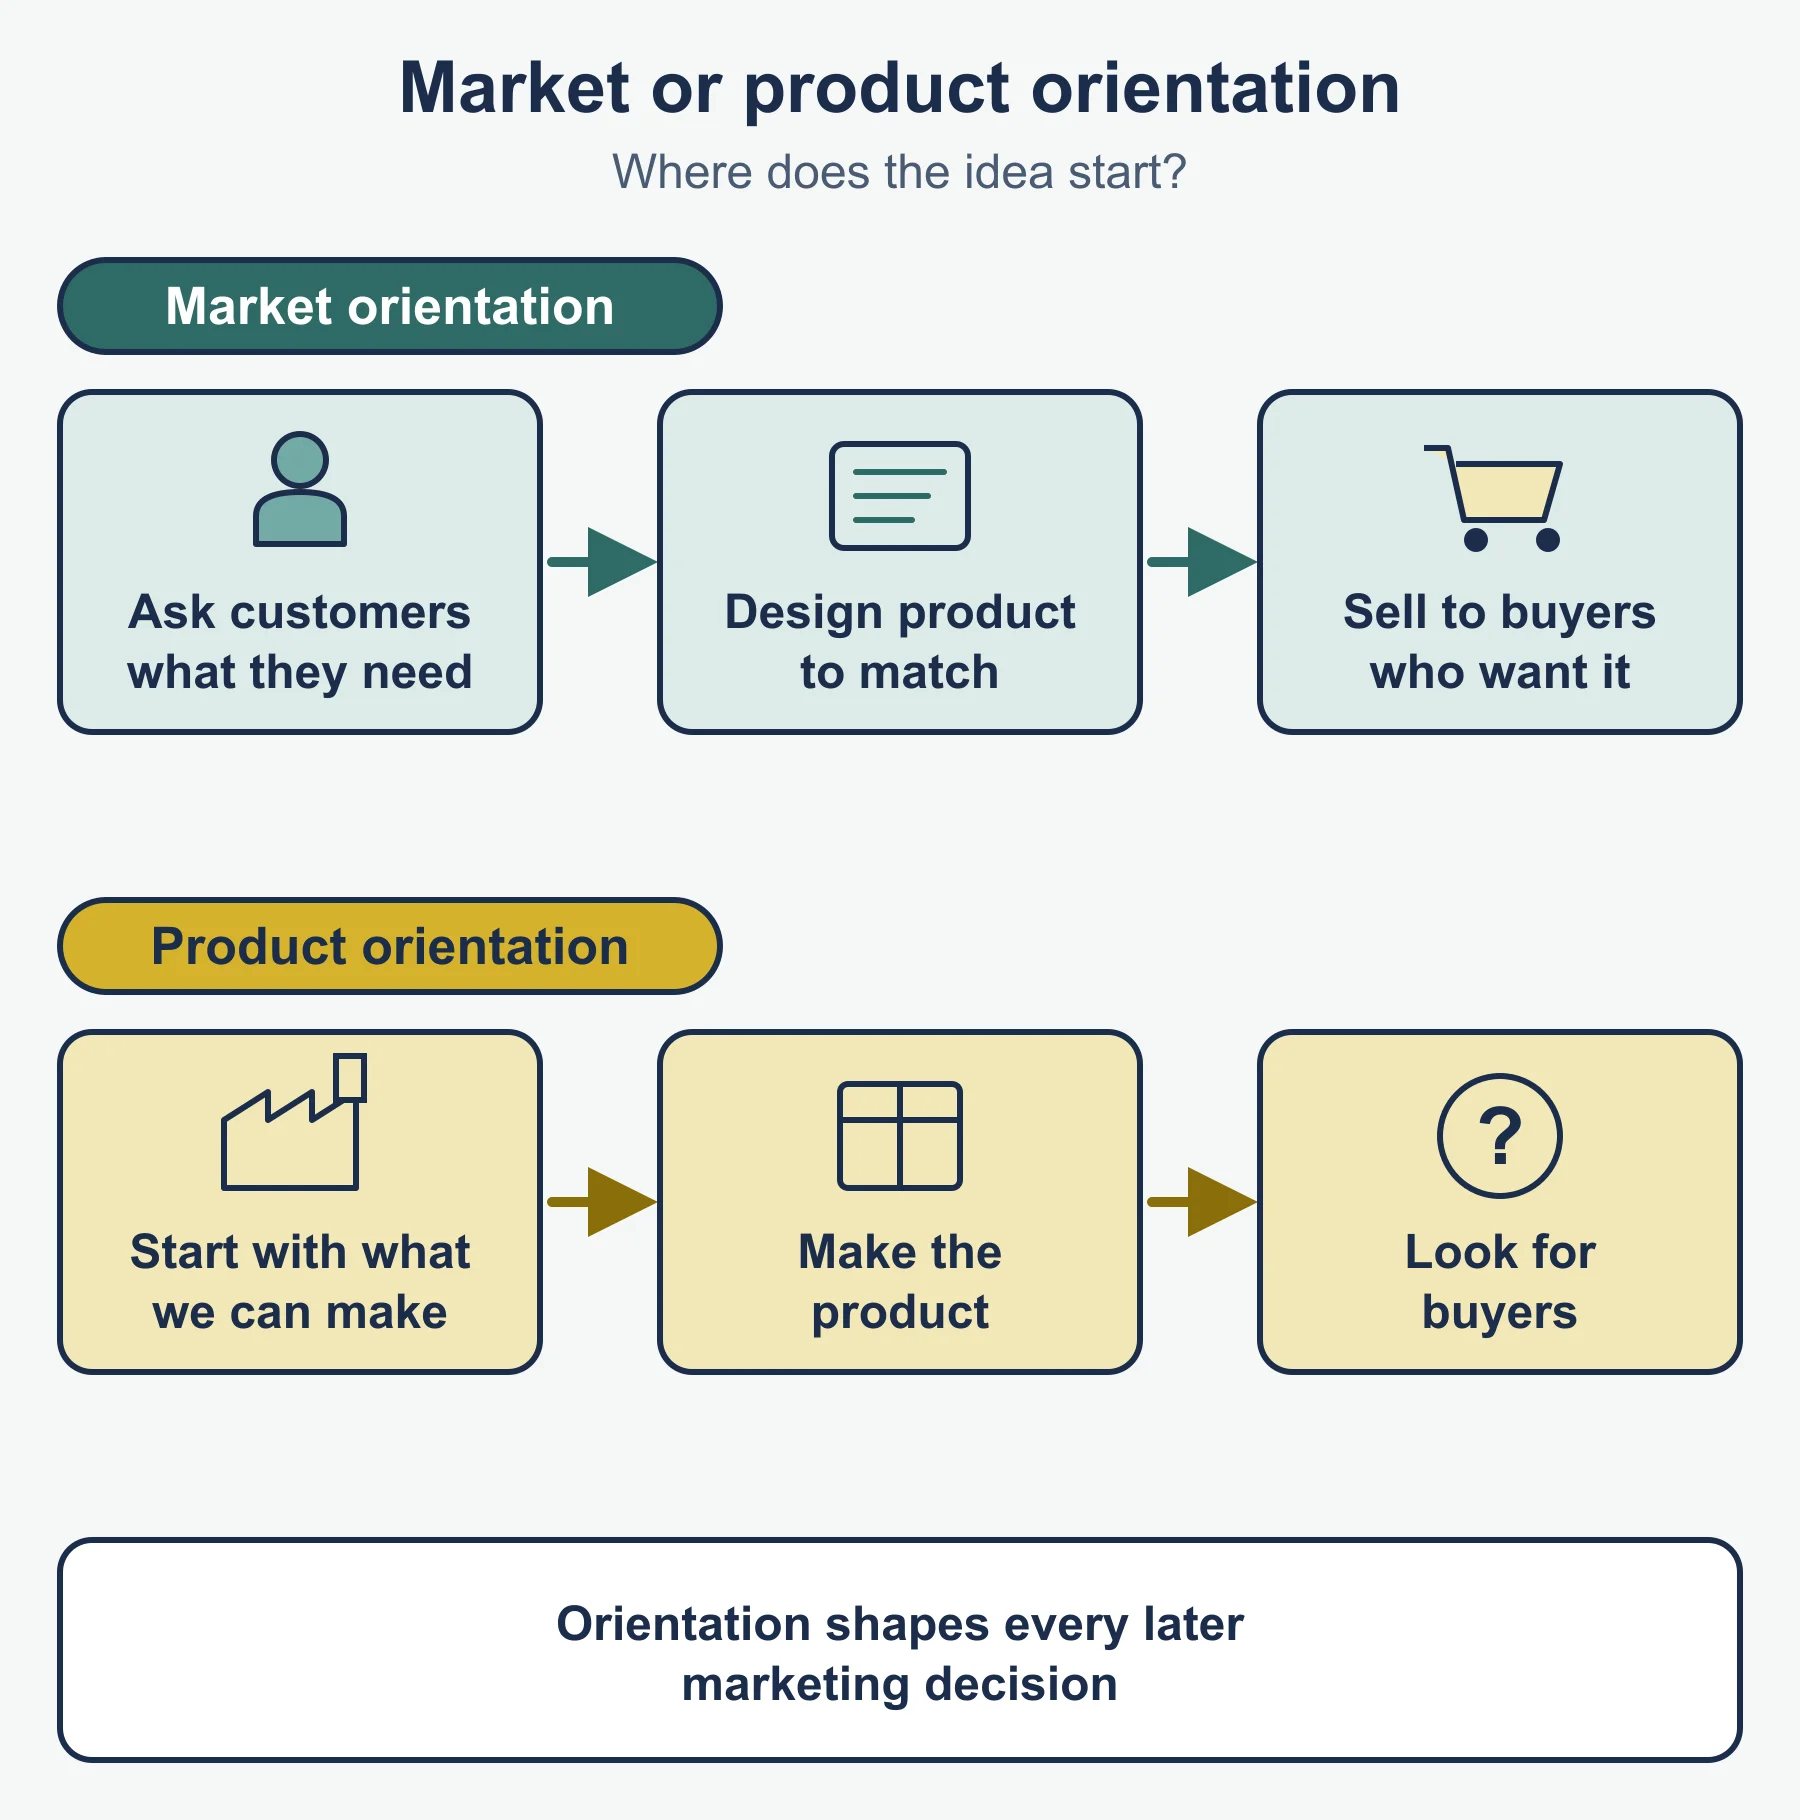
Product orientation starts from what the business is able to make and then looks for buyers. Customer (market) orientation starts from what customers want and designs the product to fit. Market orientation usually reduces the risk of unsold goods but needs spending on research; product orientation can work where a product is technically new and customers cannot yet say what they want.
The syllabus lists measurement of market share and market growth. The syllabus does not print formulas here, so these are the standard forms:
- Market share (%) = (firm’s sales / total market sales) x 100
- Market growth (%) = ((market sales this year - market sales last year) / market sales last year) x 100
Worked example. Vantley Roasters sells 5.2 (in $ million) in a market worth 40.0 in 2024. In 2025 it sells 5.5 in a market worth 44.0.
- 2024 share: 5.2 / 40.0 x 100 = 13.0%
- 2025 share: 5.5 / 44.0 x 100 = 12.5%
- Market growth: (44.0 - 40.0) / 40.0 x 100 = 10.0%
- Vantley’s own sales growth: (5.5 - 5.2) / 5.2 x 100 = 5.8% (to 1 d.p.)
Implications. Vantley’s sales rose, yet its share fell by half a percentage point because the market grew faster than the firm. A falling share in a growing market suggests competitors are winning the new customers, so the firm may need to review its product, price or promotion. A rising share in a falling market may show strength, but the firm may still be shrinking in absolute terms. Always compare the firm’s growth with the market’s growth.

3.1.4 Consumer and industrial marketing
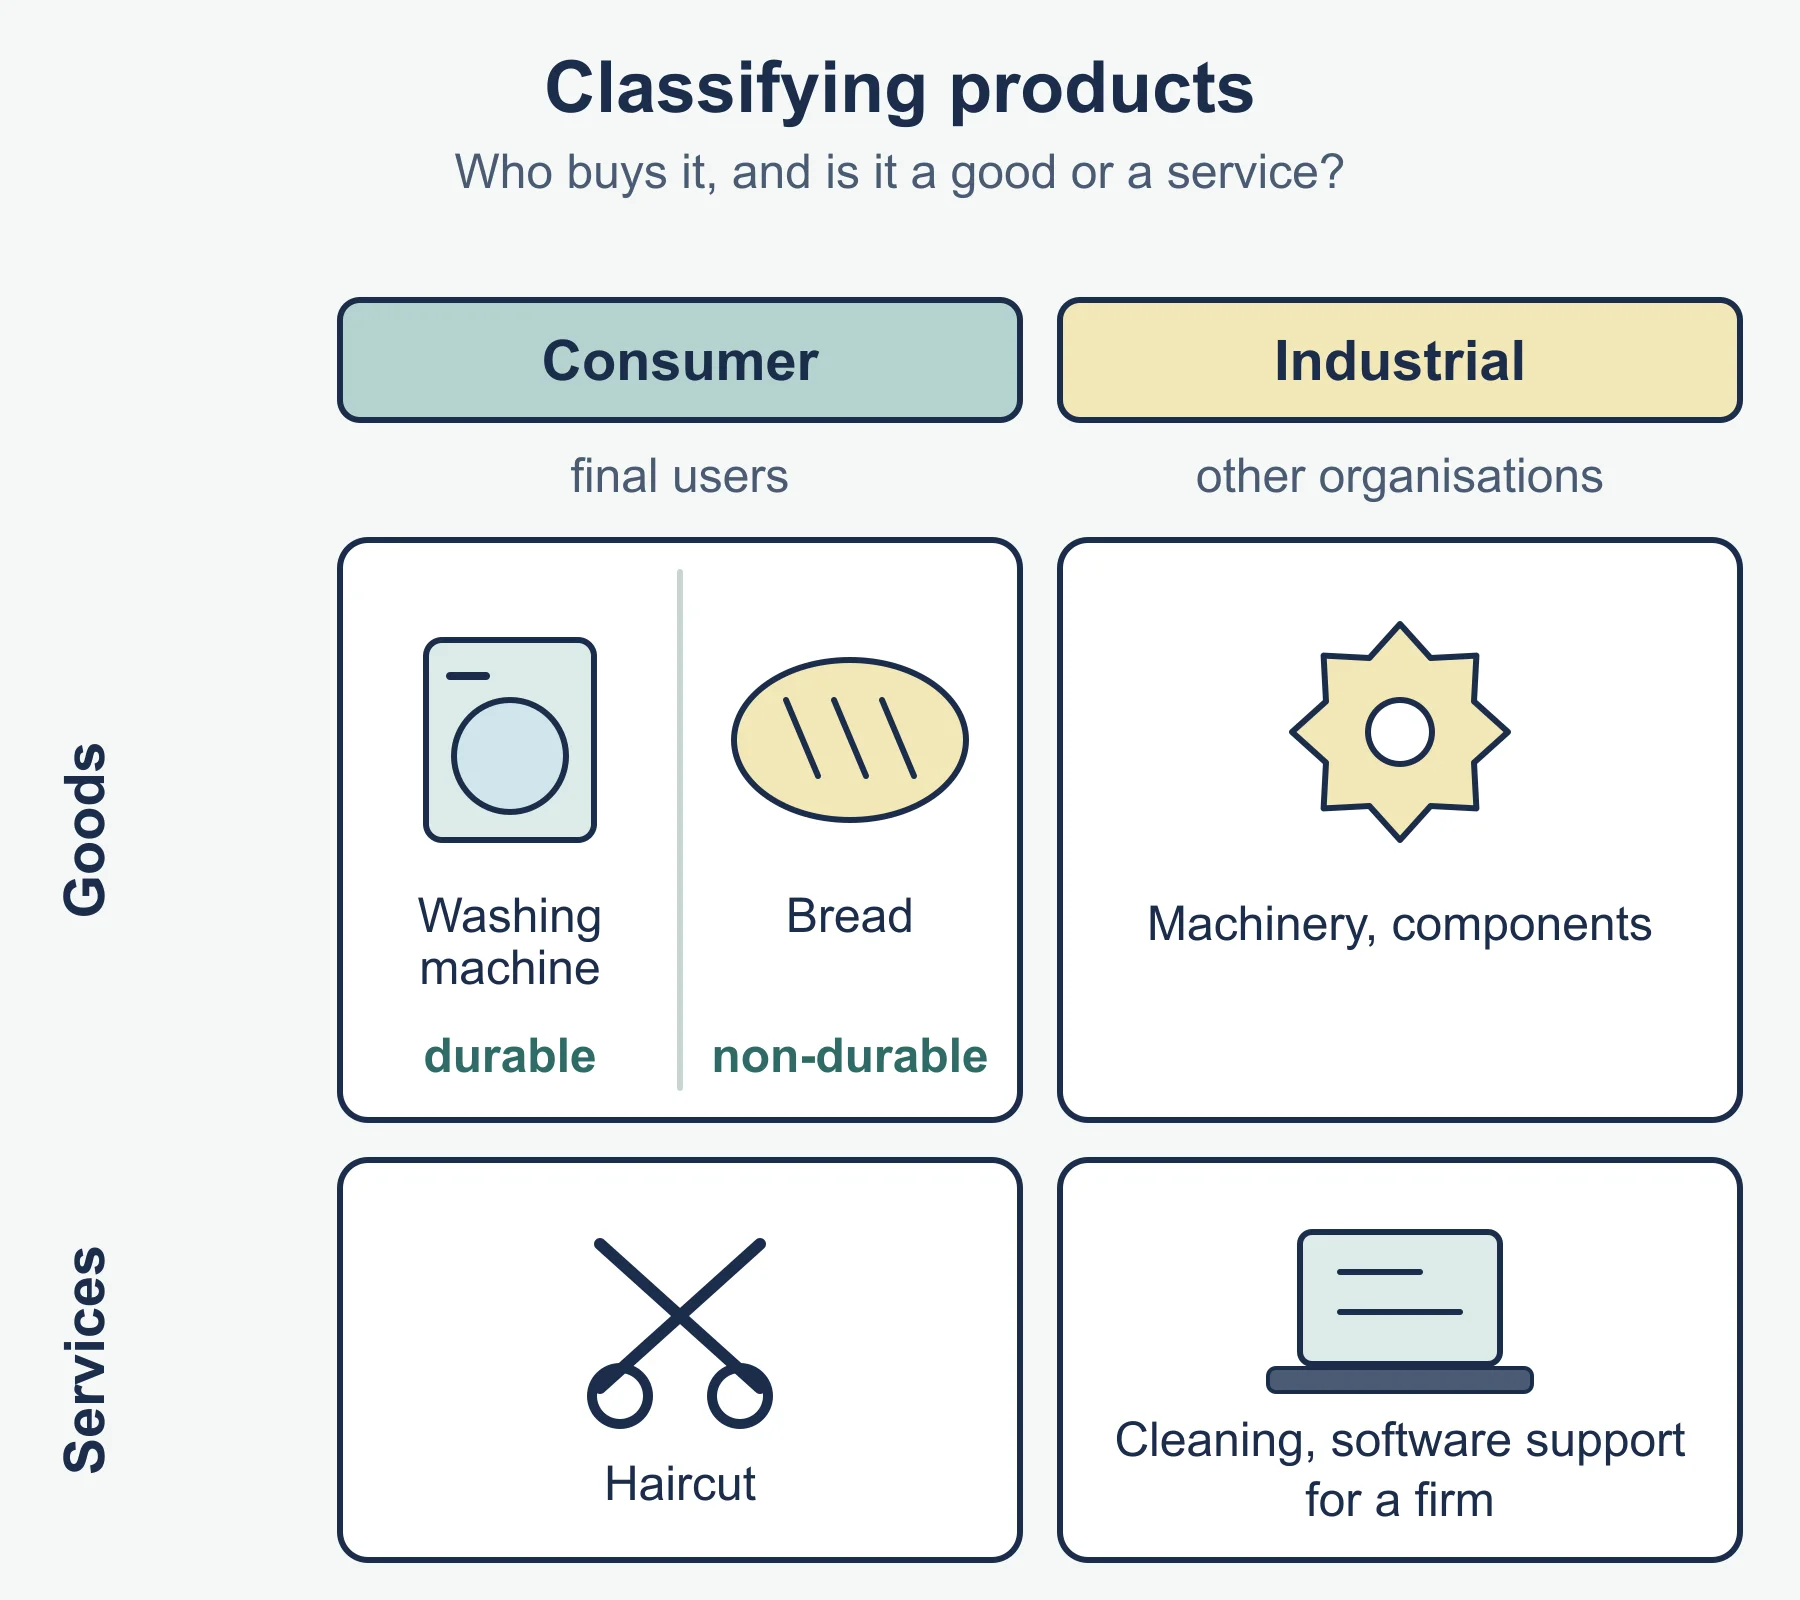
The syllabus asks for the classification of products. The standard split is consumer goods (durable, such as a washing machine, and non-durable, such as bread), consumer services (a haircut), industrial goods (machinery, components) and industrial services (cleaning or software support for a firm).
B2C marketing sells to many individuals, often through mass media, branding and emotional appeals, with short decisions and low order values. B2B marketing sells to fewer, larger buyers, often through direct sales teams, trade shows, detailed specifications, negotiated prices and long-term supply contracts. Several people may influence a B2B decision, so relationships and after-sales support matter more.
3.1.5 Mass marketing and niche marketing
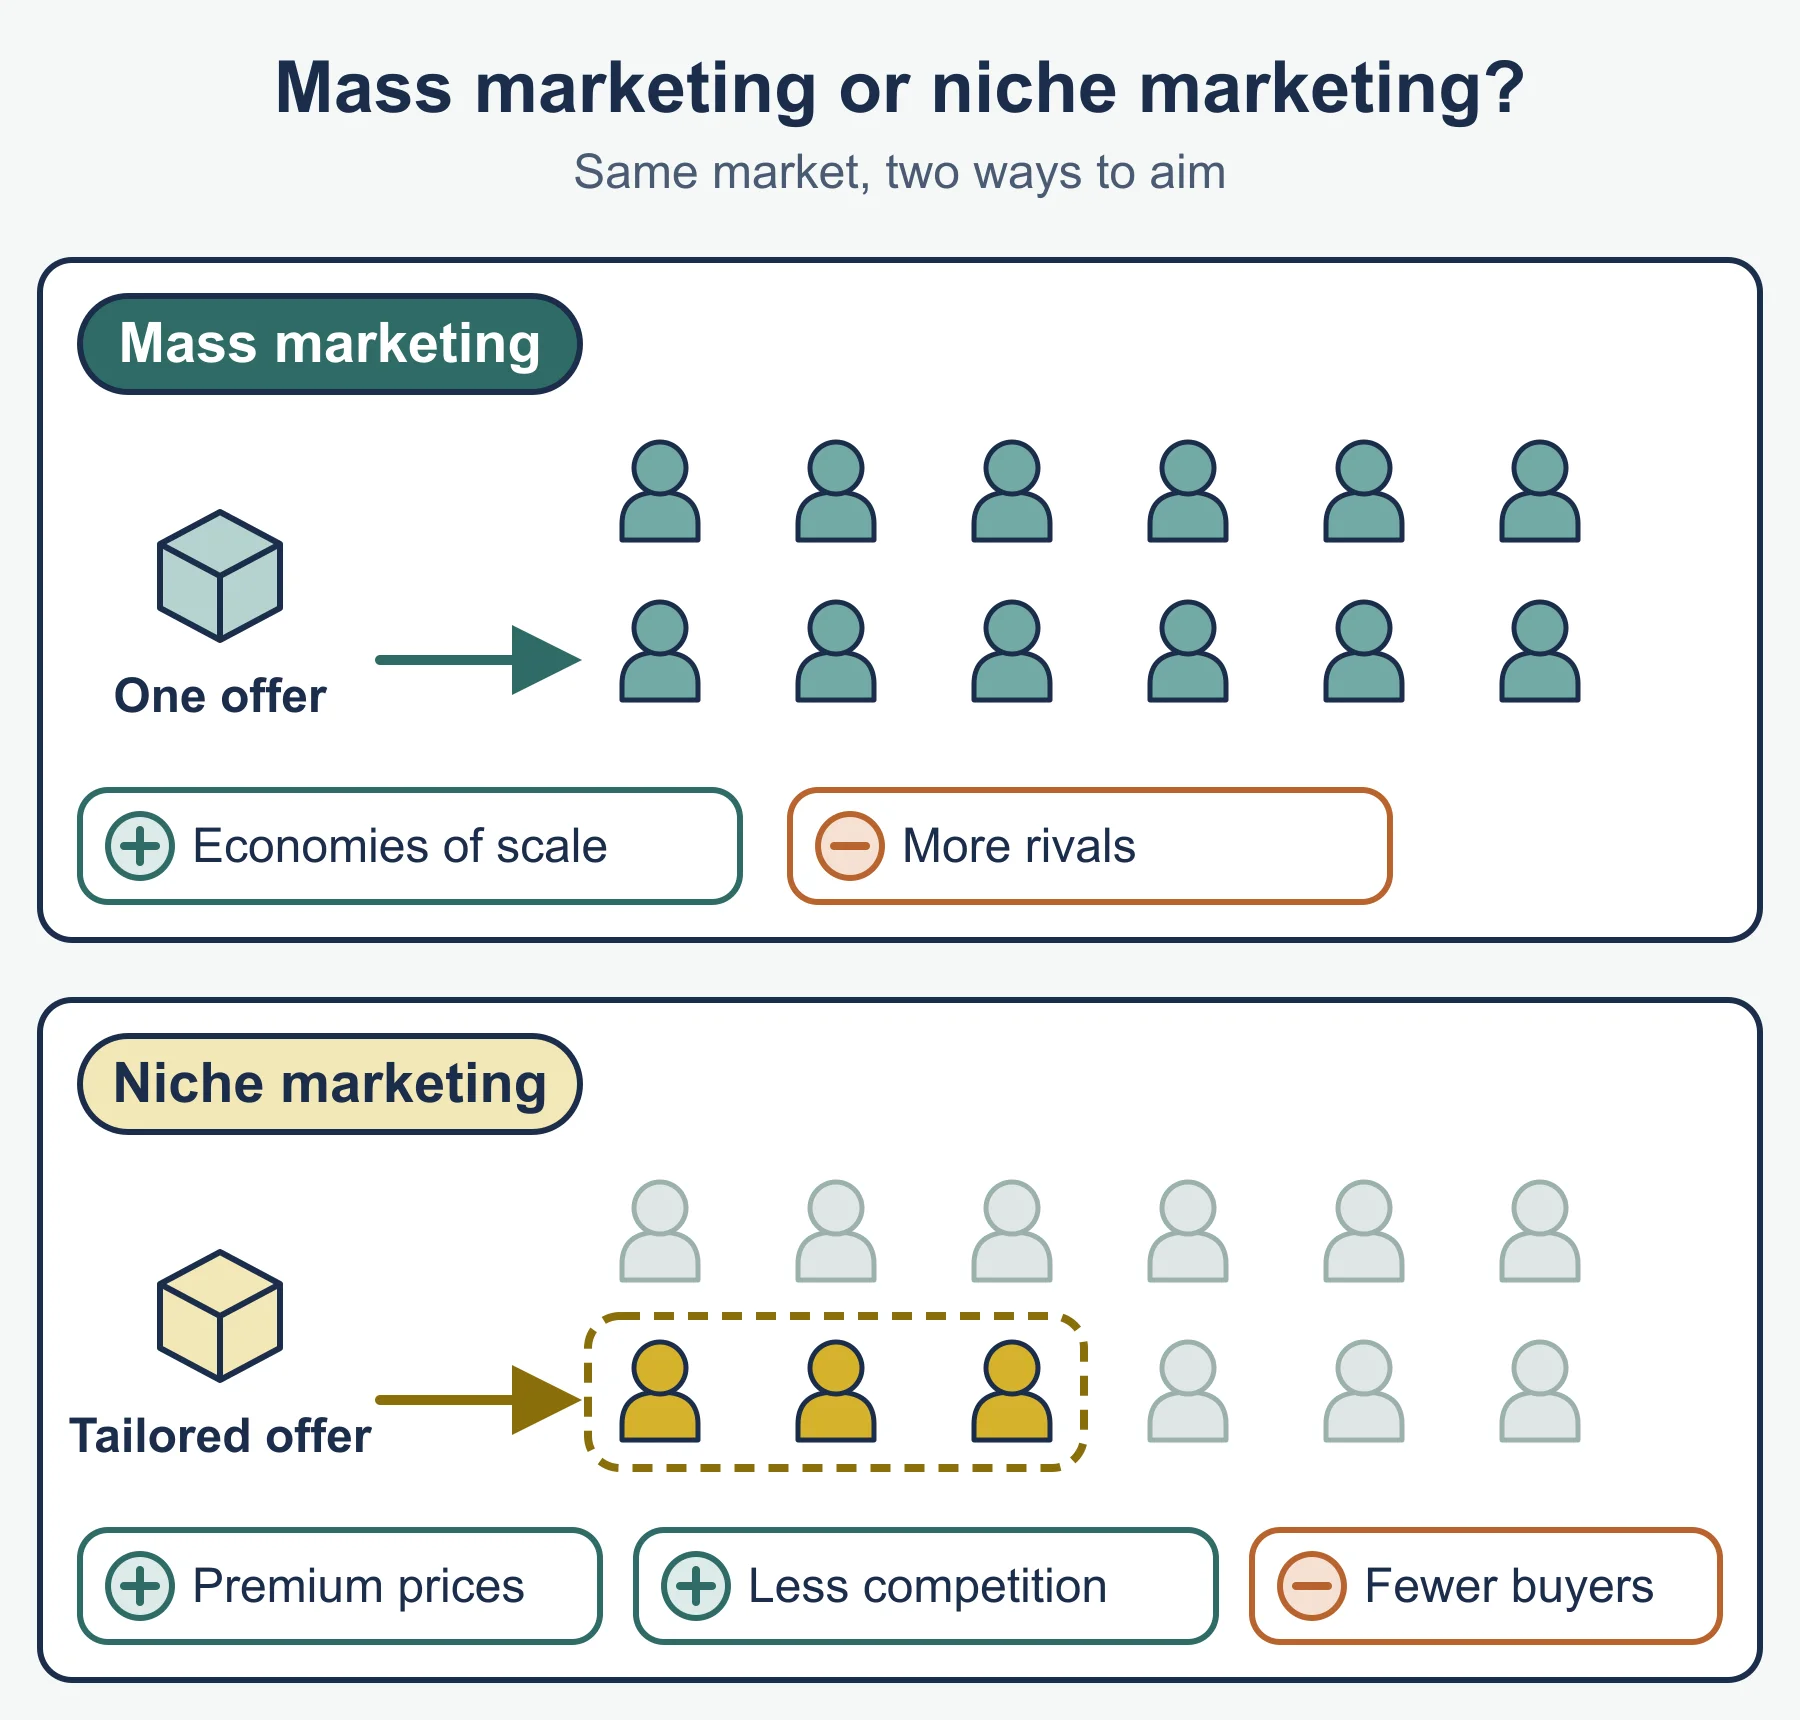
A mass market is a large market with many customers whose needs are broadly similar; mass marketing sells one product to most of it. A niche market is a small, specialised part of a larger market with particular needs.
| Advantages | Disadvantages | |
|---|---|---|
| Mass | Large sales volume; economies of scale; wide reach | Intense competition; low margins; high promotion spend; customers’ individual needs are ignored |
| Niche | Less competition; loyal customers; a premium price may be accepted | Small market limits sales; dependence on one group; large rivals may enter if the niche grows |
3.1.6 Market segmentation
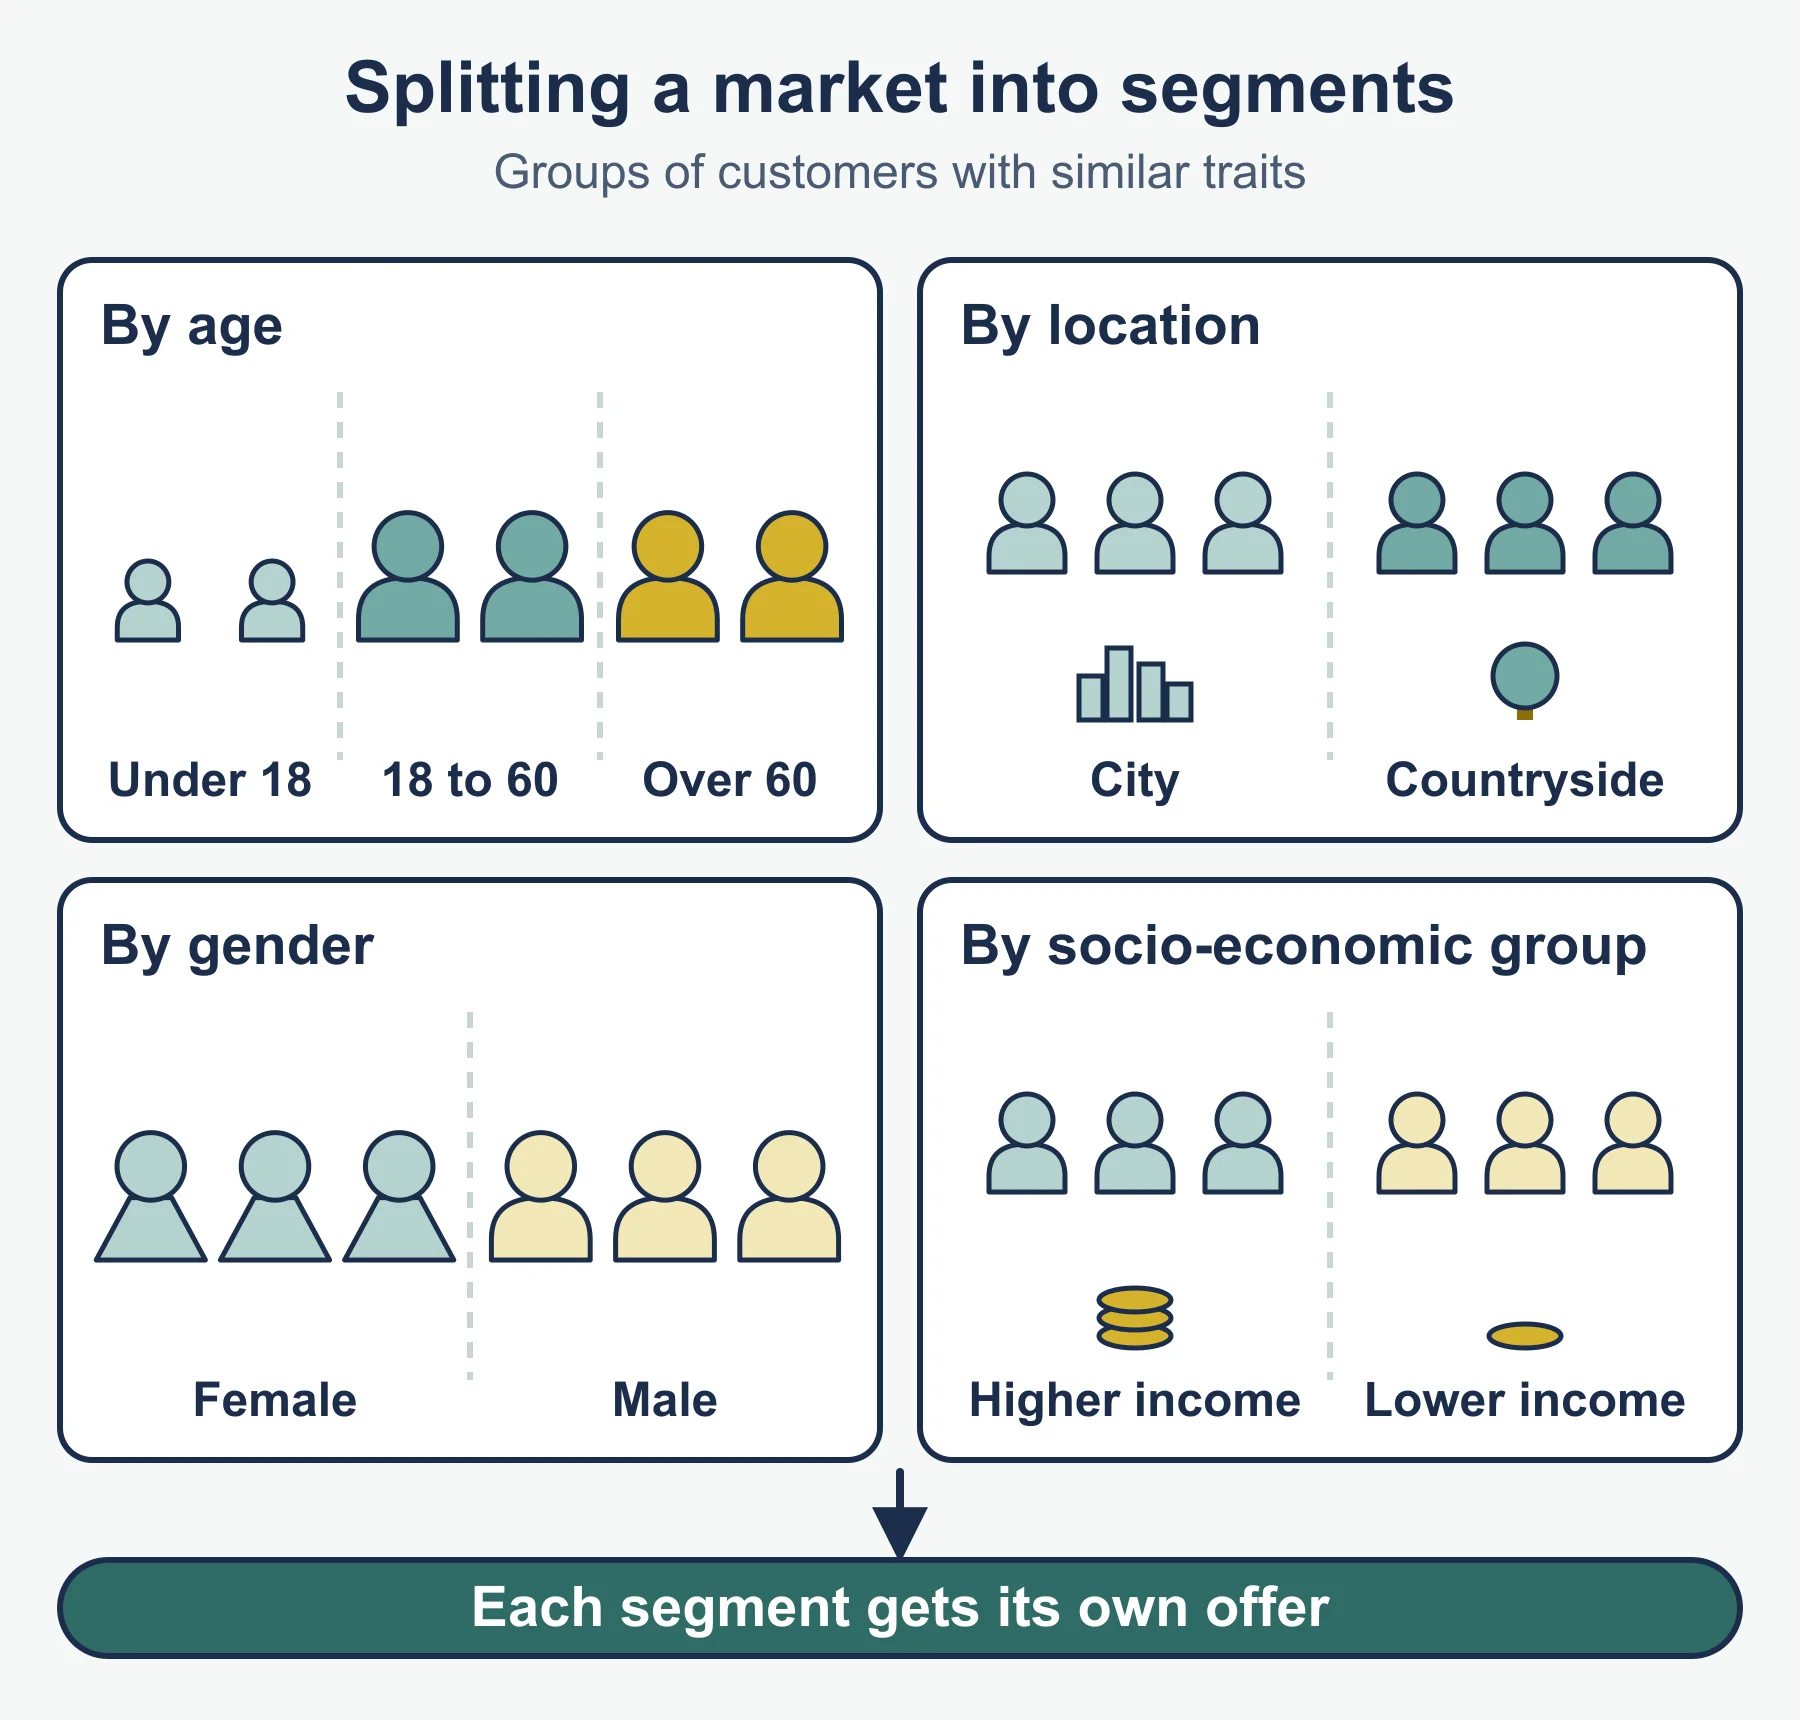
Segmentation divides a market into groups with shared characteristics so the marketing can be targeted.
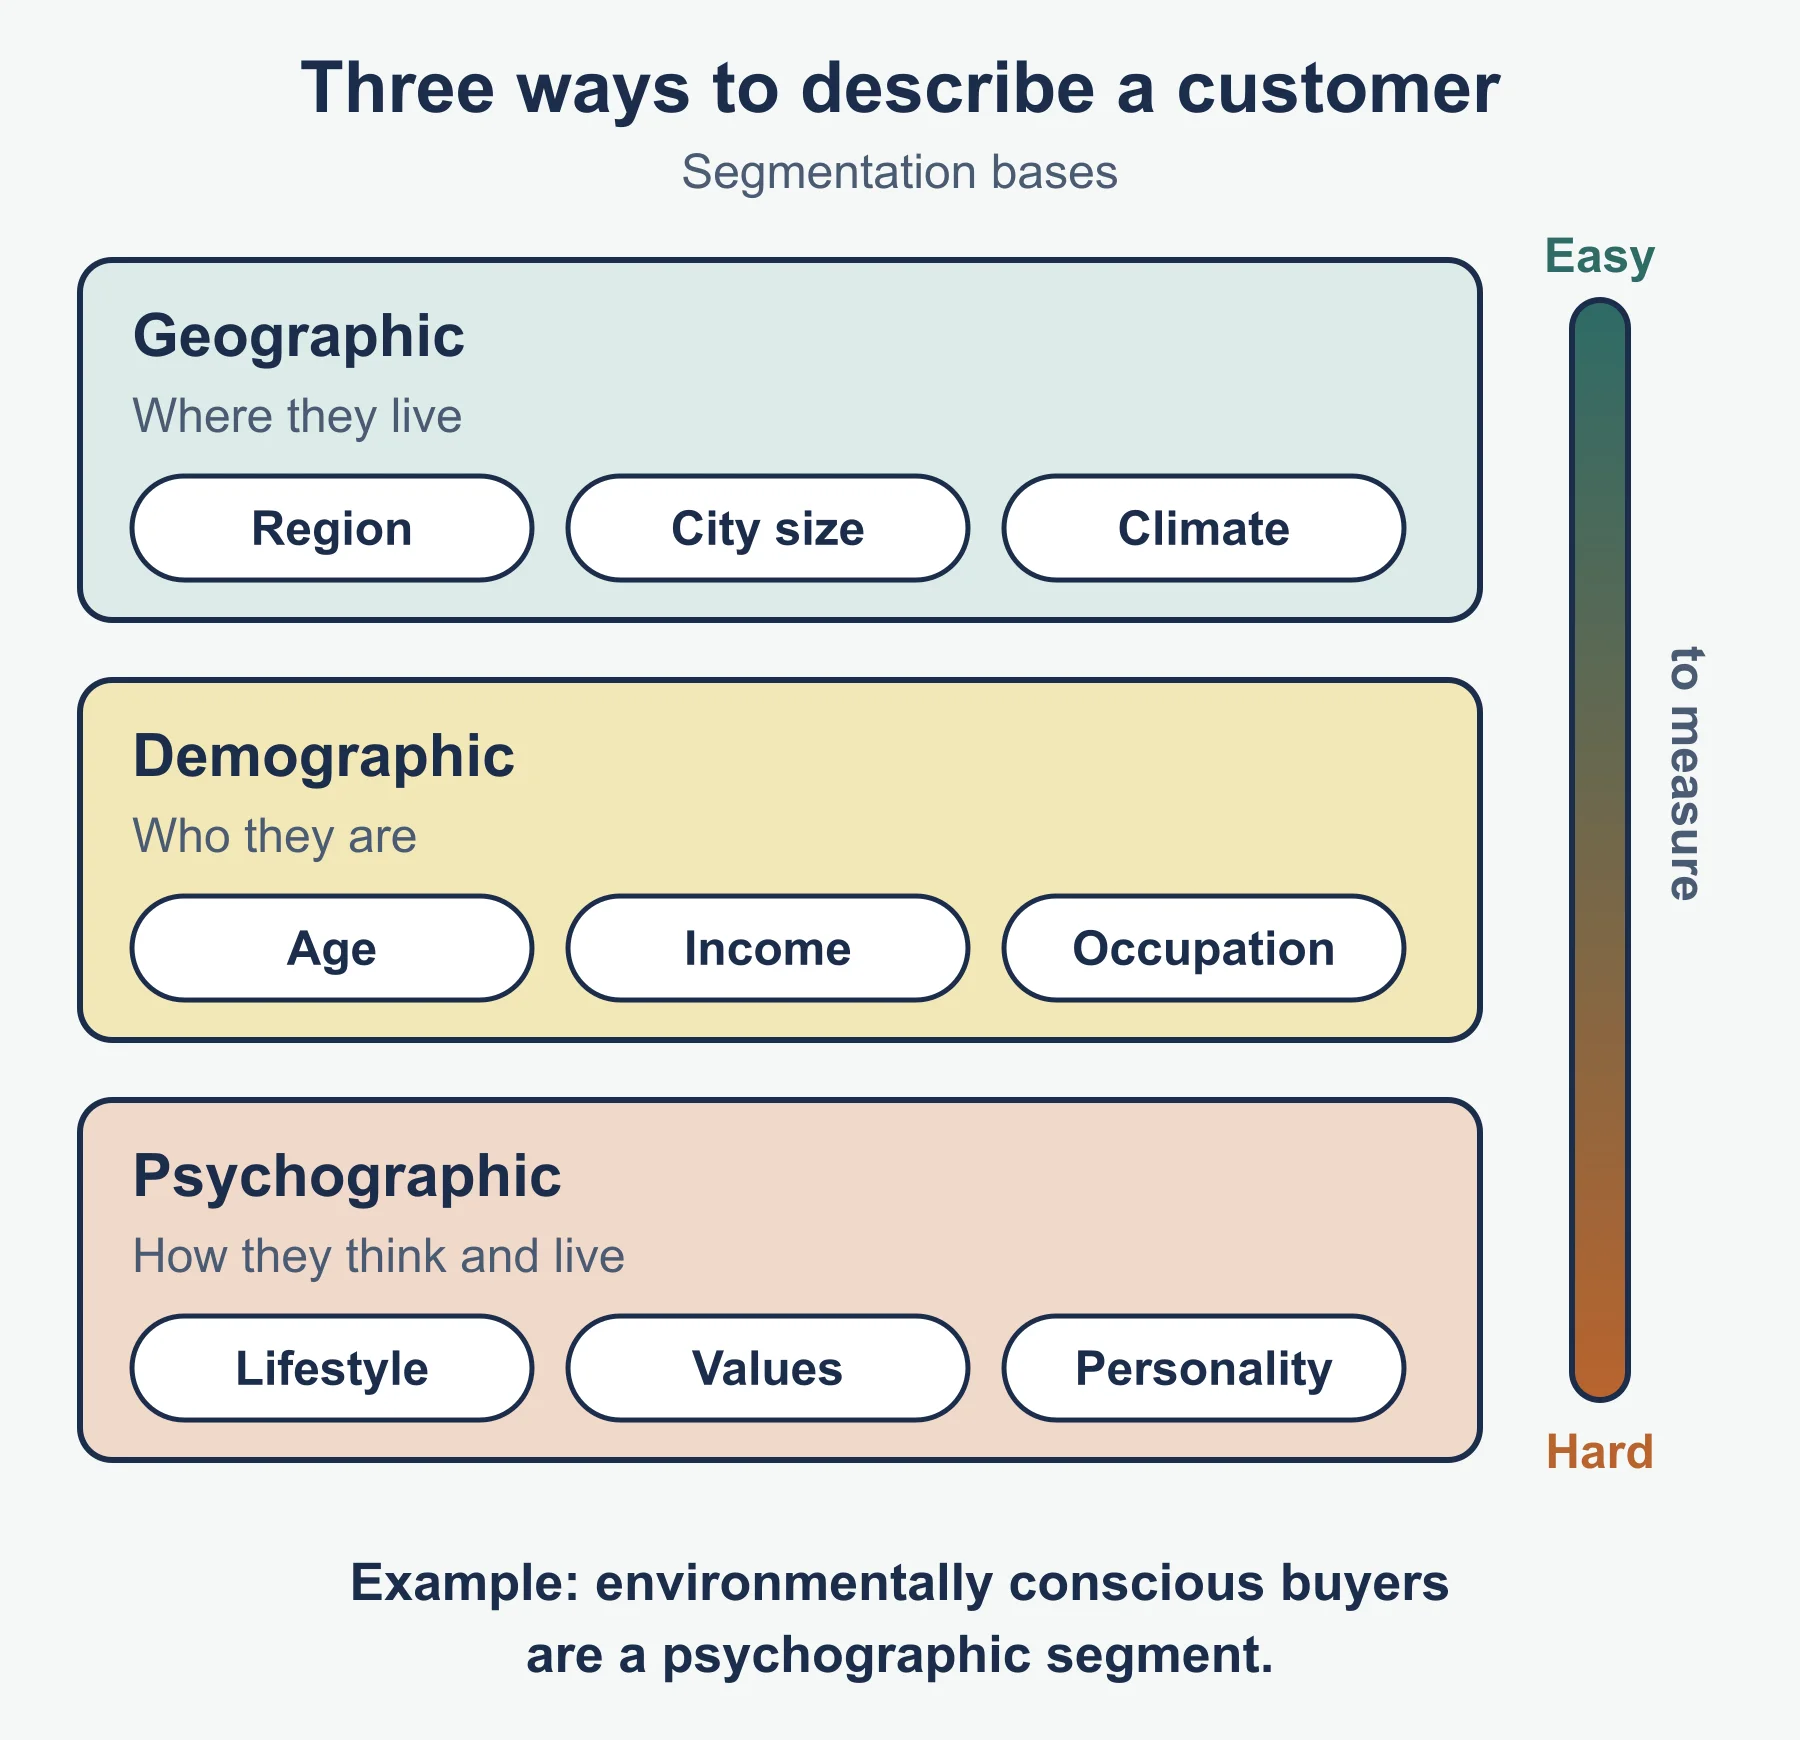
- Geographic: by location, such as region, city size or climate. A coat retailer might stock heavier coats in colder areas.
- Demographic: by measurable population features such as age, gender, income, occupation or family size.
- Psychographic: by lifestyle, attitudes, values and personality, such as environmentally conscious buyers.
Advantages: marketing is better matched to customers; spending is less wasteful; gaps in the market can be found; sales and loyalty can rise. Disadvantages: research and tailored campaigns cost more; production runs may be shorter; segments can be hard to measure (psychographic segments especially); a segment may be too small to be profitable.
3.1.7 Customer relationship marketing (CRM)
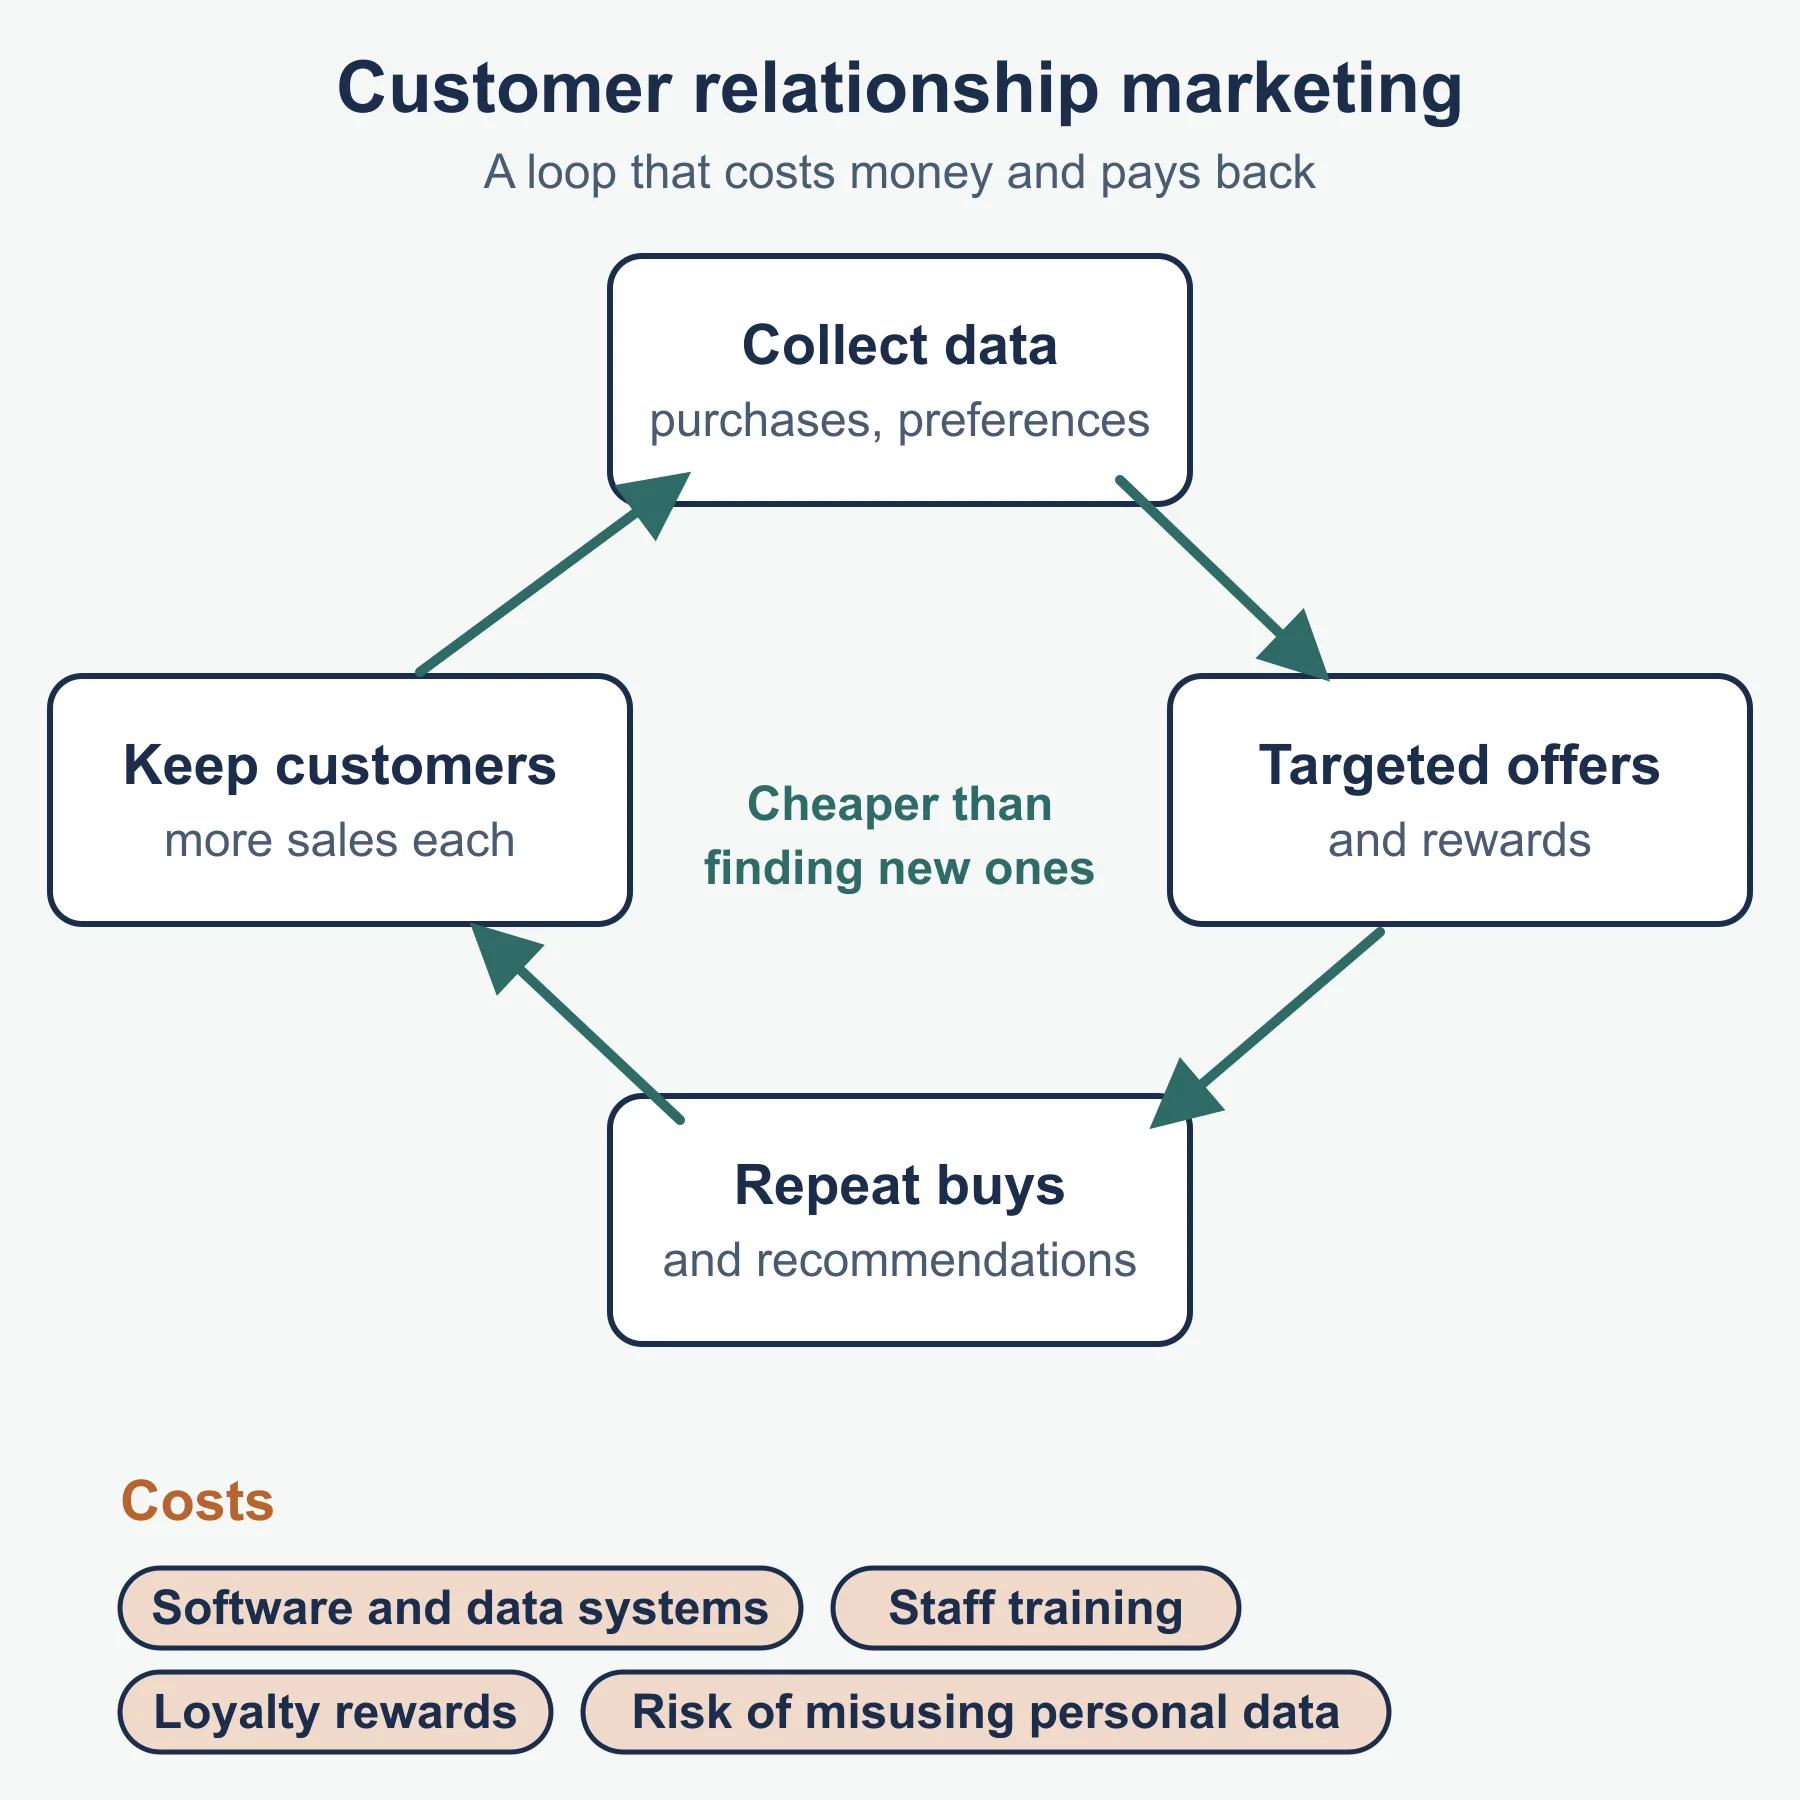
CRM builds long-term relationships with customers, using data about their purchases and preferences. Aims include keeping existing customers, raising repeat purchases, learning about customer wants and encouraging recommendations. Costs include software and data systems, staff training, loyalty rewards and the risk of misusing personal data. Benefits include higher customer retention, more sales per customer, targeted offers and lower cost than finding new customers.
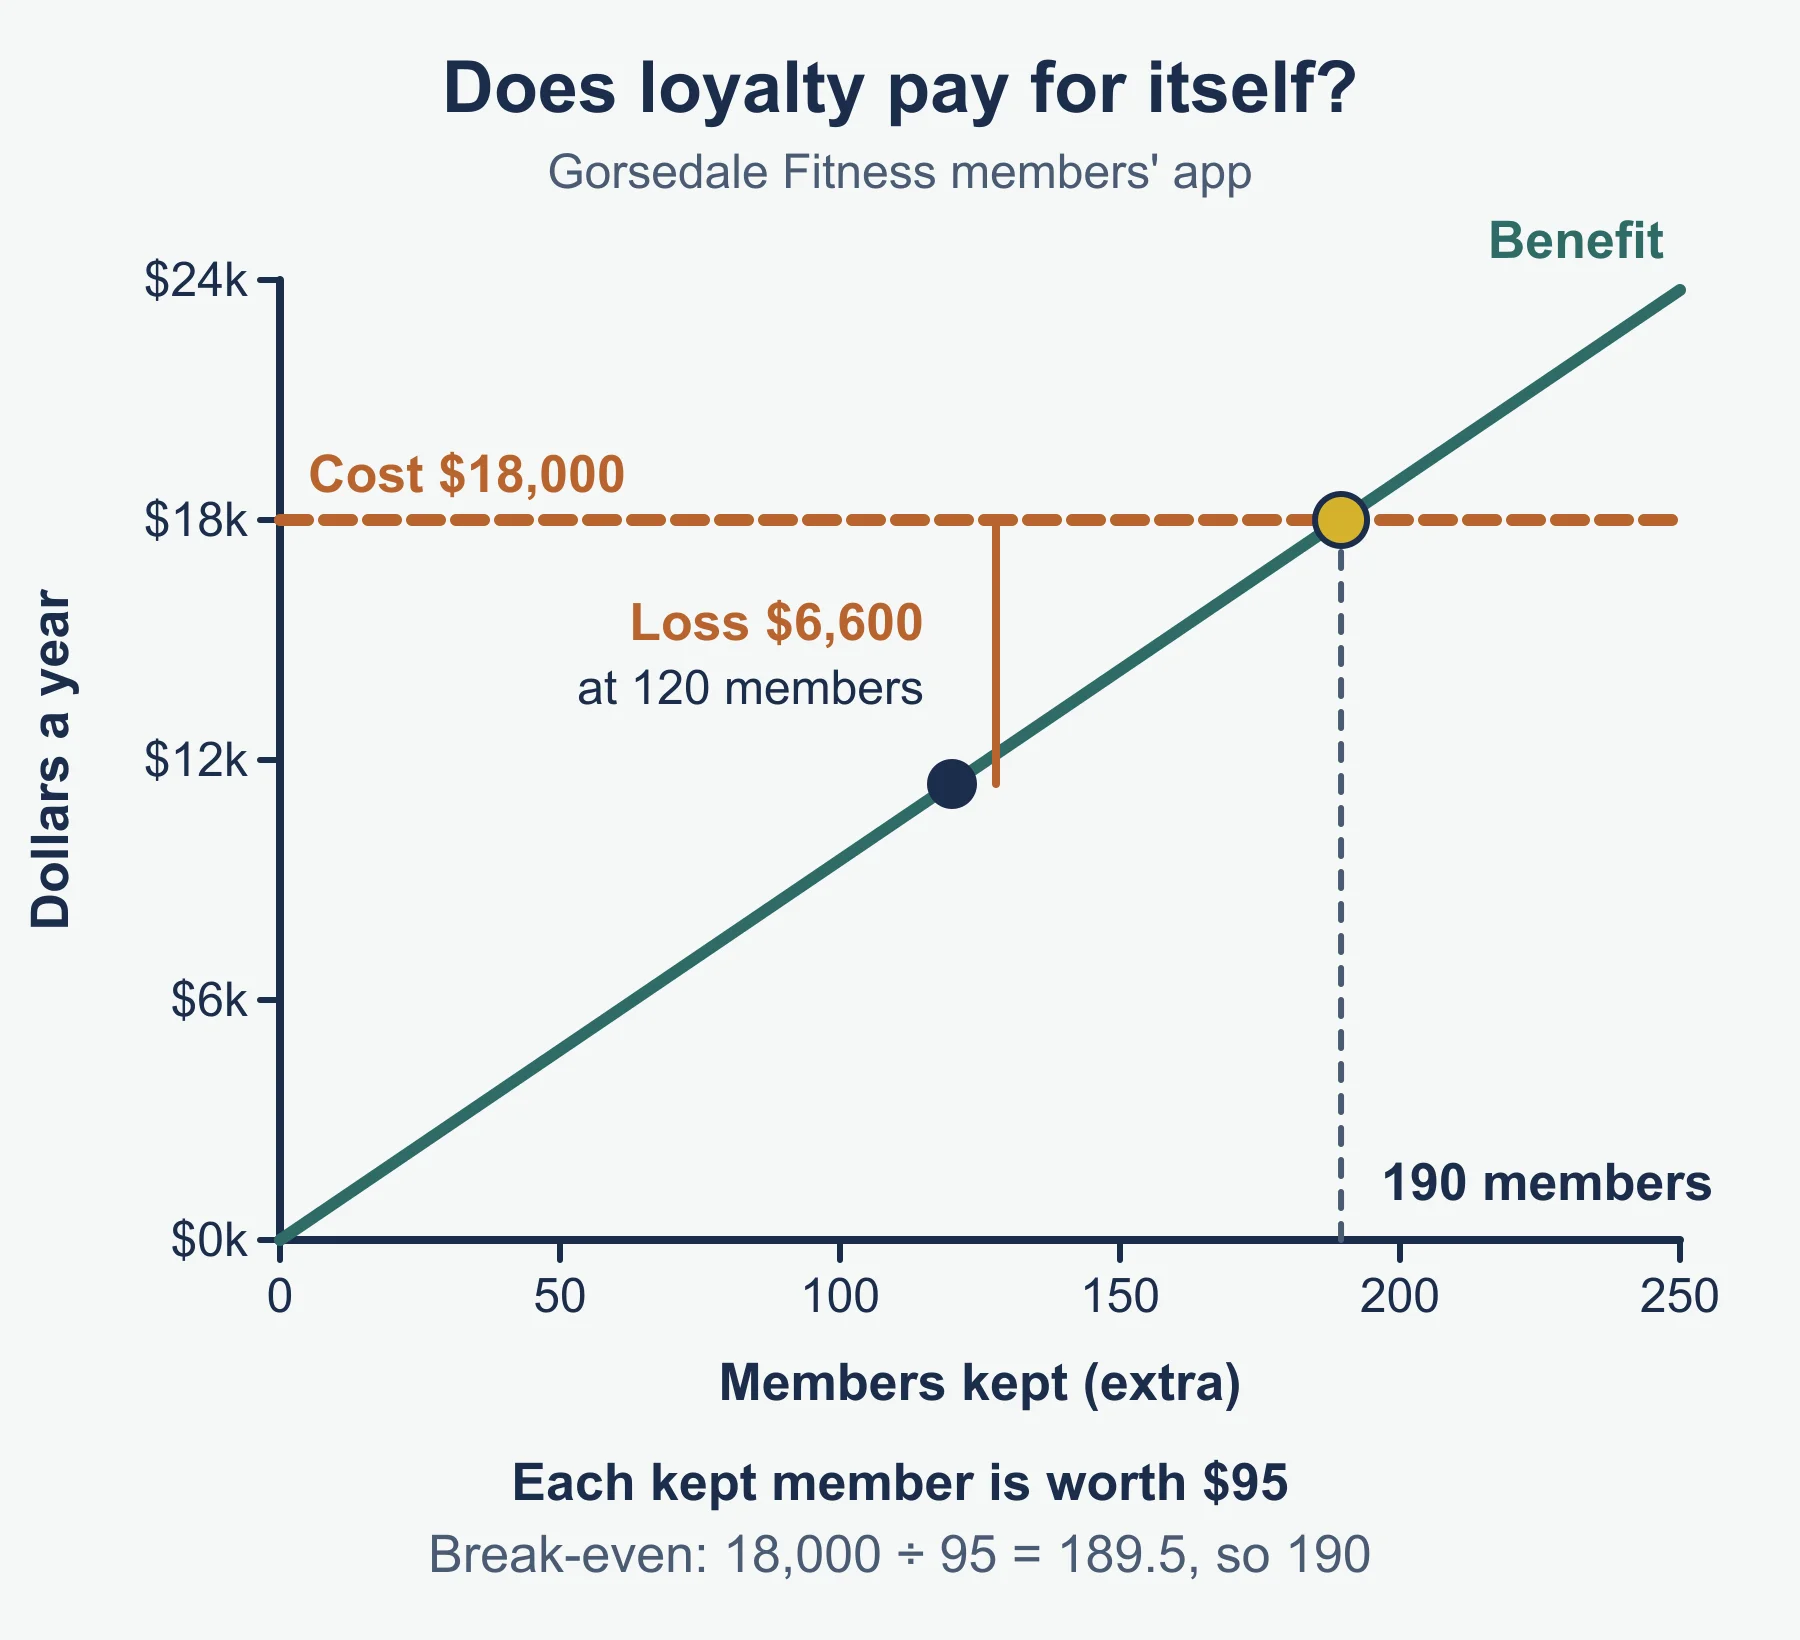
Worked example. Gorsedale Fitness spends $18,000 a year on a members’ loyalty app and rewards. It estimates that it keeps 120 extra members a year, each worth 95 dollars of contribution. Benefit: 120 x 95 = 11,400. Net result in the first year: 11,400 - 18,000 = -6,600, a loss. The scheme breaks even at 18,000 / 95 = 189.5, so 190 retained members. A sound judgement notes that retained members may stay for several years, so a first-year loss does not settle the matter.
3.2.1 Purposes of market research
Market research is the collection and analysis of information about a market. It has two purposes in the syllabus. First, to identify the main features of a market: its size, its growth and its competitors. Second, to identify customer and consumer characteristics, profiles, wants and needs: who buys, why, how often and what they would change. Together these guide decisions on products, segments and objectives.
3.2.2 Primary and secondary research
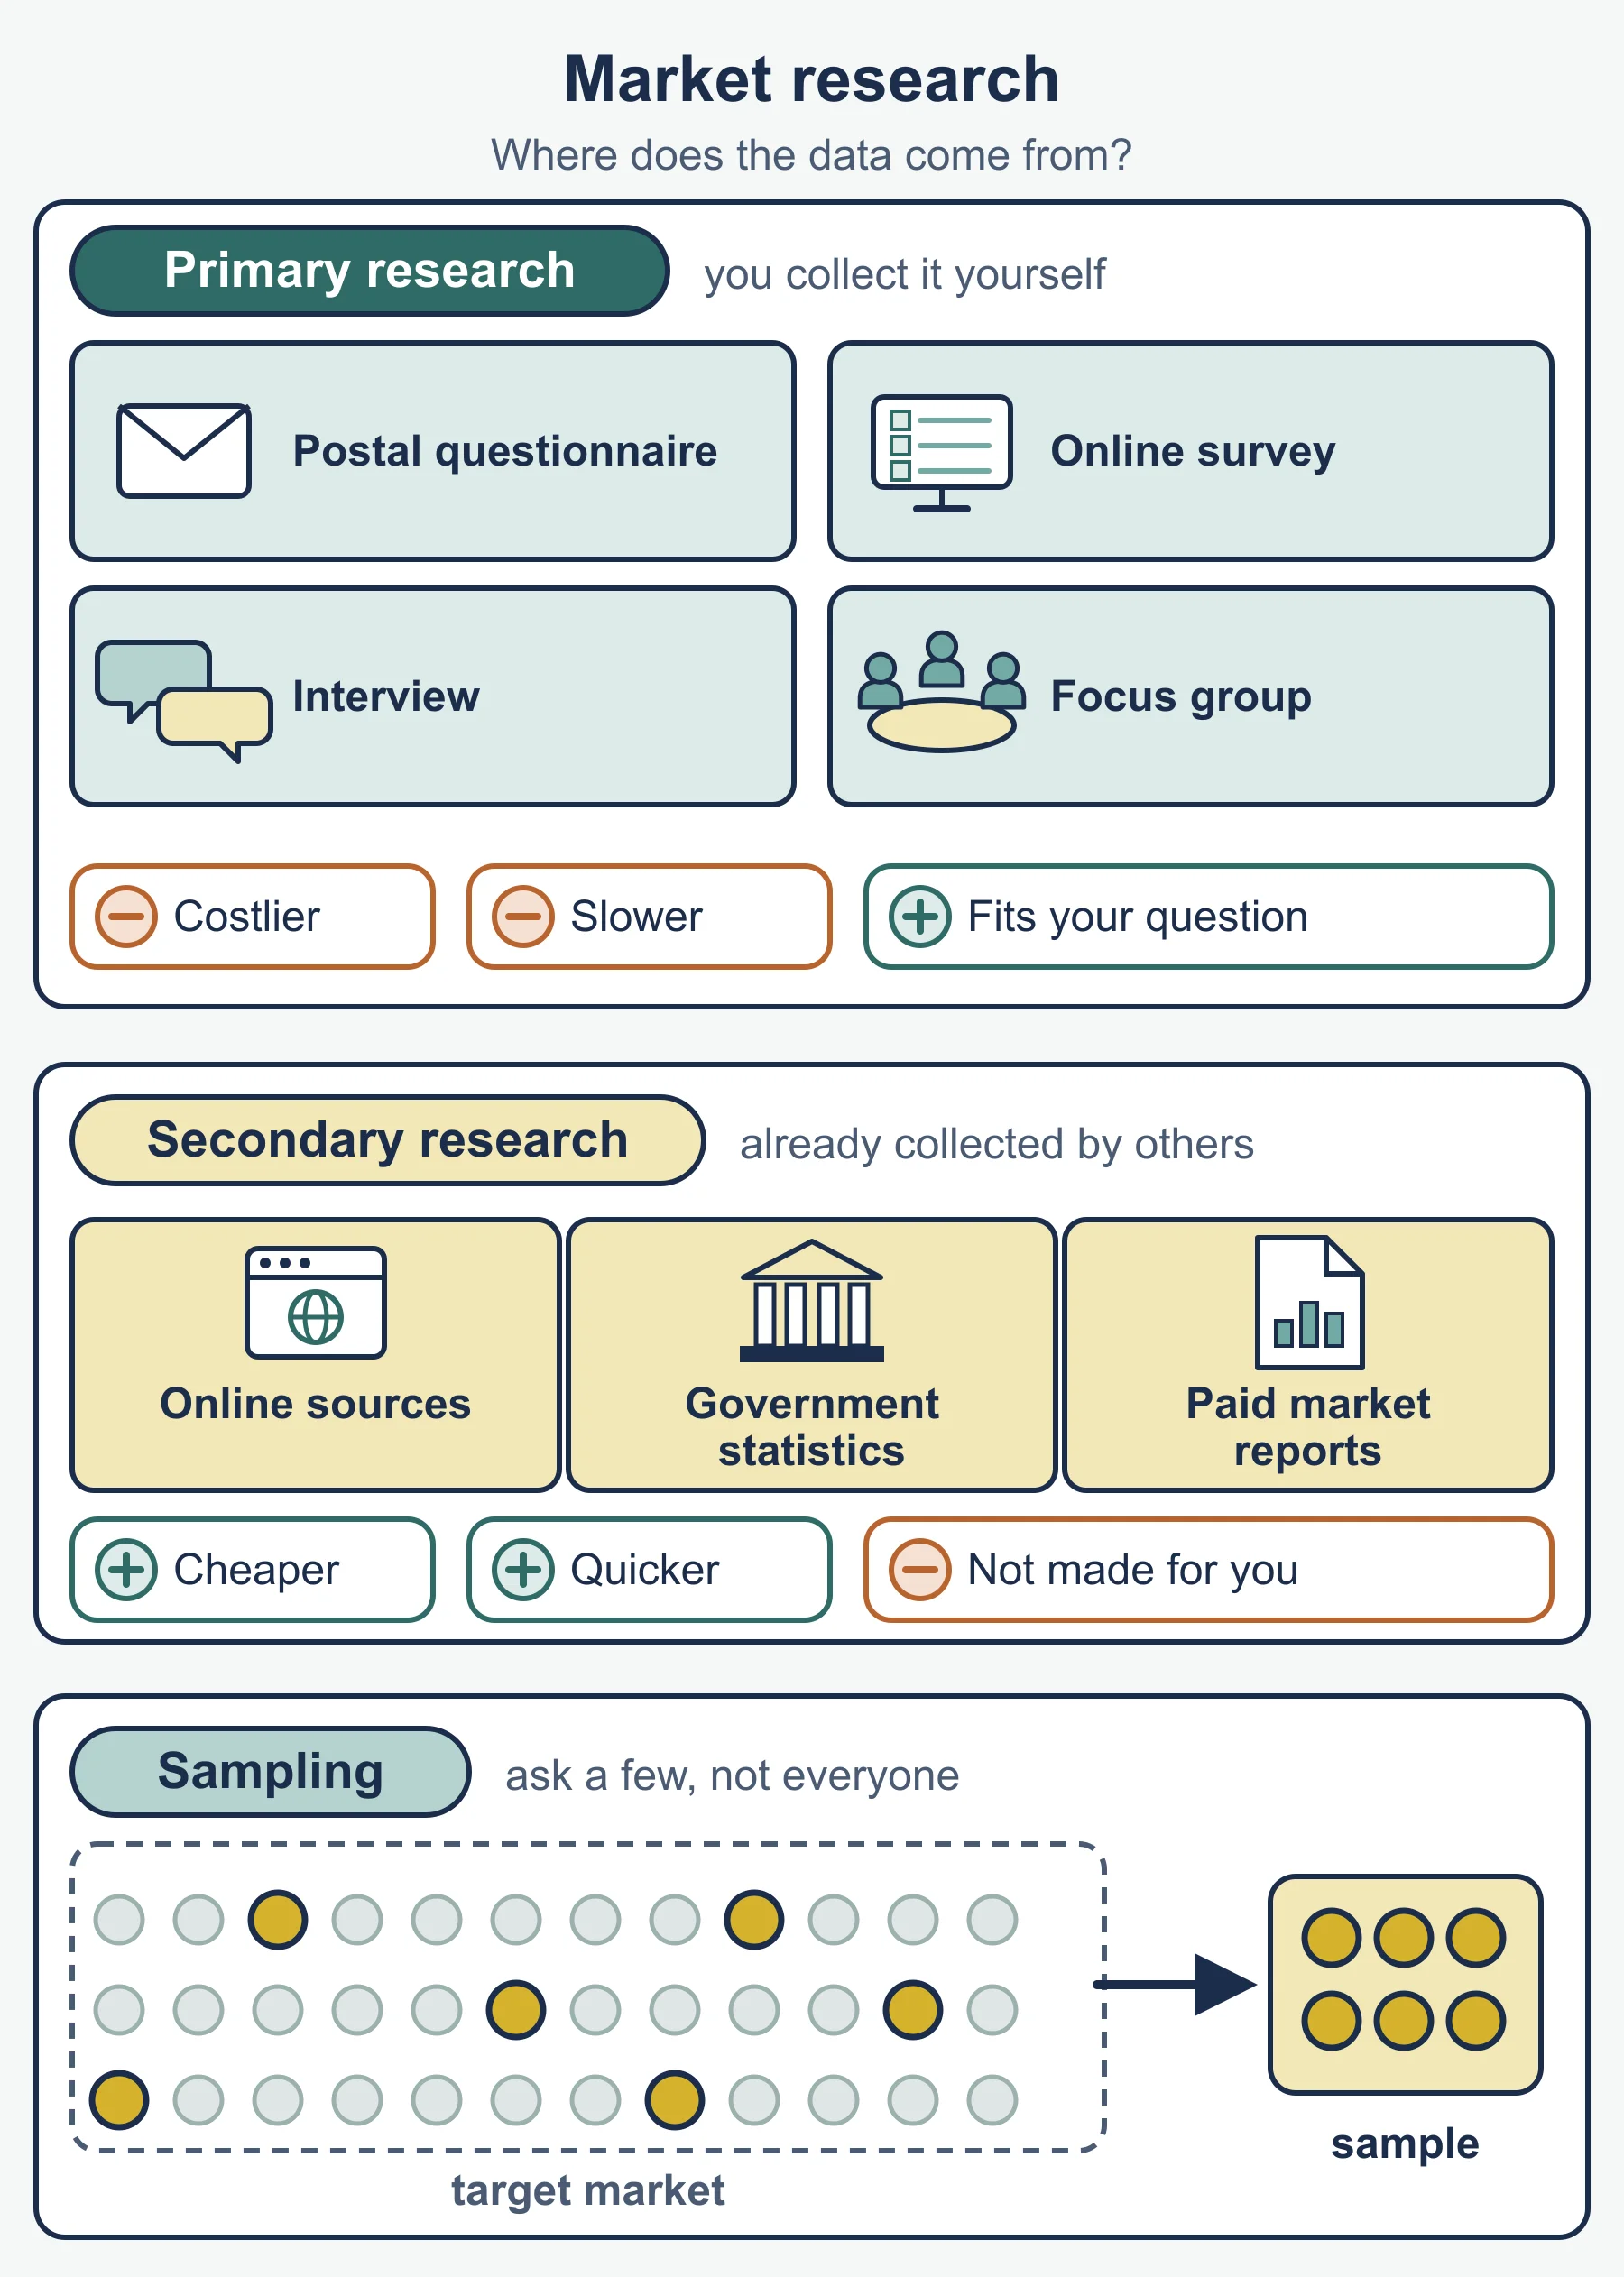
Primary research is new data collected first-hand for the purpose, by methods such as surveys and questionnaires, interviews, focus groups, observation and trials. Its features: specific to the question, up to date, owned by the firm, but slower and dearer. Secondary research uses data that already exists, such as government statistics, trade reports, competitors’ accounts and the firm’s own sales records. It is quicker and cheaper but may be out of date, collected for another purpose, or available to rivals.
Usefulness: primary data can answer a precise question (would this recipe sell at this price?) and give detailed qualitative reasons. Secondary data is useful for market size and trends and for planning primary research.
3.2.3 Sampling
A sample is a smaller group chosen from the target population. It is needed because questioning everyone would cost too much and take too long, and sometimes testing destroys the product. Limitations: a sample may not represent the population, giving biased results; a small sample gives less reliable findings; some people refuse or answer carelessly; and a larger, better sample costs more. The syllabus names no sampling methods, so concentrate on the need and the limitations.
3.2.4 Market research data
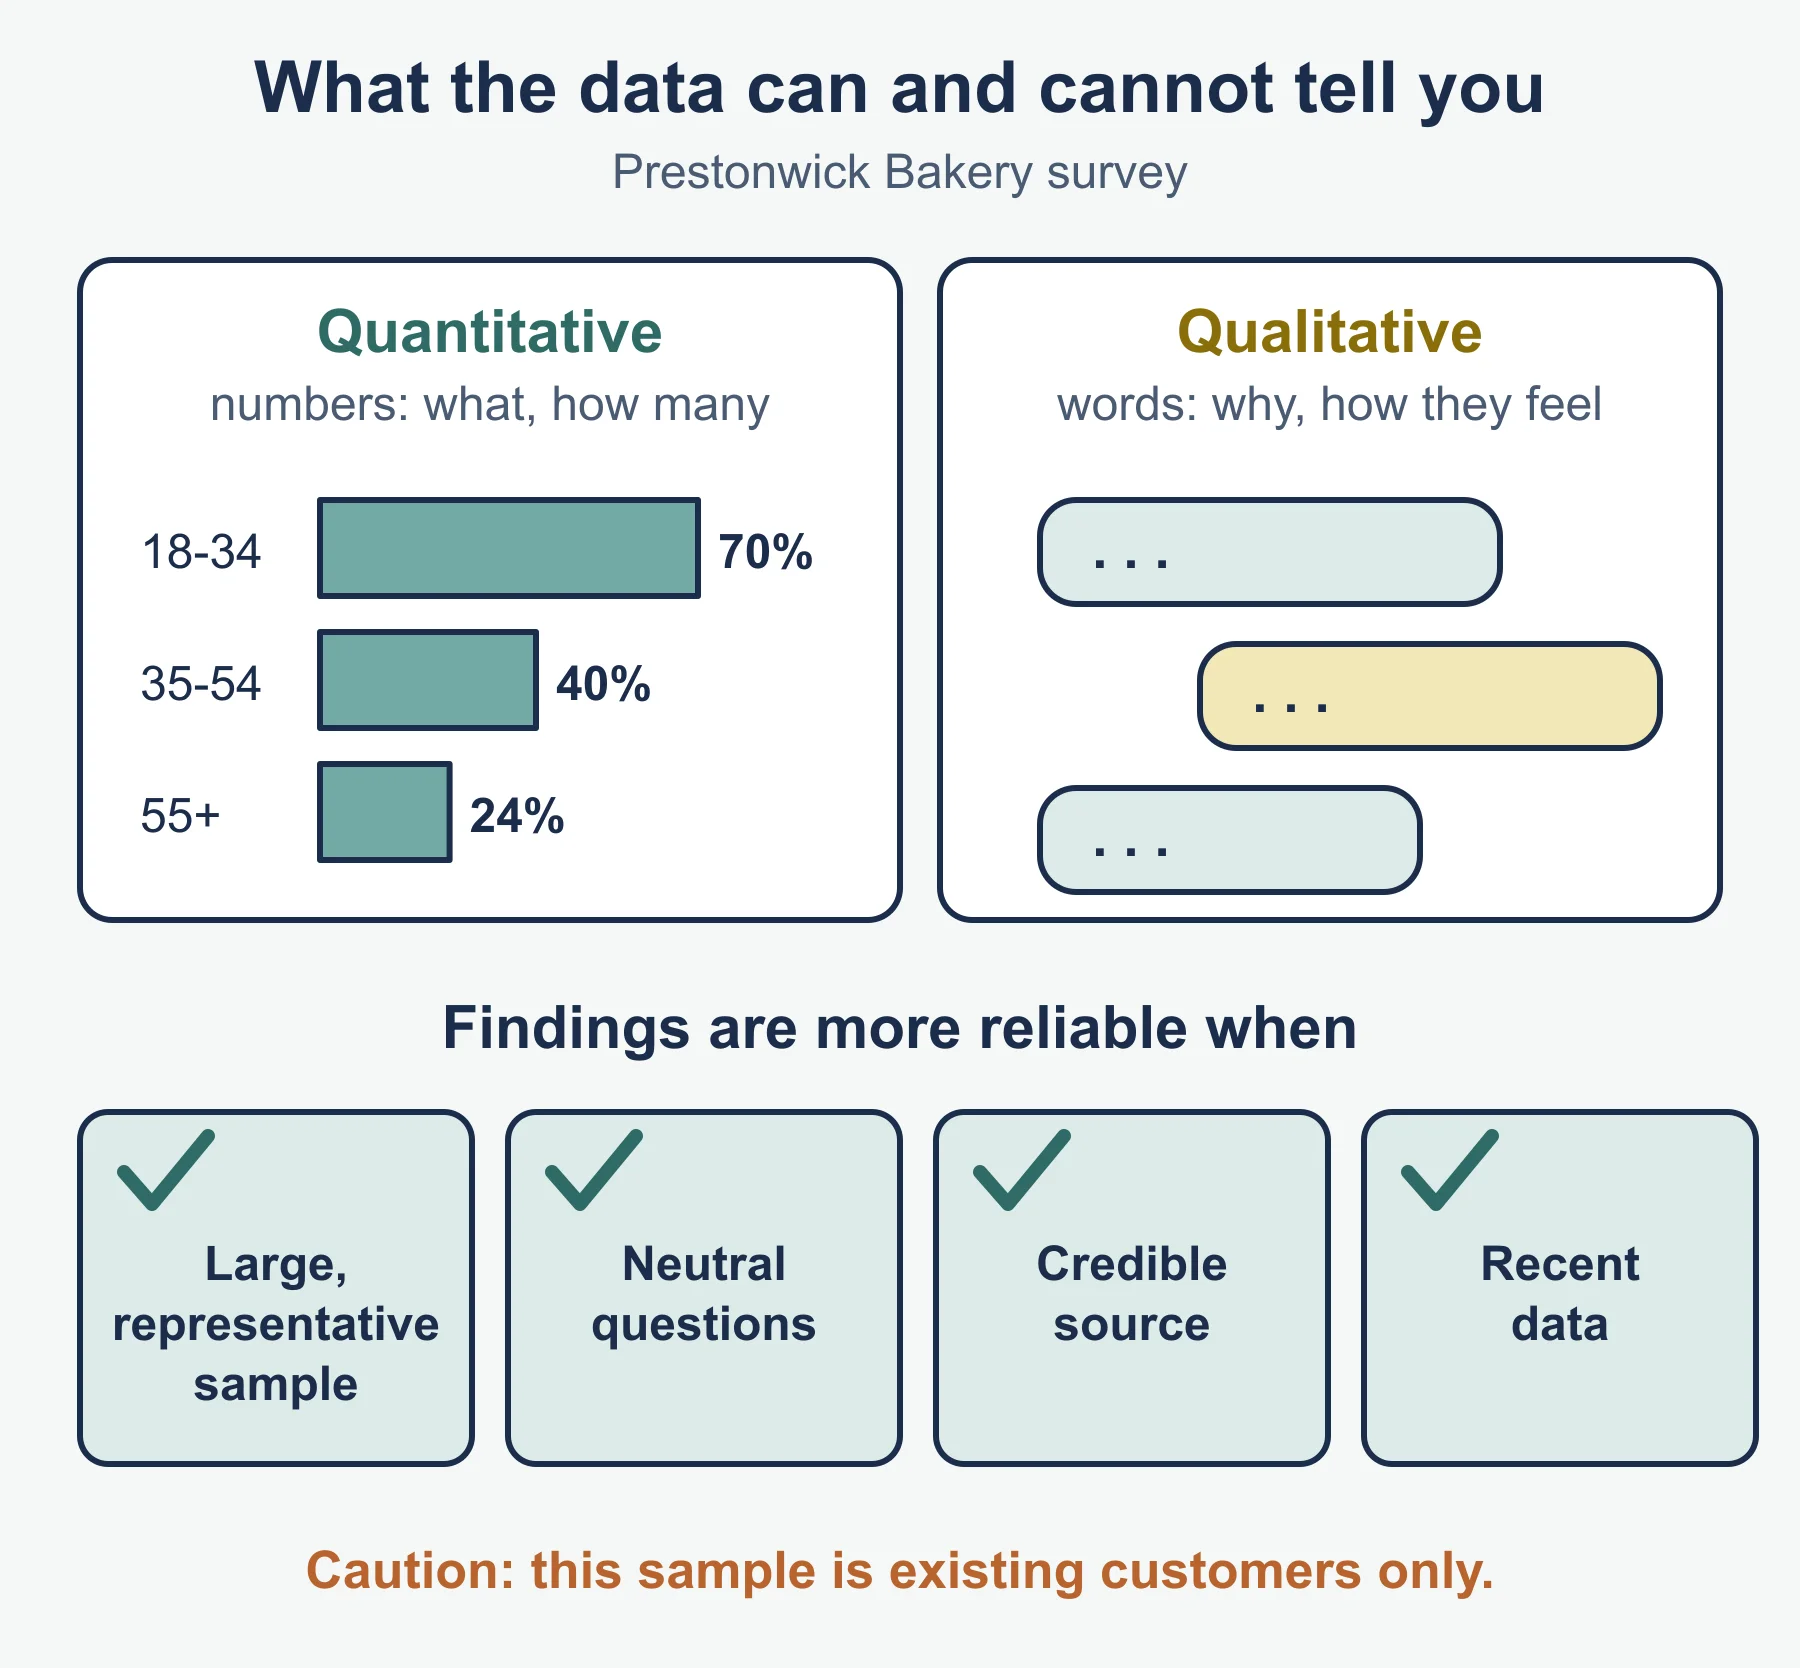
Reliability means how far the findings can be trusted. It is higher when the sample is large and representative, questions are neutral, the source is credible and the data is recent. Quantitative data is numerical (percentages, counts, averages) and is easy to compare. Qualitative data is descriptive (opinions, reasons, feelings) and explains why, but is harder to summarise.
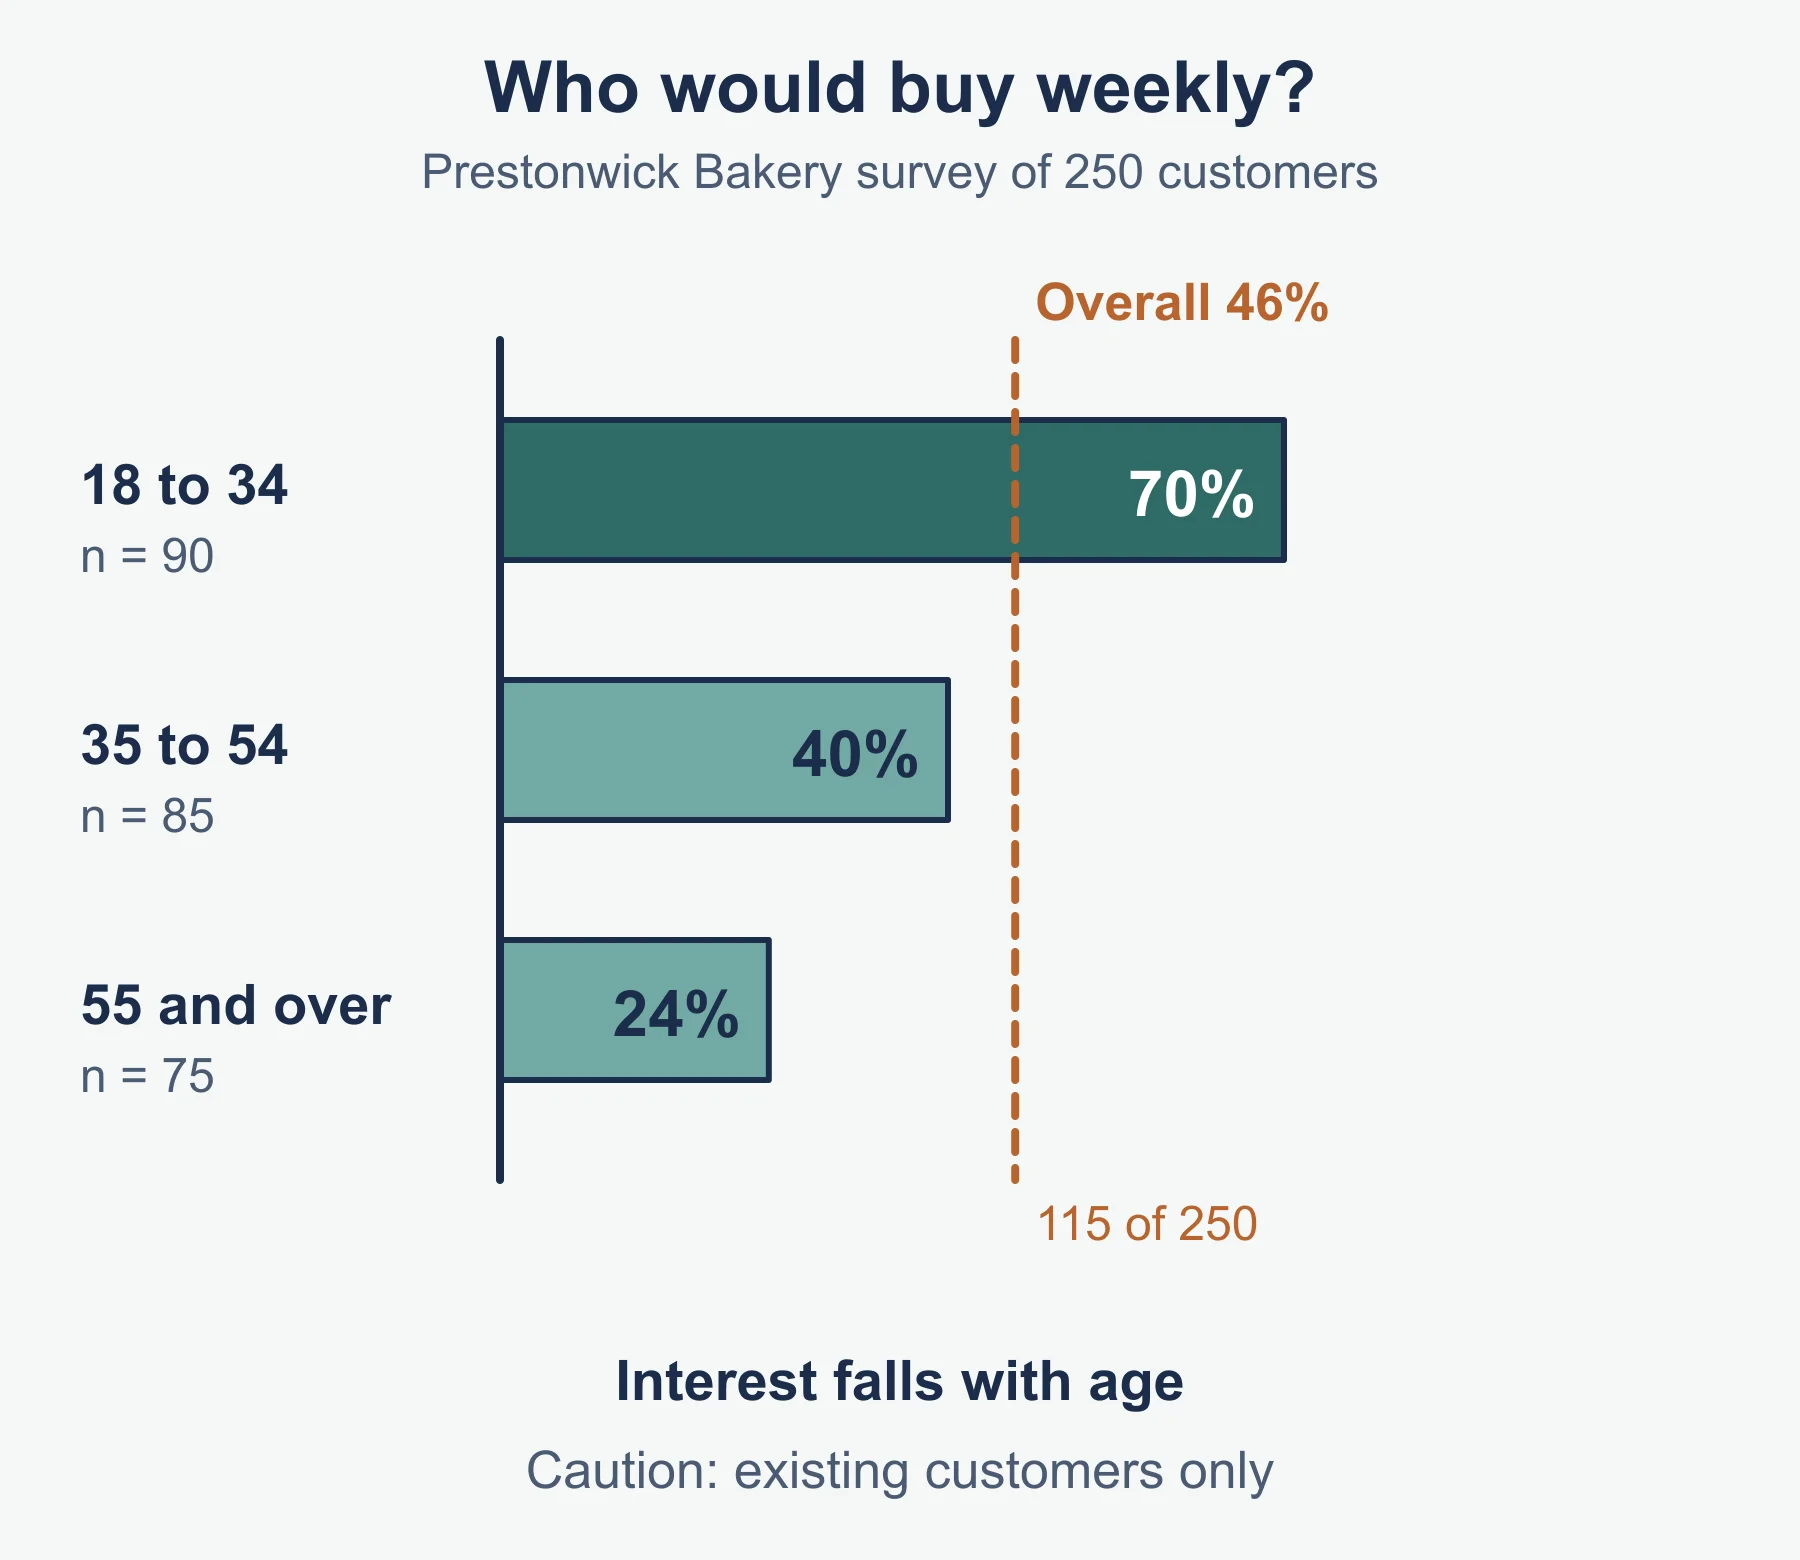
Worked example. Prestonwick Bakery surveys 250 customers about a new sourdough loaf.
| Age group | Sample | Would buy weekly |
|---|---|---|
| 18-34 | 90 | 63 |
| 35-54 | 85 | 34 |
| 55 and over | 75 | 18 |
Percentages: 63 / 90 = 70%, 34 / 85 = 40%, 18 / 75 = 24%. Overall, 115 of 250 = 46%. Interest falls with age, so the bakery might target the youngest group with digital promotion. A caution: the sample is from existing customers, so the results may not describe people who do not yet shop there. When reading a chart or table, quote figures, calculate a change or proportion, and say what the figures suggest and what they cannot show.
Common errors
- Saying a firm’s share rose because its sales rose, without checking the market.
- Describing segmentation methods without applying them to the business in the question.
- Treating primary and secondary research as good and bad rather than as different trade-offs.
- Writing about the marketing mix when the question asks about research.
- Giving a calculation with no conclusion.
Frequently asked questions
What is the difference between product orientation and customer orientation? Product orientation starts from what the business is able to make and then looks for buyers. Customer (market) orientation starts from what customers want, which needs market research.
What happens to price and quantity when demand rises? When demand rises and supply is unchanged, equilibrium price and quantity both rise. A shortage pushes price up, while a surplus pushes it down.
What is customer relationship marketing? CRM builds long-term relationships with customers using data about their purchases and preferences. Its aims are to keep customers and increase repeat purchases, but systems, training and rewards cost money.
What makes market research data reliable? Reliability is higher when the sample is large and representative, questions are neutral and the source is credible. Reliability asks whether findings can be trusted; usefulness asks whether they answer the question.
Official syllabus
Cambridge International, Cambridge International AS & A Level Business 9609 syllabus for examination in 2026, 2027 and 2028, subject content sections 3.1 and 3.2.
Get free revision emails (optional)
Occasional emails with practice questions, worked explanations and links to free resources for the qualification and subjects you choose. No spam, and you can unsubscribe from any email. The free tools on this site never need an email.
Related resources
-
Practice questions
A Level Business: The nature of marketing and Market research (Cambridge 9609) – Practice Questions
Twelve original practice questions with worked answers on Cambridge A Level Business 9609 sections 3.1 and 3.2: markets, segmentation, CRM, research.
Business · Cambridge · AS Level
Try questions -
Revision notes
A Level Business: The nature of marketing and Market research (Cambridge 9609) – Revision Notes
Condensed revision notes for Cambridge A Level Business 9609 sections 3.1 and 3.2, with formulas, comparison tables, a self-test and common mistakes.
Business · Cambridge · AS Level
Revise topic -
Study guides
A Level Business: Marketing (Cambridge 9609)
Study guide to Topic 3 Marketing in Cambridge AS & A Level Business 9609: market orientation, segmentation, research and the 4Ps with the Boston Matrix.
Business · Cambridge · AS Level
Read guide
Related articles
-
teaching
A Level tuition in Dubai: Cambridge or Pearson Edexcel International A Level?
Schools in Dubai and Abu Dhabi teach either Cambridge International AS & A Level or Pearson Edexcel International A Level. How the two are structured, why it matters for tuition, and how online classes from Lahore work.
9 October 2026
-
curriculum guides
Choosing subjects at IGCSE and A Level
How subject choices at 14 and 16 affect university options later, and how to keep pathways open without overloading a timetable.
28 July 2026
Studying this with a teacher
Working through Business AS LEVEL?
This page is free and stays free. If you would rather be taught it, Marlbridge runs Business classes one-to-one and in small groups of up to 15, online in your own time zone. The first trial class is free. WhatsApp replies within an hour (8am–11pm Pakistan time, every day); email the same day.
Cambridge Business teachers at Marlbridge

