
Revision Notes
A Level Business: The nature of marketing and Market research (Cambridge 9609) – Revision Notes
Condensed revision notes for Cambridge A Level Business 9609 sections 3.1 and 3.2, with formulas, comparison tables, a self-test and common mistakes.
- Subject
- Business
- Level
- AS LEVEL
- Topic
- Marketing
- Author
- Marlbridge Academic Team
- Updated
- Reviewed by
- Salman Ahmad (what this means)
Aligned to Cambridge A Level Business (9609), For examination in 2026, 2027 and 2028. Official specification .
Syllabus page (what it covers and how it is assessed): Cambridge A Level Business.
Syllabus points this page covers
9609 (AS Level)
- 3.1 The nature of marketing
- 3.2 Market research
Found an error? Report a correction.
Need help with this topic? Request a free trial class for A Level Business (9609).
These notes condense sections 3.1 (The nature of marketing) and 3.2 (Market research) of the Cambridge International AS & A Level Business 9609 syllabus for examination in 2026, 2027 and 2028. Both are AS Level content. For full explanations, read the study guide, then test yourself with the practice questions. The broader Marketing revision notes also cover the marketing mix, which is section 3.3 and not covered here. Links: course hub, checklist and free diagnostics.
3.1.1 Objectives
- Marketing objectives: targets for the marketing function (market share, brand awareness, a new segment).
- Corporate objectives: targets for the whole business (profit, growth, survival).
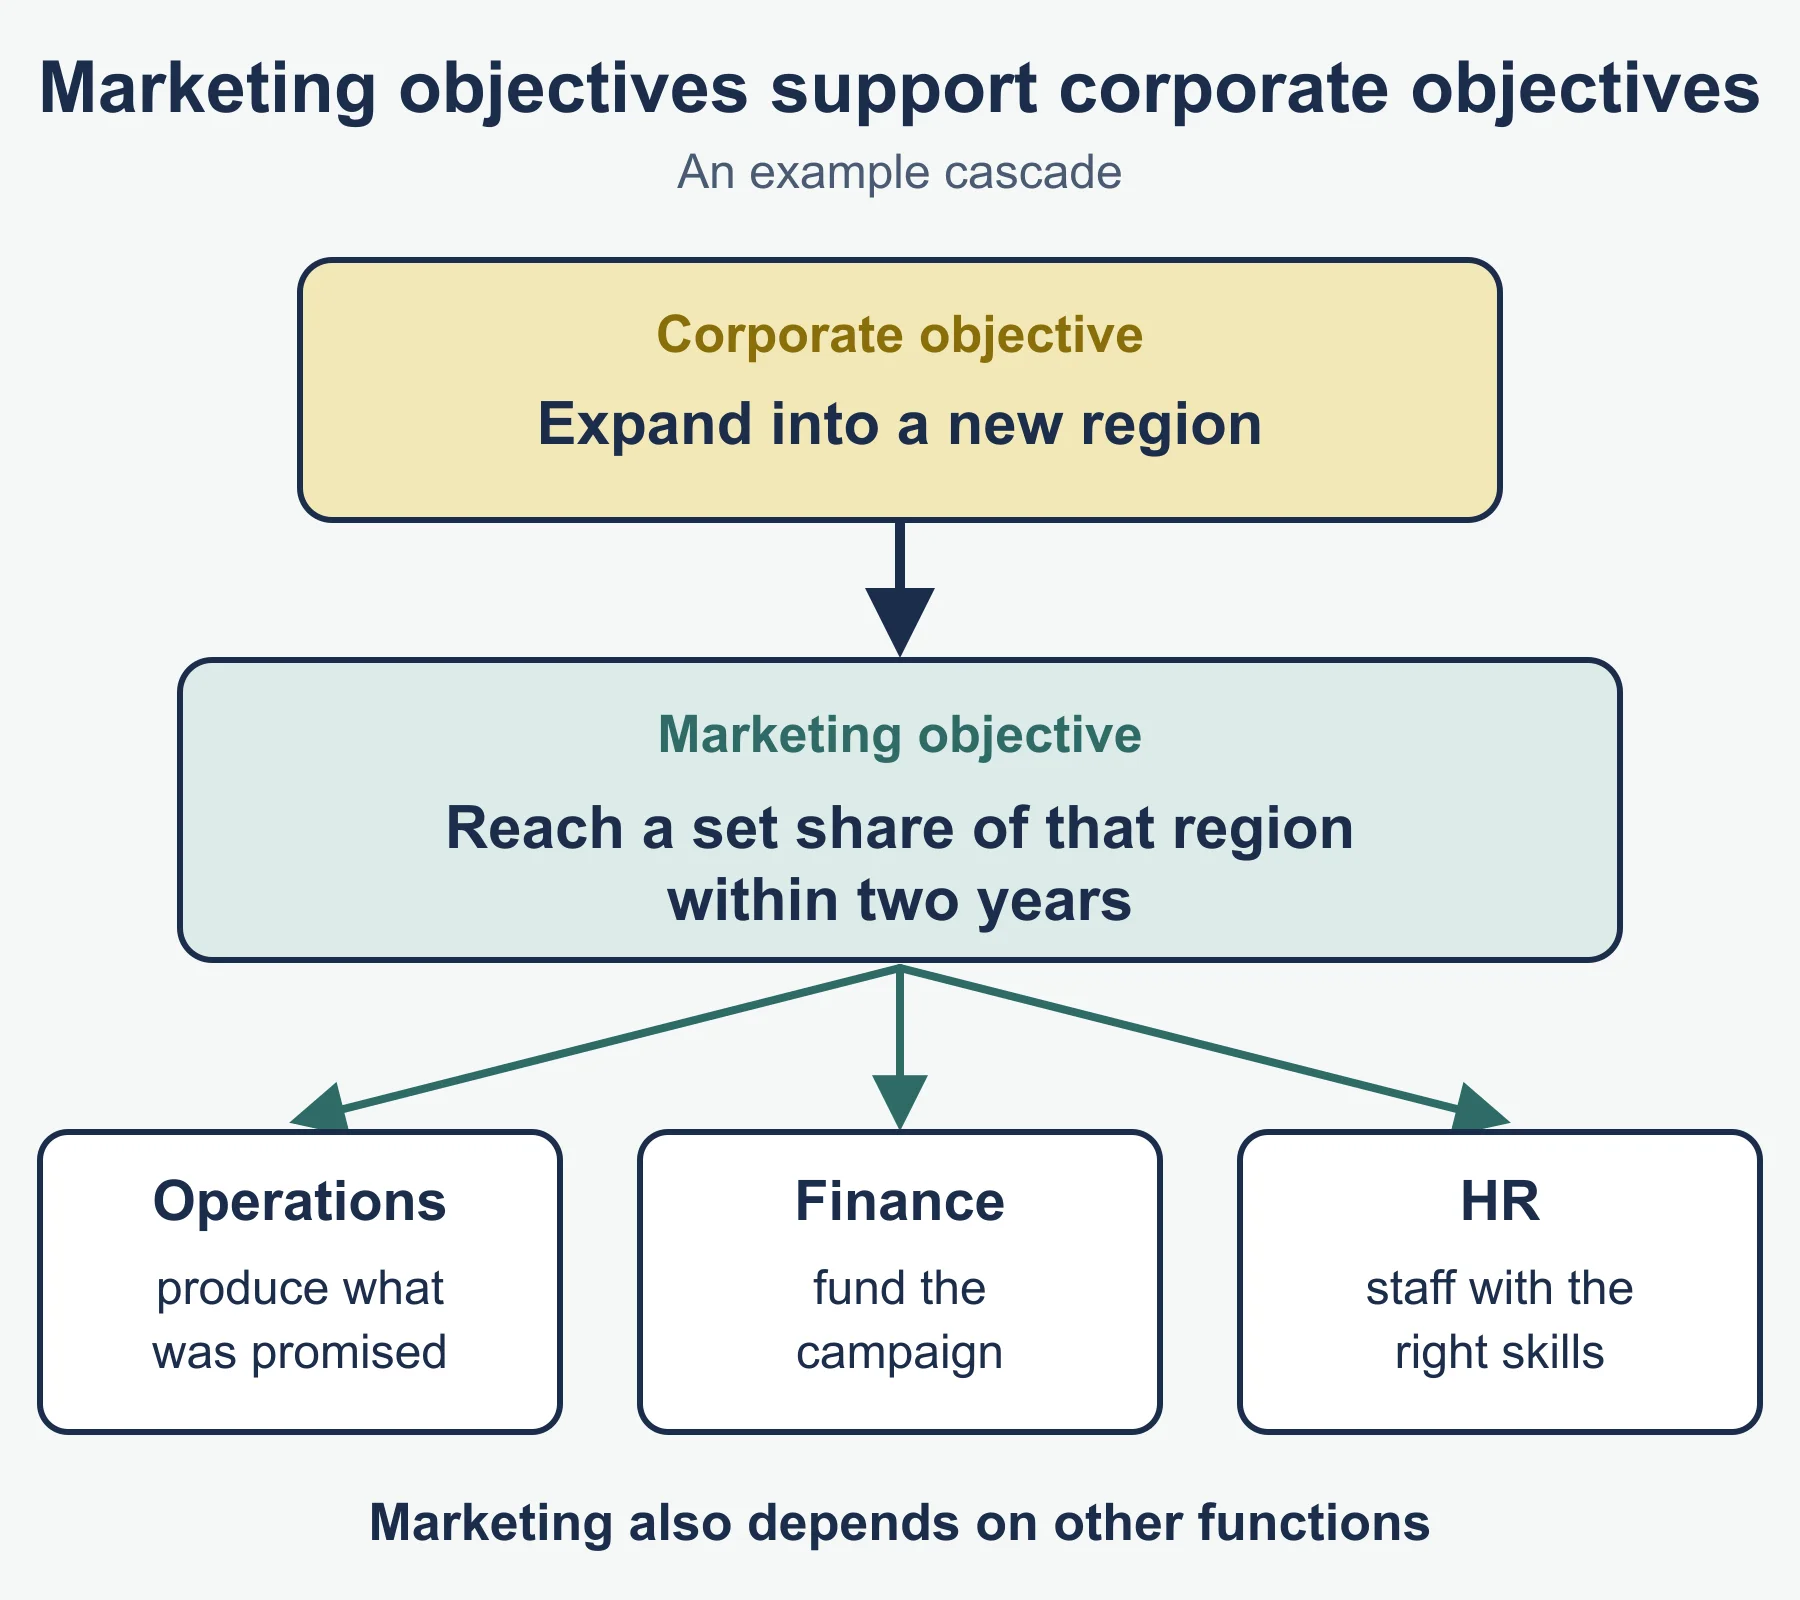
- Link: marketing objectives should be set so that reaching them helps achieve the corporate objective. If the corporate aim is growth in a new country, a marketing aim might be a set share of that country’s market.
- Marketing relies on other functions: operations (supply what is promised), finance (budget), human resources (skilled staff).
3.1.2 Demand and supply
| Demand | Supply | |
|---|---|---|
| Meaning | Quantity buyers are willing and able to buy at a price | Quantity sellers offer at a price |
| Influences | Price, income, substitutes and complements, tastes, advertising, population | Costs, technology, number of firms, expected profit, disruptions |
Method for any demand and supply question:
- Name the factor that has changed.
- Say whether it moves demand or supply, and in which direction.
- State the effect on equilibrium price and quantity.
- Link the result to the business in the question.
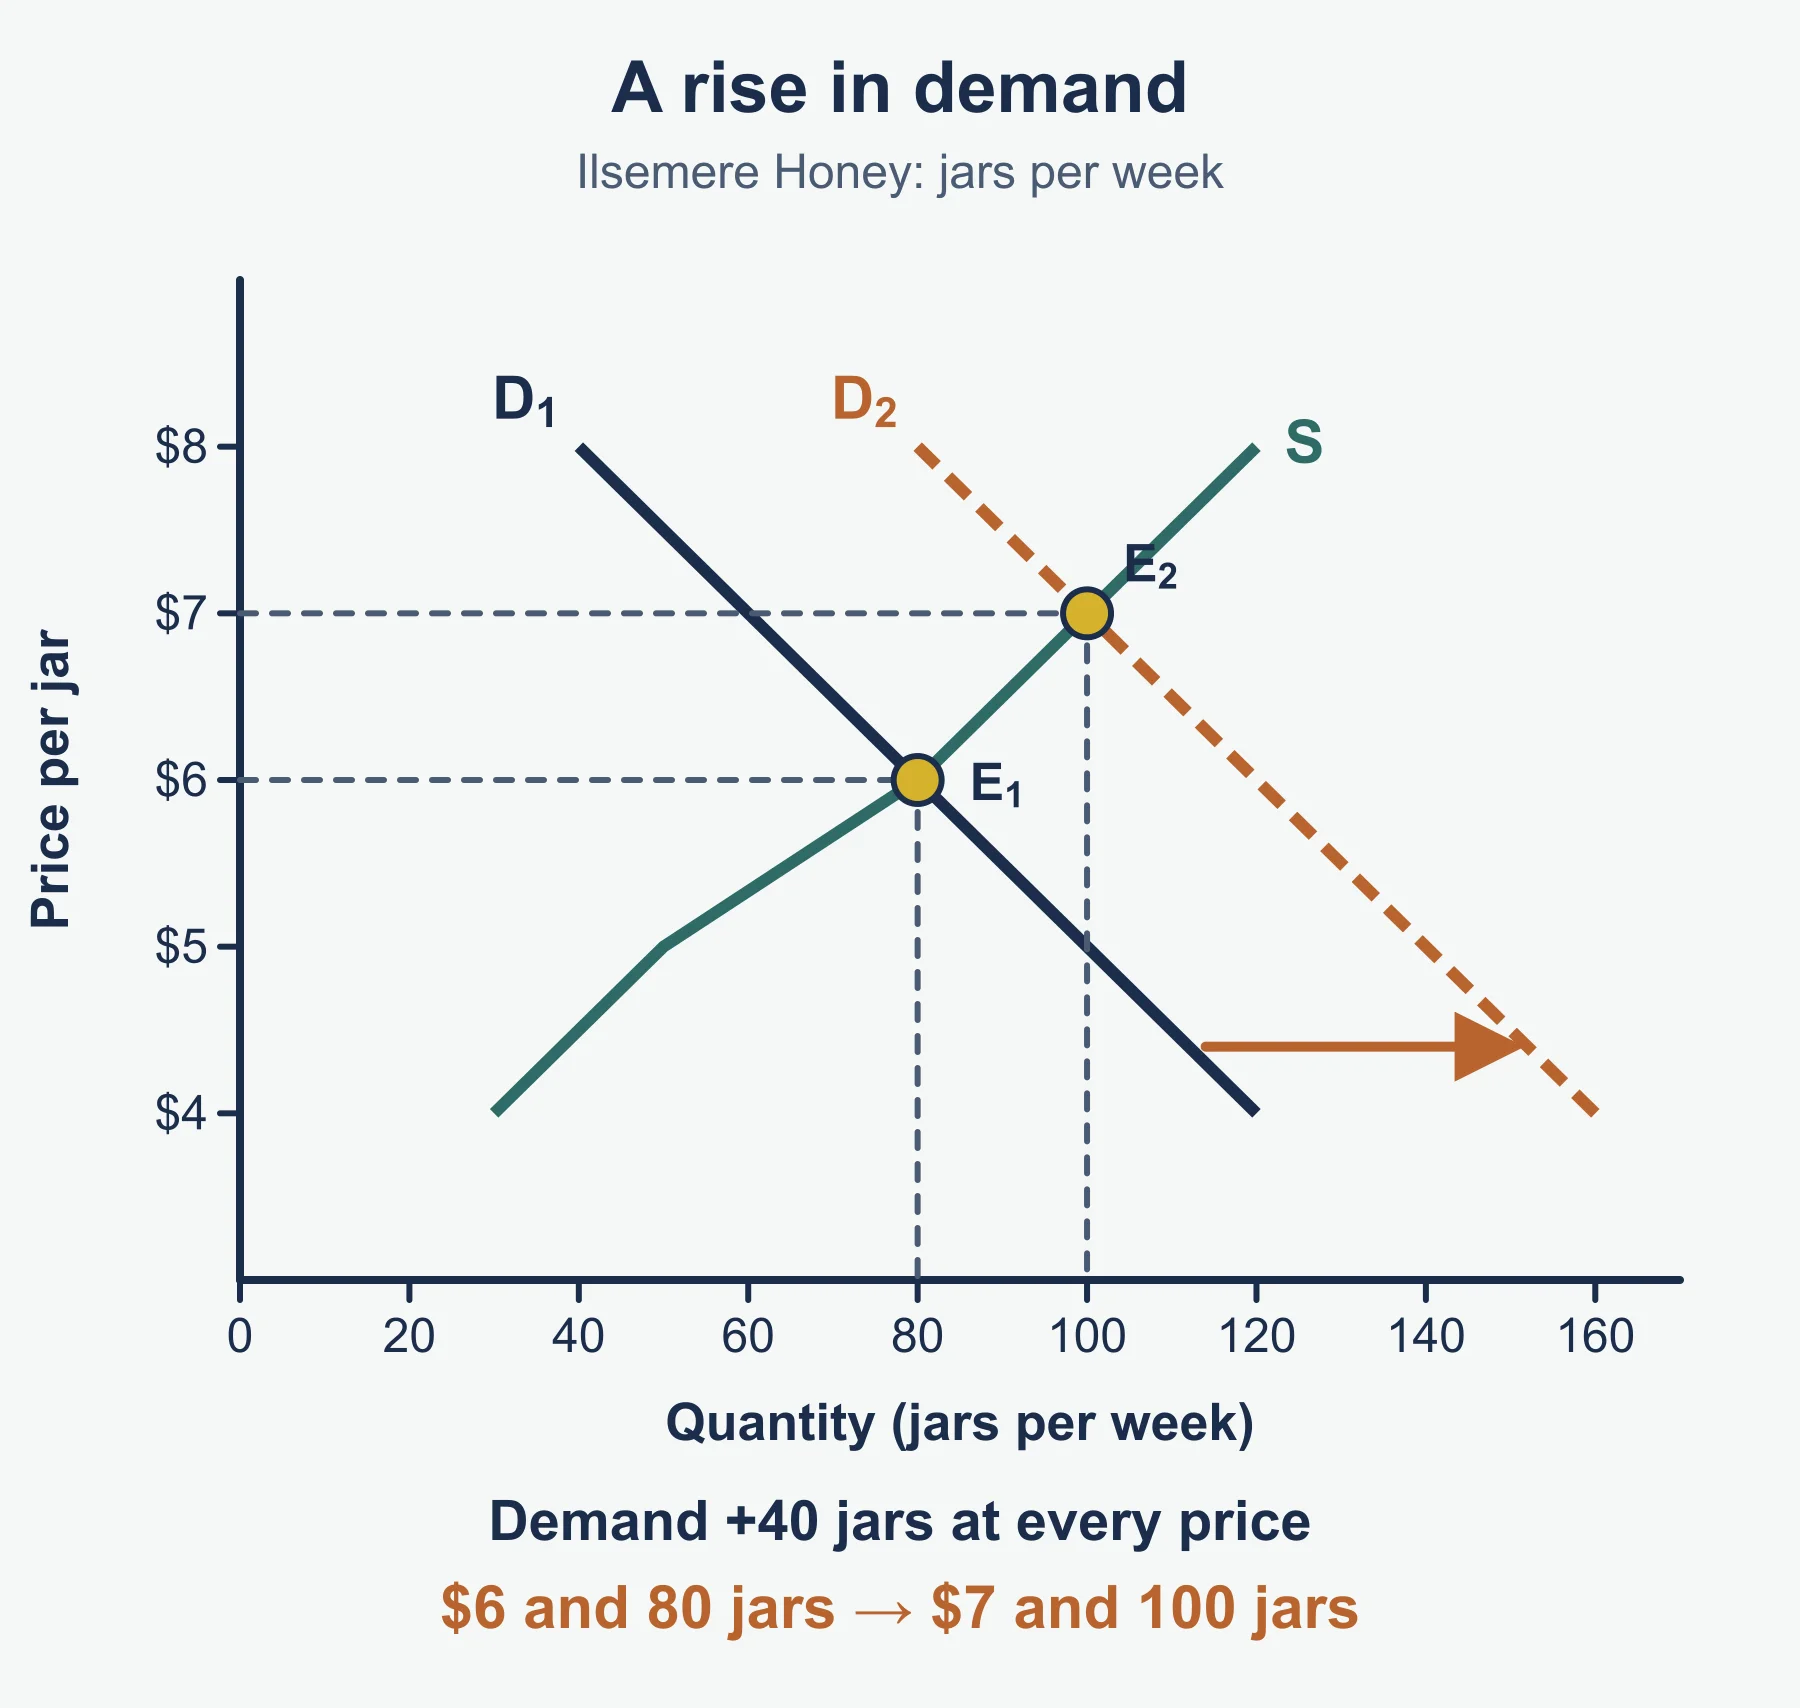
Shift summary: demand up gives higher price and higher quantity; demand down gives lower price and lower quantity; supply up gives lower price and higher quantity; supply down gives higher price and lower quantity.
Shortage (demand above supply) pushes price up. Surplus (supply above demand) pushes price down. Equilibrium is where they match.
3.1.3 Markets
| Distinction | Points |
|---|---|
| Consumer vs industrial market | Final users vs organisations buying to produce or operate |
| Local, national, international | Scale changes competitors, costs, regulation and tastes |
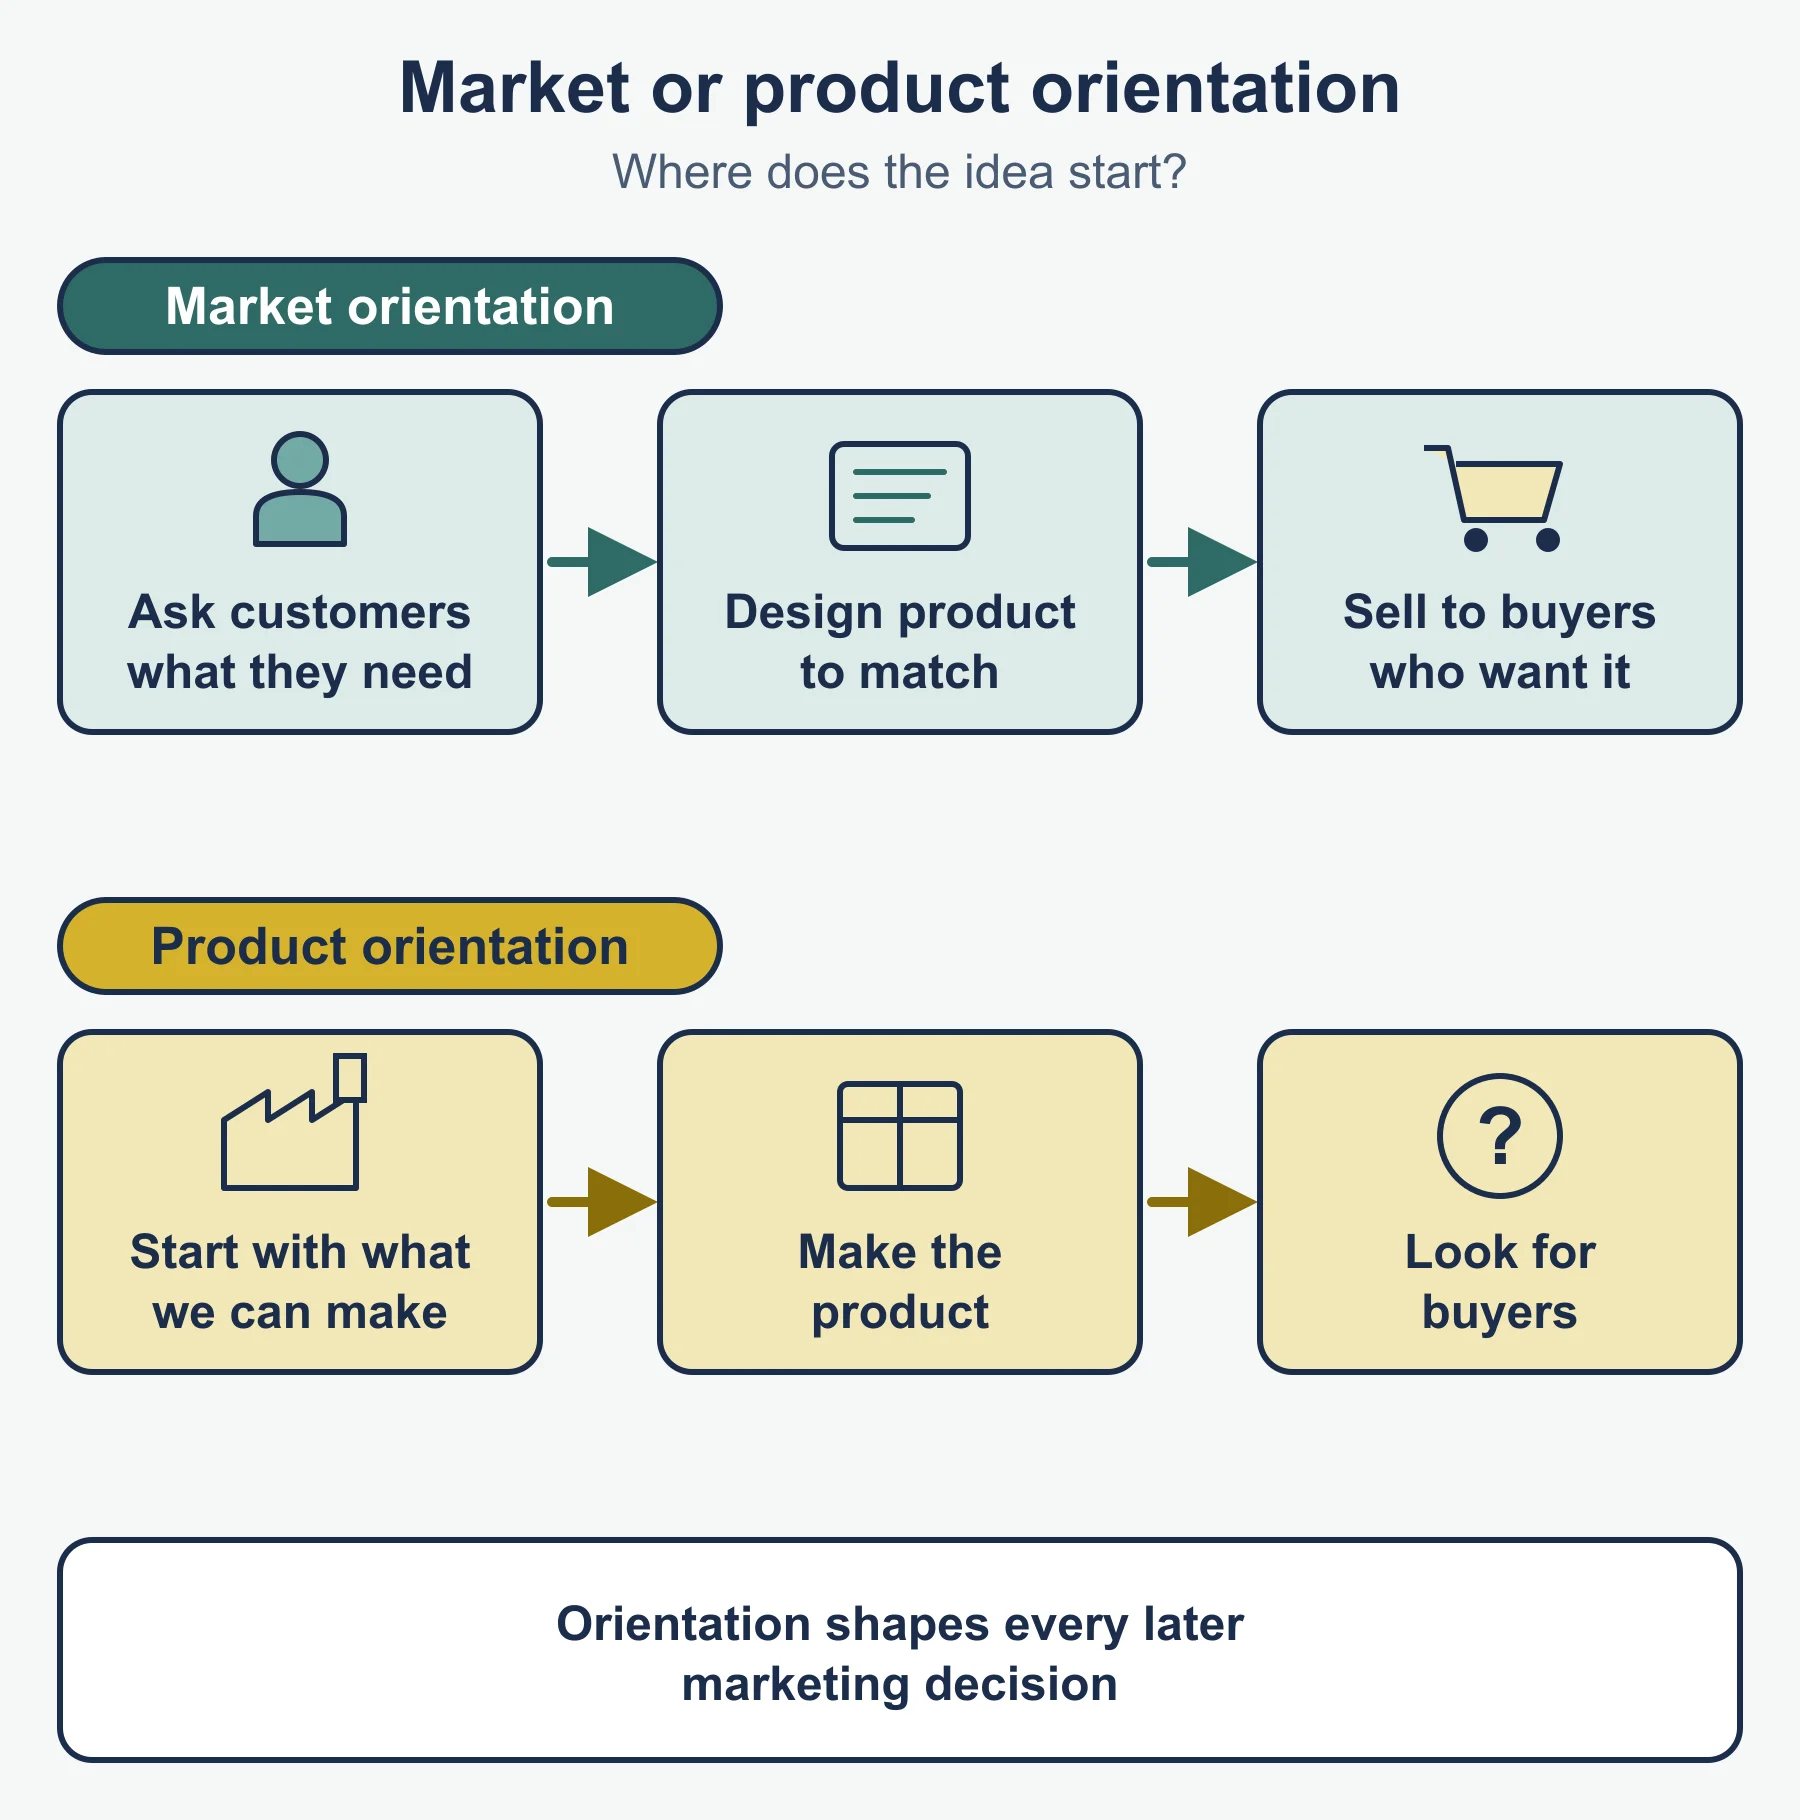
| Product orientation | Start with what the firm can make |
| Customer (market) orientation | Start with what customers want; needs research |
Standard-form formulas (the syllabus lists the measurements but does not print formulas):
| Measure | Formula |
|---|---|
| Market share | (firm’s sales / total market sales) x 100 |
| Market growth | (change in market sales / earlier market sales) x 100 |
| Firm’s sales growth | (change in firm’s sales / earlier firm’s sales) x 100 |
Worked reminder. Tarrowgate Tea sells 12.8 in a market worth 80.0 (both in millions of dollars). A year later it sells 14.4 in a market worth 86.4.
- Share: 12.8 / 80.0 = 16.0%, then 14.4 / 86.4 = 16.7% (1 d.p.)
- Market growth: 6.4 / 80.0 = 8.0%
- Firm growth: 1.6 / 12.8 = 12.5%
Implication: the firm grew faster than the market, so it gained share. If a firm’s growth is below the market’s, its share falls even when its sales rise. Falling share signals weaker competitiveness; slowing market growth warns of saturation and may push firms towards new segments or products.

3.1.4 Product classification, B2C and B2B
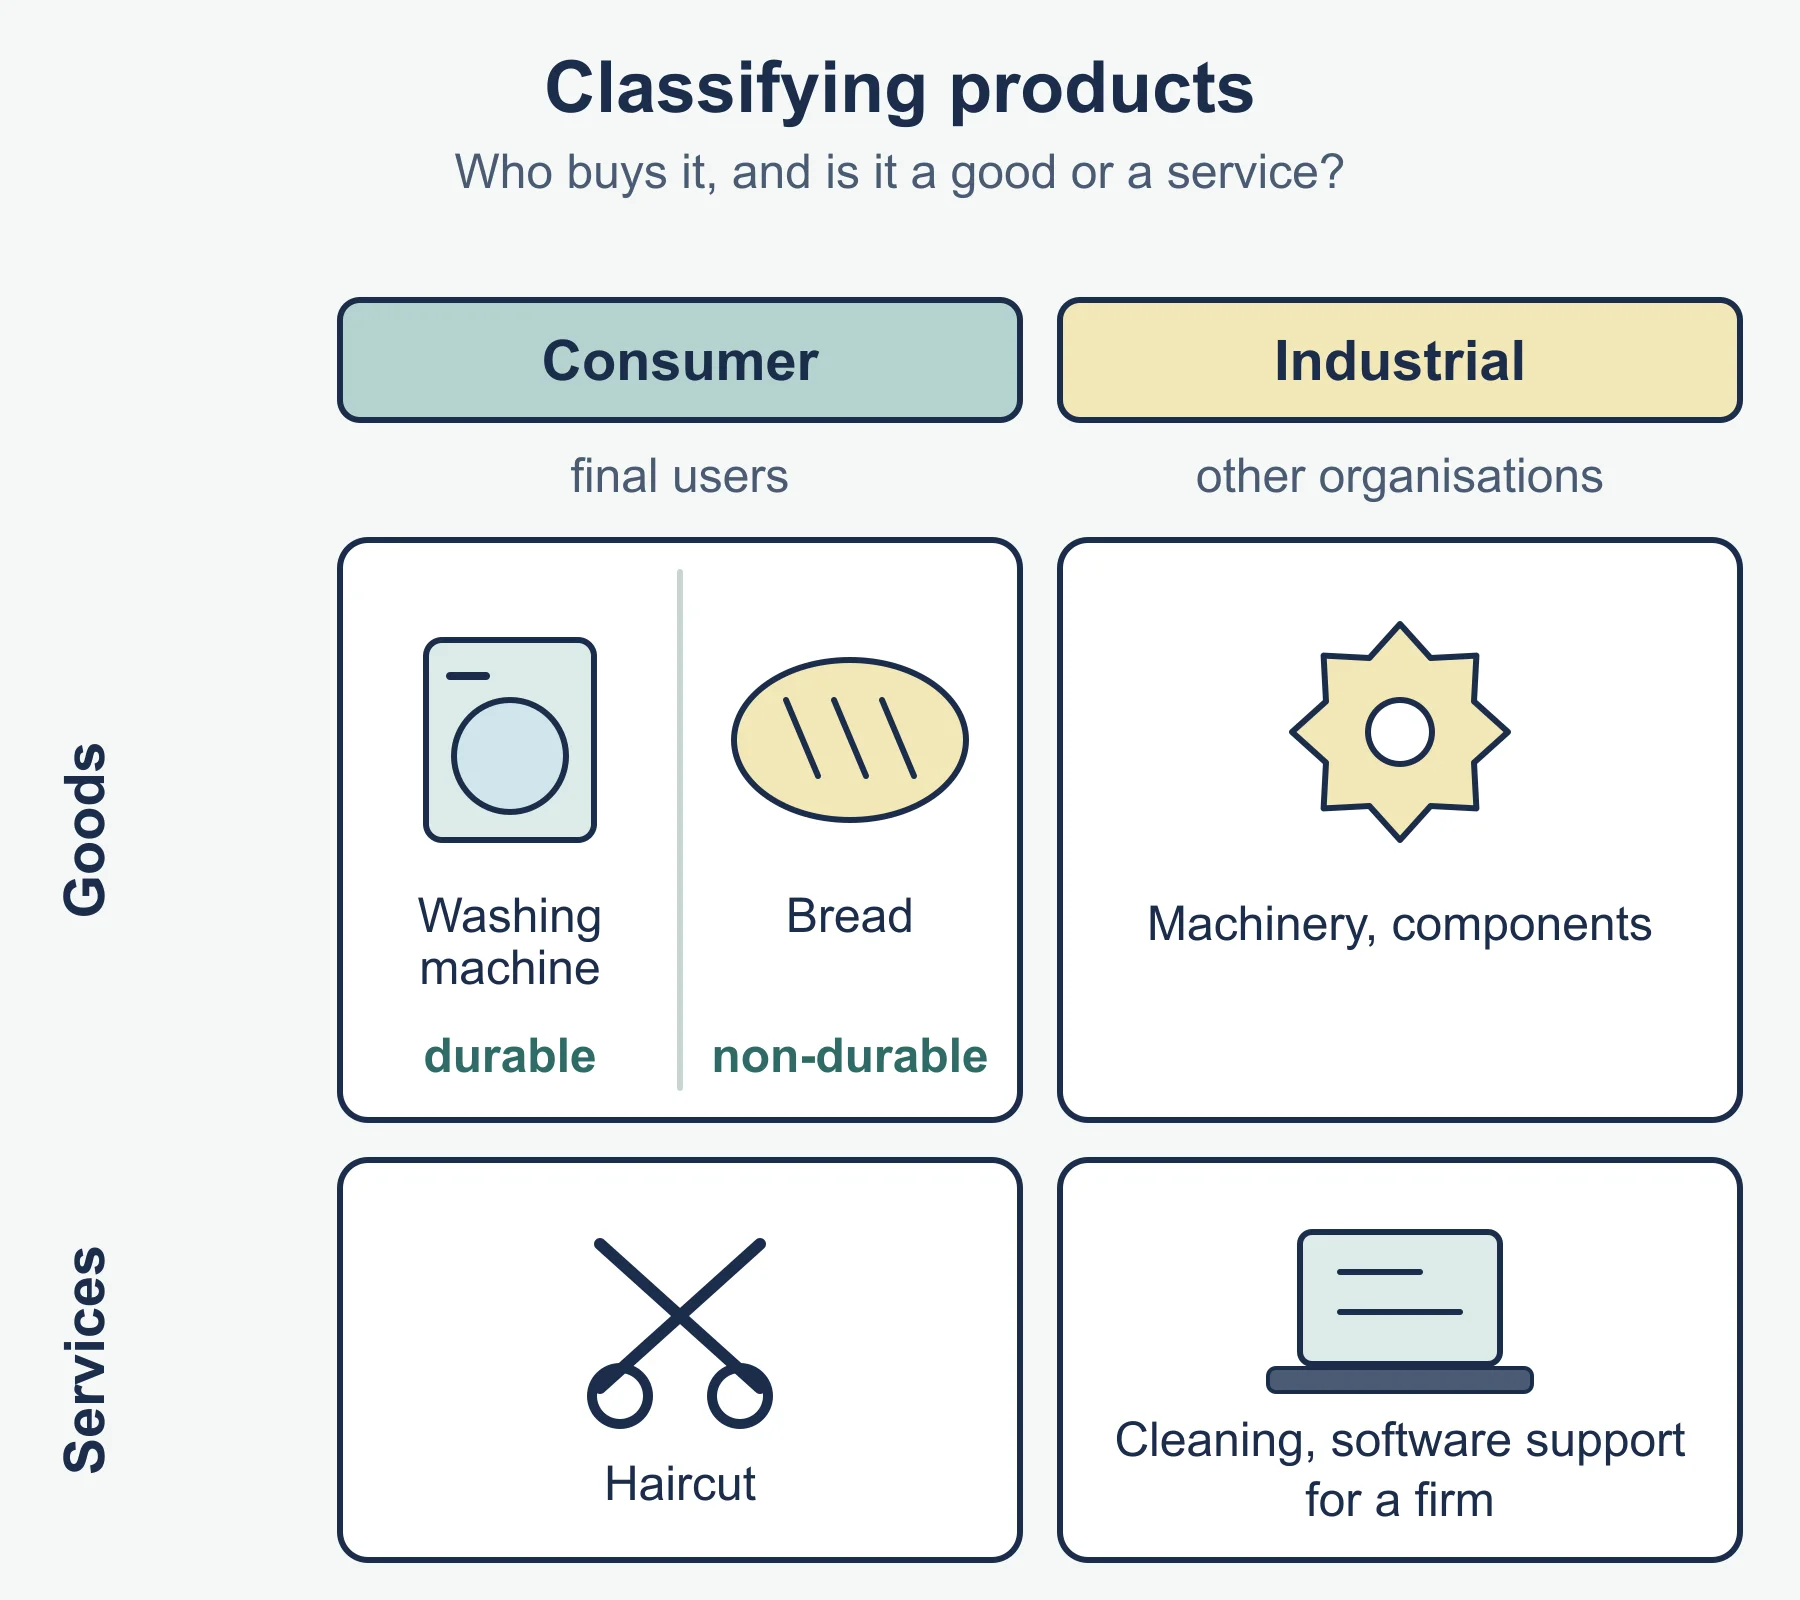
- Consumer goods: durable (a bicycle) and non-durable (milk).
- Consumer services: a dental check-up.
- Industrial goods: machines, components. Industrial services: payroll support for a firm.
- This is the standard classification; use examples to show you can apply it.
| B2C | B2B | |
|---|---|---|
| Buyers | Many individuals | Fewer, larger organisations |
| Promotion | Mass media, branding, social media | Sales teams, trade shows, direct contact |
| Price | Often fixed and public | Often negotiated, may be contract-based |
| Decision | Quick, personal, emotional | Slower, several people involved, technical |
| Relationship | Shorter, brand-led | Longer, service-led |
3.1.5 Mass and niche
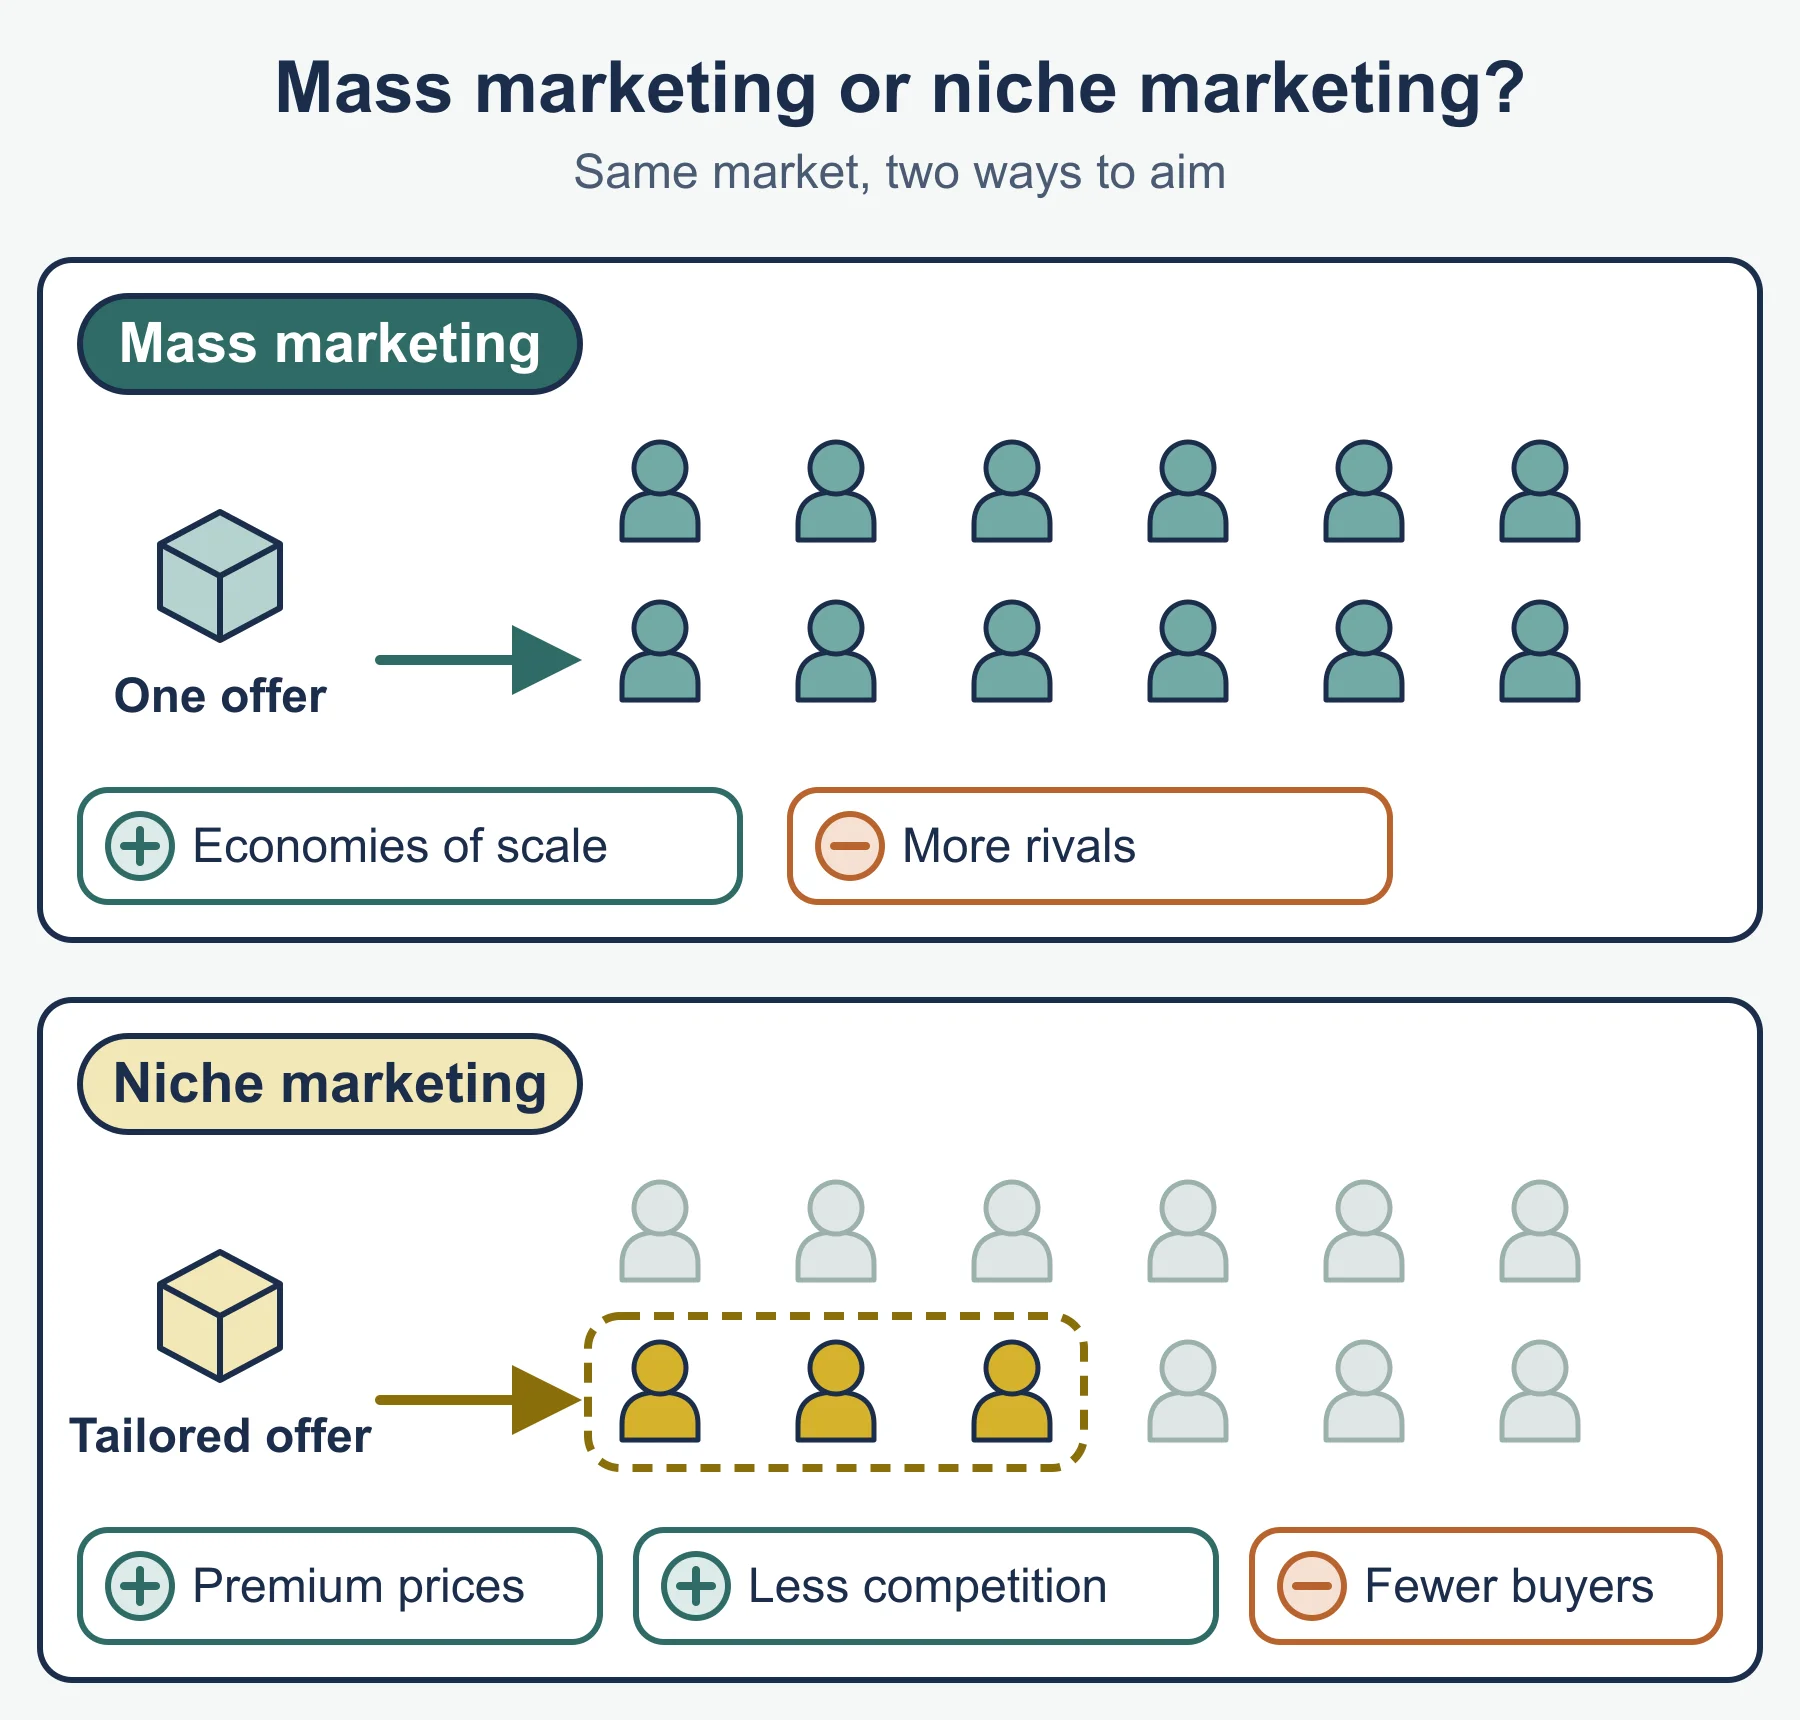
| Mass marketing | Niche marketing | |
|---|---|---|
| Market | Large, broad | Small, specialised |
| For | Volume, economies of scale, wide reach | Less competition, loyalty, premium prices possible |
| Against | Strong rivals, thin margins, costly promotion | Limited size, dependence, entry by large firms |
3.1.6 Segmentation
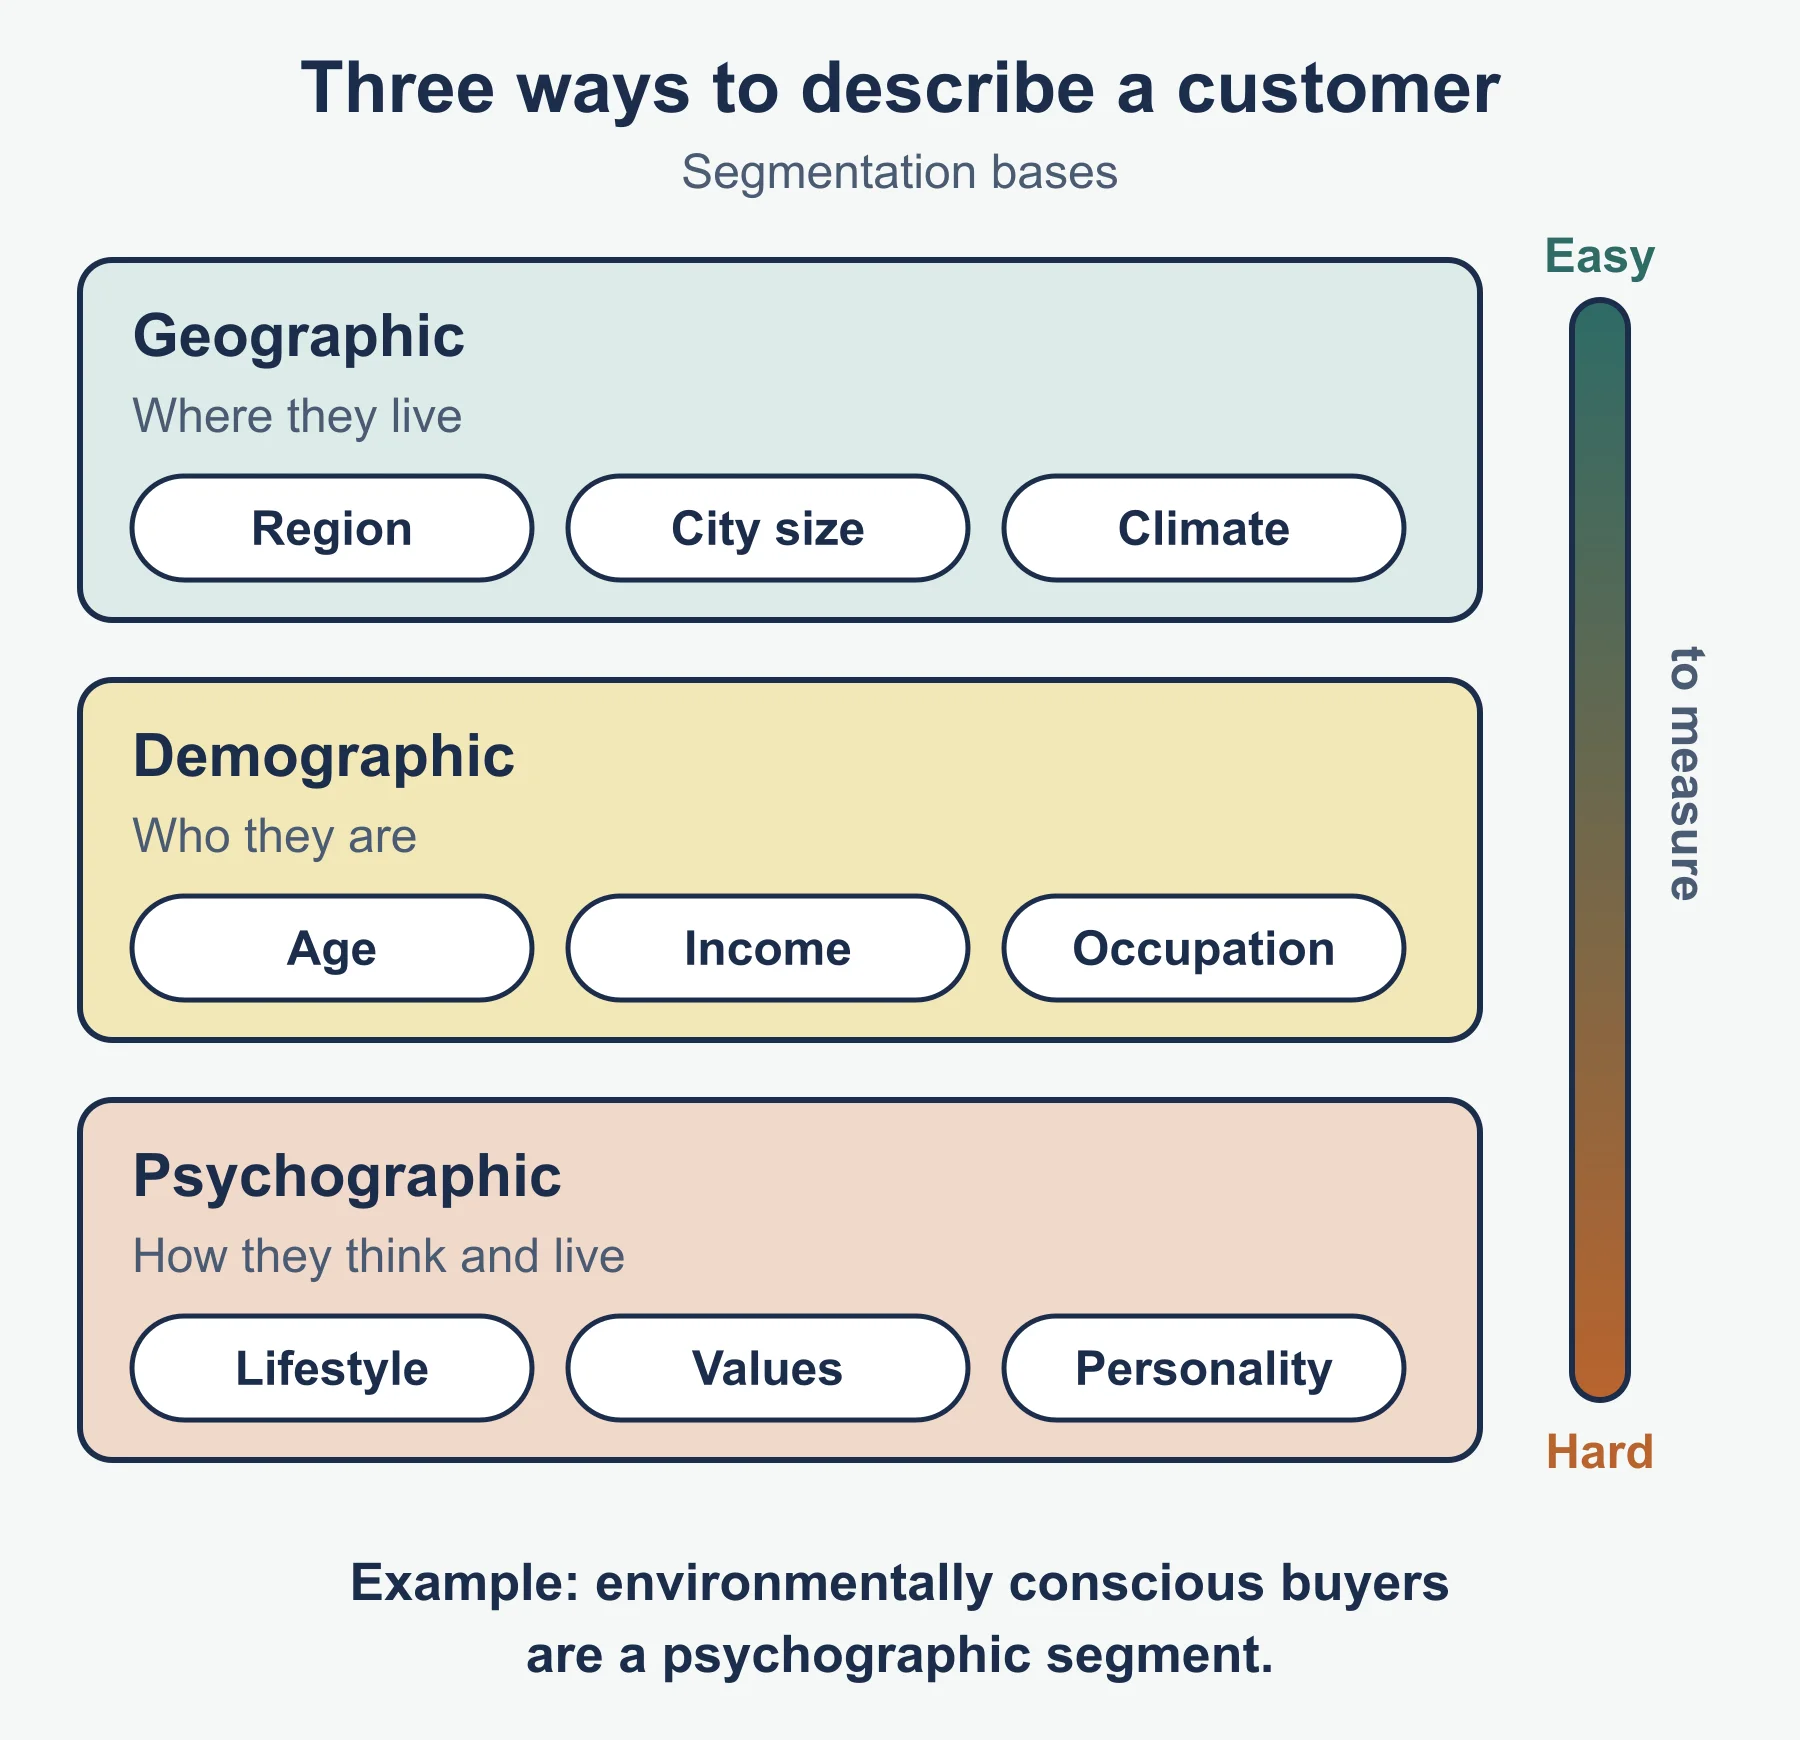
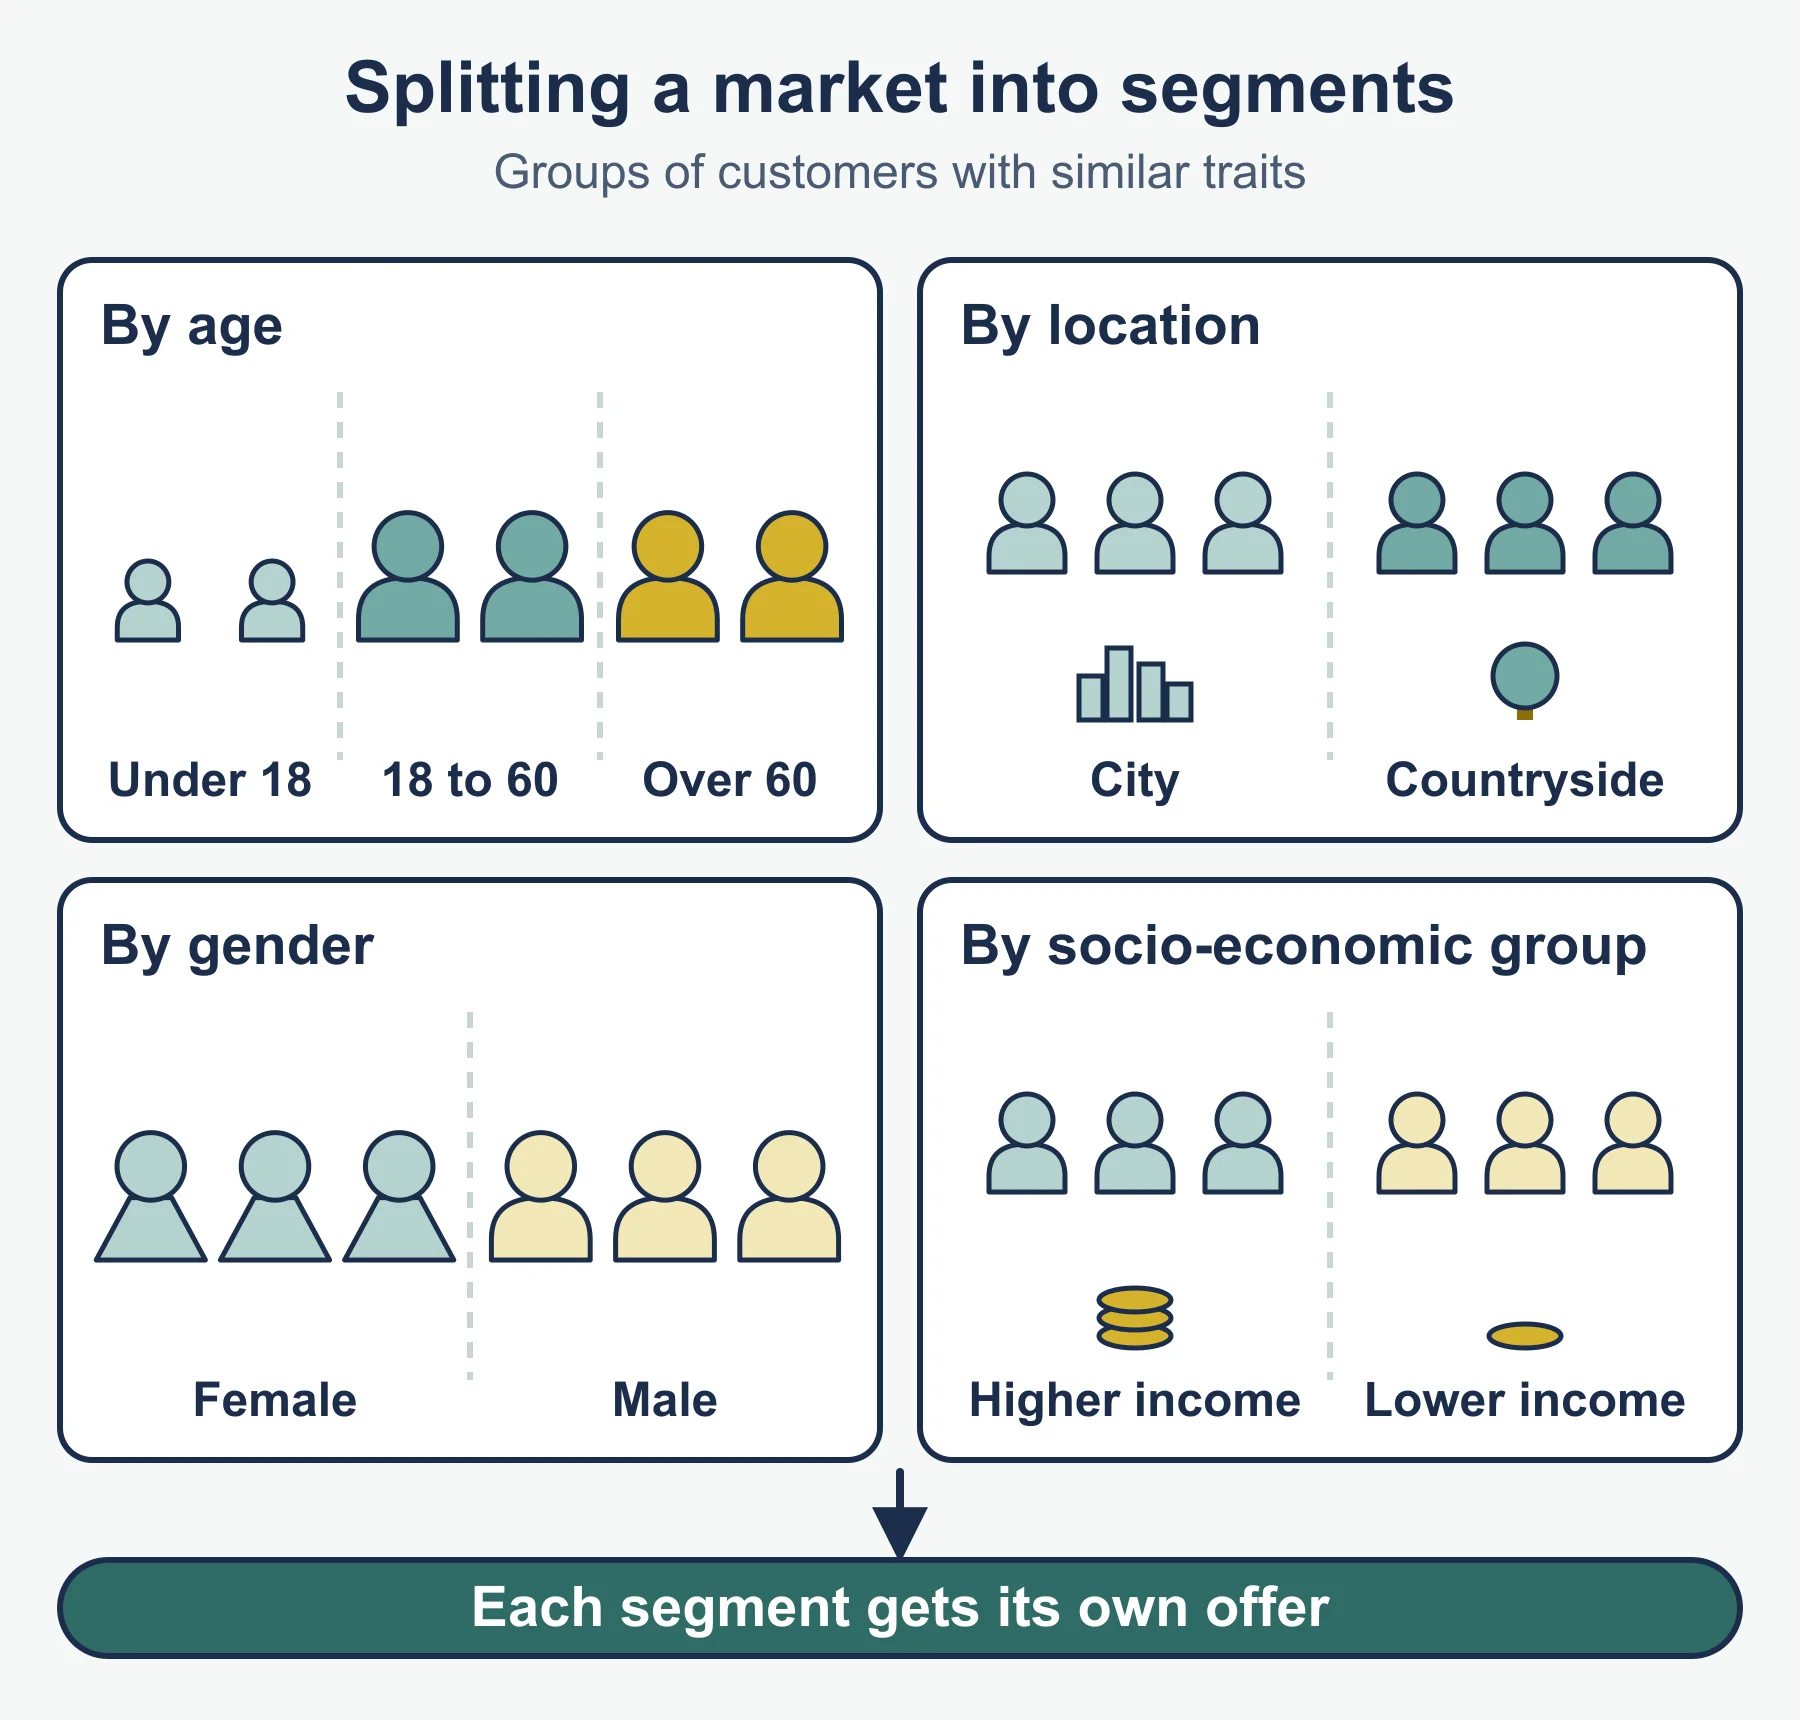
| Method | Based on | Example |
|---|---|---|
| Geographic | Location, climate, urban or rural | Different menu in a coastal region |
| Demographic | Age, gender, income, occupation, family size | Student discount card |
| Psychographic | Lifestyle, values, attitudes, personality | Ethically sourced range for conscious buyers |
- Advantages: better match to customers, less wasted promotion, gaps found, loyalty built.
- Disadvantages: higher research and promotion costs, shorter production runs, segments hard to measure, segment may be too small.
- Psychographic data is usually the hardest to collect and measure.
3.1.7 CRM
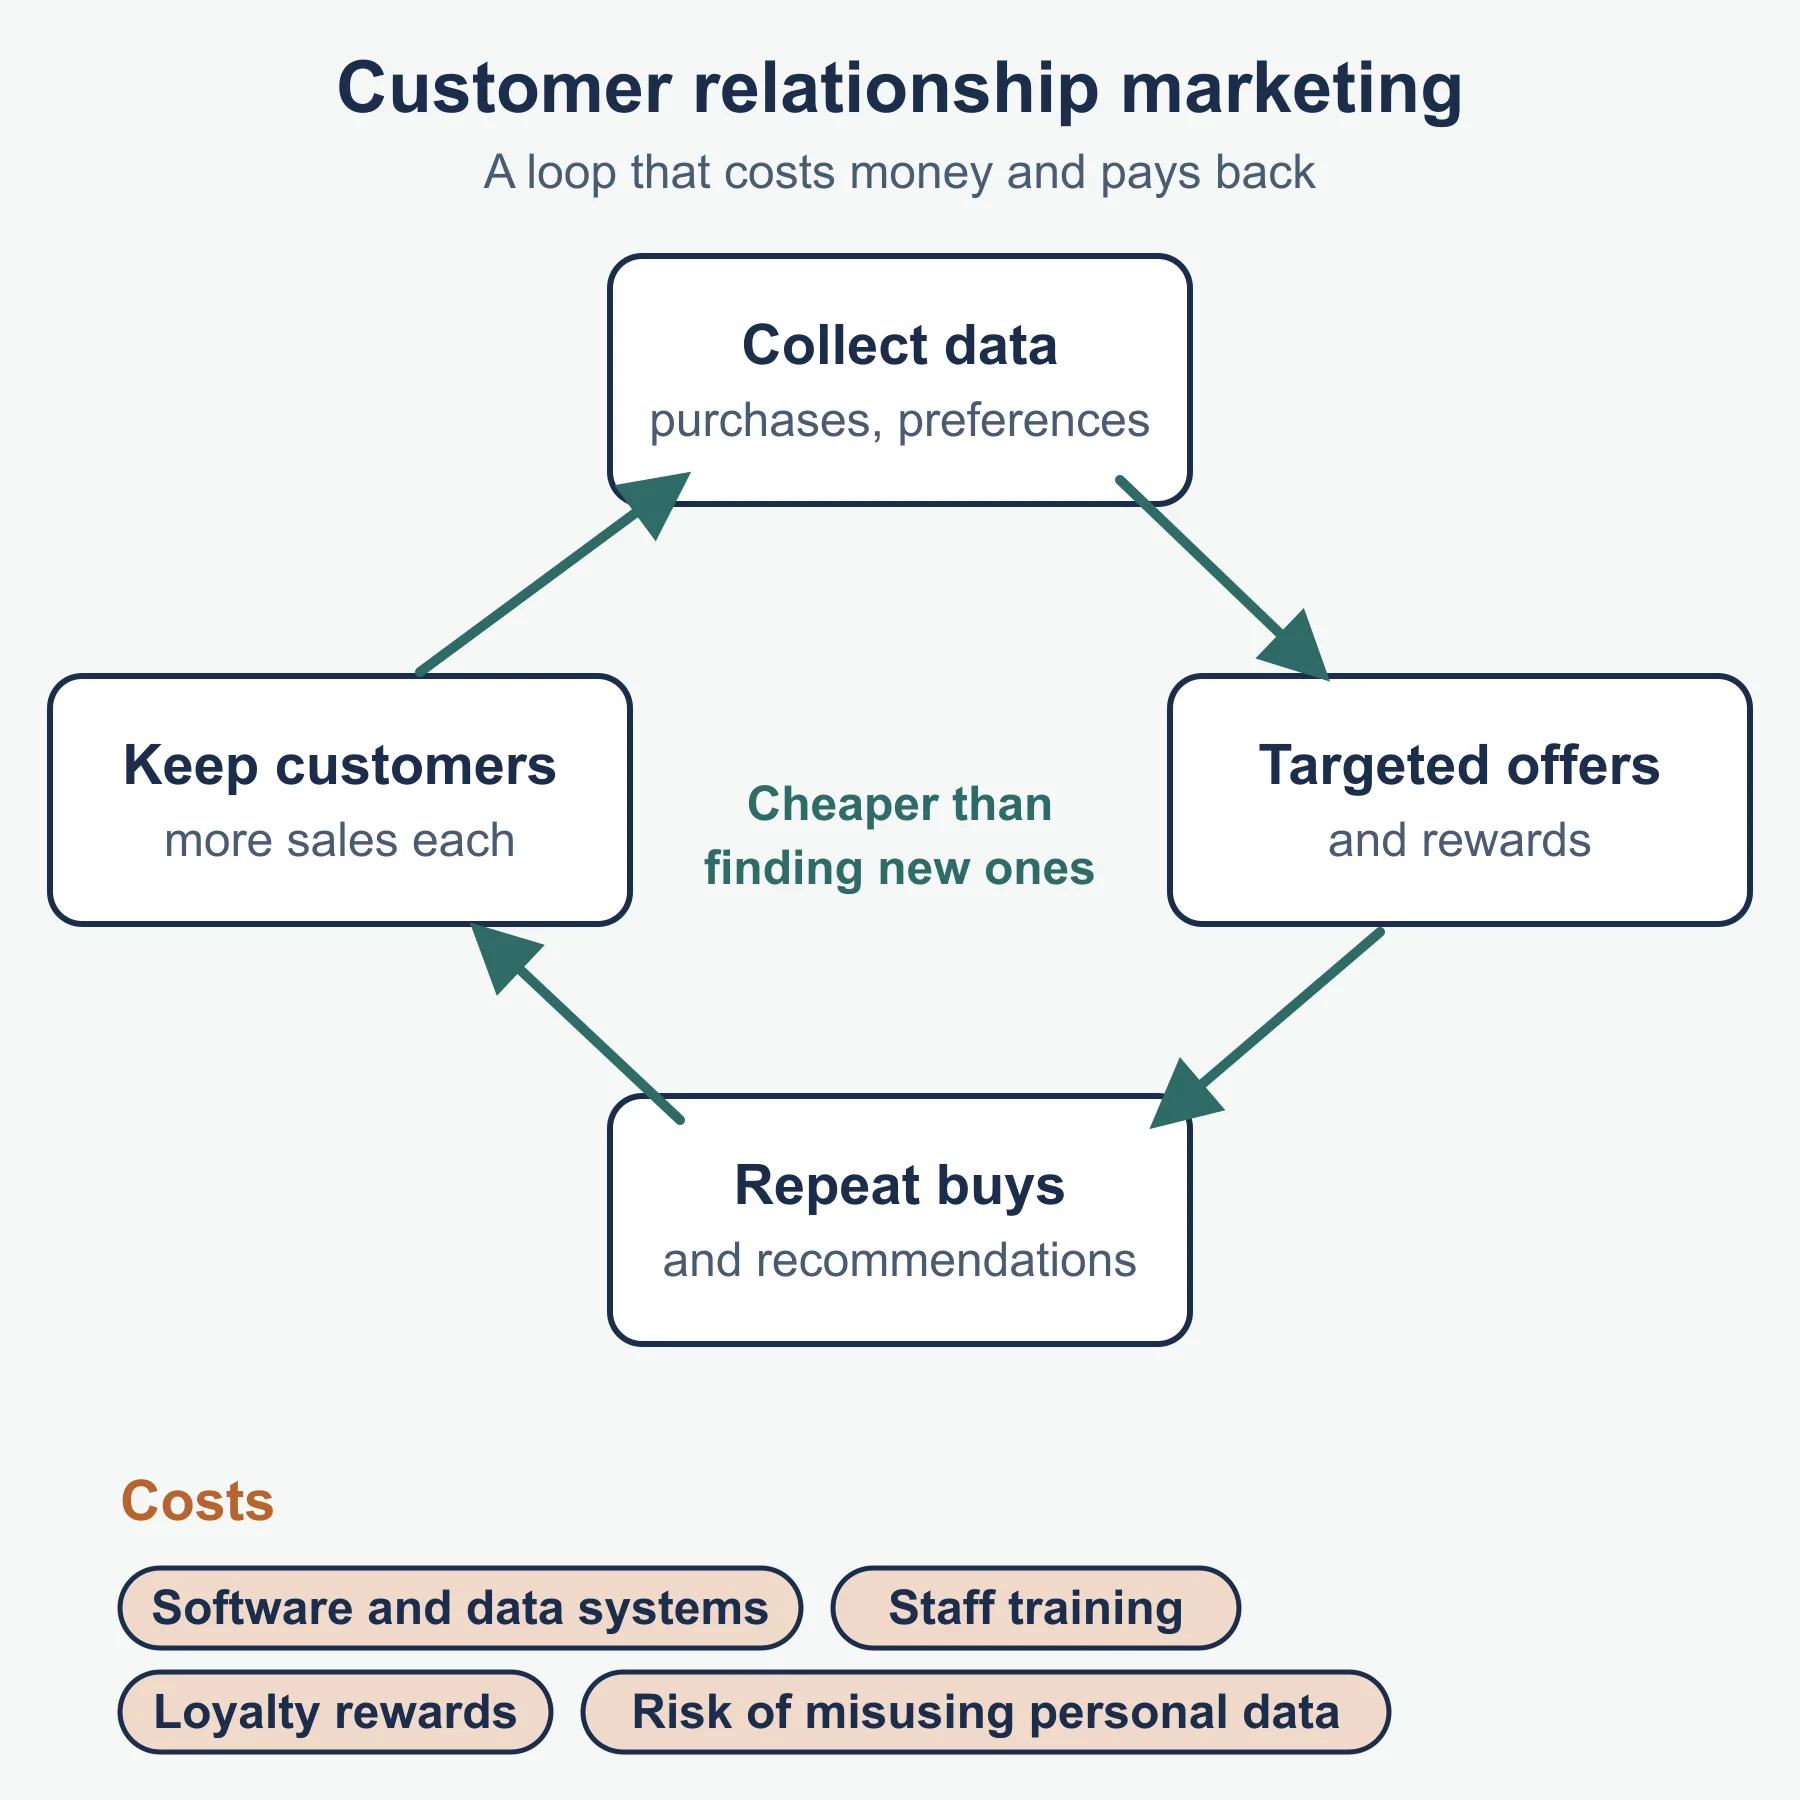
- Aims: keep customers, increase repeat purchases, learn about wants, encourage recommendations.
- Costs: systems and software, training, loyalty rewards, data protection risks.
- Benefits: retention, more sales per customer, targeted offers, cheaper than winning new customers.
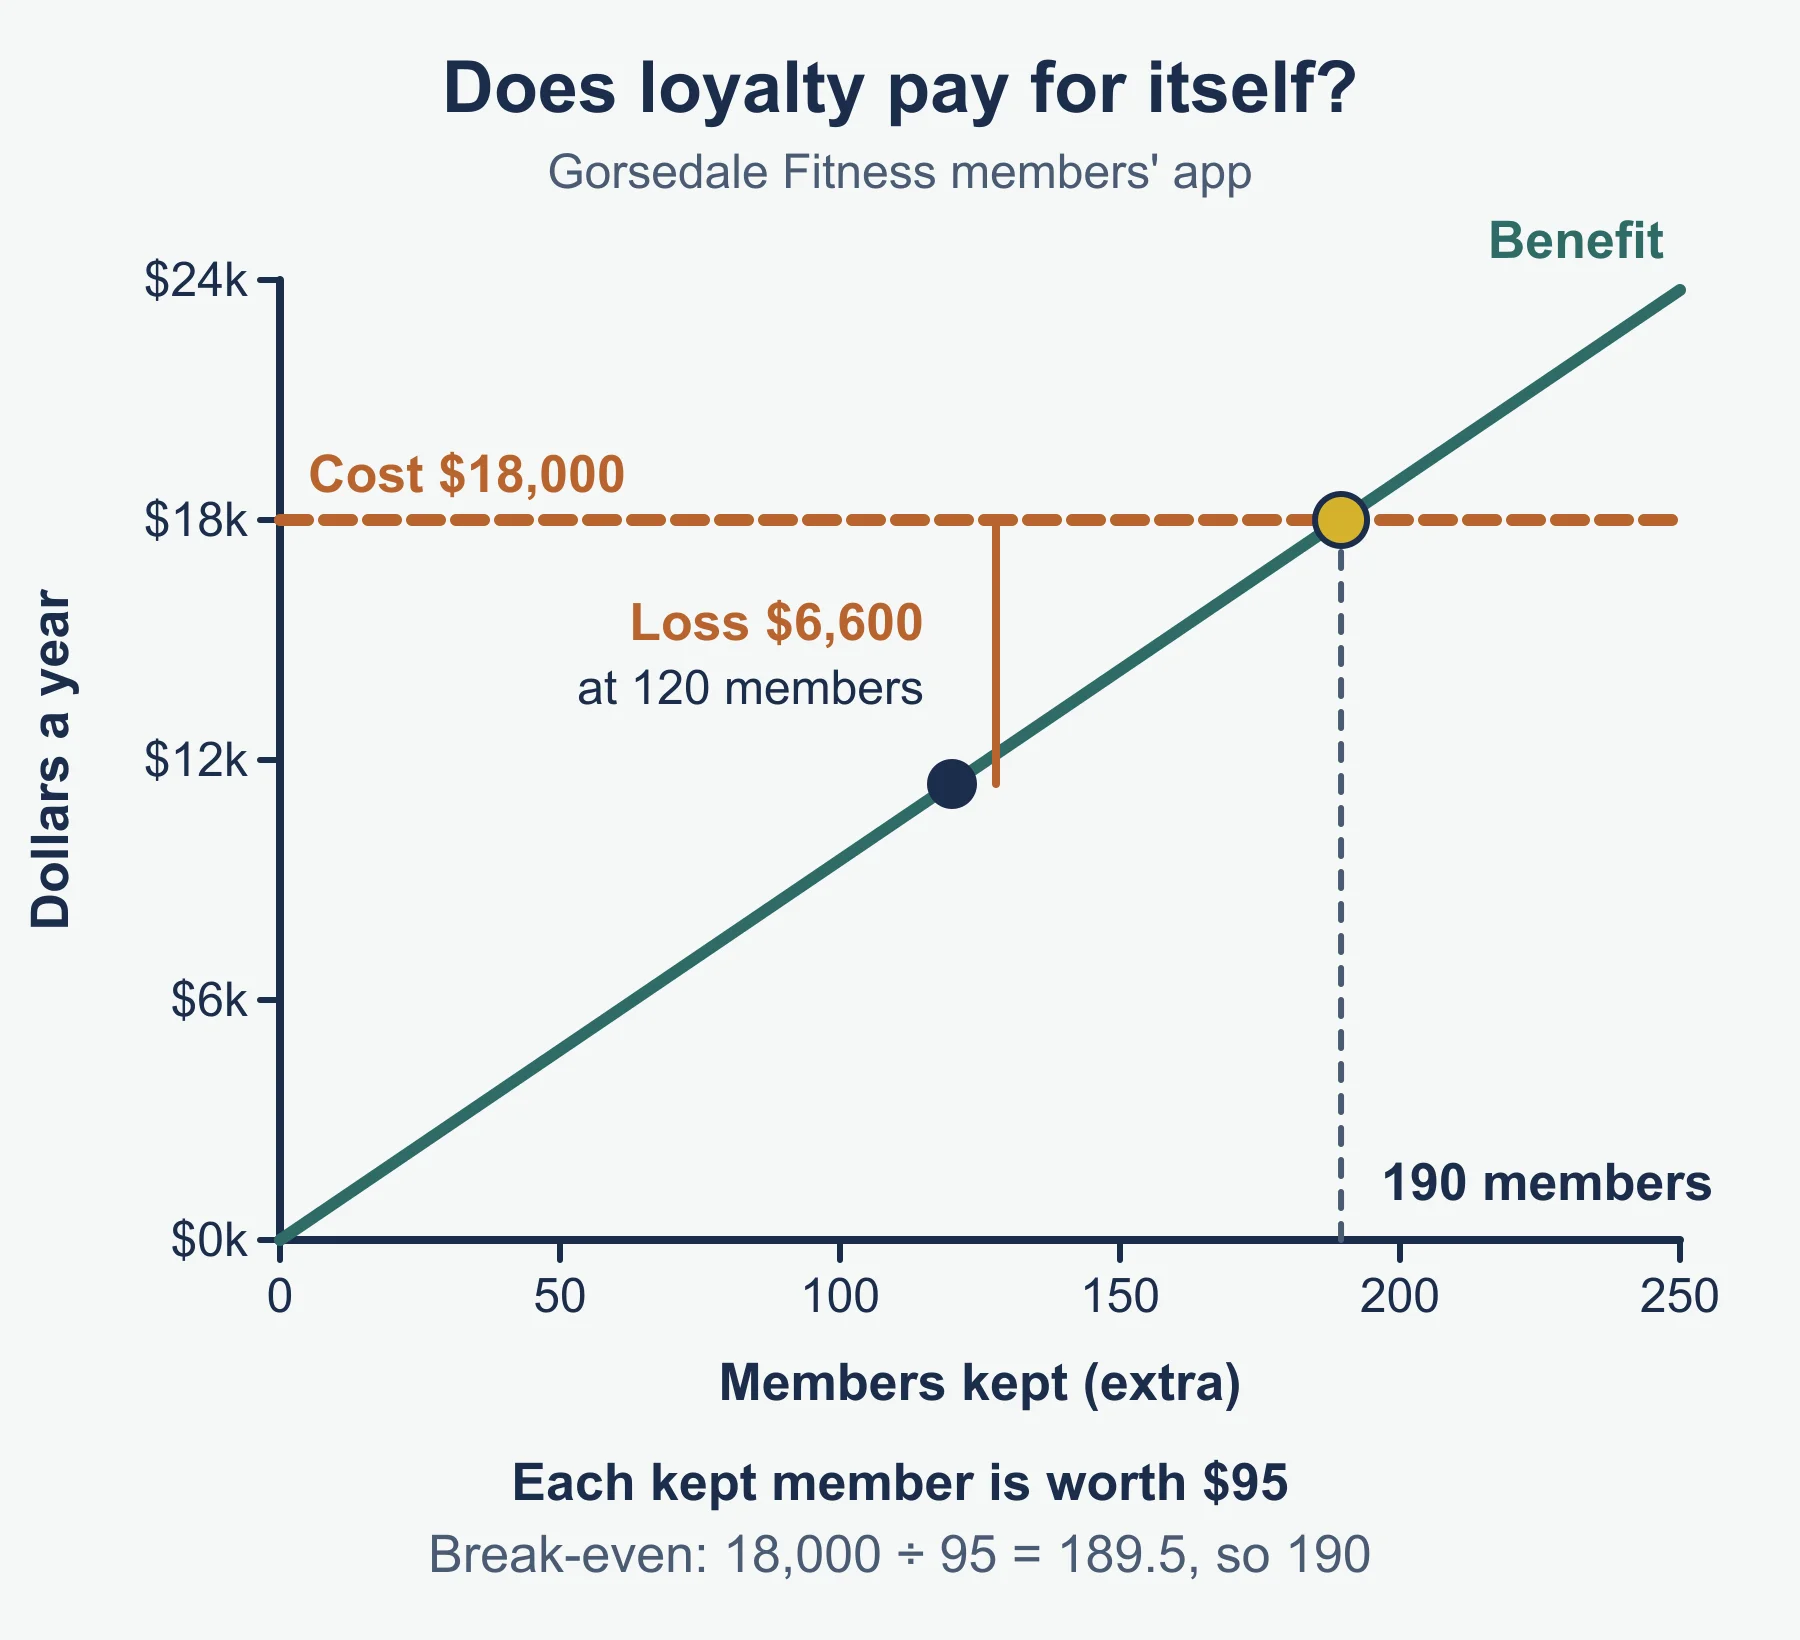
- Cost-benefit check: if a scheme costs 9,000 a year and each retained customer is worth 60 of contribution, it breaks even at 9,000 / 60 = 150 retained customers.
3.2.1 Purposes of research
- Market features: size, growth, competitors.
- Customers: characteristics, profiles, wants and needs.
- Result: lower risk when launching or changing a product.
3.2.2 Primary and secondary
| Primary | Secondary | |
|---|---|---|
| Data | New, collected first-hand | Already exists |
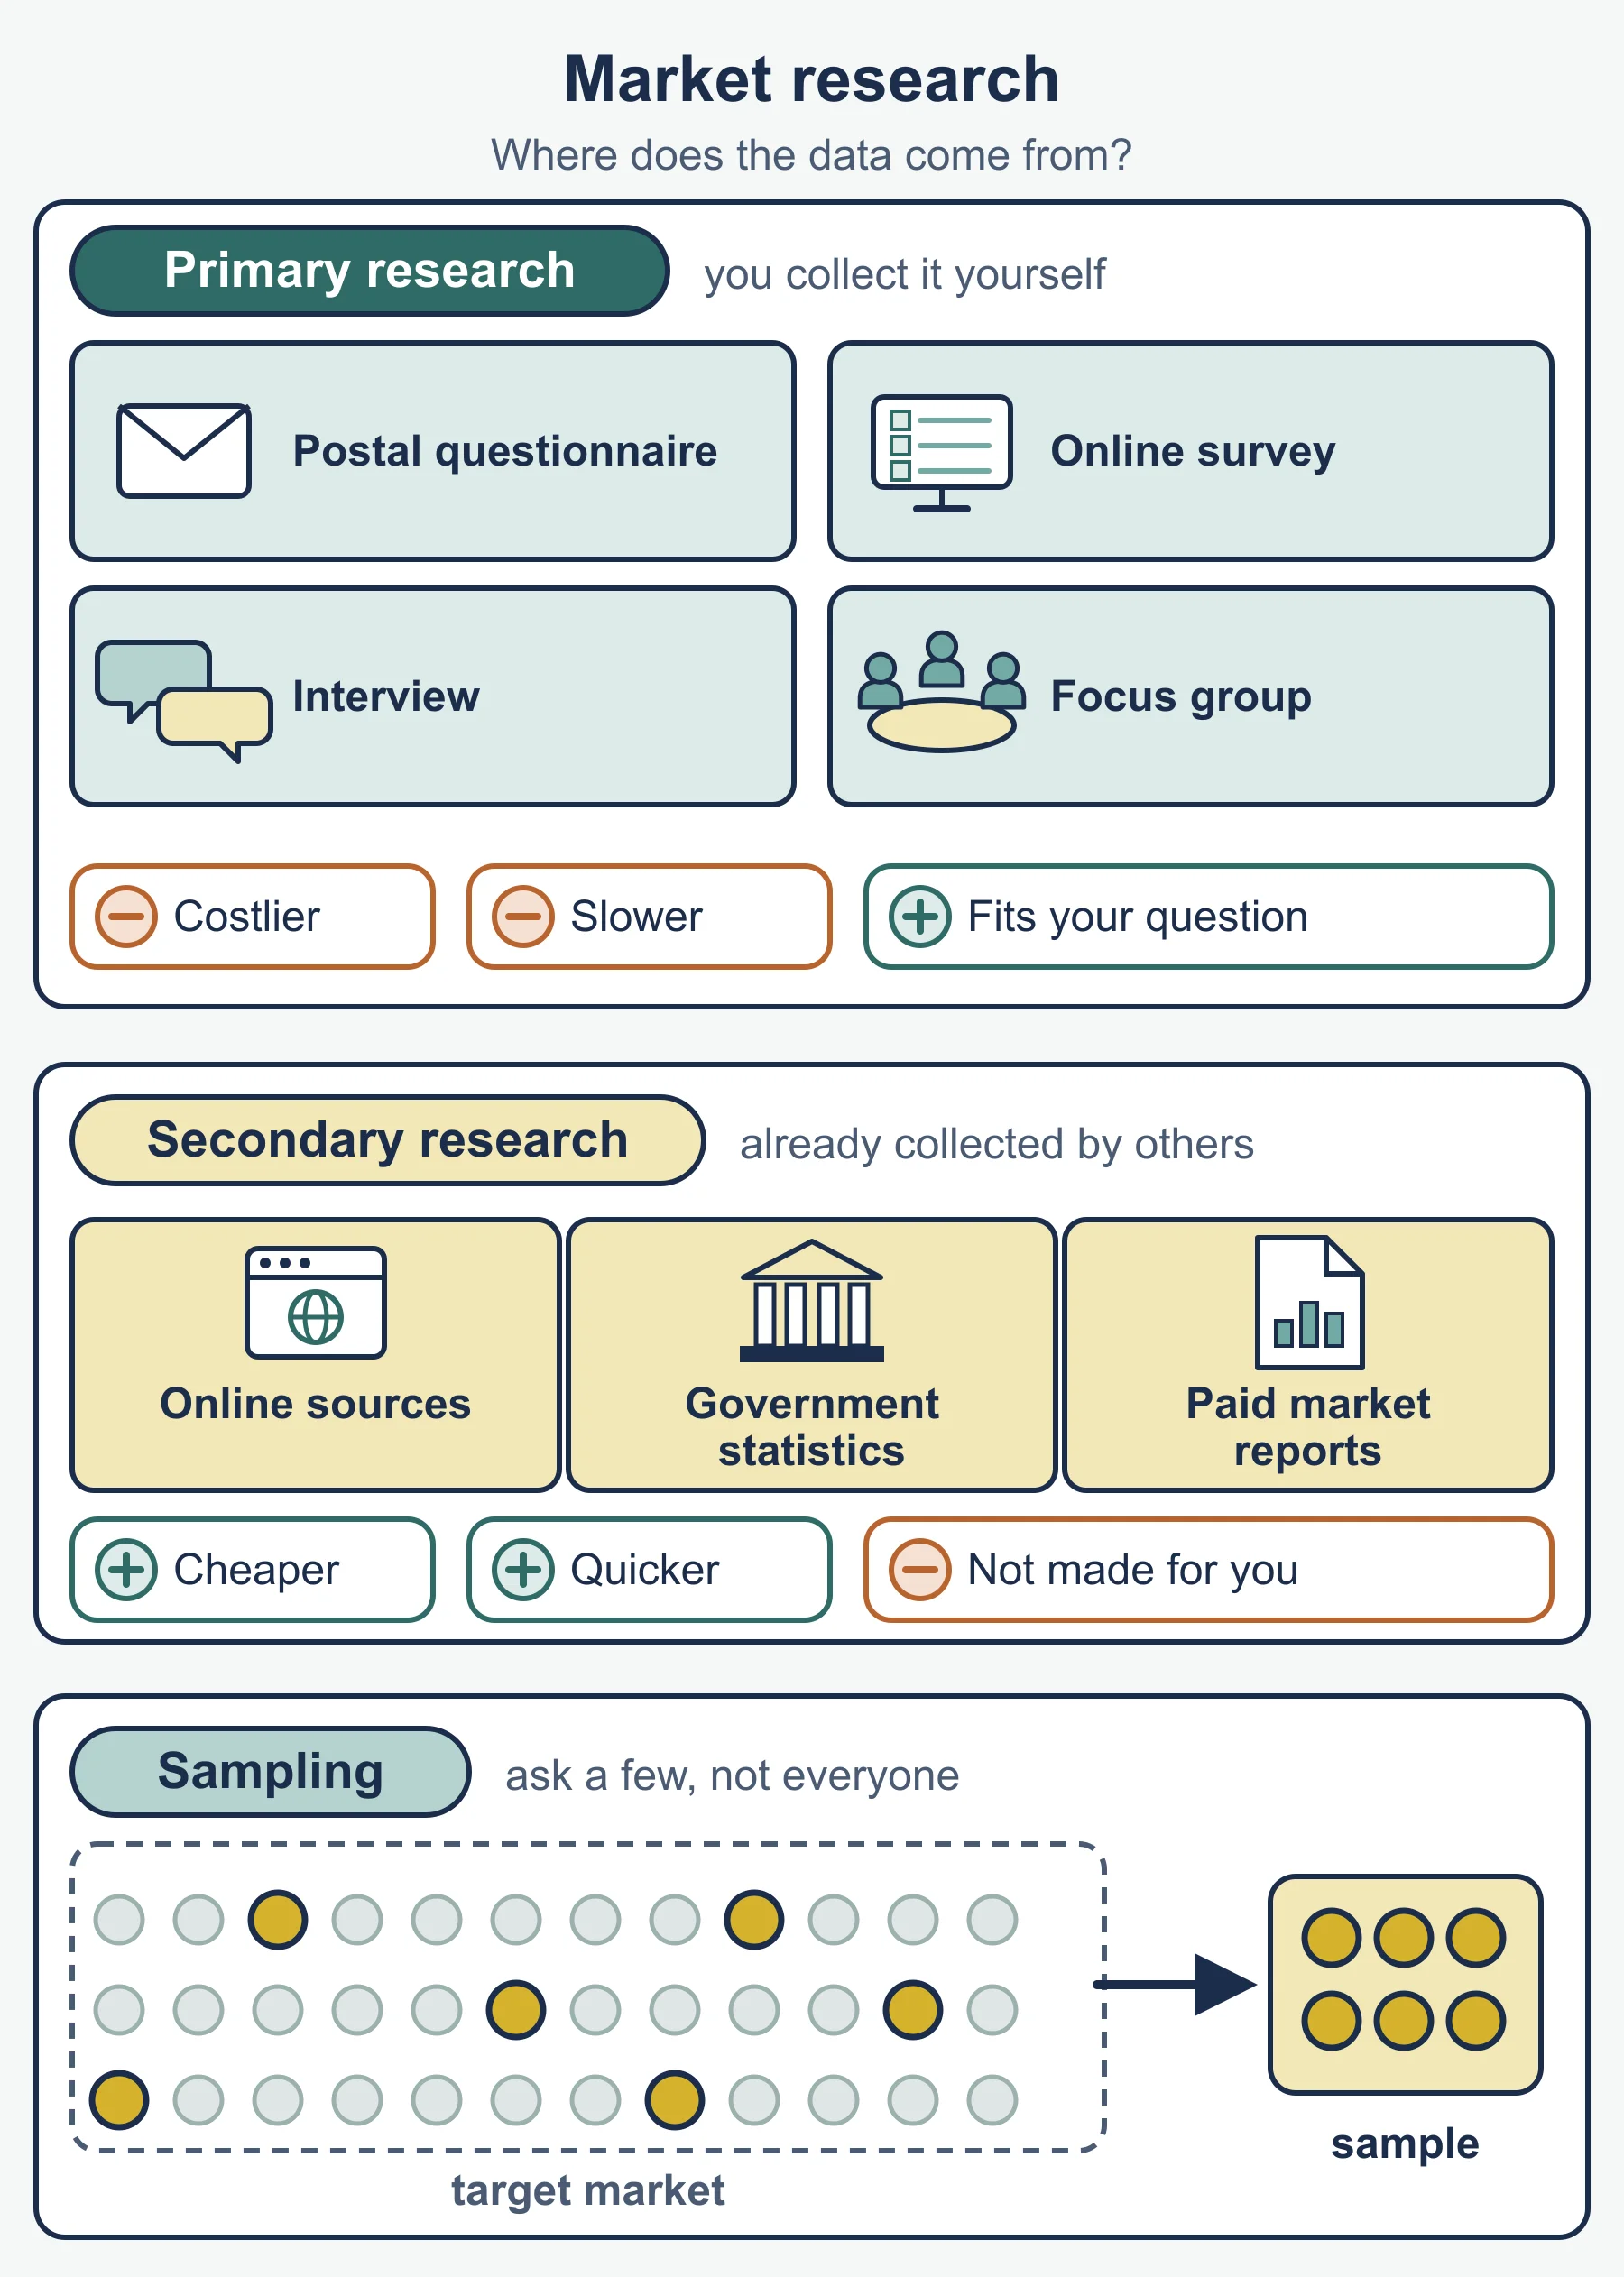
| Methods | Surveys, interviews, focus groups, observation, trials | Government statistics, trade reports, competitors’ accounts, internal sales records |
| Strengths | Specific, current, confidential | Fast, cheap, wide coverage |
| Weaknesses | Slow, costly | May be dated, not designed for the question, available to rivals |
Say which type a source is, then explain its usefulness for the decision in the question.
3.2.3 Sampling
- Need: whole population too costly or slow to question; testing may destroy products.
- Limitations: unrepresentative sample gives bias; small sample is less reliable; non-response; a better sample costs more.
- The syllabus names no sampling methods.
3.2.4 Data
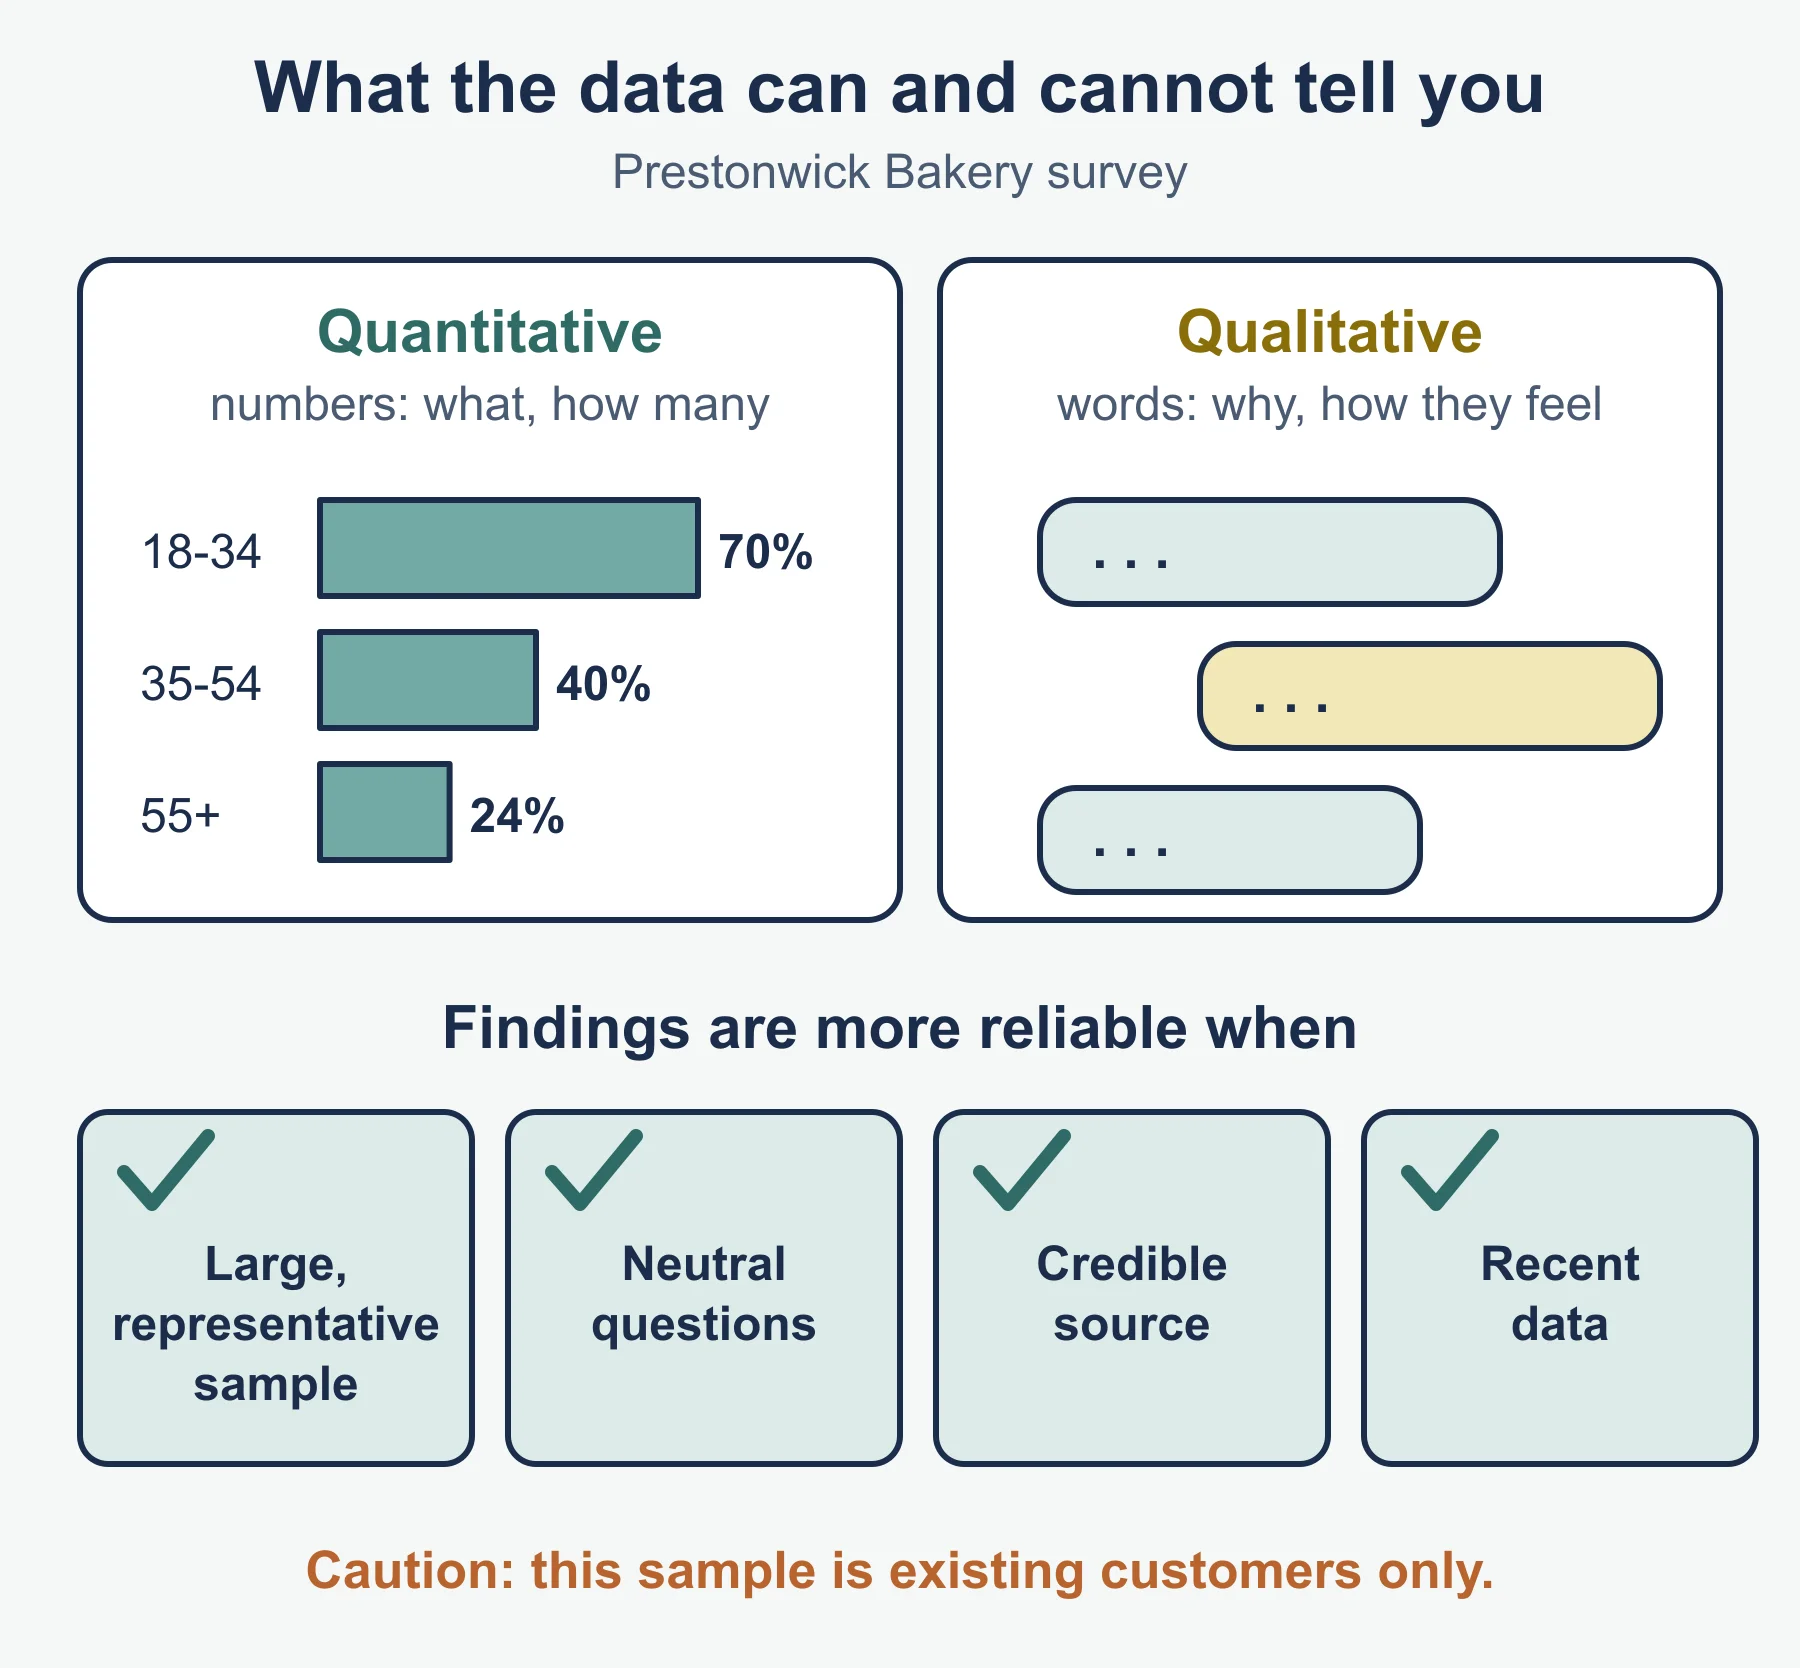
- Reliability depends on sample size and representativeness, neutral questions, credible source and recency.
- Quantitative: numbers, easy to compare. Qualitative: opinions and reasons, explains why.
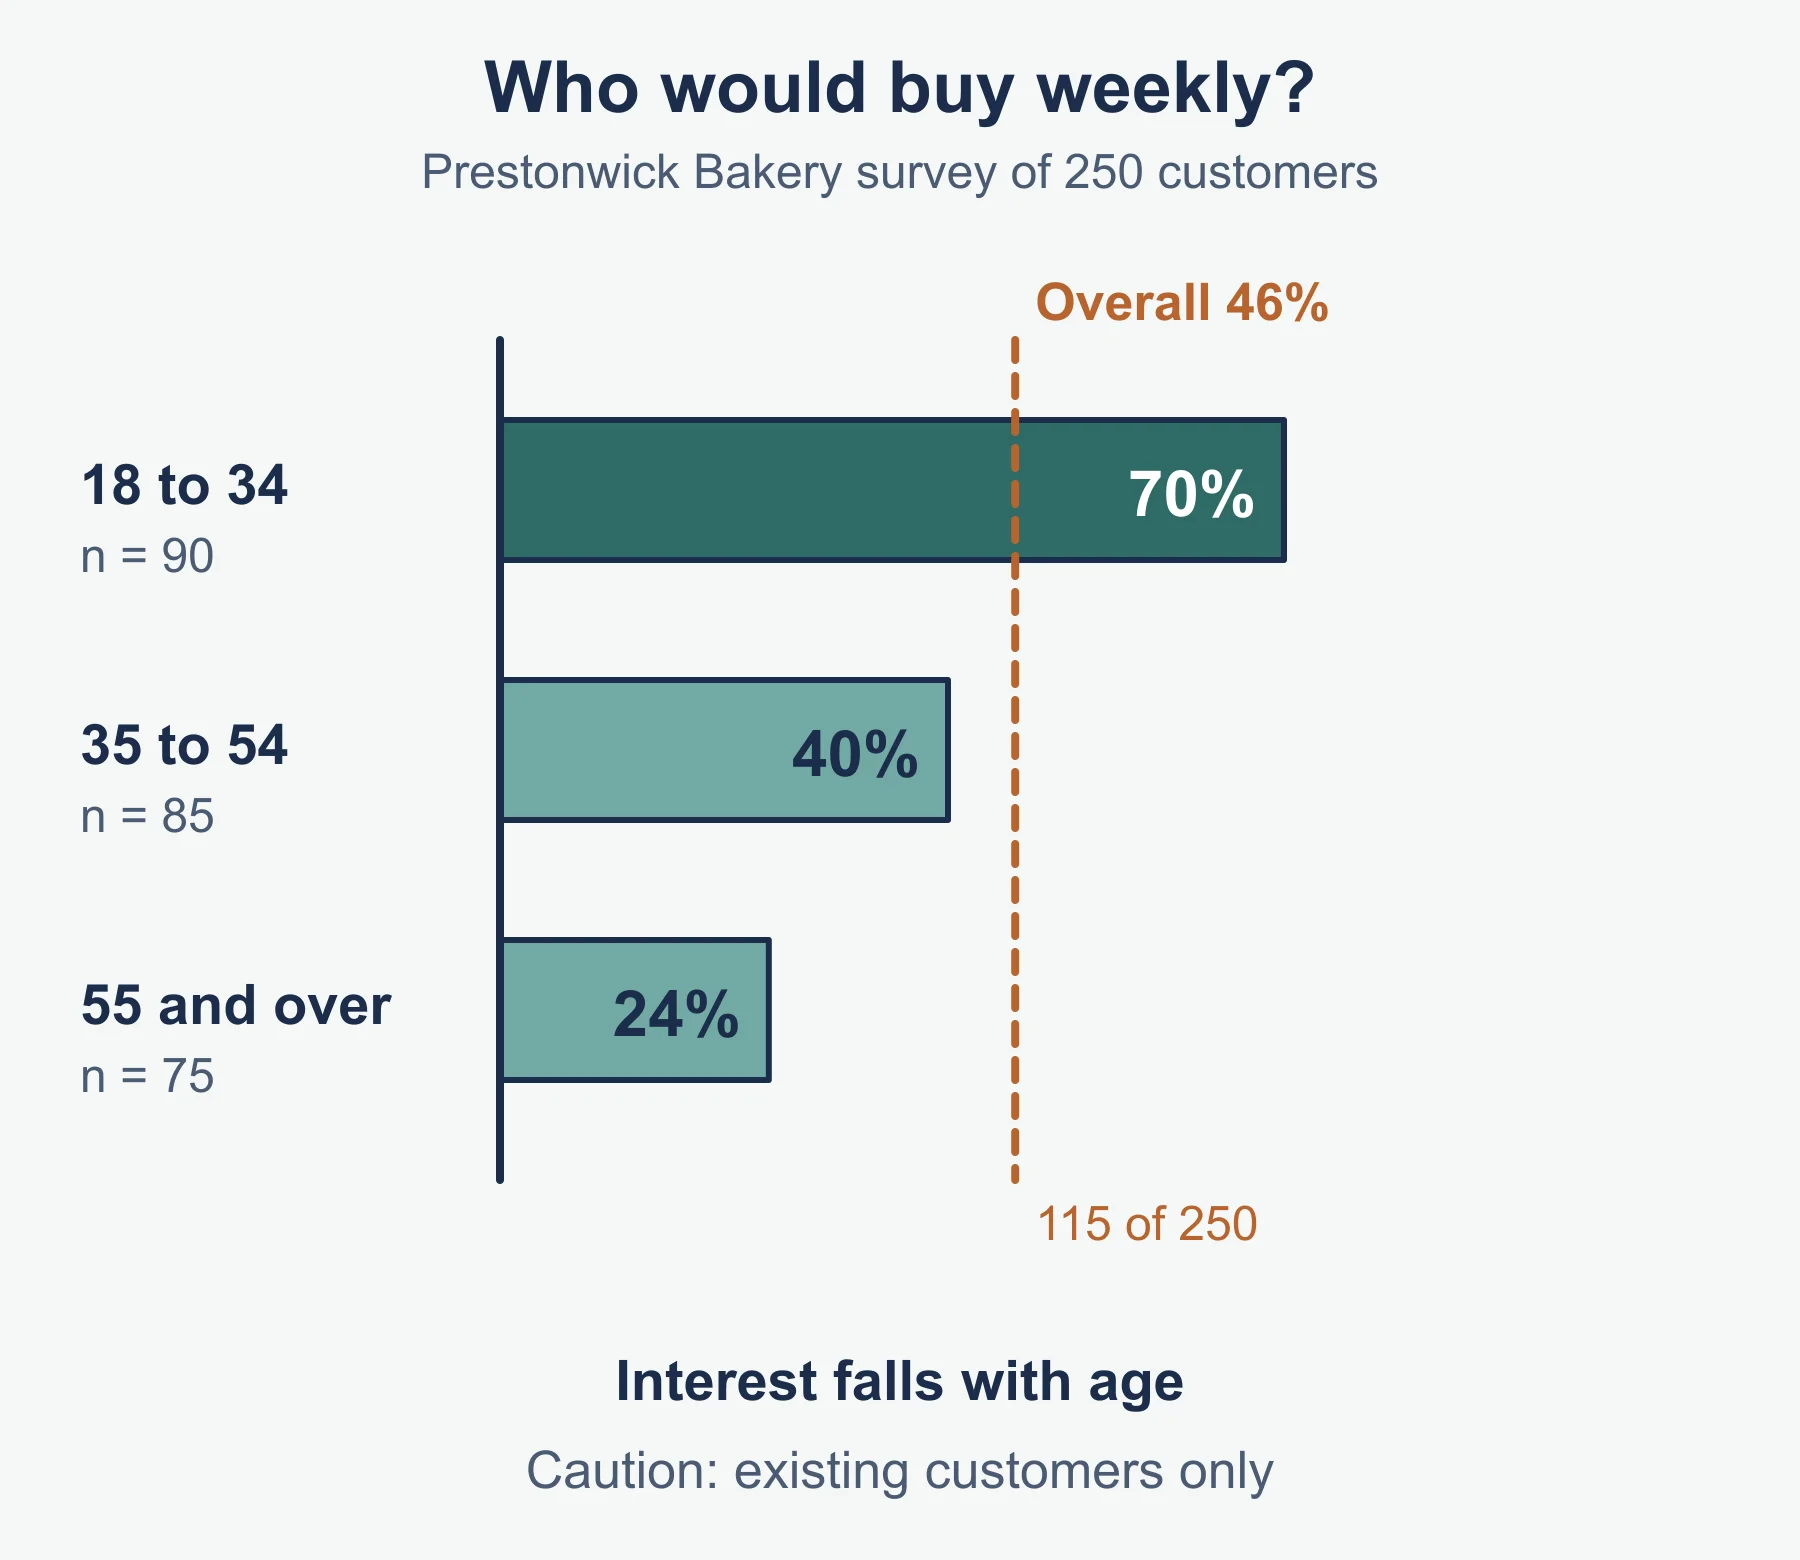
- Tables, charts and graphs: read the title and units, quote figures, calculate a percentage or change, state the trend, then qualify it.
- Worked reminder: sales rise from 45 to 54 in a year. Change = 9; 9 / 45 x 100 = 20%.
Must-know distinctions
- Market share is the firm’s slice; market growth is the whole market’s change. They answer different questions.
- Market growth is not the same as the firm’s growth. Compare the two.
- Demand is a willingness to buy at each price; quantity demanded is the figure at one price.
- Segmentation divides a market; niche marketing chooses to serve one small part of it.
- Primary and secondary describe where data comes from, not whether it is quantitative or qualitative. A survey can give both kinds.
- Reliability asks whether the findings can be trusted; usefulness asks whether they help this decision.
Building an evaluative answer
For a judgement question, give a point, develop it with the case data, then weigh it. Useful questions to ask: how big is the effect, how long will it last, what does the business want most, and what would change your view? Finish with a clear conclusion that answers the question set.
Quick self-test
- State two factors that can increase demand for a product.
- A market is worth 250 and then 225. Calculate market growth.
- In that market a firm sells 20 both years. Calculate its share each year.
- Name the three methods of segmentation in the syllabus.
- Which orientation begins with customer wants?
- State one limitation of sampling.
- Is a firm’s own sales database primary or secondary research?
- A loyalty scheme costs 9,000 and each retained customer yields 60 of contribution. How many customers are needed to break even?
- In a survey of 240 people, 60 would buy. What percentage is this?
- Give one reason a B2B product might be marketed through a direct sales team.
Answers
- Any two, for example a rise in incomes, a successful advertising campaign, a rise in the price of a substitute, a change in fashion.
- (225 - 250) / 250 x 100 = -10.0%, so the market fell by 10%.
- 20 / 250 = 8.0%, then 20 / 225 = 8.9% (1 d.p.). Share rose even though sales were flat, because the market shrank.
- Geographic, demographic and psychographic.
- Customer (market) orientation.
- Any one, for example the sample may not be representative, causing bias.
- Secondary, because the data already exists, although it was collected for another purpose.
- 9,000 / 60 = 150 customers.
- 60 / 240 x 100 = 25%.
- Buyers are few and large, orders are complex and negotiated, and relationships matter, so a direct team can explain, negotiate and support.
Where marks are usually lost
- Calculating share without using the total market figure.
- Reporting that sales rose without comparing with market growth.
- Listing the three segmentation methods but not applying them to the business given.
- Writing definitions only, with no link to the case.
- Saying primary research is “better” without a trade-off.
- Describing a sampling limitation in general terms but not tying it to the sample in the question.
- Quoting percentages without saying what they suggest.
- Confusing marketing objectives with corporate objectives.
- Forgetting that a CRM scheme has costs, so only giving benefits.
Frequently asked questions
What is the difference between market share and market growth? Market share is one firm’s sales as a percentage of total market sales. Market growth is the percentage change in the whole market’s sales. A firm’s share falls if its sales grow more slowly than the market.
What are the three methods of segmentation in Cambridge 9609? Geographic, demographic and psychographic. Psychographic data, about lifestyle, values and attitudes, is usually the hardest to collect and measure.
What is the difference between B2C and B2B marketing? B2C sells to many individuals, often through mass media and branding, with fixed public prices. B2B sells to fewer, larger organisations, often through sales teams and negotiated prices, with slower, more technical decisions.
Does the 9609 syllabus require specific sampling methods? No. Section 3.2.3 covers the need for sampling and its limitations, but the syllabus names no sampling methods.
Official syllabus
Cambridge International, Cambridge International AS & A Level Business 9609 syllabus for examination in 2026, 2027 and 2028, subject content sections 3.1 and 3.2.
Get free revision emails (optional)
Occasional emails with practice questions, worked explanations and links to free resources for the qualification and subjects you choose. No spam, and you can unsubscribe from any email. The free tools on this site never need an email.
Related resources
-
Study guides
A Level Business: Marketing (Cambridge 9609)
Study guide to Topic 3 Marketing in Cambridge AS & A Level Business 9609: market orientation, segmentation, research and the 4Ps with the Boston Matrix.
Business · Cambridge · AS Level
Read guide -
Practice questions
A Level Business: Marketing (A Level) — Practice Questions (Cambridge 9609)
Worked practice questions on moving averages, seasonal variation, forecasting, correlation, cross elasticity and global marketing for Cambridge 9609 Business.
Business · Cambridge · A Level
Try questions -
Practice questions
A Level Business: Marketing — Practice Questions (Cambridge 9609)
Practice questions with worked answers on market orientation, segmentation, research and the marketing mix for Cambridge AS & A Level Business 9609 Topic 3.
Business · Cambridge · AS Level
Try questions
Related articles
-
teaching
A Level tuition in Dubai: Cambridge or Pearson Edexcel International A Level?
Schools in Dubai and Abu Dhabi teach either Cambridge International AS & A Level or Pearson Edexcel International A Level. How the two are structured, why it matters for tuition, and how online classes from Lahore work.
9 October 2026
-
curriculum guides
Choosing subjects at IGCSE and A Level
How subject choices at 14 and 16 affect university options later, and how to keep pathways open without overloading a timetable.
28 July 2026
Studying this with a teacher
Working through Business AS LEVEL?
This page is free and stays free. If you would rather be taught it, Marlbridge runs Business classes one-to-one and in small groups of up to 15, online in your own time zone. The first trial class is free. WhatsApp replies within an hour (8am–11pm Pakistan time, every day); email the same day.
Cambridge Business teachers at Marlbridge

