
Study Guides
A Level Business: The marketing mix (Cambridge 9609)
A full study guide to section 3.3 The marketing mix for Cambridge AS & A Level Business 9609: product, portfolio analysis, pricing, promotion and place.
- Subject
- Business
- Level
- AS LEVEL
- Topic
- Marketing
- Author
- Marlbridge Academic Team
- Updated
- Reviewed by
- Salman Ahmad (what this means)
Aligned to Cambridge A Level Business (9609), For examination in 2026, 2027 and 2028. Official specification .
Syllabus page (what it covers and how it is assessed): Cambridge A Level Business.
Syllabus points this page covers
9609 (AS Level)
- 3.3 The marketing mix
Found an error? Report a correction.
Need help with this topic? Request a free trial class for A Level Business (9609).
This guide covers section 3.3 The marketing mix (3.3.1 to 3.3.6) of the Cambridge International AS & A Level Business 9609 syllabus for examination in 2026, 2027 and 2028. It is AS Level content, which A Level candidates also study and which is assumed knowledge for the A Level papers. The syllabus aims for candidates to be able to recommend a marketing mix that suits a specific business context, so the sections below keep returning to application. All businesses and figures below are invented.
Links: Cambridge A Level Business hub, checklist, revision notes, practice questions and the wider Marketing study guide. To find your weak spots first, try the free diagnostics.
What the section covers
| Ref | What you must be able to do |
|---|---|
| 3.3.1 | Name the 4Ps: Product, Price, Promotion, Place (distribution channels) |
| 3.3.2 | Goods and services; tangible and intangible attributes; product development; differentiation and USP |
| 3.3.3 | Product life cycle and extension strategies; Boston Matrix and its uses; effect on marketing decisions |
| 3.3.4 | Objectives and usefulness of competitive, penetration, skimming, price discrimination, dynamic, cost-based and psychological pricing |
| 3.3.5 | Objectives and usefulness of promotion methods: advertising, sales, direct, digital; packaging; branding |
| 3.3.6 | Objectives and usefulness of channels of distribution; digital and physical distribution |
3.3.1 The 4Ps
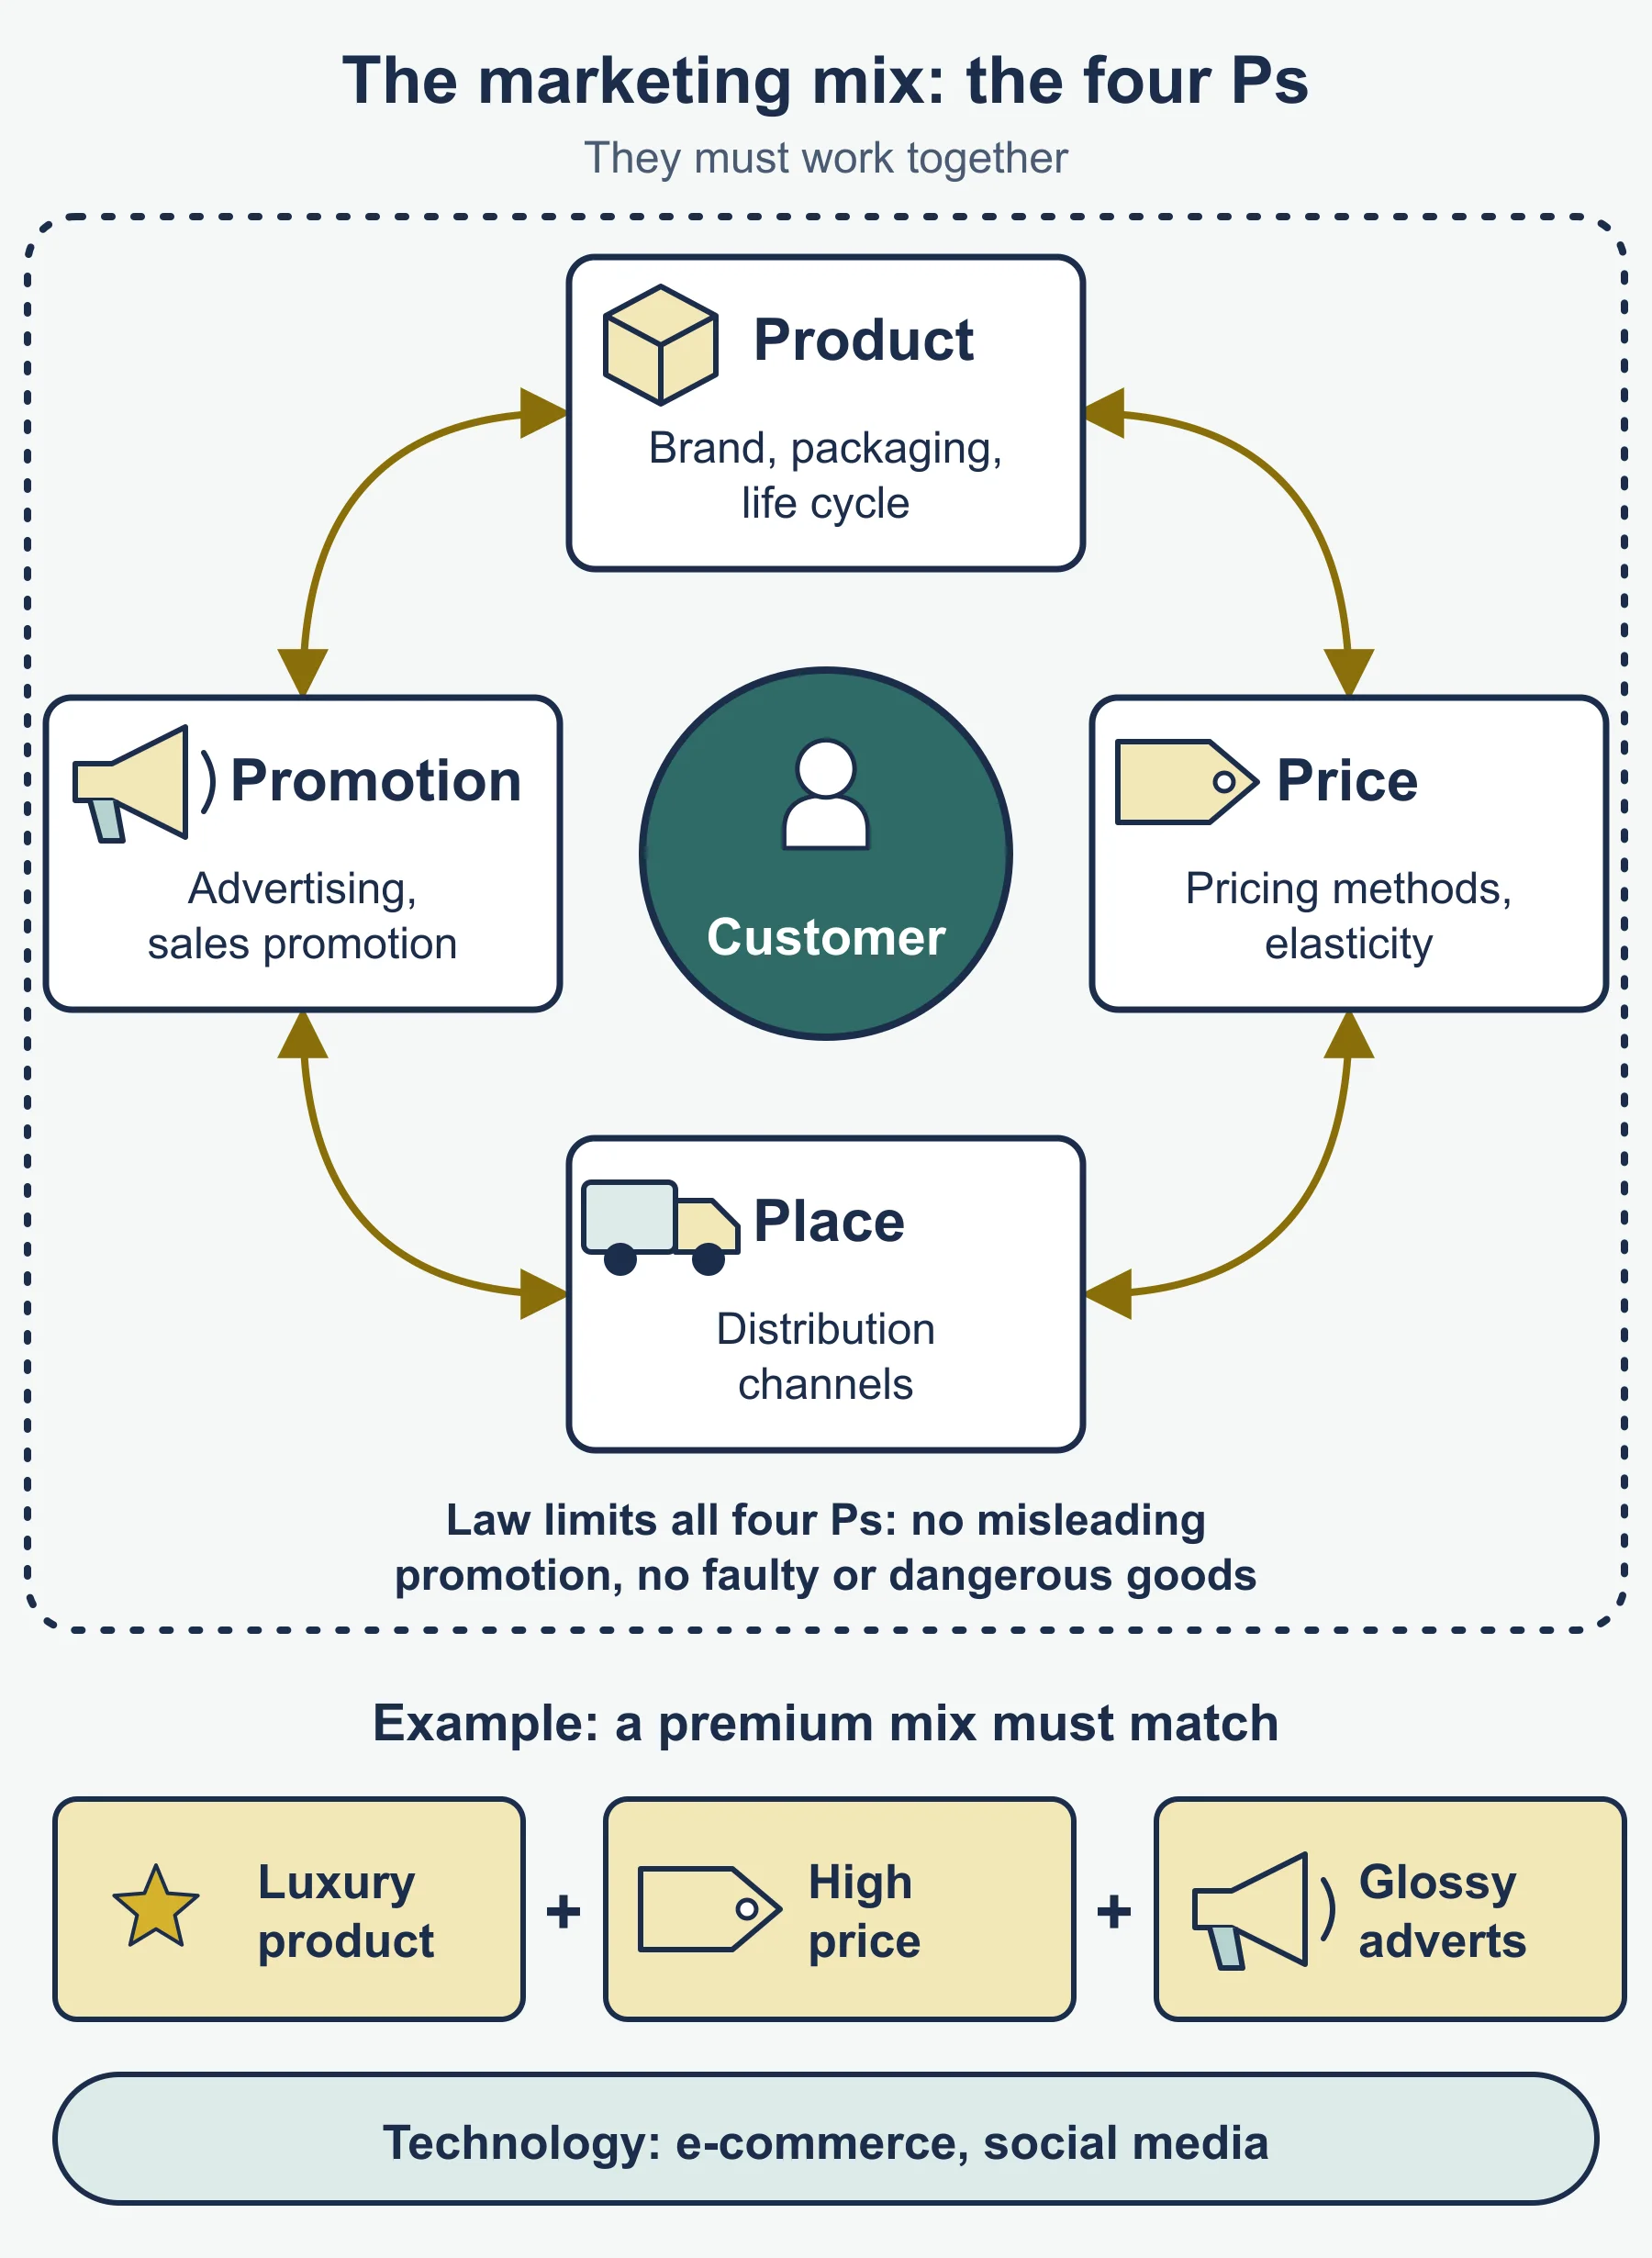
The marketing mix is the set of choices a firm makes on its Product, Price, Promotion and Place (distribution channels). The elements must fit each other and the target customers. A good answer judges the mix as a whole, not each P on its own.
3.3.2 Product
Goods and services. Goods are physical items that can be touched and stored, such as a kettle. Services are activities, such as a haircut or a repair visit. Services are usually consumed as they are produced and cannot be stored.
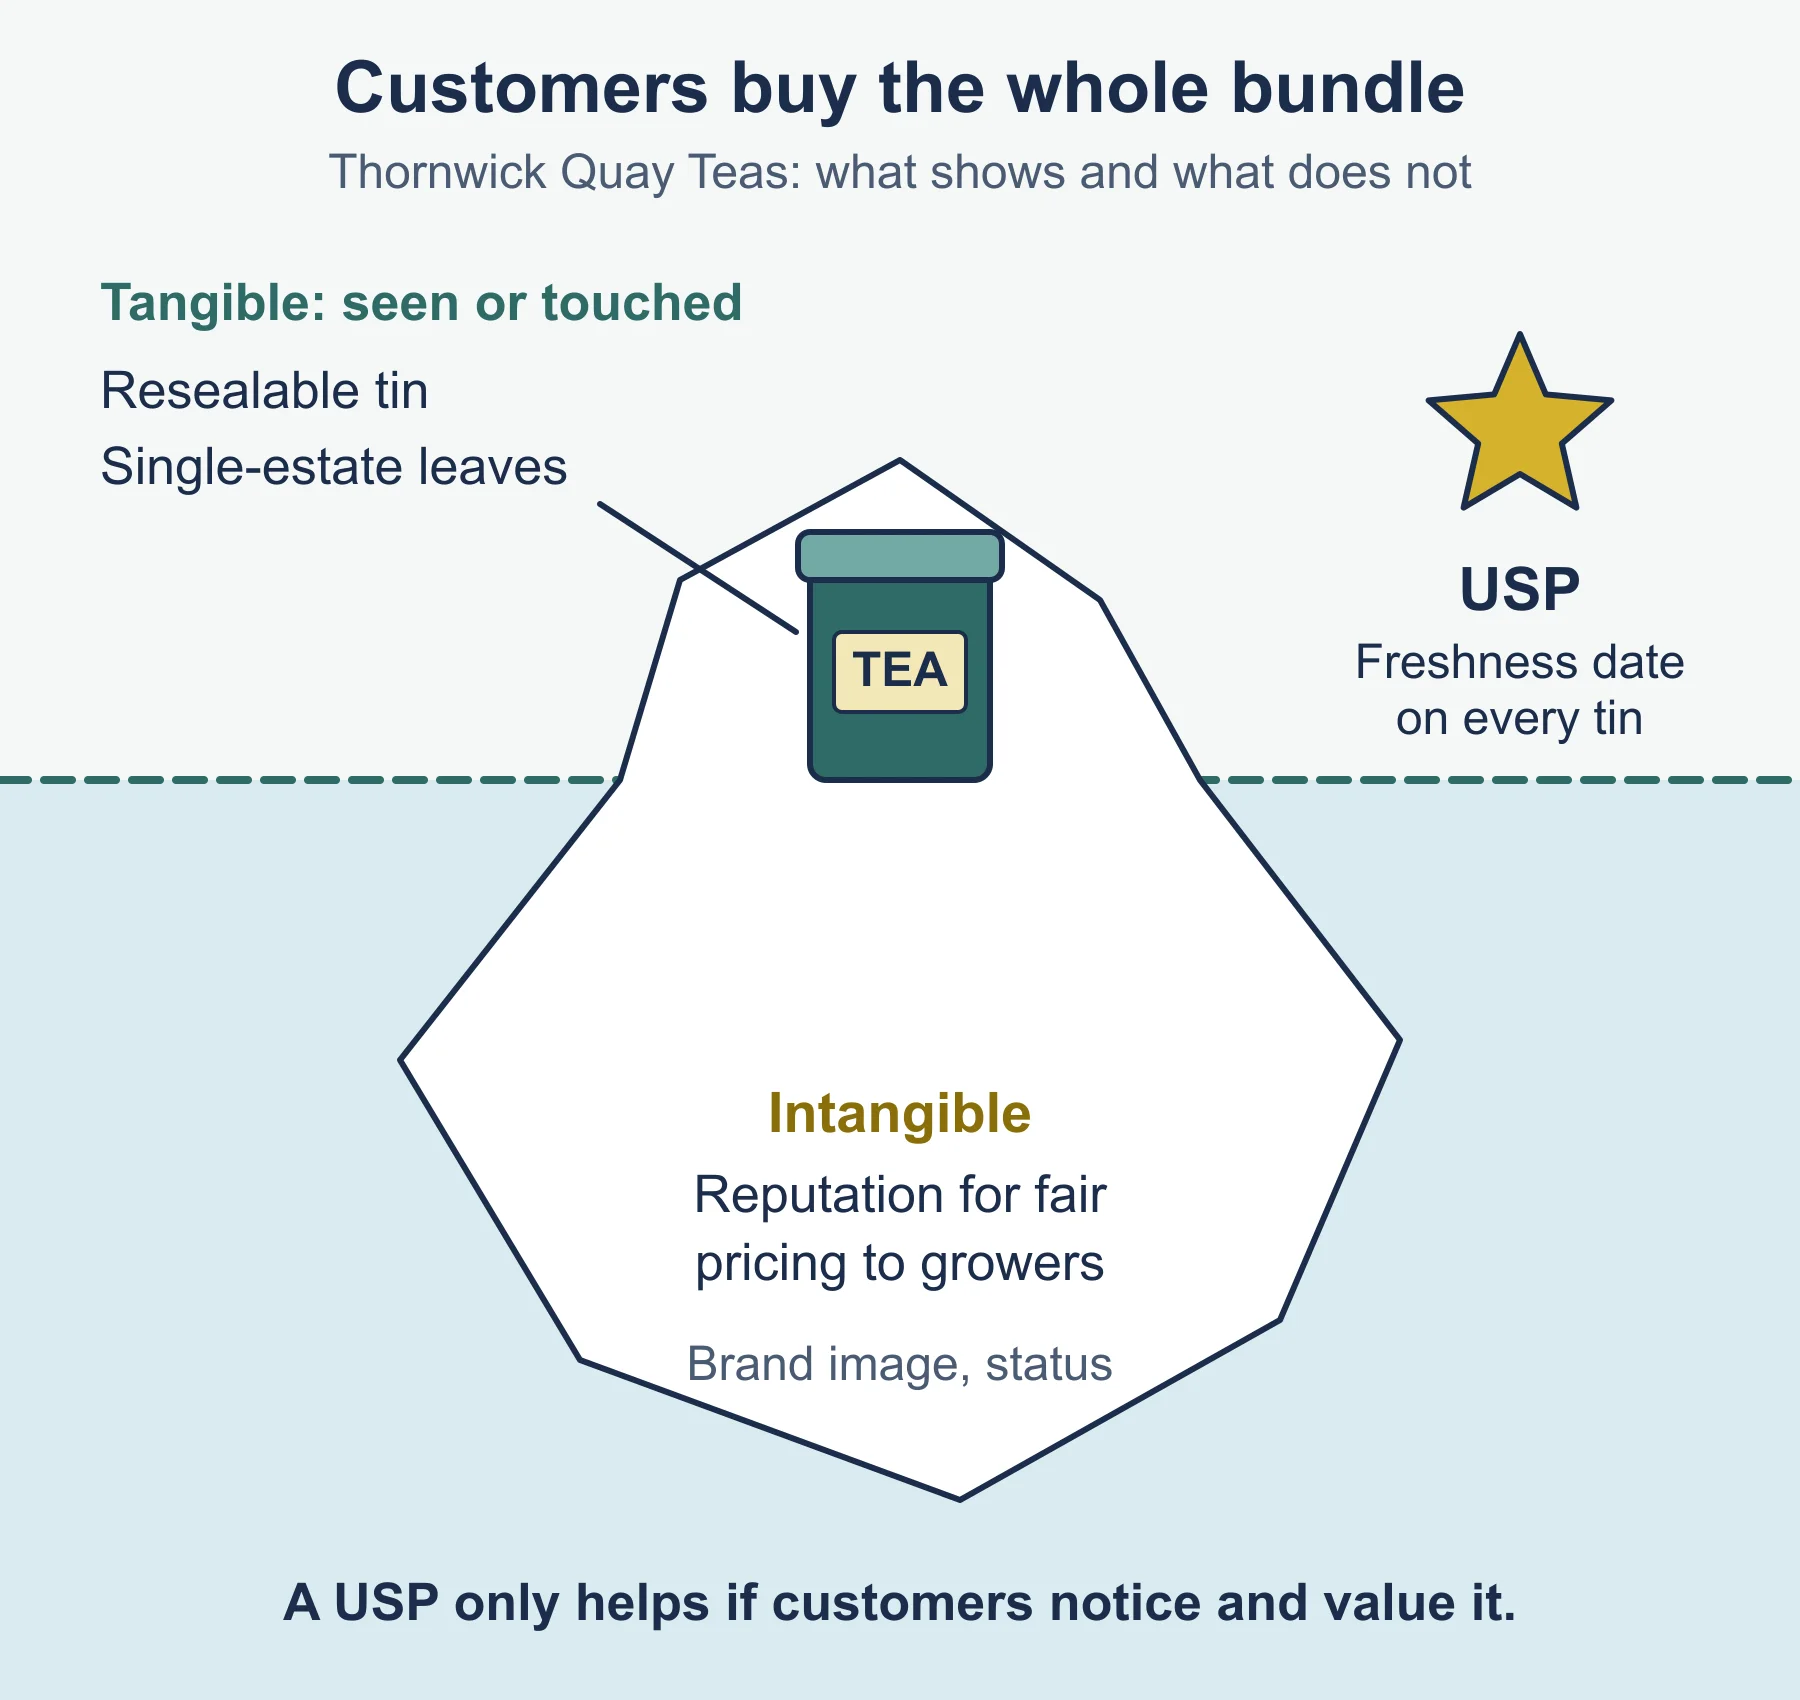
Tangible and intangible attributes. Tangible attributes can be seen or touched: size, materials, packaging, durability. Intangible attributes cannot: brand image, reputation, status, reliability, friendliness of staff. Customers buy the whole bundle. Two identical bags of tea may sell at different prices because one has a trusted name.
Importance of product development. Tastes change, rivals copy and technology moves on, so a business that stops developing its products sees sales fall. Development can open new segments, defend share and spread risk, but it costs money and may fail.
Differentiation and USP. Product differentiation means making a product stand out from rivals through design, quality, features, service or image. A unique selling point (USP) is the feature that rivals do not offer and that customers value. Differentiation can support a higher price and customer loyalty, but only if customers notice and value the difference. A USP that rivals can copy quickly is weak.
Worked example 1. Thornwick Quay Teas sells loose-leaf tea. Its tangible attributes include a resealable tin and single-estate leaves. Its intangible attributes include a reputation for fair pricing to growers. Its USP is a “freshness date” on every tin showing the packing day. For application, say which attribute matters most to the target segment (busy office buyers may value convenience over estate origin).
3.3.3 Product portfolio analysis
Product life cycle
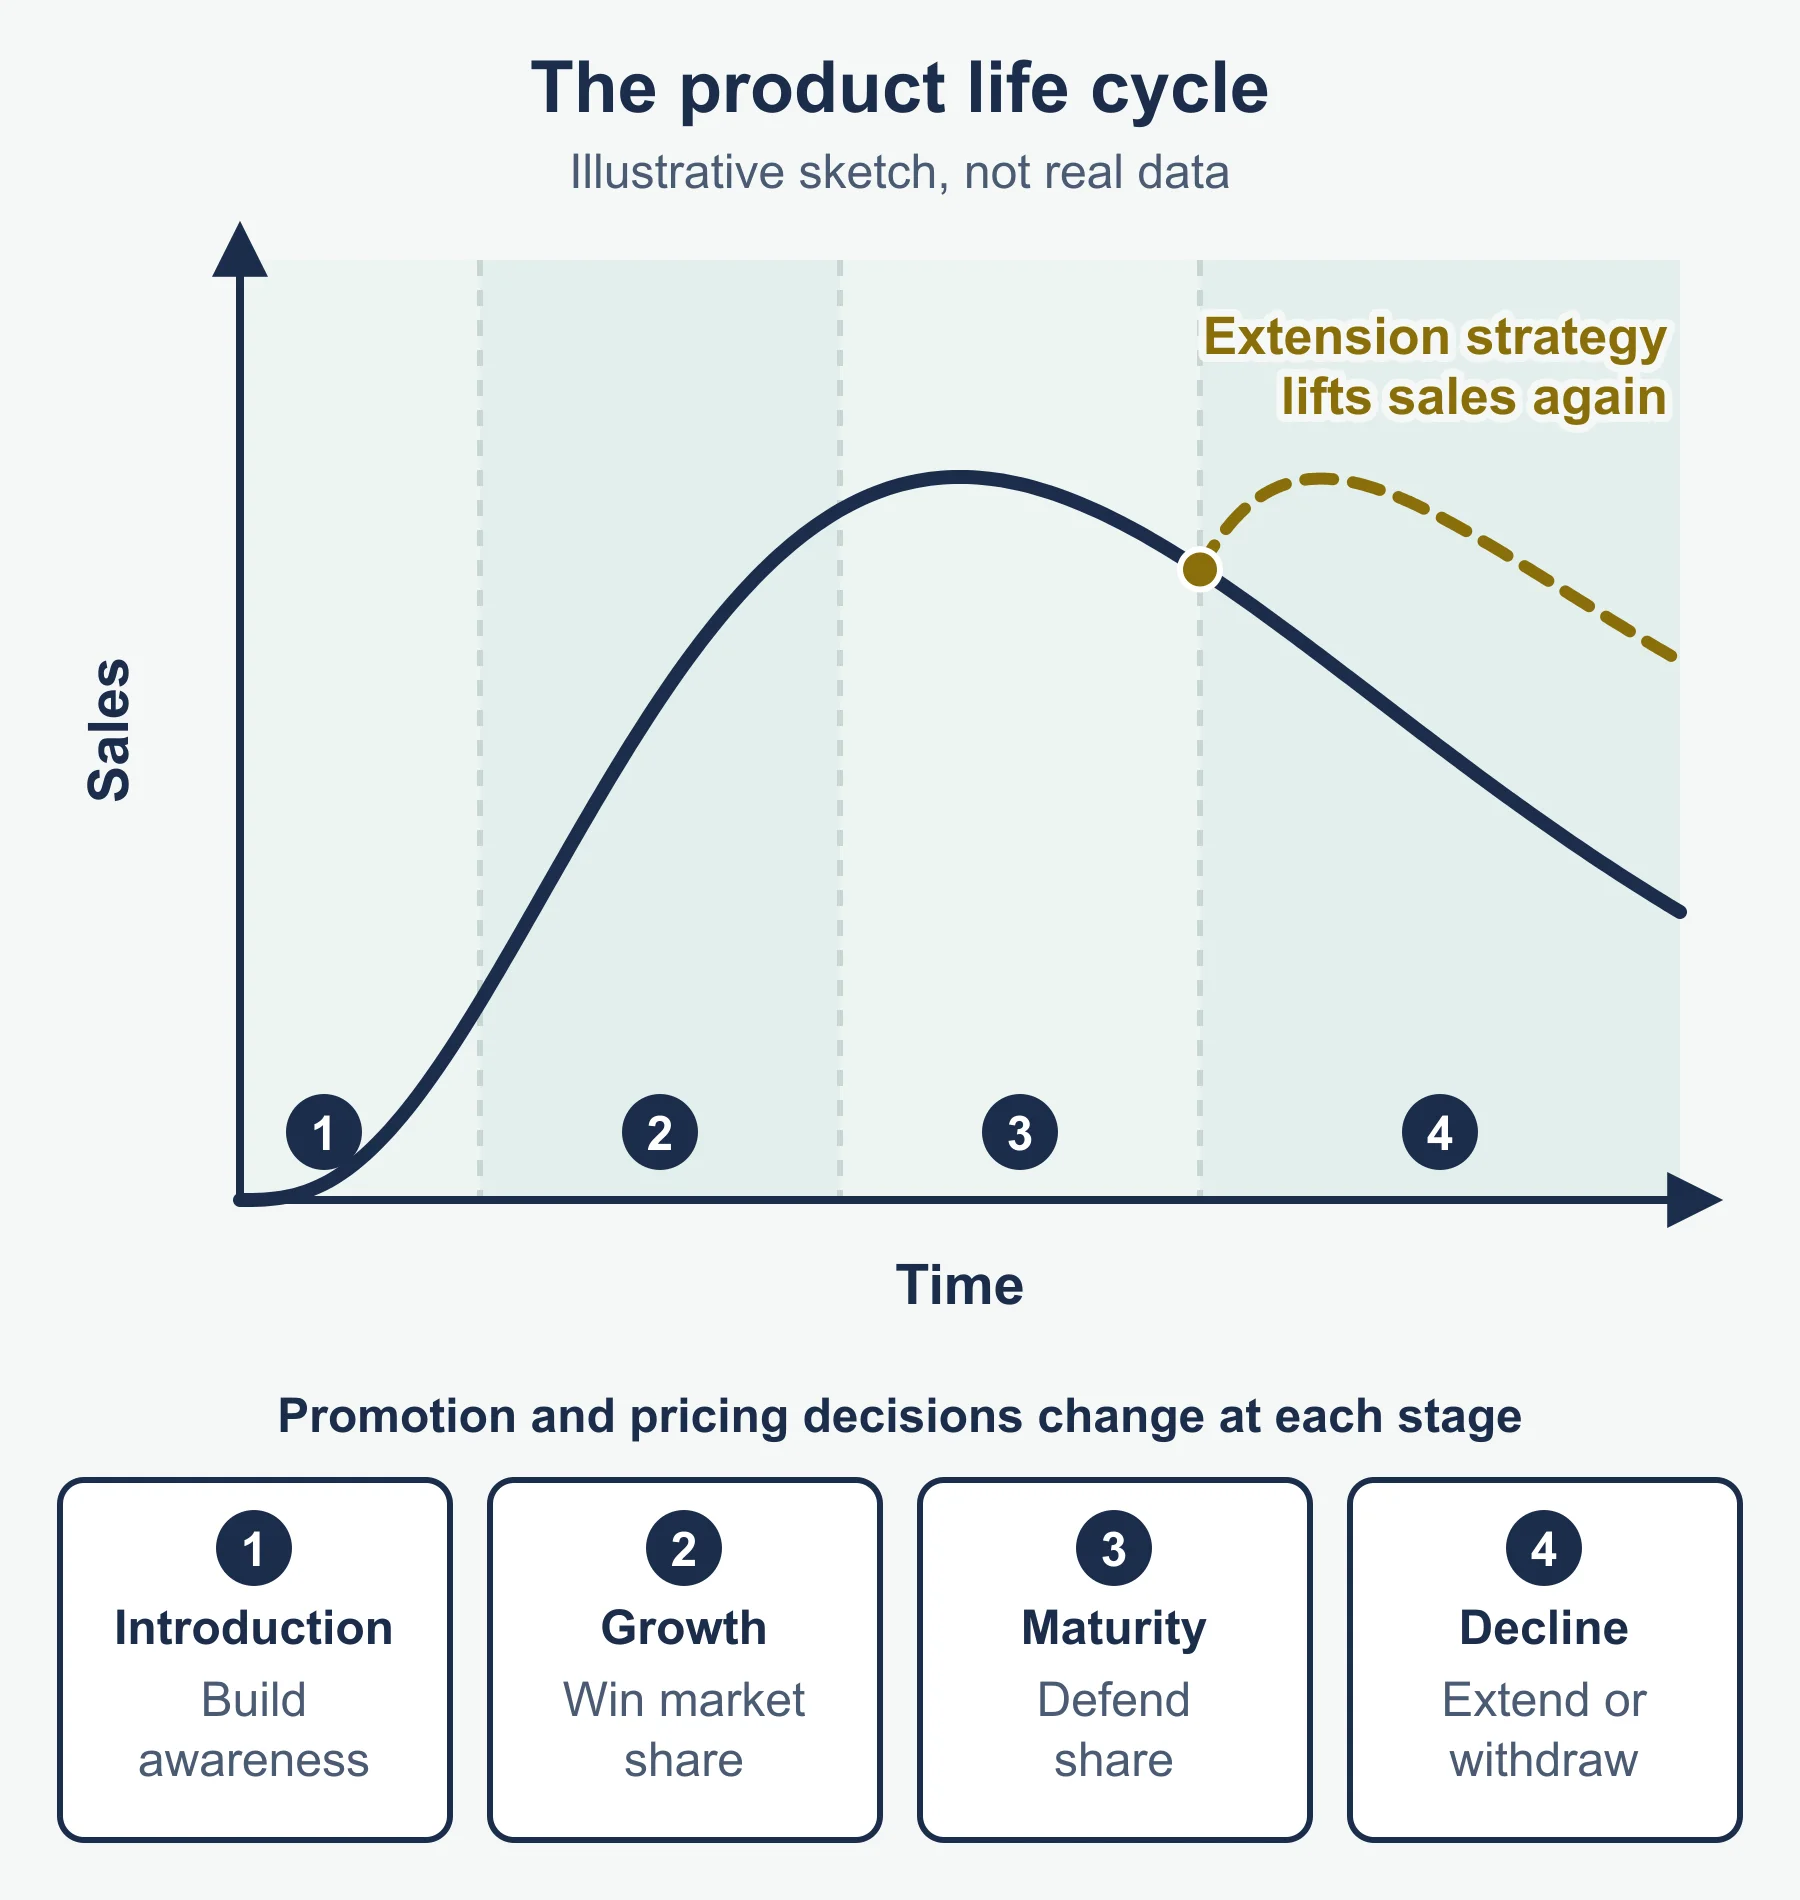
The standard product life cycle shows sales over time in stages: introduction (or launch), growth, maturity and decline. A development stage with no sales, and high costs, often comes before launch.
| Stage | Sales | Typical marketing response |
|---|---|---|
| Introduction | Low, rising slowly | Build awareness; high promotion spend; price may be skimming or penetration |
| Growth | Rising fast | Widen distribution; build brand; rivals enter |
| Maturity | Levels off | Defend share; competitive pricing; differentiation |
| Decline | Falling | Cut costs, run down stock or use an extension strategy |
Extension strategies try to lengthen the life of a product before or during decline. Examples: new packaging, a modified or improved product, finding new uses or new markets, extra promotion, changing the price or adding a new distribution channel. They work only if a real opportunity exists. Extending a product that customers have genuinely left wastes money.
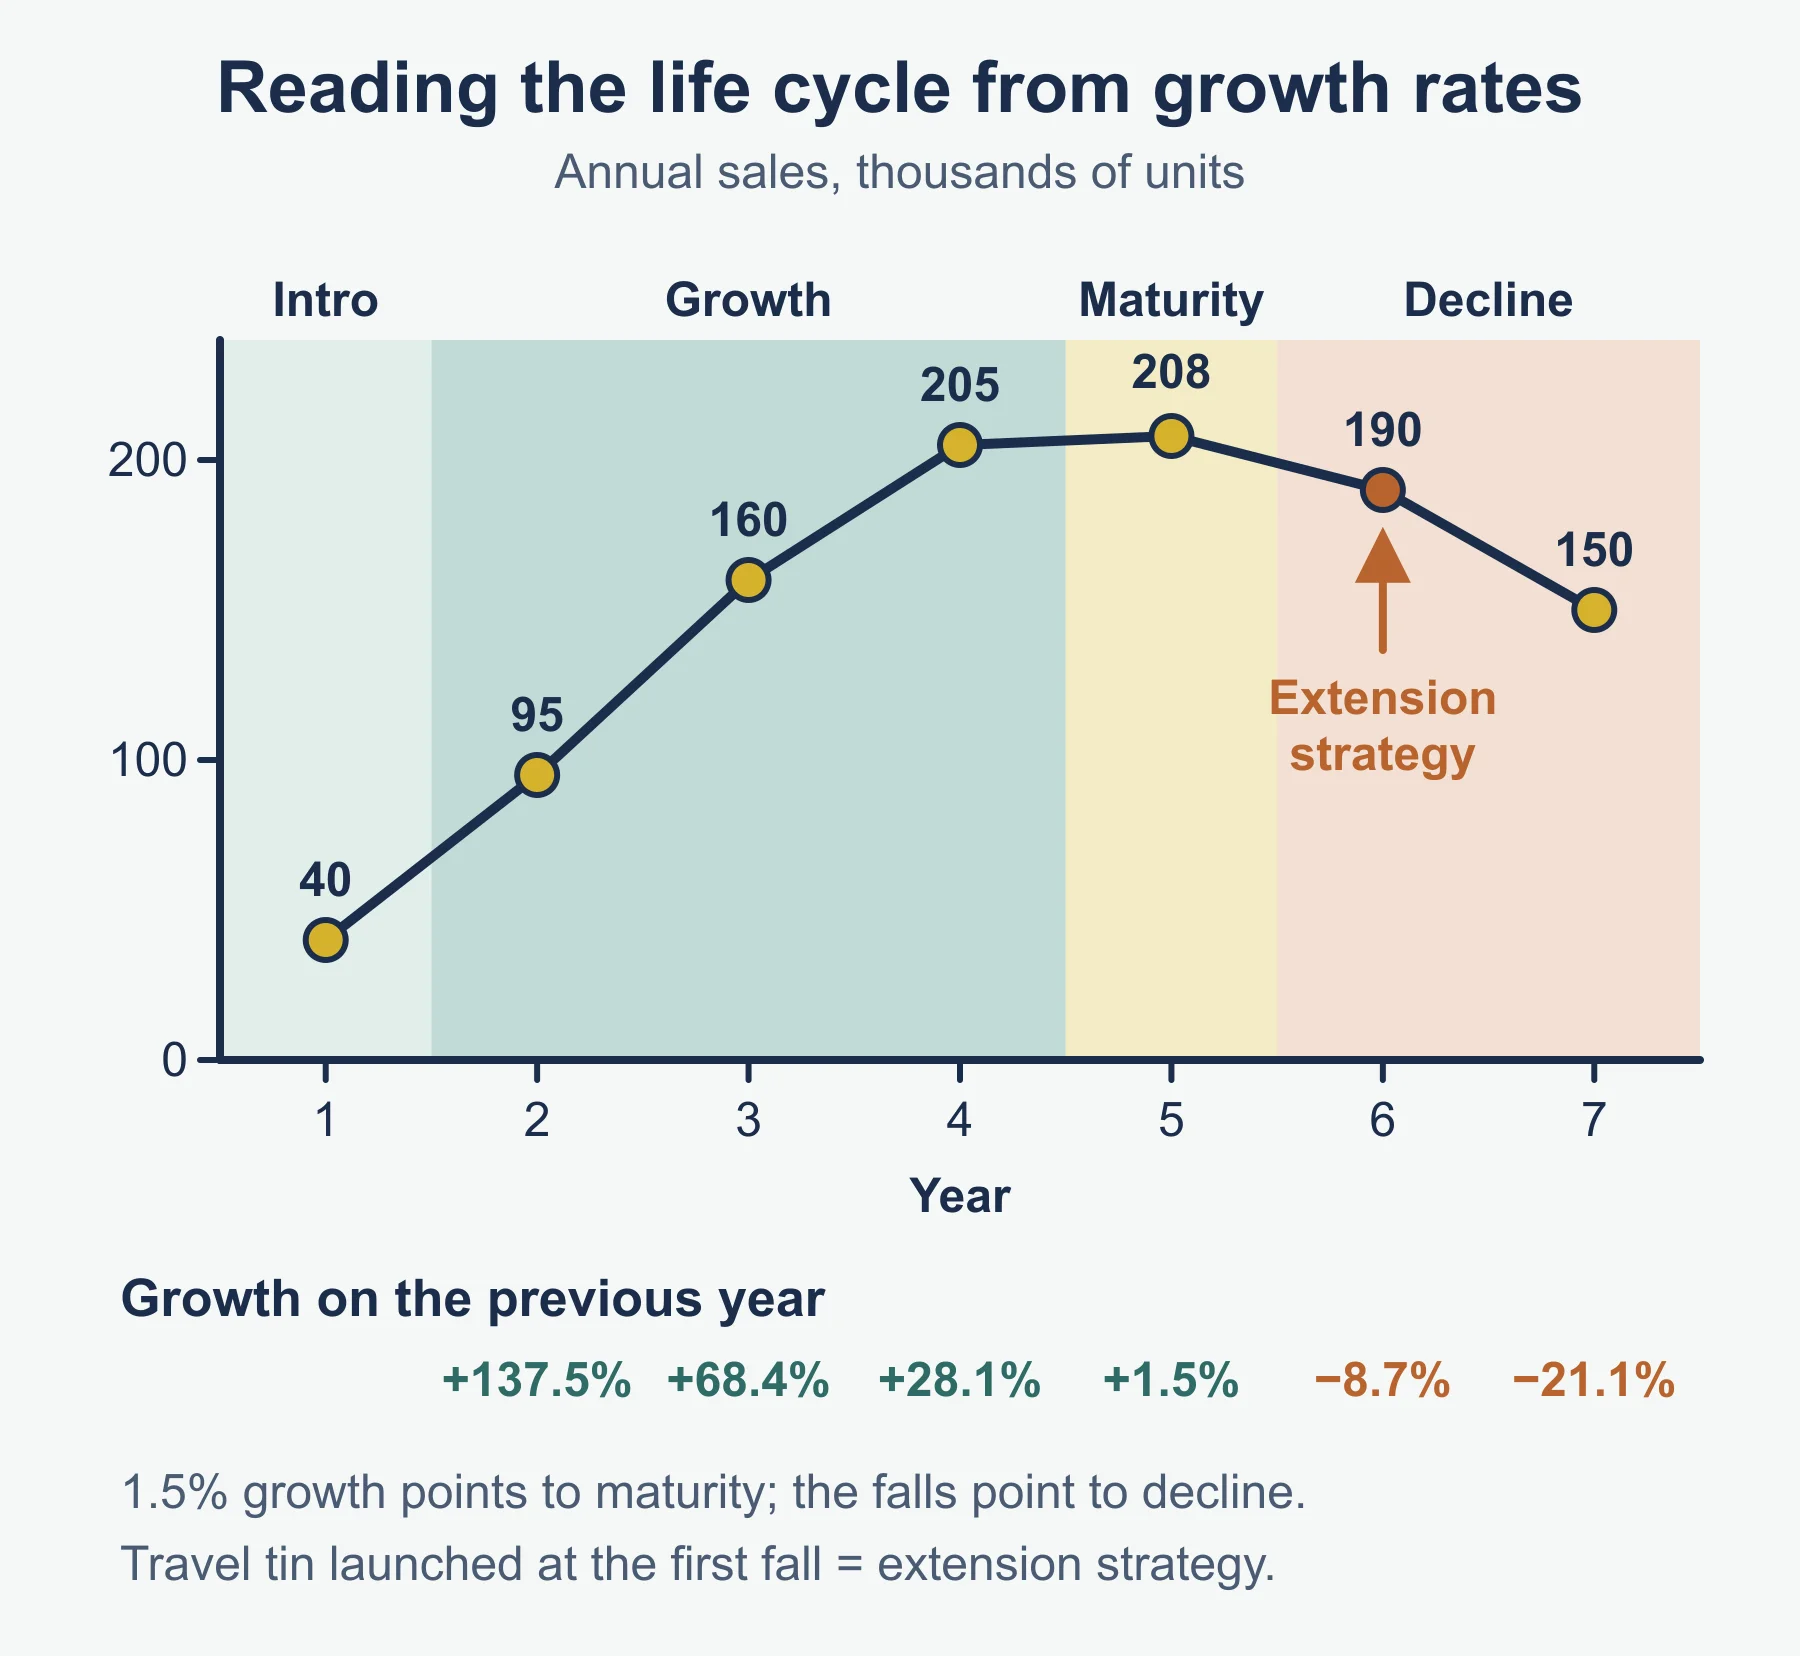
Worked example 2. Annual sales (thousands of units) of a Thornwick Quay Teas product run 40, 95, 160, 205, 208, 190, 150. Growth between years is 137.5%, 68.4%, 28.1%, 1.5%, then falls of 8.7% and 21.1%. Growth slowing to 1.5% points to maturity; the falls point to decline. A launch of a smaller travel tin at the first fall is an extension strategy aimed at a new use.
Boston Matrix
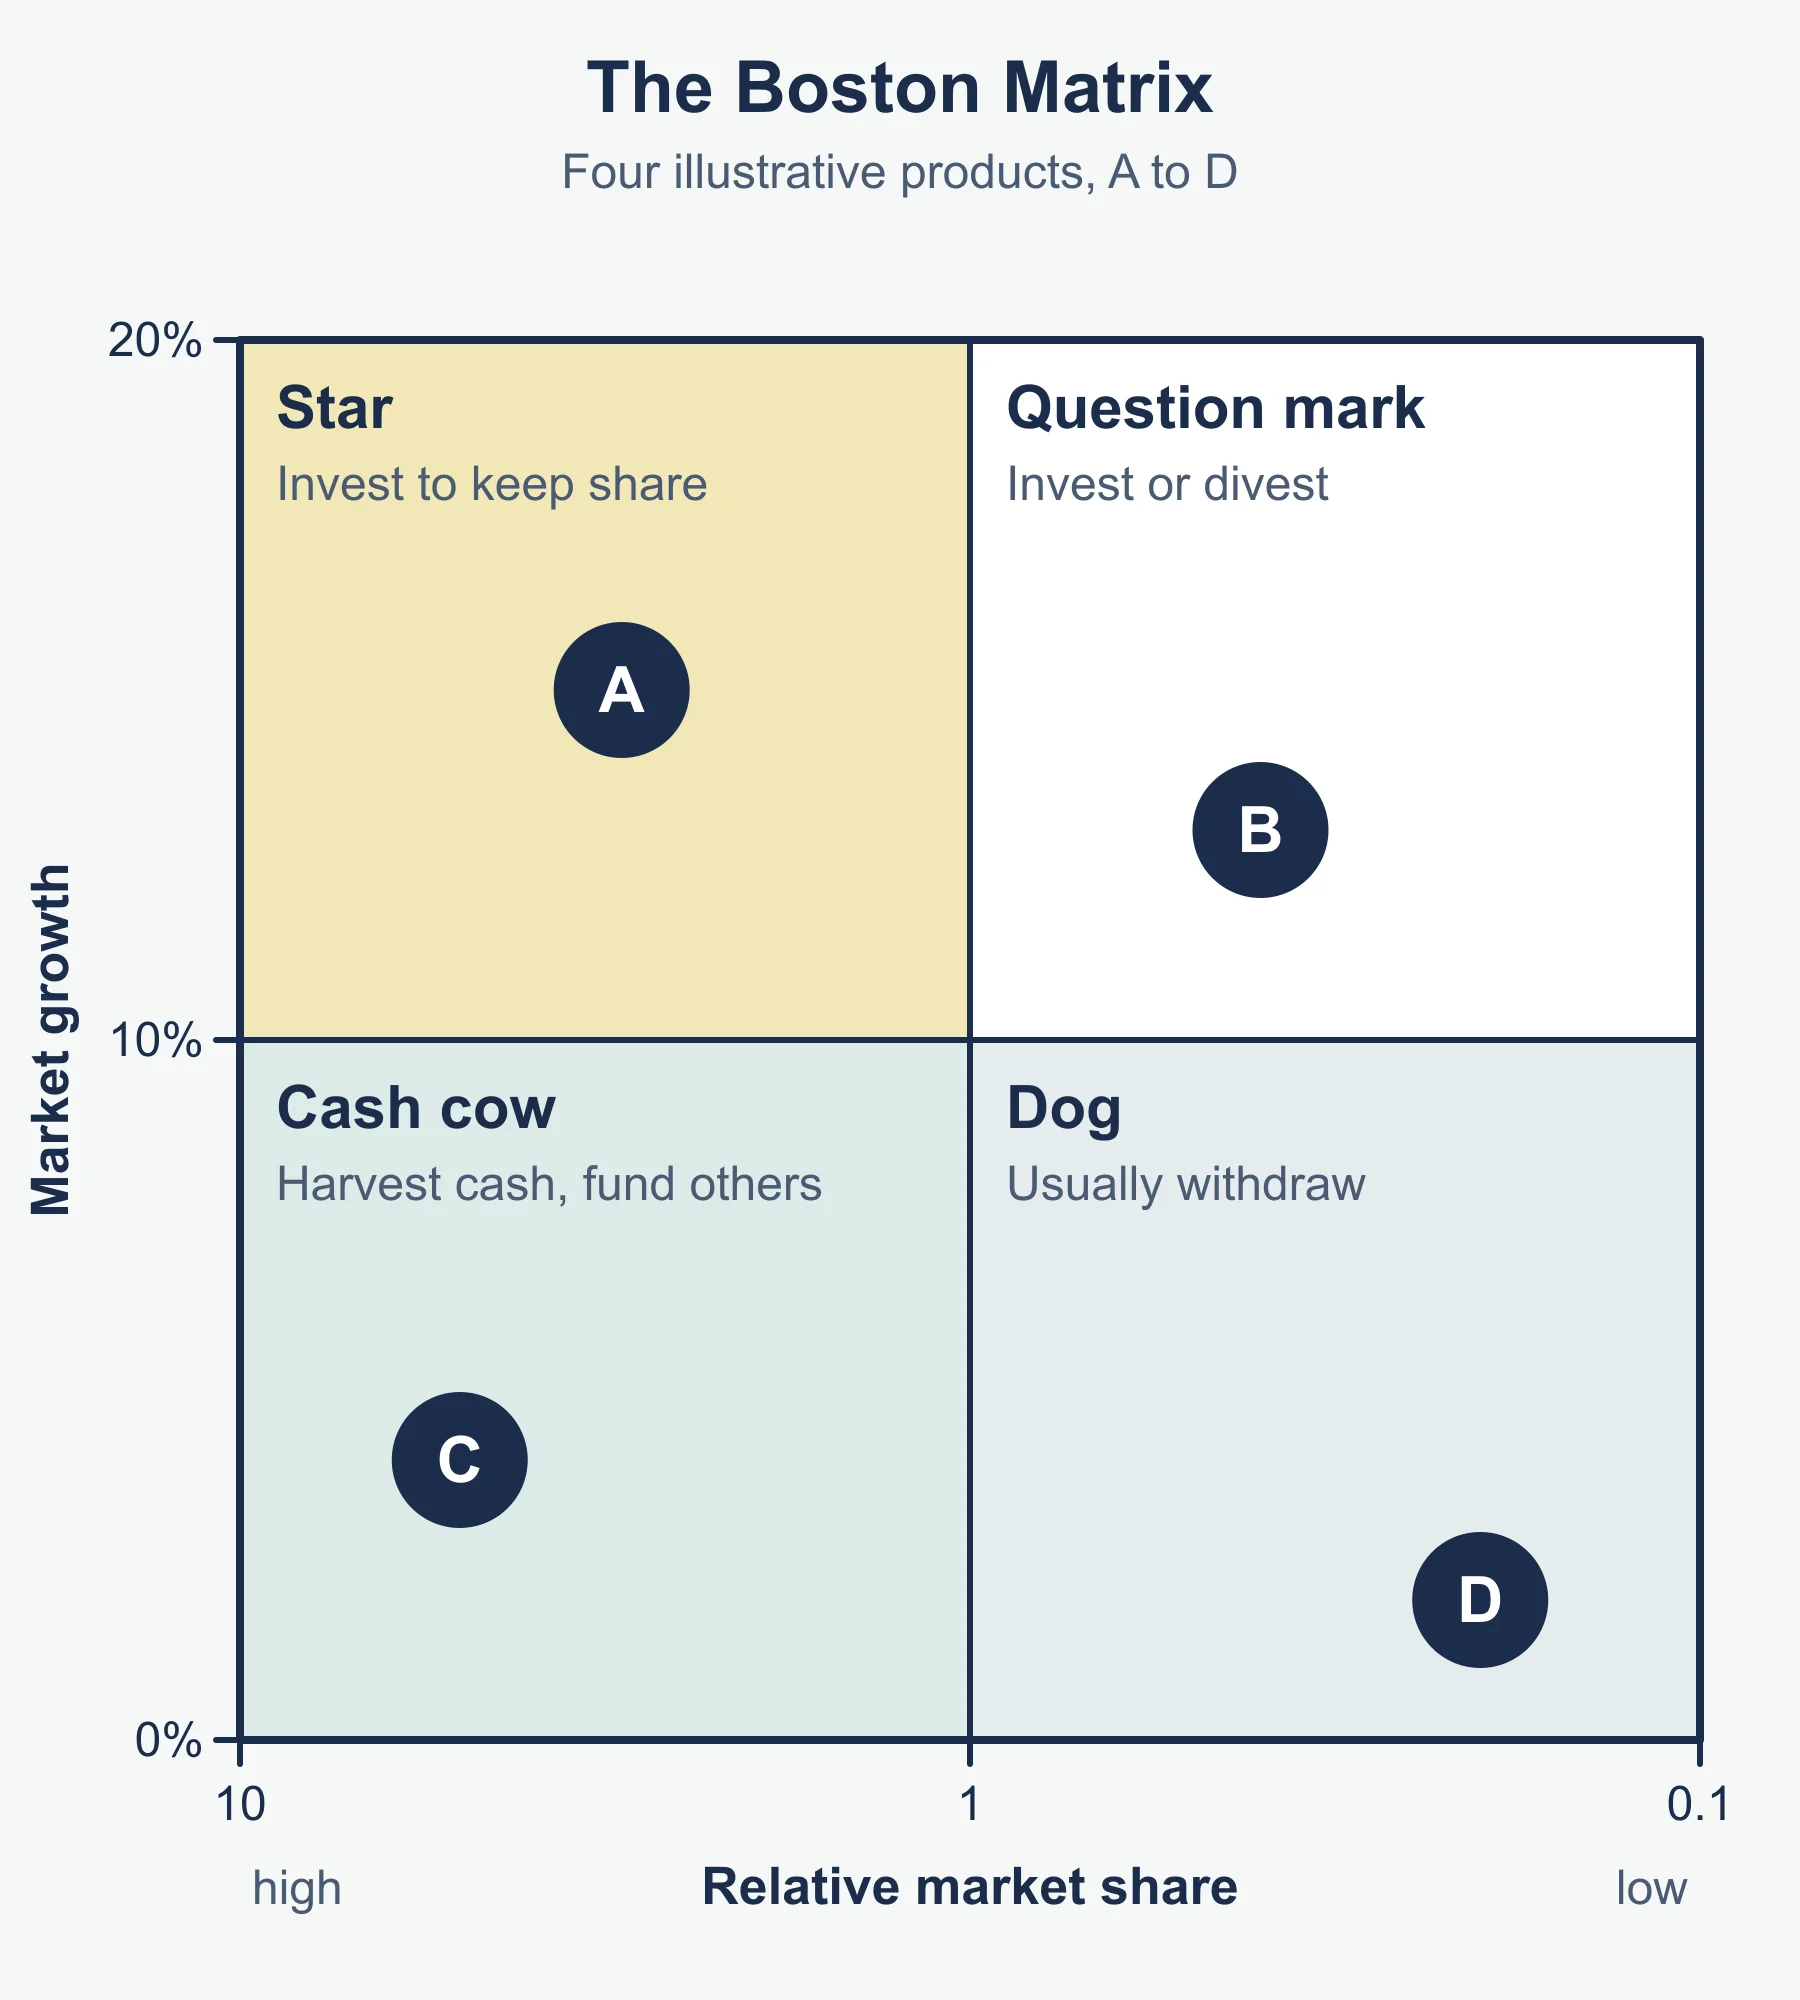
The Boston Matrix classifies each product by market growth (high or low) and market share. The usual measure is relative market share: the business’s share divided by the share of its largest rival. This is the standard form, so a value above 1 means the product leads its market.
| High market share | Low market share | |
|---|---|---|
| High market growth | Star | Question mark (problem child) |
| Low market growth | Cash cow | Dog |
- Stars earn well but need investment to keep share in a growing market.
- Cash cows earn more than they need and fund the rest of the portfolio.
- Question marks need heavy investment and may become stars or fail.
- Dogs earn little. The business may drop them, harvest them, or keep them for a reason (they complete a range, or customers who buy them also buy other products).
Uses. The matrix shows the balance of a portfolio, helps decide where to put limited funds, flags products to drop or rescue, and shows whether future cash will come from today’s cash cows. Limits: it ignores why a market is growing, uses only two measures, depends on how the market is defined, and gives a snapshot rather than a forecast.
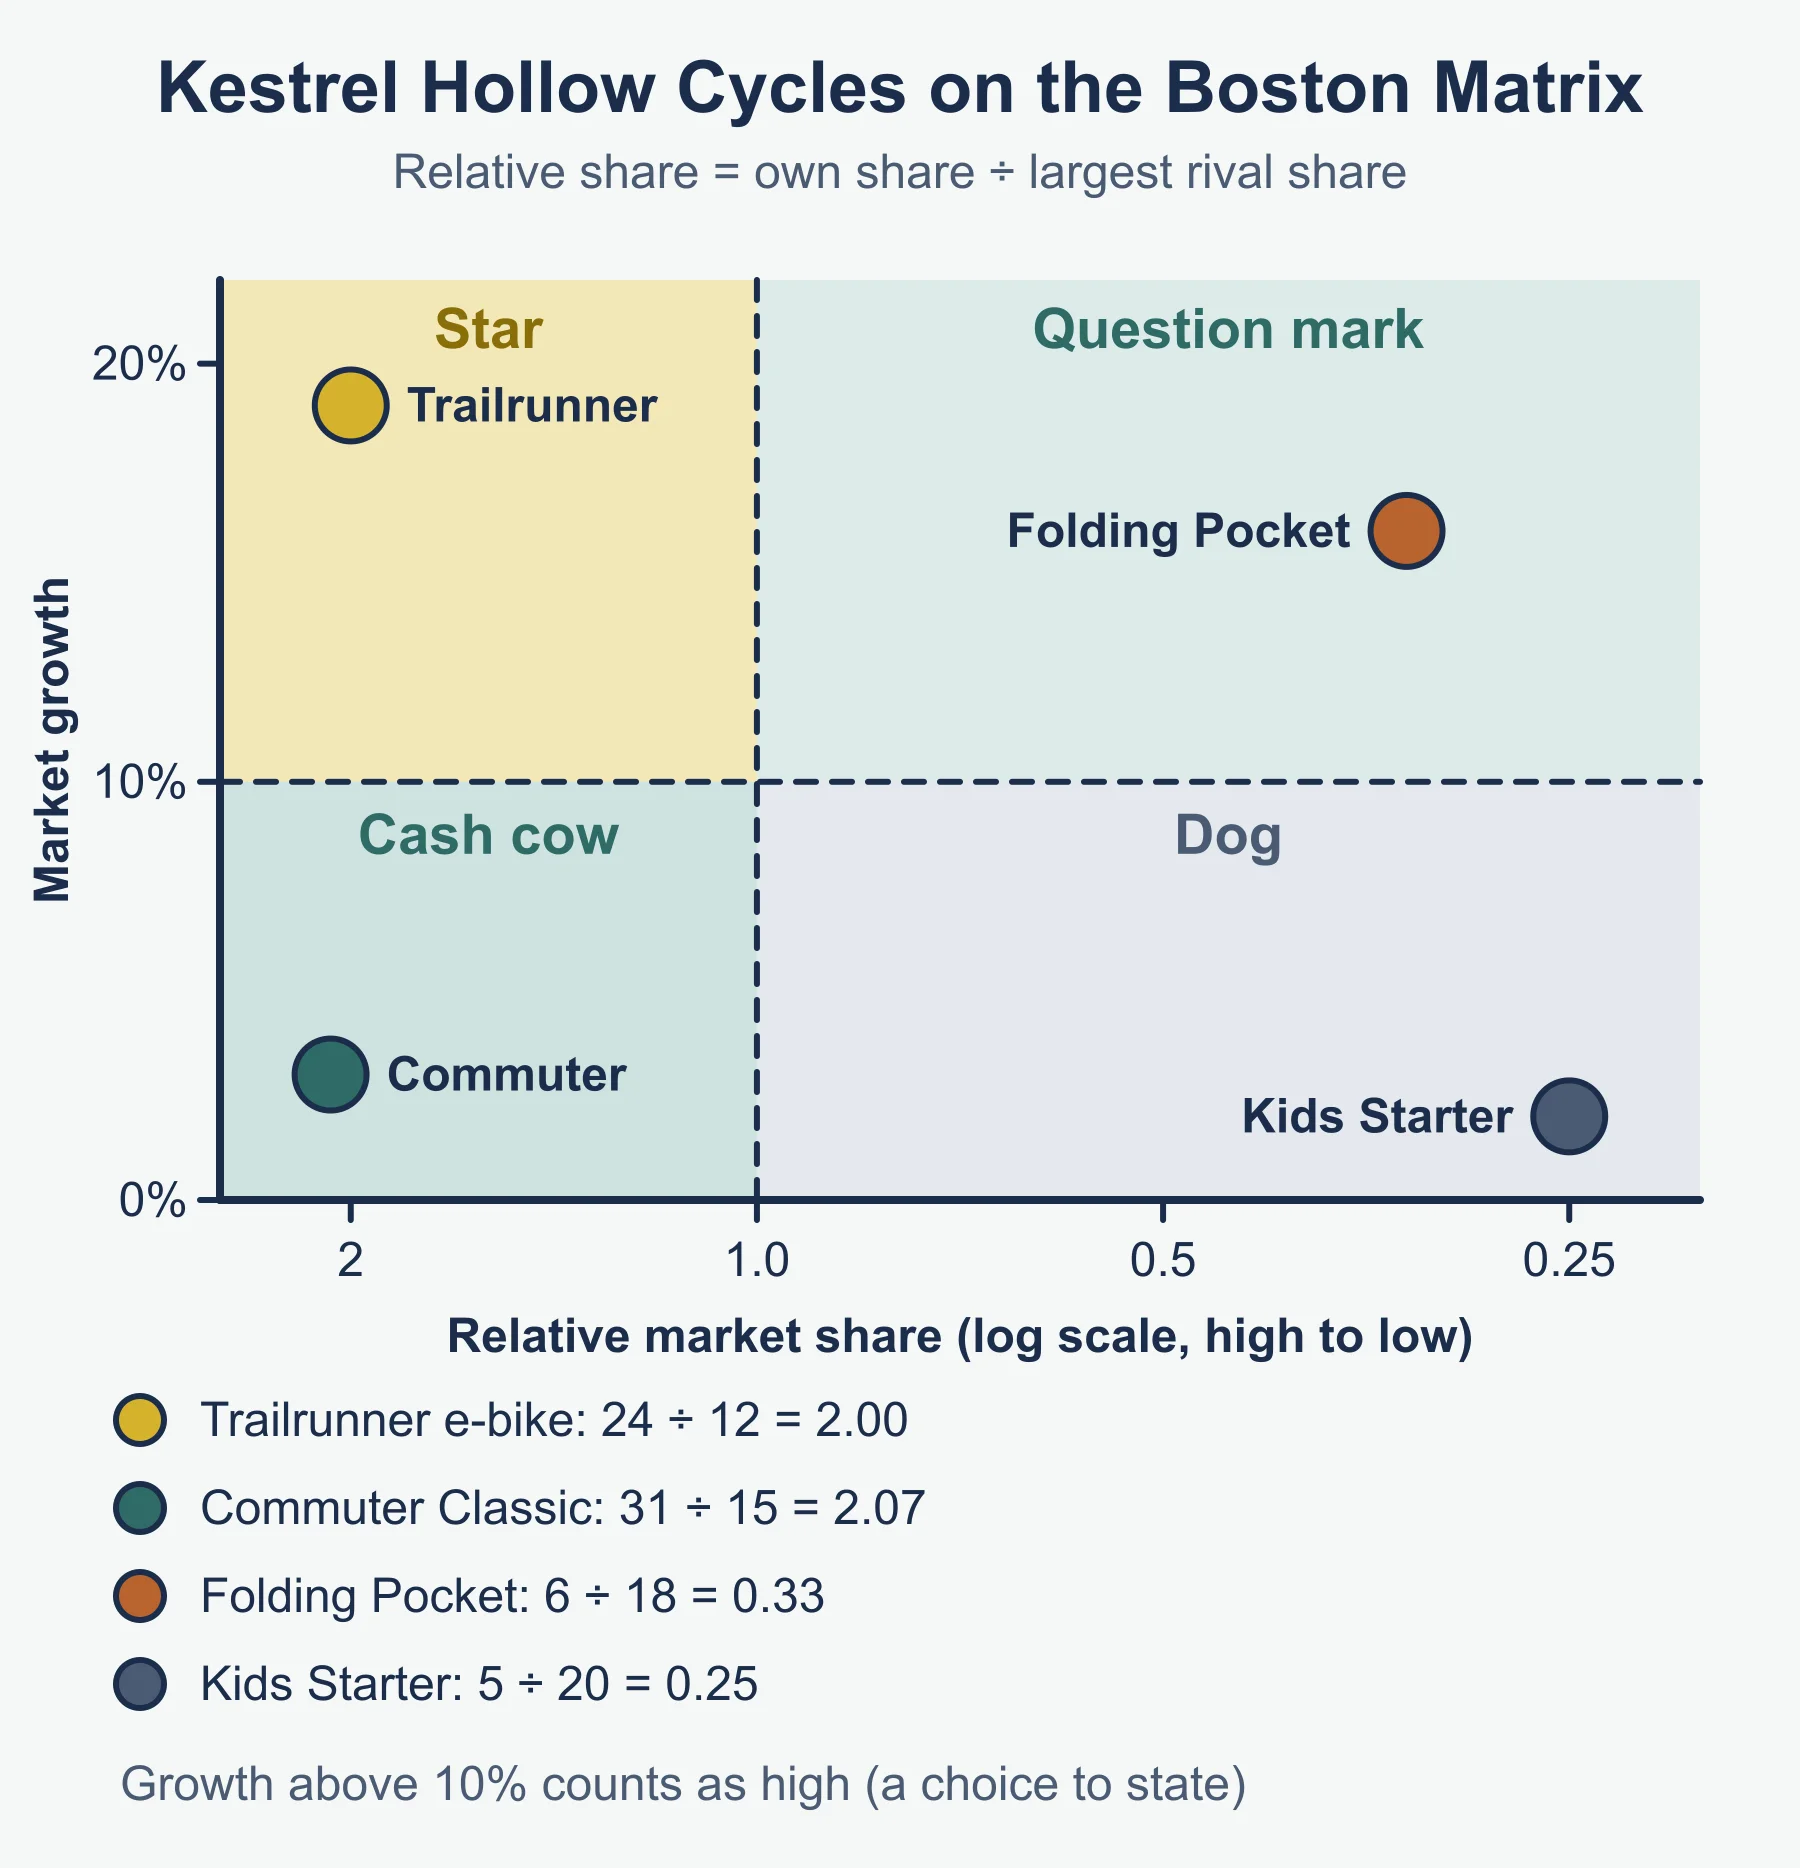
Worked example 3. Kestrel Hollow Cycles has four products.
| Product | Market growth | Own share | Largest rival share | Relative share |
|---|---|---|---|---|
| Trailrunner e-bike | 19% | 24% | 12% | 2.00 |
| Commuter Classic | 3% | 31% | 15% | 2.07 |
| Folding Pocket | 16% | 6% | 18% | 0.33 |
| Kids Starter | 2% | 5% | 20% | 0.25 |
Taking growth above 10% as high, Trailrunner is a star, Commuter Classic a cash cow, Folding Pocket a question mark and Kids Starter a dog. The growth threshold is a choice, so state it. Commuter Classic profits could fund promotion for Folding Pocket, while Kids Starter is reviewed.
Impact on marketing decisions. The matrix and life cycle work together but measure different things. A cash cow is often in maturity, and a dog may be in decline, but a question mark can also be in growth. Use the matrix to decide how much to spend on each product and the life cycle to decide which tactics suit its stage. The mix can differ by product: heavy promotion for the question mark, little for the cash cow.
3.3.4 Pricing methods
Pricing objectives include survival, profit, sales or market share growth, and image. Each method serves some objectives better than others.
| Method | What it is | Useful when | Weakness |
|---|---|---|---|
| Competitive | Set price near or below rivals | Many similar products; price-sensitive customers | Can start a price war; squeezes profit |
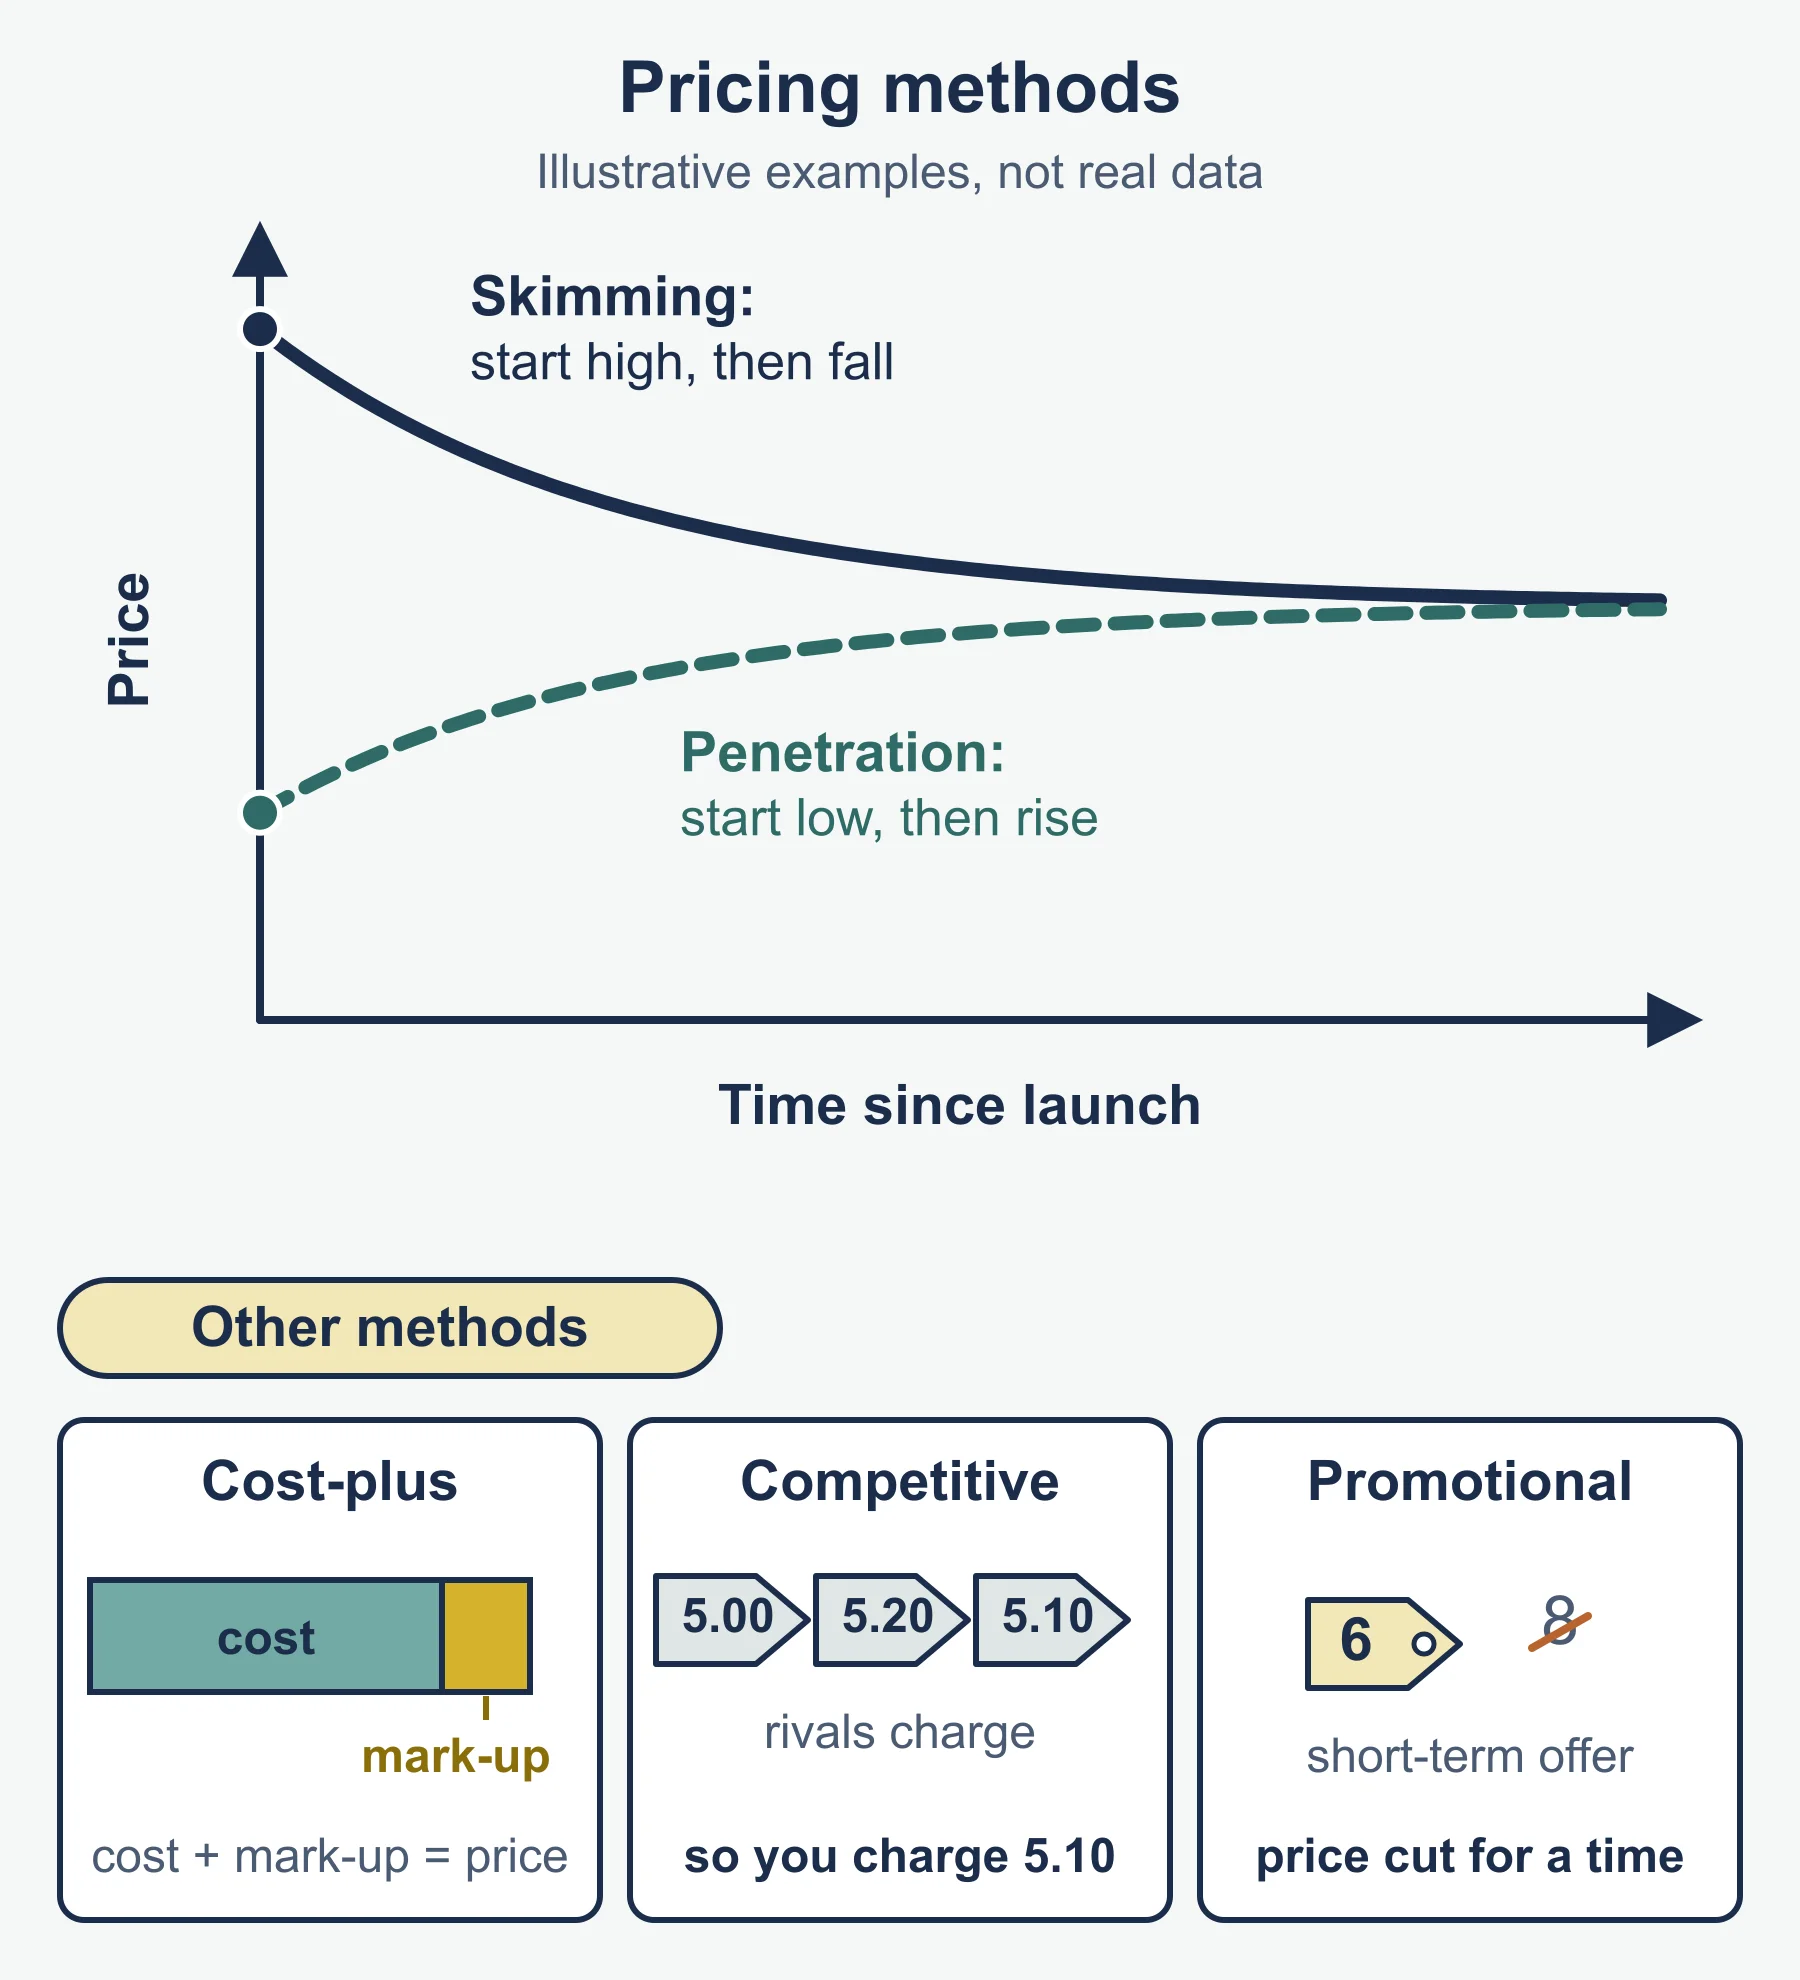
| Penetration | Low initial price to win share fast | New entrant; high repeat purchase; demand price elastic | Low early profit; hard to raise later |
| Skimming | High initial price, lowered later | Novel product; few rivals; keen early buyers | Attracts rivals; slow share growth |
| Price discrimination | Charge different groups different prices for the same product | Segments differ in willingness to pay and can be kept apart | Complaints; leakage between groups |
| Dynamic | Price changes frequently with demand, time or stock | Online sales; perishable capacity; demand varies | Customers may feel treated unfairly |
| Cost-based | Add a margin to cost (cost-plus) | Simple; quick; secure a return | Ignores demand and rivals |
| Psychological | Prices that look lower or signal quality, such as 4.99 | Customers react to price points | Gains small; image risk |
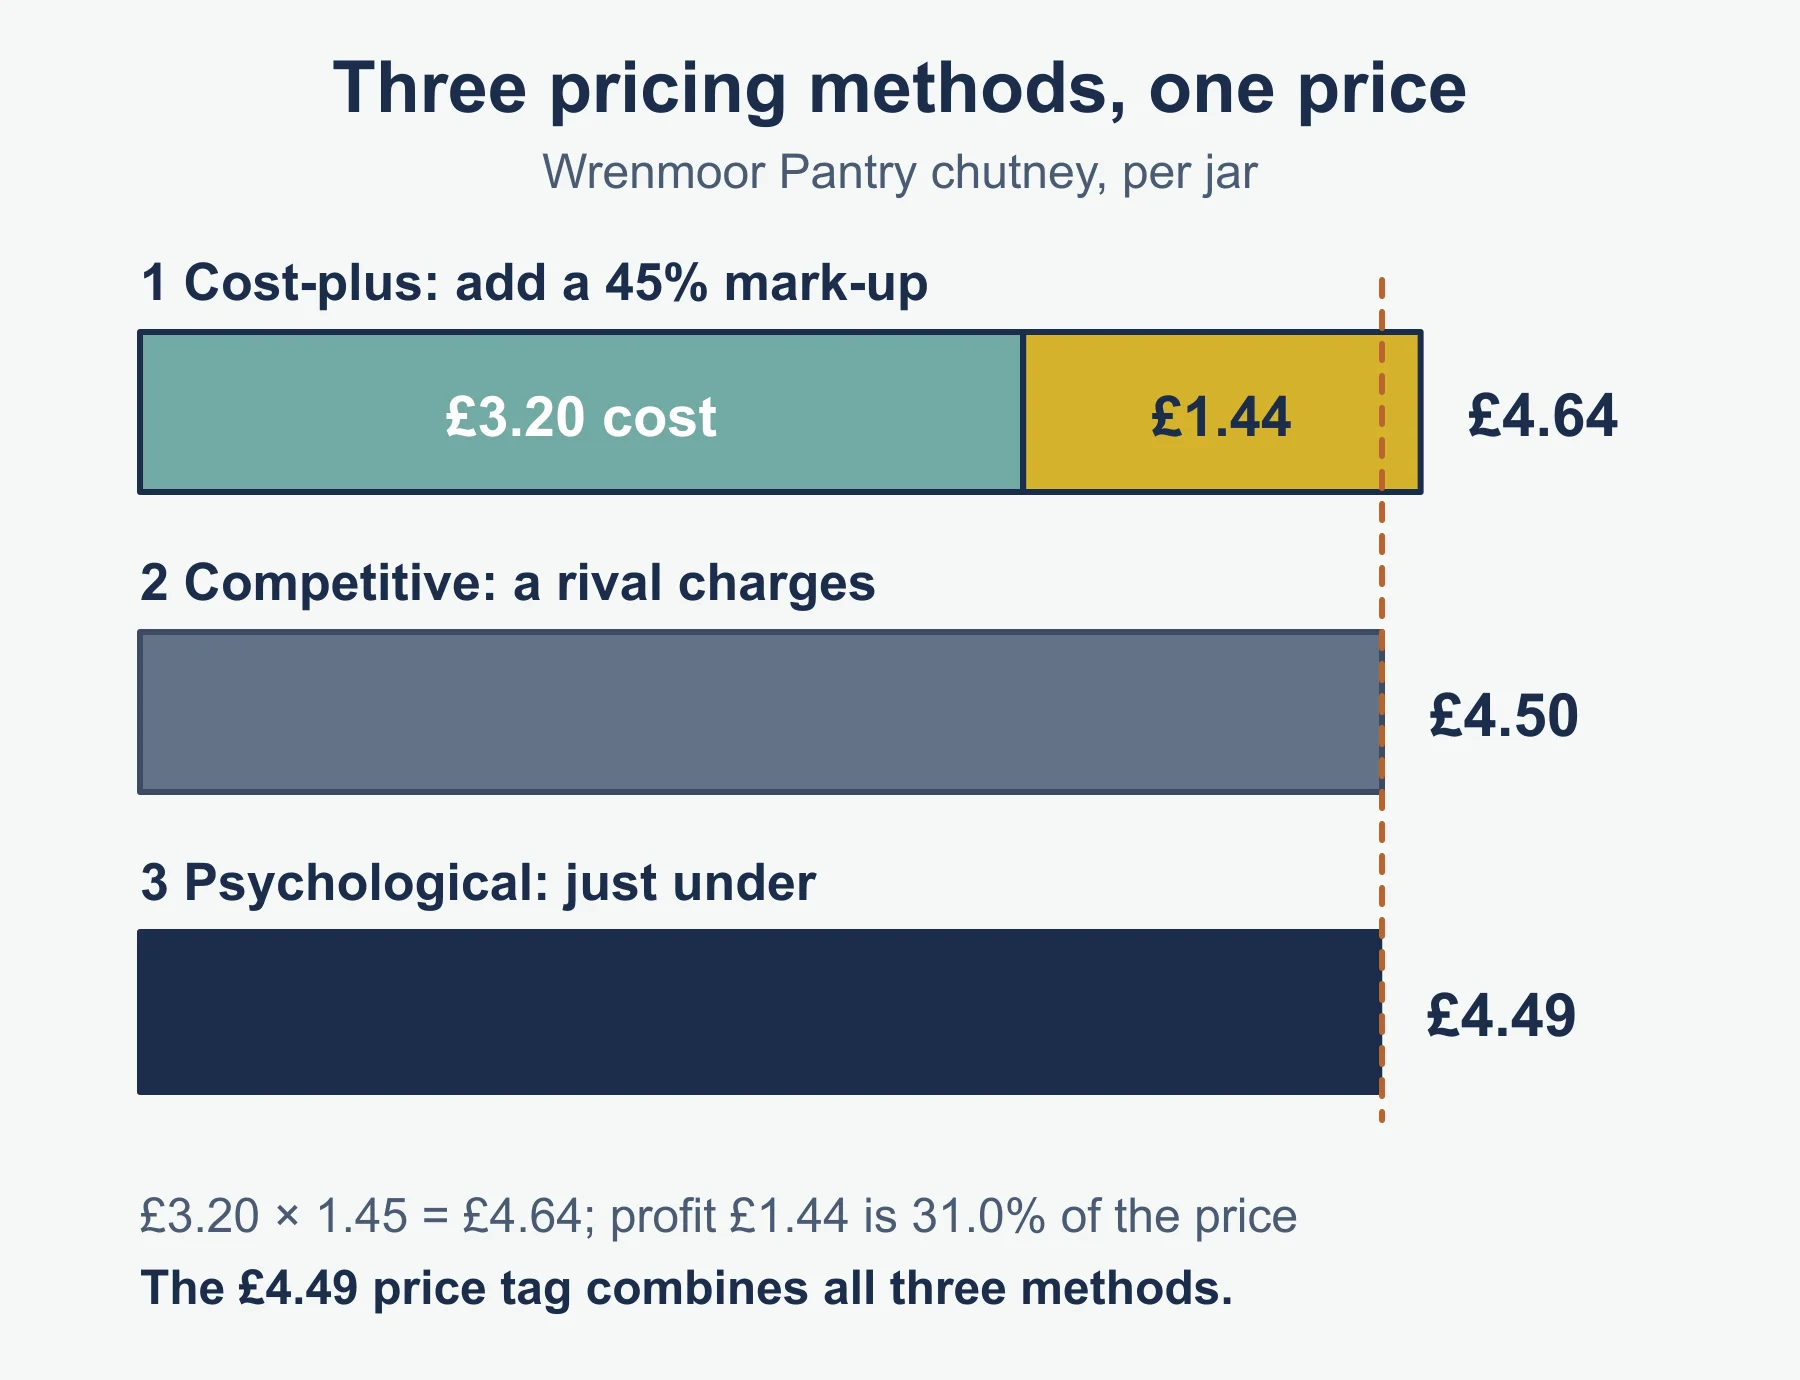
Worked example 4. Wrenmoor Pantry’s chutney costs £3.20 a jar. A 45% mark-up gives £3.20 x 1.45 = £4.64. The profit is £1.44 a jar, which is 31.0% of the price. A rival sells similar jars at £4.50, so Wrenmoor may round to £4.49, combining cost-plus with competitive and psychological pricing.
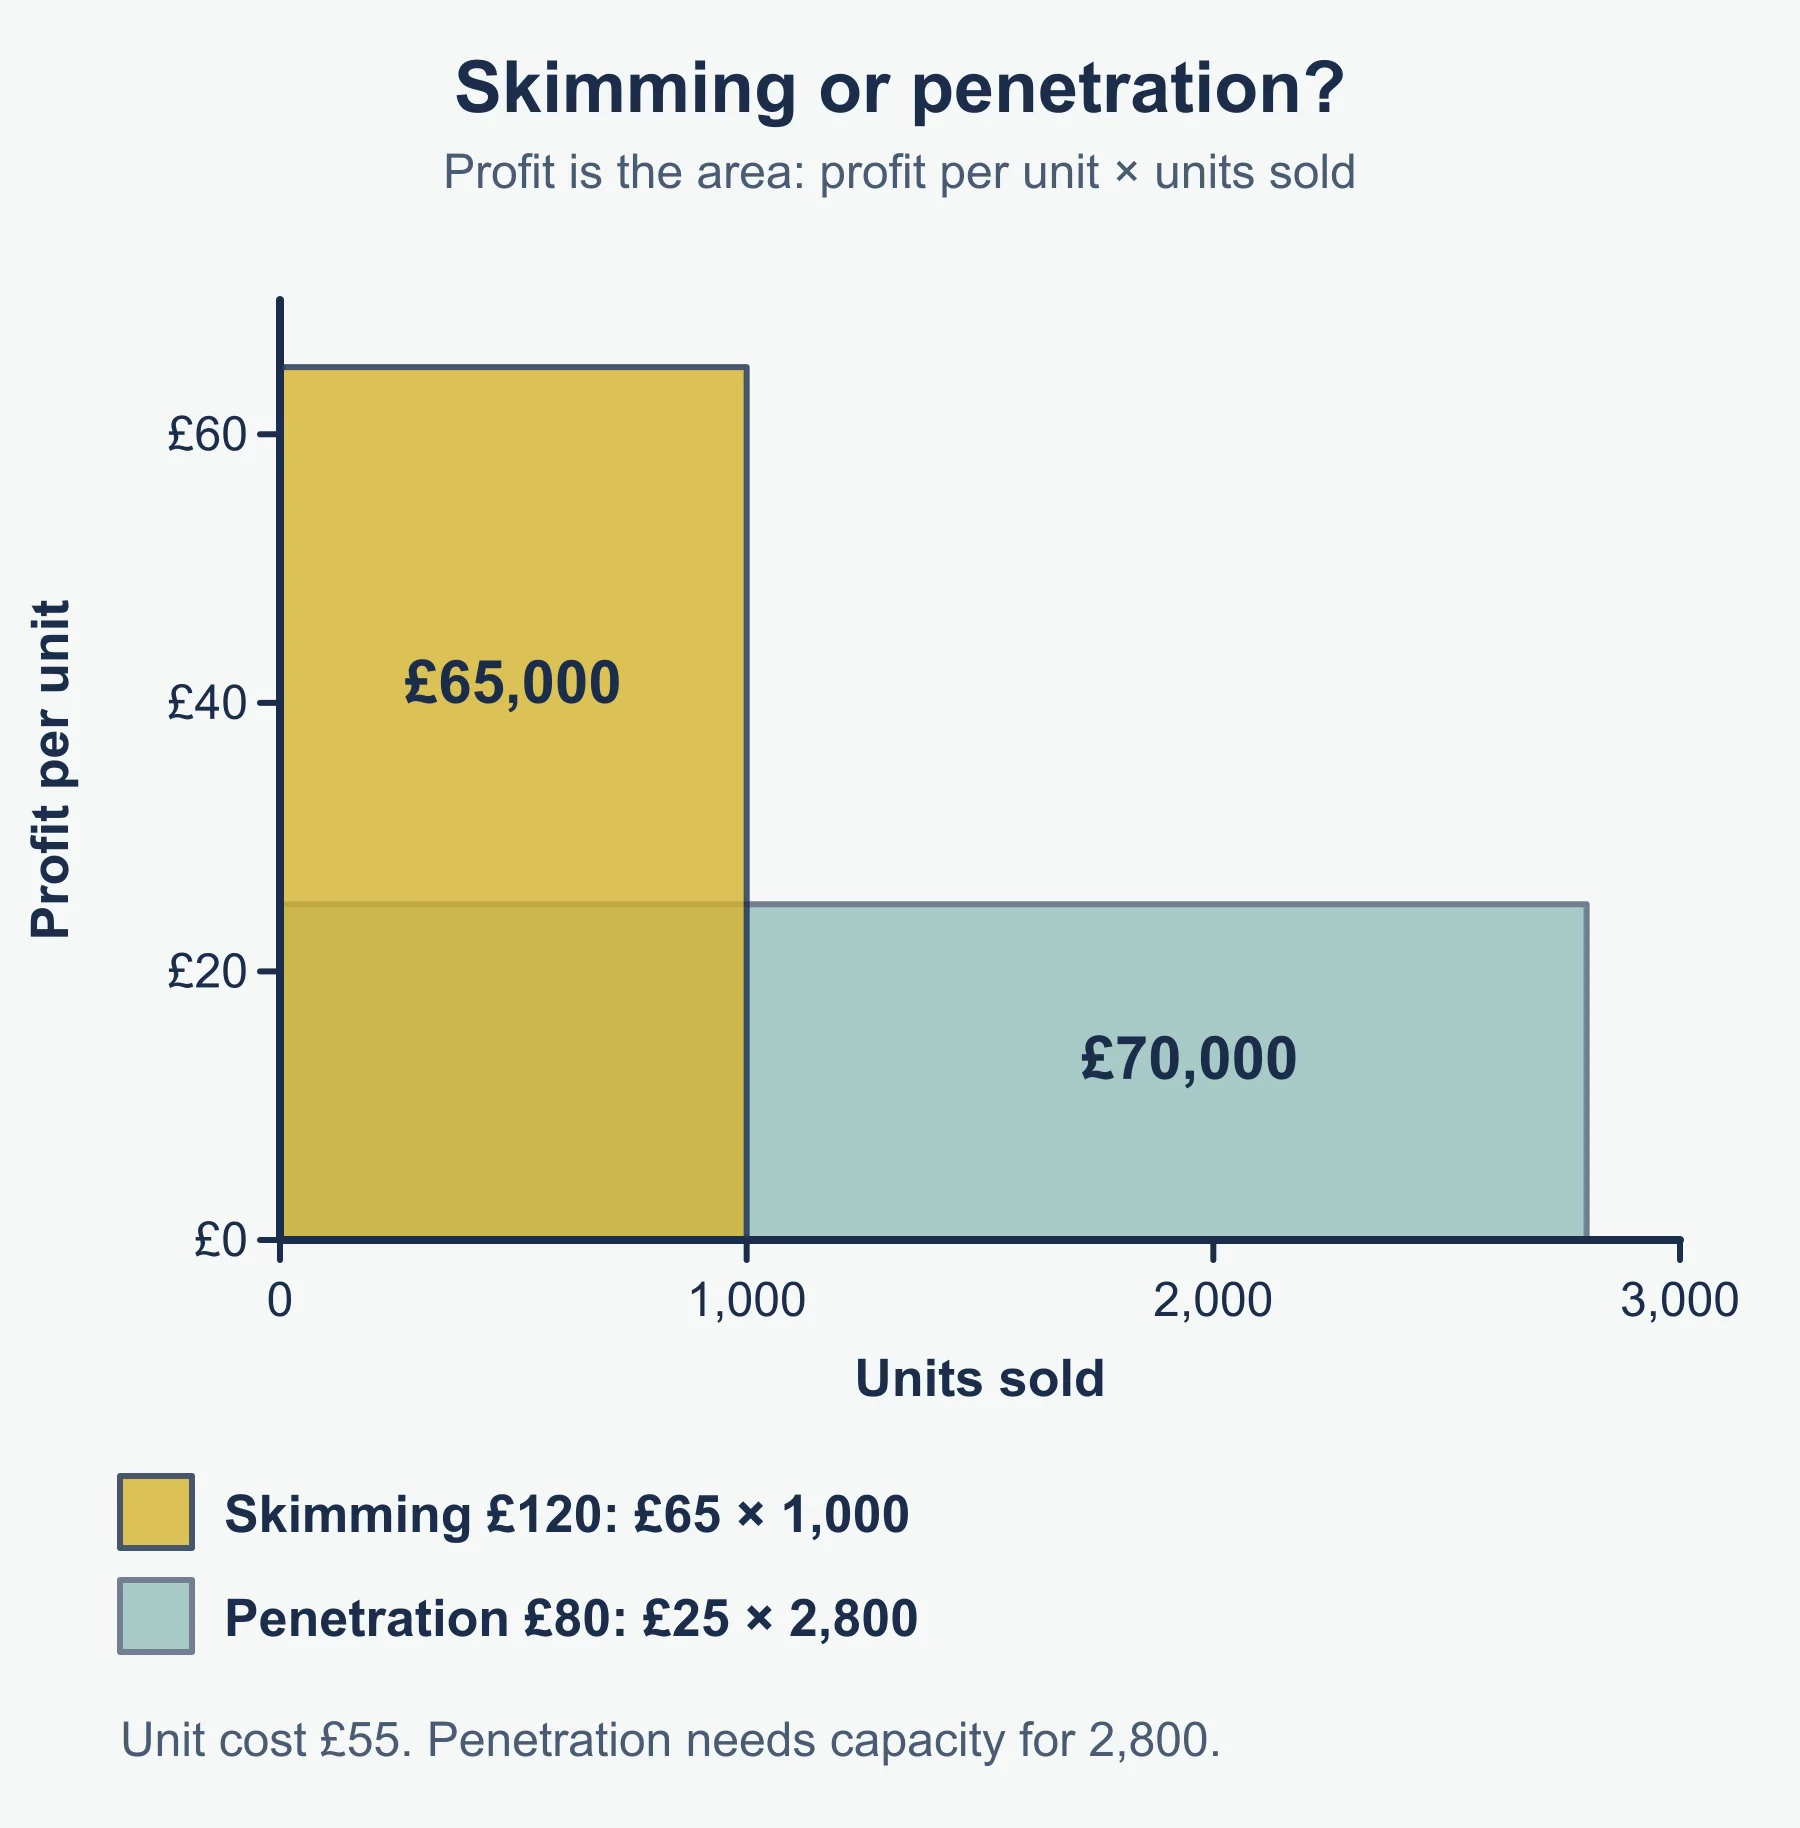
Worked example 5. A new gadget costs £55 a unit. Skimming at £120 sells 1,000 units, a profit of 1,000 x £65 = £65,000. Penetration at £80 sells 2,800 units, a profit of 2,800 x £25 = £70,000. Penetration earns more here, but it needs capacity for 2,800, and the figures are estimates. Judge the choice by the objective: profit now, or share.
3.3.5 Promotion methods
Promotion aims to inform, persuade and remind, to raise awareness, build image and increase sales. Its usefulness depends on the target market, the budget and the product.
- Advertising promotion: paid messages in media (television, print, radio, online, outdoor). It reaches many people and builds image, but costs a lot and effects are hard to measure.
- Sales promotion: short-term incentives such as discounts, free samples, buy-one-get-one-free, competitions and loyalty points. They lift sales quickly and can launch products, but may cut margins and train customers to wait for deals.
- Direct promotion: contact aimed at named customers, such as direct mail, email, telesales and personal selling. Targeted and measurable, but can annoy people and costs more per contact.
- Developments in digital promotion: social media, search advertising, email campaigns, influencers, mobile apps and targeted online advertising. They are lower cost per contact, easy to target and measure, and allow two-way contact. Risks: bad reviews spread fast and customers may avoid adverts.
- Role of packaging: it protects the product, but also attracts attention, shows brand, gives information and can signal quality or fit a price point. Costly or wasteful packaging can hurt margins and image.
- Role of branding: a brand (name, logo, design, reputation) makes a product recognisable, supports differentiation and a higher price, and builds loyalty. It is costly to build and can be damaged by one scandal.
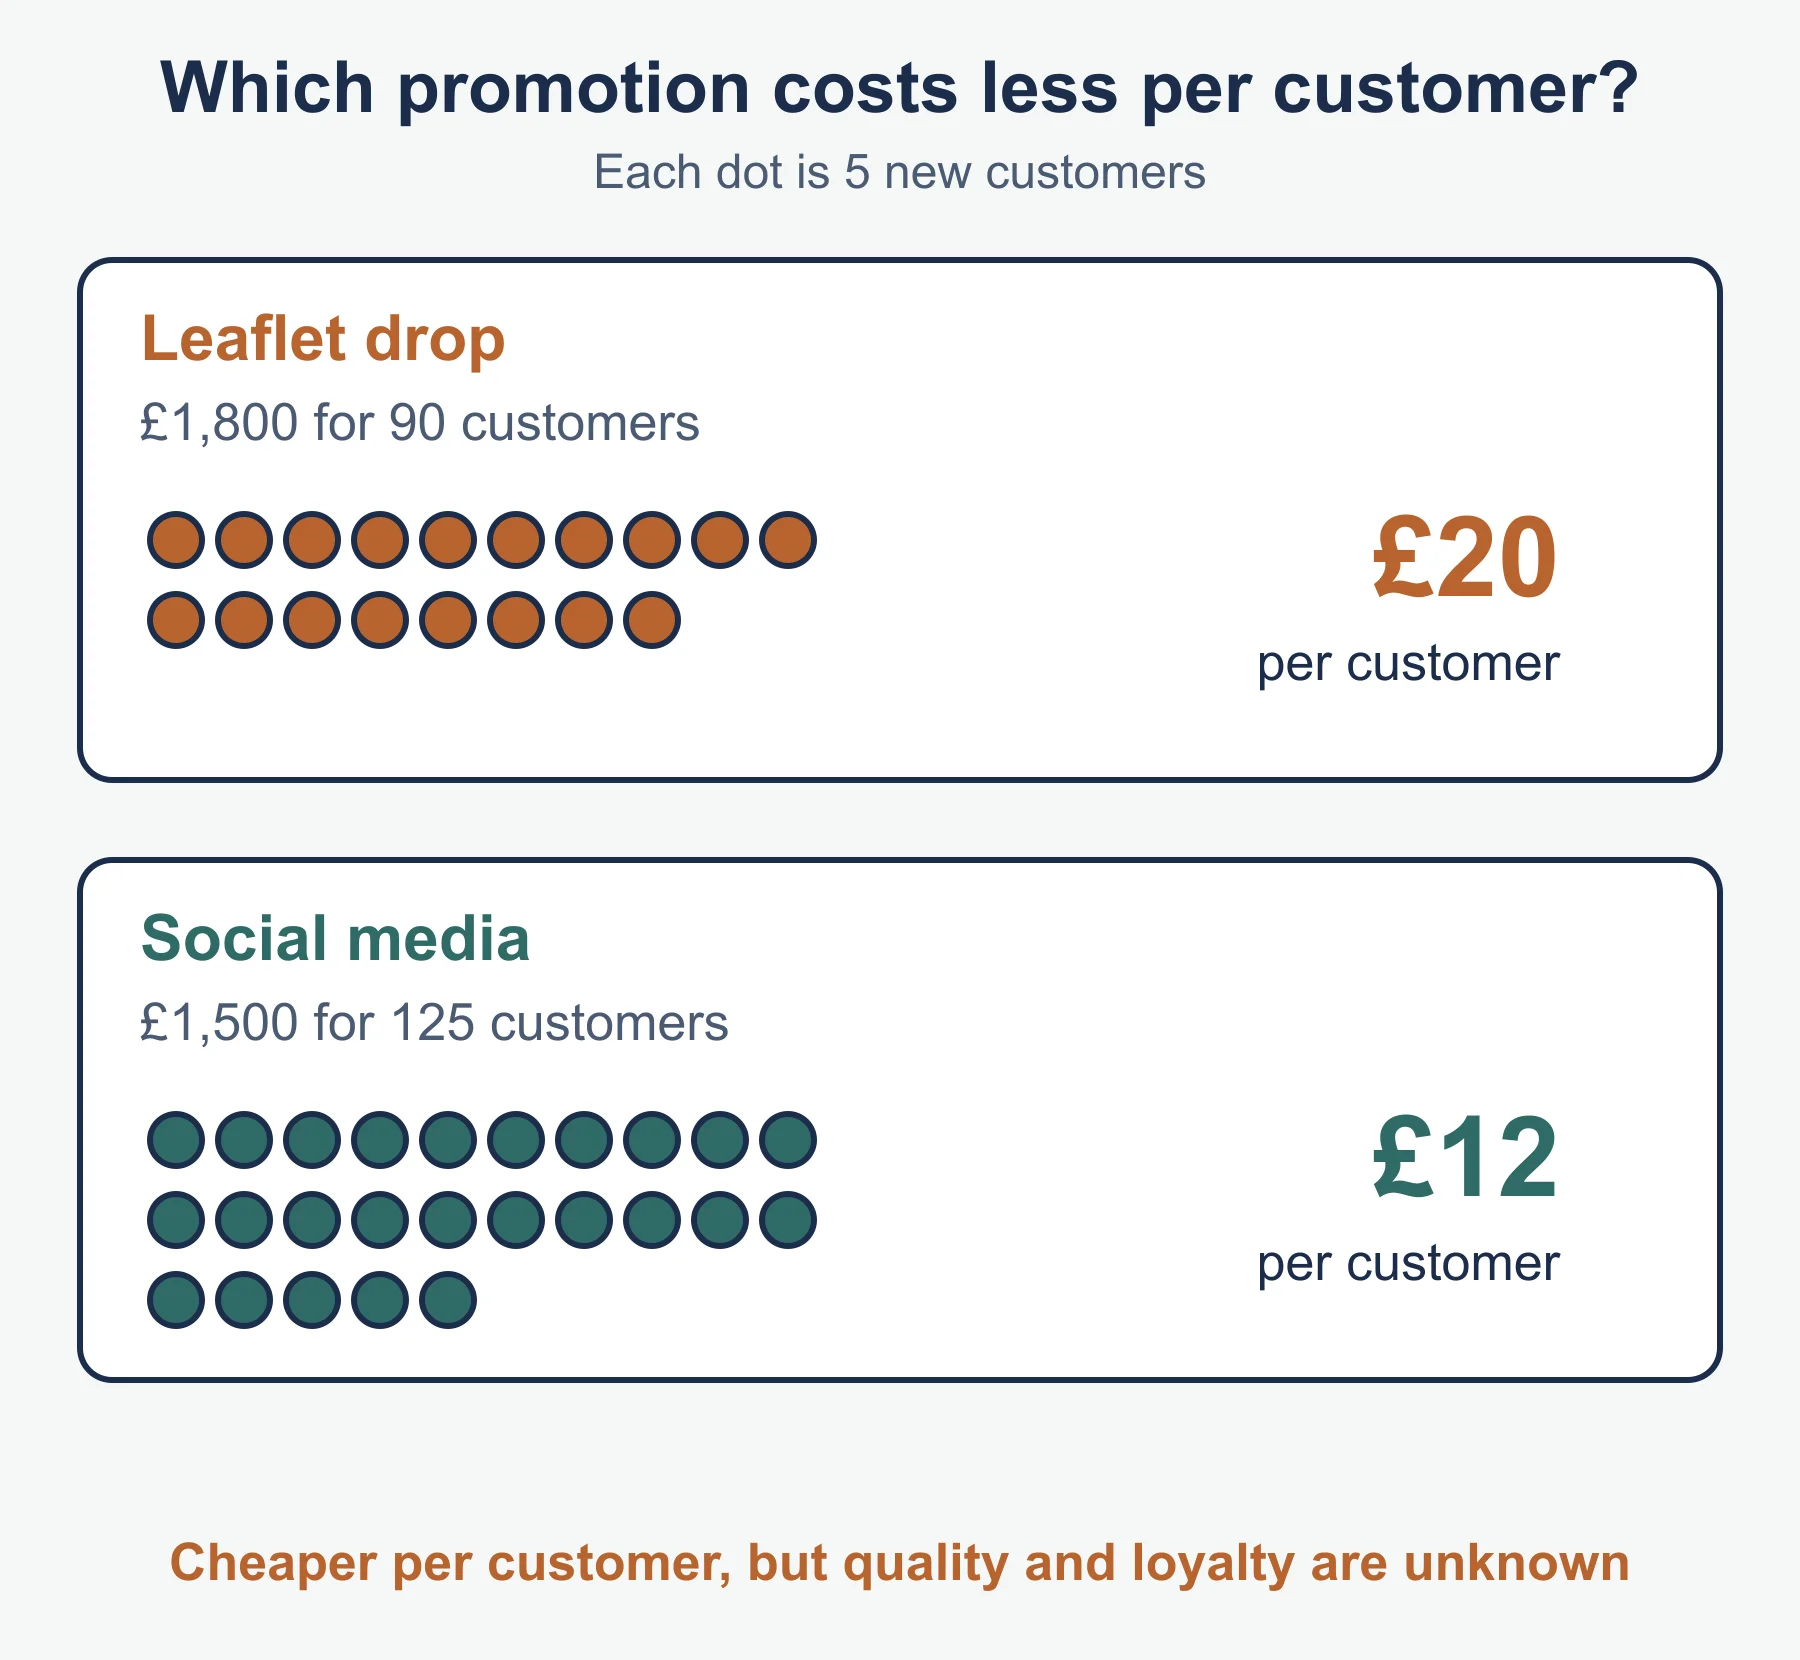
Worked example 6. Wrenmoor Pantry tests two methods. A leaflet drop costs £1,800 and wins 90 new customers: £20 each. Social media costs £1,500 and wins 125: £12 each. Social media is cheaper per customer, but the figures say nothing about customer quality or lasting loyalty.
3.3.6 Place (channels of distribution)
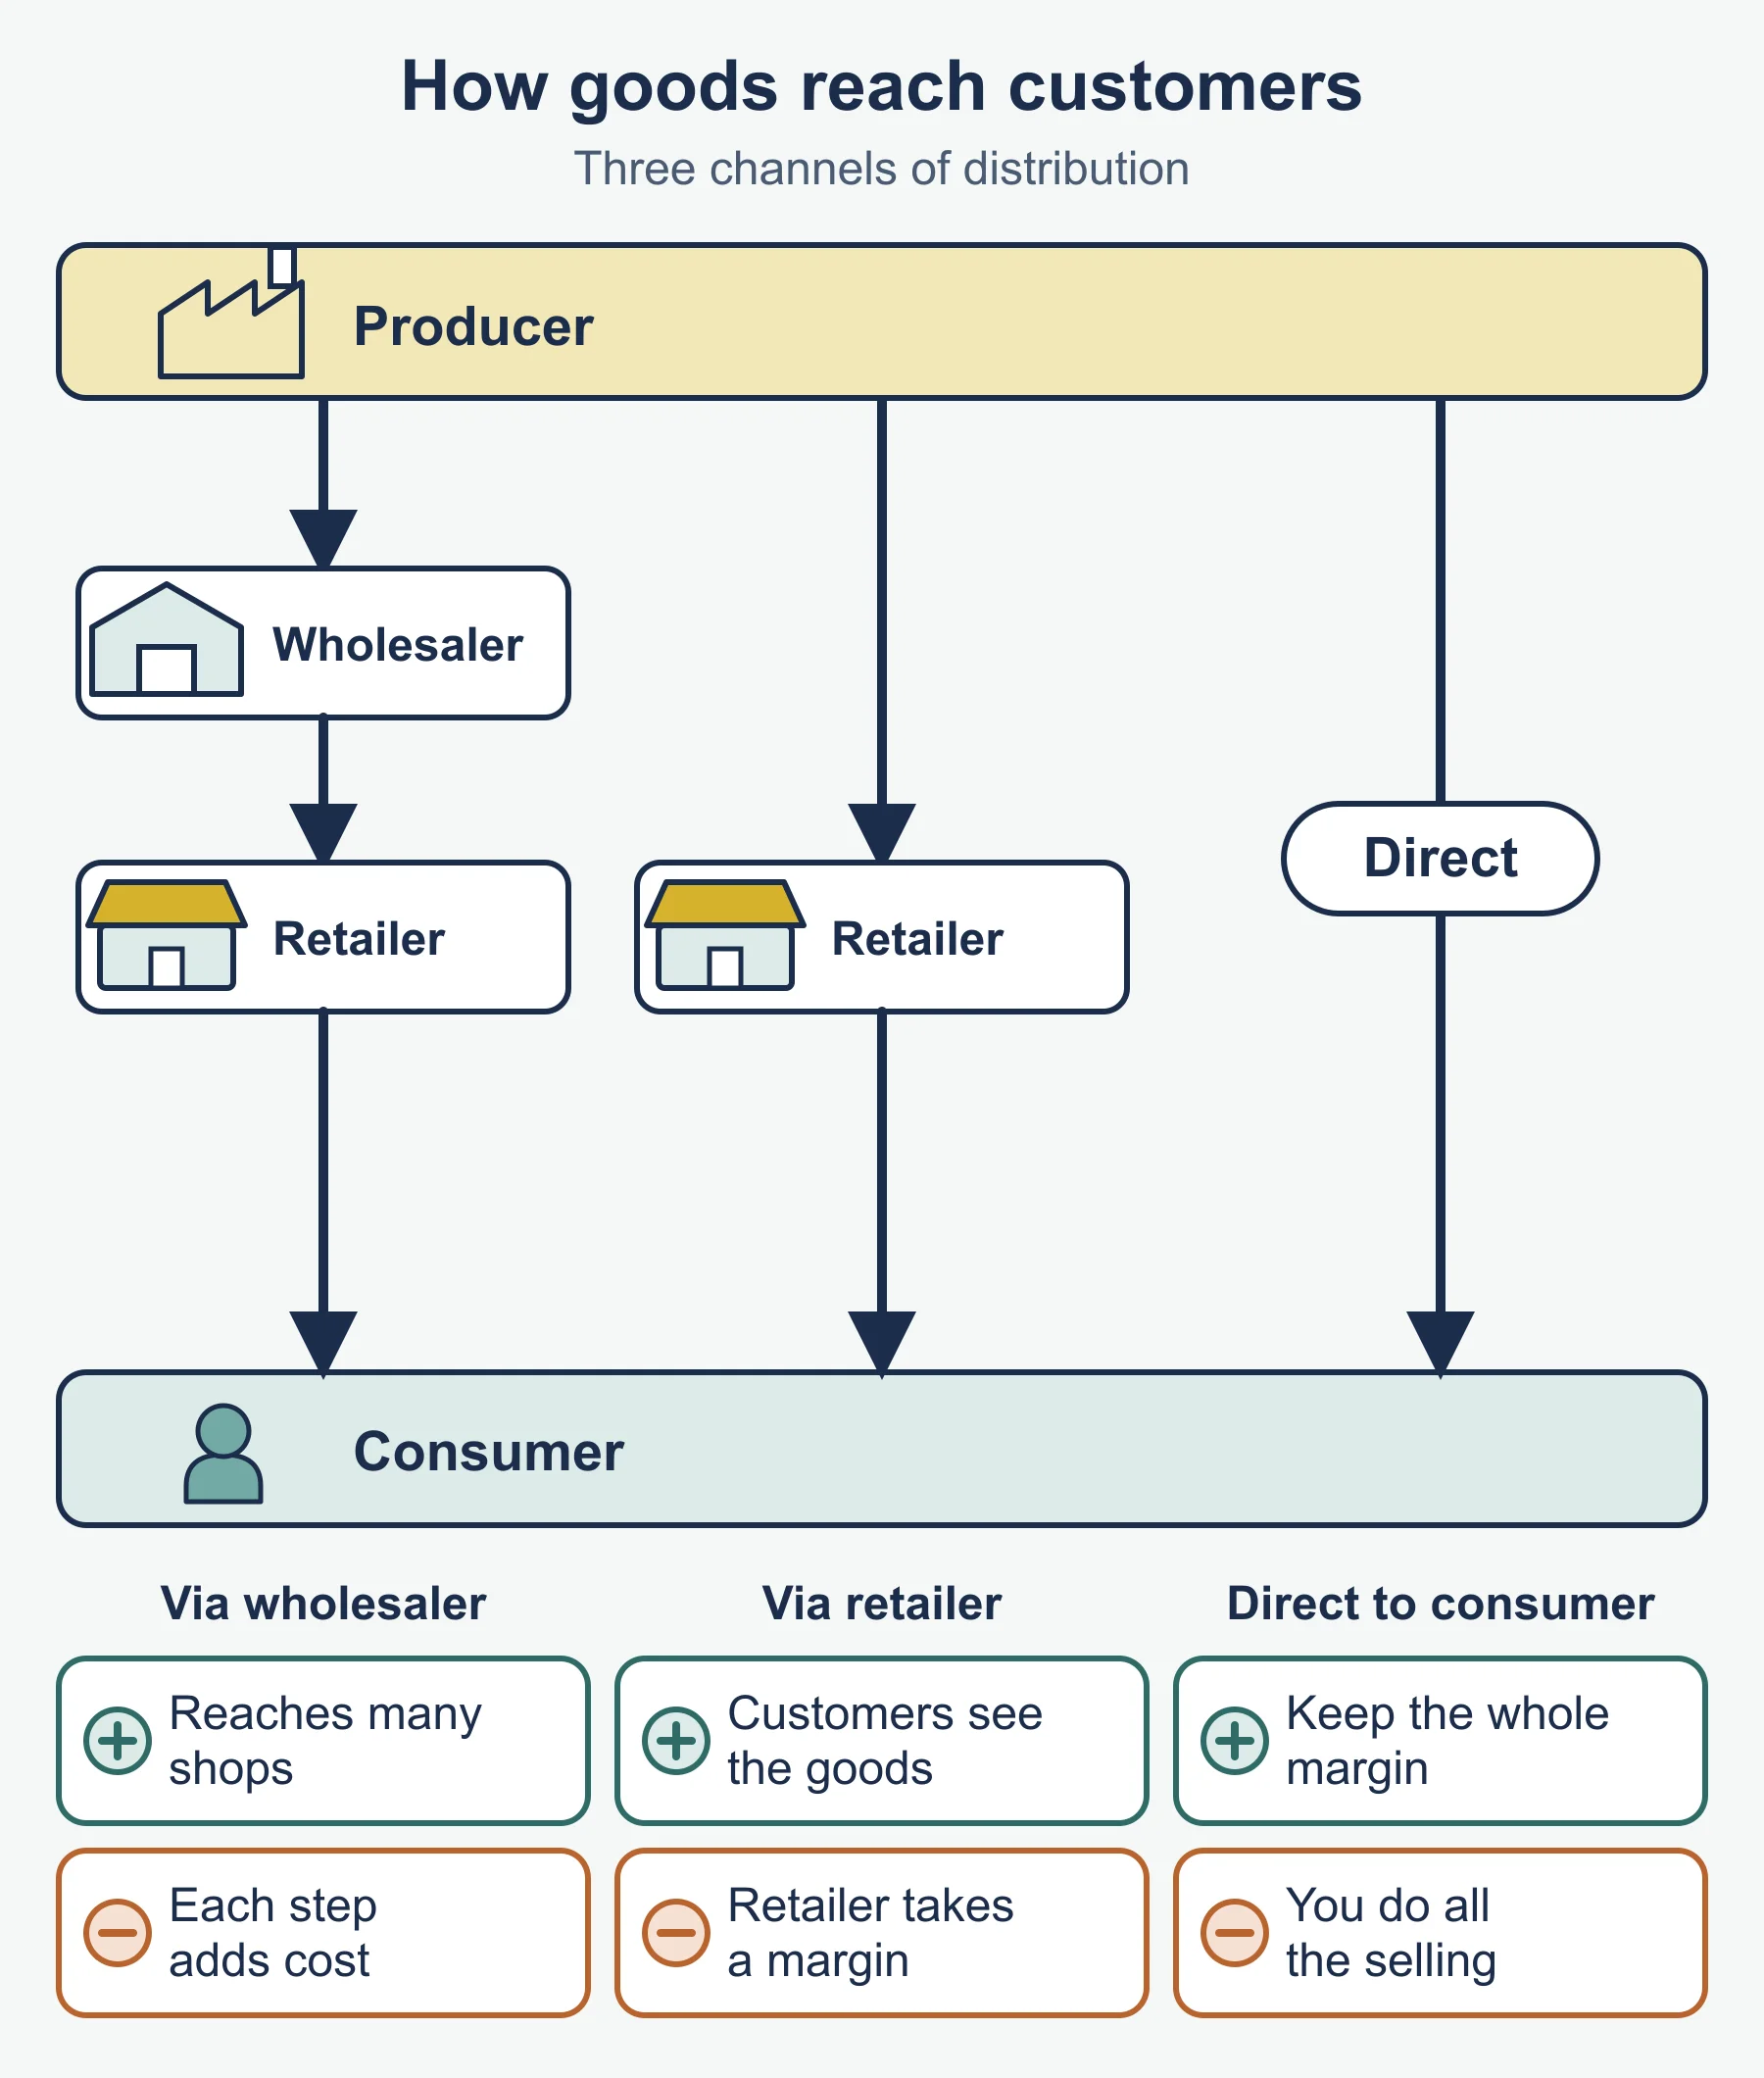
A channel of distribution is the route a product takes from producer to customer. Objectives include reaching the target customers, controlling the brand, keeping costs low and getting the product available at the right time. Common channels: producer to consumer (direct), producer to retailer to consumer, and producer to wholesaler to retailer to consumer.
| Channel | Advantages | Disadvantages |
|---|---|---|
| Direct (own shop, own site) | Keeps whole price; control of brand; customer data | Producer carries the cost of selling and delivery; limited reach |
| Via retailer | Wide reach; retailer stocks and displays; less work | Retailer takes a margin; less control |
| Via wholesaler | Breaks bulk; helpful for many small retailers | Another margin; further from customers |
Digital and physical distribution. Physical distribution uses shops, vans and warehouses and suits products people want to see, try or take home today. Digital distribution means selling online, through a website or marketplace, and for digital products (music, software) also delivering online at almost no extra cost. Online selling widens reach but means delivery costs, returns and website upkeep. Many businesses use both.
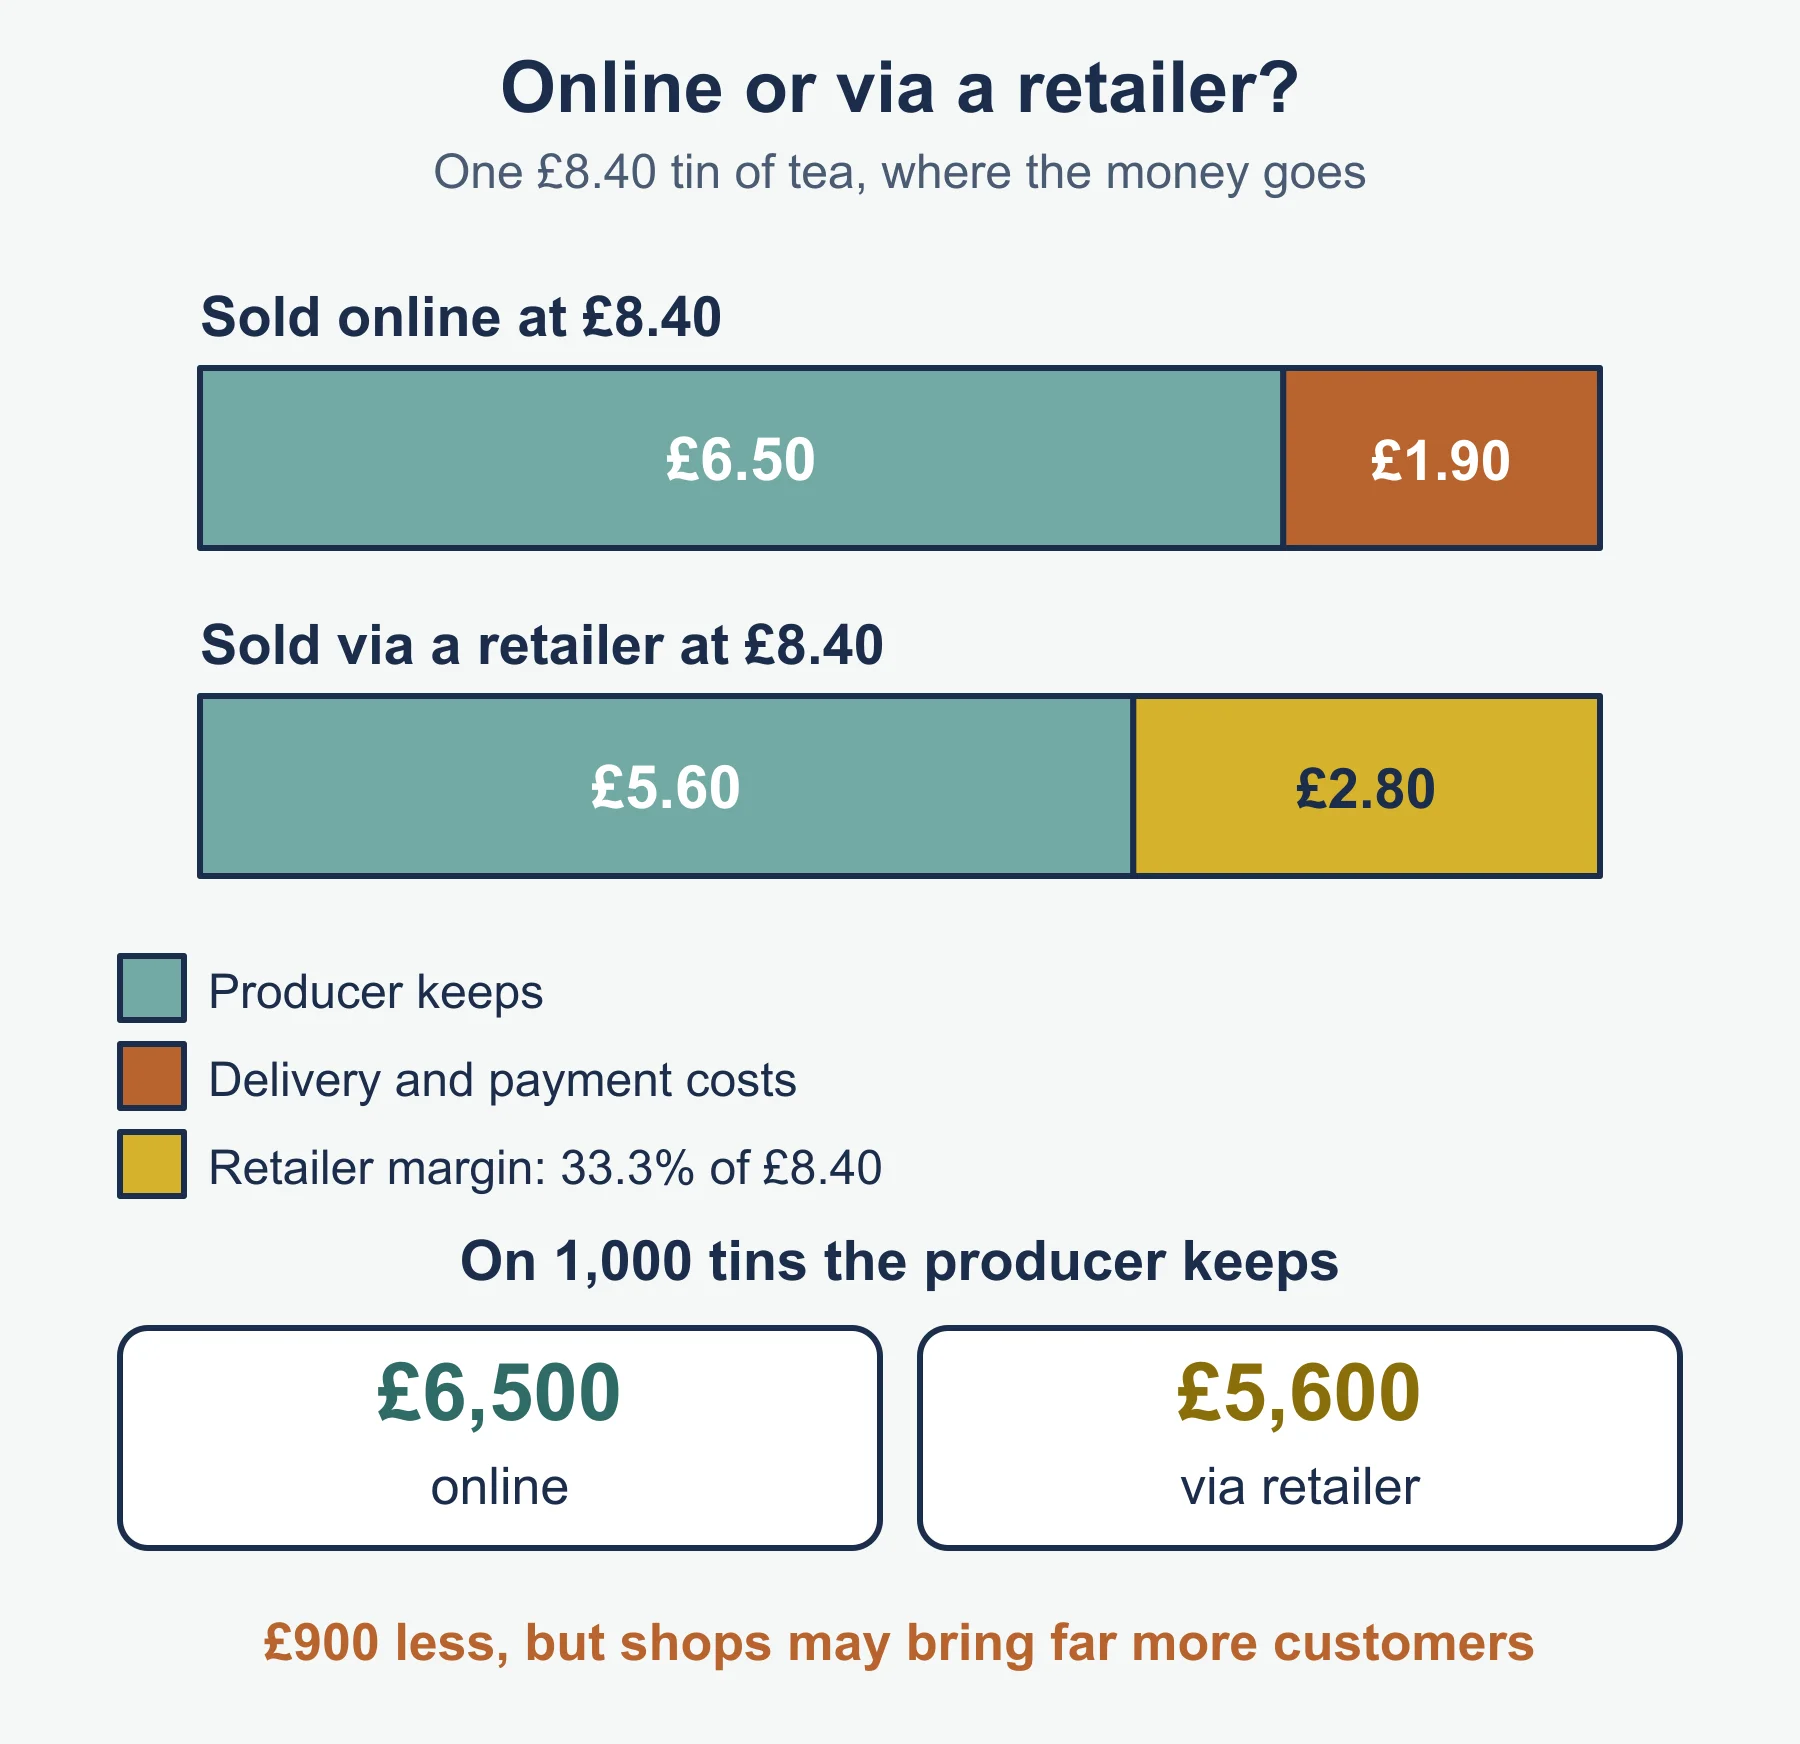
Worked example 7. Thornwick Quay Teas sells a tin for £8.40 online. Delivery and payment costs are £1.90 a tin, so it keeps £6.50. A retailer buys from it at £5.60 and sells at £8.40, a retailer margin of 33.3%. On 1,000 tins, online gives £6,500 and retail £5,600, £900 less. Retail may still win if the shops deliver far more customers.
Common errors
- Explaining a tool in general terms and never tying it to the firm in the stem.
- Treating the Boston Matrix and life cycle as the same tool.
- Saying penetration pricing always means selling below cost. It means a low initial price.
- Assuming a high price always raises profit, ignoring the fall in sales.
- Listing promotion methods without judging fit to the target customers and budget.
Frequently asked questions
What is the difference between a good and a service? A good is a physical item that can be touched and stored. A service is an activity carried out for a customer that cannot be stored.
What is the difference between product differentiation and a USP? Product differentiation means making a product stand out from rivals through design, quality, service or image. A unique selling point is a specific feature that rivals do not offer and that customers value.
Does penetration pricing mean selling below cost? No. Penetration pricing means a low initial price to win market share quickly, usually for a new entrant; it does not have to be below cost.
What are the roles of packaging and branding in promotion? Packaging protects the product but also attracts attention, shows the brand, informs and signals quality. Branding makes a product recognisable and can support loyalty and a higher price.
Official syllabus
Cambridge International, Cambridge International AS & A Level Business 9609 syllabus for examination in 2026, 2027 and 2028, section 3.3 The marketing mix.
Get free revision emails (optional)
Occasional emails with practice questions, worked explanations and links to free resources for the qualification and subjects you choose. No spam, and you can unsubscribe from any email. The free tools on this site never need an email.
Related resources
-
Practice questions
A Level Business: The marketing mix (Cambridge 9609) – Practice Questions
Original practice questions with worked answers on 3.3 The marketing mix for Cambridge AS & A Level Business 9609: short answer, calculation, case study.
Business · Cambridge · AS Level
Try questions -
Revision notes
A Level Business: The marketing mix (Cambridge 9609) – Revision Notes
Condensed revision notes for section 3.3 The marketing mix in Cambridge AS & A Level Business 9609, with a quick self-test and common mark losses.
Business · Cambridge · AS Level
Revise topic -
Study guides
A Level Business: The nature of marketing and Market research (Cambridge 9609)
Full study guide to Cambridge A Level Business 9609 sections 3.1 and 3.2: demand and supply, markets, segmentation, CRM, sampling and market research data.
Business · Cambridge · AS Level
Read guide
Related articles
-
teaching
A Level tuition in Dubai: Cambridge or Pearson Edexcel International A Level?
Schools in Dubai and Abu Dhabi teach either Cambridge International AS & A Level or Pearson Edexcel International A Level. How the two are structured, why it matters for tuition, and how online classes from Lahore work.
9 October 2026
-
curriculum guides
Choosing subjects at IGCSE and A Level
How subject choices at 14 and 16 affect university options later, and how to keep pathways open without overloading a timetable.
28 July 2026
Studying this with a teacher
Working through Business AS LEVEL?
This page is free and stays free. If you would rather be taught it, Marlbridge runs Business classes one-to-one and in small groups of up to 15, online in your own time zone. The first trial class is free. WhatsApp replies within an hour (8am–11pm Pakistan time, every day); email the same day.
Cambridge Business teachers at Marlbridge

