
Revision Notes
A Level Business: The marketing mix (Cambridge 9609) – Revision Notes
Condensed revision notes for section 3.3 The marketing mix in Cambridge AS & A Level Business 9609, with a quick self-test and common mark losses.
- Subject
- Business
- Level
- AS LEVEL
- Topic
- Marketing
- Author
- Marlbridge Academic Team
- Updated
- Reviewed by
- Salman Ahmad (what this means)
Aligned to Cambridge A Level Business (9609), For examination in 2026, 2027 and 2028. Official specification .
Syllabus page (what it covers and how it is assessed): Cambridge A Level Business.
Syllabus points this page covers
9609 (AS Level)
- 3.3 The marketing mix
Found an error? Report a correction.
Need help with this topic? Request a free trial class for A Level Business (9609).
Condensed notes for section 3.3 The marketing mix (3.3.1 to 3.3.6) of the Cambridge International AS & A Level Business 9609 syllabus for examination in 2026, 2027 and 2028. This is AS Level content that A Level candidates also need. For full explanations and worked examples, read the study guide. Then test yourself with the practice questions. Course links: Cambridge A Level Business hub, checklist, free diagnostics and the wider Marketing revision notes. All businesses and figures here are invented.
The big picture
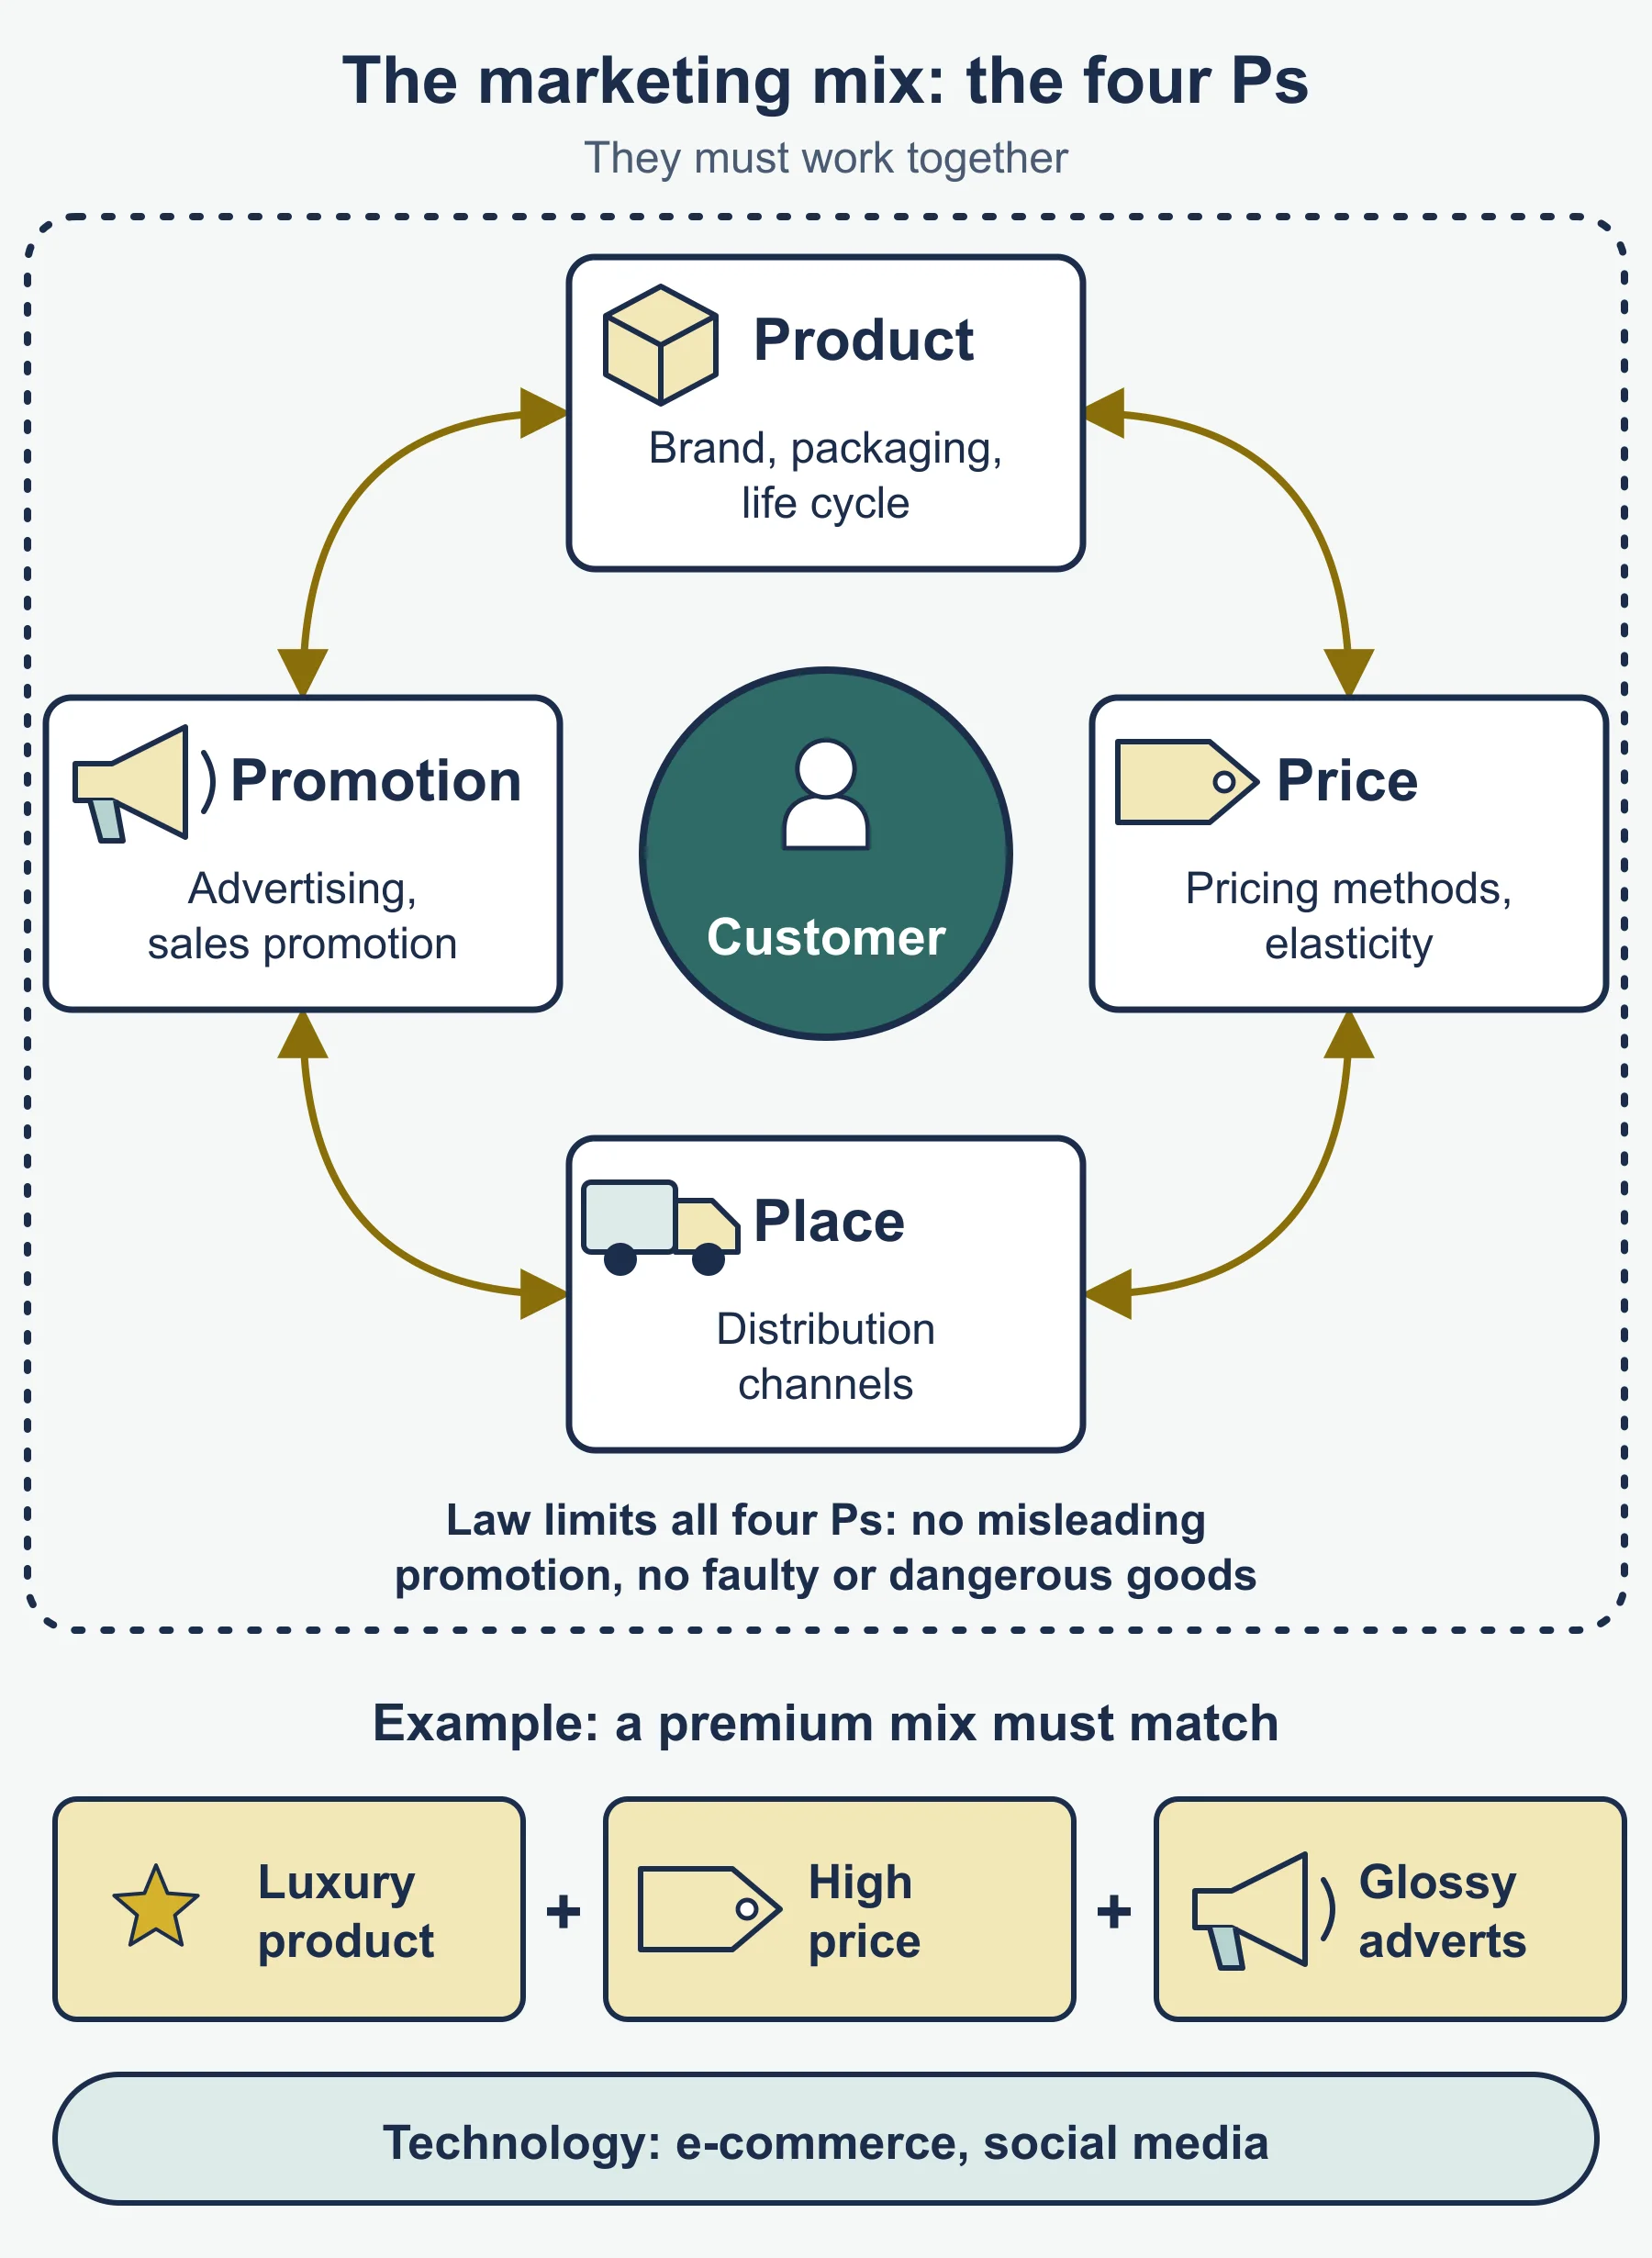
The mix is Product, Price, Promotion, Place (distribution channels). The skill is to recommend a mix that suits one business in one context. In any answer, name the method, tie it to a detail in the case, then weigh it up.
| Ref | Topic | One-line anchor |
|---|---|---|
| 3.3.1 | The 4Ps | The elements must fit together and fit the target customers |
| 3.3.2 | Product | Goods v services; tangible v intangible; development; differentiation; USP |
| 3.3.3 | Portfolio analysis | Life cycle and extension strategies; Boston Matrix |
| 3.3.4 | Pricing | Seven named methods |
| 3.3.5 | Promotion | Advertising, sales, direct, digital; packaging; branding |
| 3.3.6 | Place | Channels; digital and physical distribution |
3.3.2 Product: definitions
| Term | Meaning | Quick example |
|---|---|---|
| Good | Physical item you can touch and store | A lamp |
| Service | Activity; not stored | A boiler repair |
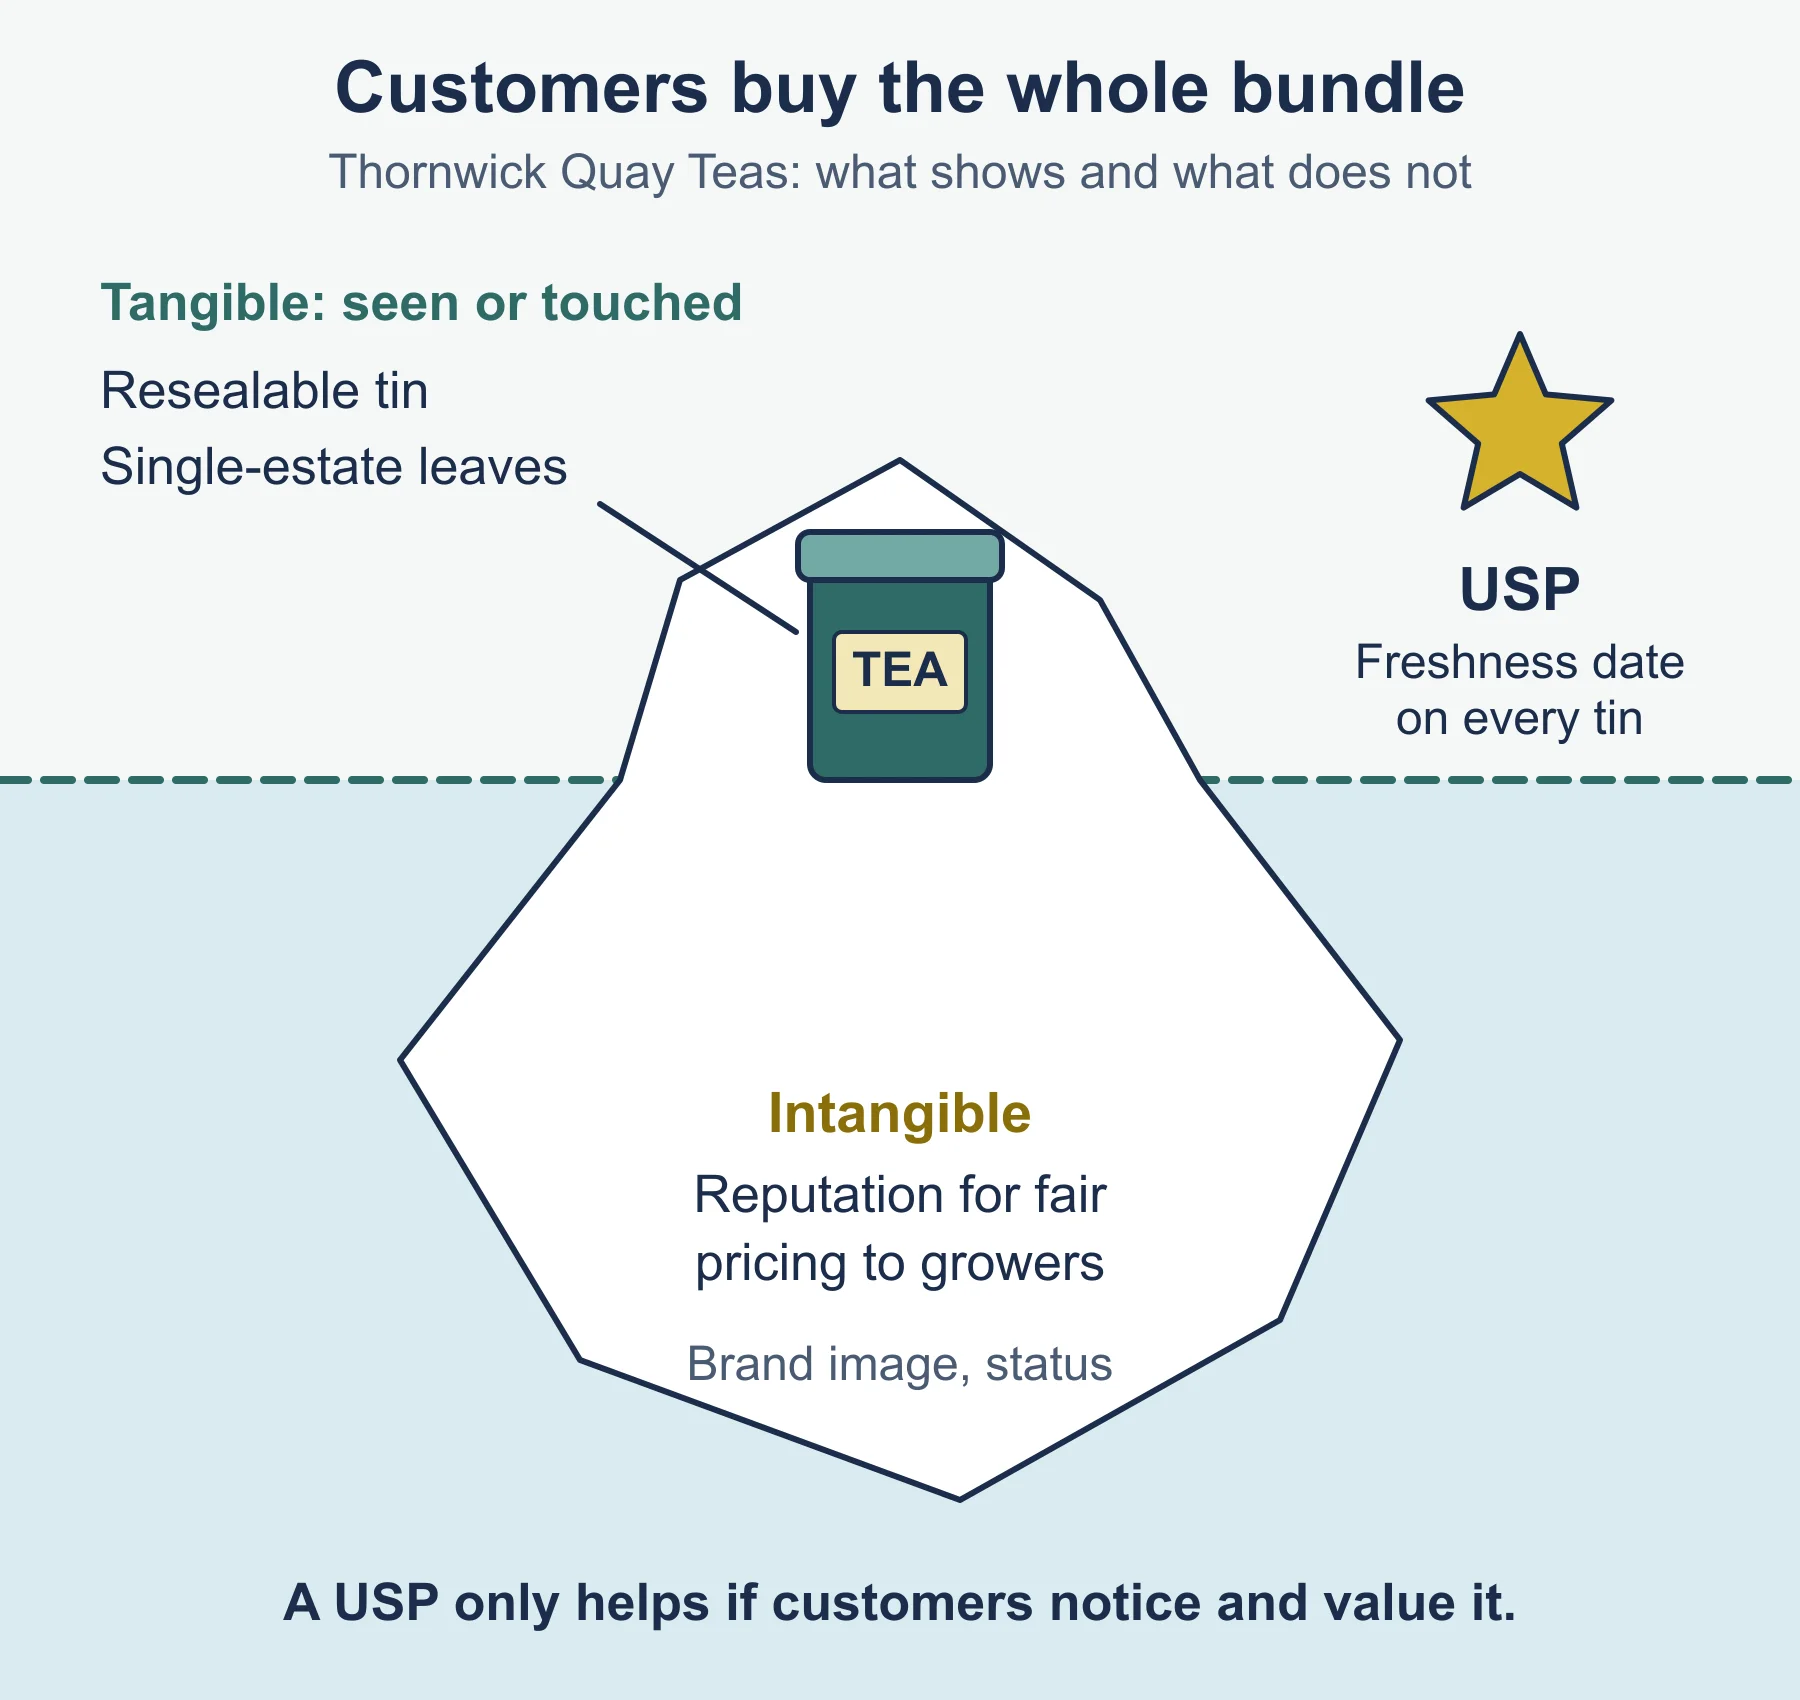
| Tangible attribute | Can be seen or touched | Materials, size, packaging |
| Intangible attribute | Cannot be touched | Reputation, status, friendliness |
| Product development | Creating new or improved products | A lighter, quieter model |
| Differentiation | Making a product stand out from rivals | Design, quality, service, image |
| USP | The feature rivals lack that customers value | A two-year no-quibble guarantee |
Why development matters: tastes and technology change, rivals copy, it defends share and spreads risk. Cost: money, time and the chance of failure.
Differentiation supports a higher price and loyalty, but only if customers notice and value the difference.
3.3.3 Product life cycle and extension strategies
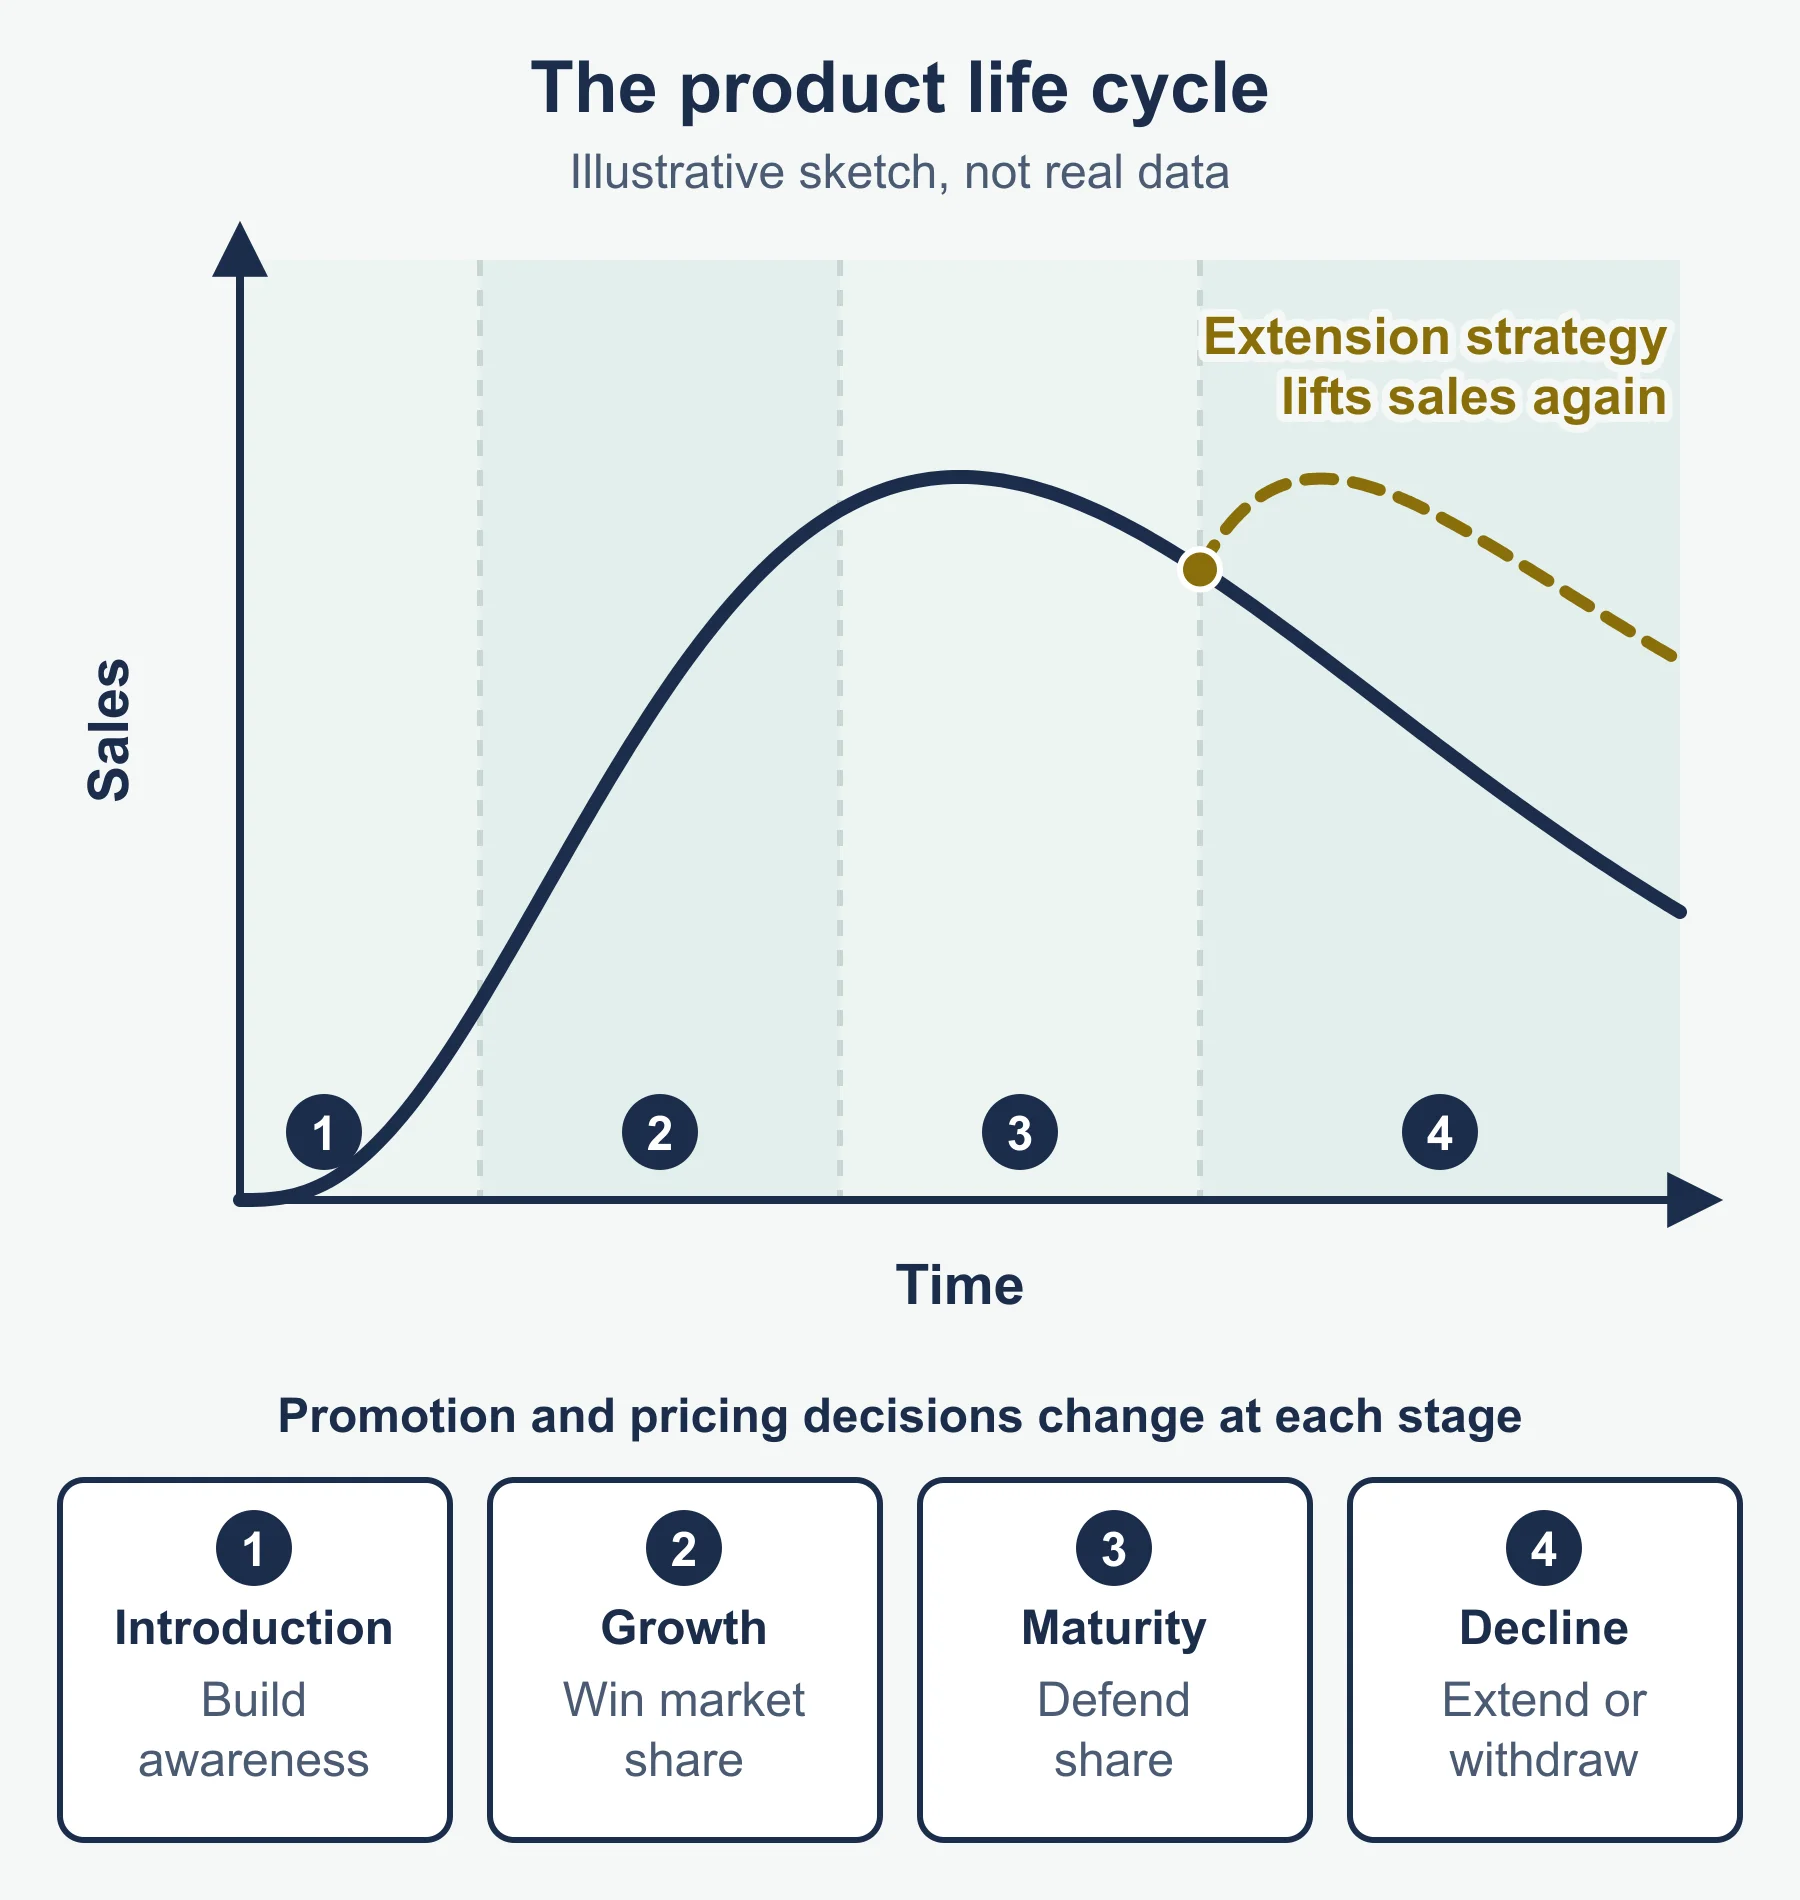
Stages: (development) then introduction, growth, maturity, decline.
| Stage | What happens | Typical marketing |
|---|---|---|
| Introduction | Low sales, high costs | Awareness; skimming or penetration |
| Growth | Sales rise quickly; rivals arrive | Widen distribution; build brand |
| Maturity | Sales flatten | Defend share; differentiate; competitive pricing |
| Decline | Sales fall | Cut costs, drop it or extend it |
Extension strategies: new packaging, product modification, new uses, new markets, extra promotion, price changes, new channels. They succeed only where a real opportunity exists.
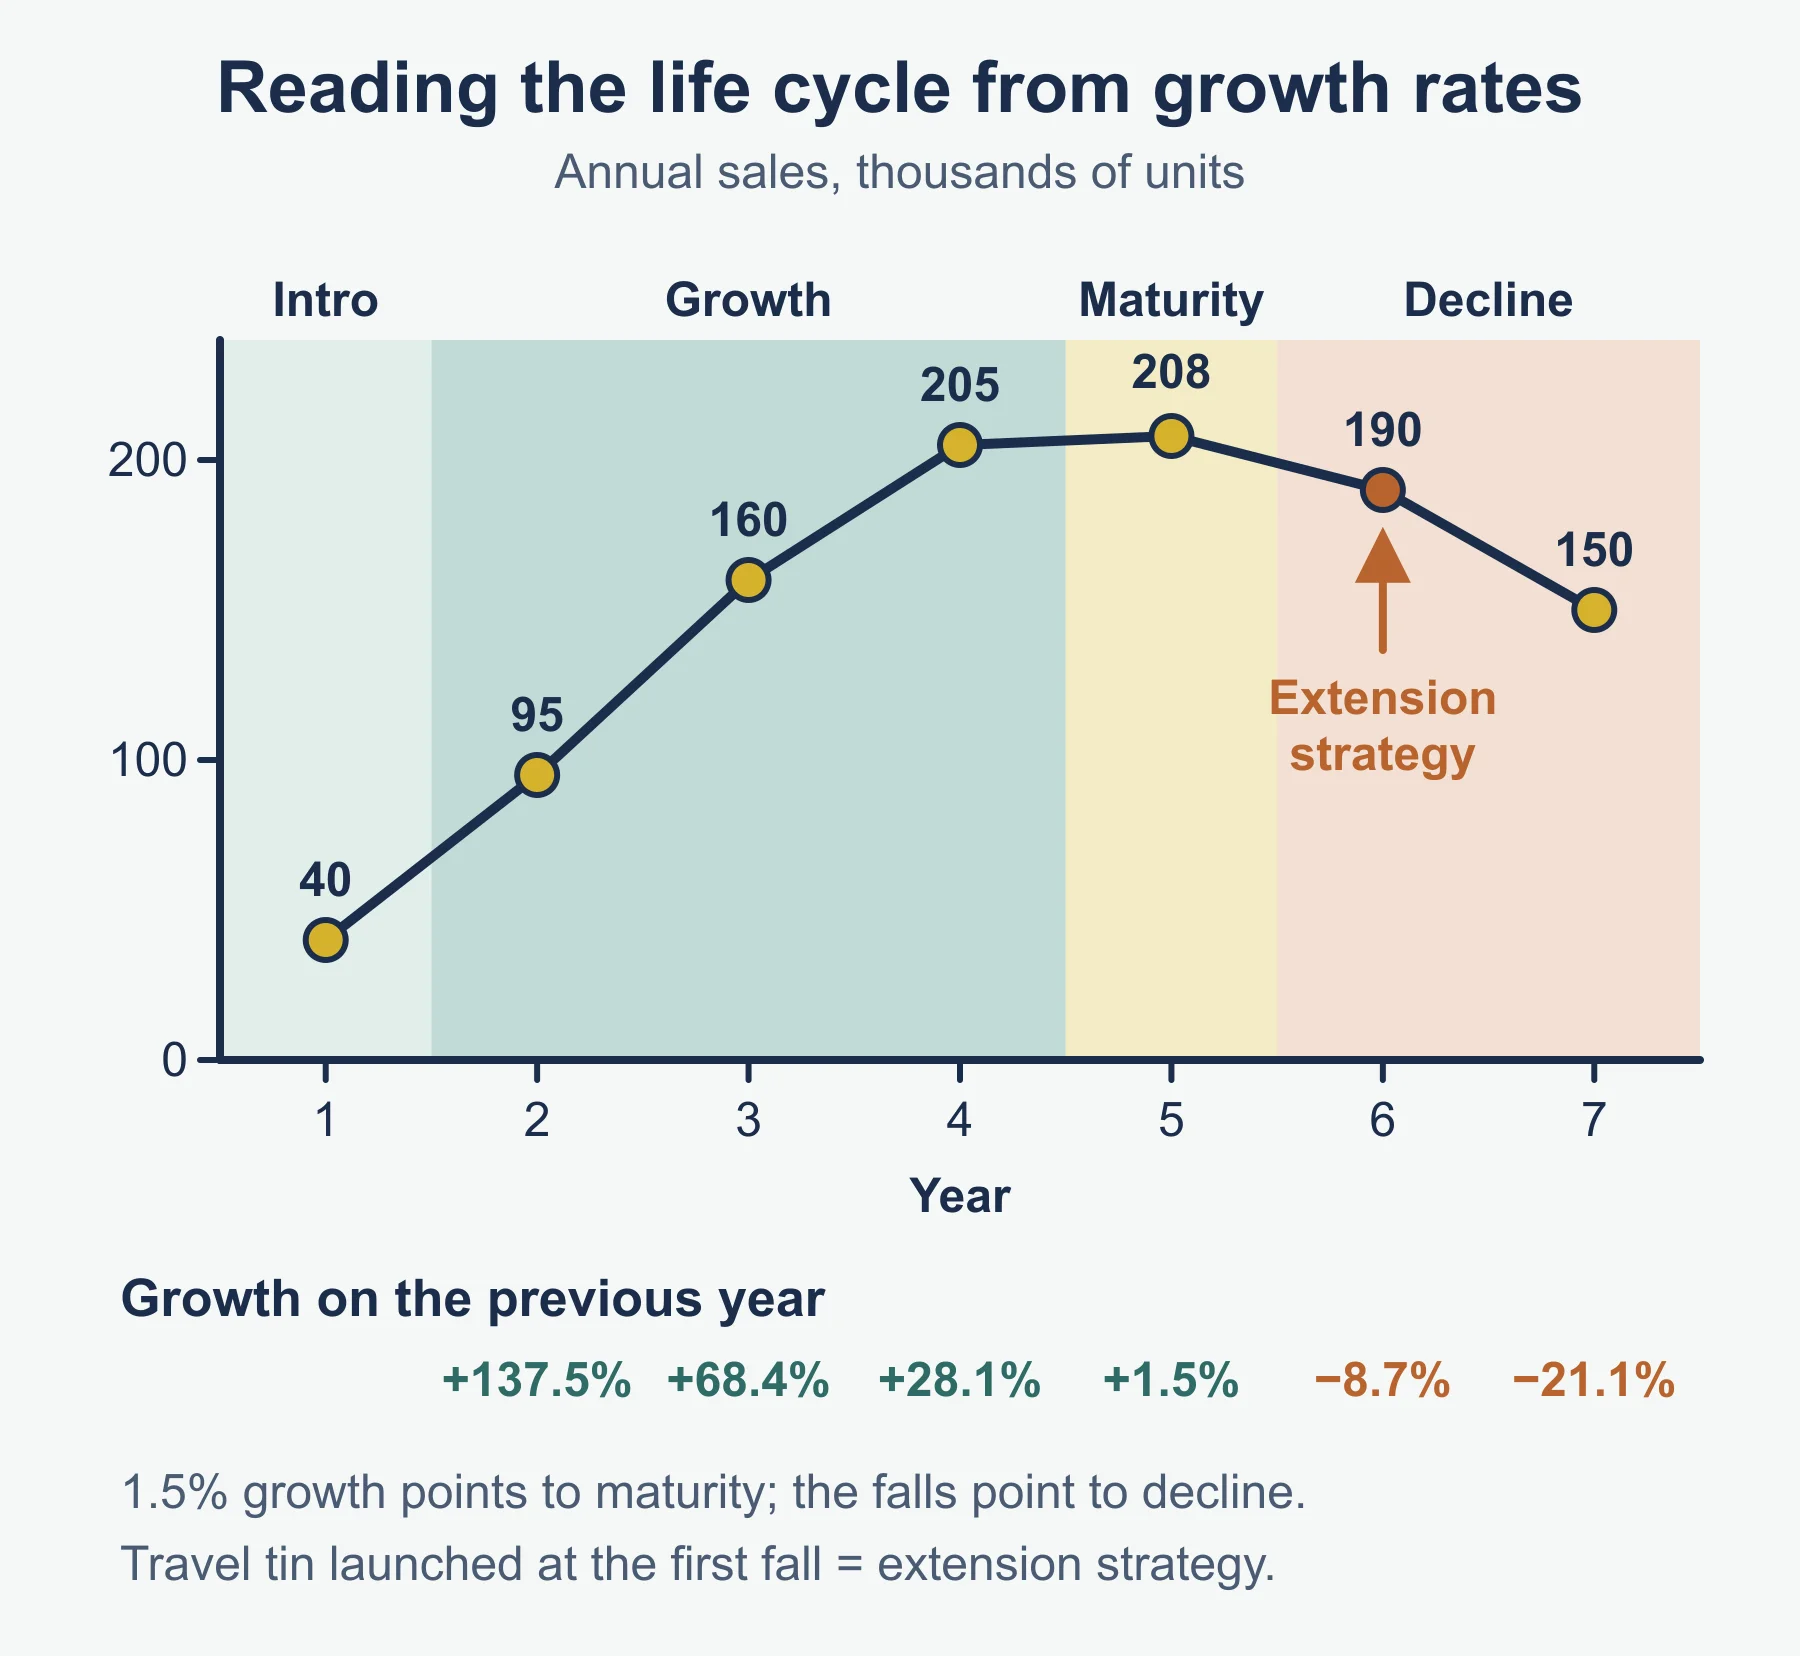
Method: read a life cycle table.
- Work out the percentage change in sales each period.
- Look for growth slowing (maturity) or turning negative (decline).
- Link the stage to a sensible response, then check what the case says about costs and competitors.
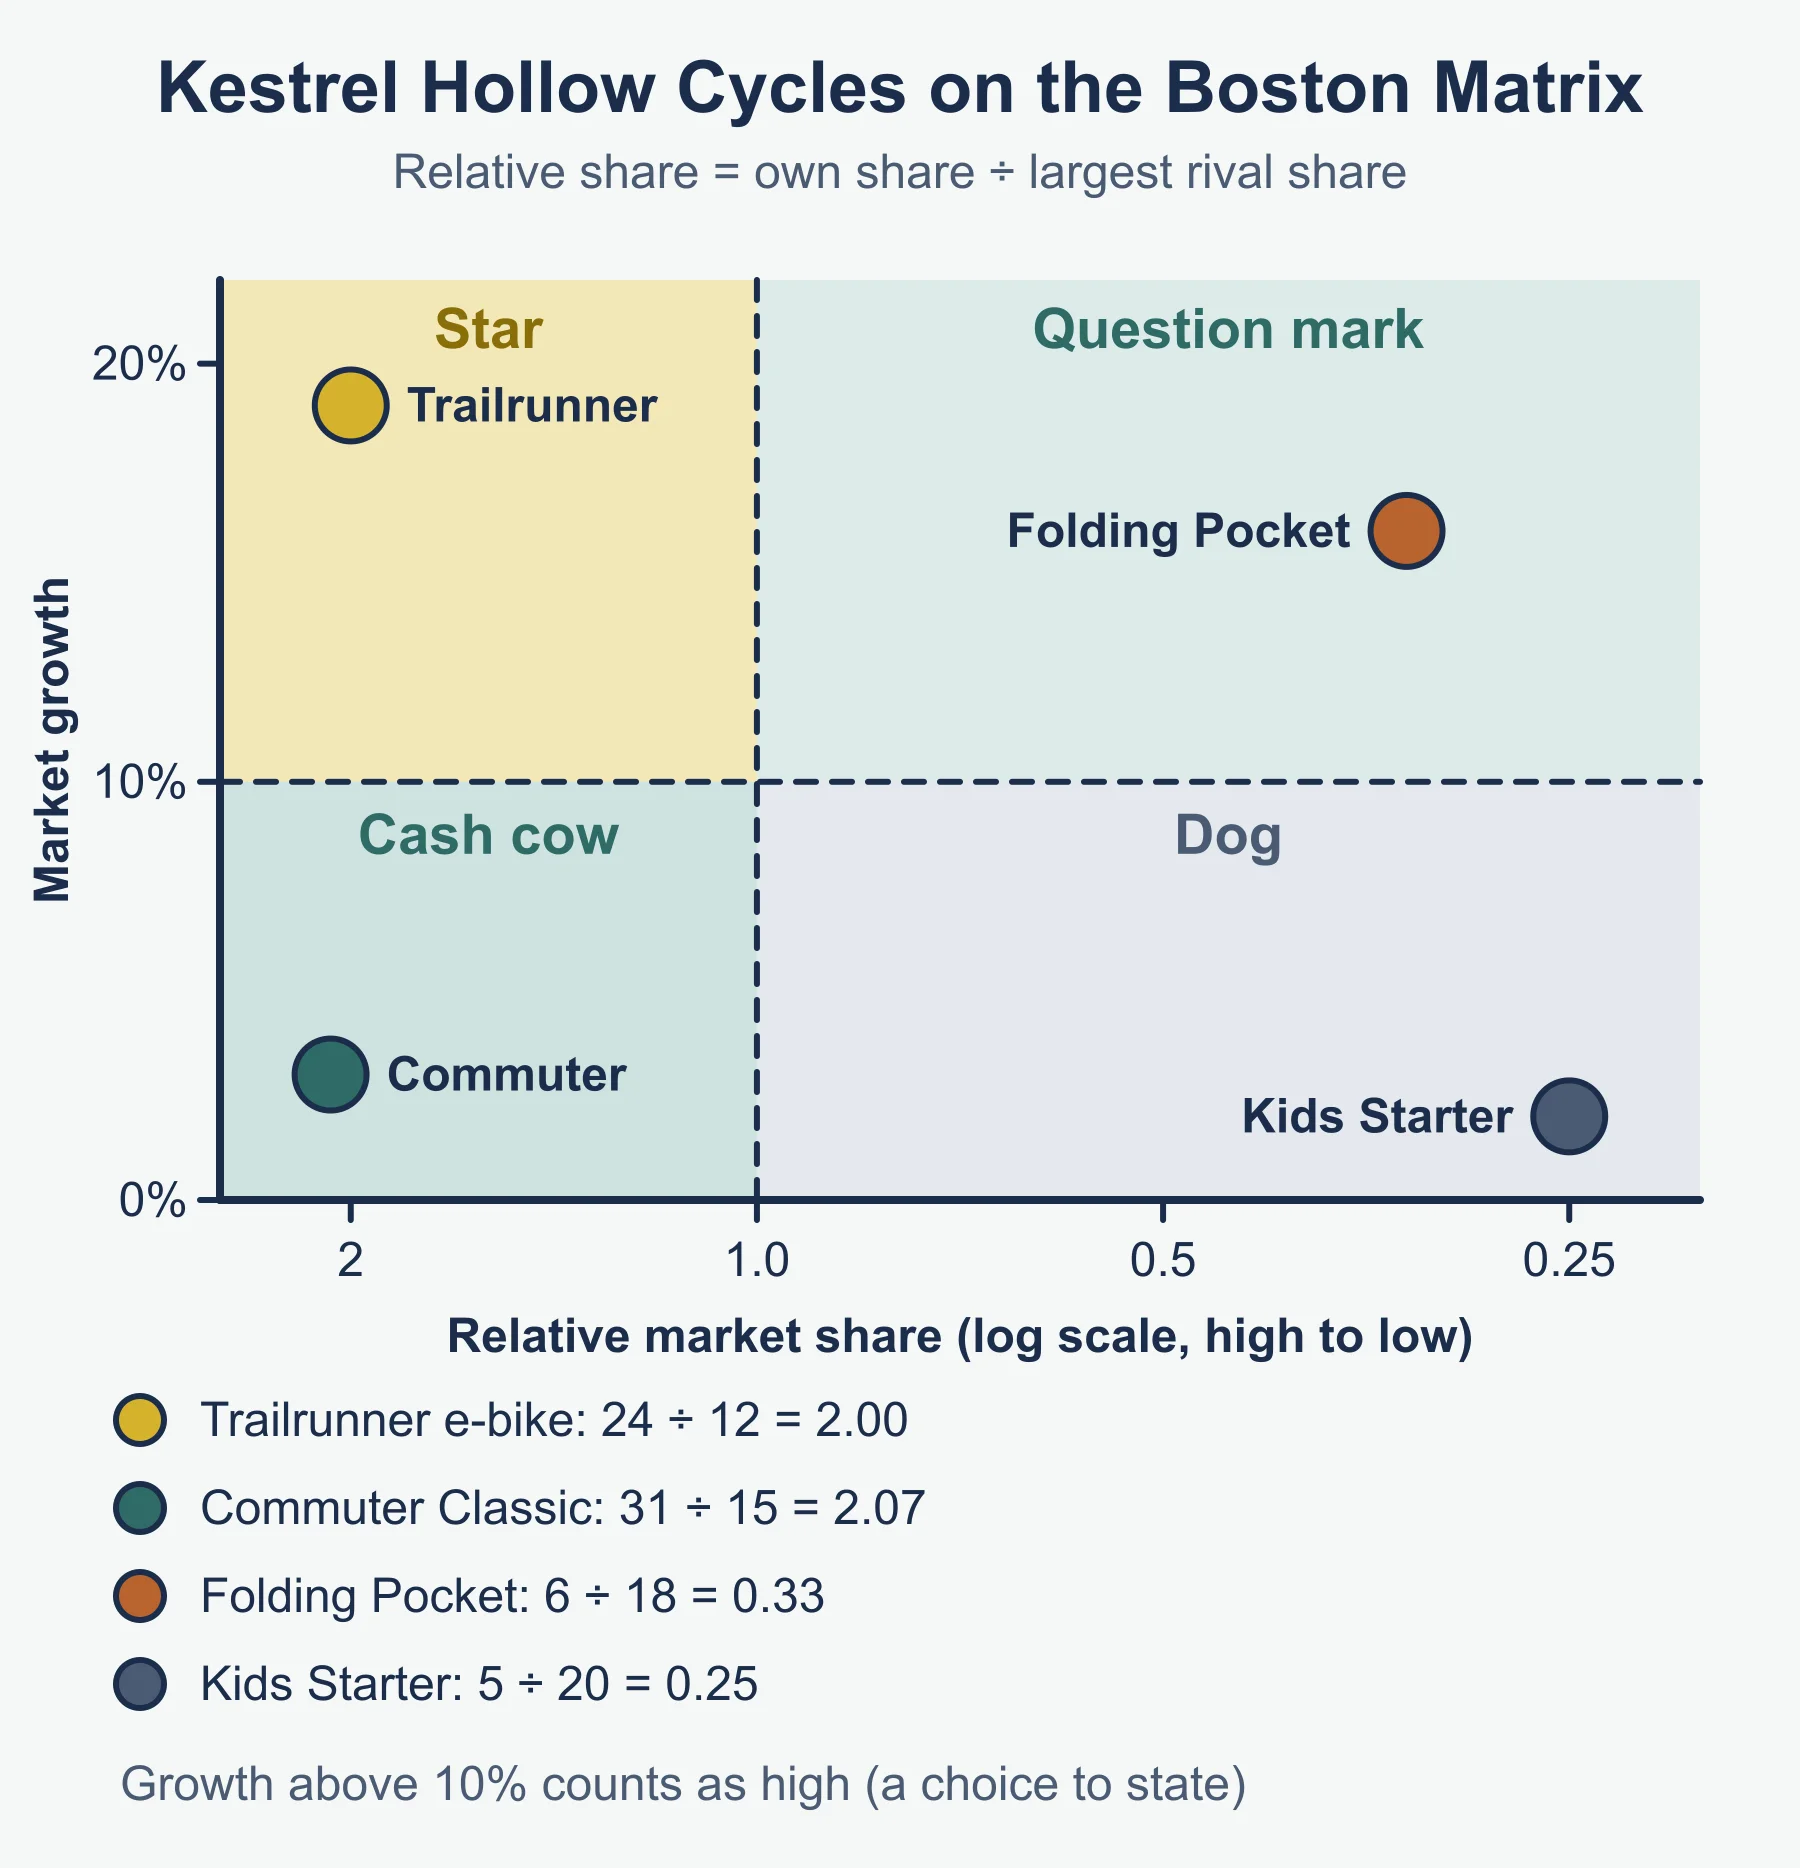
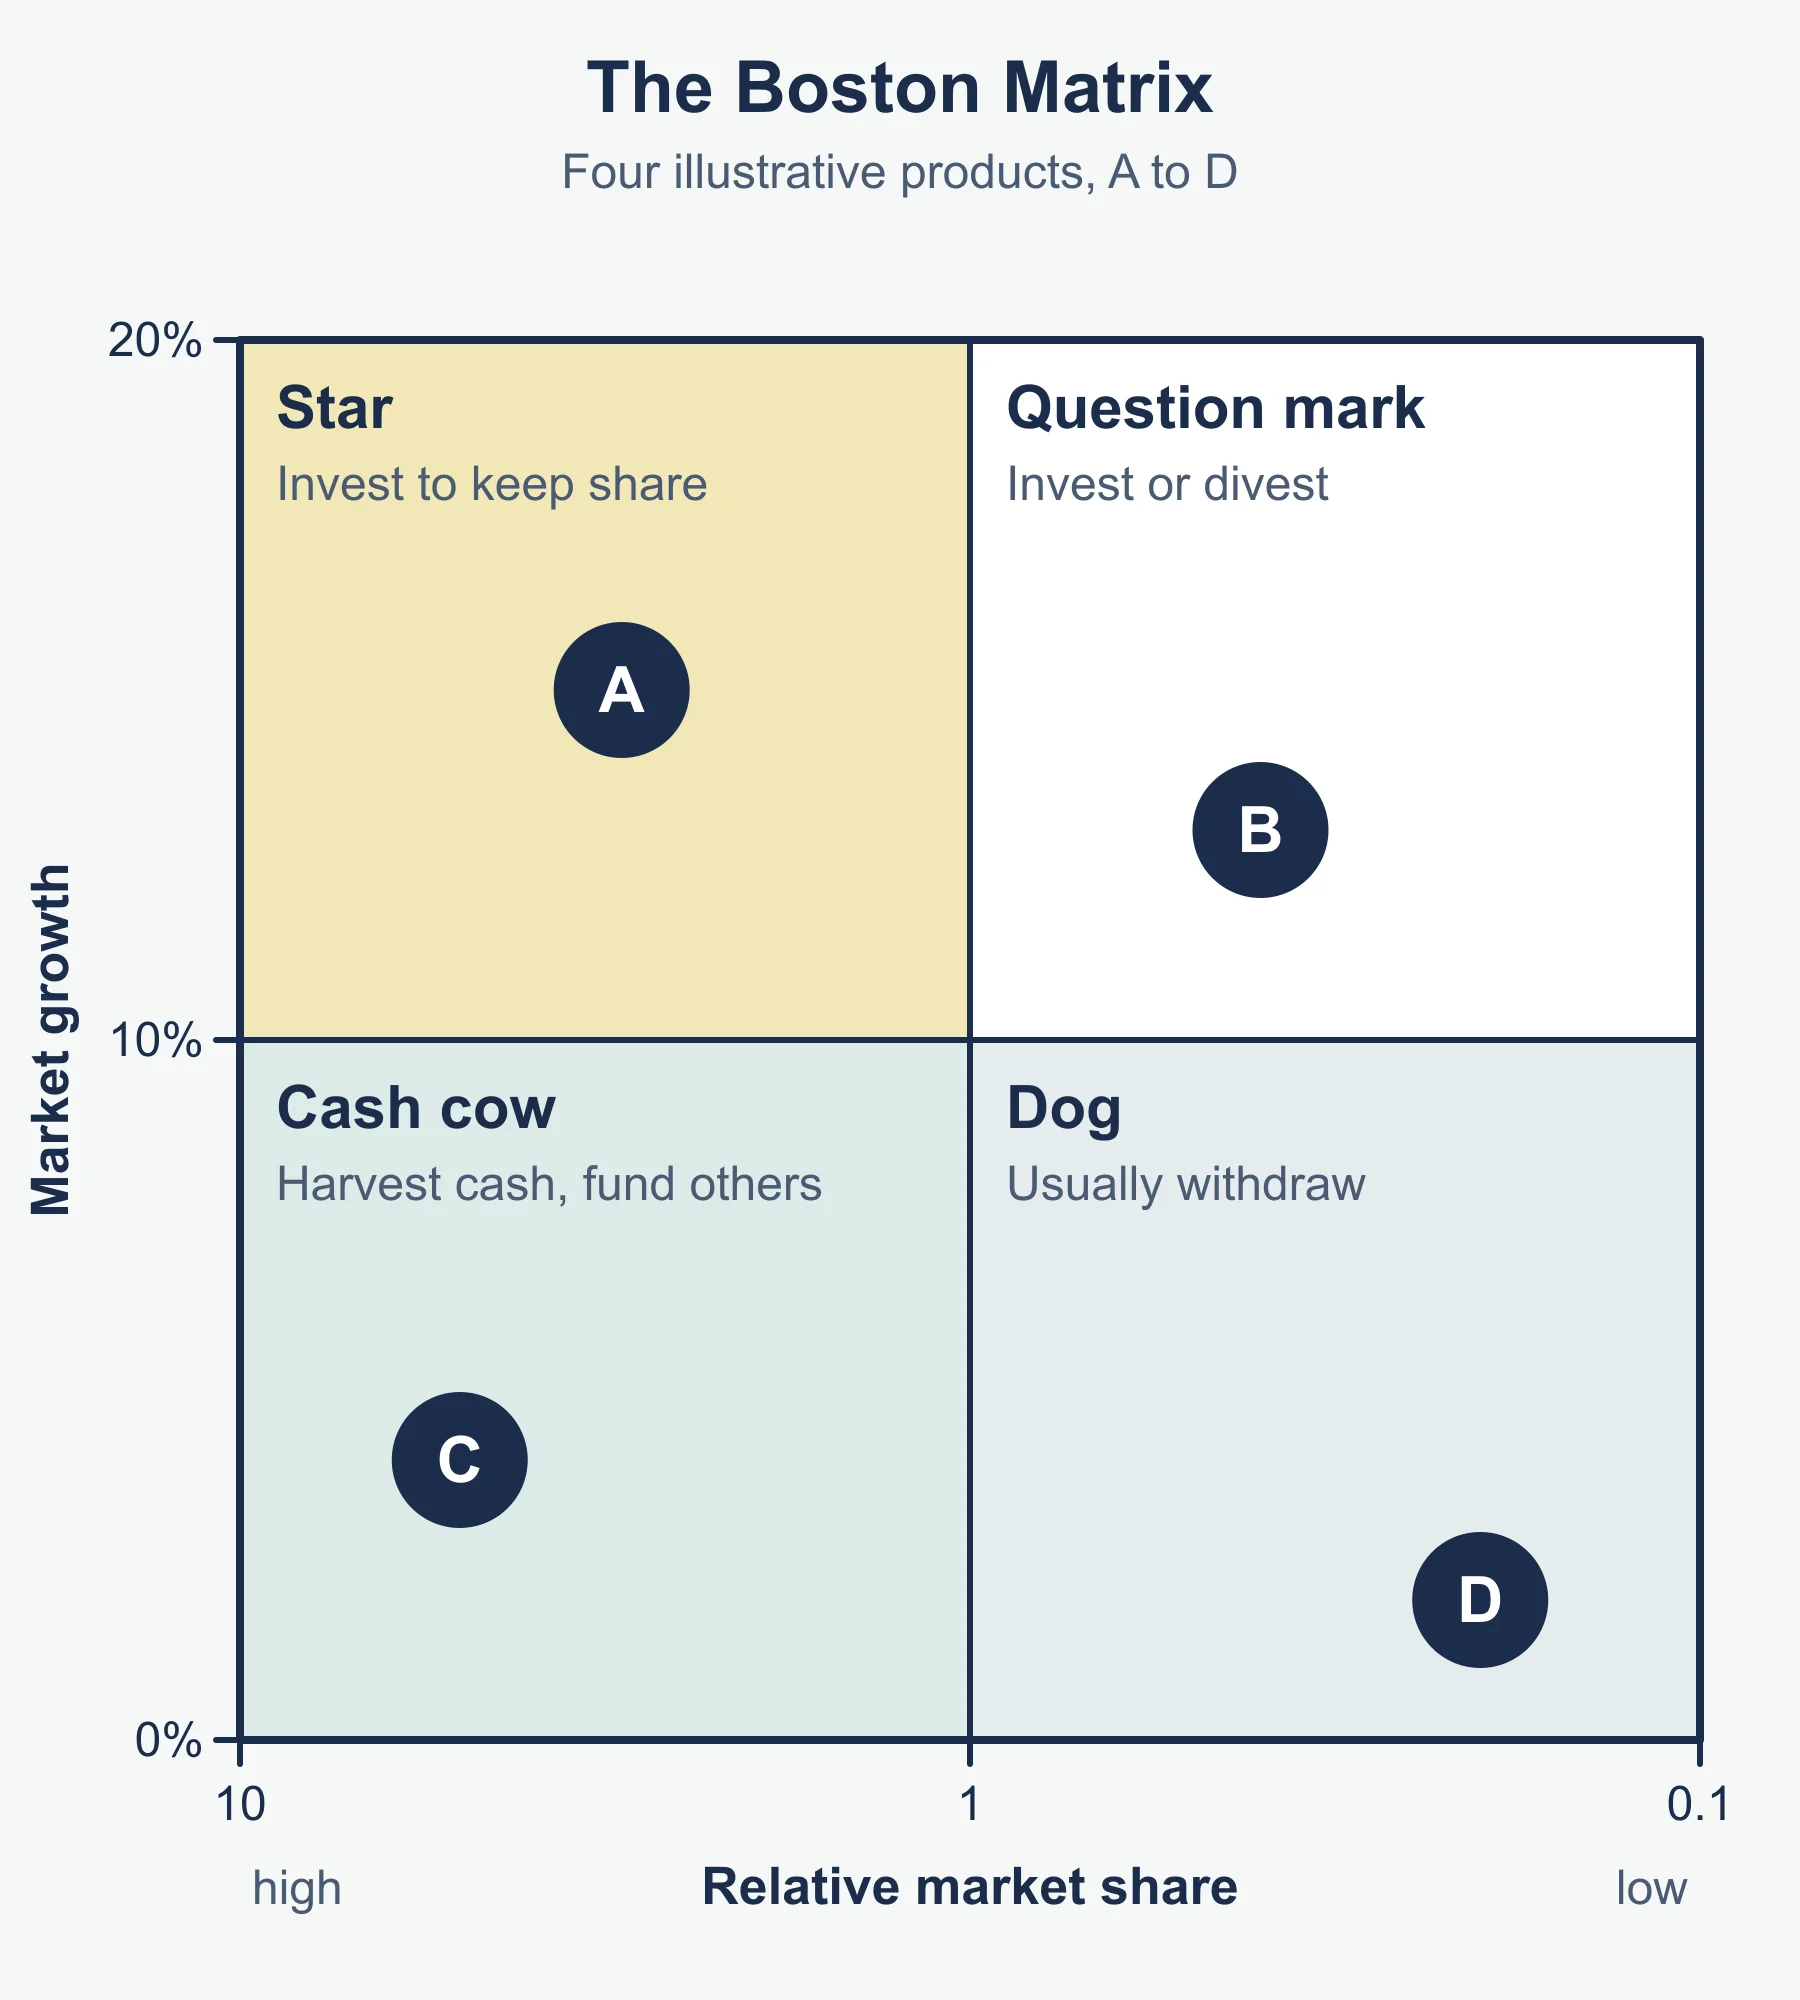
3.3.3 Boston Matrix
| High market share | Low market share | |
|---|---|---|
| High growth | Star | Question mark (problem child) |
| Low growth | Cash cow | Dog |
Standard form of relative market share: own share divided by the share of the largest rival. Above 1 means market leader.
| Position | Role | Typical decision |
|---|---|---|
| Star | Earns, but needs funding to hold share | Invest to keep the lead |
| Cash cow | Surplus cash | Milk it; fund others |
| Question mark | Cash drain; uncertain | Invest to turn into a star, or stop |
| Dog | Low earnings | Drop, harvest, or keep if it helps the range |
Uses: shows balance of the portfolio, guides spending, flags products to drop, shows future cash needs. Limits: two measures only, market definition matters, a snapshot, ignores why a market is growing, and the high/low boundary is a choice.
Must-know distinction. The Boston Matrix looks at market share and growth across the portfolio. The life cycle follows one product’s sales over time. A dog may be in decline but need not be. A cash cow is often in maturity but not always.
Worked reminder. A product has 8% of a market where the largest rival has 16%: relative share is 8 / 16 = 0.5. In a market growing 14% a year, it is a question mark. In a market growing 2%, it is a dog.
3.3.4 Pricing methods
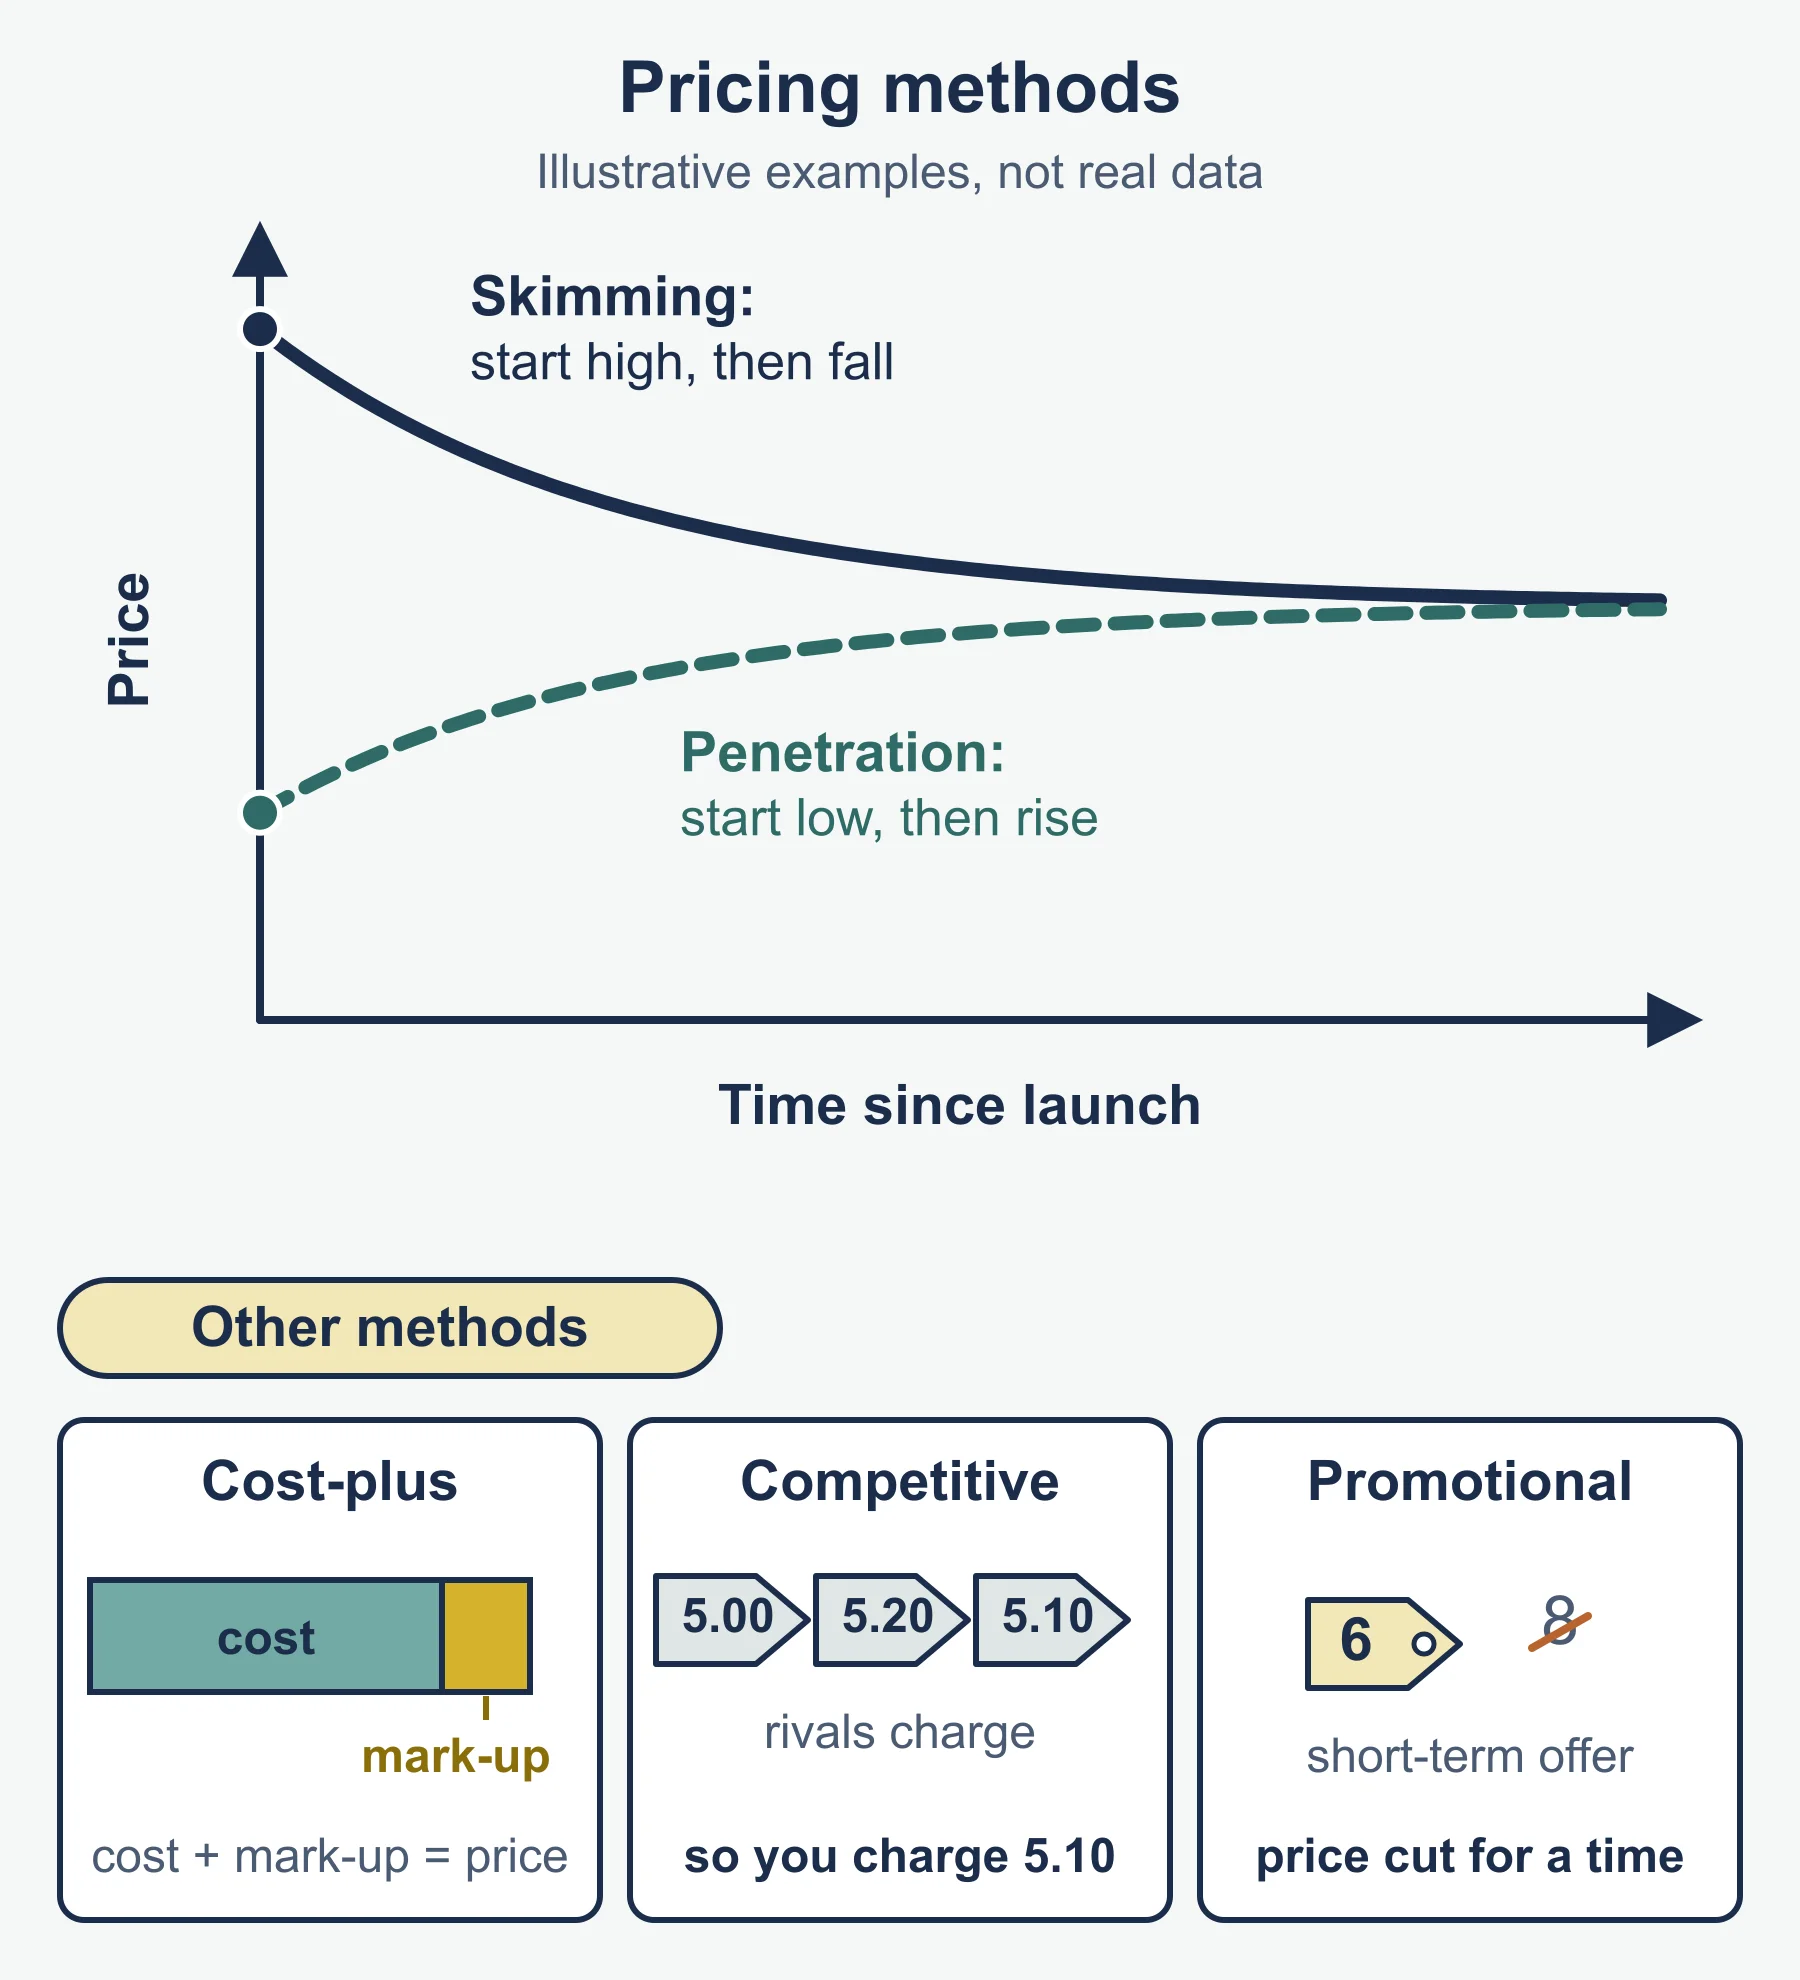
| Method | Remember it as | Best when | Watch out |
|---|---|---|---|
| Competitive | Price against rivals | Many similar products | Price wars |
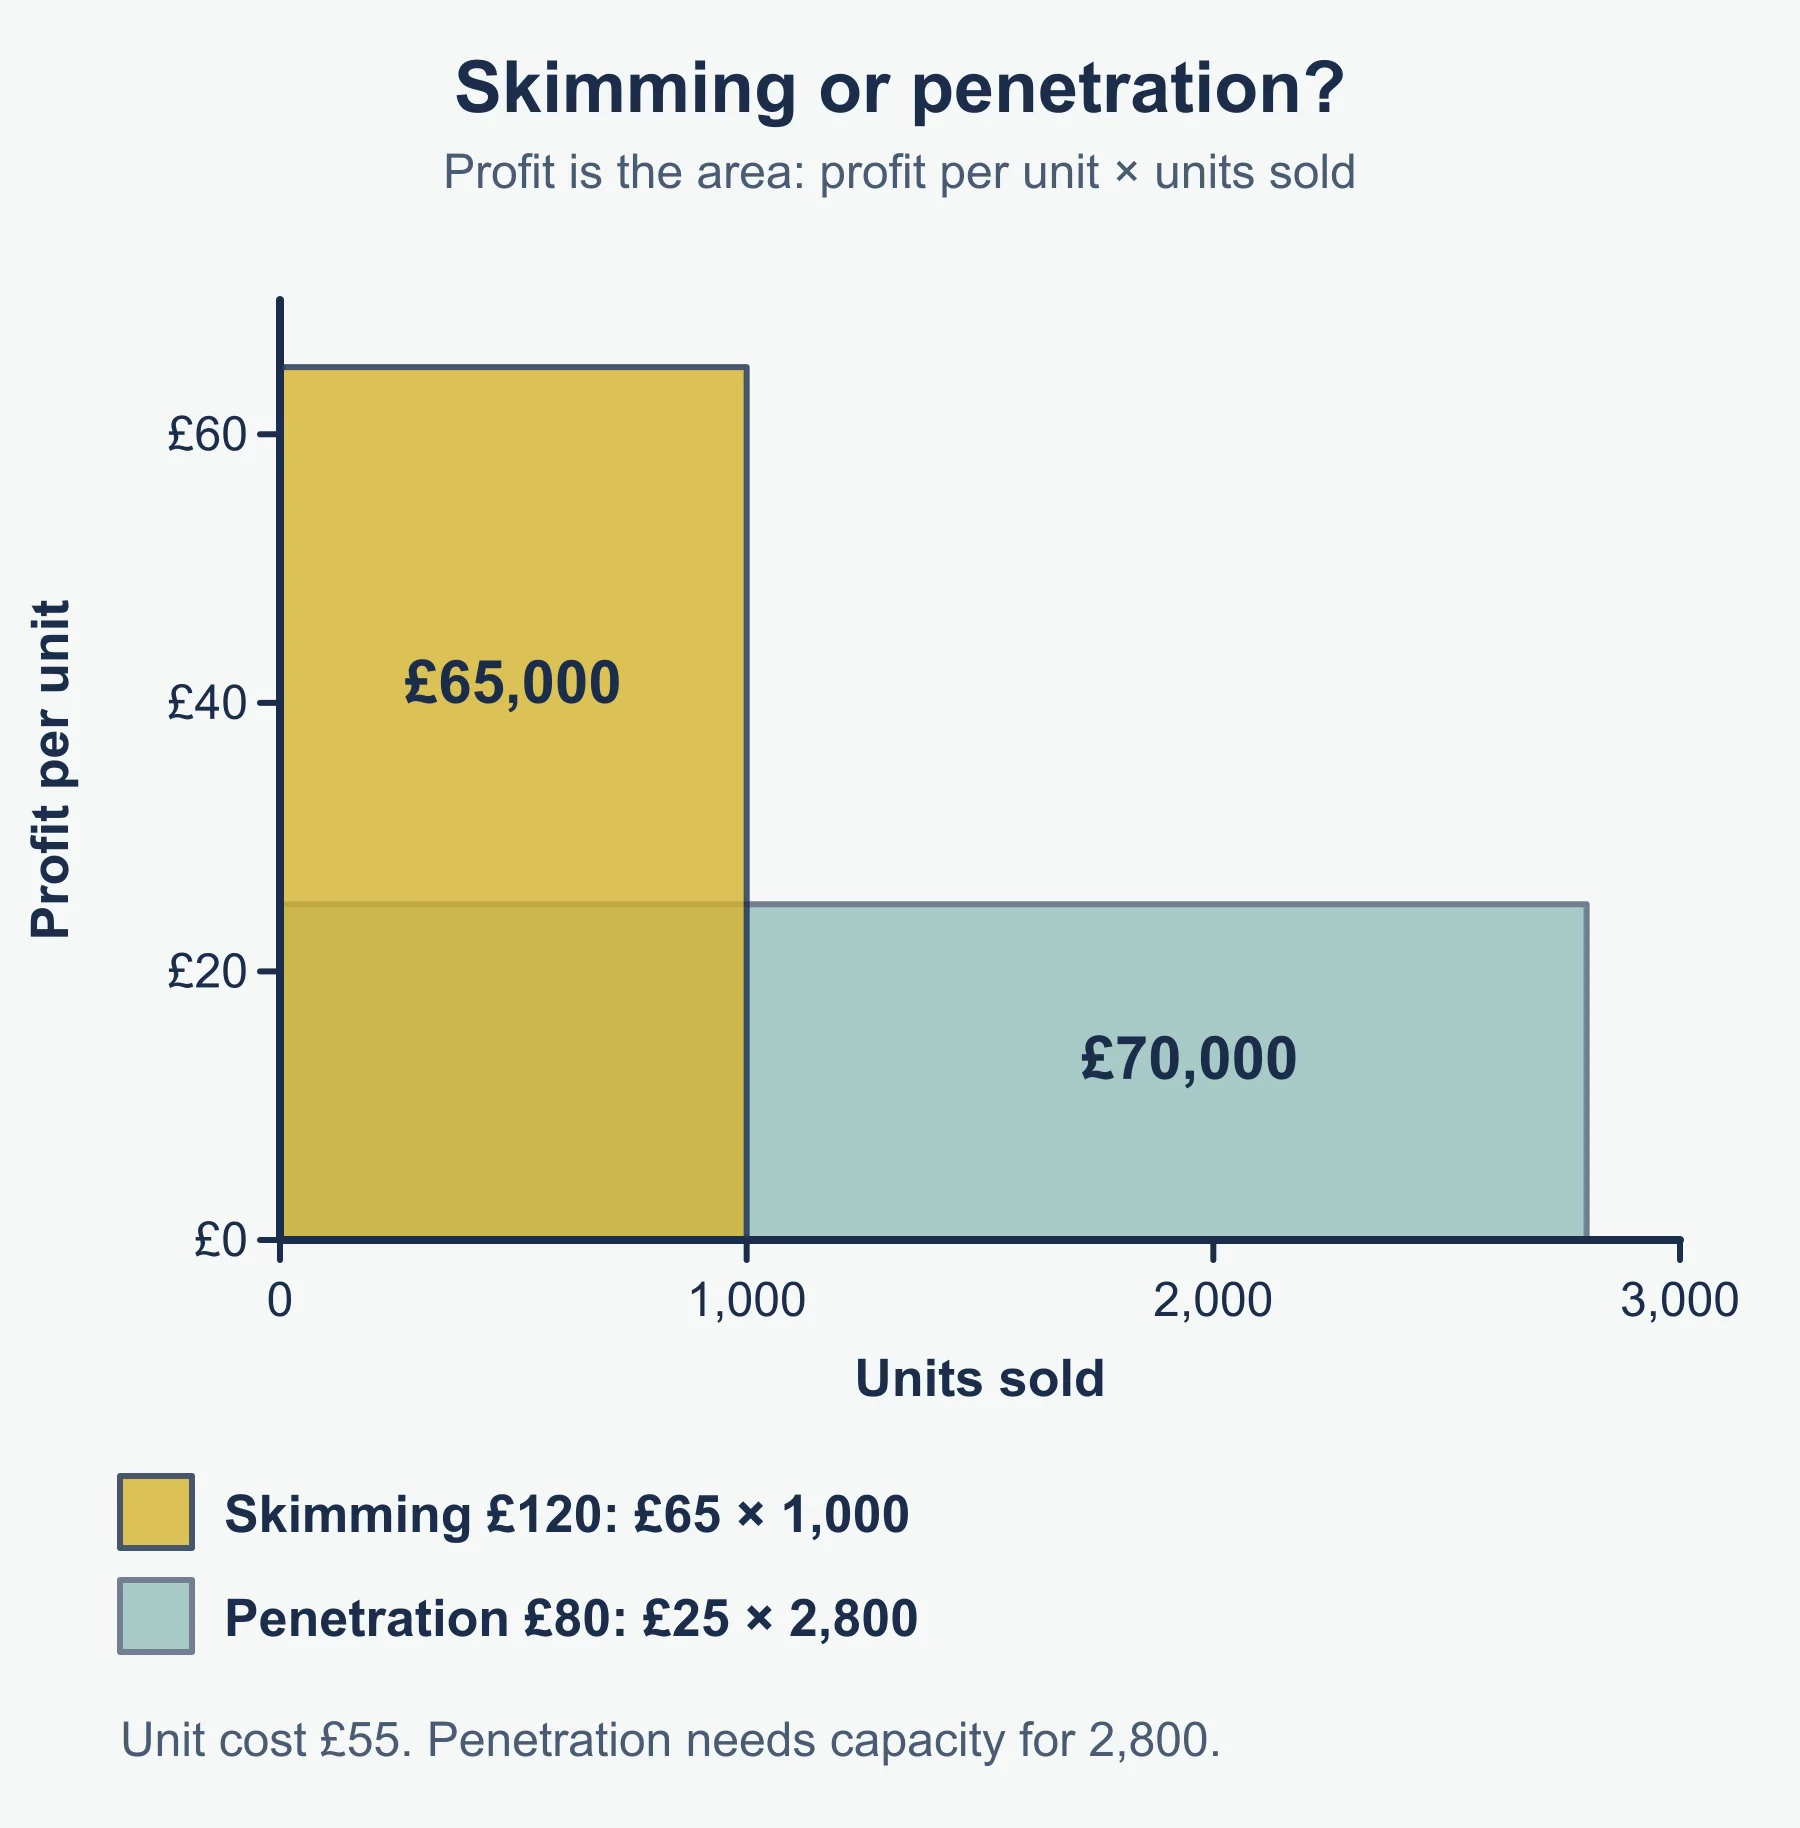
| Penetration | Low start, win share | New entrant; elastic demand | Low early profit; raising price later |
| Skimming | High start, then fall | Novel product; few rivals | Rivals enter; slower share growth |
| Price discrimination | Different prices to different groups | Segments can be kept apart | Complaints; leakage |
| Dynamic | Price moves with demand or stock | Online; perishable capacity | Seen as unfair |
| Cost-based | Cost plus a margin | Quick; secure return | Ignores demand |
| Psychological | Looks cheaper, e.g. 19.99 | Customers notice price points | Small effect |
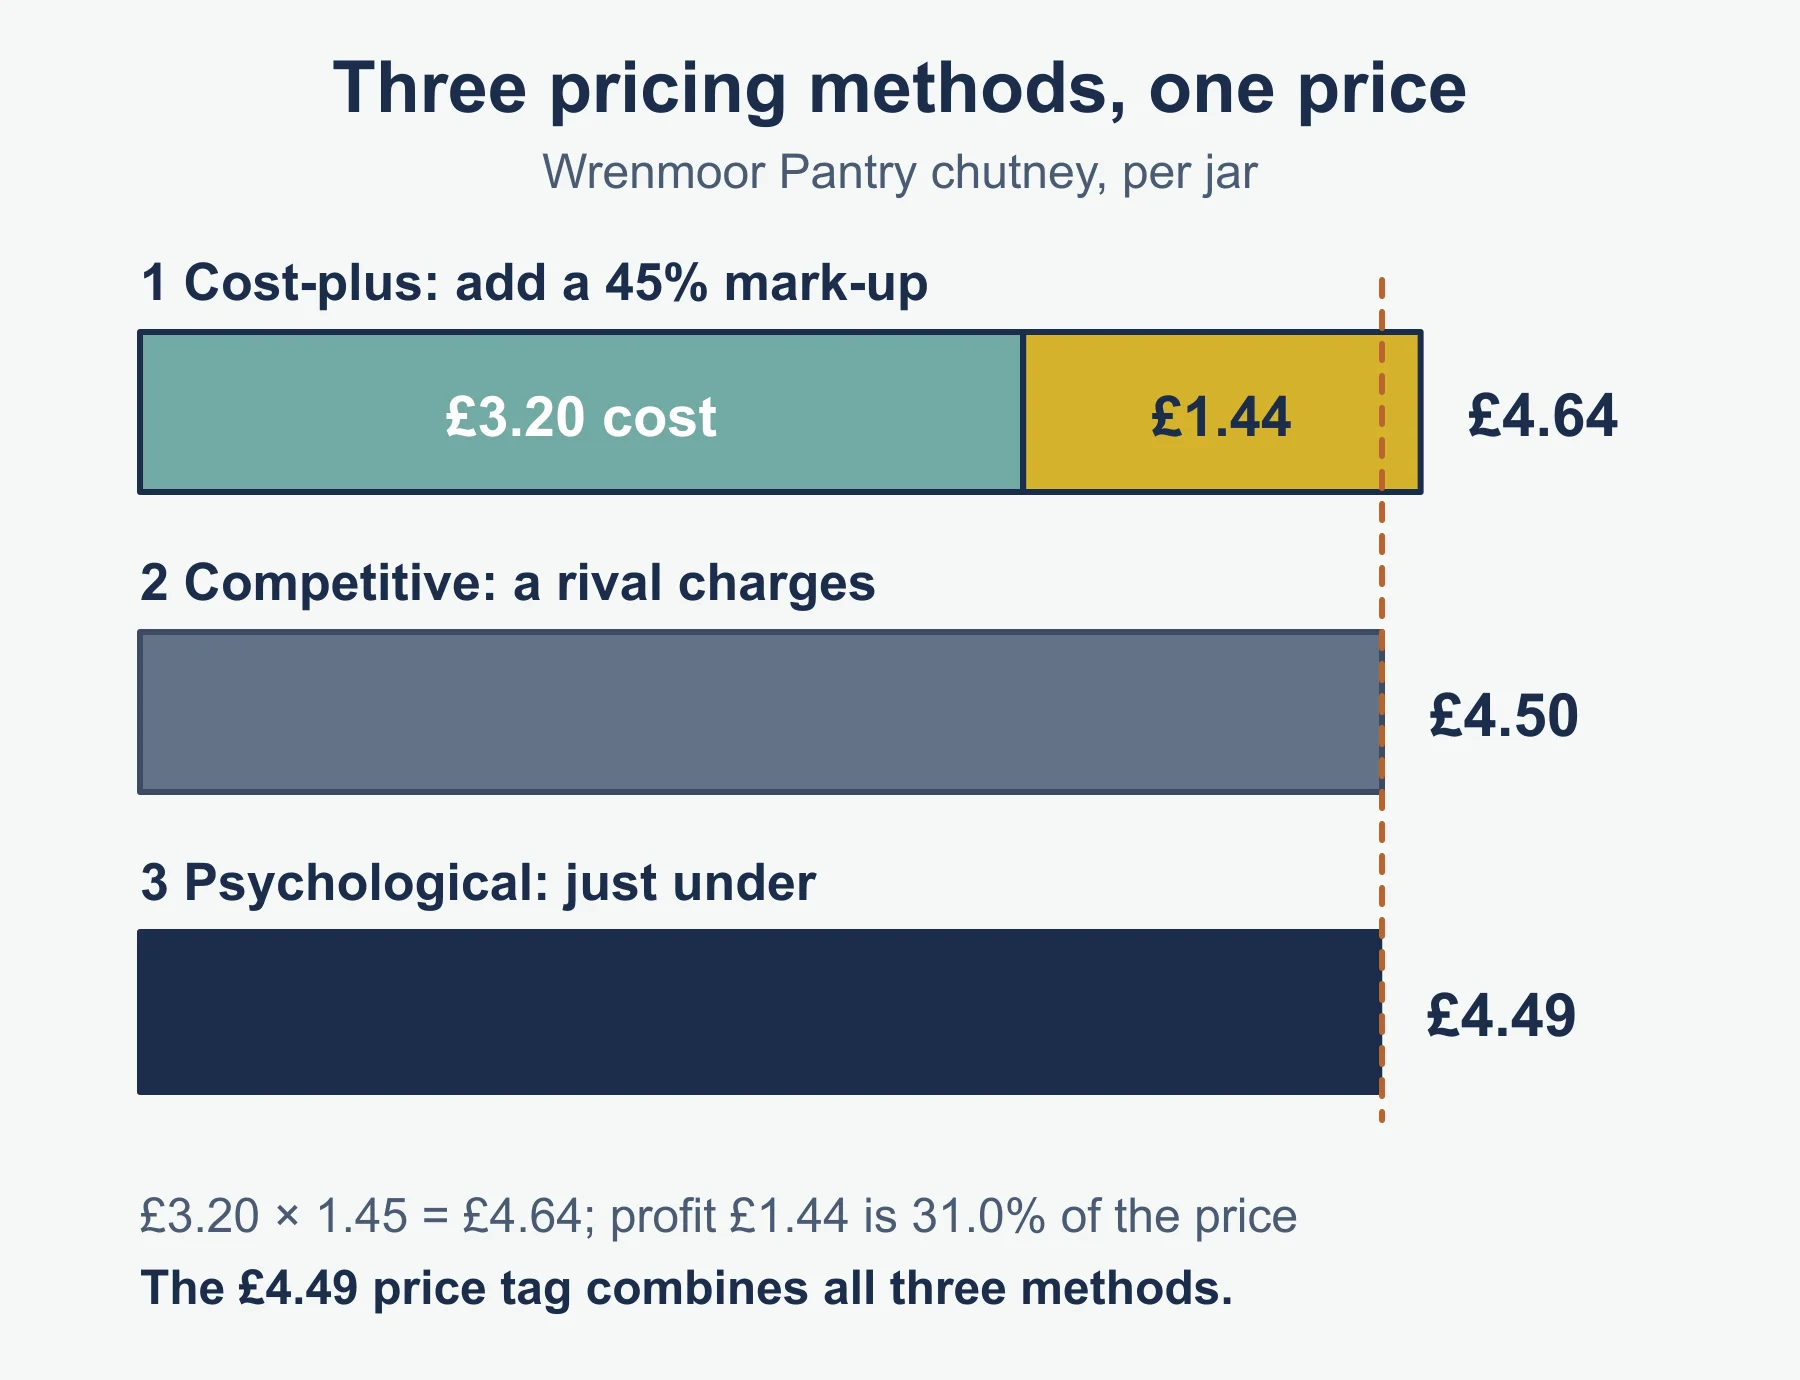
Method: cost-plus. Price = unit cost x (1 + mark-up). Mark-up is measured against cost, whereas margin is measured against the selling price.
Brindle Wharf Audio pays £62 for a speaker. A 30% mark-up gives £80.60; a 50% mark-up gives £93.00. A 30% mark-up on cost is a margin of 23.1% of the price (18.60 / 80.60).
Price discrimination reminder. A 120-seat hall charges £14 for 80 peak seats and £9 for 40 off-peak seats: revenue £1,480. A single £12 price on all 120 seats gives £1,440. Discrimination wins by £40, only if the seats are filled at each price and the groups cannot swap.
Psychological reminder. £19.99 is only 1p below £20, yet buyers may read it as “under £20”.
Choosing a method: three questions. What is the objective (profit, share, survival, image)? How do customers react to price? What are rivals likely to do?
3.3.5 Promotion methods
| Method | Objective | Use | Limit |
|---|---|---|---|
| Advertising | Inform, persuade, remind; build image | Mass reach | Costly; hard to measure |
| Sales promotion | Short-term sales; trial | Discounts, samples, BOGOF, loyalty points | Cuts margins; trains customers to wait |
| Direct promotion | Reach named customers | Mail, email, telesales, personal selling | Can annoy; higher cost per contact |
| Digital | Targeted, measurable contact | Social media, search, email, influencers, apps | Bad reviews spread; ad avoidance |
Packaging: protects, attracts, shows brand, informs, signals quality. Branding: recognition, differentiation, loyalty, price support. A brand is costly to build and can be damaged quickly.
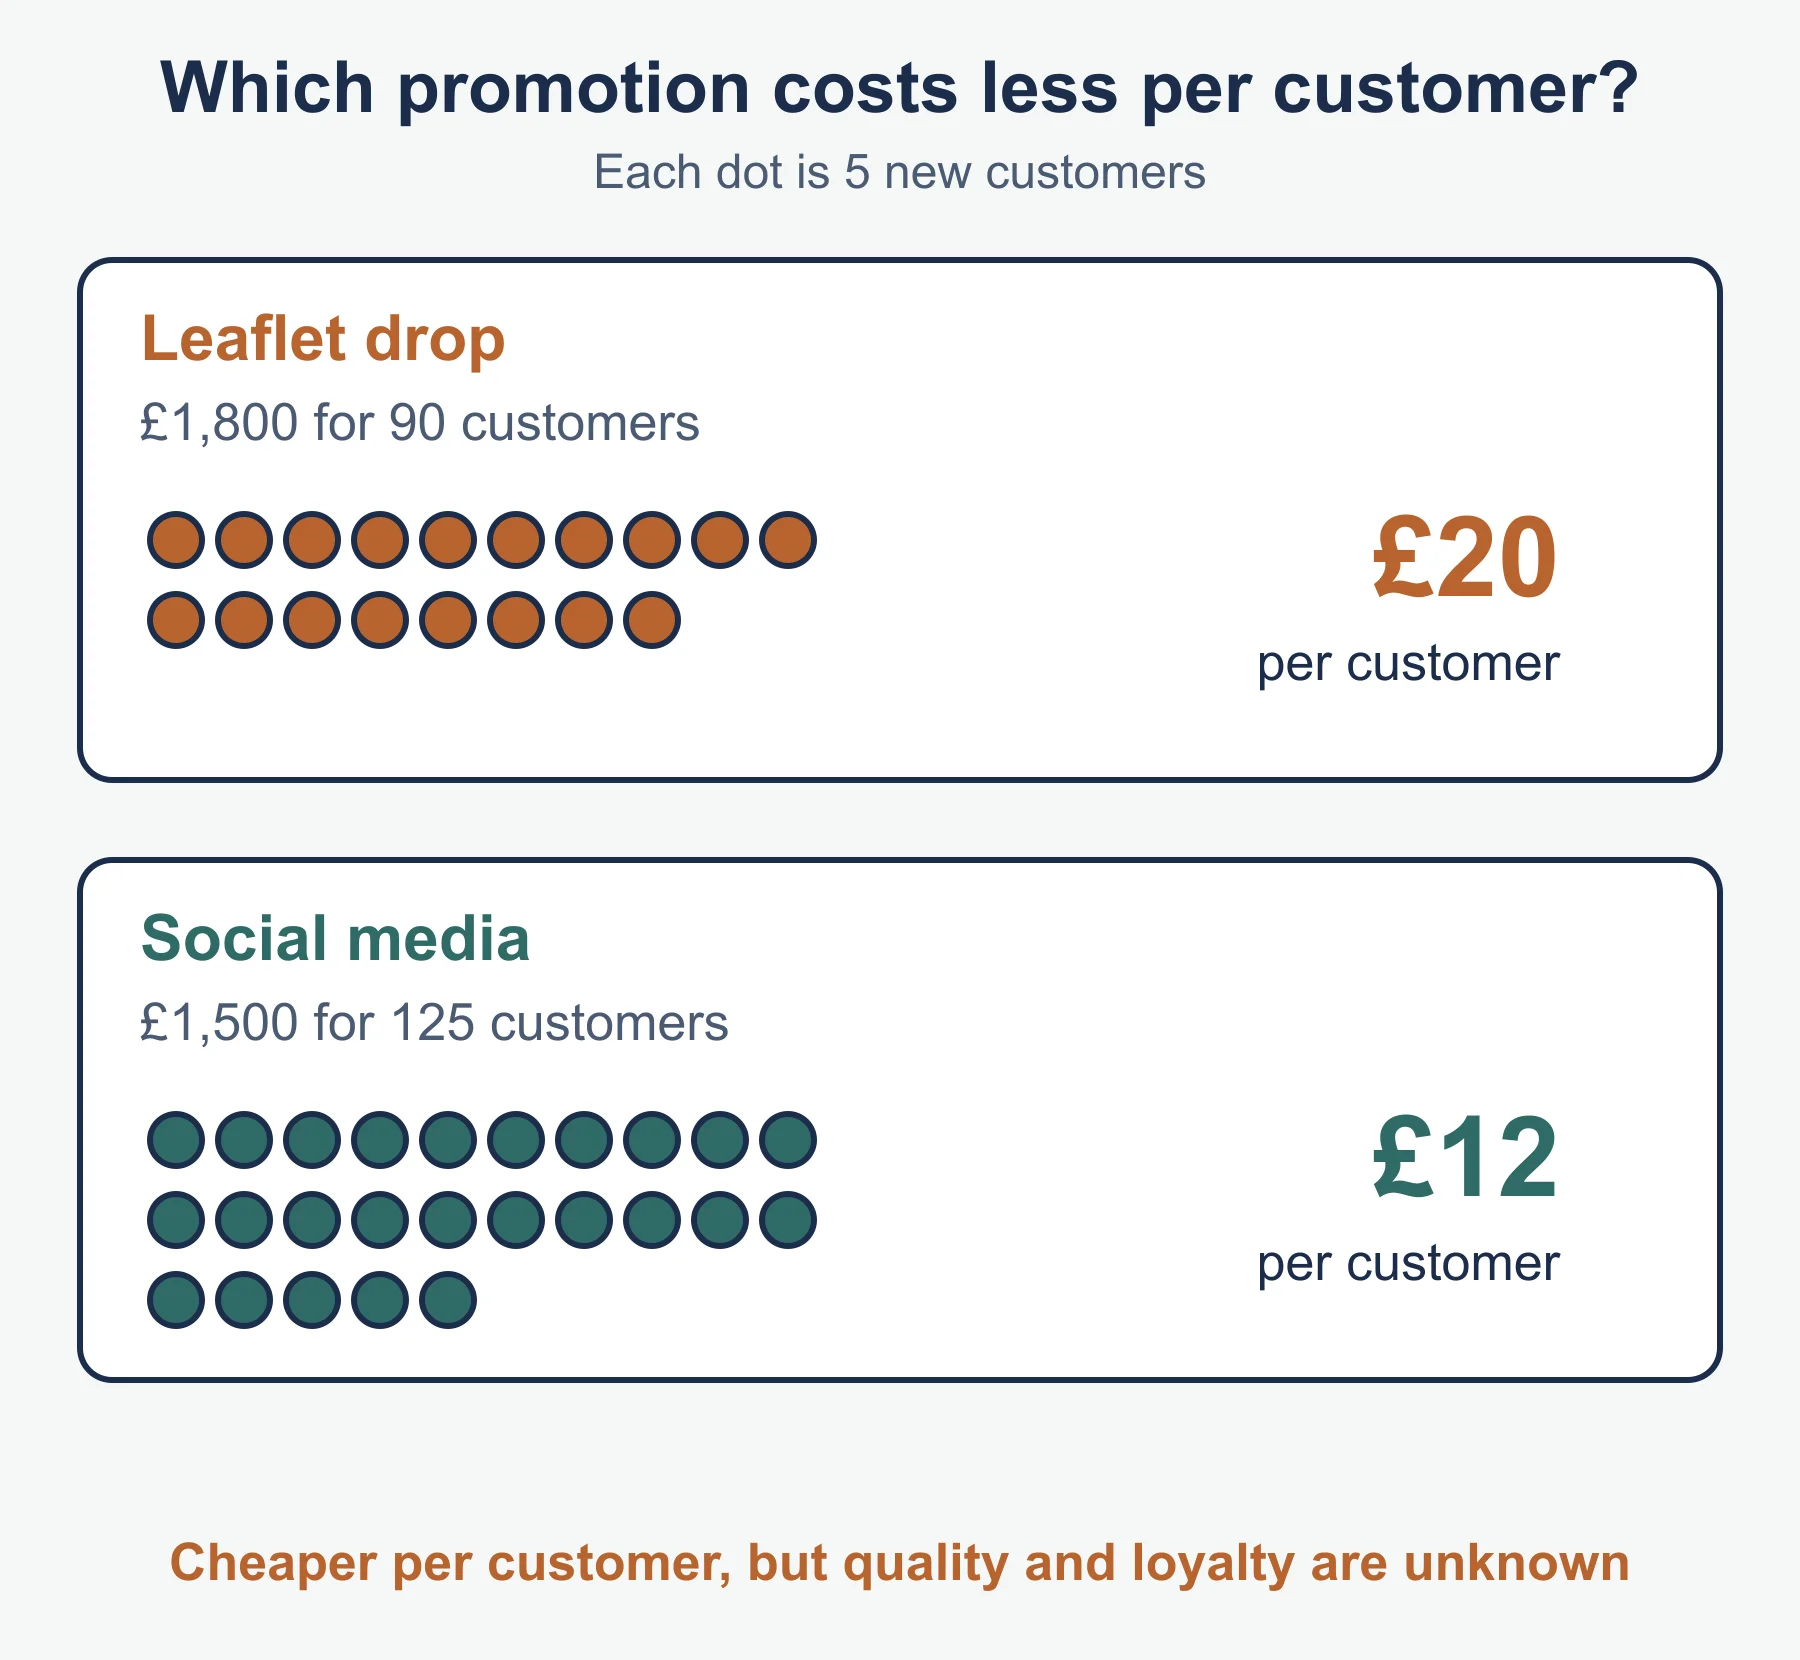
Method: cost per new customer. Cost of the campaign divided by customers won. Cobalt Fen Skincare spends £3,200 on digital promotion and wins 160 customers (£20 each), against £2,700 on leaflets for 90 customers (£30 each). Digital is cheaper per customer here. Say what the figure leaves out: quality of customers and repeat sales.
Buy 2 get 1 free. The customer pays for two items and gets three, so each costs two-thirds of the normal price (one-third off).
3.3.6 Place
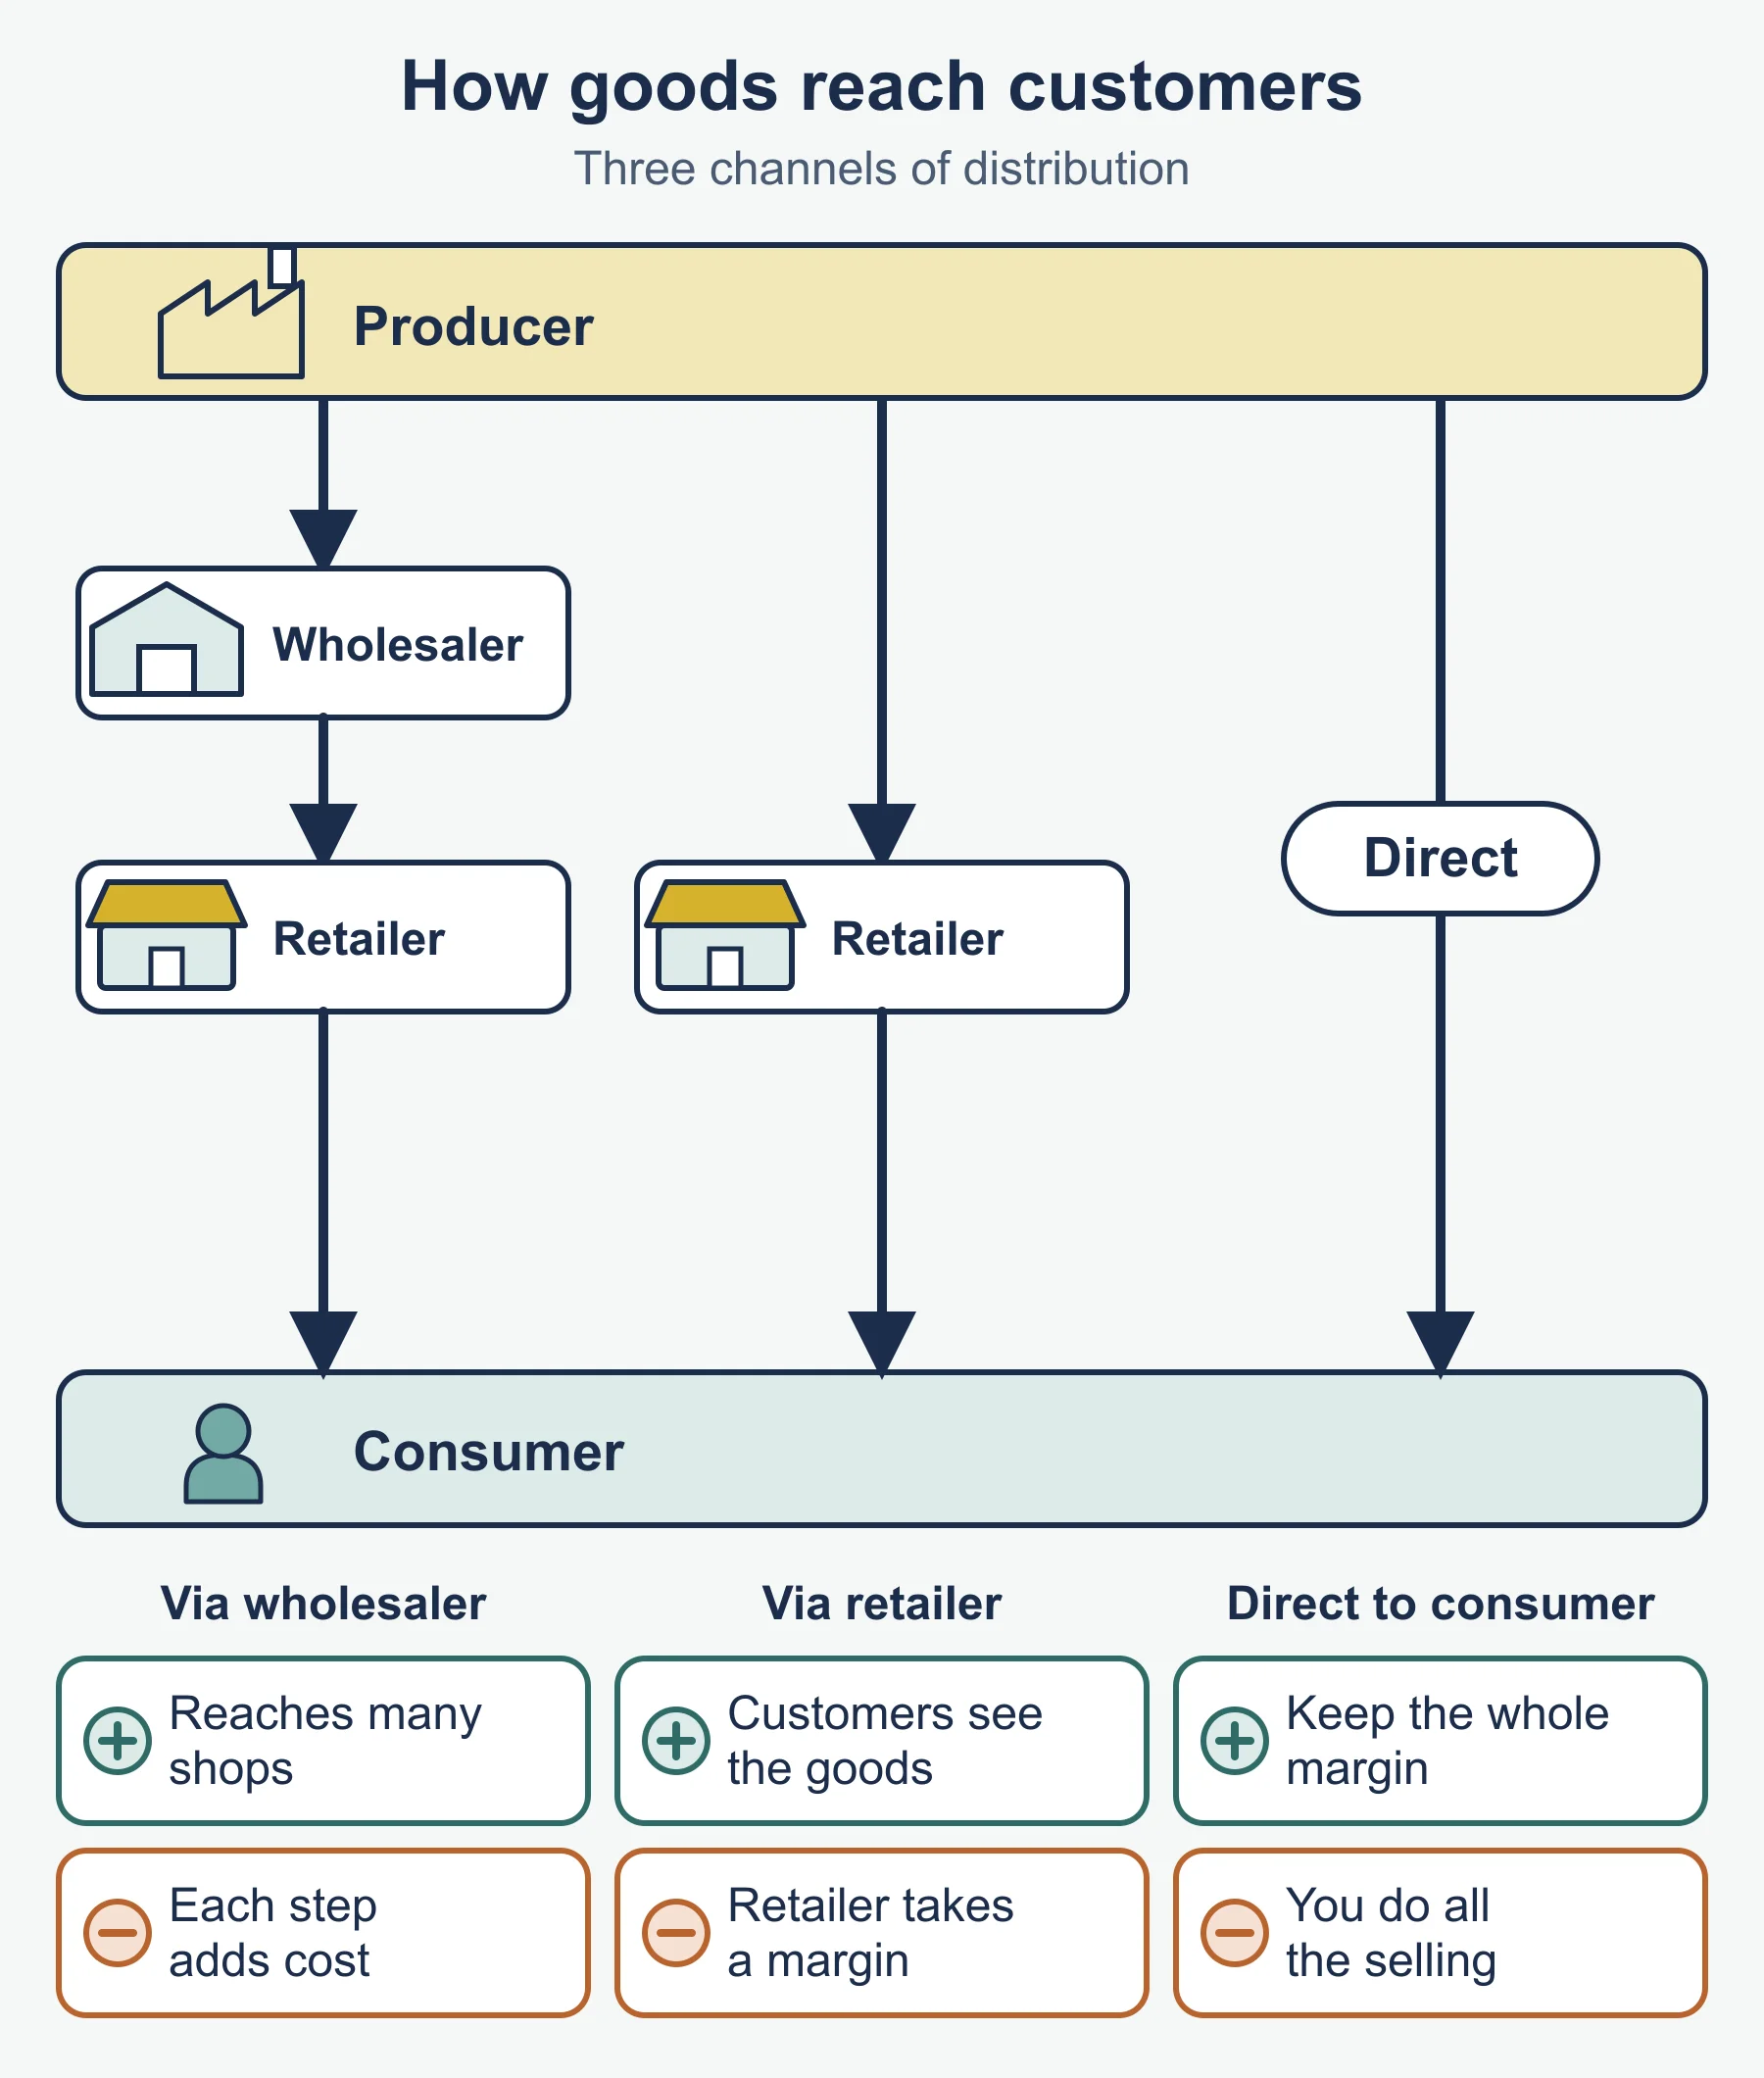
Channels: direct; via retailer; via wholesaler then retailer.
| Channel | Gain | Cost |
|---|---|---|
| Direct | Keeps whole price; brand control; data | Producer bears selling and delivery |
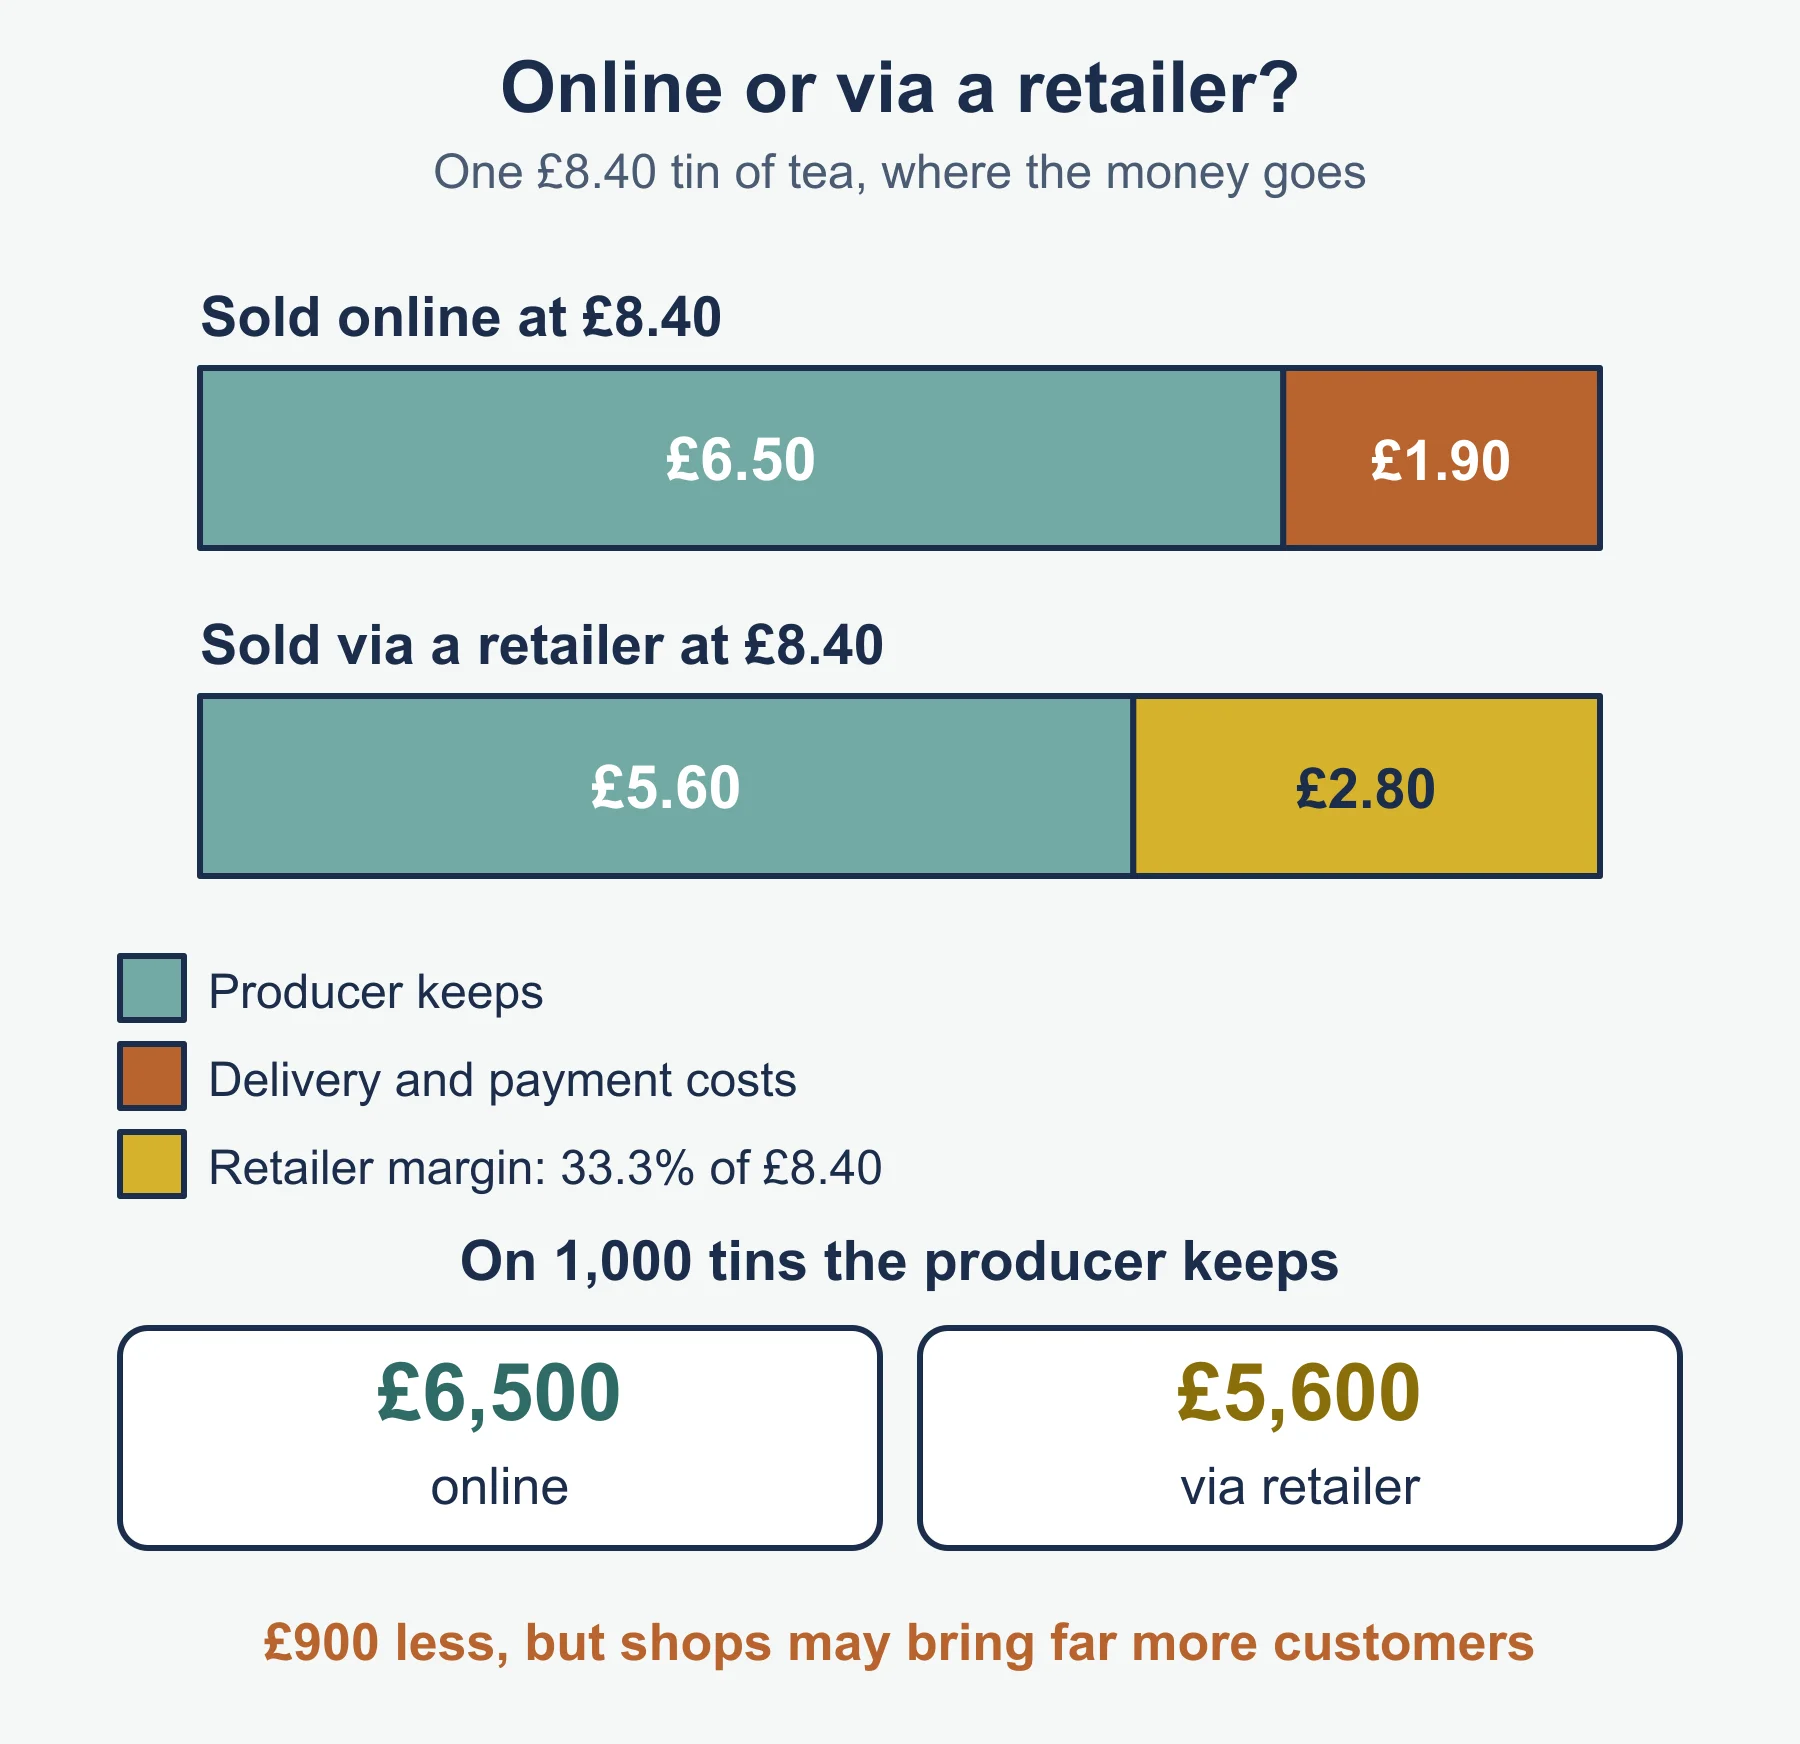
| Retailer | Reach; display; less work | Retailer margin; less control |
| Wholesaler | Bulk-breaking; many outlets | Extra margin |
Digital v physical: physical suits products customers want to see, try or take away now; digital widens reach and works for digital goods, but means delivery, returns and site costs. Many businesses use both.
Retailer margin reminder. A retailer buys at £40 and sells at £65: margin £25, or 38.5% of the selling price.
Quick self-test
- State two tangible attributes and two intangible attributes of a coffee shop’s drink.
- Define a unique selling point.
- A product’s sales (units) are 500, 700, 840, 850 across four years. Calculate the growth in each year and name the likely stage.
- A product has 9% of a market; the largest rival has 18%. Calculate relative market share.
- Name the Boston Matrix category for low share in a fast-growing market.
- Calculate the cost-plus price for a unit cost of £25 and a 40% mark-up.
- Name the pricing method of charging students less than other adults for the same ticket.
- Give one advantage of skimming for a novel product.
- Calculate the cost per new customer: £2,000 spent, 80 customers won.
- Give one disadvantage of selling through a retailer rather than direct.
Answers
- Tangible: size of cup, taste or temperature, packaging. Intangible: friendly service, brand reputation, atmosphere (any two of each).
- A feature of a product that rivals do not offer and that customers value.
- 40%, 20%, 1.2%. Likely maturity (growth slowing sharply).
- 9 / 18 = 0.5.
- Question mark (problem child).
- £25 x 1.40 = £35.00.
- Price discrimination.
- Early buyers pay a high price, so the business recovers development costs quickly.
- £2,000 / 80 = £25.
- The retailer takes a margin, so the producer receives less per unit and has less control over how it is sold.
Where marks are usually lost
- Defining a tool but never tying it to the firm in the stem.
- Mixing up mark-up (on cost) and margin (on price).
- Confusing the Boston Matrix with the life cycle.
- Calling every low-priced launch penetration pricing without reasoning about share.
- Describing a promotion method with no judgement of cost against likely sales.
- Forgetting that psychological pricing is about perception, not cost.
- Ignoring the target segment when choosing a channel.
- Giving evaluation as a list of generic pros and cons rather than a conclusion based on the case.
Frequently asked questions
How many pricing methods are in Cambridge 9609 section 3.3.4? Seven: competitive, penetration, skimming, price discrimination, dynamic, cost-based and psychological pricing. Choose a method by asking about the objective, the market and the product.
How do you calculate relative market share for the Boston Matrix? The standard form divides the business’s own market share by the share of its largest rival. A result above 1 means the business leads that market.
What are extension strategies? Ways to lengthen a product’s life before or during decline, such as new packaging, product modification, new uses or new markets.
What is the difference between direct and indirect channels of distribution? Selling direct keeps the whole price, brand control and customer data, but the producer bears selling and delivery costs. Selling through retailers or wholesalers gives wider reach, but each takes a margin and control is reduced.
Official syllabus
Cambridge International, Cambridge International AS & A Level Business 9609 syllabus for examination in 2026, 2027 and 2028, section 3.3 The marketing mix.
Get free revision emails (optional)
Occasional emails with practice questions, worked explanations and links to free resources for the qualification and subjects you choose. No spam, and you can unsubscribe from any email. The free tools on this site never need an email.
Related resources
-
Study guides
A Level Business: The nature of marketing and Market research (Cambridge 9609)
Full study guide to Cambridge A Level Business 9609 sections 3.1 and 3.2: demand and supply, markets, segmentation, CRM, sampling and market research data.
Business · Cambridge · AS Level
Read guide -
Practice questions
A Level Business: The nature of marketing and Market research (Cambridge 9609) – Practice Questions
Twelve original practice questions with worked answers on Cambridge A Level Business 9609 sections 3.1 and 3.2: markets, segmentation, CRM, research.
Business · Cambridge · AS Level
Try questions -
Revision notes
A Level Business: The nature of marketing and Market research (Cambridge 9609) – Revision Notes
Condensed revision notes for Cambridge A Level Business 9609 sections 3.1 and 3.2, with formulas, comparison tables, a self-test and common mistakes.
Business · Cambridge · AS Level
Revise topic
Related articles
-
teaching
A Level tuition in Dubai: Cambridge or Pearson Edexcel International A Level?
Schools in Dubai and Abu Dhabi teach either Cambridge International AS & A Level or Pearson Edexcel International A Level. How the two are structured, why it matters for tuition, and how online classes from Lahore work.
9 October 2026
-
curriculum guides
Choosing subjects at IGCSE and A Level
How subject choices at 14 and 16 affect university options later, and how to keep pathways open without overloading a timetable.
28 July 2026
Studying this with a teacher
Working through Business AS LEVEL?
This page is free and stays free. If you would rather be taught it, Marlbridge runs Business classes one-to-one and in small groups of up to 15, online in your own time zone. The first trial class is free. WhatsApp replies within an hour (8am–11pm Pakistan time, every day); email the same day.
Cambridge Business teachers at Marlbridge

