
Study Guides
A Level Business: Marketing analysis (Cambridge 9609)
Study guide to Cambridge A Level Business 9609 section 8.1: elasticity, product development, R&D and sales forecasting with worked examples.
- Subject
- Business
- Level
- A LEVEL
- Topic
- Marketing
- Author
- Marlbridge Academic Team
- Updated
- Reviewed by
- Salman Ahmad (what this means)
Aligned to Cambridge A Level Business (9609), For examination in 2026, 2027 and 2028. Official specification .
Syllabus page (what it covers and how it is assessed): Cambridge A Level Business.
Syllabus points this page covers
9609 (A Level)
- 8.1 Marketing analysis
Found an error? Report a correction.
Need help with this topic? Request a free trial class for A Level Business (9609).
This guide covers section 8.1 (Marketing analysis) of the Cambridge International AS & A Level Business 9609 syllabus for examination in 2026, 2027 and 2028. It is A Level content, taught under topic 8 (Marketing). The syllabus says Paper 3 and Paper 4 are based on the A Level content and that AS content is assumed knowledge, so you should be ready to use these ideas on a case study. The syllabus says answers to the last part of Paper 3 Questions 3 and 4, and to both Paper 4 questions, should show evaluation.
Related pages: revision notes, practice questions, the topic 8 practice set, the marketing mix guide, the course hub, the checklist and the free diagnostics.
What 8.1 asks you to know
| Section | What you must be able to do |
|---|---|
| 8.1.1 Elasticity | Explain elasticity of demand (price, income and promotional); calculate all three; interpret results; show the effect on decisions; judge the limitations |
| 8.1.2 Product development | Describe the process; name sources of ideas; explain why research and development (R&D) matters |
| 8.1.3 Sales forecasting | Explain why firms forecast; calculate and use the four period centred moving average; describe qualitative methods; show the effect on decisions |
8.1.1 Elasticity
Elasticity of demand shows how far buyers react to a change in something else. You compare two percentage changes. The syllabus names three forms.
| Form | Responds to | Formula (standard form) |
|---|---|---|
| Price elasticity of demand (PED) | Price of the product | quantity response (%) ÷ price change (%) |
| Income elasticity of demand (YED) | Consumer income | quantity response (%) ÷ income change (%) |
| Promotional elasticity of demand (PromED) | Spending on promotion | quantity response (%) ÷ promotional spending change (%) |
The syllabus does not print these formulas, so they are given here in their standard form. The percentage change is (new − old) ÷ old × 100. Keep the sign on the answer, because it carries meaning.
Price elasticity of demand
Worked example. Aldergrove Oat Drinks raises the price of its one-litre carton from £2.00 to £2.20. Weekly sales fall from 50 000 to 46 000 cartons.
- Price change = £0.20 on a base of £2.00, so the percentage rise is +10%.
- % change in quantity = (46 000 − 50 000) ÷ 50 000 × 100 = −8%.
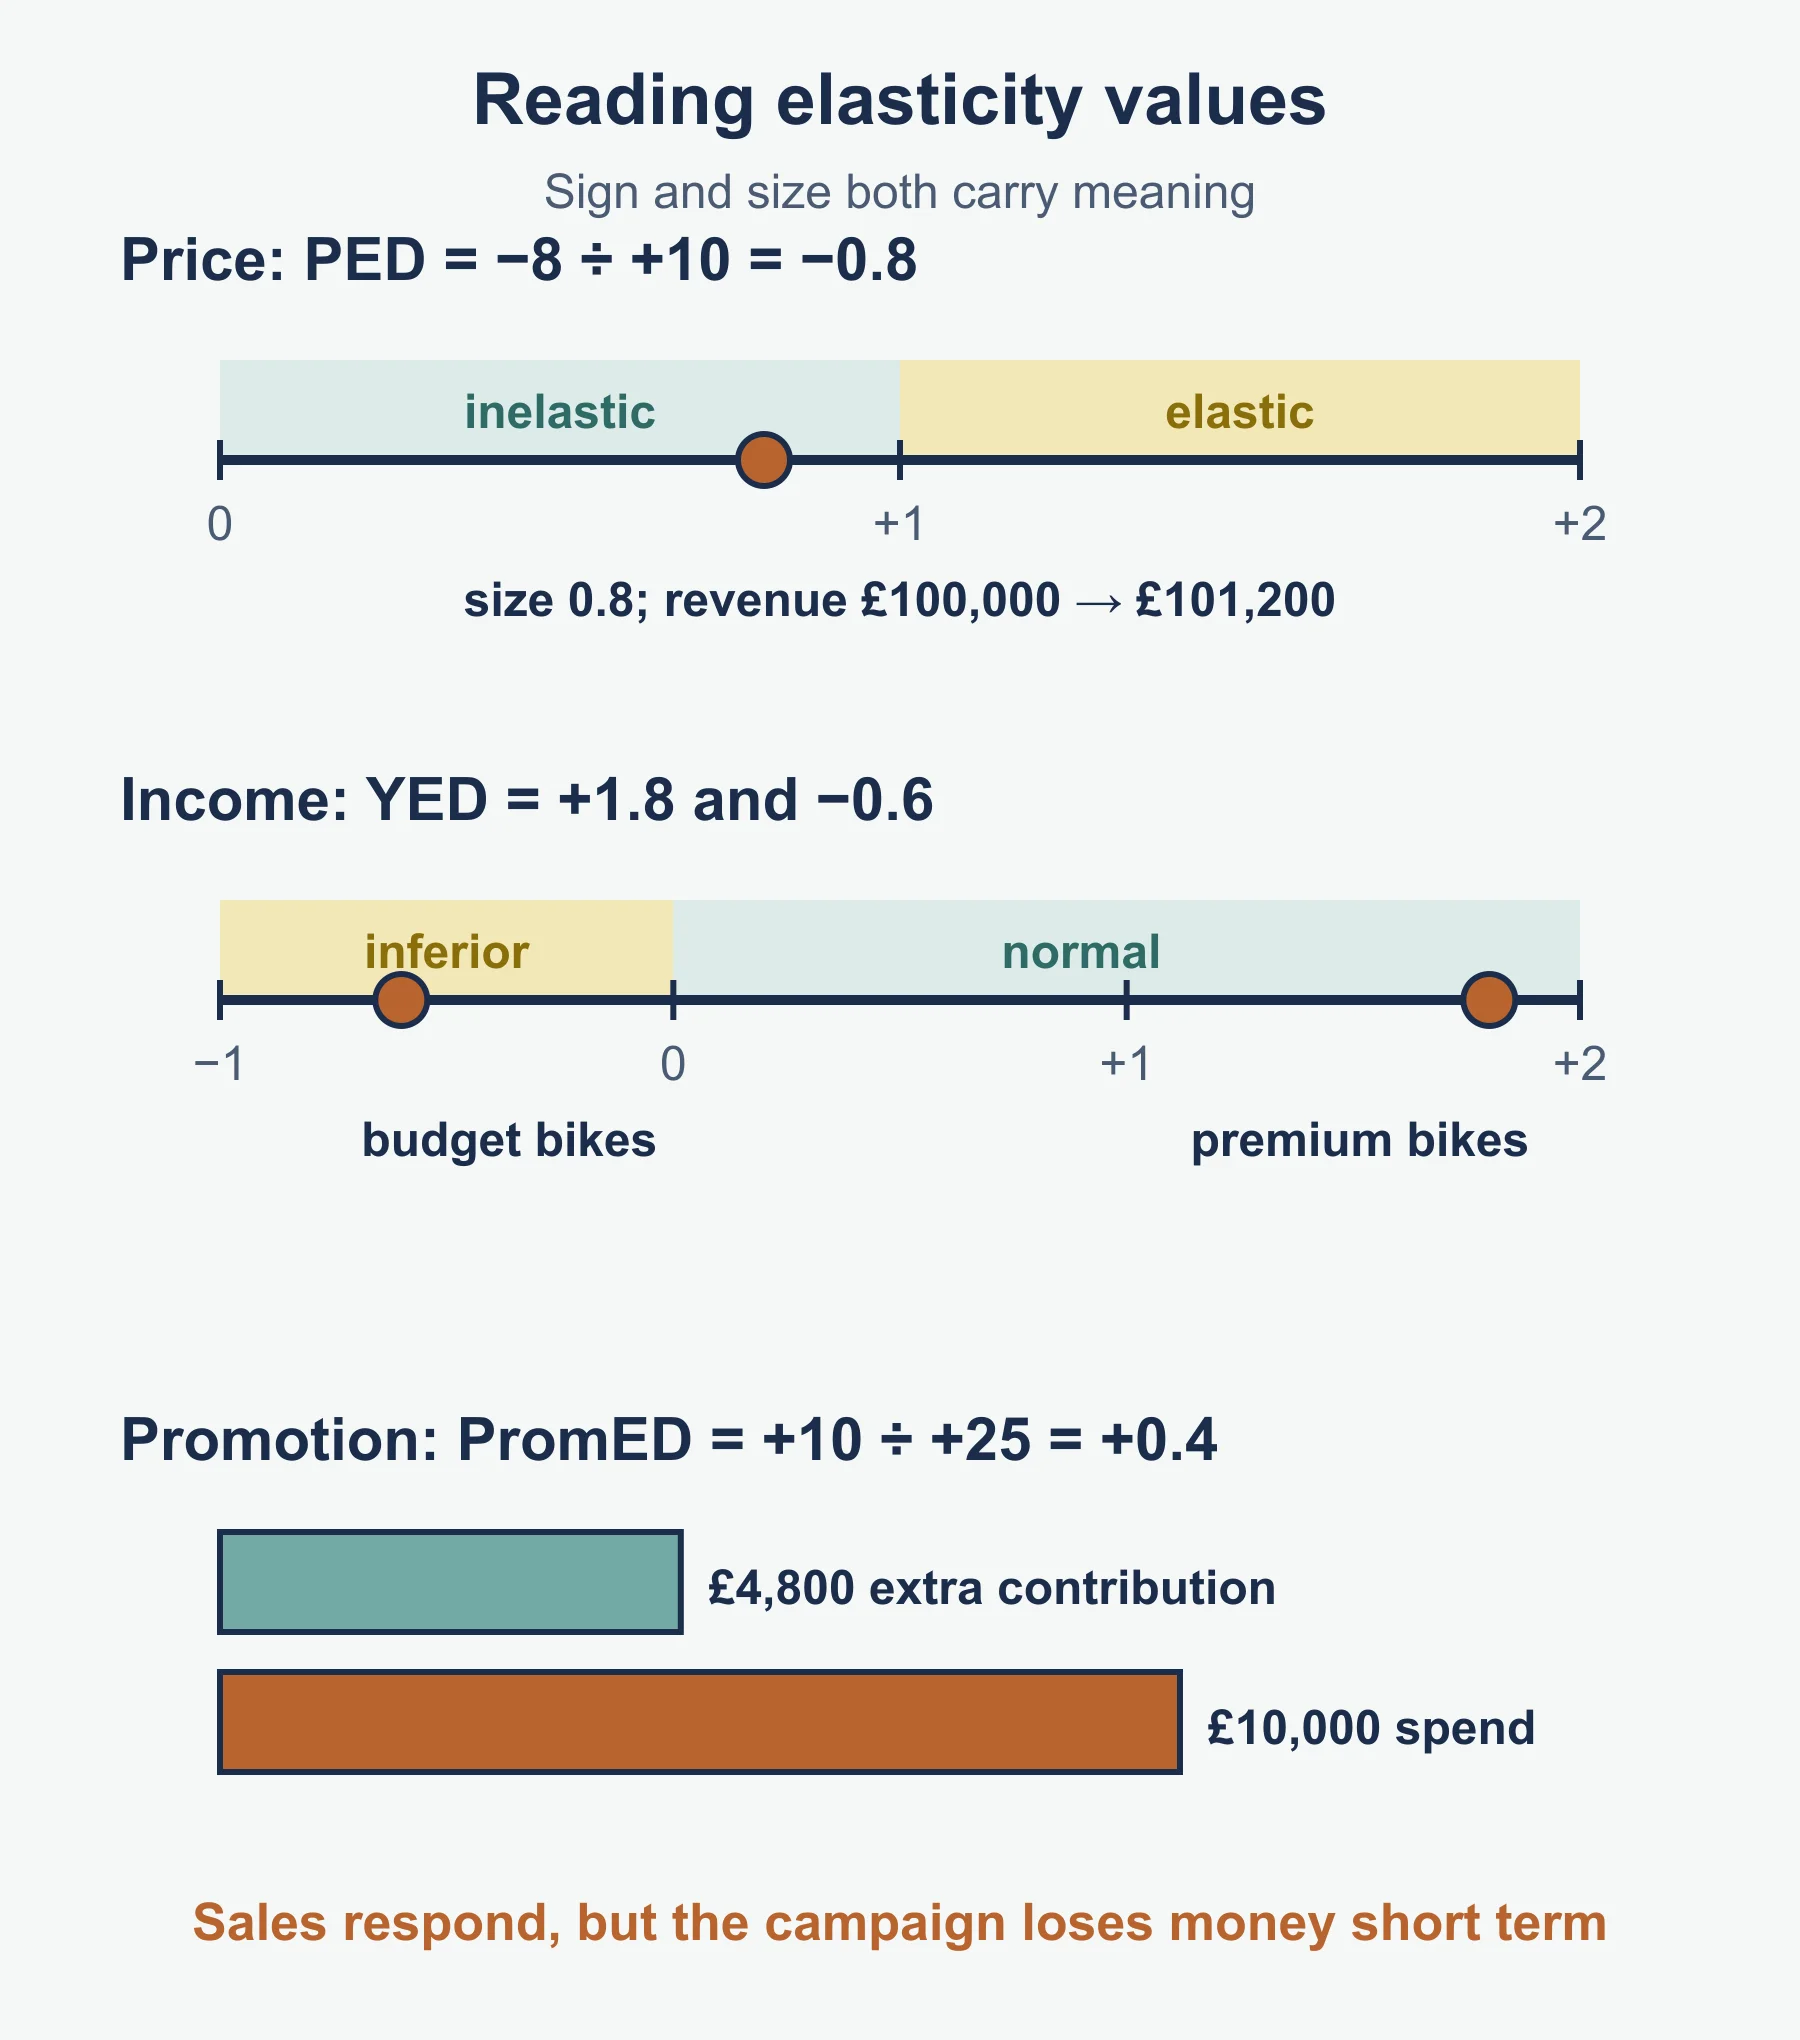
- PED = −8 ÷ +10 = −0.8.
PED is almost always negative, because a higher price lowers quantity demanded. Some sources quote only the size. Interpret by size:
- Size above 1: price elastic. The percentage move in quantity is larger than the percentage move in price.
- Size below 1: price inelastic. The percentage move in quantity is smaller than the percentage move in price.
- Size exactly 1: unitary.
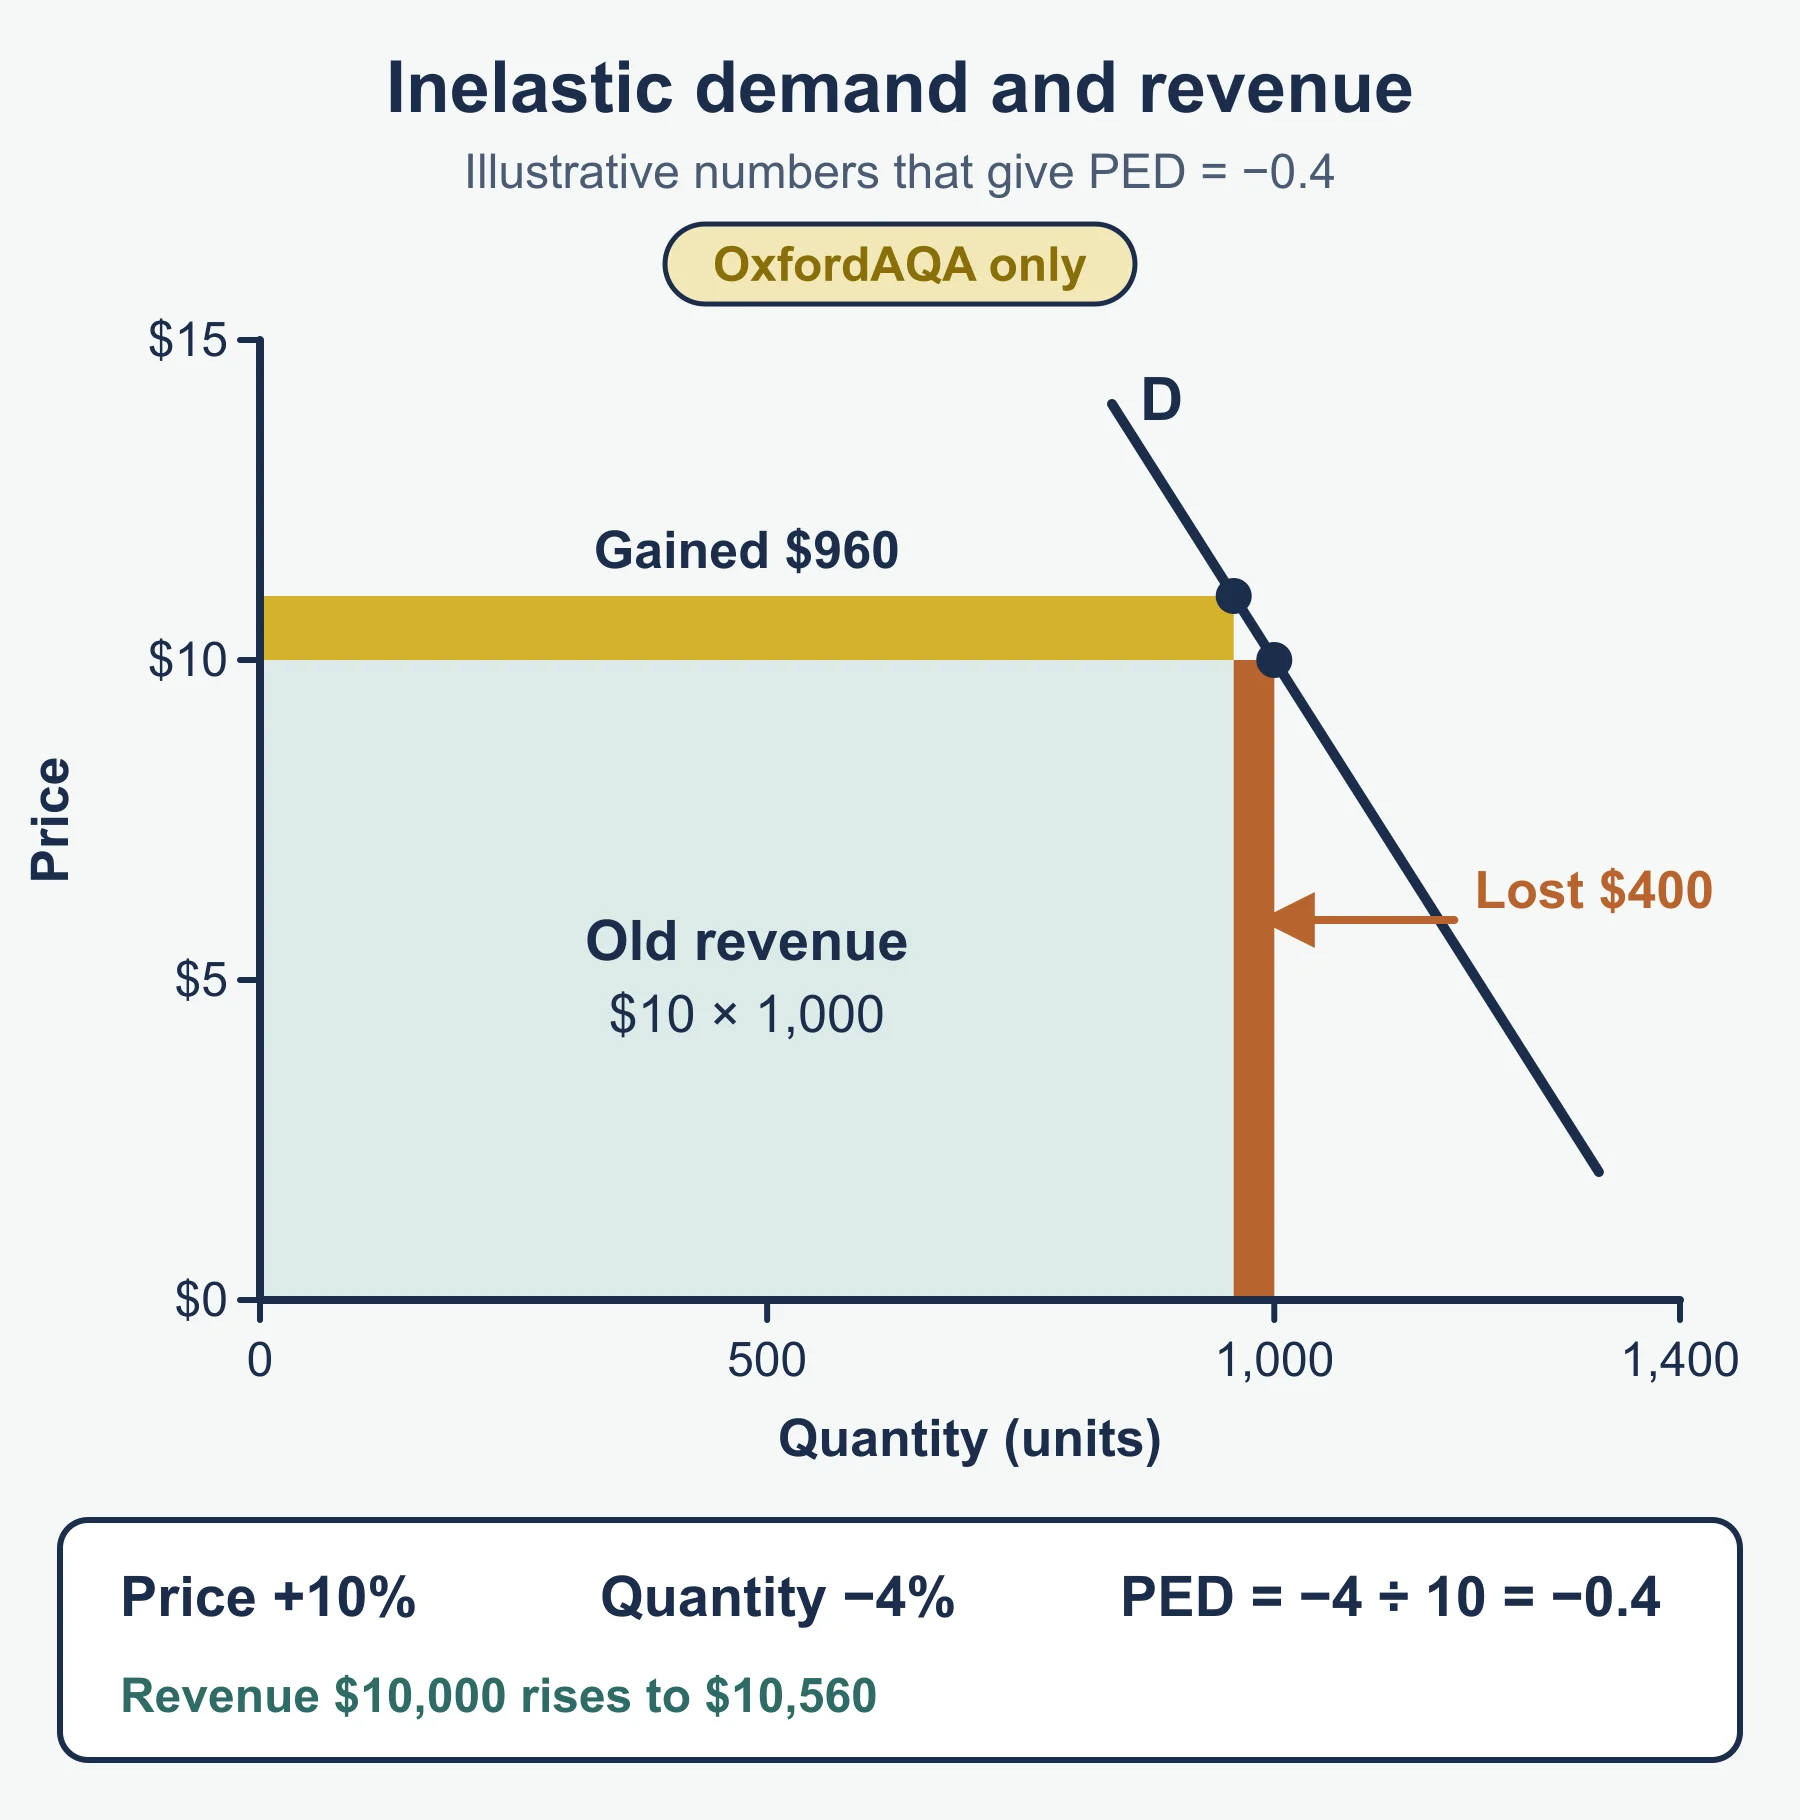
Here demand is inelastic. Check the effect on sales revenue: before = £2.00 × 50 000 = £100 000; after = £2.20 × 46 000 = £101 200. Revenue rises by £1 200, which is the usual result when demand is inelastic and the price goes up. If demand were elastic, a price rise would cut revenue and a price cut would raise it.
Income elasticity of demand
Worked example. Zennick Cycles sells two lines. When average household income rises 5%, demand for its premium electric bikes rises 9% and demand for its budget bikes falls 3%.
- YED for premium bikes = +9 ÷ +5 = +1.8.
- YED for budget bikes = −3 ÷ +5 = −0.6.
A positive YED means a normal good. A value above 1 means demand grows faster than income, so sales of this product are very sensitive to the economy (often called a luxury). A positive value below 1 means demand rises more slowly than income. A negative YED means an inferior good: demand falls as income rises.
Promotional elasticity of demand
Worked example. Ossian Pet Foods raises its promotional spending on a premium dog food from £40 000 to £50 000 a year. Sales rise from 8 000 to 8 800 units.
- % change in promotional spending = 10 000 ÷ 40 000 × 100 = +25%.
- % change in quantity = 800 ÷ 8 000 × 100 = +10%.
- PromED = +10 ÷ +25 = +0.4.
A positive value means the promotion works, and a value below 1 means each extra pound spent brings a less than proportionate sales response. Whether this is worth it depends on money. The selling price is £15 and the variable cost is £9, so each unit adds £6 of contribution. The extra 800 units add £4 800 of contribution, against £10 000 of extra spending. In the short run the campaign loses money. A longer view (brand loyalty, repeat purchase) could change the judgement.
Using elasticity in decisions
- Pricing. Inelastic demand supports a price rise to lift revenue. Elastic demand supports a price cut, or a non-price approach such as differentiation.
- Product range. A high positive YED suggests investing in premium lines during growth. A negative YED suggests budget lines hold up in a downturn, so a mixed range spreads risk.
- Promotion. A low PromED suggests the budget may be better spent elsewhere, or on a different medium.
Limitations of elasticity
Elasticity gives a number, but the number is only as good as its inputs.
- It is calculated from past data, and markets change (new competitors, new tastes).
- It assumes nothing else changed. In practice weather, rival prices, advertising and fashion move at the same time, so the change in quantity may not come from the price alone.
- The value may differ for different sizes of change, so a result for a 10% rise may not hold for a 30% rise.
- A small survey or short period gives an unreliable estimate.
- Time matters. Customers often respond slowly, so a short-run figure can differ from a long-run one.
8.1.2 Product development
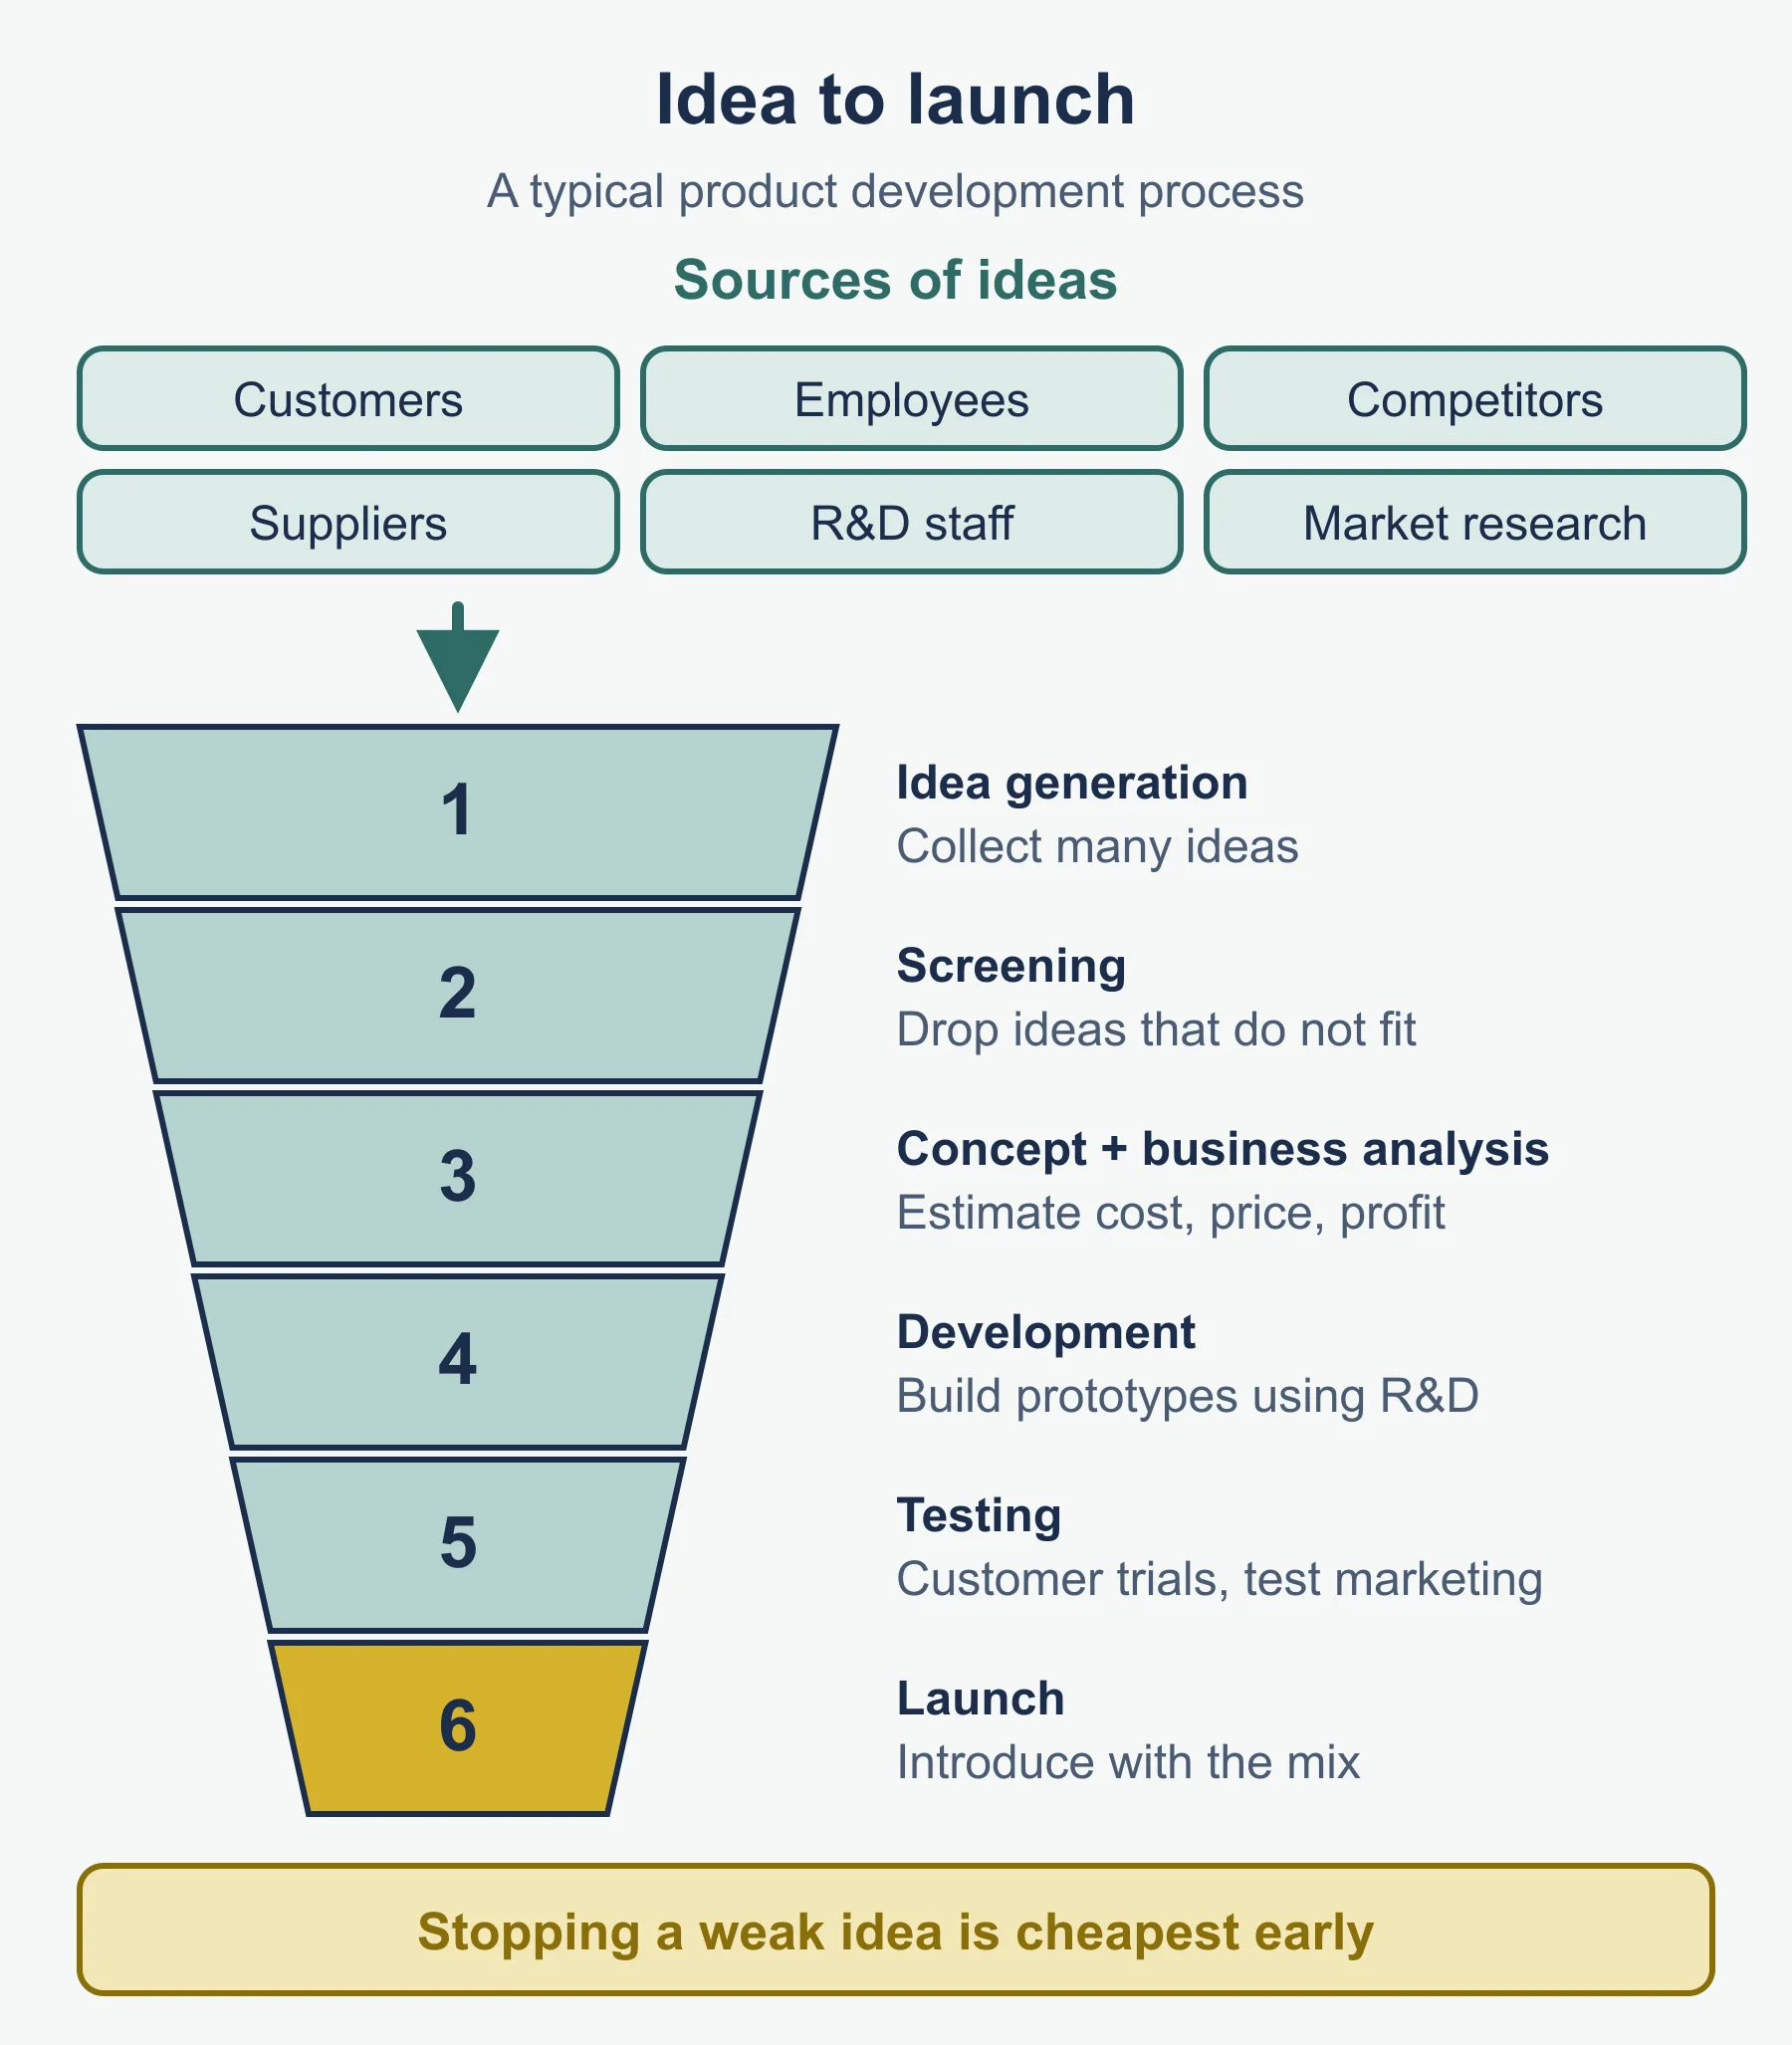
Product development is the process of turning an idea into a product ready for sale. The syllabus asks for the process, the sources of ideas and the importance of R&D. It does not fix the number of stages, so the sequence below is a typical one.
- Idea generation. Collect many ideas.
- Screening. Remove ideas that do not fit the firm’s aims, skills, resources or likely demand.
- Concept and business analysis. Estimate costs, price, demand and profit for the surviving ideas.
- Development. Design and build prototypes, using R&D.
- Testing. Use customer trials or test marketing in a limited area.
- Launch. Introduce the product, supported by the marketing mix.
Stopping a weak idea is cheapest early.
Sources of new ideas
- Customers, through surveys, reviews, complaints and social media.
- Employees, particularly sales staff, who hear what buyers ask for.
- Competitors, whose products can be studied and improved.
- Suppliers and distributors, who may know about new materials or trends.
- R&D staff, who test new technology and materials.
- Market research, which shows gaps and changing tastes.
Worked example. Muirfield Audio makes wireless speakers. Its sales team reports that buyers keep asking for a speaker that survives a fall into water. A supplier offers a new sealant. These two sources, customers (through staff) and a supplier, make the idea worth screening.
Research and development
Research and development (R&D) is the work a business does to create new products and improve existing products and processes.
Why it matters:
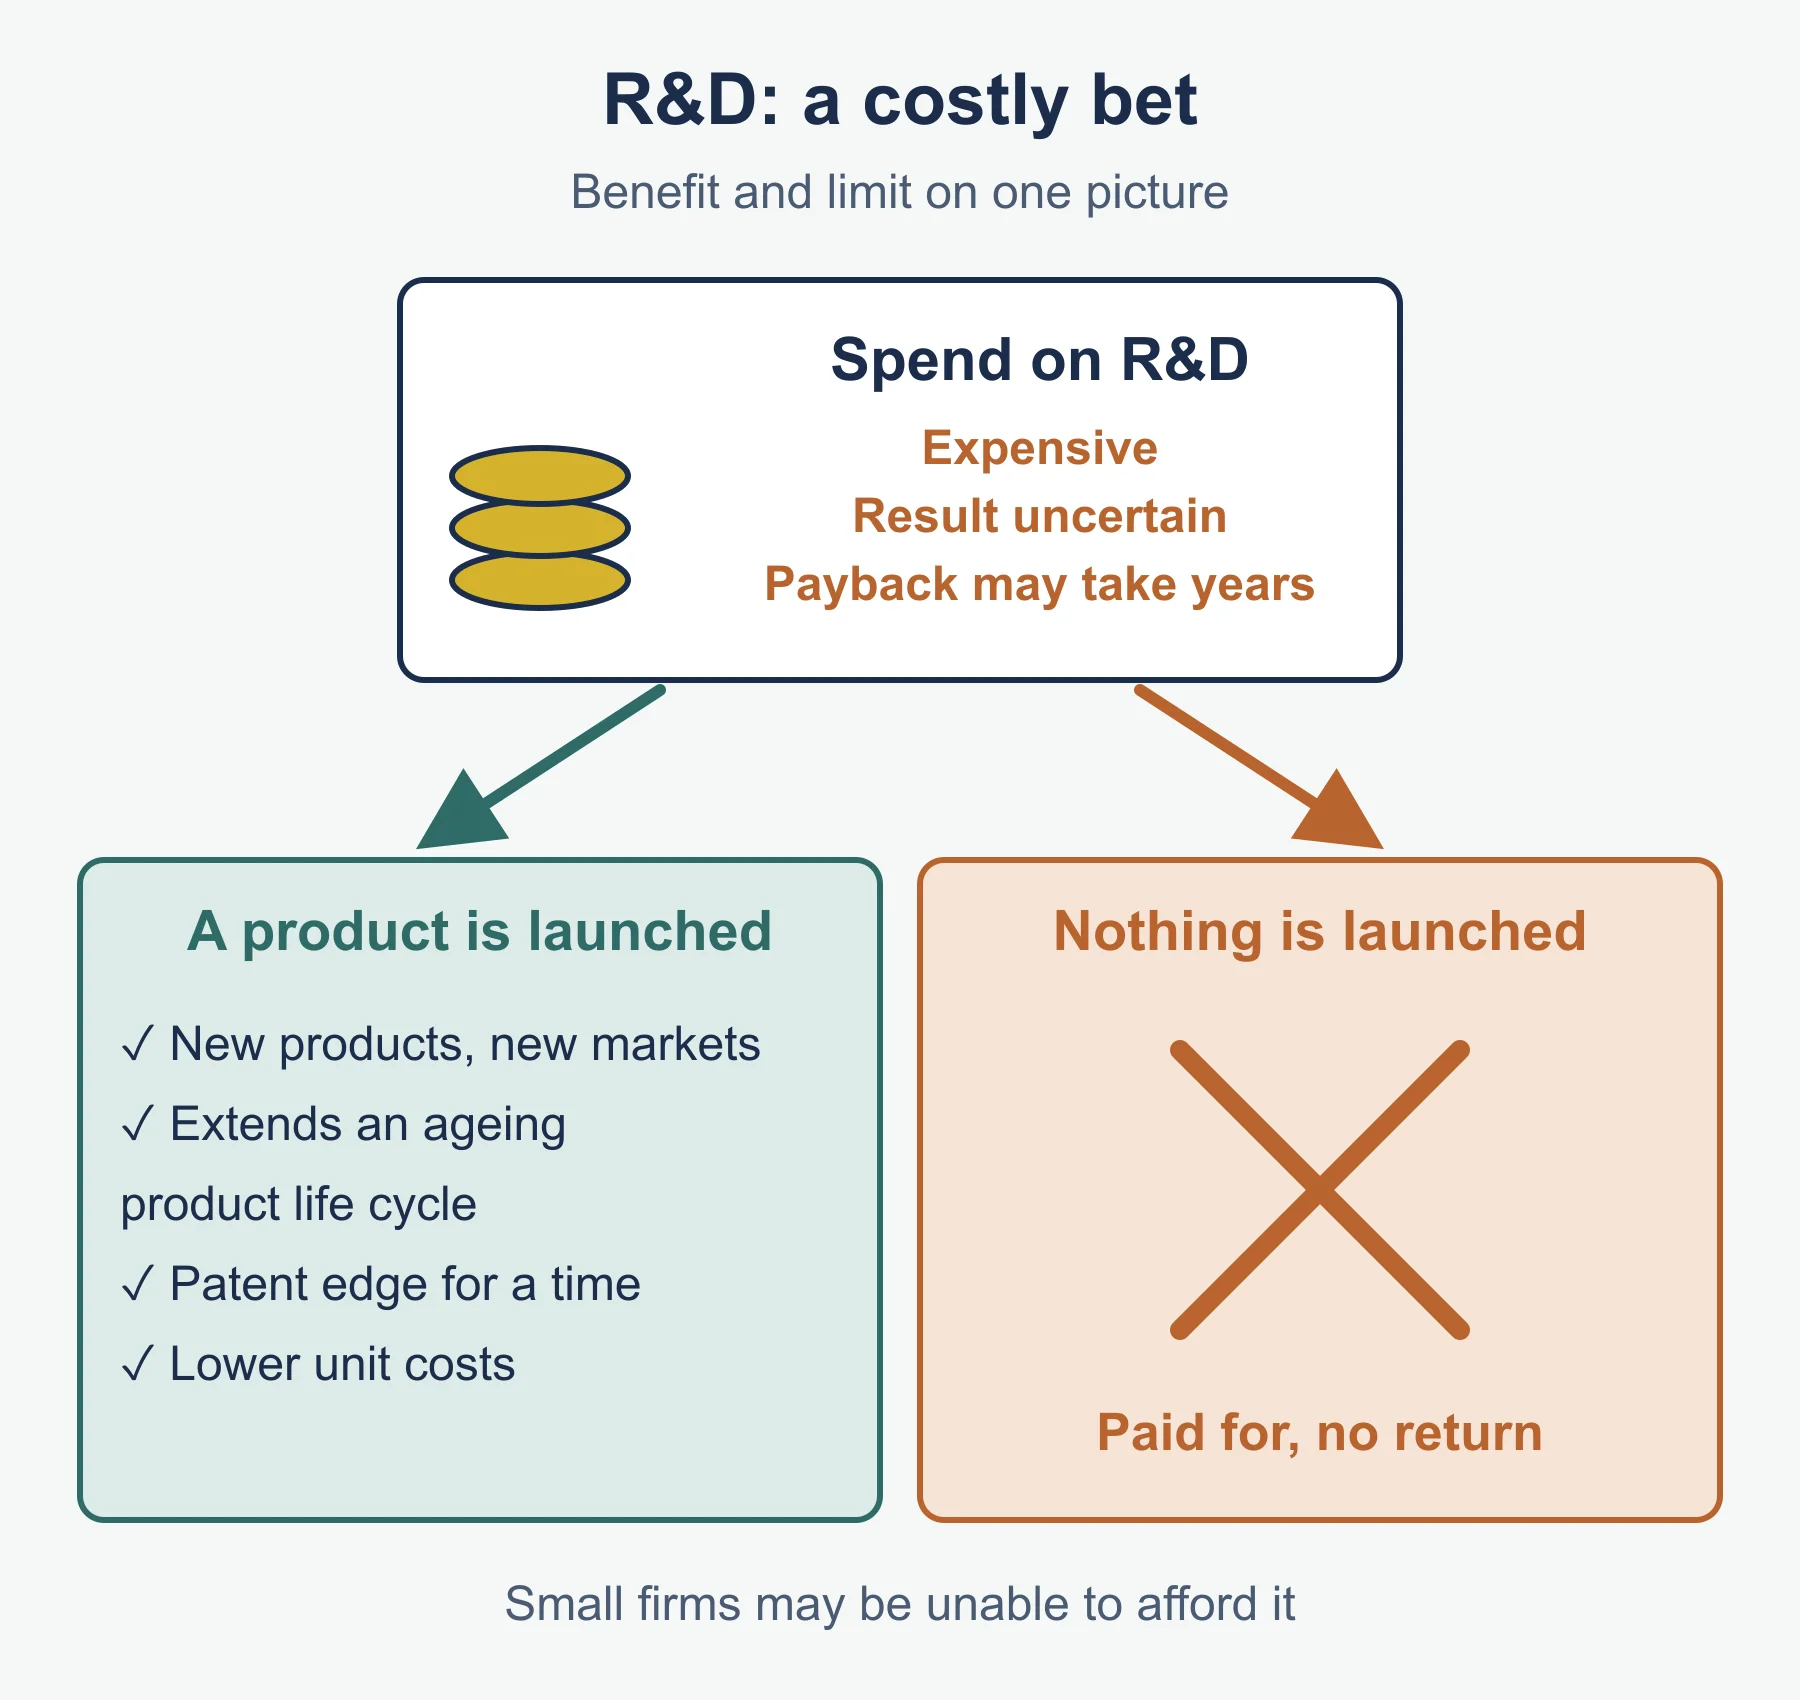
- It can produce new products that open new markets or extend the product life cycle of an ageing one.
- A product that is protected, for example by a patent, can give a competitive advantage for a time.
- It can lower unit costs through better processes.
The limits are just as important. R&D is expensive, results are uncertain, and the payback may take years. A small firm may not be able to afford it. A firm that spends heavily but launches nothing has paid for no return.
8.1.3 Sales forecasting
A sales forecast is a firm’s prediction of what it will sell in a coming period. Firms need it to plan production, buy materials and stock, schedule staff, set budgets and cash flow, and decide marketing spending. Too high a forecast leaves unsold stock; too low leaves empty shelves and lost customers.
Four period centred moving average
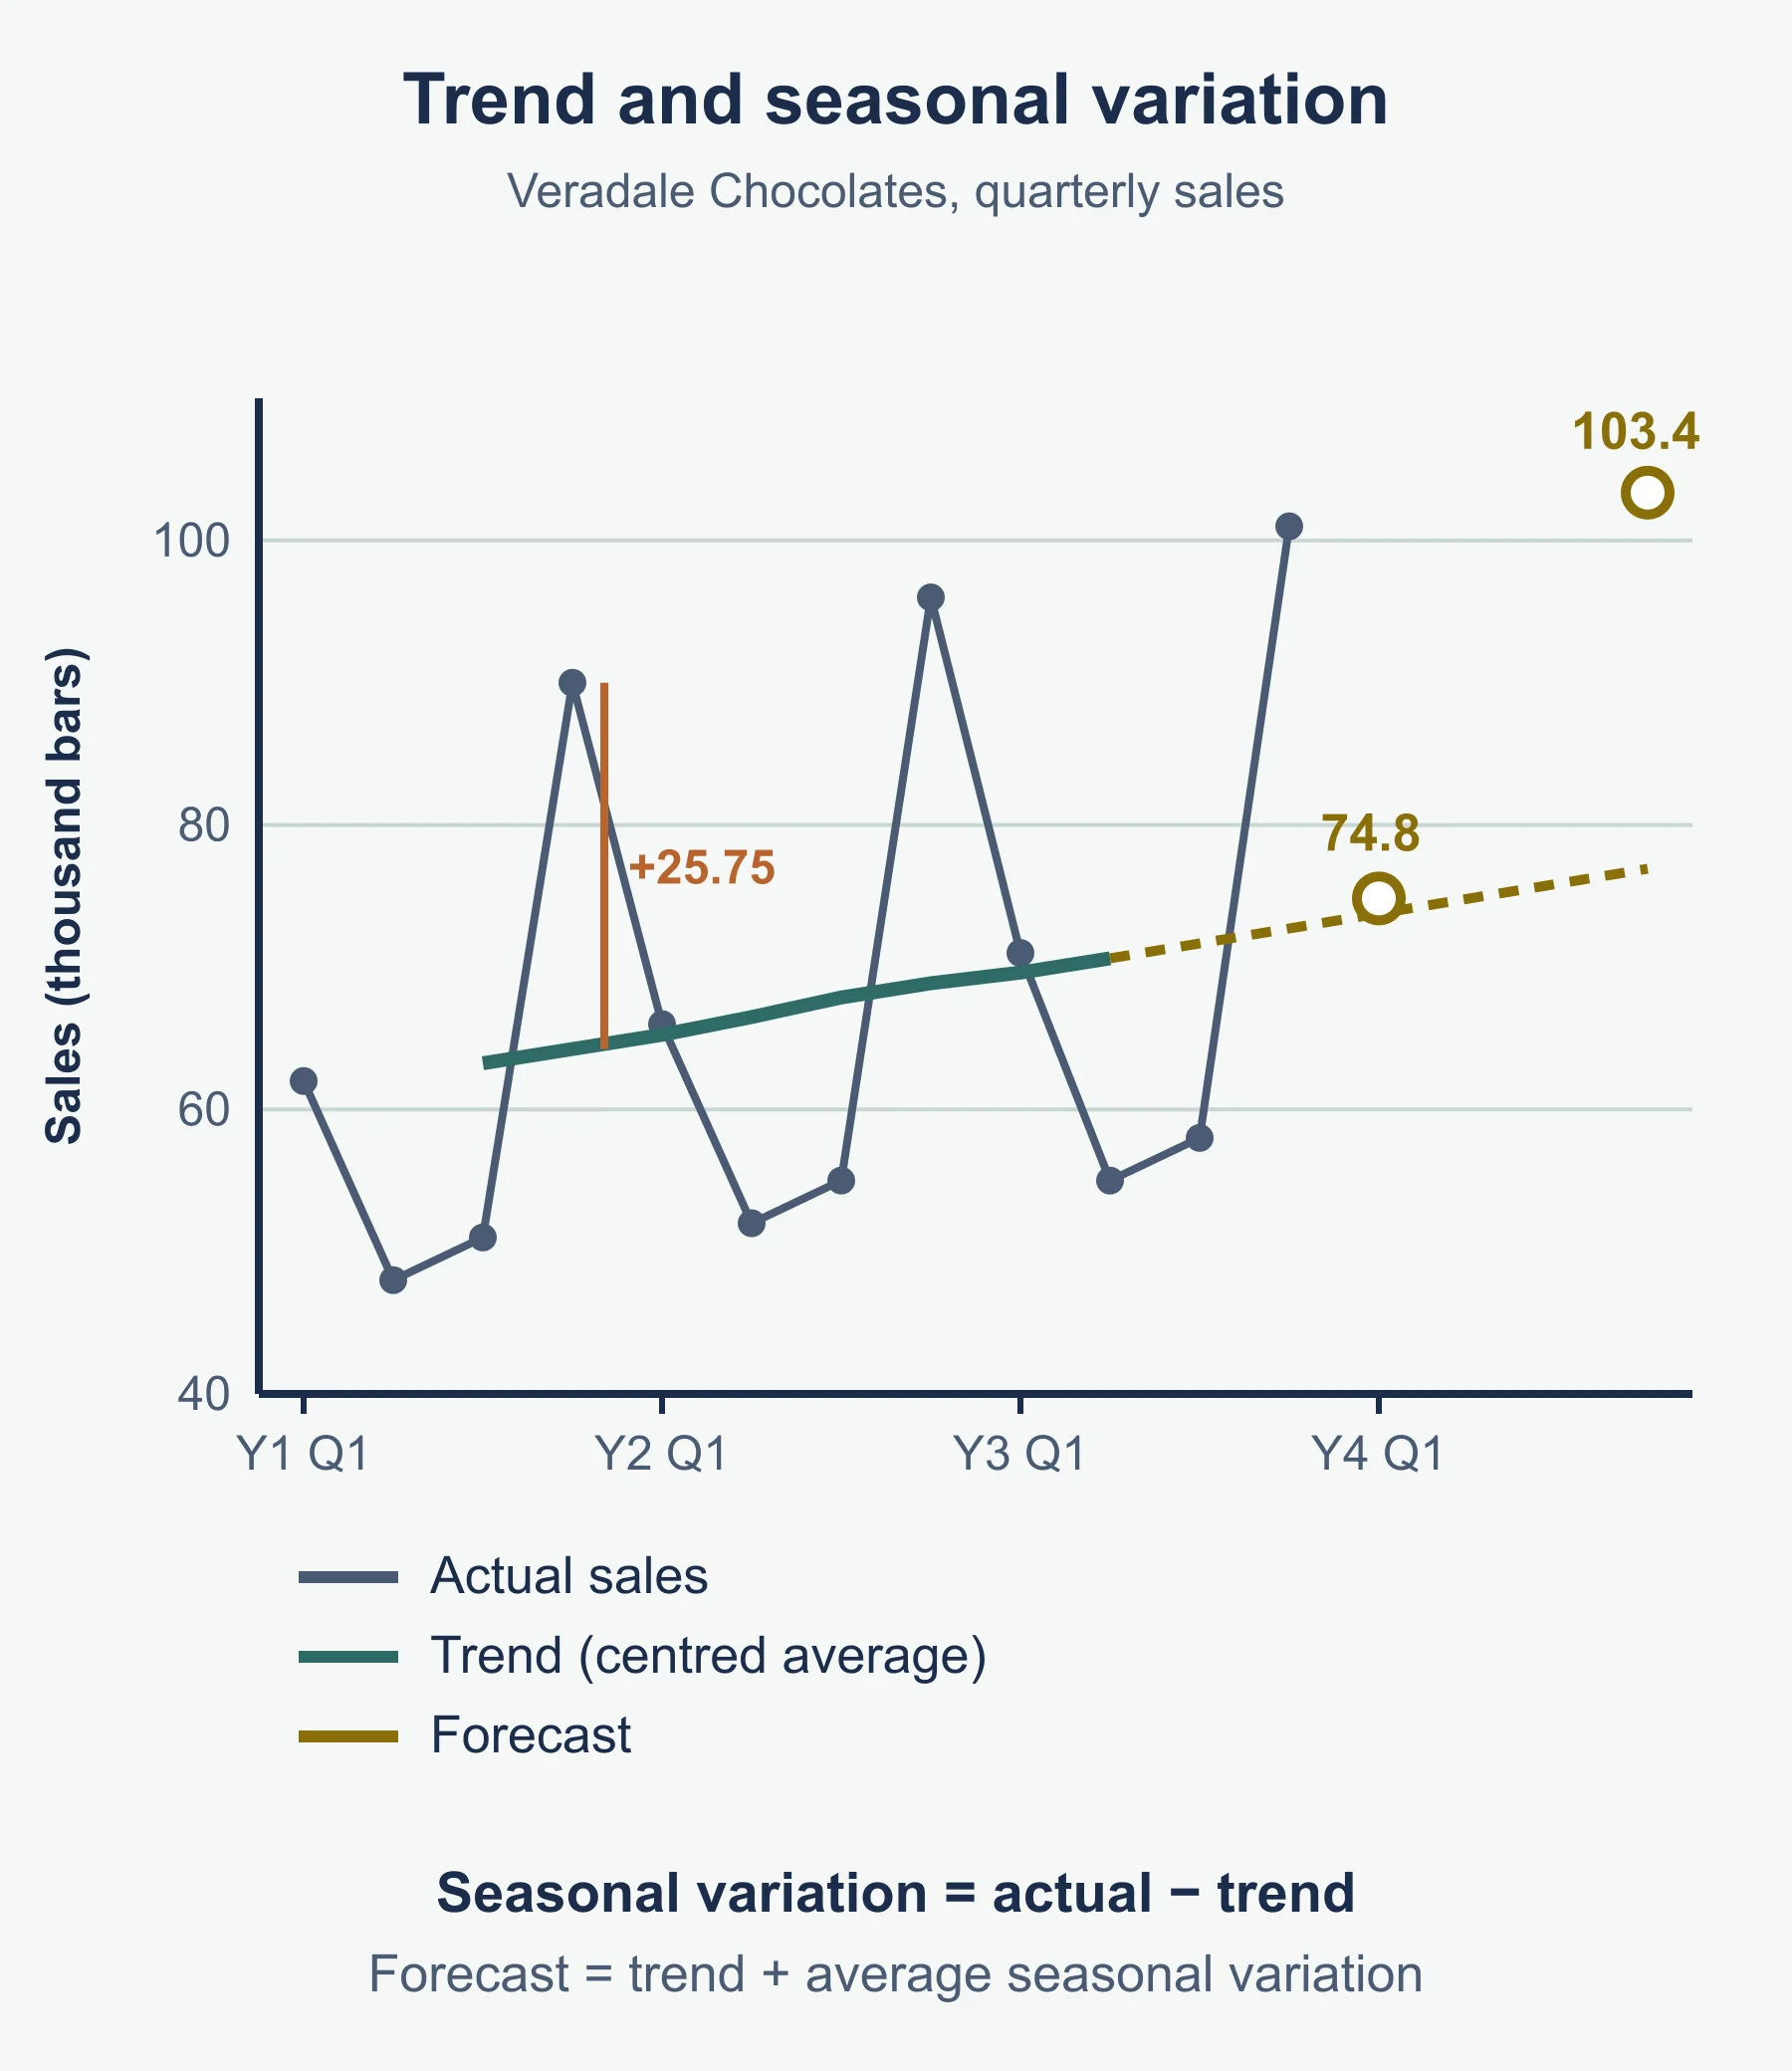
Time series analysis breaks a series of past sales into a trend (the underlying direction) and seasonal variation (regular differences by time of year). With quarterly data you use a four period moving average. Because four is an even number, the average falls halfway between two quarters, so you centre it.
Method:
- Find each four-quarter moving total (add four consecutive quarters, then drop the oldest and add the next).
- Add each pair of consecutive totals to get an eight-quarter total.
- Divide by 8. This is the centred moving average (CMA), the trend for the middle quarter.
- Seasonal variation = actual sales − trend.
- Average the seasonal variations for each quarter across the years.
- Forecast = projected trend + average seasonal variation for that quarter.
Worked example. Veradale Chocolates records sales (thousand bars):
| Year | Quarter 1 | Quarter 2 | Quarter 3 | Quarter 4 |
|---|---|---|---|---|
| 1 | 62 | 48 | 51 | 90 |
| 2 | 66 | 52 | 55 | 96 |
| 3 | 71 | 55 | 58 | 101 |
Four-quarter totals: 251, 255, 259, 263, 269, 274, 277, 280, 285.
For Year 1 Quarter 3: (251 + 255) ÷ 8 = 506 ÷ 8 = 63.25. For Year 1 Quarter 4: (255 + 259) ÷ 8 = 64.25. Continuing gives:
| Quarter | Actual | CMA (trend) | Seasonal variation |
|---|---|---|---|
| Y1 Q3 | 51 | 63.25 | −12.25 |
| Y1 Q4 | 90 | 64.25 | +25.75 |
| Y2 Q1 | 66 | 65.25 | +0.75 |
| Y2 Q2 | 52 | 66.50 | −14.50 |
| Y2 Q3 | 55 | 67.875 | −12.875 |
| Y2 Q4 | 96 | 68.875 | +27.125 |
| Y3 Q1 | 71 | 69.625 | +1.375 |
| Y3 Q2 | 55 | 70.625 | −15.625 |
Average seasonal variations (to 2 decimal places): Quarter 1 +1.06; Quarter 2 −15.06; Quarter 3 −12.56; Quarter 4 +26.44.
The trend rises from 63.25 to 70.625 over seven quarters, which is (70.625 − 63.25) ÷ 7 = about 1.05 a quarter. To forecast Year 4 Quarter 1 (three quarters after the last CMA):
- Trend = 70.625 + 3 × 1.05 = 73.775.
- Forecast = 73.775 + 1.06 = about 74.8 thousand bars.
For Year 4 Quarter 4: trend = 70.625 + 6 × 1.05 = 76.925; forecast = 76.925 + 26.44 = about 103.4 thousand bars.
The first two and last two quarters have no CMA. Show each total so a slip is easy to find. A forecast made many periods beyond the data carries more risk of error.
Qualitative sales forecasting
Qualitative forecasting uses opinion and judgement instead of past figures. It is useful when there is no sales history, such as a new product, or when conditions have changed sharply.
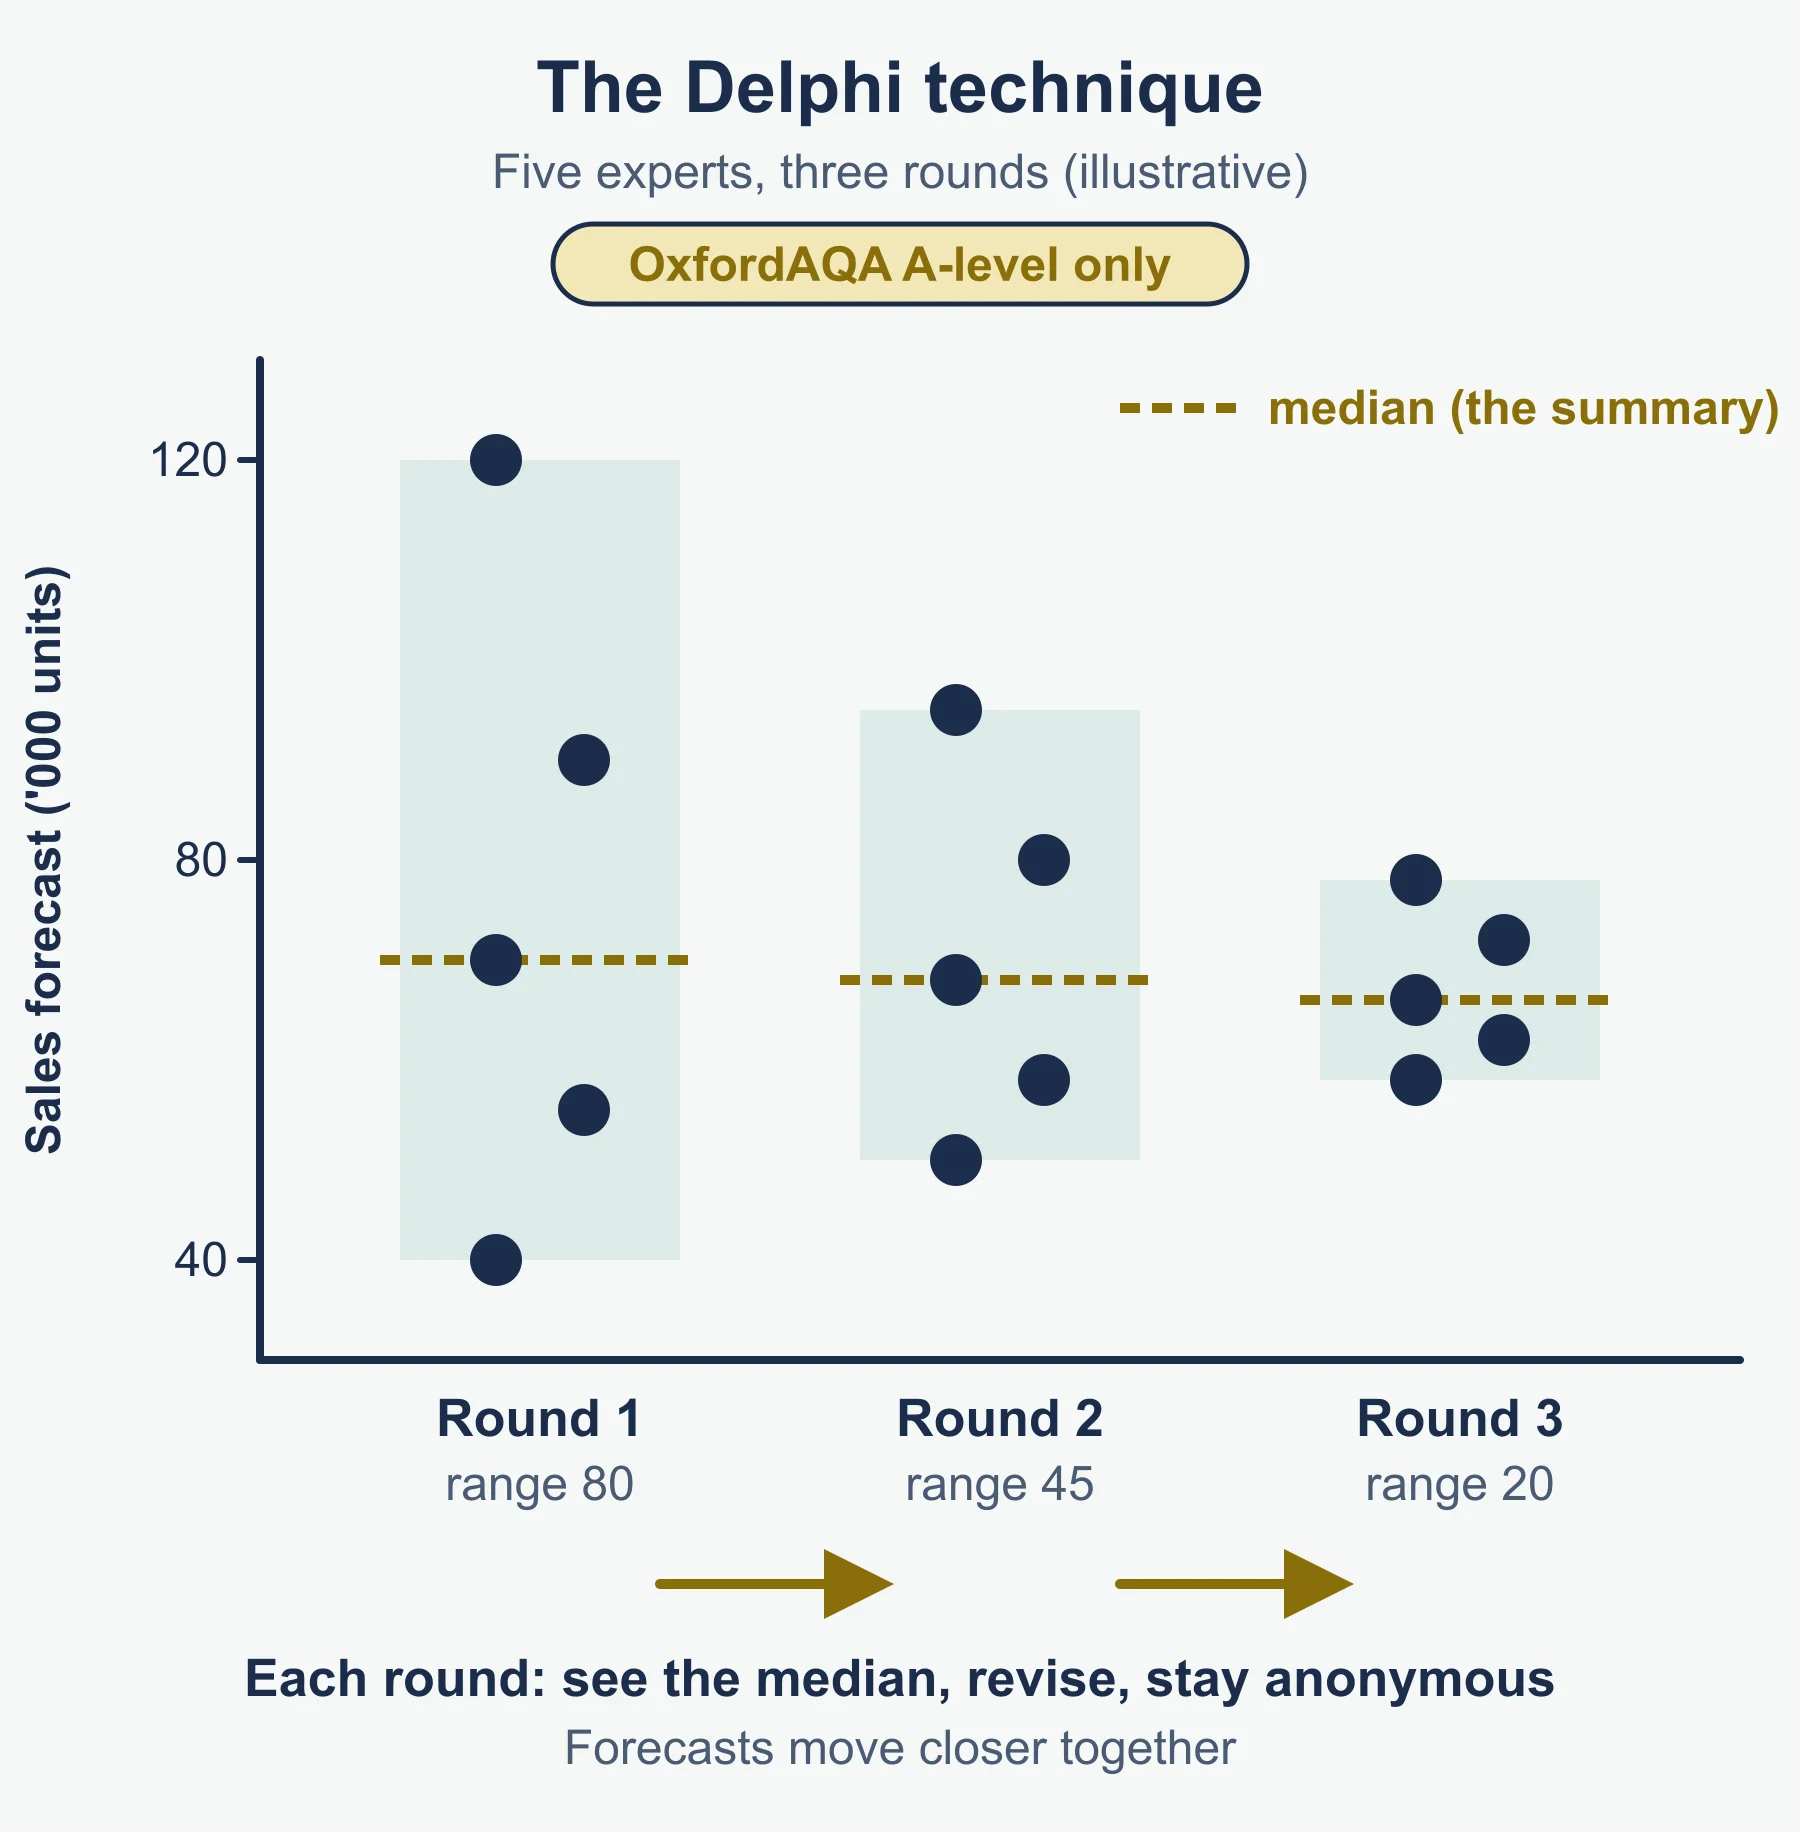
- Expert opinion (sometimes a panel asked repeatedly until views converge).
- Sales force opinion, from staff who know their customers.
- Consumer panels, surveys and test marketing, which ask potential buyers about intentions.
- Market research into trends and competitors.
Strengths: it can include new information and works without history. Weaknesses: it is subjective, opinions may be biased, buyers’ stated intentions often differ from what they buy, and it can be slow and costly. Many firms use both approaches.
Impact of forecasting on decisions
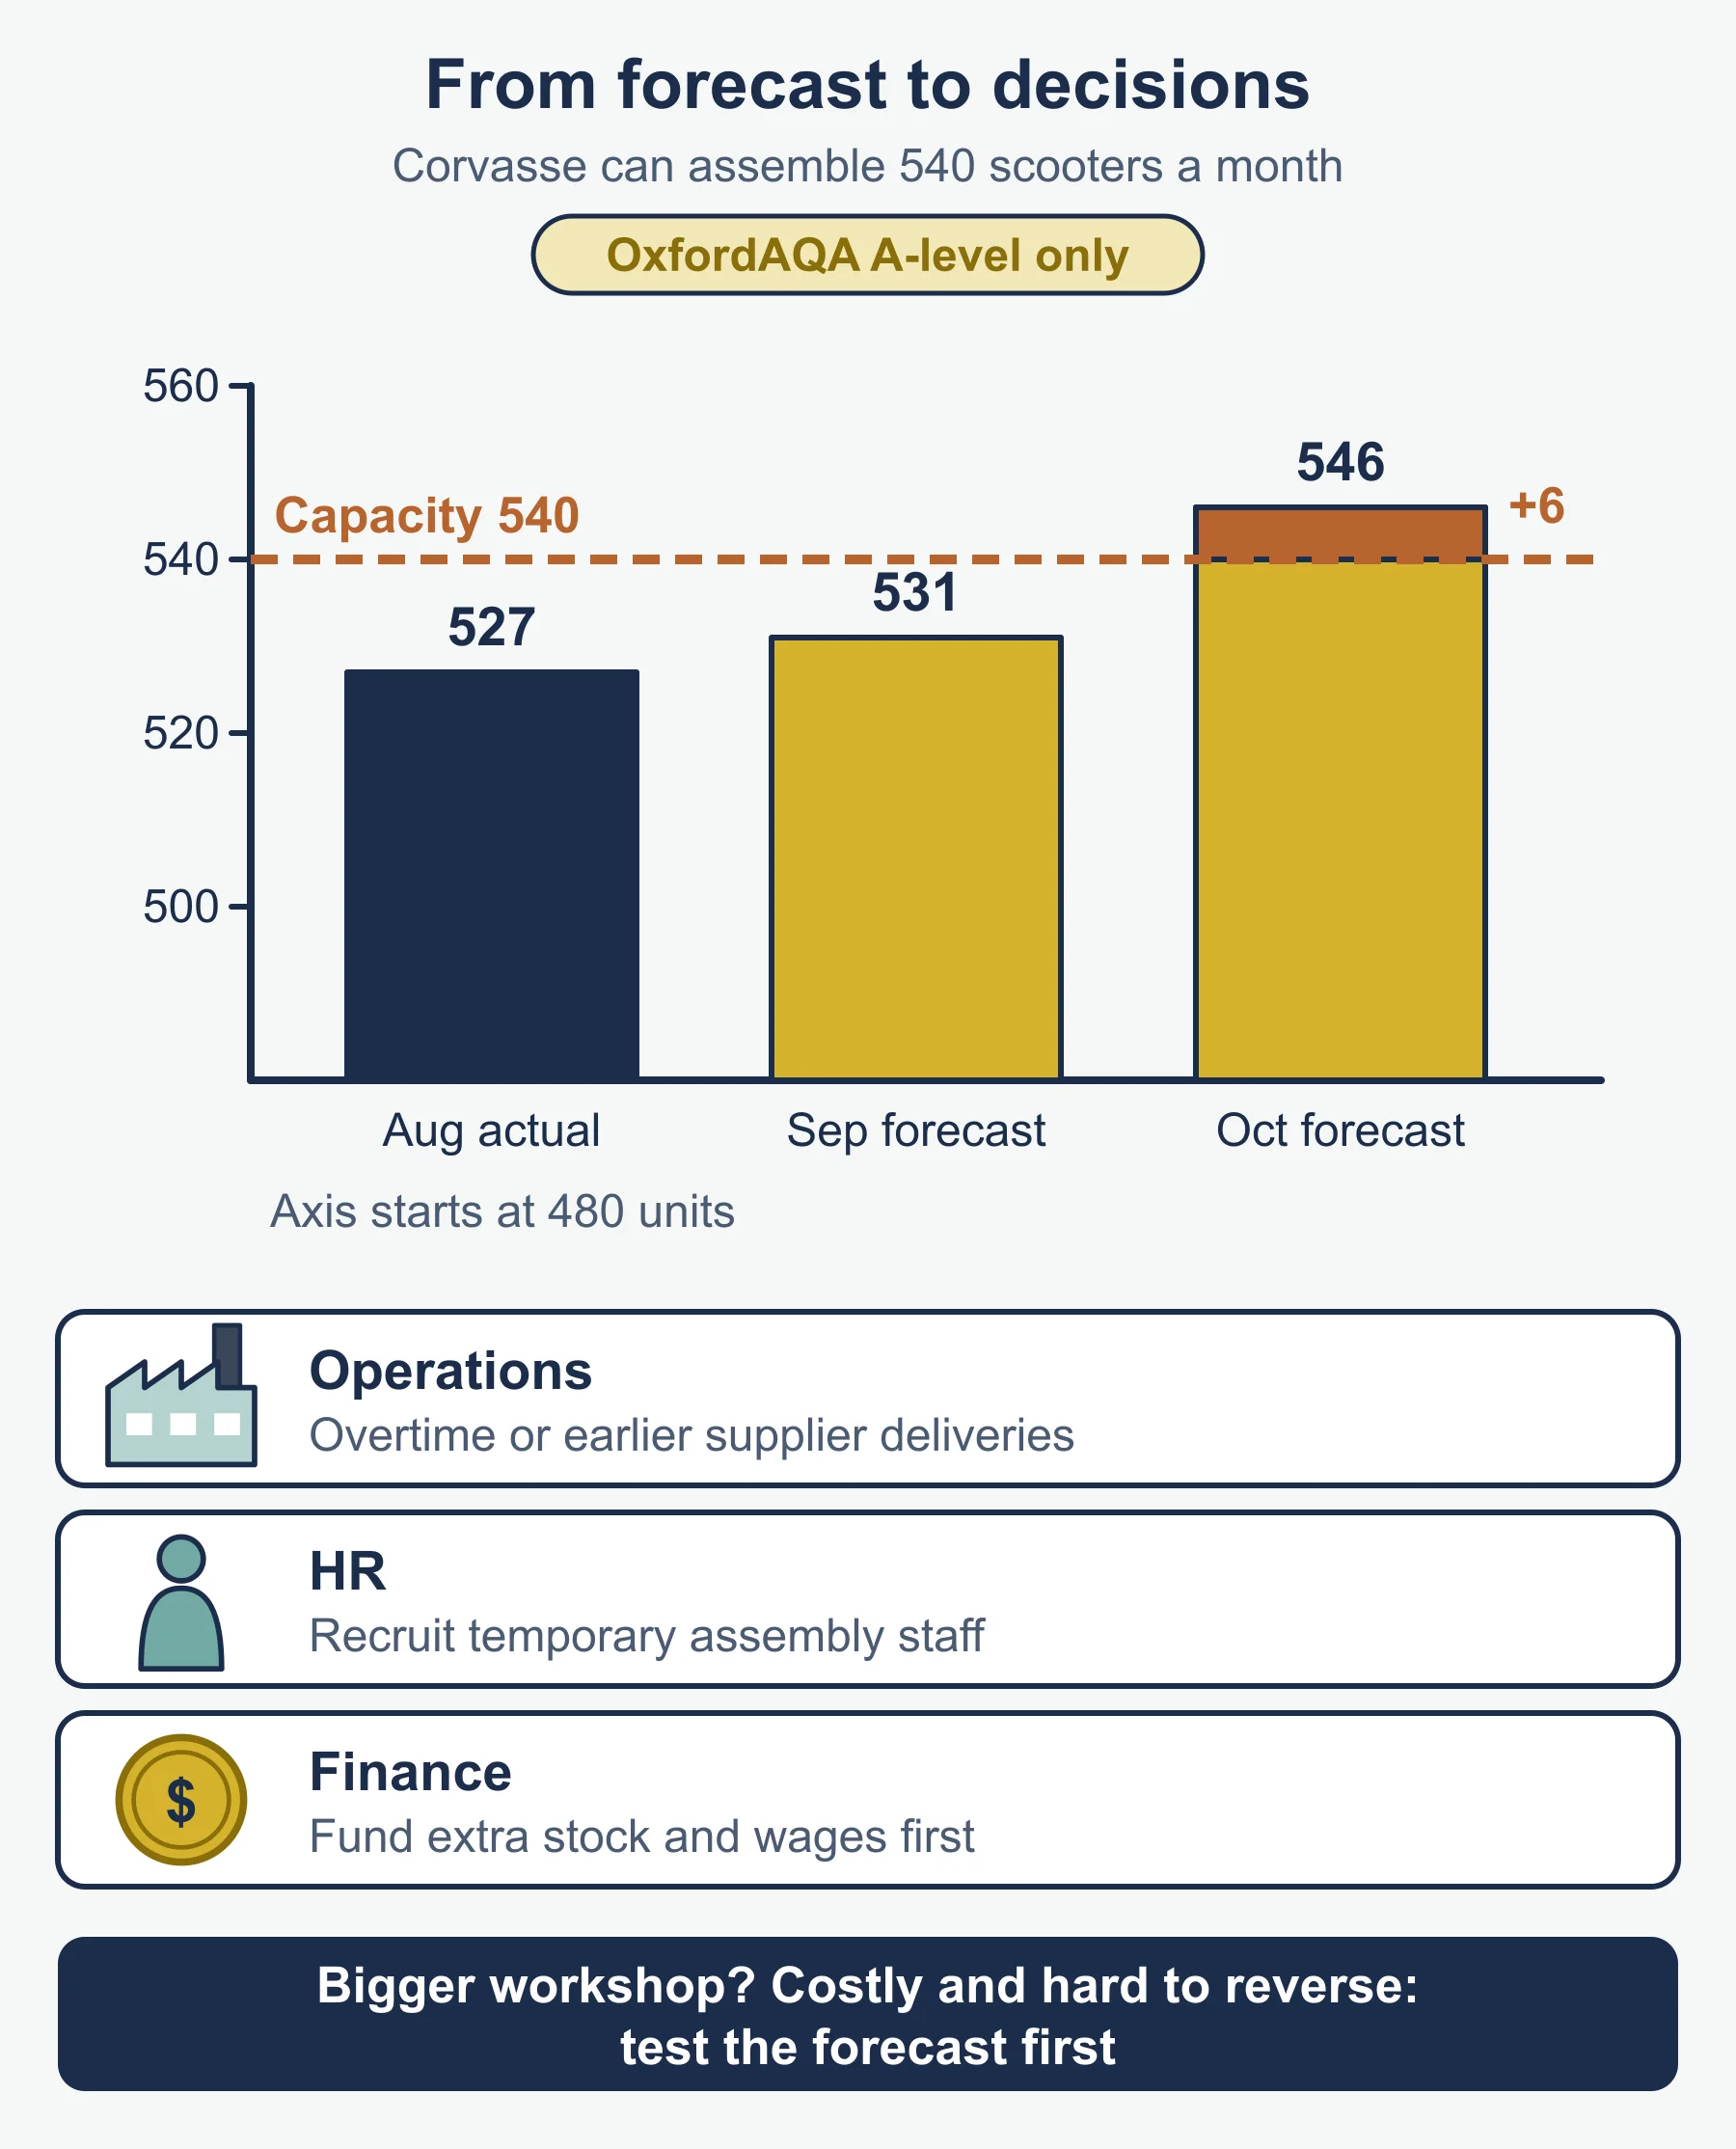
A forecast shapes production plans, stock levels, hiring of seasonal workers, finance (an expected peak raises working capital needs), and marketing timing. A forecast of strong growth may justify investment; a forecast of decline may lead to cost cutting or a new product. Because forecasts can be wrong, firms add flexibility such as temporary staff.
Common errors
- Reversing the seasonal variation: it is actual minus trend.
- Dividing a pair of four-quarter totals by 4 instead of adding them and dividing by 8.
- Quoting an elasticity number without saying whether it is elastic or inelastic and what that means for the firm.
- Ignoring the sign of YED. A negative value means an inferior good.
- Describing R&D benefits with no cost or risk, so the answer is one-sided.
Frequently asked questions
How do you calculate a four period centred moving average? Add four consecutive quarters to get moving totals, add each pair of consecutive totals, and divide by 8. The result is the trend for the middle quarter.
How do you forecast sales using seasonal variation? Seasonal variation is actual sales minus the trend. Average the variations for each quarter, then add the average for the quarter you want to the projected trend.
What are the limitations of elasticity? It is calculated from past data, assumes nothing else changed, may differ for larger or smaller changes, can be unreliable from a small sample, and short-run figures can differ from long-run ones.
What are the stages of product development? A typical sequence is idea generation, screening, concept and business analysis, development, testing and launch. The syllabus does not fix the number of stages, so a logical order with each step explained is what matters.
Official syllabus
Cambridge International AS & A Level Business 9609 syllabus for examination in 2026, 2027 and 2028 (Cambridge University Press & Assessment), section 8.1 Marketing analysis (8.1.1 Elasticity, 8.1.2 Product development, 8.1.3 Sales forecasting).
Get free revision emails (optional)
Occasional emails with practice questions, worked explanations and links to free resources for the qualification and subjects you choose. No spam, and you can unsubscribe from any email. The free tools on this site never need an email.
Related resources
-
Practice questions
A Level Business: Marketing analysis (Cambridge 9609) – Practice Questions
Original practice questions with worked answers on elasticity, product development, R&D and sales forecasting, Cambridge A Level Business 9609 8.1.
Business · Cambridge · A Level
Try questions -
Revision notes
A Level Business: Marketing analysis (Cambridge 9609) – Revision Notes
Condensed revision notes for Cambridge A Level Business 9609 section 8.1: elasticity, product development, R&D and sales forecasting, with a self-test.
Business · Cambridge · A Level
Revise topic -
Study guides
A Level Business: Marketing strategy (Cambridge 9609)
Study guide to marketing plans, coordinated strategy, IT and AI in marketing and international marketing, for Cambridge A Level Business, section 8.2.
Business · Cambridge · A Level
Read guide
Related articles
-
teaching
A Level tuition in Dubai: Cambridge or Pearson Edexcel International A Level?
Schools in Dubai and Abu Dhabi teach either Cambridge International AS & A Level or Pearson Edexcel International A Level. How the two are structured, why it matters for tuition, and how online classes from Lahore work.
9 October 2026
-
curriculum guides
Choosing subjects at IGCSE and A Level
How subject choices at 14 and 16 affect university options later, and how to keep pathways open without overloading a timetable.
28 July 2026
Studying this with a teacher
Working through Business A LEVEL?
This page is free and stays free. If you would rather be taught it, Marlbridge runs Business classes one-to-one and in small groups of up to 15, online in your own time zone. The first trial class is free. WhatsApp replies within an hour (8am–11pm Pakistan time, every day); email the same day.
Cambridge Business teachers at Marlbridge

