
Revision Notes
A Level Business: Marketing analysis (Cambridge 9609) – Revision Notes
Condensed revision notes for Cambridge A Level Business 9609 section 8.1: elasticity, product development, R&D and sales forecasting, with a self-test.
- Subject
- Business
- Level
- A LEVEL
- Topic
- Marketing
- Author
- Marlbridge Academic Team
- Updated
- Reviewed by
- Salman Ahmad (what this means)
Aligned to Cambridge A Level Business (9609), For examination in 2026, 2027 and 2028. Official specification .
Syllabus page (what it covers and how it is assessed): Cambridge A Level Business.
Syllabus points this page covers
9609 (A Level)
- 8.1 Marketing analysis
Found an error? Report a correction.
Need help with this topic? Request a free trial class for A Level Business (9609).
These notes condense section 8.1 (Marketing analysis) of the Cambridge International AS & A Level Business 9609 syllabus for examination in 2026, 2027 and 2028. Full explanations and worked examples are in the study guide. When you are ready, try the practice questions, the wider topic 8 practice set, the course hub, the checklist or the free diagnostics. The content is A Level (topic 8), so it is assessed in the case-study papers, with AS content assumed.
8.1.1 Elasticity
Formulas (standard form; the syllabus does not print them)
| Measure | Formula |
|---|---|
| Percentage change | (new − old) ÷ old × 100 |
| PED | quantity response (%) ÷ price change (%) |
| YED | quantity response (%) ÷ income change (%) |
| PromED | quantity response (%) ÷ promotional spending change (%) |
Reading the answer
| Result | Meaning |
|---|---|
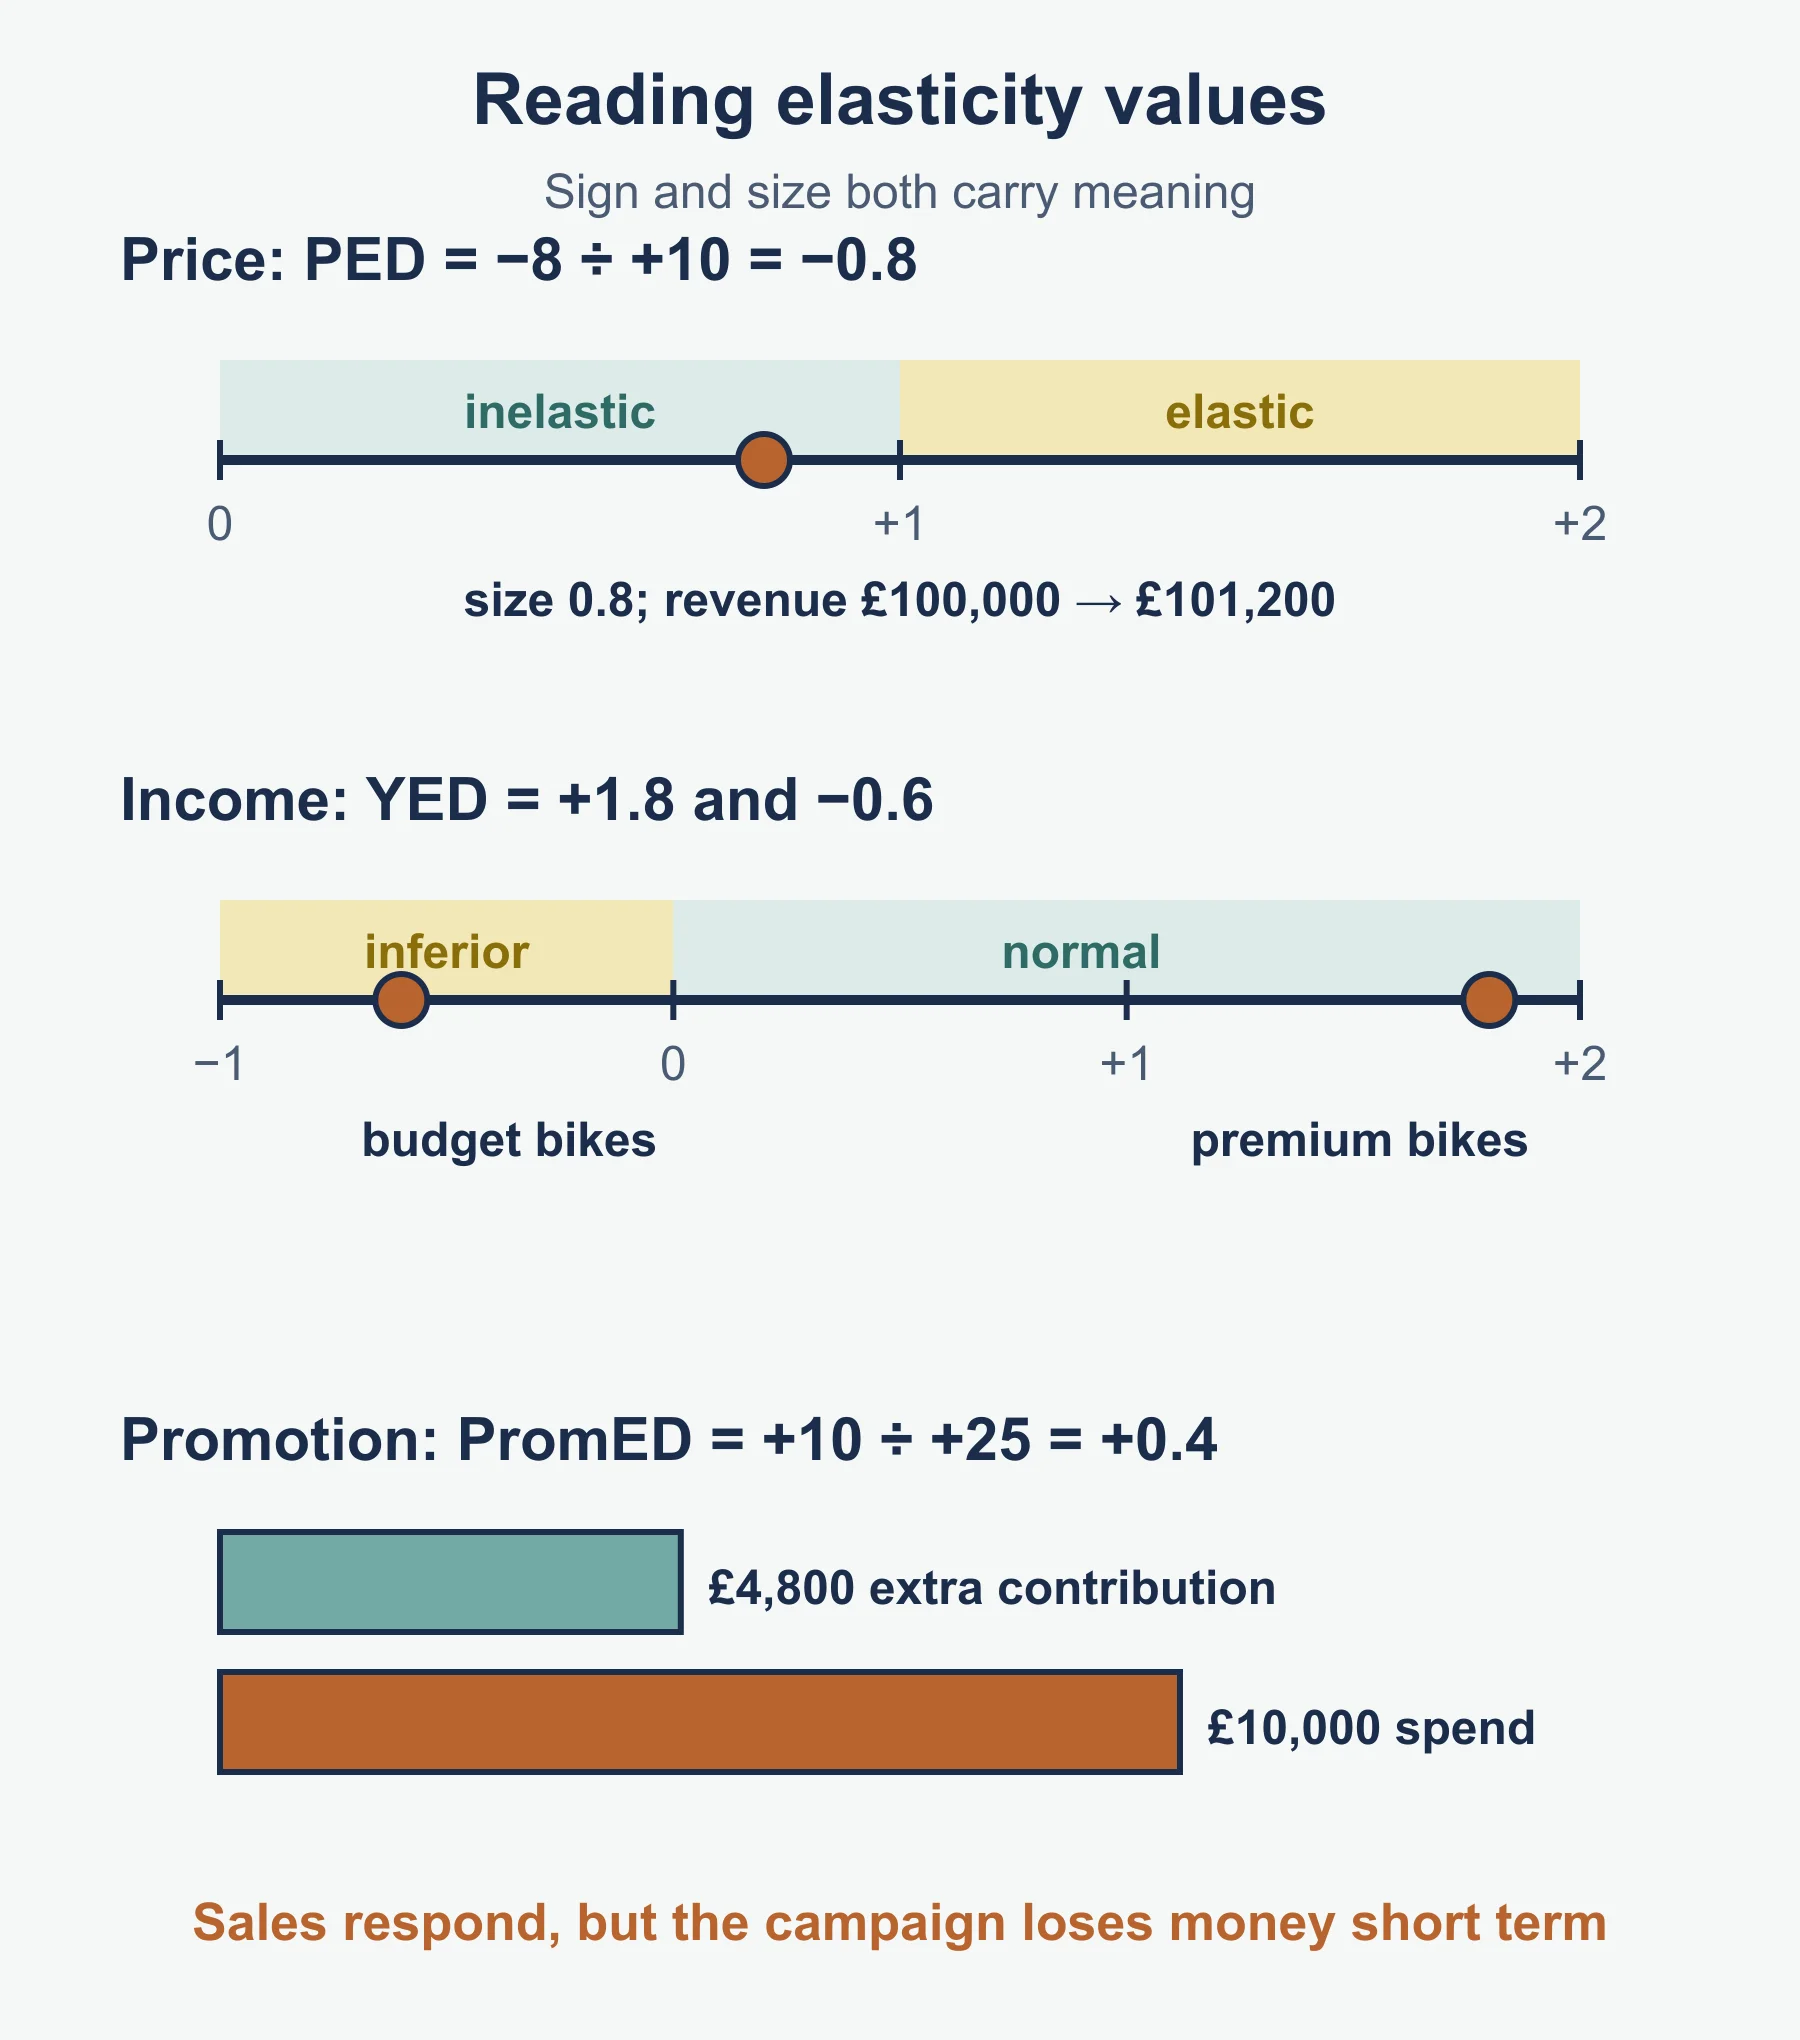
| PED size above 1 | Elastic: quantity reacts more than proportionately to price |
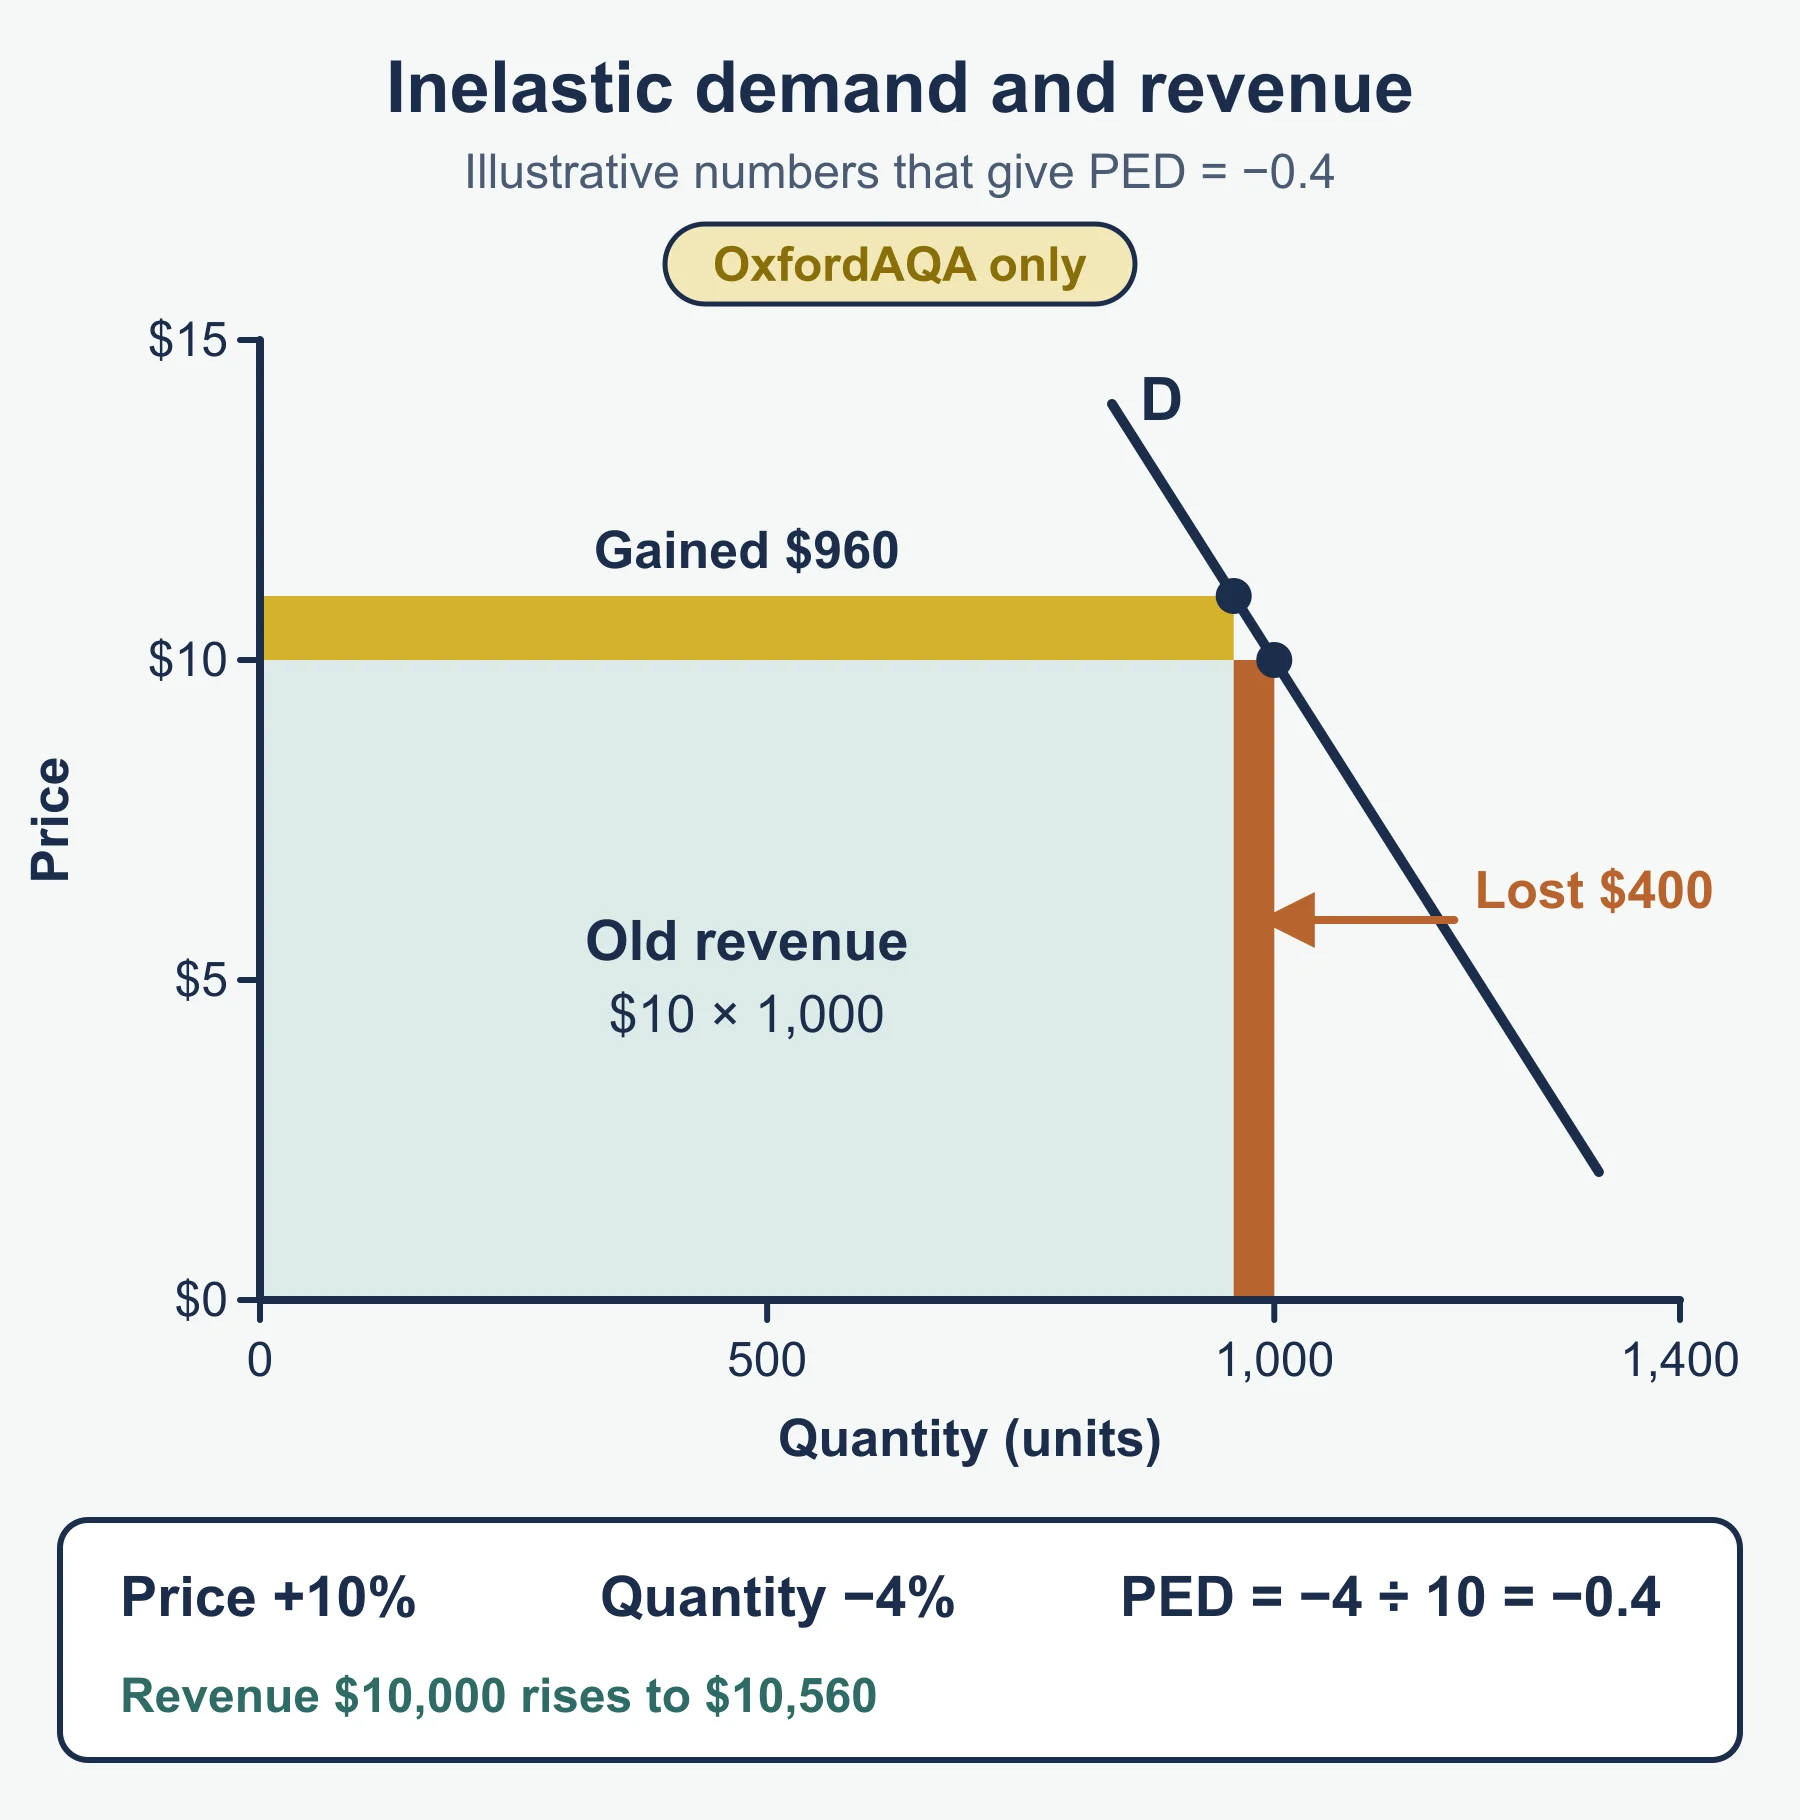
| PED size below 1 | Inelastic: quantity reacts less than proportionately to price |
| PED size equal to 1 | Unitary: revenue does not change when price changes |
| YED above 0 | Normal good; above 1, demand grows faster than income |
| YED below 0 | Inferior good: demand falls when income rises |
| PromED above 0 | Promotion lifts demand; size shows how strongly |
Elasticity and revenue
| Demand | Price rises | Price falls |
|---|---|---|
| Inelastic | Revenue goes up | Revenue goes down |
| Elastic | Revenue falls | Revenue rises |
Quick check: PED of −1.5 and a 6% price rise gives a 9% fall in quantity. Revenue index = 1.06 × 0.91 = 0.9646, so revenue falls about 3.5%.
Worked reminder: a price cut from £10 to £9 is −10%. Quantity rises from 200 to 250, which is +25%. PED = +25 ÷ −10 = −2.5, so demand is elastic. Revenue rises from £2 000 to £2 250, as the table predicts.
Method in steps
- Convert each change into a percentage of its starting value.
- Divide the change in quantity by the change in the other variable.
- Keep the sign.
- Say elastic or inelastic (or normal or inferior), then say what it means for the decision.
Decisions and limitations
- Decisions: pricing (raise price if inelastic, cut if elastic), product range (premium versus budget lines as incomes change), promotion budgets (low PromED means a poor response per pound), revenue and profit planning.
- Limitations: based on past data; assumes other factors stay constant, but they rarely do; differs at different prices and sizes of change; depends on the quality of the data; short-run and long-run responses differ; rivals may react; it is a guide, not a guarantee.
- A judgement uses both: the figure supports a decision, the limitations qualify it, and cost (contribution) decides whether an action pays.
Judging an elasticity decision
- Ask what the figure says (size and sign), then what it means for revenue.
- Ask whether revenue is the right test. Profit depends on costs, so compare the change in contribution with any extra spending.
- Ask how reliable the estimate is: how old, how large a sample, what else changed.
- Reach a judgement that depends on the firm’s aim, such as growth, profit or brand image.
8.1.2 Product development
The process (typical sequence)
| Stage | Purpose |
|---|---|
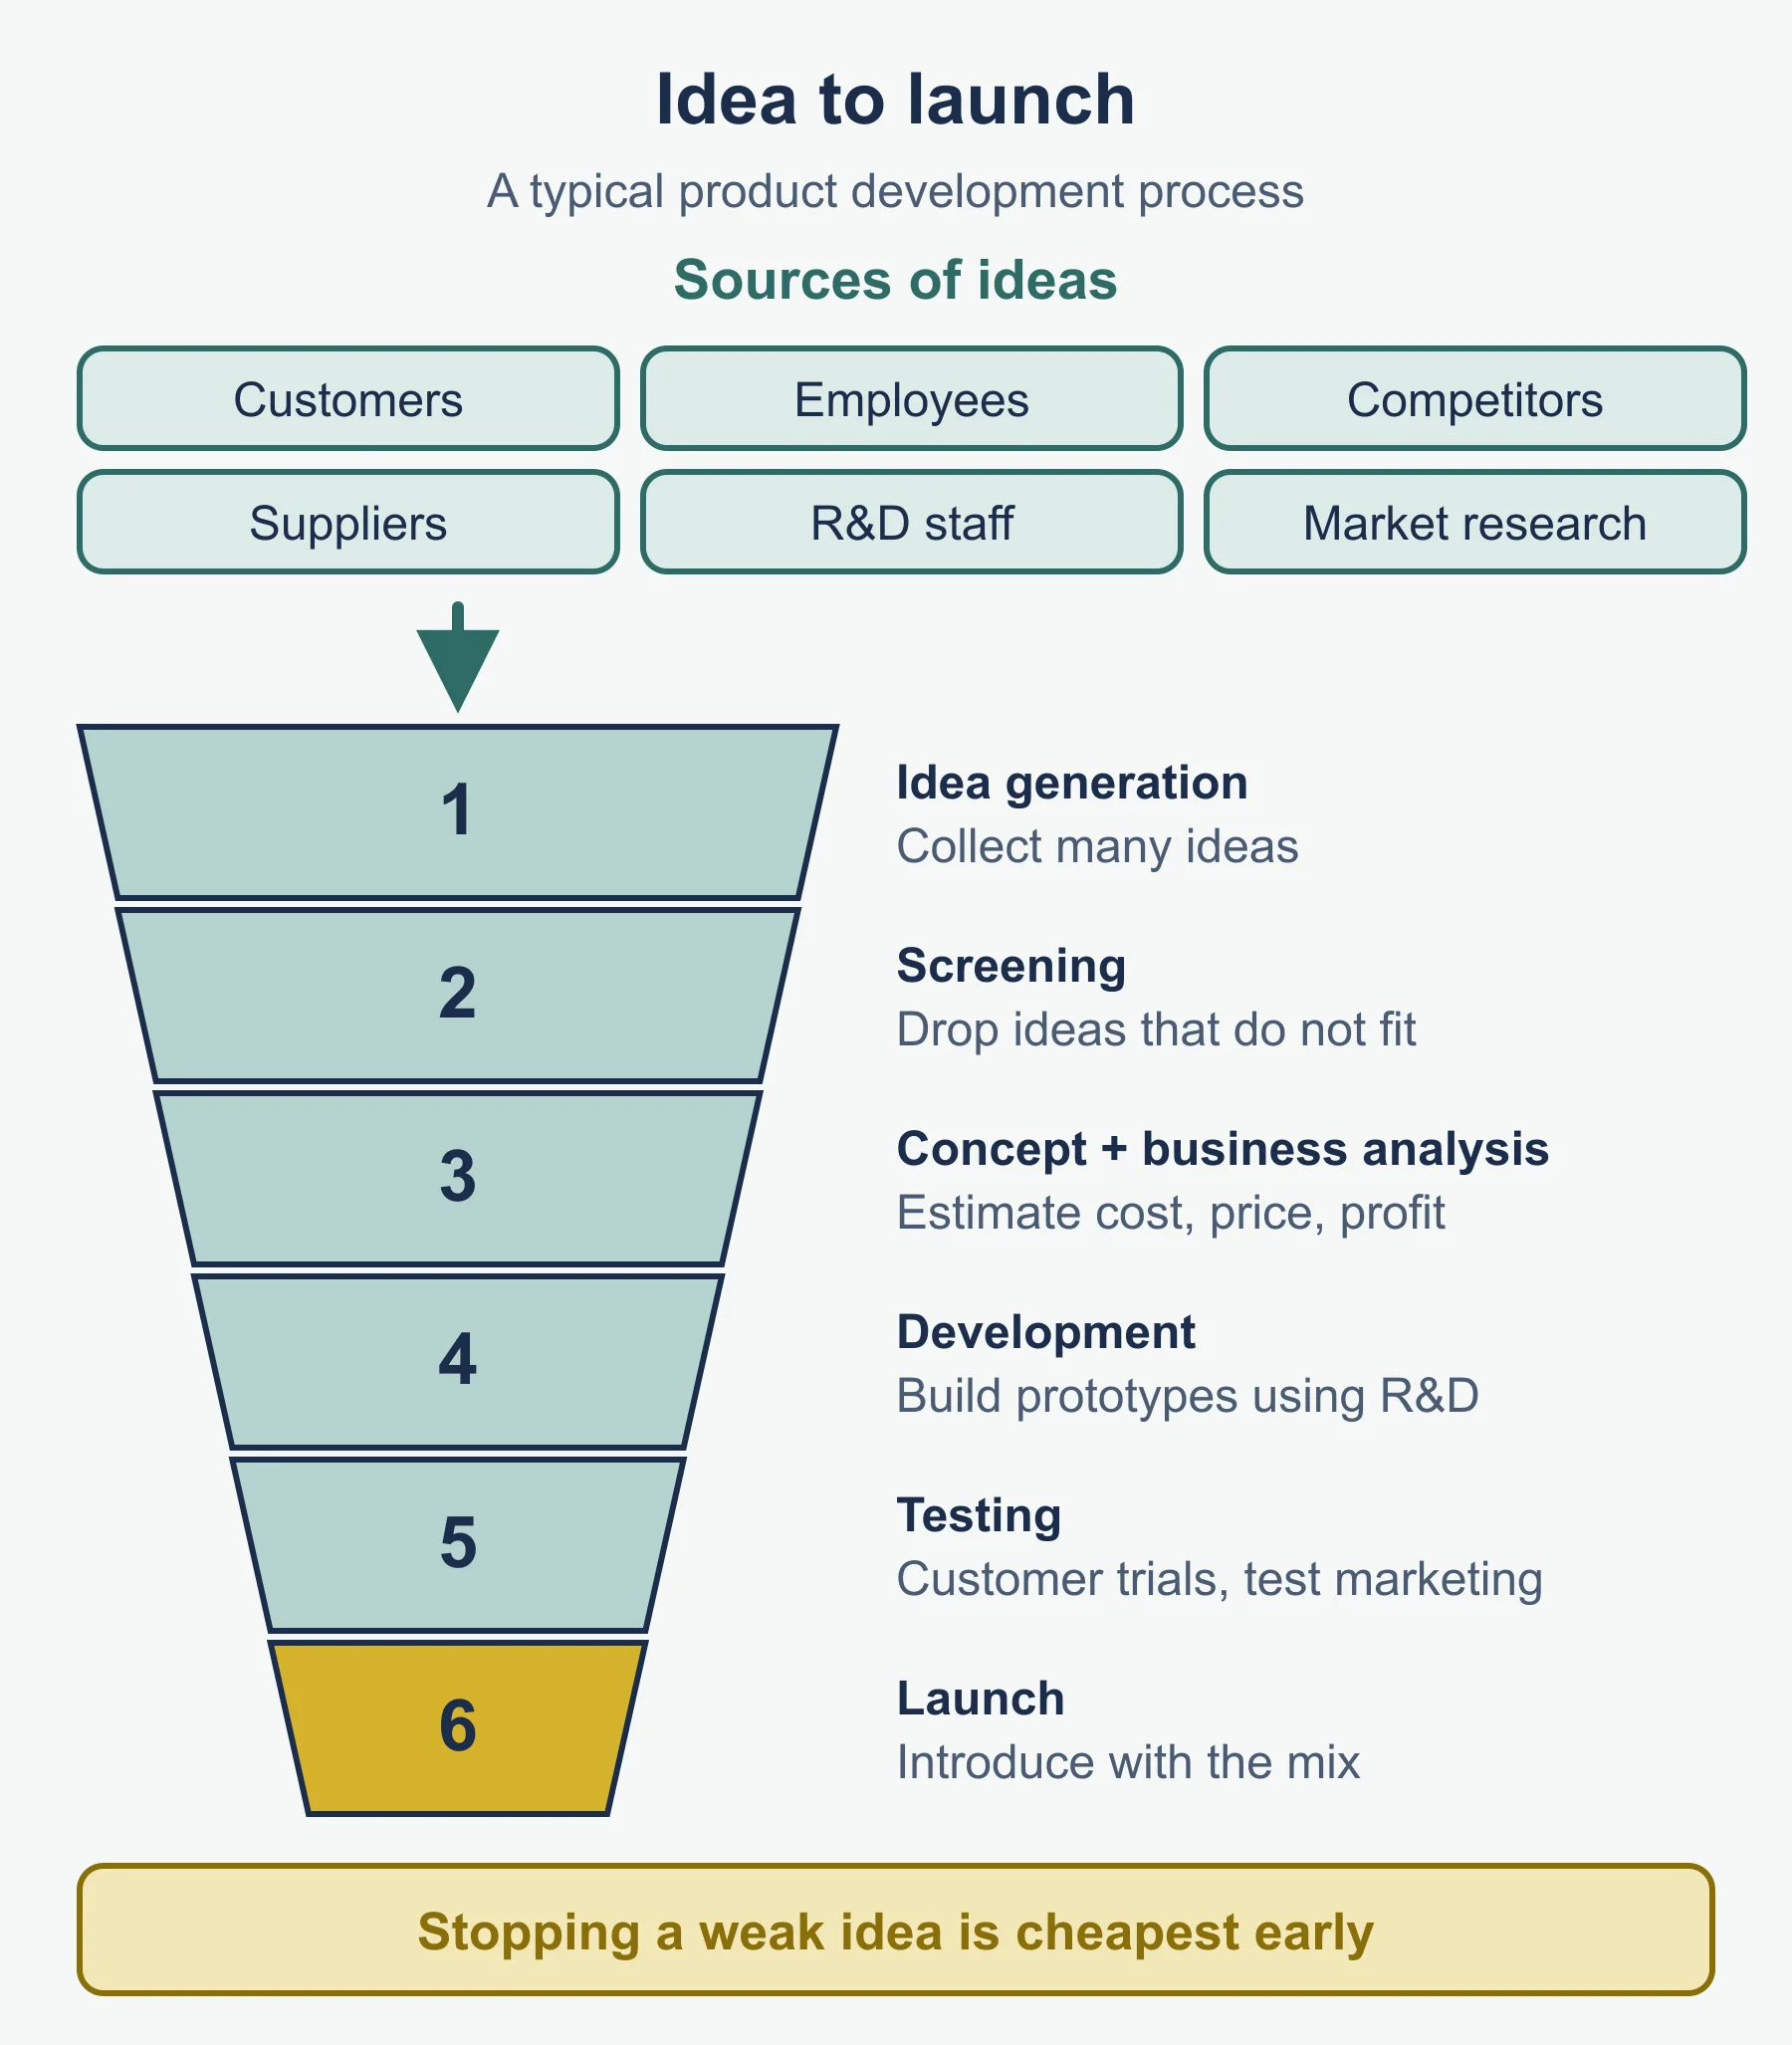
| Idea generation | Gather many possible ideas |
| Screening | Drop ideas that do not fit aims, skills or demand |
| Concept and business analysis | Estimate costs, price, demand and profit |
| Development | Build prototypes (R&D) |
| Testing | Customer trials or test marketing |
| Launch | Introduce with the marketing mix |
The syllabus does not fix the number of stages, so use the order and explain each step.
Sources of ideas
Customers (surveys, reviews, complaints), employees (especially sales staff), competitors, suppliers and distributors, R&D staff, market research.
Research and development (R&D)
| For | Against |
|---|---|
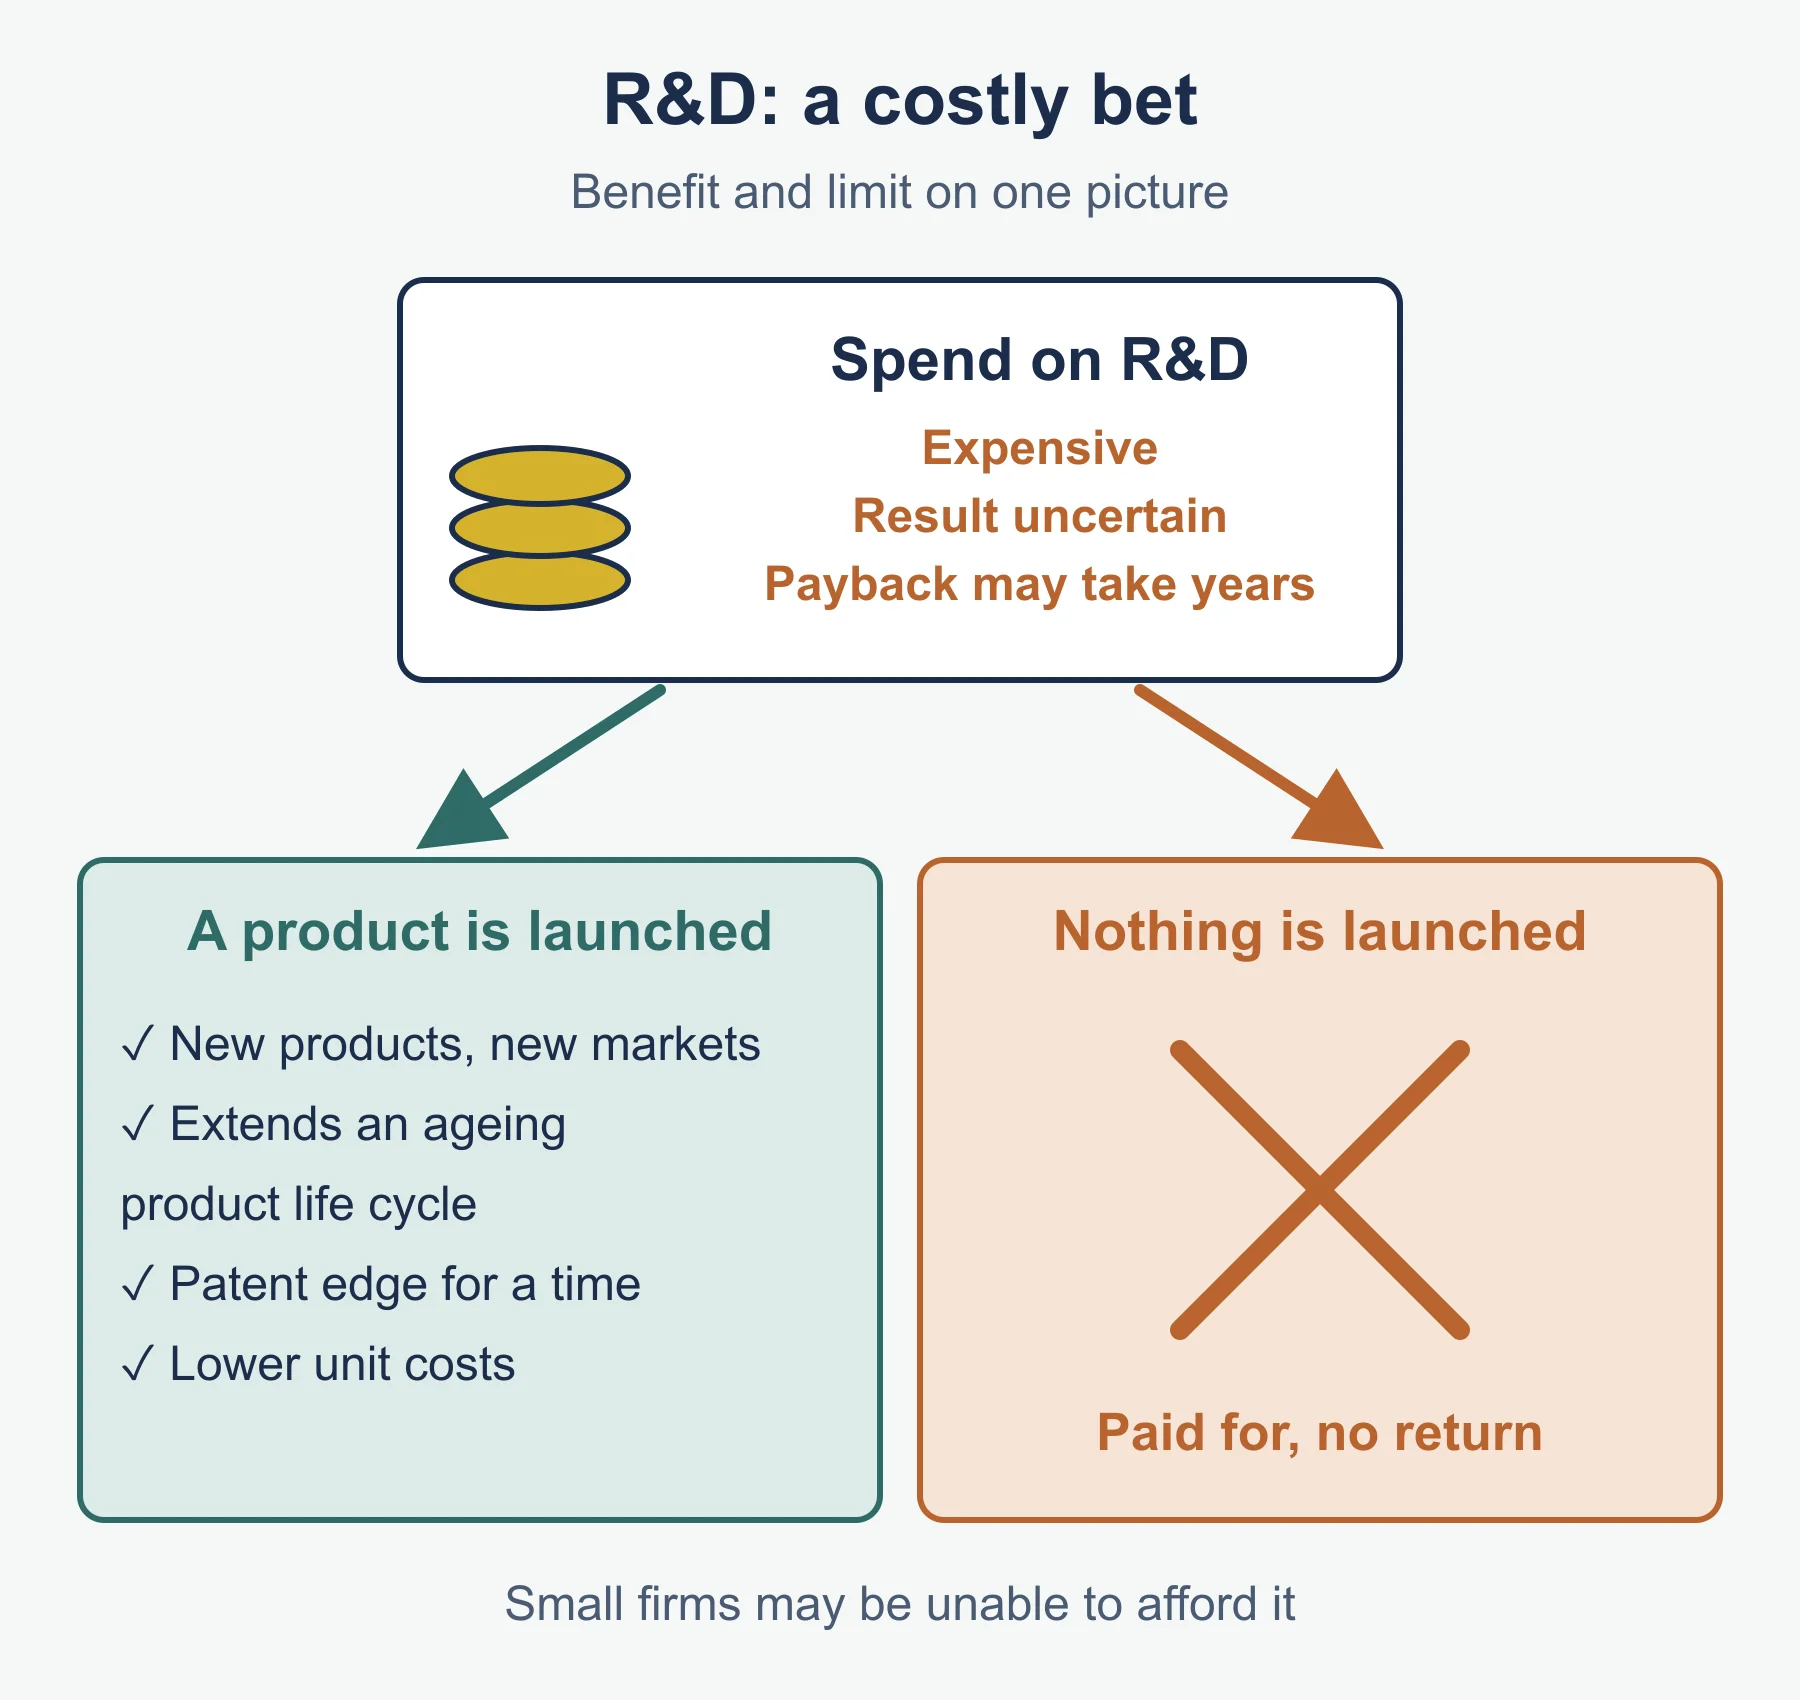
| New products and extended product life cycles | High cost |
| Possible protection, for example a patent | Uncertain results |
| Competitive advantage and lower unit costs | Long payback |
| Response to technology and rivals | Hard for a small firm to afford |
Judging R&D: weigh the cost and delay against the chance of a product that customers value. A firm in a fast-changing market, or one that needs a unique product, has more to lose by not investing. A firm with spare cash and a long time horizon can accept a slow payback.
Must-know distinction: research looks for new knowledge or ideas; development turns them into a usable product. Both sit within R&D.
8.1.3 Sales forecasting
Why forecast
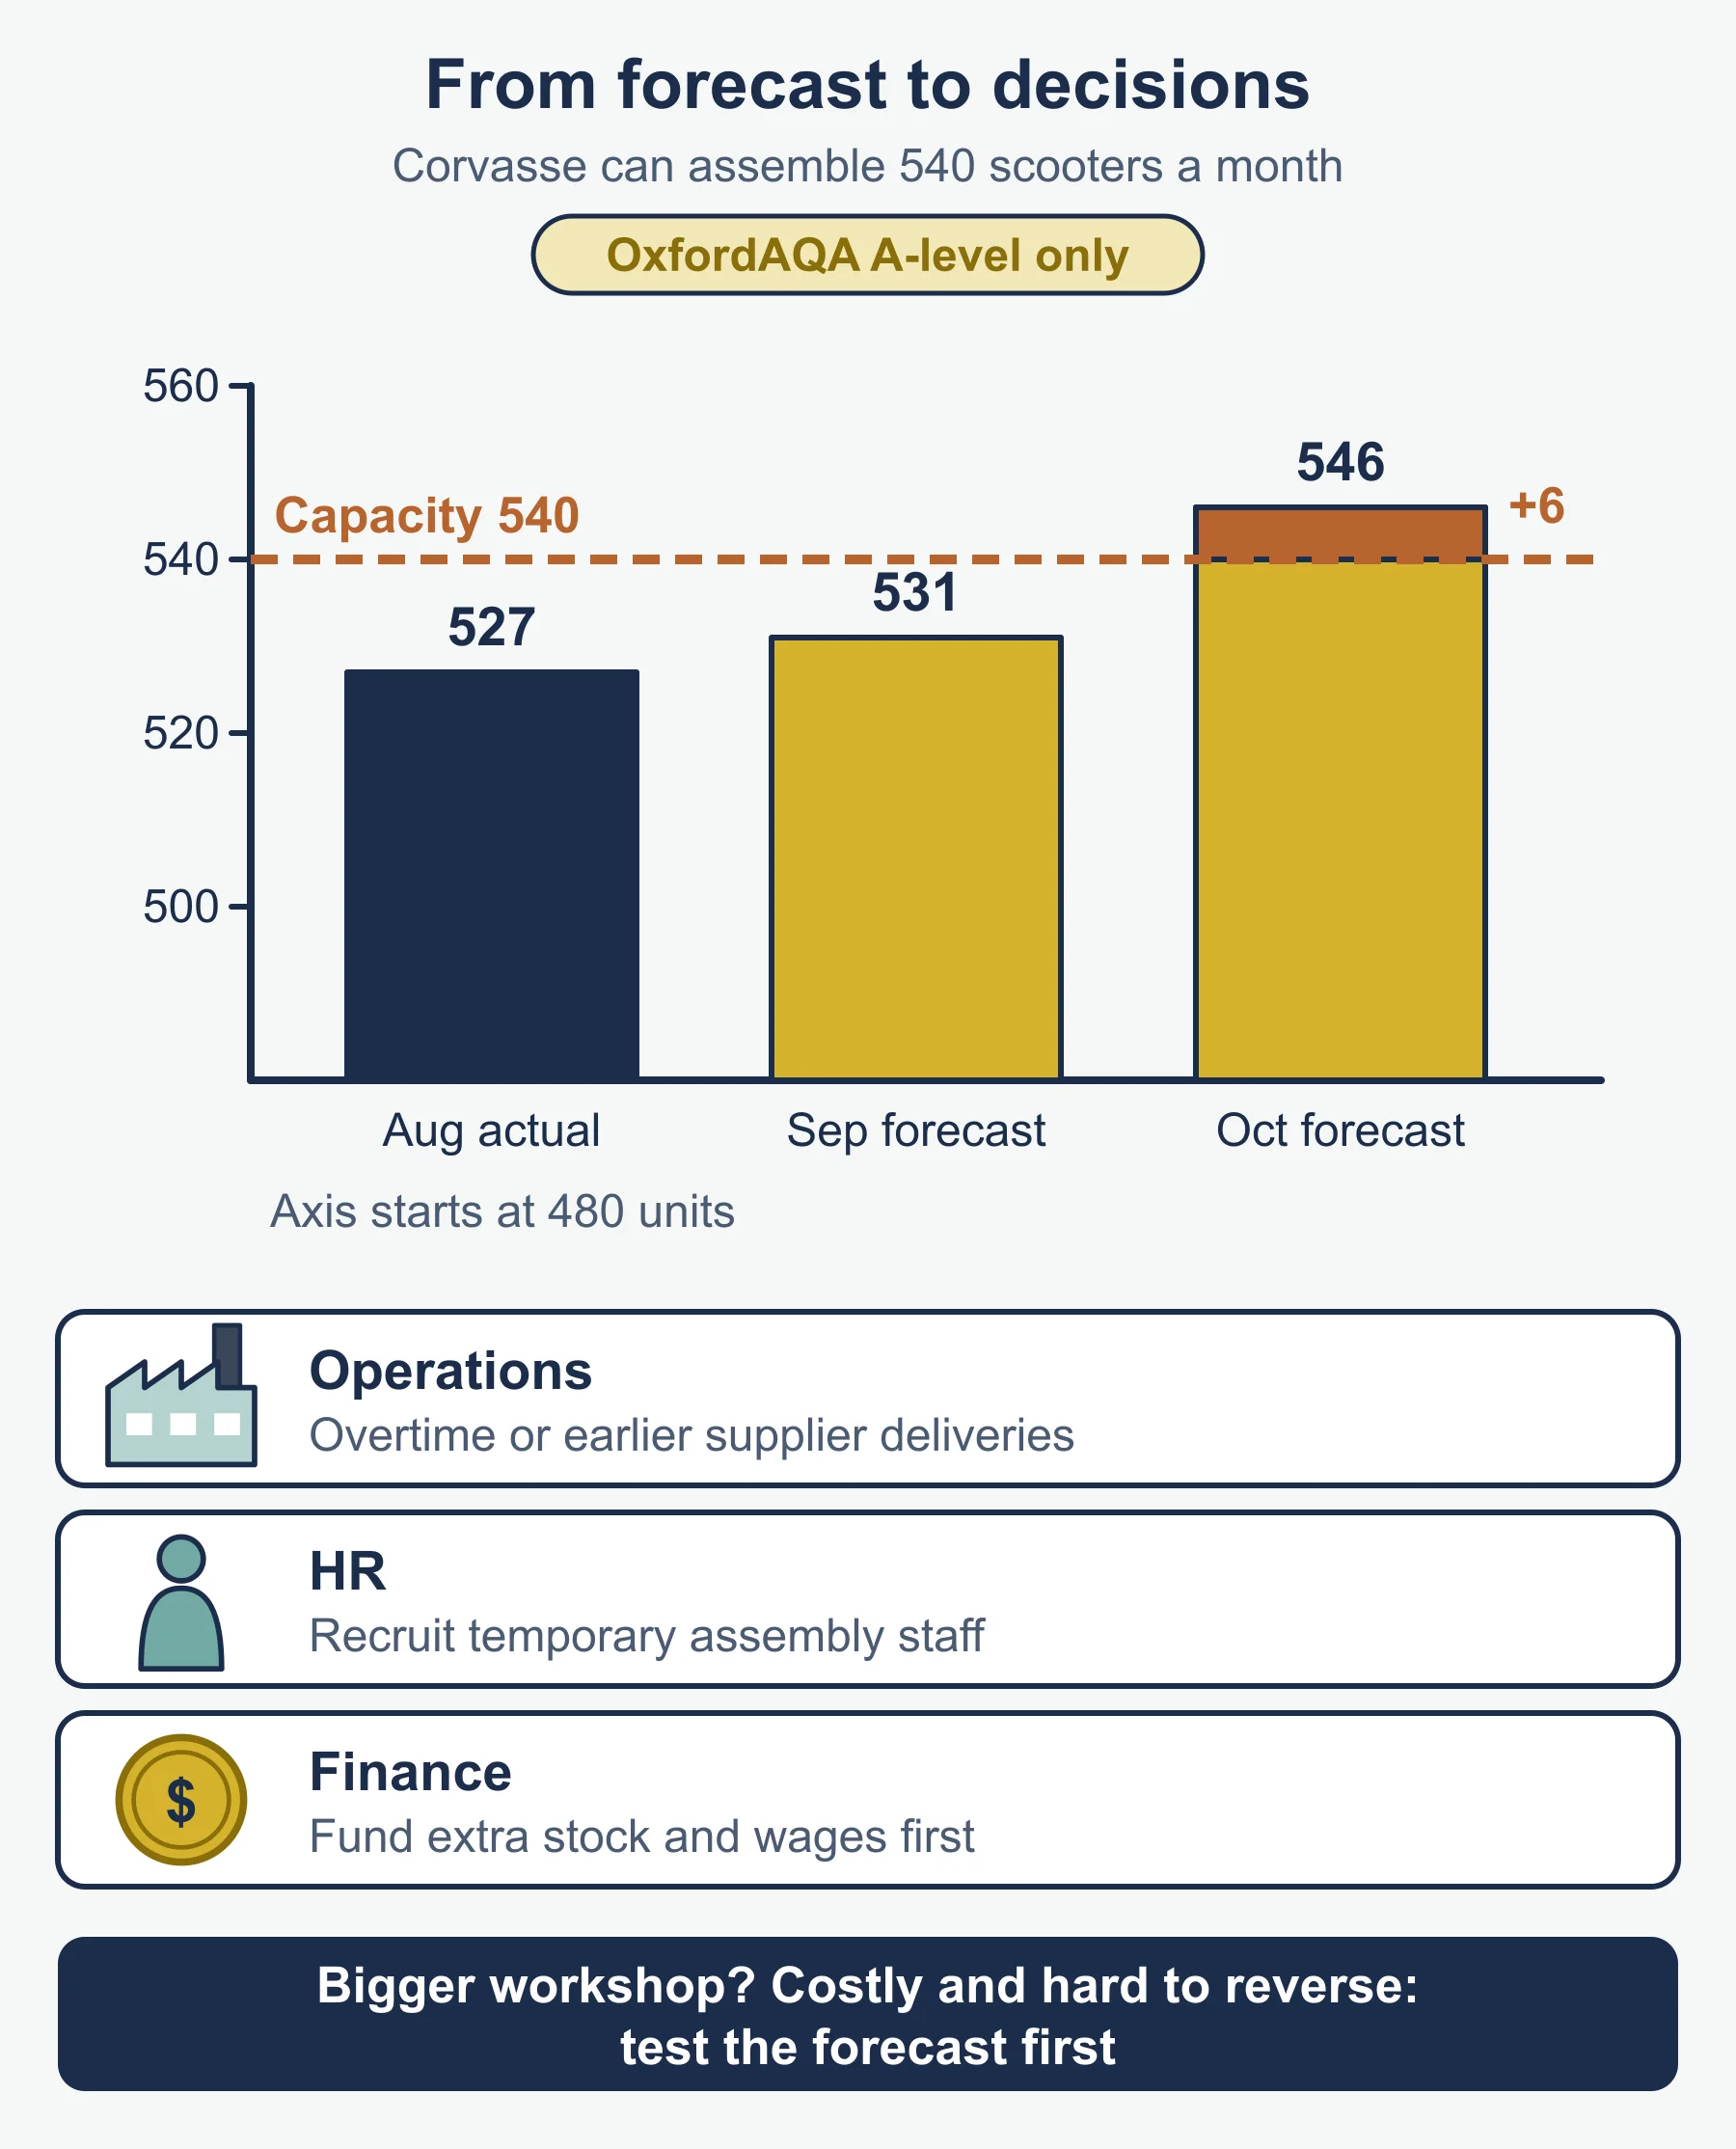
Production plans, stock levels, staffing, budgets and cash flow, marketing spending, and investment decisions all depend on expected sales. A forecast that is too high leaves unsold stock; too low loses customers.
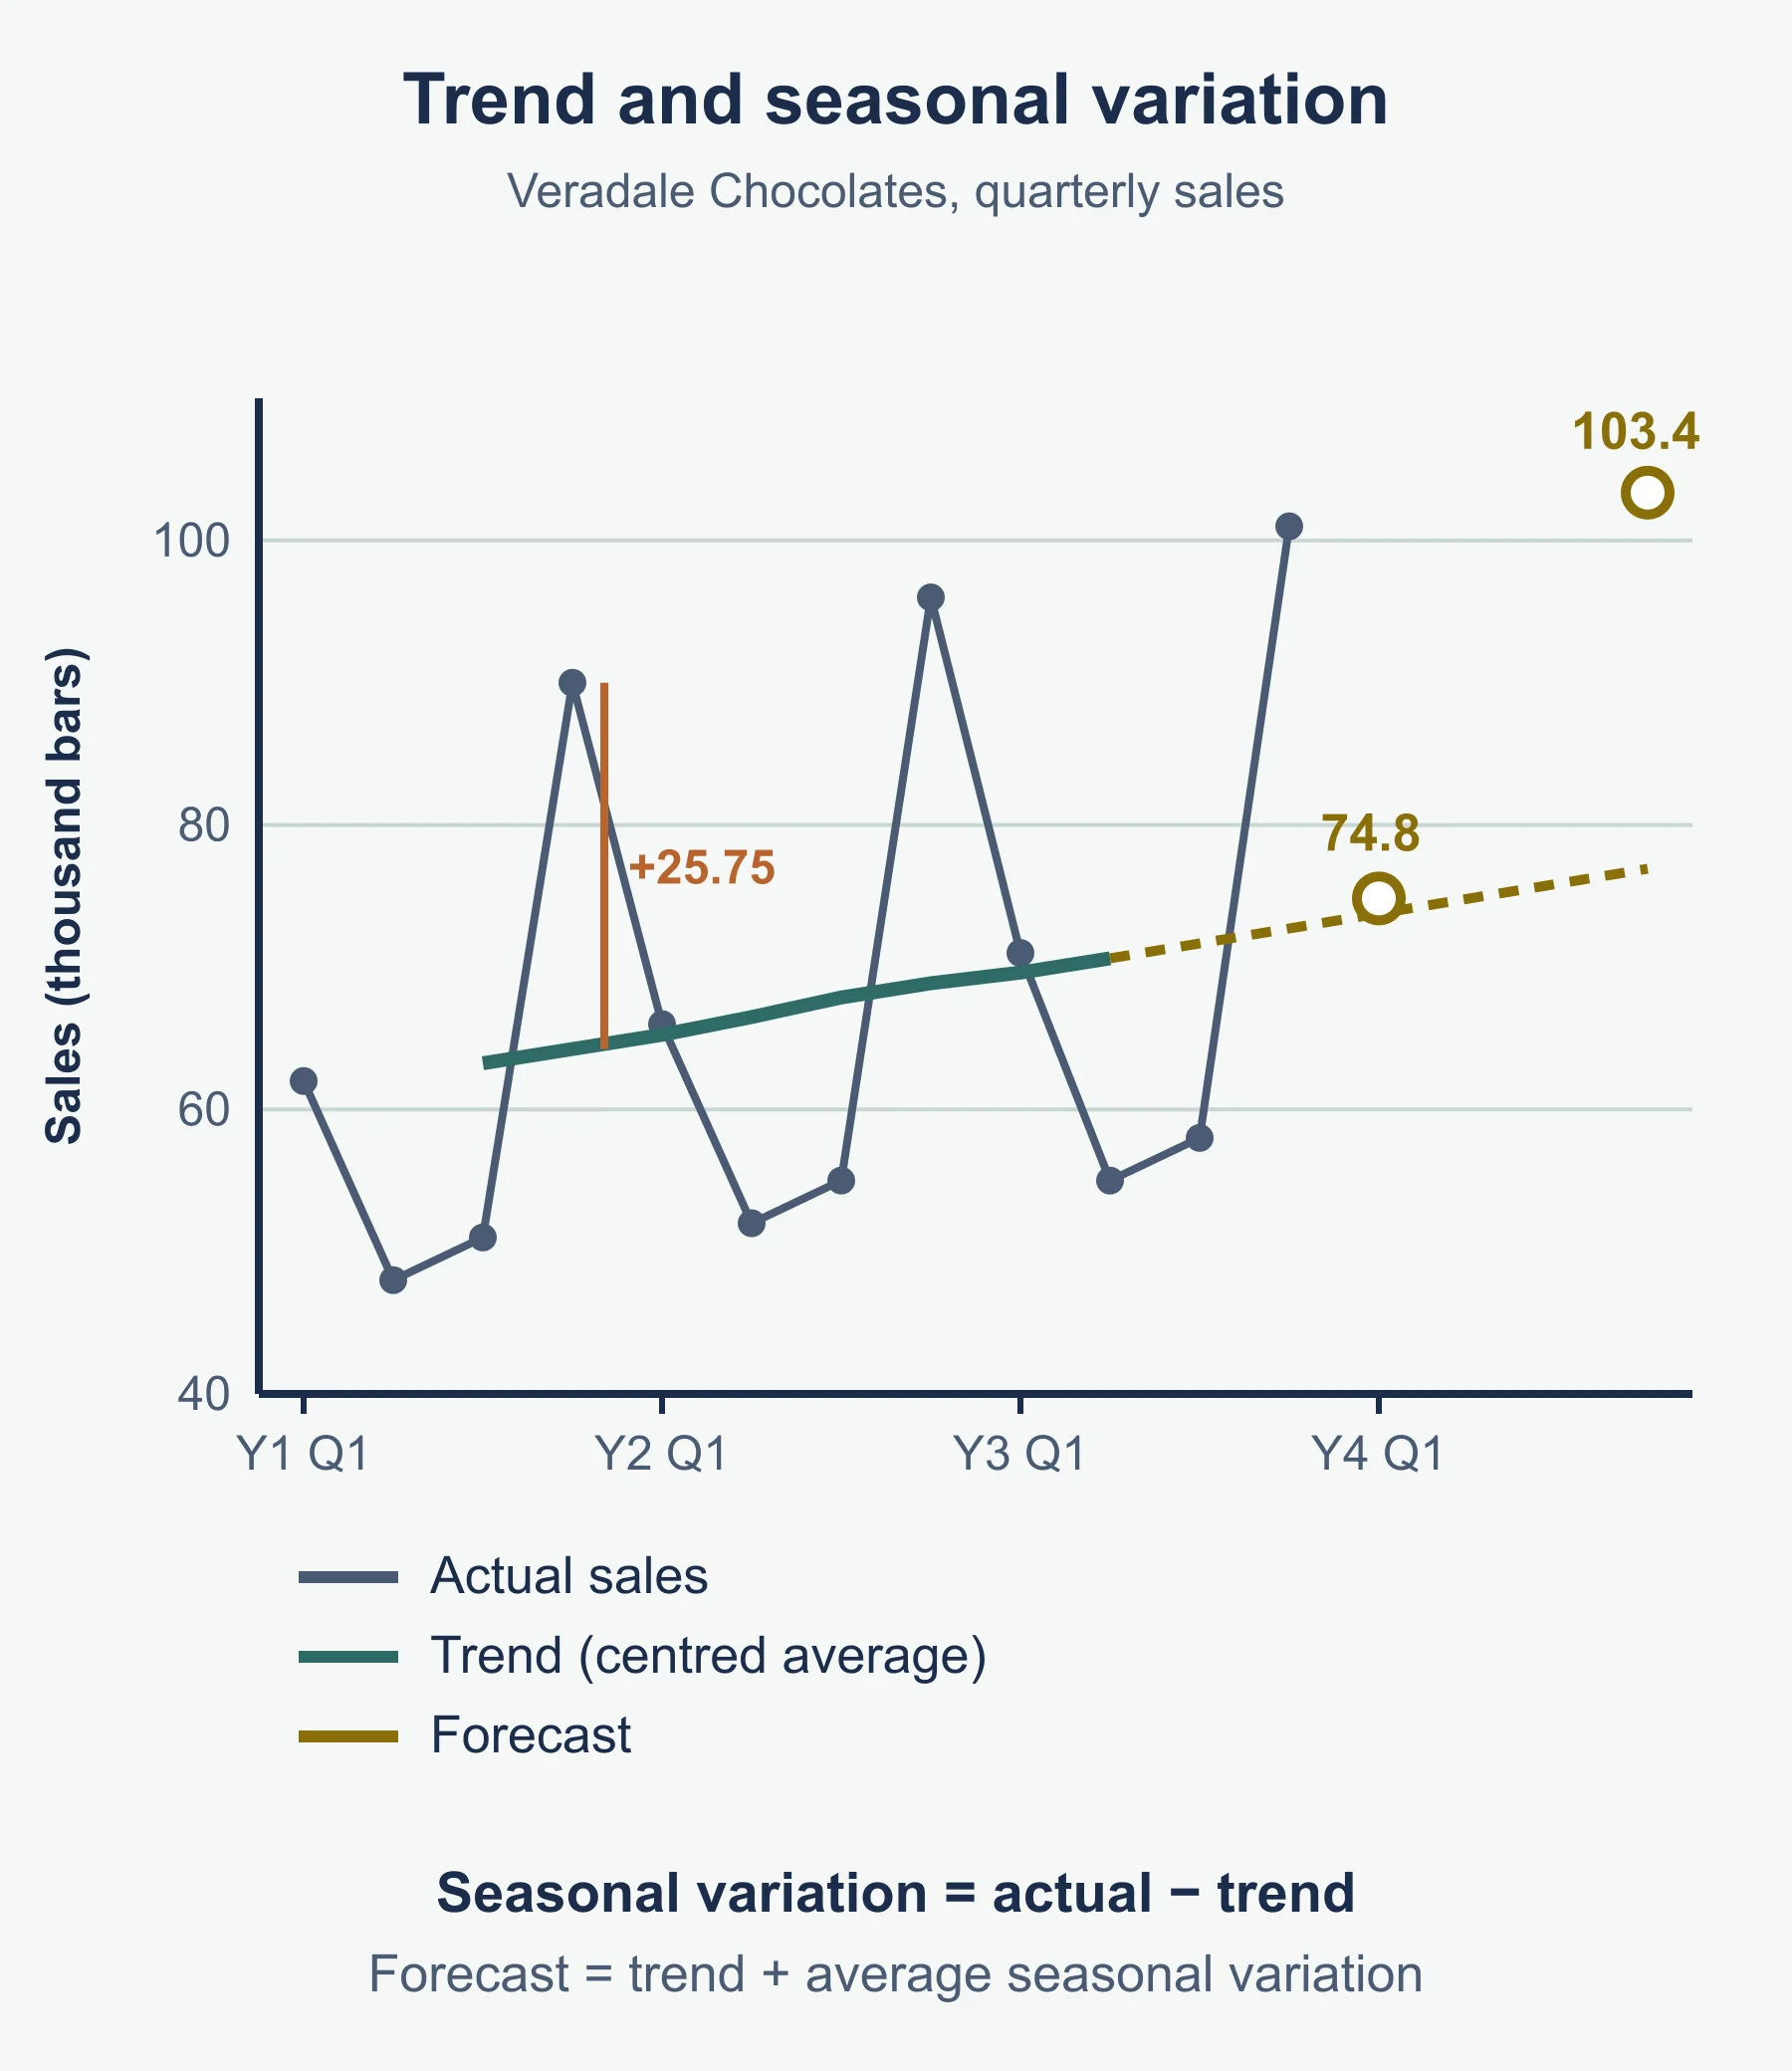
Four period centred moving average (steps)
- Add four consecutive quarters (the moving total). Slide on by one quarter each time.
- Add pairs of consecutive moving totals.
- Divide each pair total by 8. This is the centred moving average (CMA), the trend for the middle quarter.
- Seasonal variation = actual − trend.
- Average the seasonal variations for each quarter across the years.
- Forecast = projected trend + average seasonal variation for that quarter.
Worked reminder with small numbers: totals of 210 and 218 give (210 + 218) ÷ 8 = 53.5. An actual of 47 gives a seasonal variation of 47 − 53.5 = −6.5, meaning sales were below trend. If the trend is expected to be 56, the forecast is 56 − 6.5 = 49.5.
Judging a moving average forecast: it suits a stable, seasonal pattern and gives a clear number. It cannot see a new rival, a change in fashion or a shock, so check it against recent market information. Reliability drops the more periods ahead the forecast looks.
Qualitative forecasting
| Method | Idea |
|---|---|
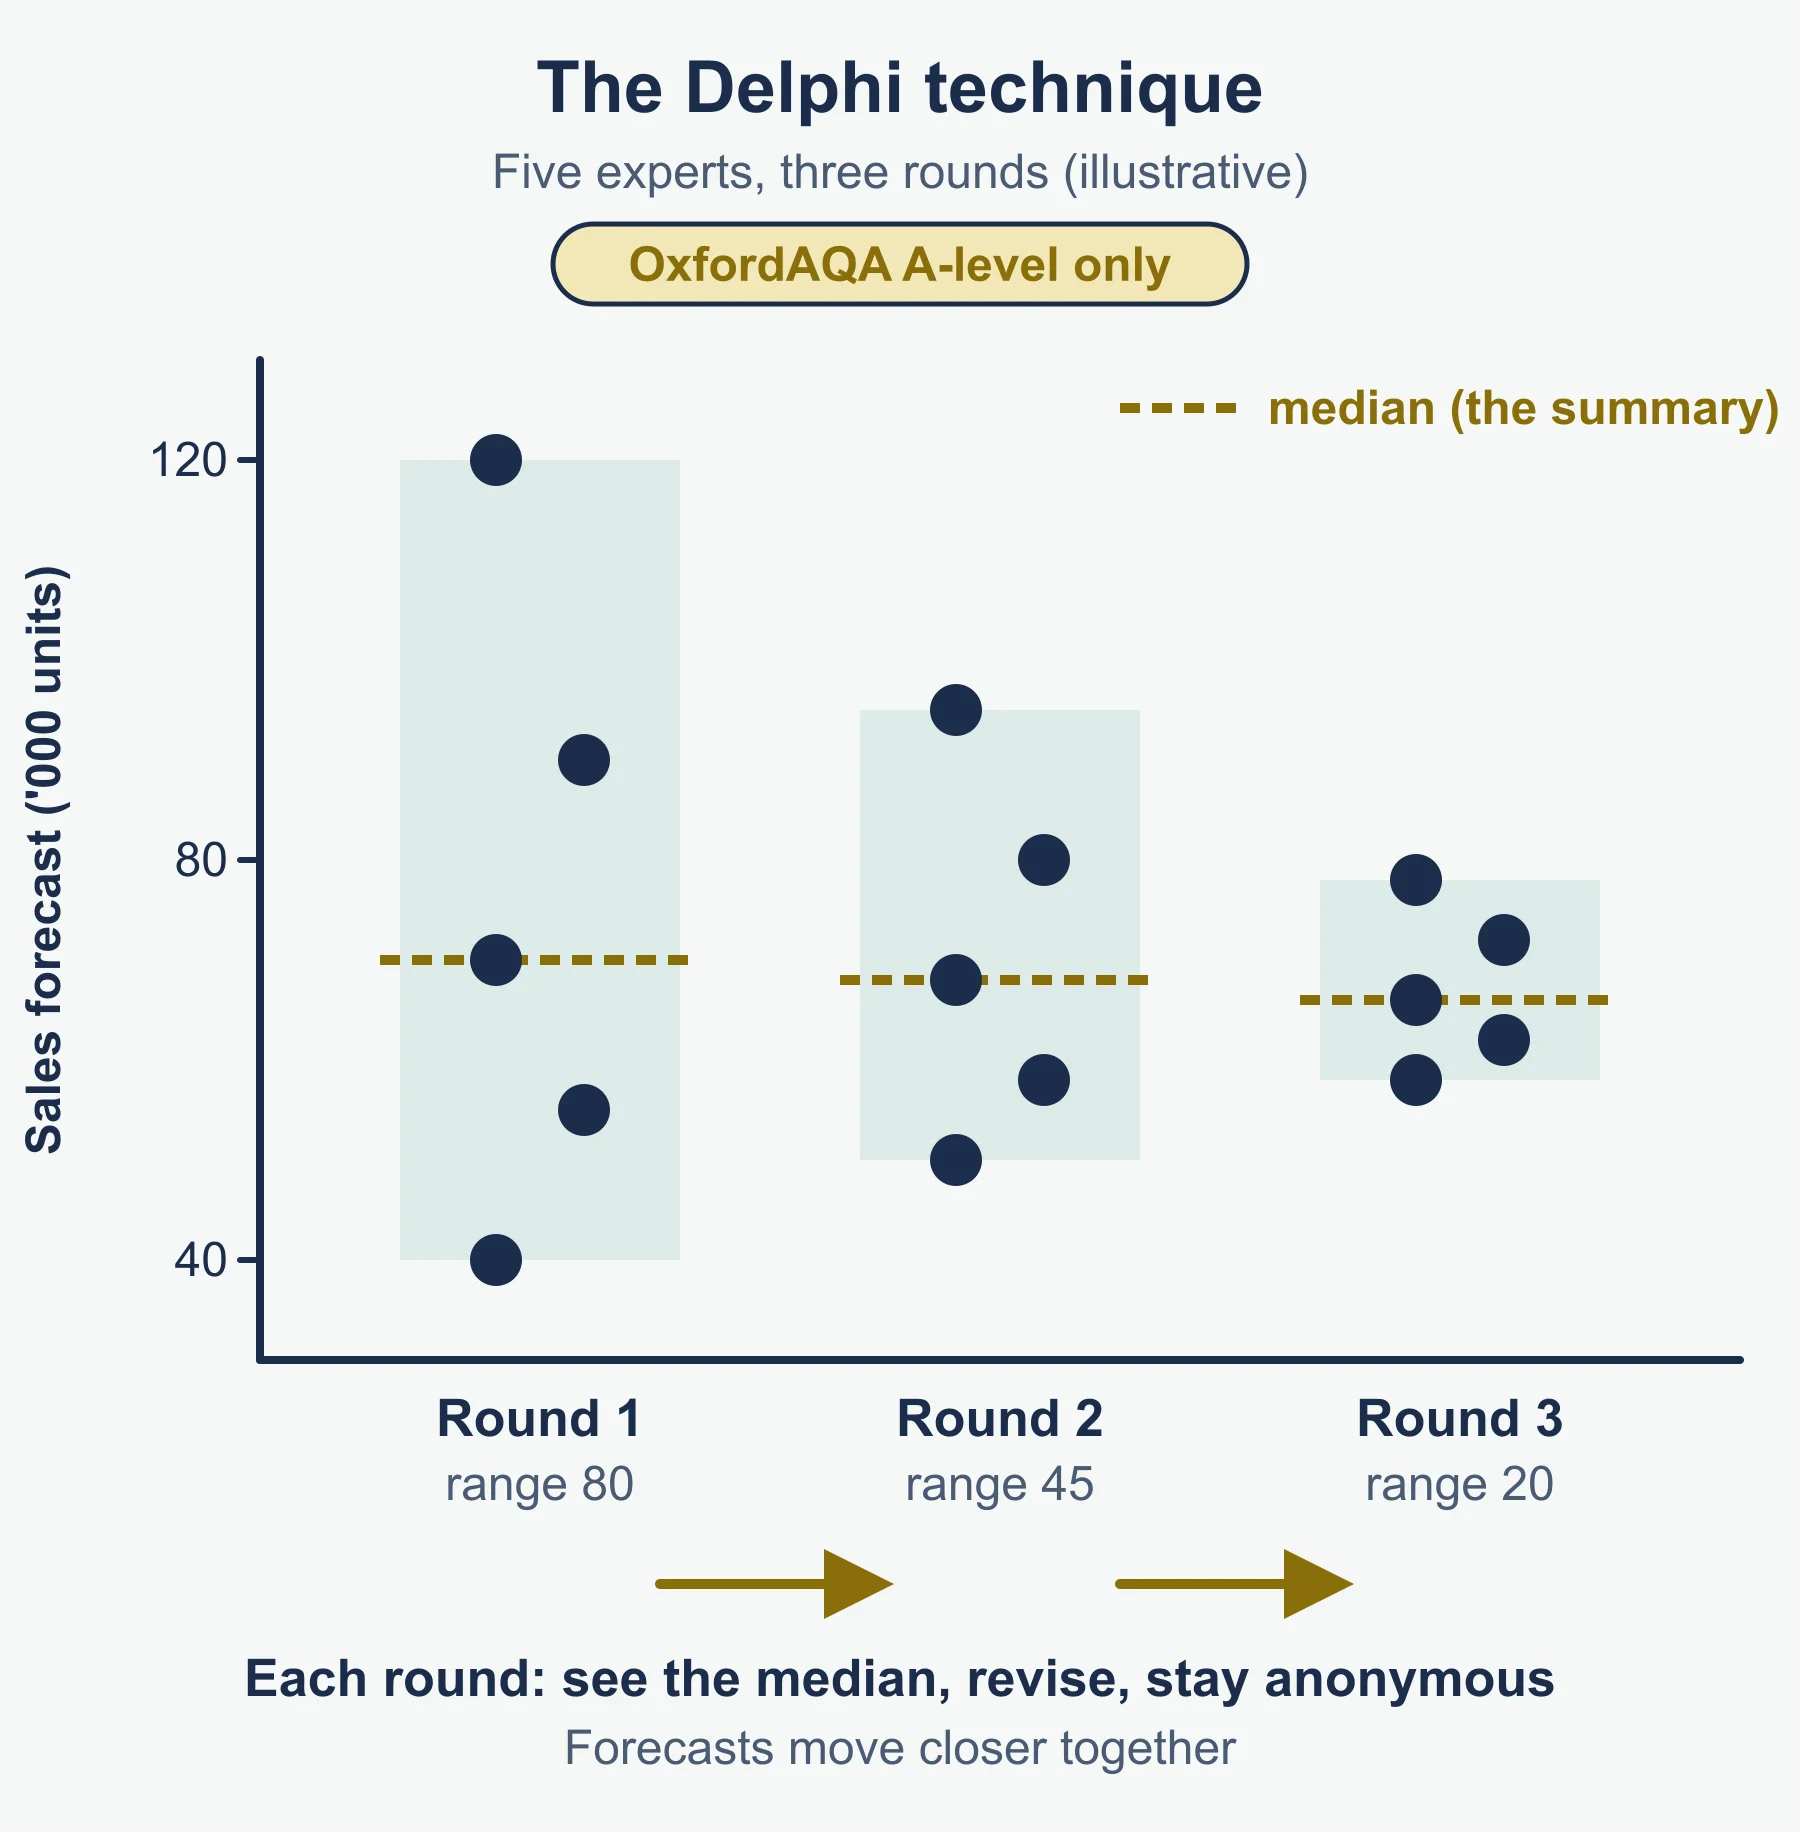
| Expert opinion | Specialists give views, sometimes repeated until they converge |
| Sales force opinion | Staff share what customers say |
| Consumer panels, surveys and test marketing | Potential buyers state intentions |
| Market research | Trends and competitor activity |
Use when there is no history (new product) or conditions have changed. Weakness: subjective and may be biased.
Quantitative versus qualitative
| Moving average | Qualitative | |
|---|---|---|
| Based on | Past sales data | Opinion and judgement |
| Best when | Stable, seasonal pattern | New product or sudden change |
| Weakness | Assumes the past repeats; ignores new events | Subjective; opinions may be wrong |
Impact on decisions
Production schedules, stock, seasonal hiring, finance for a peak, marketing timing, and whether to invest or cut costs. Flexibility reduces the cost of a wrong forecast. A forecast of rising sales may support new equipment, extra finance or a bigger marketing budget. A forecast of falling sales may lead to a cost review, a new product or a search for new markets. In a case study, link the forecast to the specific decision in the question and say how sure the firm can be of it.
Quick self-test
- A firm raises a price by 6% and quantity demanded falls by 9%. Calculate PED.
- Incomes rise 8% and demand for a product rises 4%. Calculate YED and classify the product.
- Promotional spending rises 20% and sales rise 3%. Calculate PromED.
- With PED of −2.0, a firm lowers its price by 5%. State the resulting percentage change in quantity demanded.
- Two consecutive four-quarter totals are 210 and 218. Calculate the centred moving average.
- The trend is 53.5 and actual sales are 47. Calculate the seasonal variation.
- The projected trend is 56 and the average seasonal variation is −6.5. State the forecast.
- YED is −0.4 and incomes rise 10%. What happens to demand?
- Name two sources of new product ideas.
- State one benefit and one drawback of R&D.
- Give one reason a qualitative method suits a brand-new product.
- Give two limitations of using elasticity to make a pricing decision.
Answers
- 9 ÷ 6 gives −1.5: elastic.
- 4 ÷ 8 = +0.5: a normal good, with demand rising more slowly than income.
- 3 ÷ 20 = +0.15: promotion has a weak effect.
- −2.0 × −5 = +10%.
- 428 ÷ 8 = 53.5.
- 47 − 53.5 = −6.5.
- 56 − 6.5 = 49.5.
- Demand falls by 4%: an inferior good.
- Any two of: customers, employees, competitors, suppliers, R&D staff, market research.
- Benefit: new products or competitive advantage. Drawback: high cost or uncertain results.
- No sales history exists, so past figures cannot be used.
- Any two of: past data may be out of date; other factors change at the same time; the figure may differ for a different size of price change; rivals may react.
Where marks are usually lost
- Using trend minus actual for seasonal variation.
- Dividing the sum of two four-quarter totals by 4 instead of 8.
- Giving an elasticity figure with no interpretation or no link to the decision.
- Dropping the negative sign, then calling an inferior good normal.
- Stating that elasticity “proves” the outcome, with no limitation.
- Listing R&D benefits only, with no cost, risk or payback time.
- Choosing a forecasting method with no reason tied to the case (new product, stable seasonal sales).
- Repeating the case facts without using them in the argument.
Frequently asked questions
What is the difference between price, income and promotional elasticity of demand? All three divide the percentage change in quantity demanded by a percentage change in something else: the product’s price for PED, consumer income for YED, and promotional spending for PromED. The Cambridge 9609 syllabus does not print the formulas, so these are standard forms.
How does price elasticity affect revenue? If demand is inelastic, a price rise increases revenue and a price cut reduces it. If demand is elastic, a price rise reduces revenue and a price cut increases it.
What does a negative income elasticity of demand mean? A negative YED means an inferior good: demand falls when incomes rise. A YED above 1 means a normal good whose demand grows faster than income.
When should a business use qualitative sales forecasting? When there is no sales history, such as for a brand-new product, or when conditions have changed sharply. Its weakness is that opinions are subjective and may be wrong.
Official syllabus
Cambridge International AS & A Level Business 9609 syllabus for examination in 2026, 2027 and 2028 (Cambridge University Press & Assessment), section 8.1 Marketing analysis.
Get free revision emails (optional)
Occasional emails with practice questions, worked explanations and links to free resources for the qualification and subjects you choose. No spam, and you can unsubscribe from any email. The free tools on this site never need an email.
Related resources
-
Study guides
A Level Business: Marketing strategy (Cambridge 9609)
Study guide to marketing plans, coordinated strategy, IT and AI in marketing and international marketing, for Cambridge A Level Business, section 8.2.
Business · Cambridge · A Level
Read guide -
Practice questions
A Level Business: Marketing strategy (Cambridge 9609) – Practice Questions
Original practice questions with answers on marketing plans, coordinated strategy, IT and AI and international marketing for Cambridge A Level Business.
Business · Cambridge · A Level
Try questions -
Revision notes
A Level Business: Marketing strategy (Cambridge 9609) – Revision Notes
Condensed revision notes on marketing plans, coordinated strategy, IT and AI, and international marketing for Cambridge A Level Business section 8.2.
Business · Cambridge · A Level
Revise topic
Related articles
-
teaching
A Level tuition in Dubai: Cambridge or Pearson Edexcel International A Level?
Schools in Dubai and Abu Dhabi teach either Cambridge International AS & A Level or Pearson Edexcel International A Level. How the two are structured, why it matters for tuition, and how online classes from Lahore work.
9 October 2026
-
curriculum guides
Choosing subjects at IGCSE and A Level
How subject choices at 14 and 16 affect university options later, and how to keep pathways open without overloading a timetable.
28 July 2026
Studying this with a teacher
Working through Business A LEVEL?
This page is free and stays free. If you would rather be taught it, Marlbridge runs Business classes one-to-one and in small groups of up to 15, online in your own time zone. The first trial class is free. WhatsApp replies within an hour (8am–11pm Pakistan time, every day); email the same day.
Cambridge Business teachers at Marlbridge

