
Revision Notes
Edexcel International A Level Business: Business decisions and strategy (YBS11) – Revision Notes
Condensed revision notes for Unit 3 Business decisions and strategy in Edexcel International A Level Business: formulas, models and a self-test.
- Subject
- Business
- Level
- A LEVEL
- Topic
- Business decisions and strategy
- Author
- Marlbridge Academic Team
- Updated
- Reviewed by
- Salman Ahmad (what this means)
Aligned to Pearson Edexcel A Level Business (YBS11), Issue 1, September 2017. Official specification .
Syllabus page (what it covers and how it is assessed): Pearson Edexcel A Level Business.
Syllabus points this page covers
YBS11 (A Level)
- 3 Business decisions and strategy (whole topic)
Found an error? Report a correction.
Need help with this topic? Request a free trial class for A Level Business (YBS11).
These notes condense Unit 3, Business decisions and strategy (sections 3.3.1 to 3.3.6), of the Pearson Edexcel International Advanced Subsidiary/Advanced Level in Business specification (YBS11), Issue 1, September 2017. For fuller explanations and worked examples, see the study guide. Then try the practice questions. Other links: Edexcel A Level Business hub, printable checklist, free diagnostics.
3.3.1 Objectives and strategy
- Mission statement or corporate aims lead to corporate objectives (measurable). Appraise a mission statement: specific, usable, believed, acted on.
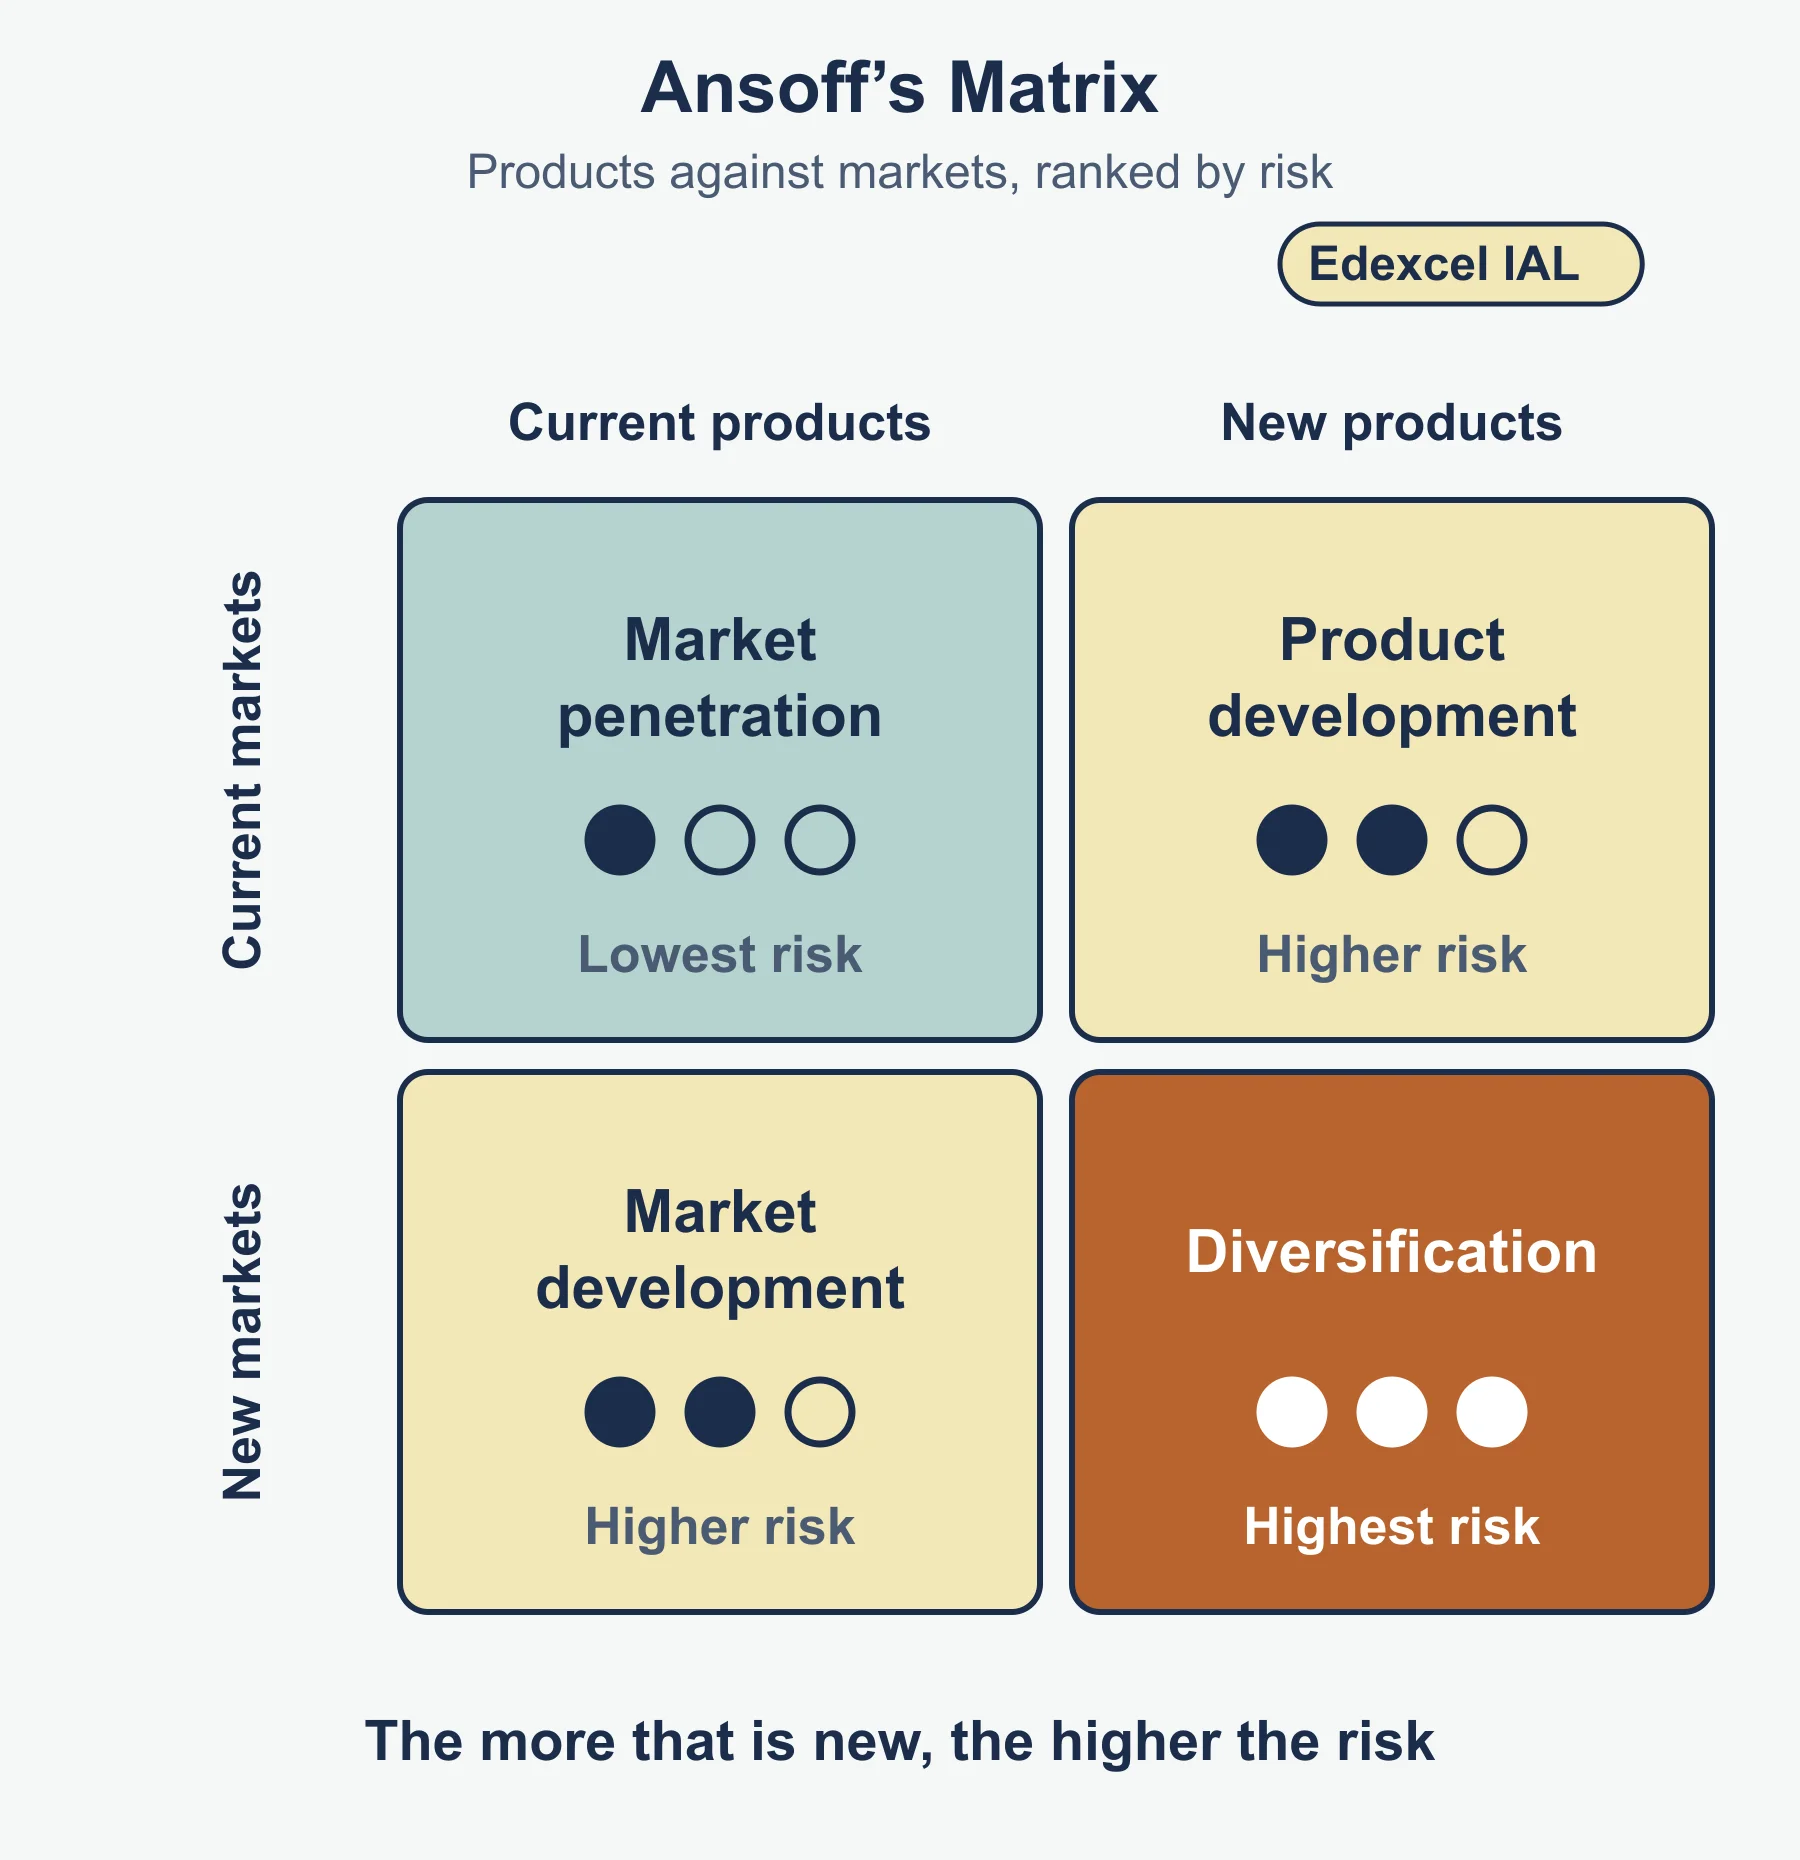
- Ansoff’s Matrix: market penetration, market development, product development, diversification (risk rises towards diversification).
- Porter’s Strategic Matrix: cost leadership, differentiation, cost focus, differentiation focus.
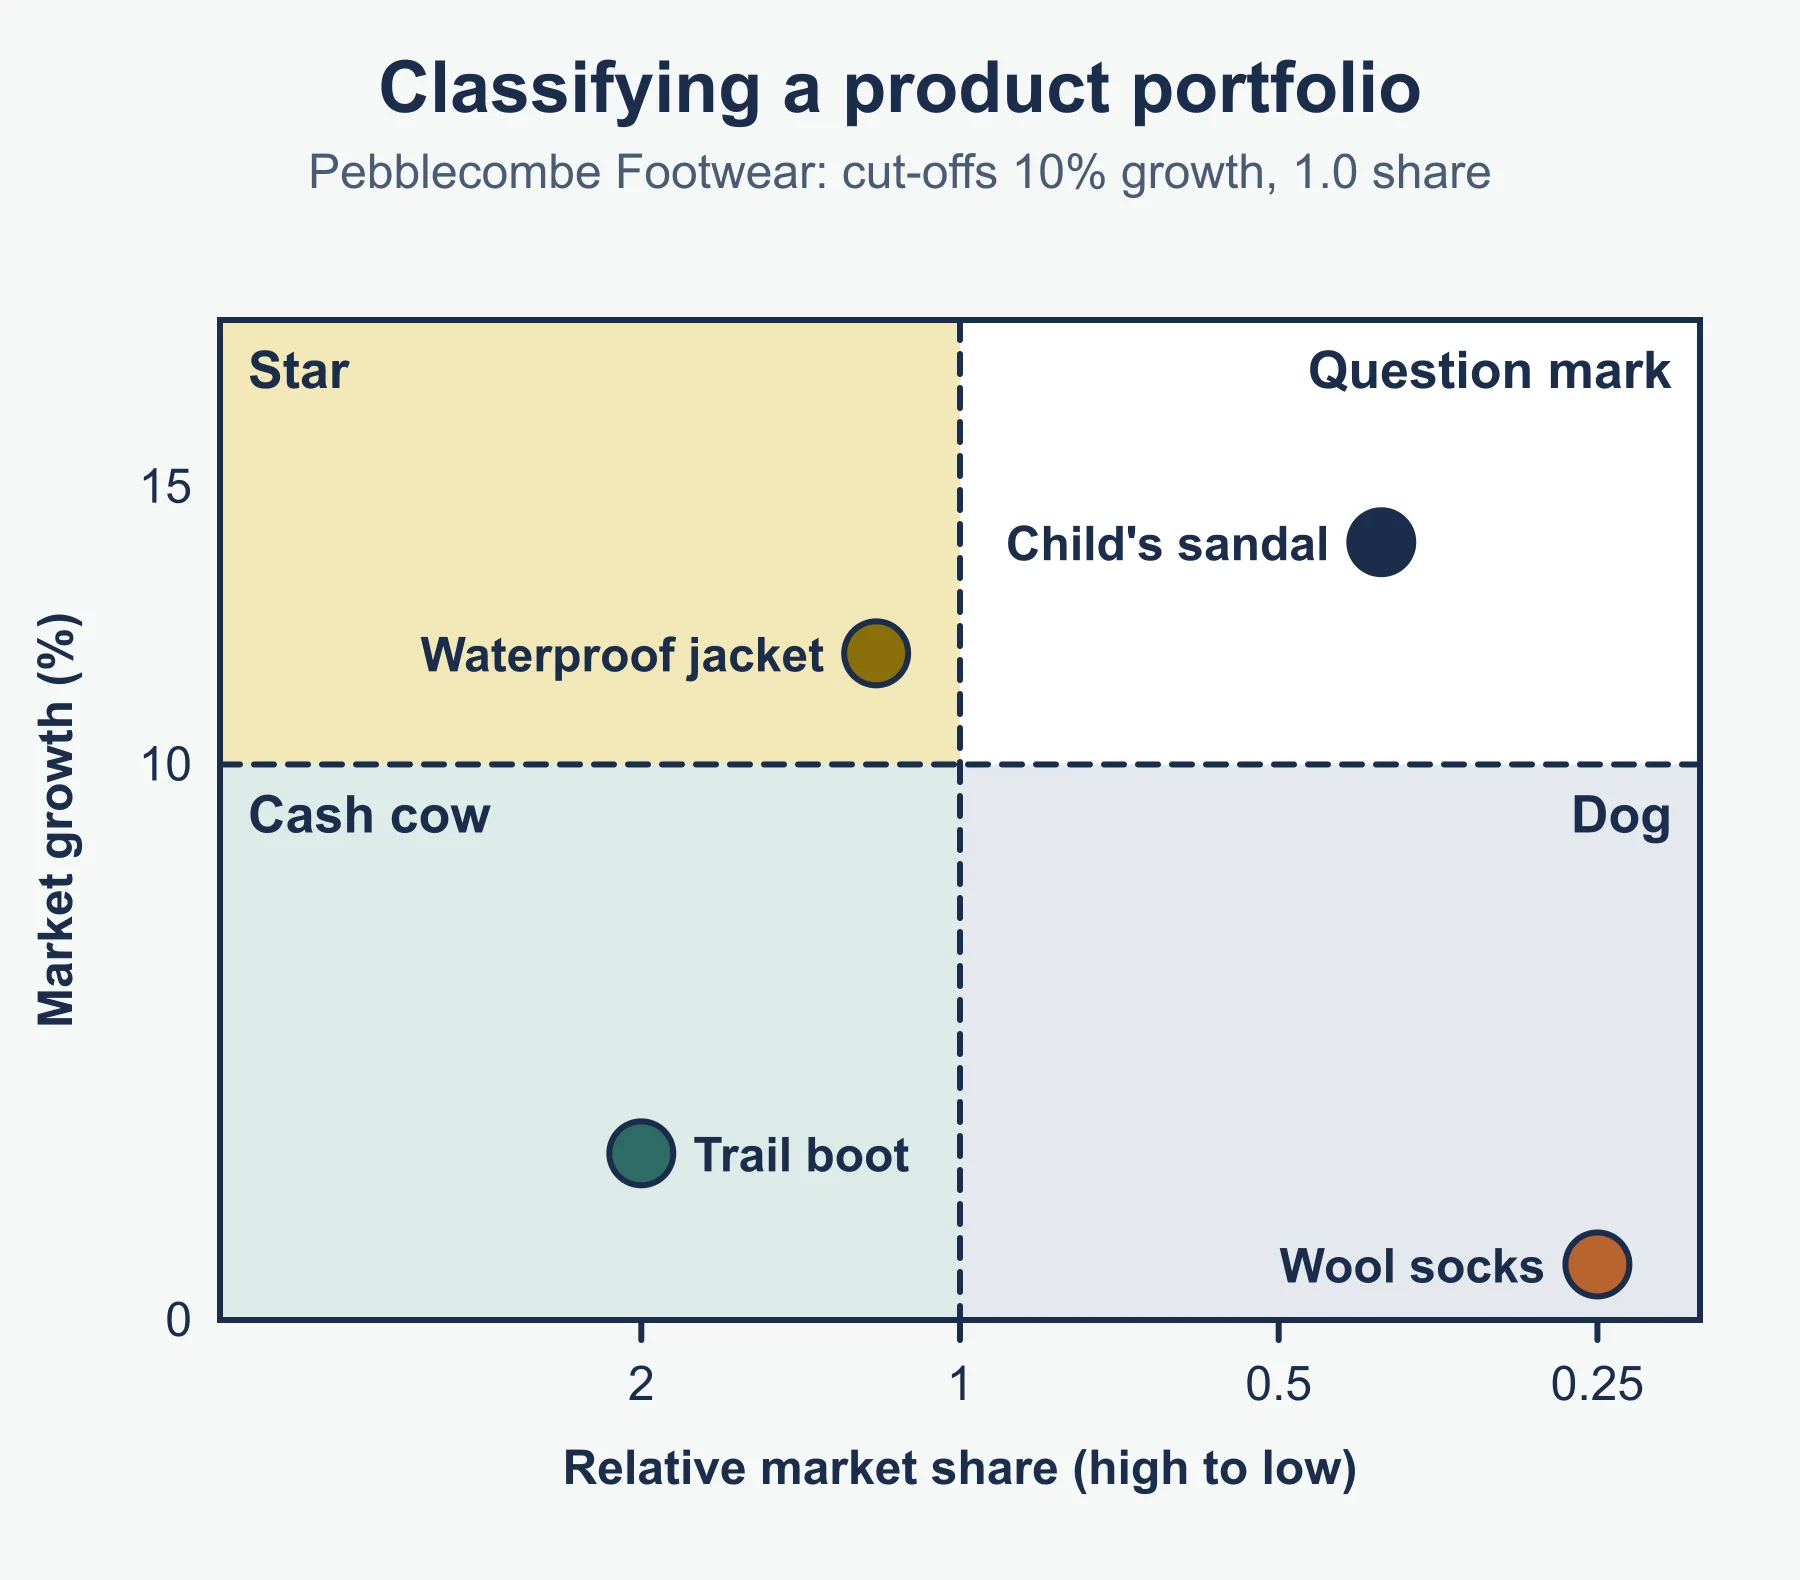
- Portfolio analysis: balance a range of products so mature ones fund growth (Boston matrix is the common tool).
- Strategic = long term, firm-wide. Tactical = shorter term, specific. Both change human, physical and financial resources.
- SWOT: internal factors are strengths and weaknesses; external factors are opportunities and threats.
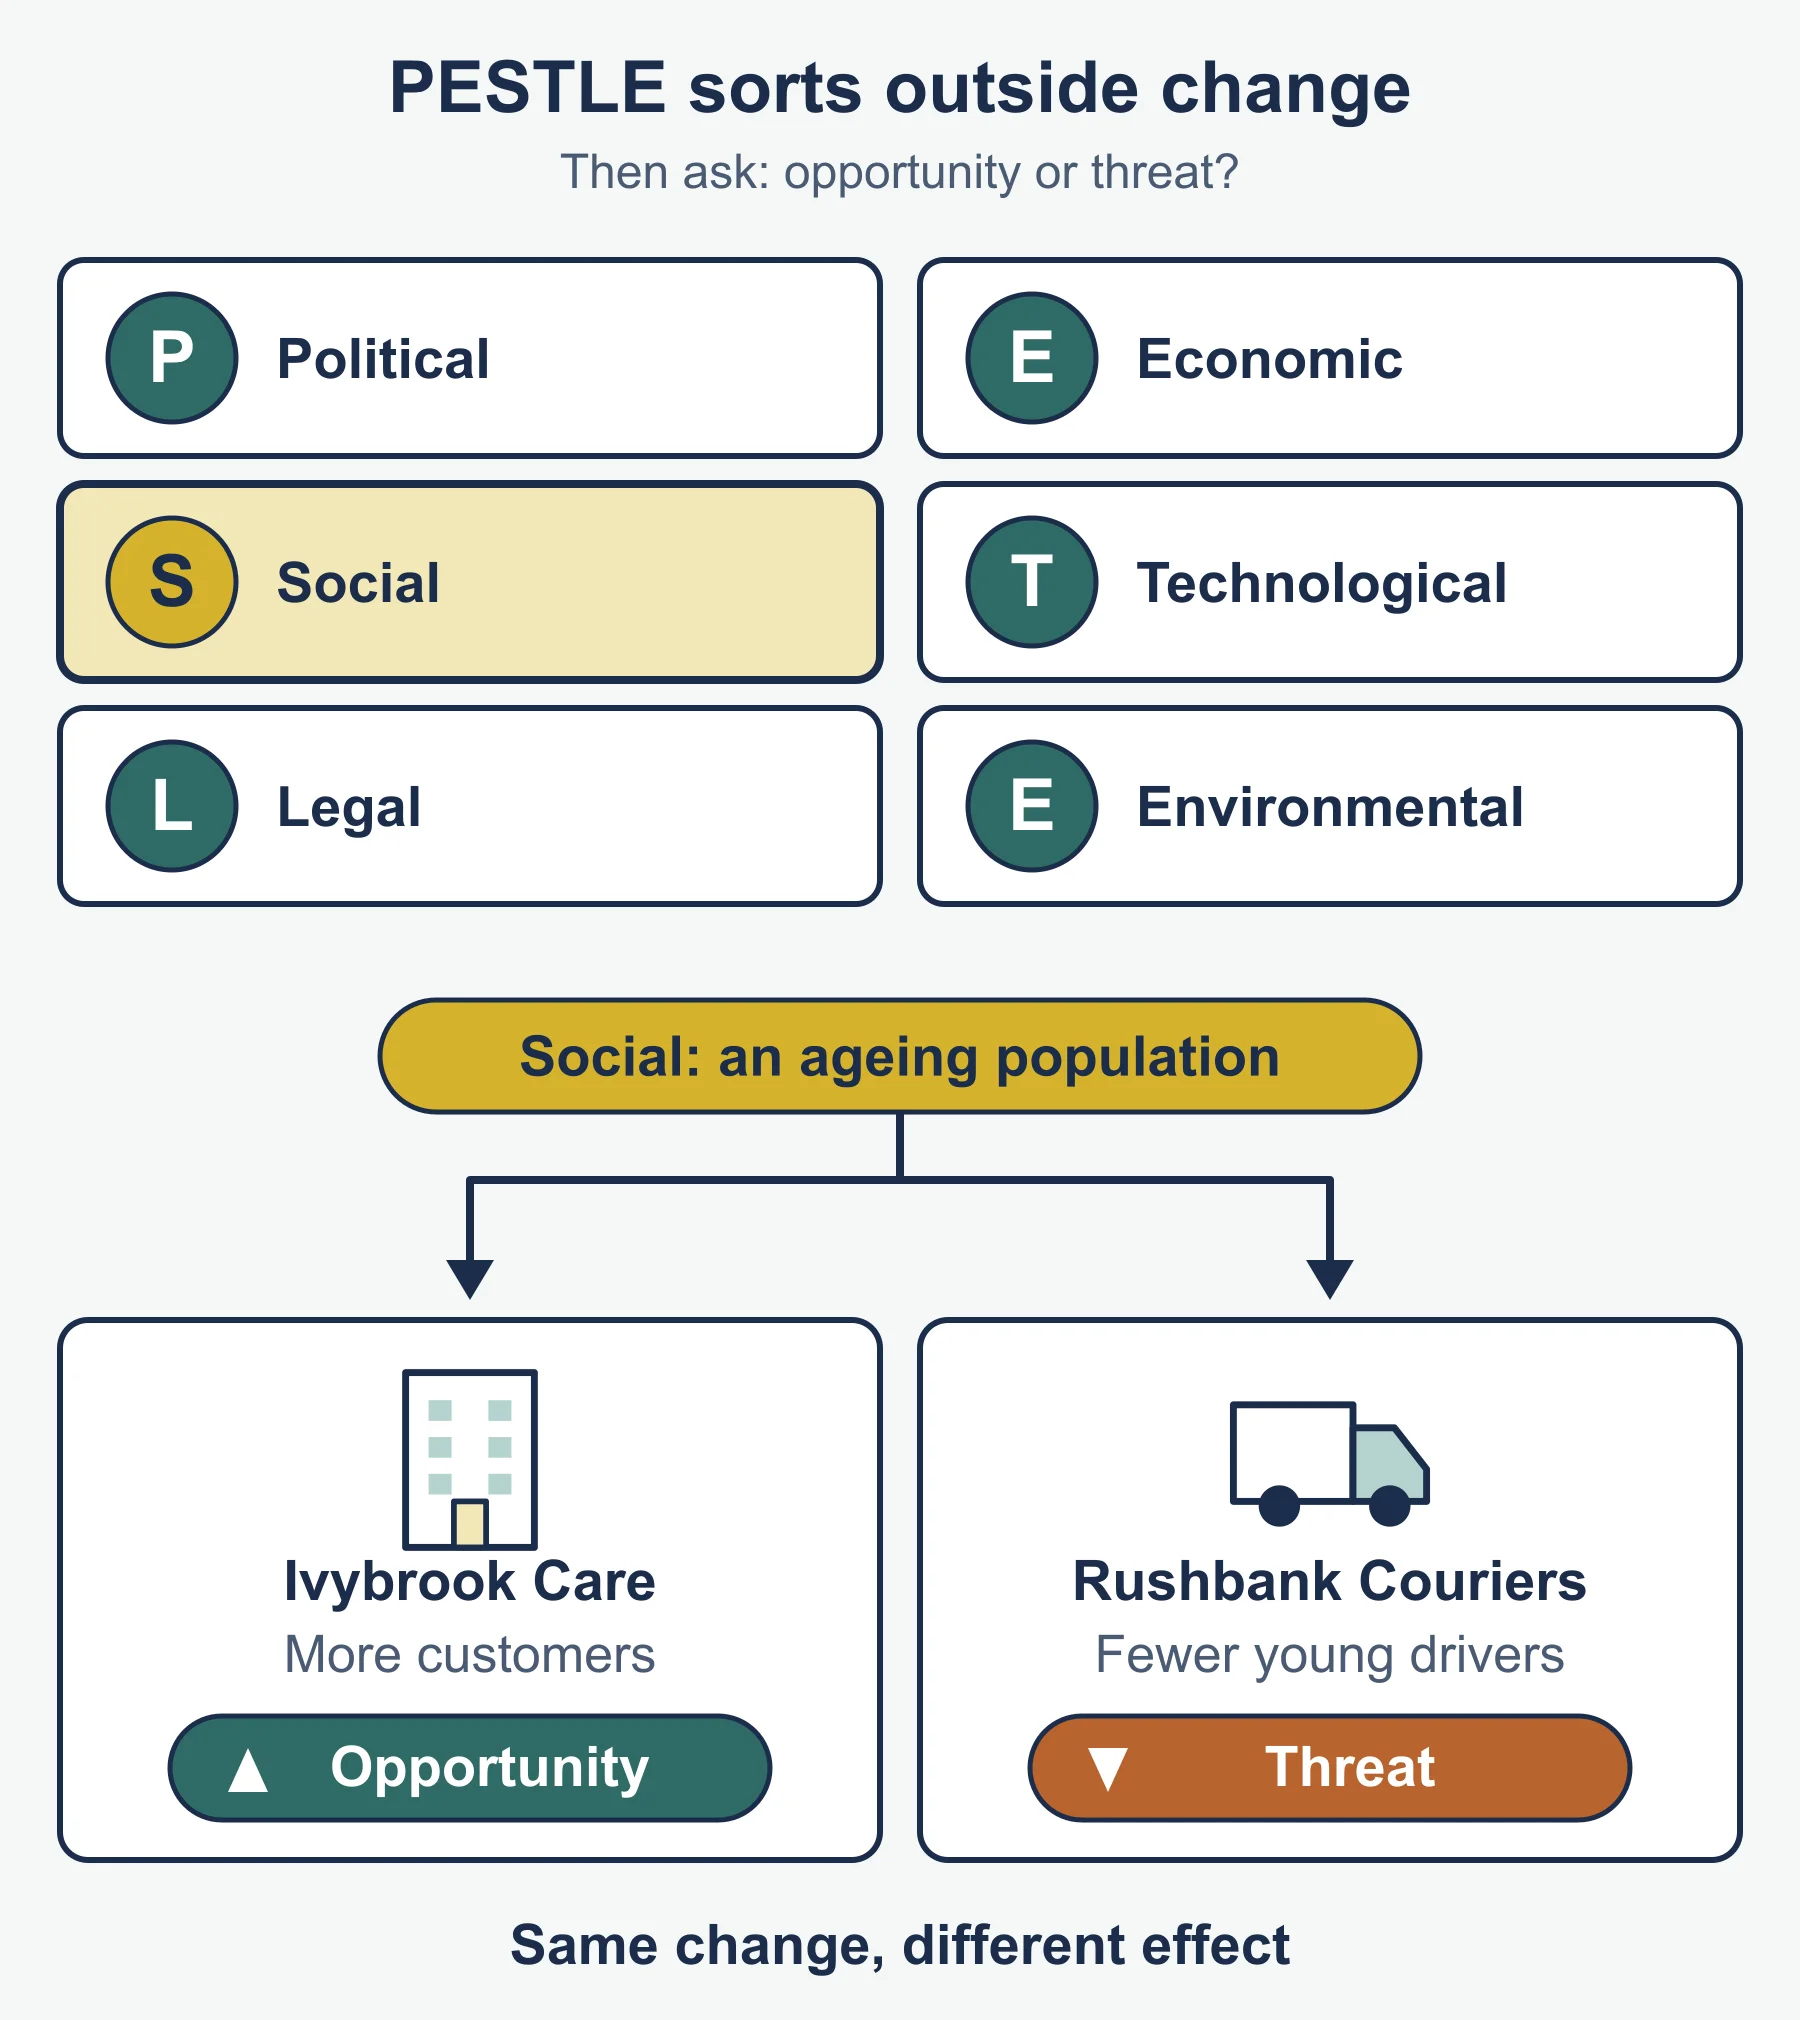
- PESTLE: political, economic, social, technological, legal, environmental.
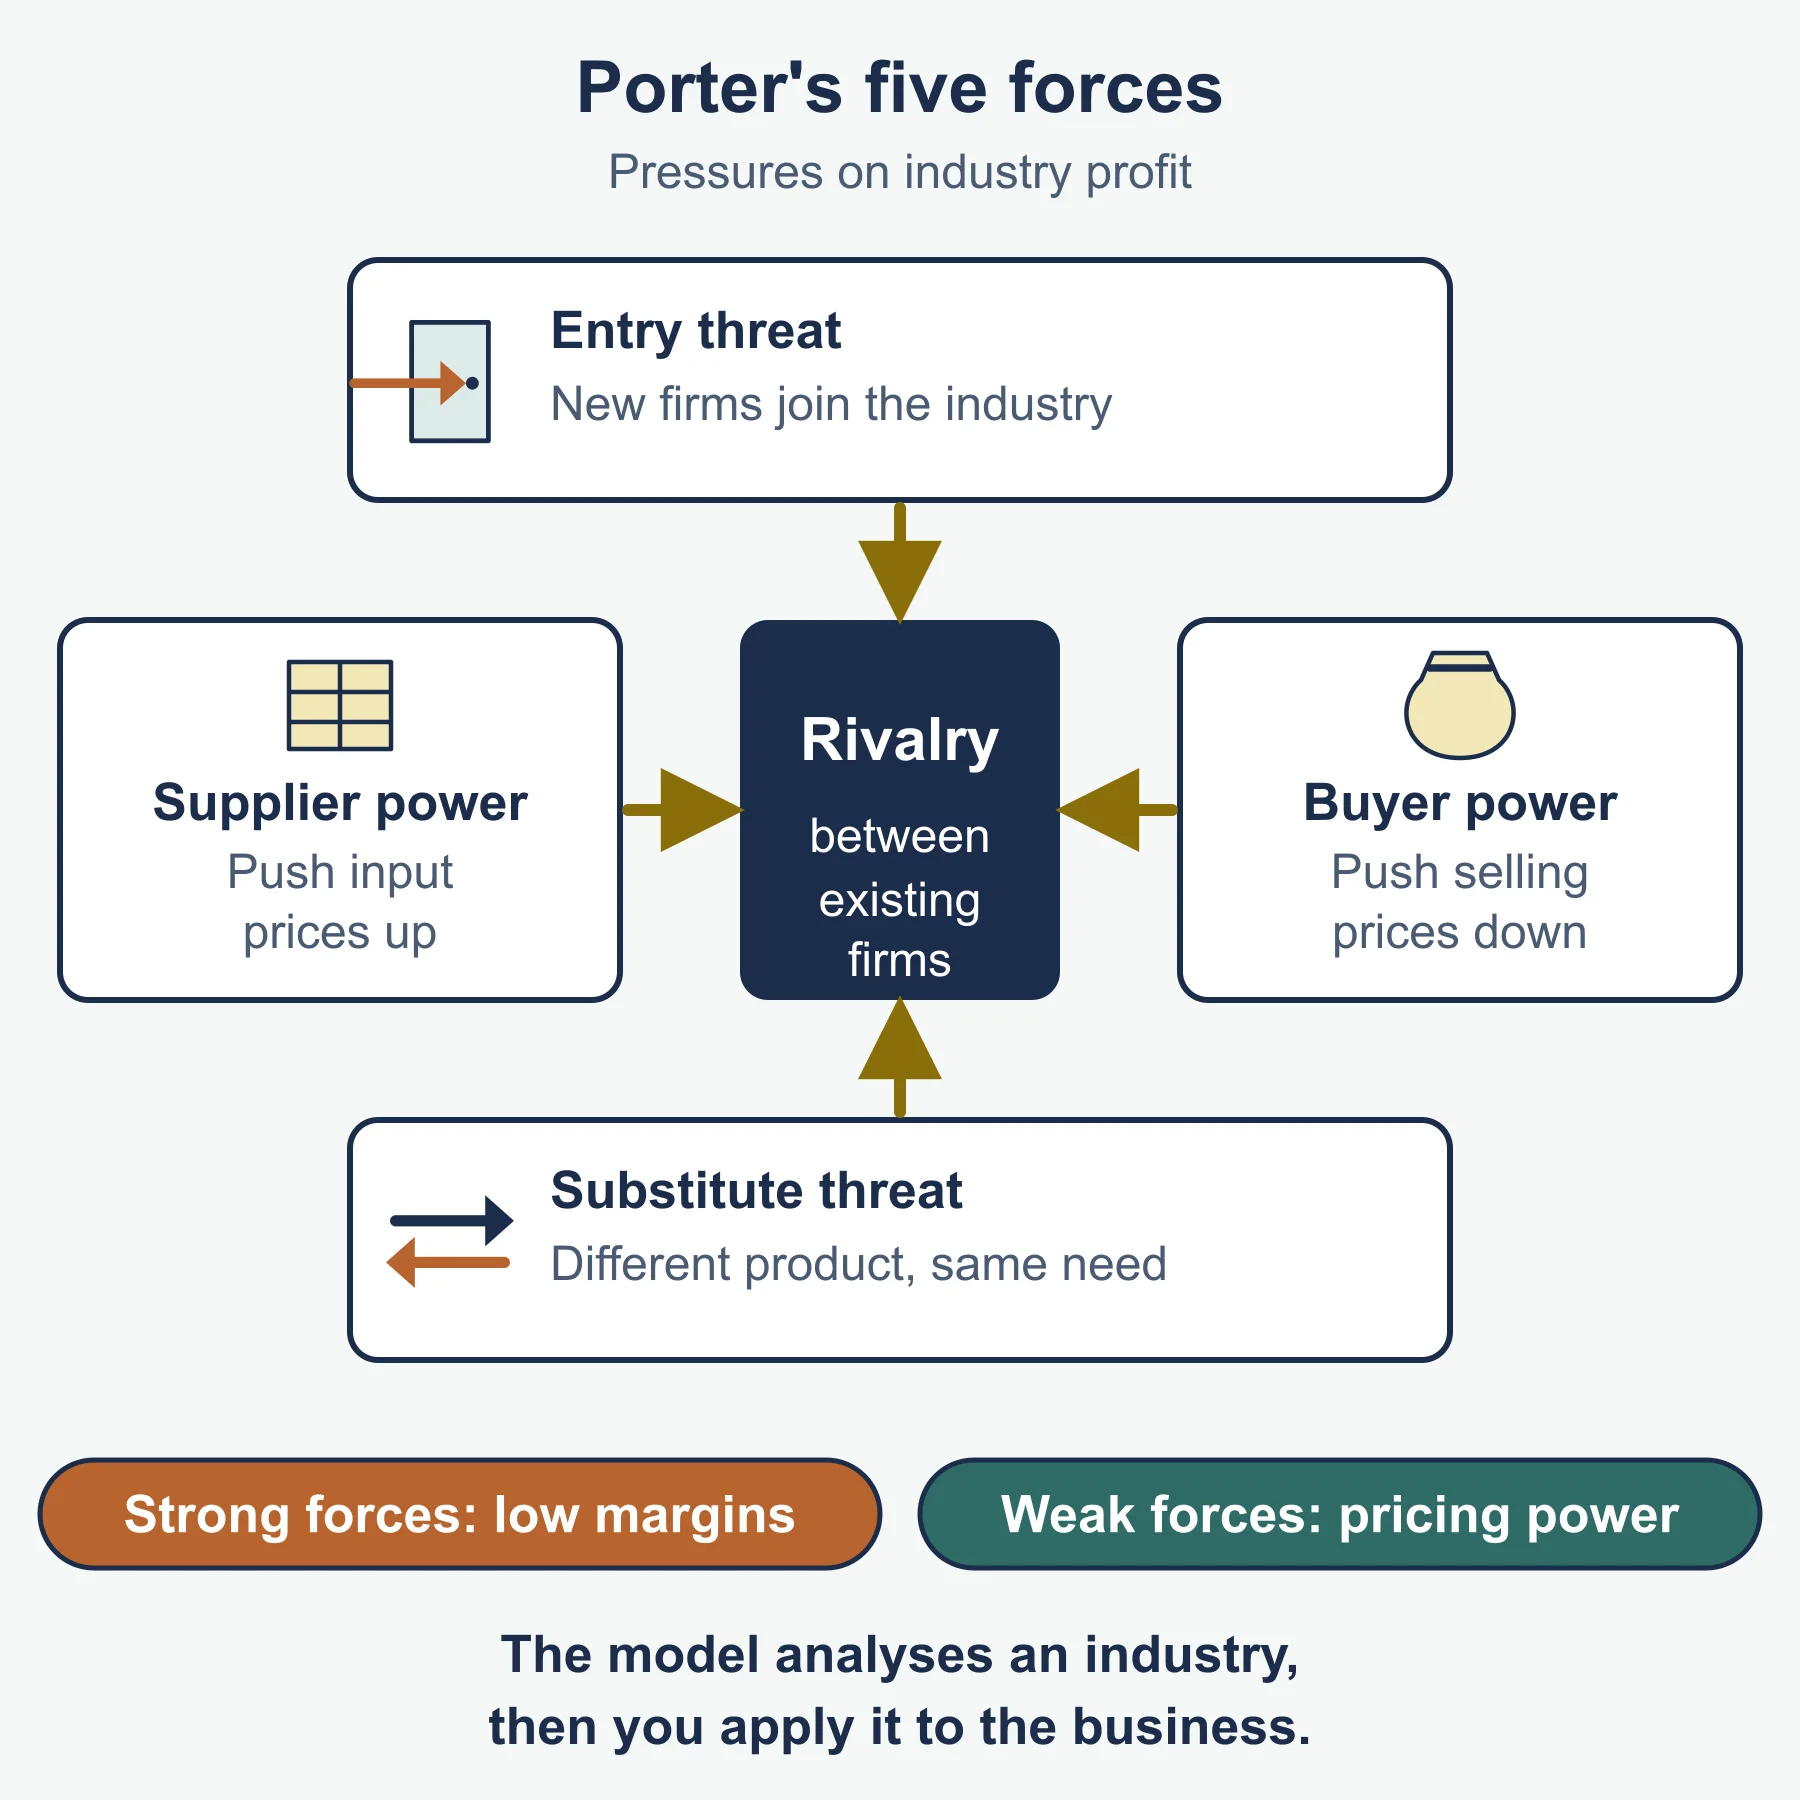
- Porter’s five forces: rivalry, new entrants, substitutes, buyer power, supplier power.
3.3.2 Growth
| Point | Notes |
|---|---|
| Objectives | economies of scale (internal: bulk buying; external: industry-wide benefits), market power over customers and suppliers, market share and brand recognition, profitability |
| Organic | new products, markets, outlets, online, capacity; slow but controlled; keeps culture |
| Inorganic | merger (agreed combination) or takeover (buying control); fast but costly and risky |
| Horizontal | same stage, same industry |
| Vertical | forward (customers) or backward (suppliers) |
| Conglomerate | unrelated industries; spreads risk |
| Financial risks | overpaying, higher gearing and interest, integration cost |
| Financial rewards | scale economies, share, diversified income |
| Problems | diseconomies of scale, weaker internal communication, overtrading |
Overtrading: sales growth outruns working capital, so profit exists but cash runs out. Fixes: slow growth, add finance, chase debtors, negotiate supplier terms.
3.3.3 Decision-making techniques
| Technique | Formula or method |
|---|---|
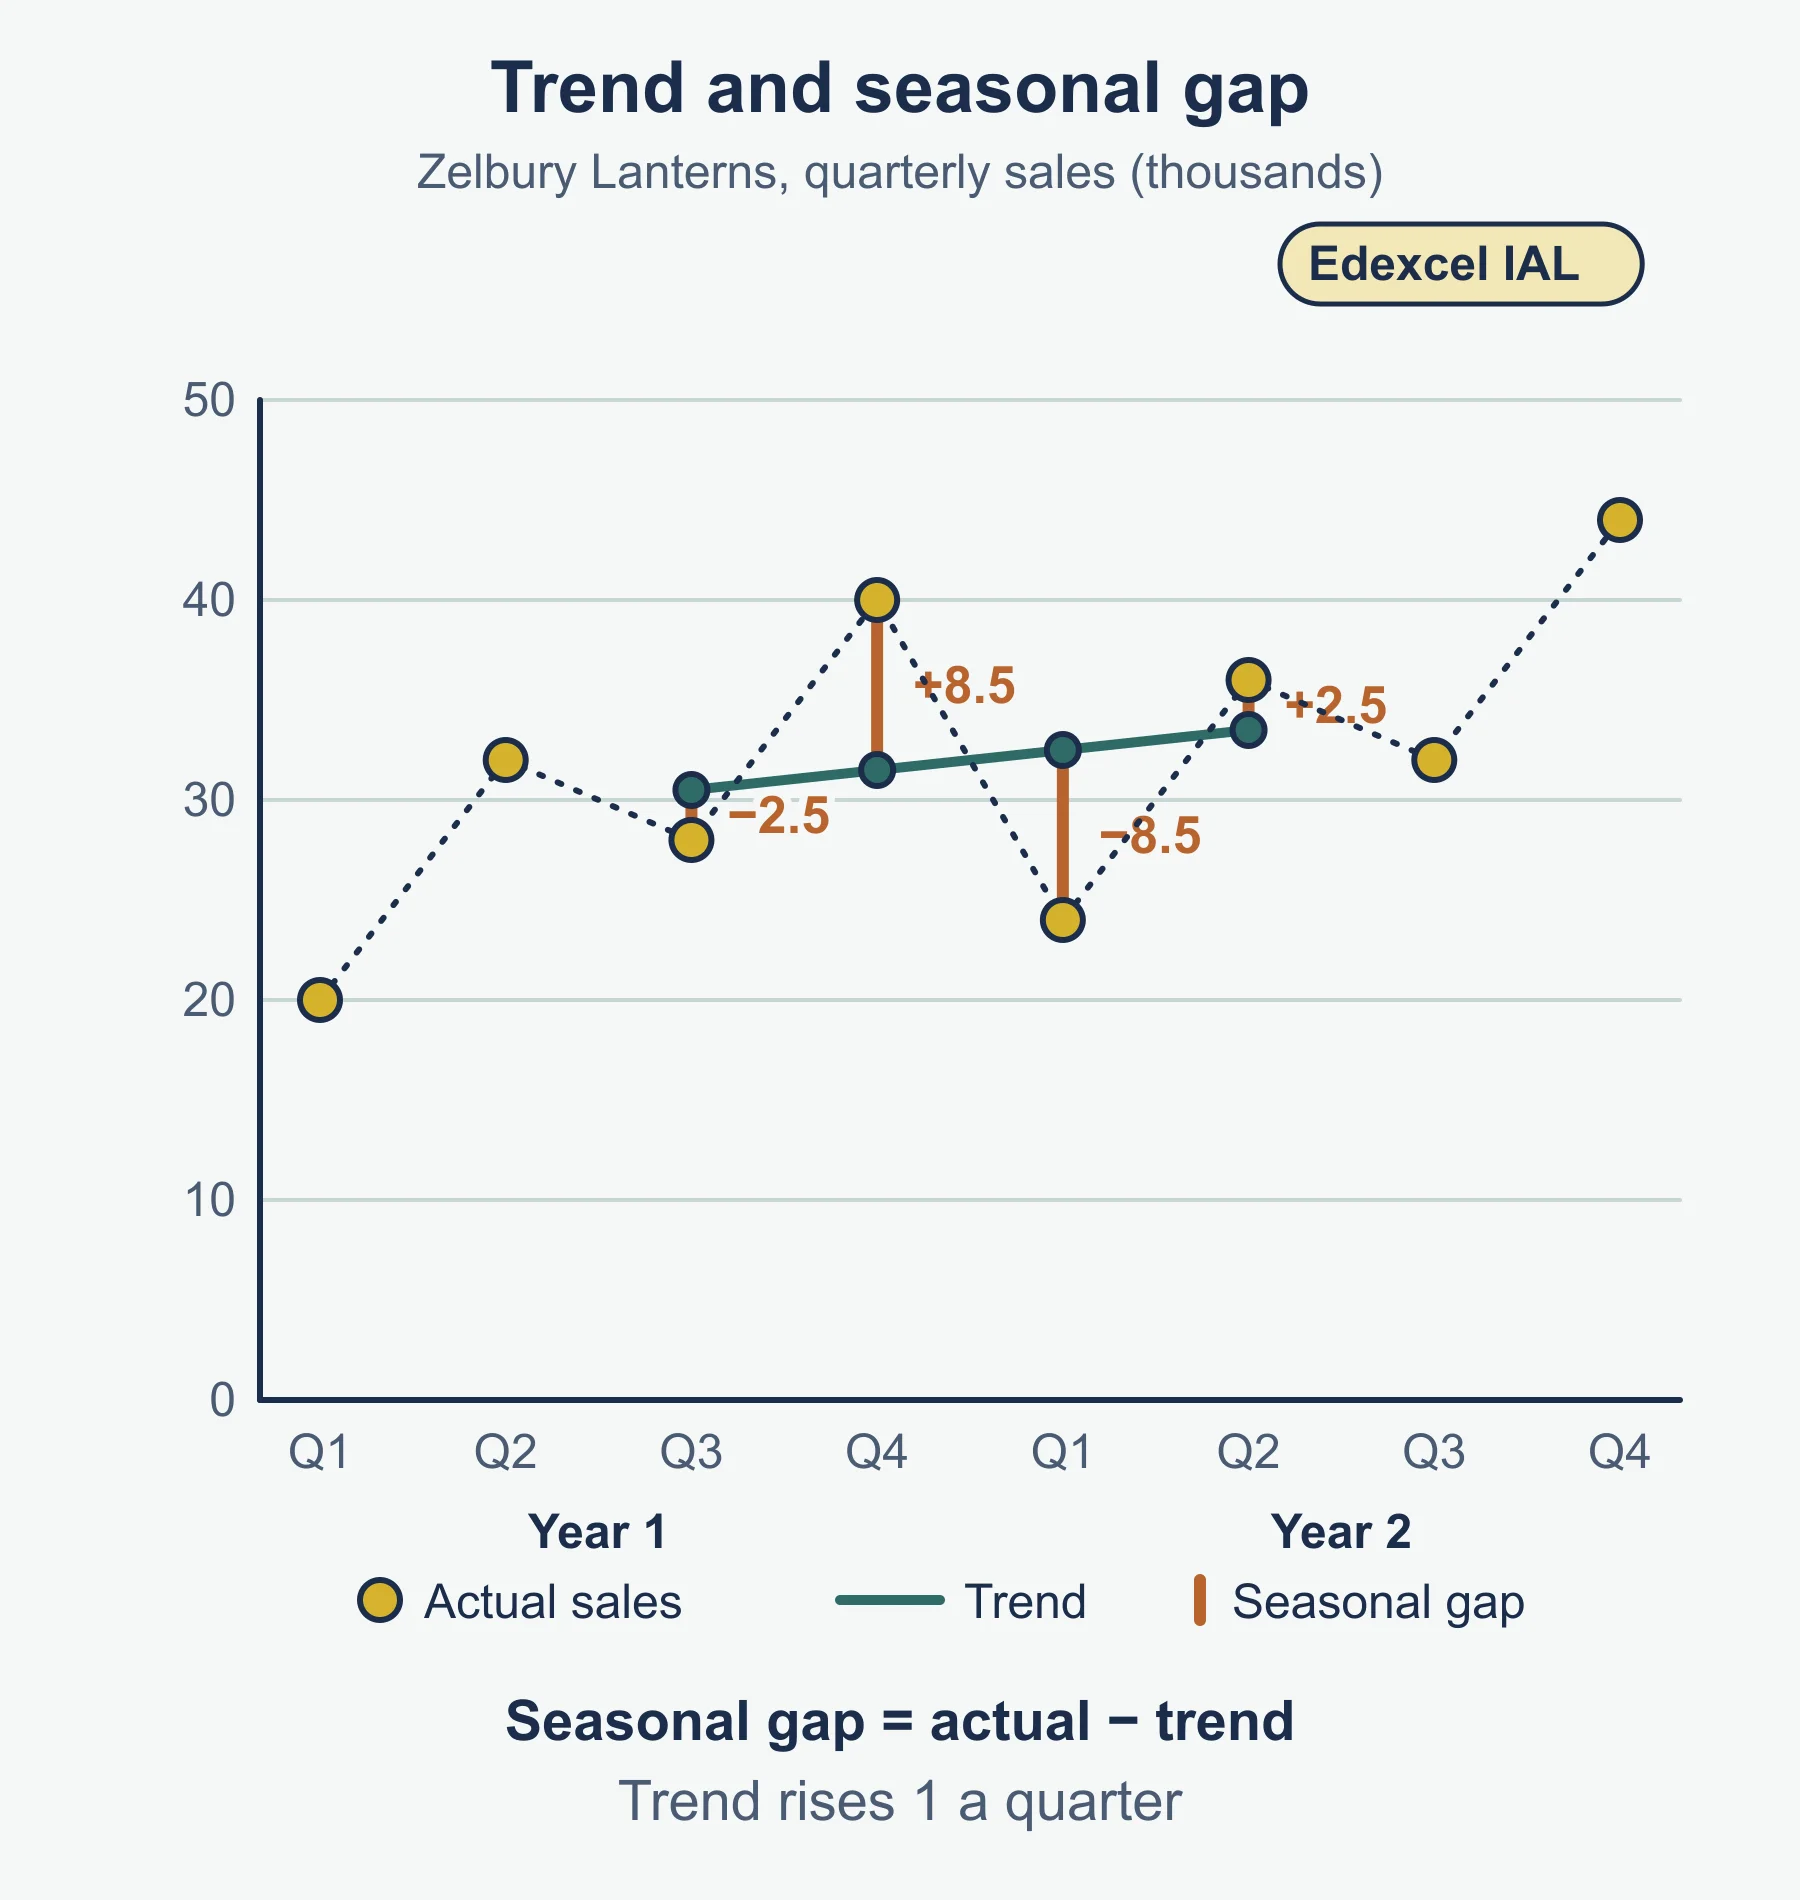
| 3-period moving average | sum of 3 consecutive values / 3, placed at the middle |
| 4-quarter centred average | average 4 quarters, then average two neighbours to centre it |
| Seasonal variation | actual minus trend |
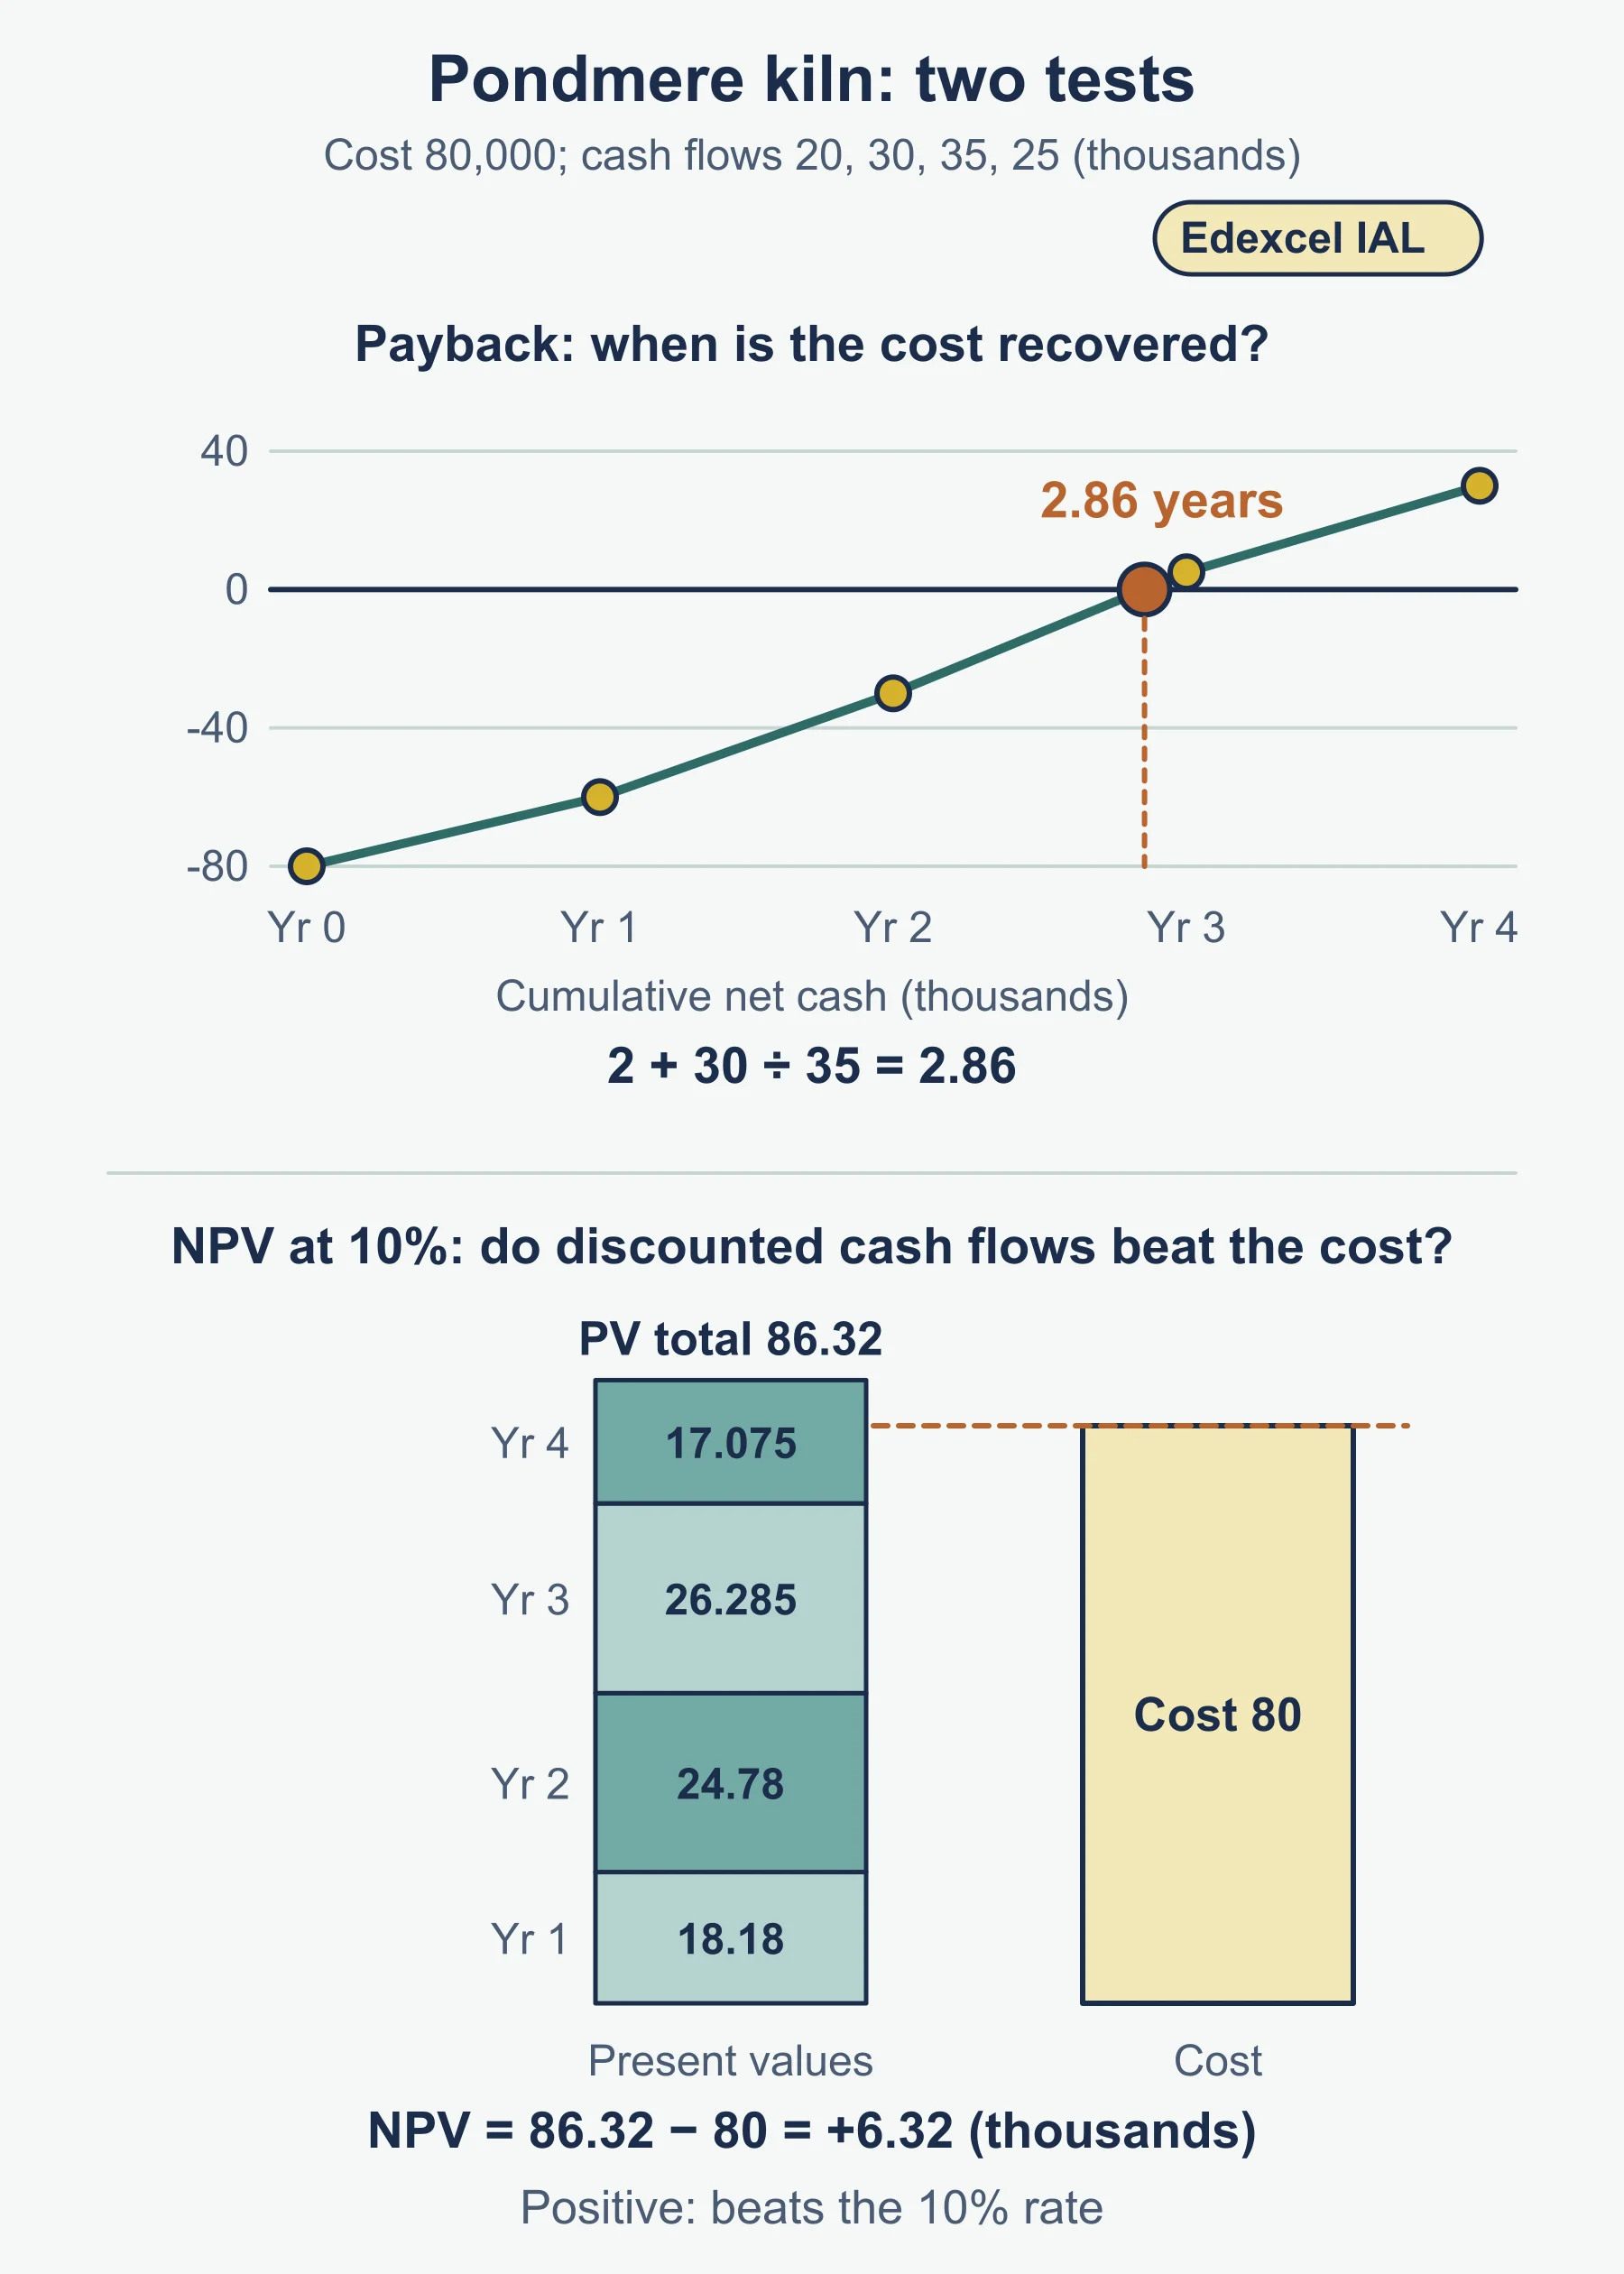
| Payback | full years + (cost still to recover / cash flow in the payback year) |
| ARR (standard form) | (total net return - cost) / years / cost x 100 |
| NPV | sum of (cash flow x discount factor) - initial cost |
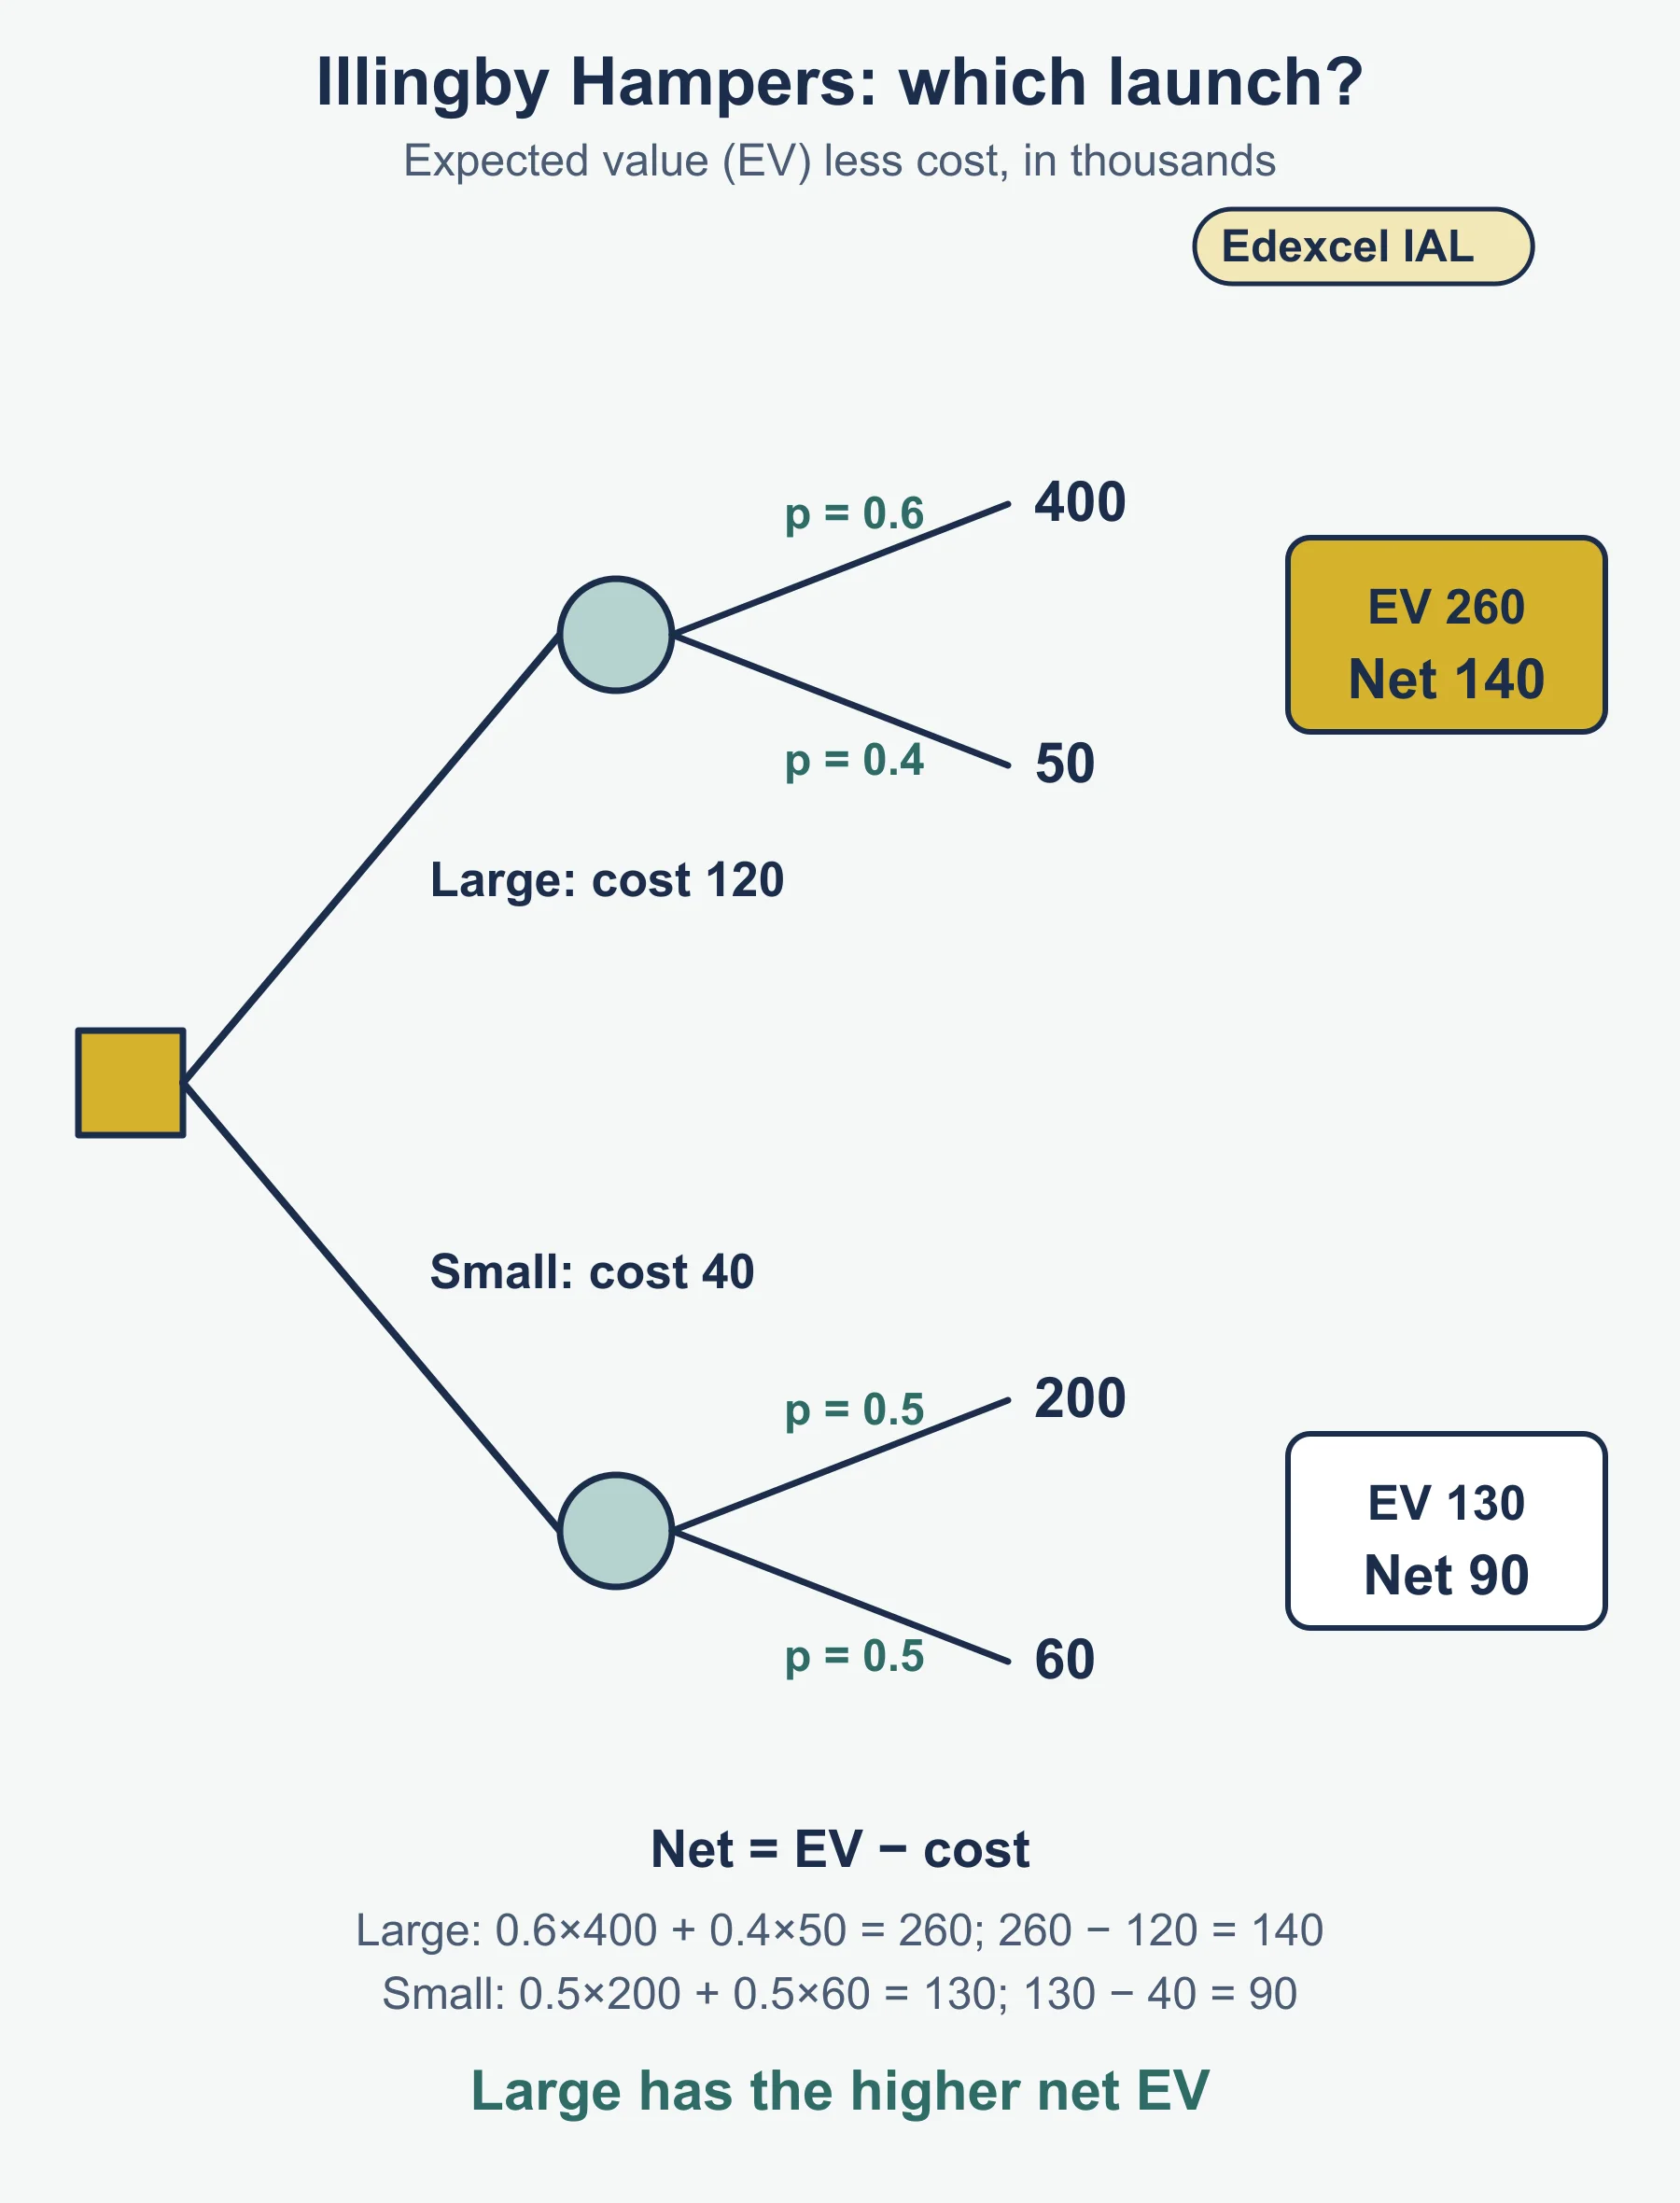
| Expected value | sum of (probability x outcome); net EV = EV - cost |
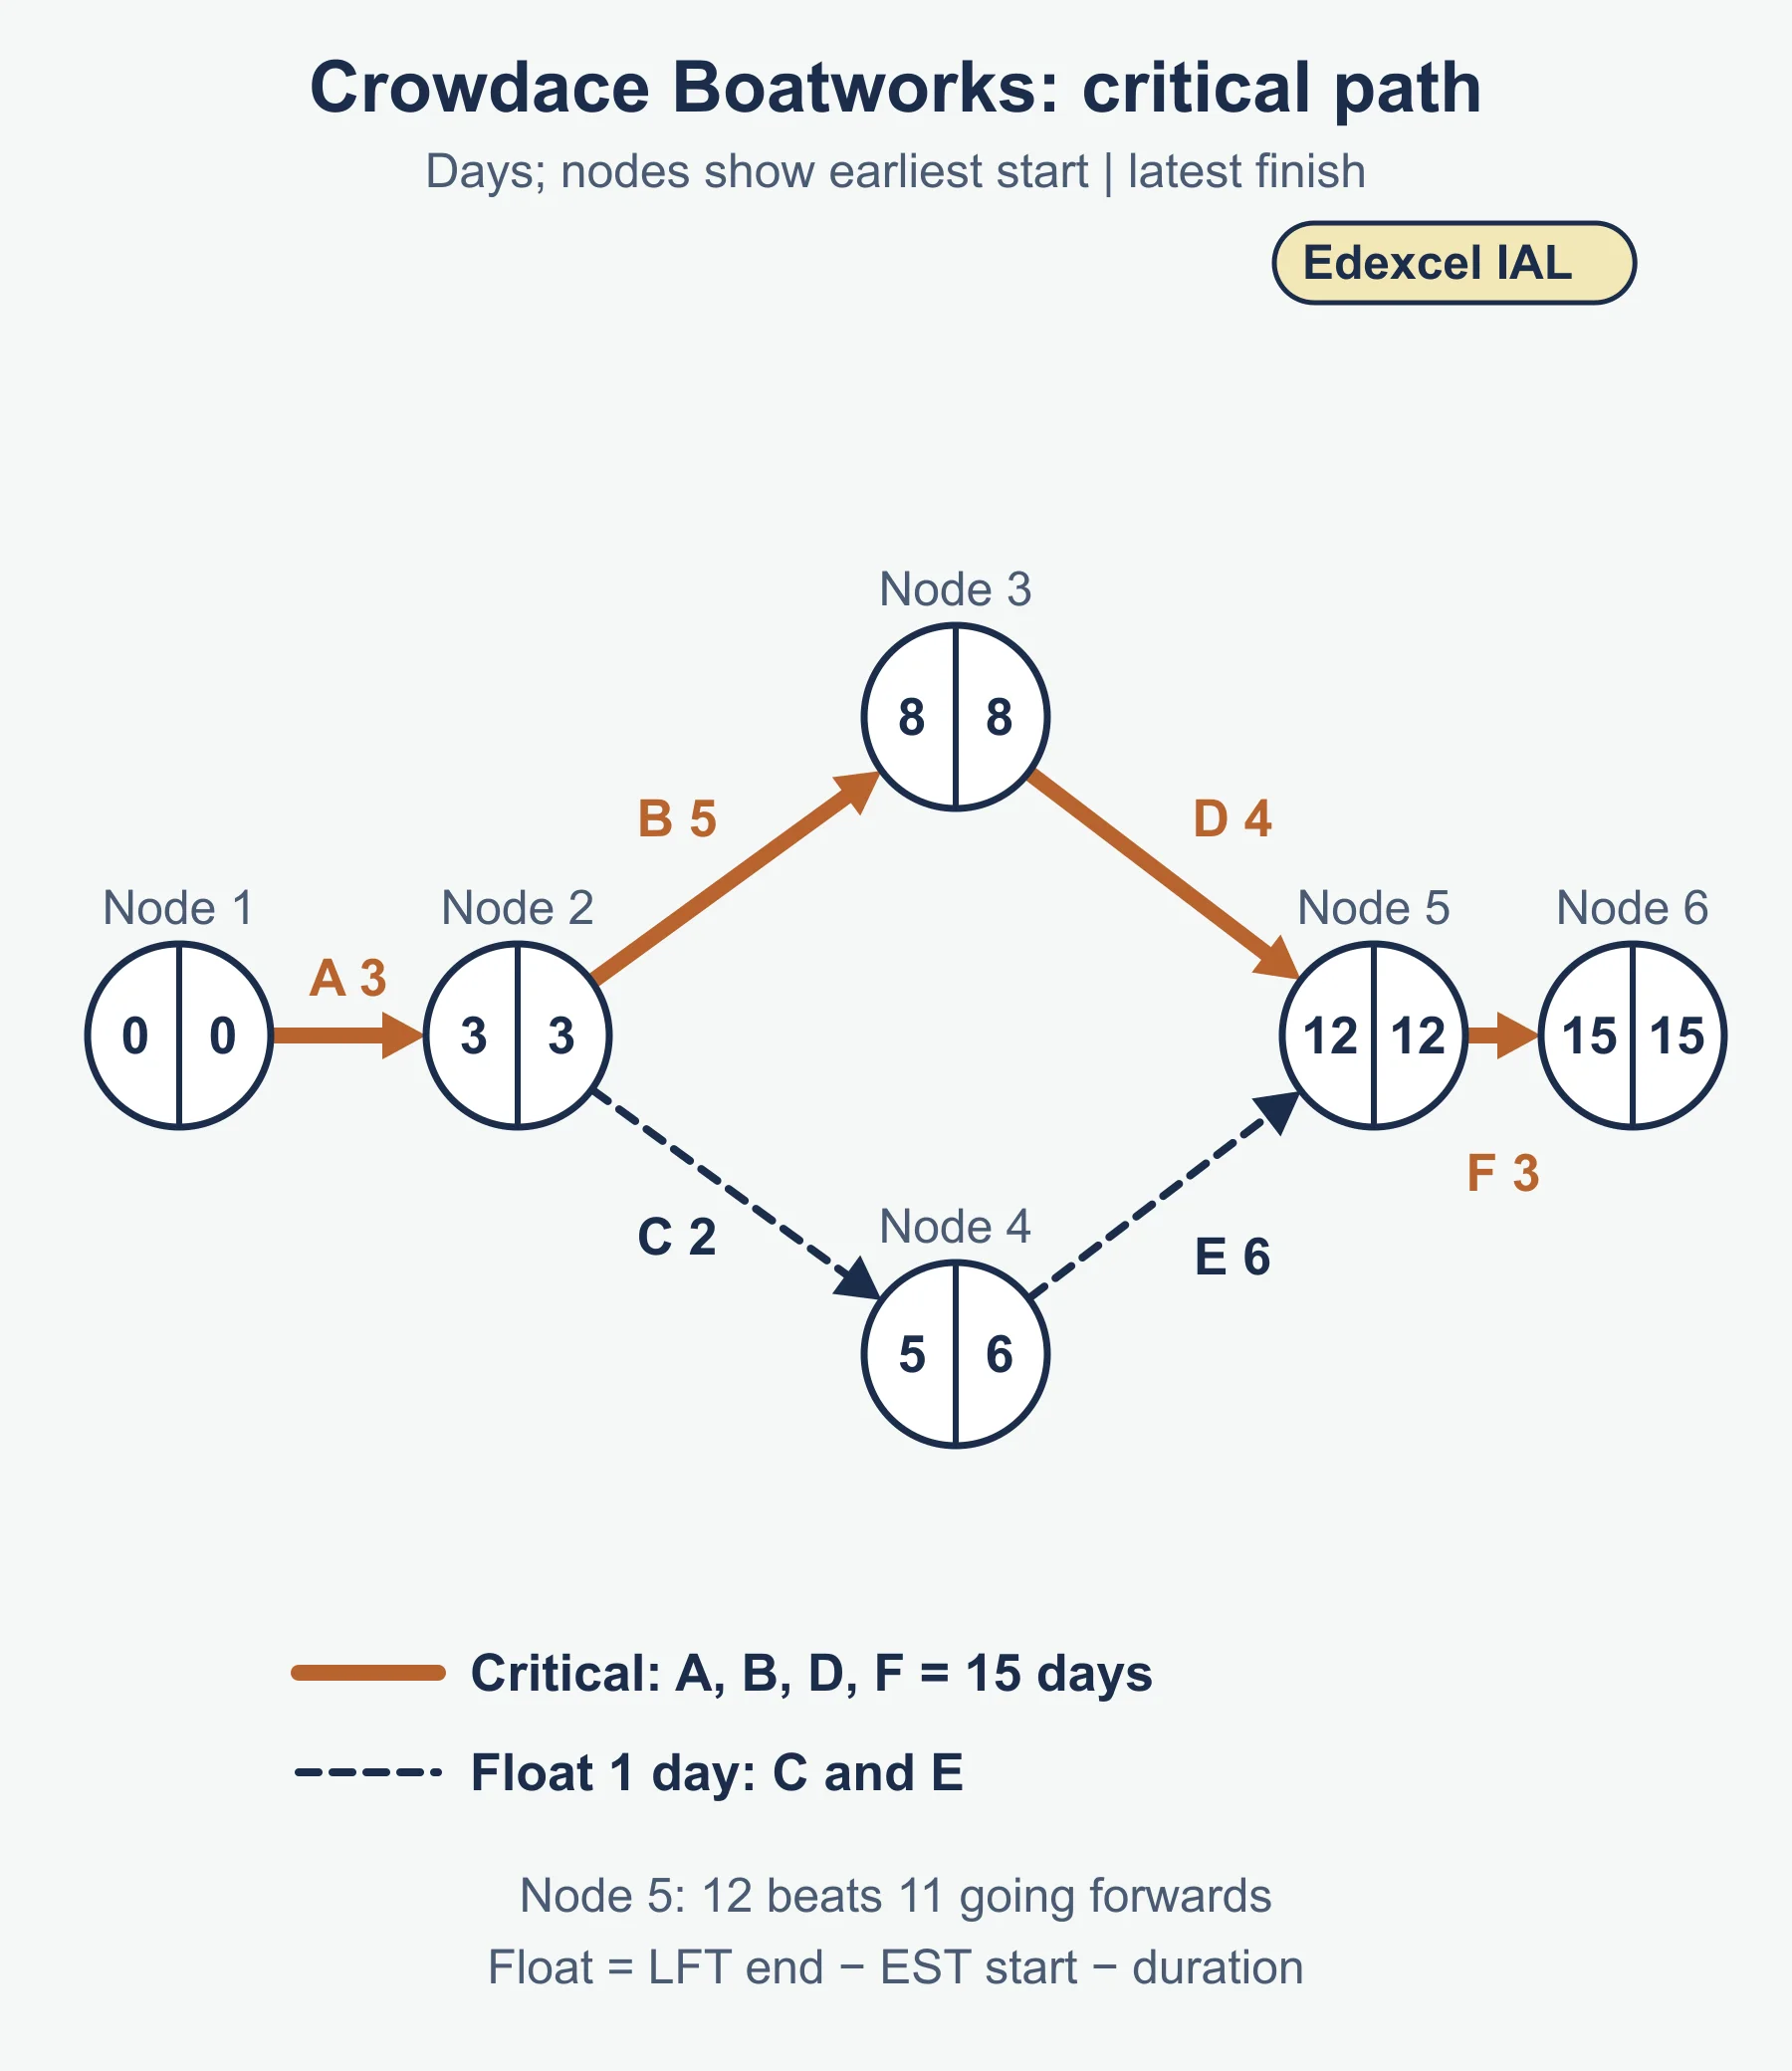
| Total float | LFT at end node - EST at start node - duration |
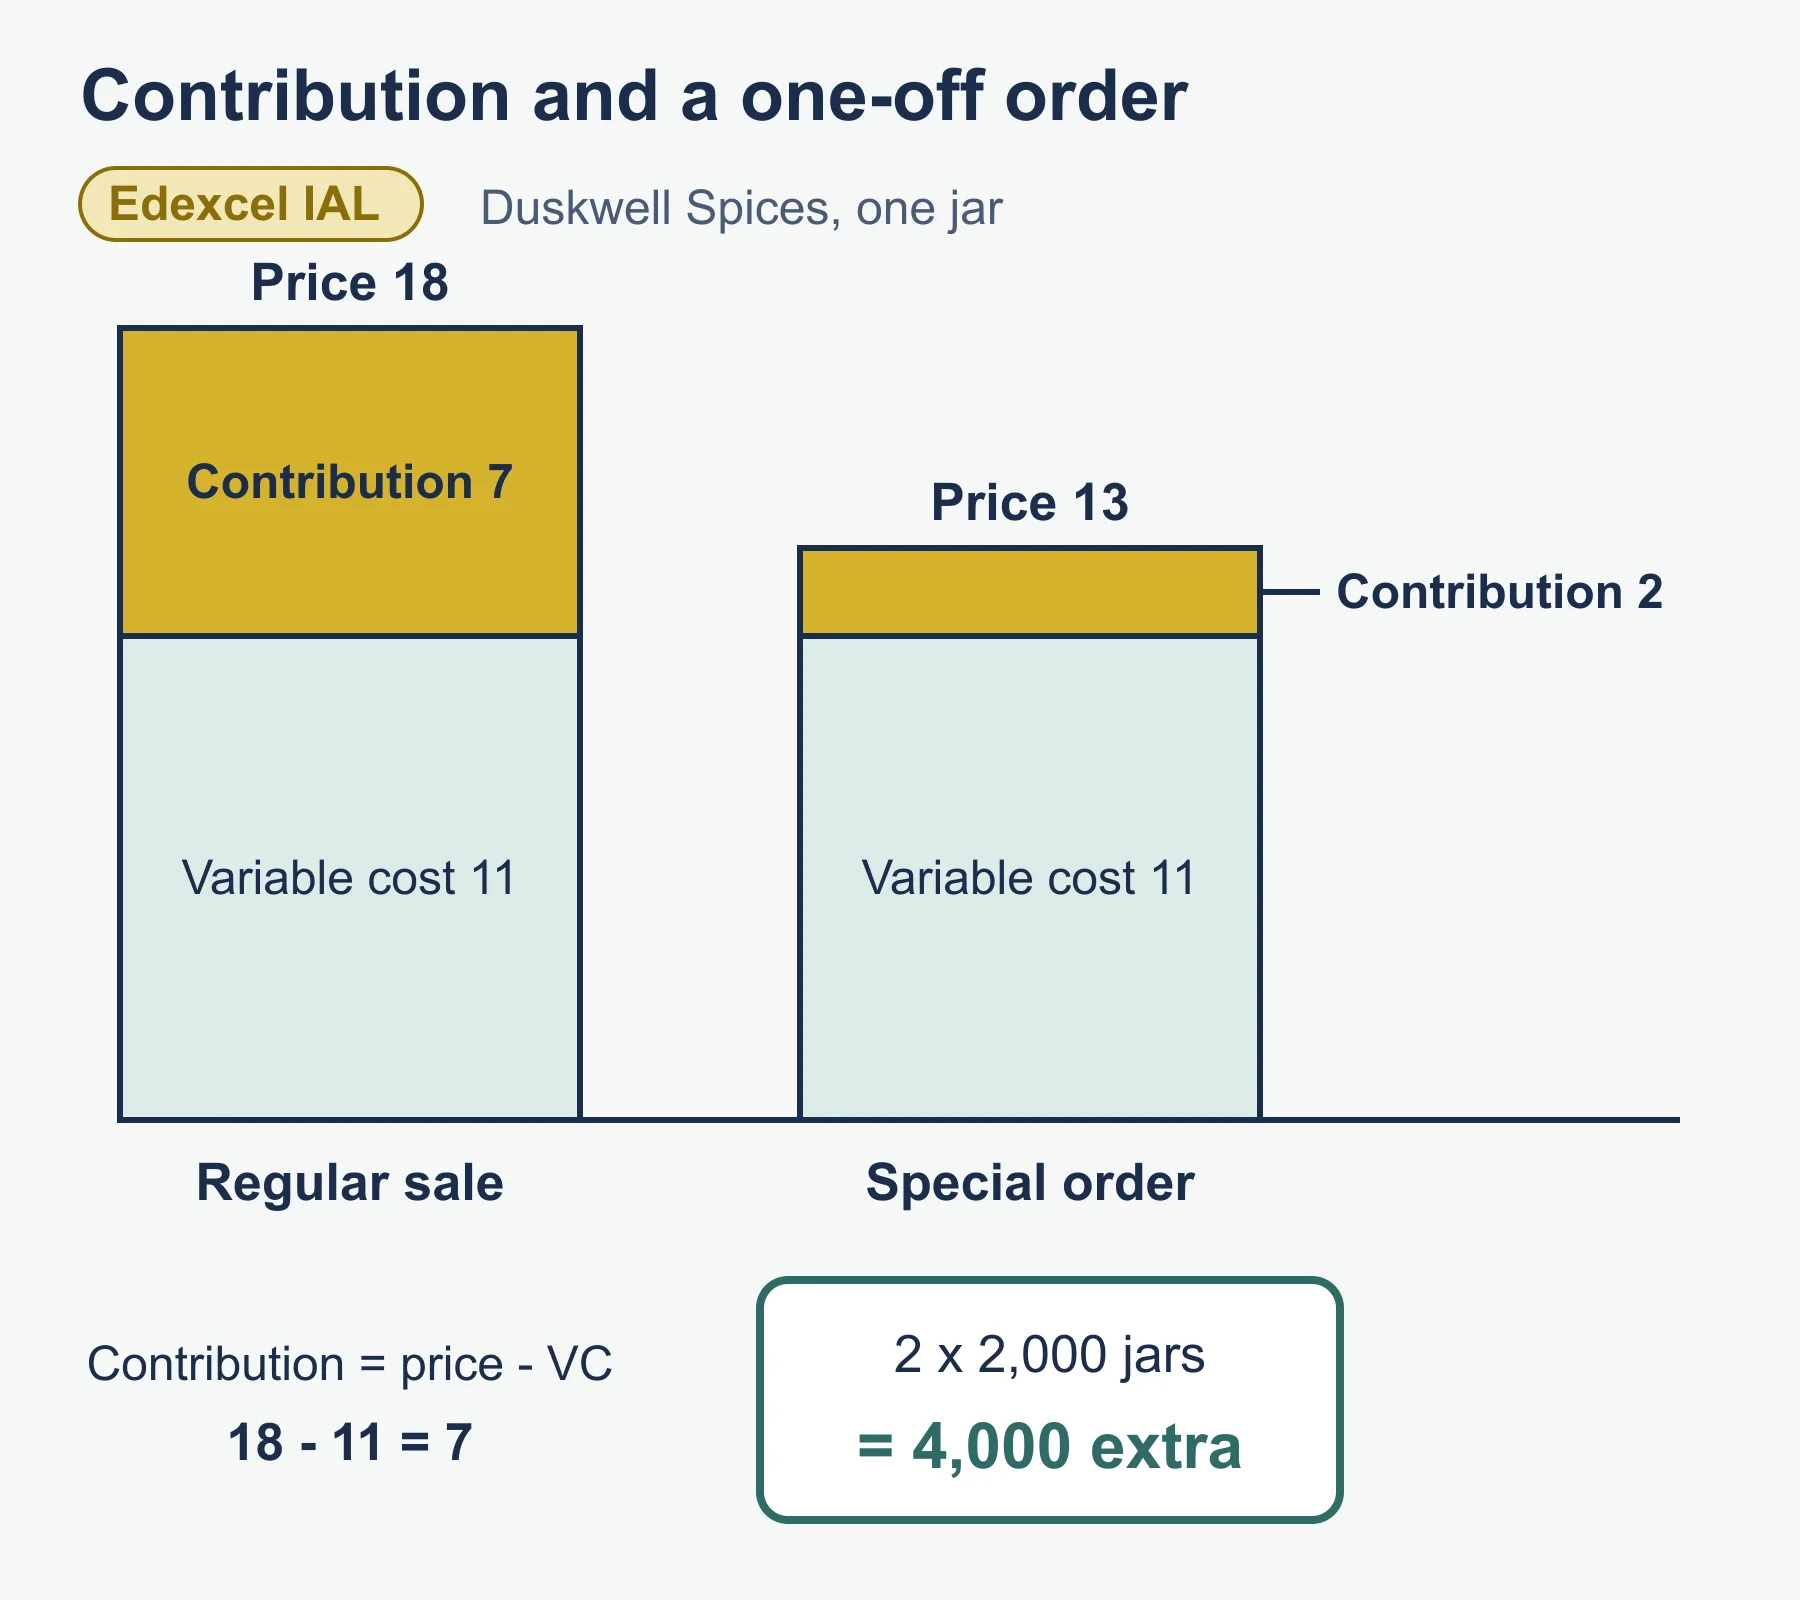
| Contribution per unit | what remains of the price after one unit’s variable cost |
| Total contribution | unit contribution times units sold; profit = total contribution - fixed costs |
Method for a decision tree: work right to left, calculate the EV at each chance node, subtract the option’s cost, then choose the highest net EV at the decision node.
Method for CPA: list activities and dependencies, draw nodes, find EST forwards (larger value where paths merge), find LFT backwards (smaller value where paths split), mark zero-float activities as the critical path.
Limitations to quote:
- Forecasting: past may not repeat, outliers, shocks, weak correlation, extrapolation risk.
- Investment appraisal: forecasts are uncertain; payback ignores later cash; ARR ignores timing; NPV depends on the discount rate; non-financial factors ignored.
- Decision trees: subjective probabilities, only money, risk attitude ignored.
- CPA: estimated durations, resources not shown.
- Contribution: fixed costs must still be covered; assumes spare capacity and stable prices.
3.3.4 Influences on decisions
- Culture: strong (widely held) or weak (inconsistent). Types: power, role, task, person. Formed by founders, history, leadership, structure. Hard to change because of habit and resistance.
- Stakeholders: internal (owners, managers, employees) and external (customers, suppliers, lenders, government, community). Stakeholder model considers all; shareholder model focuses on share price and dividends. Conflict: profit versus wider objectives.
- Ethics: trade-offs between profit and ethics. Pay and rewards: fairness, executive pay, bonuses. CSR: responsibility for social and environmental impact beyond the minimum.
3.3.5 Assessing competitiveness
Statement of comprehensive income (profit and loss account): revenue less cost of sales gives gross profit; less other operating expenses gives operating profit; less interest gives profit for the year. Statement of financial position (balance sheet): assets (non-current, current) less liabilities (current, non-current) give net assets, matched by equity (share capital plus retained profits).
| Ratio | Formula |
|---|---|
| Gross profit margin | gross profit / revenue x 100 |
| Operating profit margin (Appendix 9) | operating profit / revenue x 100 |
| Net profit (profit for the year) margin | profit for the year as a percentage of revenue |
| Current ratio | current assets : current liabilities, as a single number |
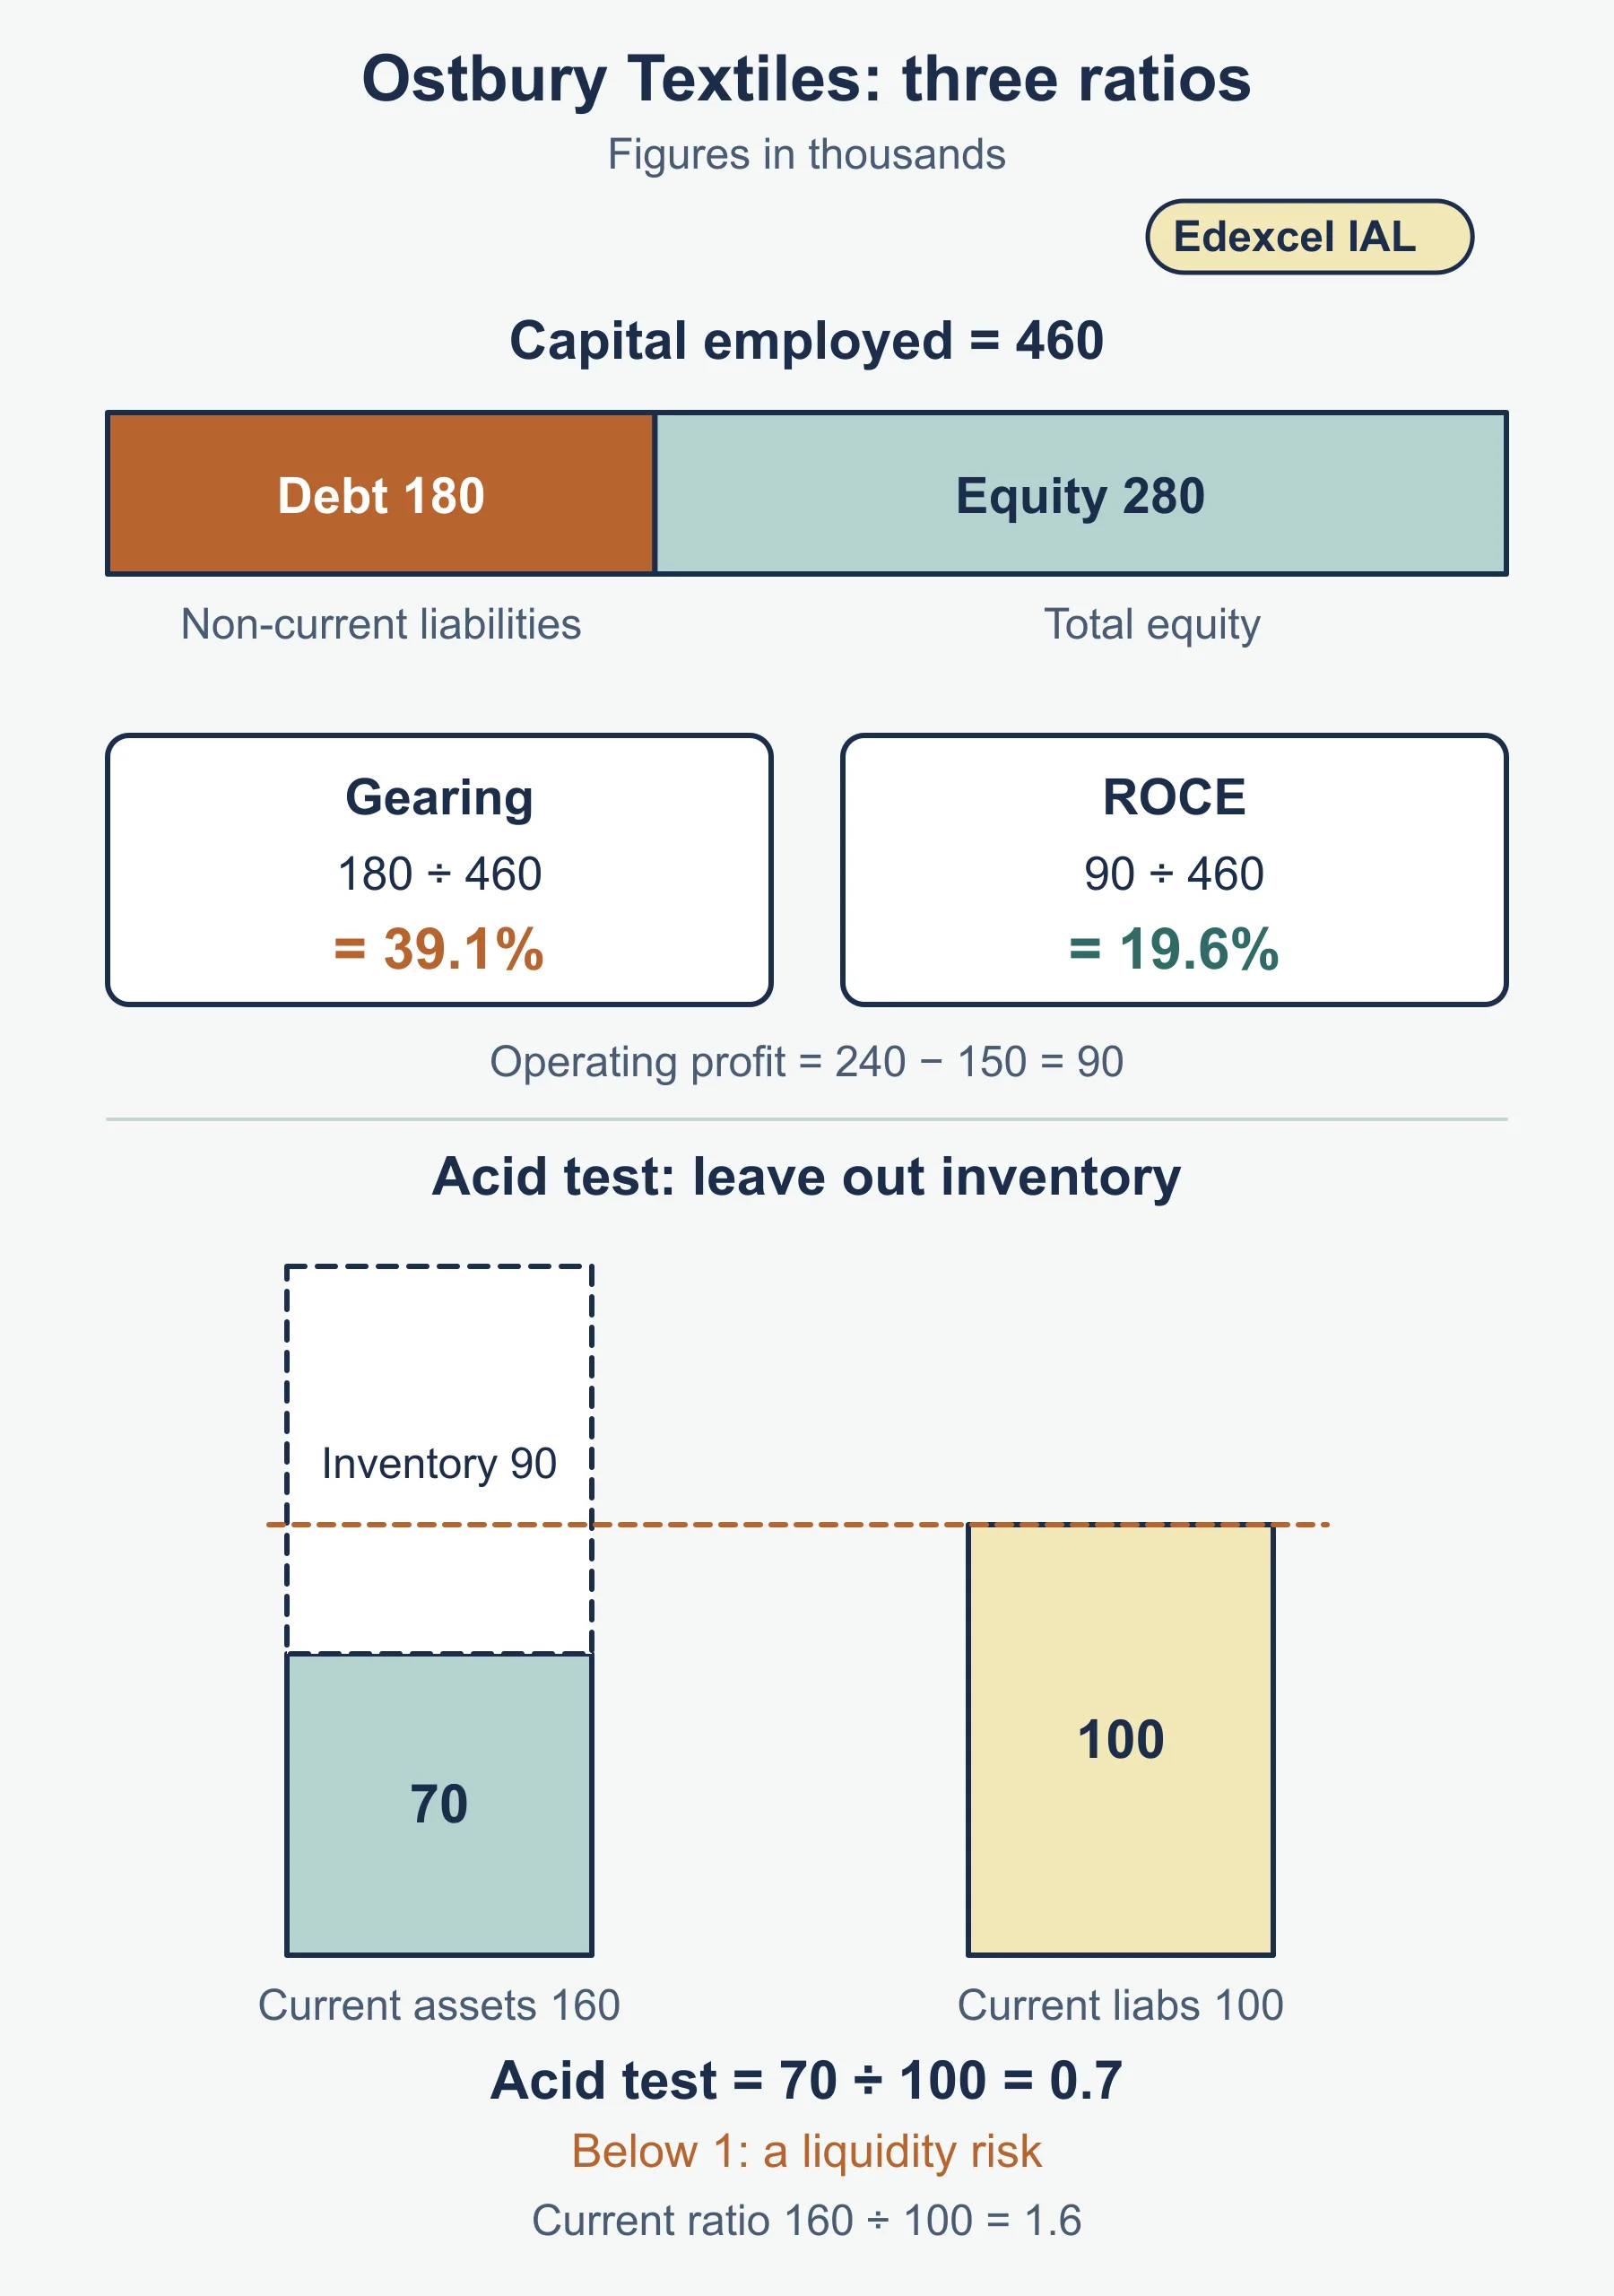
| Acid test ratio | (current assets less inventory) divided by current liabilities |
| Capital employed | non-current liabilities plus total equity |
| Gearing | long-term (non-current) liabilities over capital employed, x 100 |
| ROCE | operating profit / capital employed x 100 |
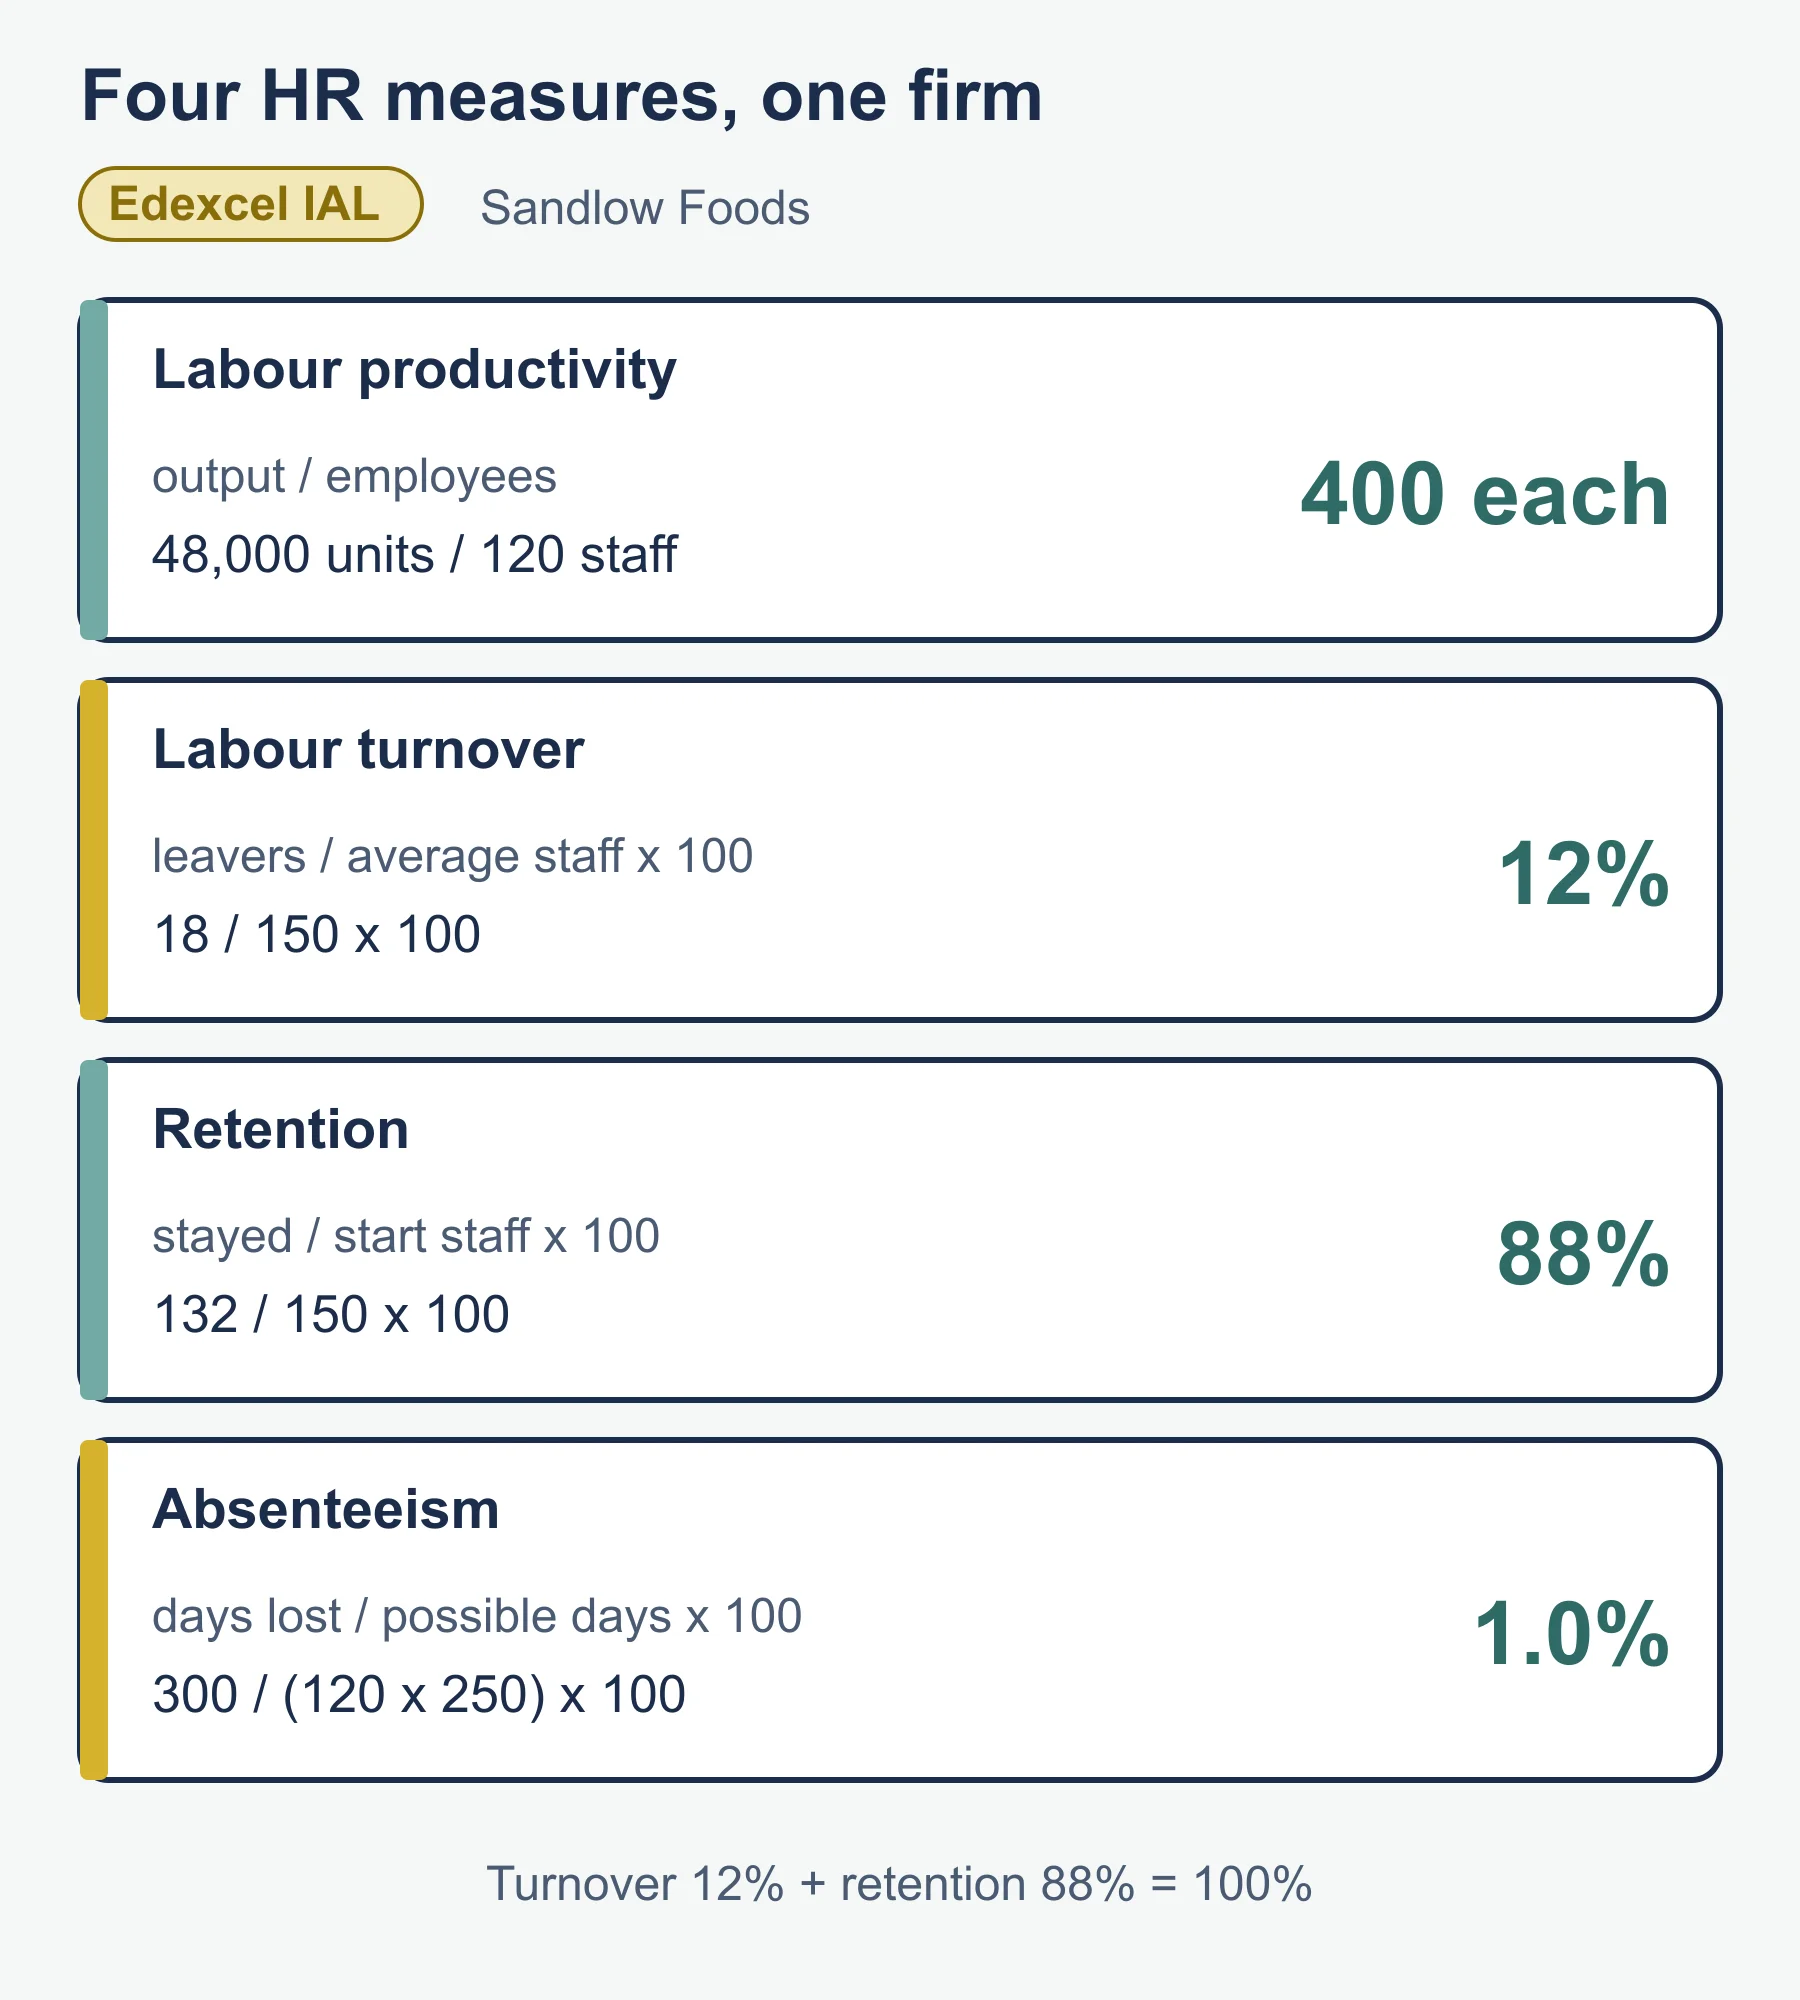
| Labour productivity (standard form) | output / number of employees |
| Labour turnover (standard form) | leavers / average employees x 100 |
| Retention (standard form) | employees who stayed / employees at start x 100 |
| Absenteeism (standard form) | days lost / possible working days x 100 |
Ratio limitations: historic, accounting policies differ, ignore non-financial factors. HR limitations: averages hide detail and causes. HR strategies: financial rewards, employee share ownership, consultation, empowerment.
3.3.6 Managing change
- Factors: culture, size of organisation, speed of change, managing resistance, transformative leadership (inspiring vision that changes attitudes).
- Risk assessment: likelihood and impact of natural disasters, IT systems failure, loss of key staff.
- Mitigation: business continuity planning; succession planning.
Small worked reminders
Centred four-quarter average. Quarterly sales: 10, 14, 12, 16, 12, 16, 14, 18. Four-quarter averages: 13, 13.5, 14, 14.5, 15. Each sits between two quarters, so average neighbouring pairs: 13.25, 13.75, 14.25, 14.75. These are the trend values for quarters 3 to 6. Quarter 3 actual 12 minus trend 13.25 gives a seasonal variation of -1.25.
Interpreting investment results. Suppose a firm needs payback within 3 years and ARR above 10%. A project with payback of 2.67 years and ARR of 12.5% meets both. A positive NPV supports going ahead, but only if the cash-flow forecasts and discount rate are sound. Say what else matters: risk, finance available, strategic fit and effects on staff.
Reading the five forces. If buyers are few and large, buyer power is high and prices are squeezed. If entry costs are low, new entrants threaten profit. If close substitutes exist, customers can switch. Recommend entering a market only when the forces leave room for profit.
Special orders. Accept an extra order only if its price exceeds variable cost per unit, there is spare capacity, and regular customers will not expect the same lower price.
Must-know distinctions
- Merger (agreed, new combined firm) versus takeover (one firm gains control).
- Internal versus external economies of scale.
- Strategic versus tactical decisions.
- Stakeholder versus shareholder model.
- Gearing (long-term debt share of capital) versus liquidity (ability to pay short-term bills).
Quick self-test
- Calculate the 3-period moving averages for 50, 56, 53, 62.
- A project costing 60,000 returns 15,000 in the first year, then 25,000, then 30,000, then 20,000. Calculate payback.
- Calculate the ARR for the same project.
- Using factors 0.909, 0.826, 0.751 and 0.683, calculate its NPV.
- A chance node gives 0.7 chance of 80 and 0.3 chance of 20 (thousands). The option costs 30. Calculate net expected value.
- An activity lasts 5 days. EST at its start node is 4 and LFT at its end node is 12. Calculate total float.
- Price 25, variable cost 16, fixed costs 3,000. Calculate profit at 500 units.
- Non-current liabilities 90,000, capital employed 300,000, operating profit 36,000 and capital employed (for ROCE) 240,000 in a separate firm. Calculate gearing for the first and ROCE for the second.
- Current assets 60, inventory 24, current liabilities 30. Calculate the acid test ratio.
- Nine of an average of 60 staff leave. Calculate labour turnover.
- State two risks that a firm may identify in contingency planning.
- Define overtrading.
Answers
- 53 and 57.
- After 2 years 40,000 recovered; 20,000 of 30,000 needed: 2.67 years.
- (90,000 - 60,000) / 4 = 7,500; 7,500 / 60,000 x 100 = 12.5%.
- 13,635 + 20,650 + 22,530 + 13,660 = 70,475; NPV = +10,475.
- 56 + 6 = 62; 62 - 30 = 32, so 32,000.
- 12 - 4 - 5 = 3 days.
- Contribution 9 x 500 = 4,500; profit 4,500 - 3,000 = 1,500.
- Gearing 30%; ROCE 15%.
- (60 - 24) / 30 = 1.2.
- 9 / 60 x 100 = 15%.
- For example natural disasters, IT systems failure, loss of key staff (any two).
- Expanding sales faster than working capital can finance, causing cash shortage.
Where marks are usually lost
- Not subtracting the initial cost in NPV, or giving the PV total as the NPV.
- Using total profit rather than average annual profit for ARR.
- Taking the smaller value forward at a merging node in CPA.
- Mixing up the denominators for gearing and ROCE: both use capital employed.
- Forgetting the cost of the option in a decision tree.
- Naming a limitation but never tying it to the business described in the source.
- Saying a ratio is good or bad with no comparison against past years, rivals or targets.
- Treating stakeholder and shareholder views as one, or leaving out a judgement in evaluative answers.
Frequently asked questions
What is Ansoff’s Matrix? Ansoff’s Matrix links products and markets: market penetration (current products, current market) carries the lowest risk, followed by product development, market development and diversification, where new products go into new markets.
What is the difference between horizontal and vertical integration? Horizontal integration joins two firms at the same stage of the same industry, such as two coach operators. Vertical integration joins a firm with a supplier (backward) or with a business closer to the customer (forward).
How do you find the critical path in Edexcel IAL Business? Work forwards to find the earliest start times, taking the larger value where paths join, then backwards for the latest finish times, taking the smaller. Activities with zero total float lie on the critical path.
How do you calculate labour turnover? Labour turnover (%) is the number of leavers in the period divided by the average number of employees, multiplied by 100. For example, 18 leavers from 150 staff is 12%.
Official syllabus
Pearson Edexcel International Advanced Subsidiary/Advanced Level in Business (YBS11), Specification, Issue 1, September 2017, Unit 3, published by Pearson Education Limited.
Get free revision emails (optional)
Occasional emails with practice questions, worked explanations and links to free resources for the qualification and subjects you choose. No spam, and you can unsubscribe from any email. The free tools on this site never need an email.
Related resources
-
Study guides
Edexcel International A Level Business: Business decisions and strategy (YBS11)
Study guide to every section of Unit 3 Business decisions and strategy in Pearson Edexcel International A Level Business, with worked examples.
Business · Pearson Edexcel · A Level
Read guide -
Practice questions
Edexcel International A Level Business: Business decisions and strategy (YBS11) – Practice Questions
Original practice questions with worked answers for Unit 3 Business decisions and strategy in Edexcel International A Level Business.
Business · Pearson Edexcel · A Level
Try questions -
Exam preparation
Edexcel International A Level Business: Source-Booklet Technique Across Four Units
How Edexcel IAL Business (YBS11) exam structure changes from the AS units to the A2 units, why source booklets drive every answer, and a 20-mark essay routine.
Business · Pearson Edexcel · A Level
Read guide
Related articles
-
teaching
A Level tuition in Dubai: Cambridge or Pearson Edexcel International A Level?
Schools in Dubai and Abu Dhabi teach either Cambridge International AS & A Level or Pearson Edexcel International A Level. How the two are structured, why it matters for tuition, and how online classes from Lahore work.
9 October 2026
-
curriculum guides
Choosing subjects at IGCSE and A Level
How subject choices at 14 and 16 affect university options later, and how to keep pathways open without overloading a timetable.
28 July 2026
Studying this with a teacher
Working through Business A LEVEL?
This page is free and stays free. If you would rather be taught it, Marlbridge runs Business classes one-to-one and in small groups of up to 15, online in your own time zone. The first trial class is free. WhatsApp replies within an hour (8am–11pm Pakistan time, every day); email the same day.
Pearson Edexcel Business teachers at Marlbridge

