Revision Notes
Cambridge O Level Mathematics: Probability (4024) – Revision Notes
Condensed revision notes for all of Probability in Cambridge O Level Mathematics 4024: formulas, methods, a quick self-test and common lost marks.
- Subject
- Mathematics
- Level
- O LEVELS
- Topic
- Probability
- Author
- Marlbridge Academic Team
- Updated
- Reviewed by
- Sajawal Zahid (what this means)
Aligned to Cambridge O Level Mathematics (4024), 2025-2027. Official specification .
Syllabus page (what it covers and how it is assessed): Cambridge O Level Mathematics.
Syllabus points this page covers
4024
- 8 Probability (whole topic)
Found an error? Report a correction.
Need help with this topic? Request a free trial class for O Level Mathematics (4024).
These revision notes are aligned to the Cambridge O Level Mathematics (Syllabus D) 4024 syllabus for examination in 2025, 2026 and 2027, and cover topic 8, Probability, sections 8.1 to 8.3. The syllabus is not tiered. For full explanations and worked examples, read the study guide first, then test yourself on the practice questions. Track progress with the course hub, the printable checklist and the free 10-minute diagnostics.
Key facts and formulas
| Idea | Rule |
|---|---|
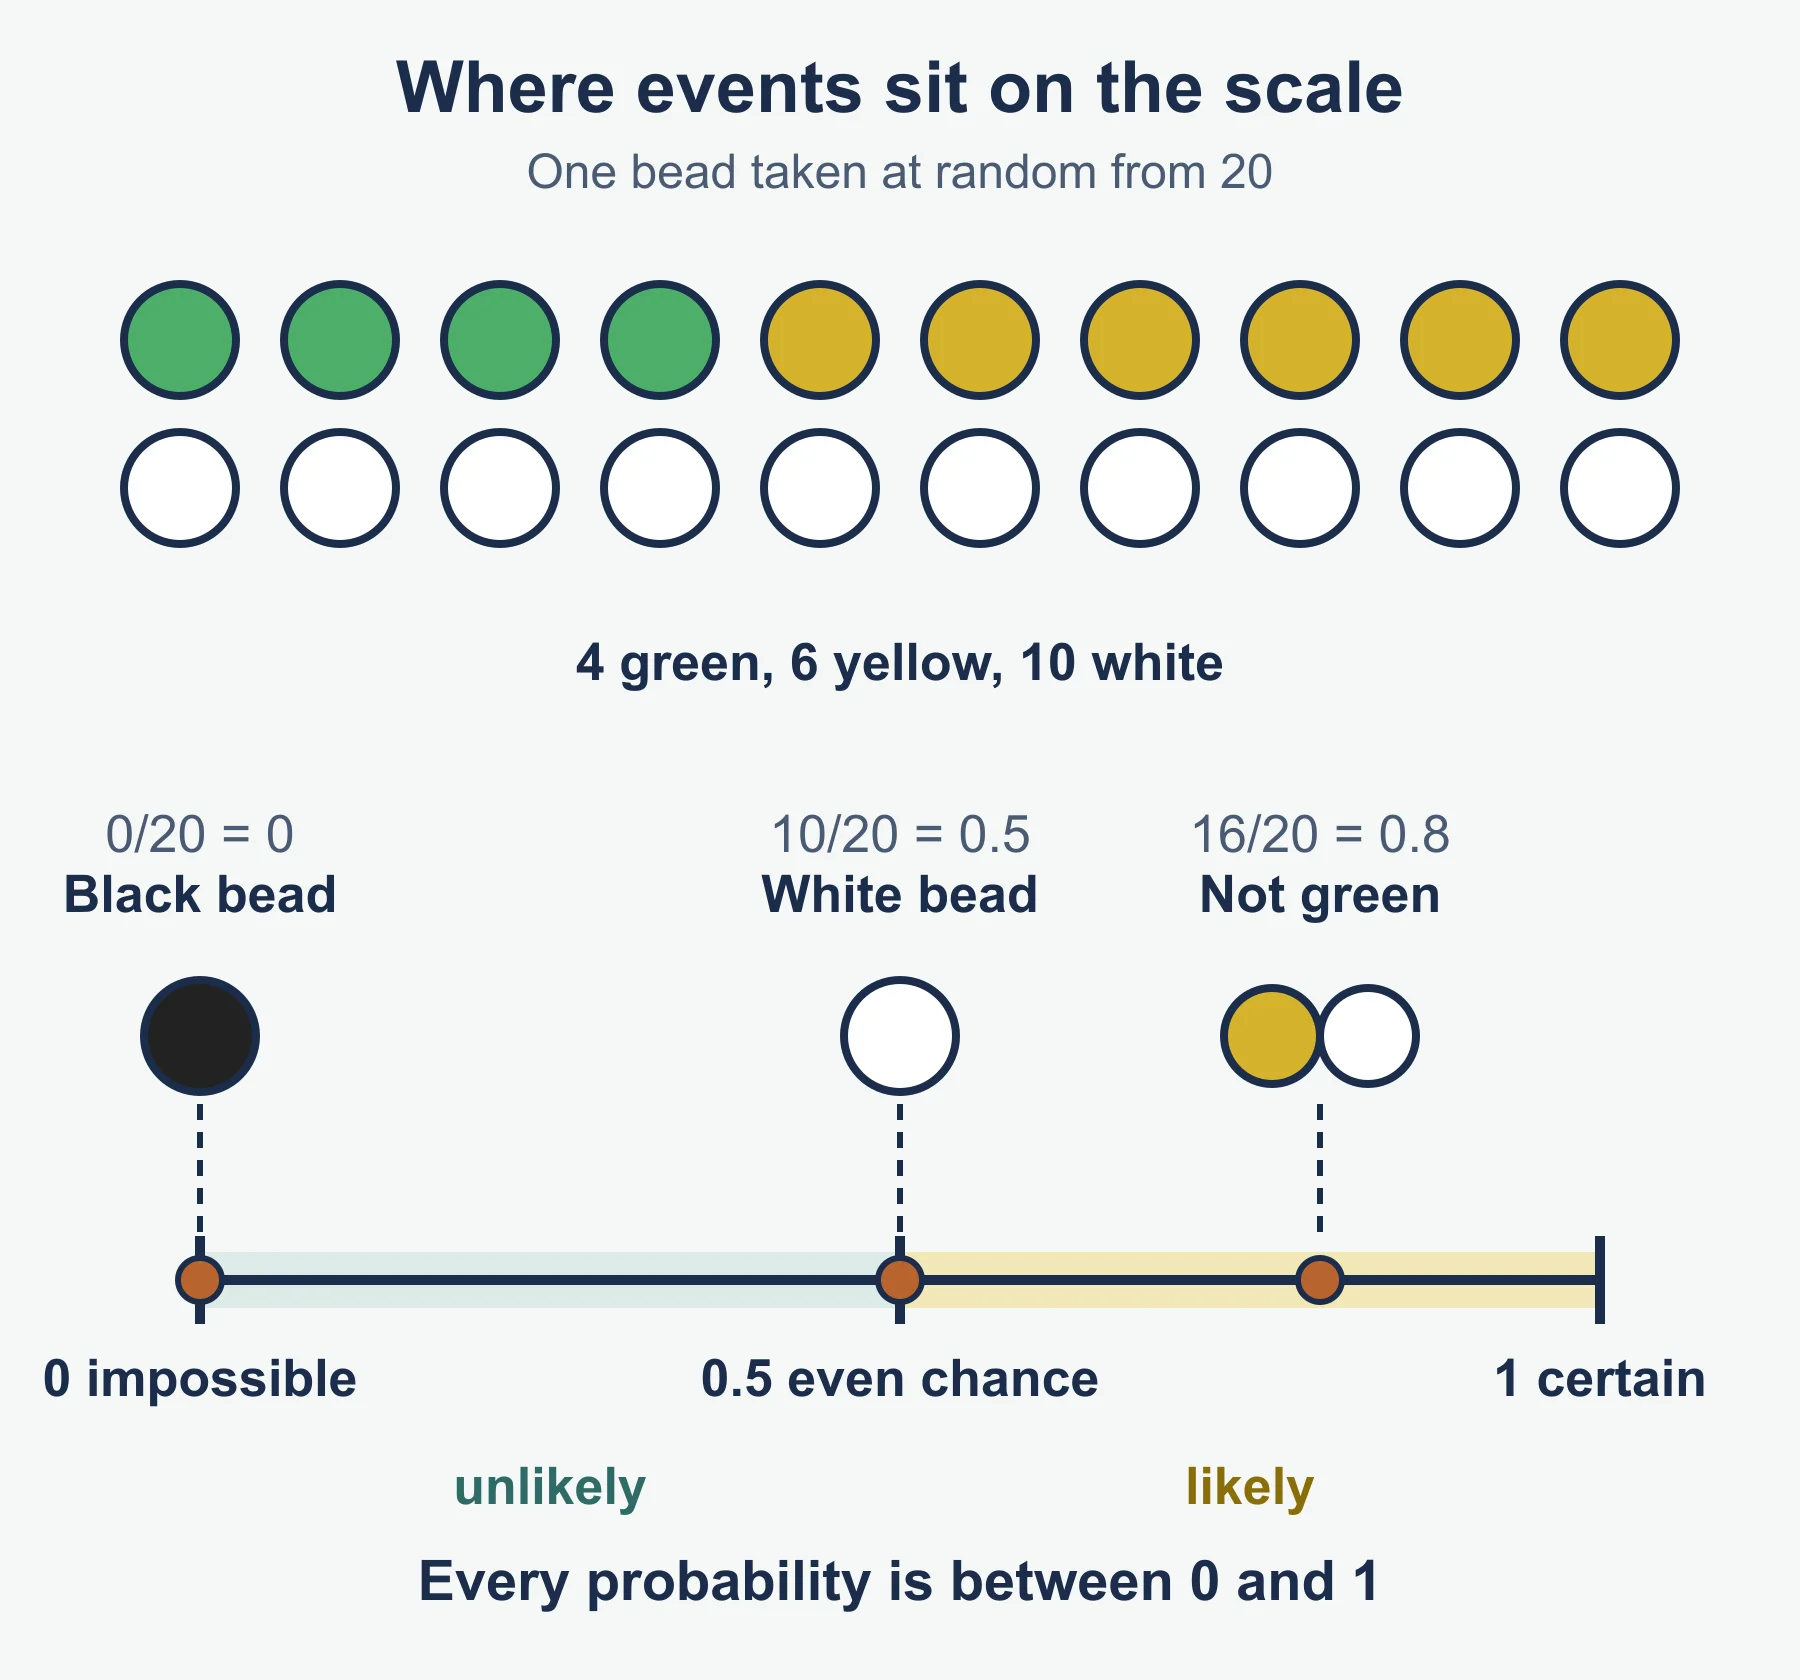
| Scale | 0 is impossible, 1 is certain, all probabilities lie between 0 and 1 |
| Notation | P(A) is the probability of A, P(A′) is the probability of not A |
| Equally likely outcomes | P(A) = favourable outcomes / total outcomes |
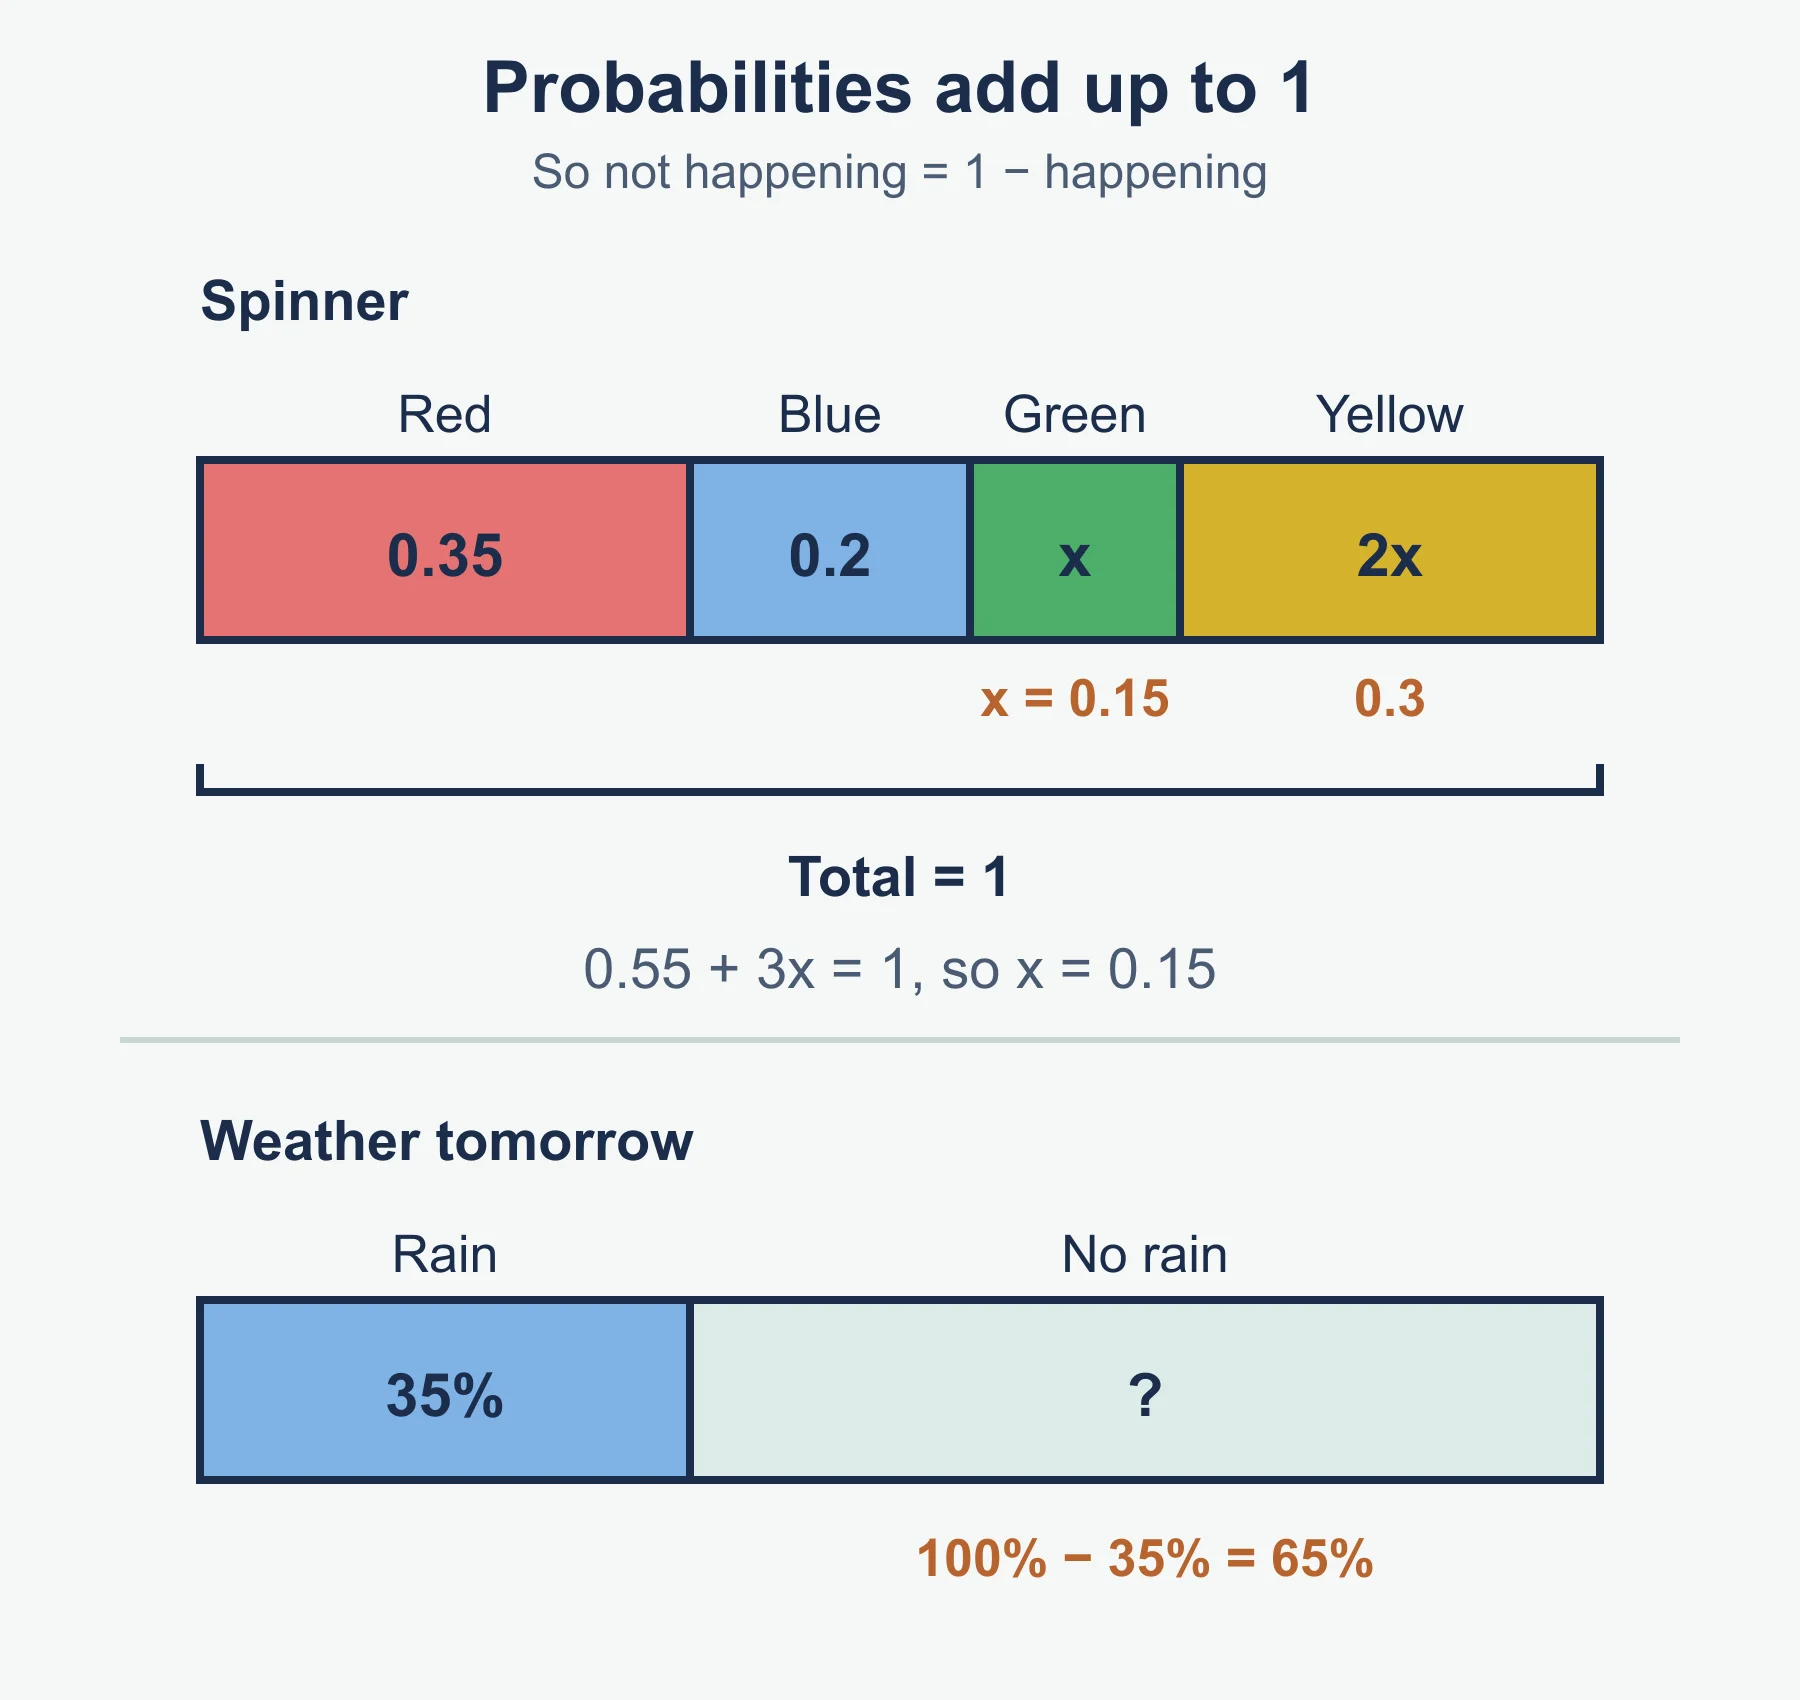
| Complement | P(A′) = 1 − P(A) |
| Relative frequency | times it happened / number of trials |
| Expected frequency | probability × number of trials (or population) |
| Venn notation | P(A ∩ B) is “A and B”, P(A ∪ B) is “A or B or both” |
| Venn count | n(A ∪ B) = n(A) + n(B) − n(A ∩ B) |
| Tree diagram | multiply along branches, add between paths |
| Check | all outcome probabilities add up to 1 |
Give answers as a fraction, decimal or percentage, which the syllabus accepts equally. Fractions are exact, so keep them unless the question asks for a decimal.
8.1 Introduction to probability
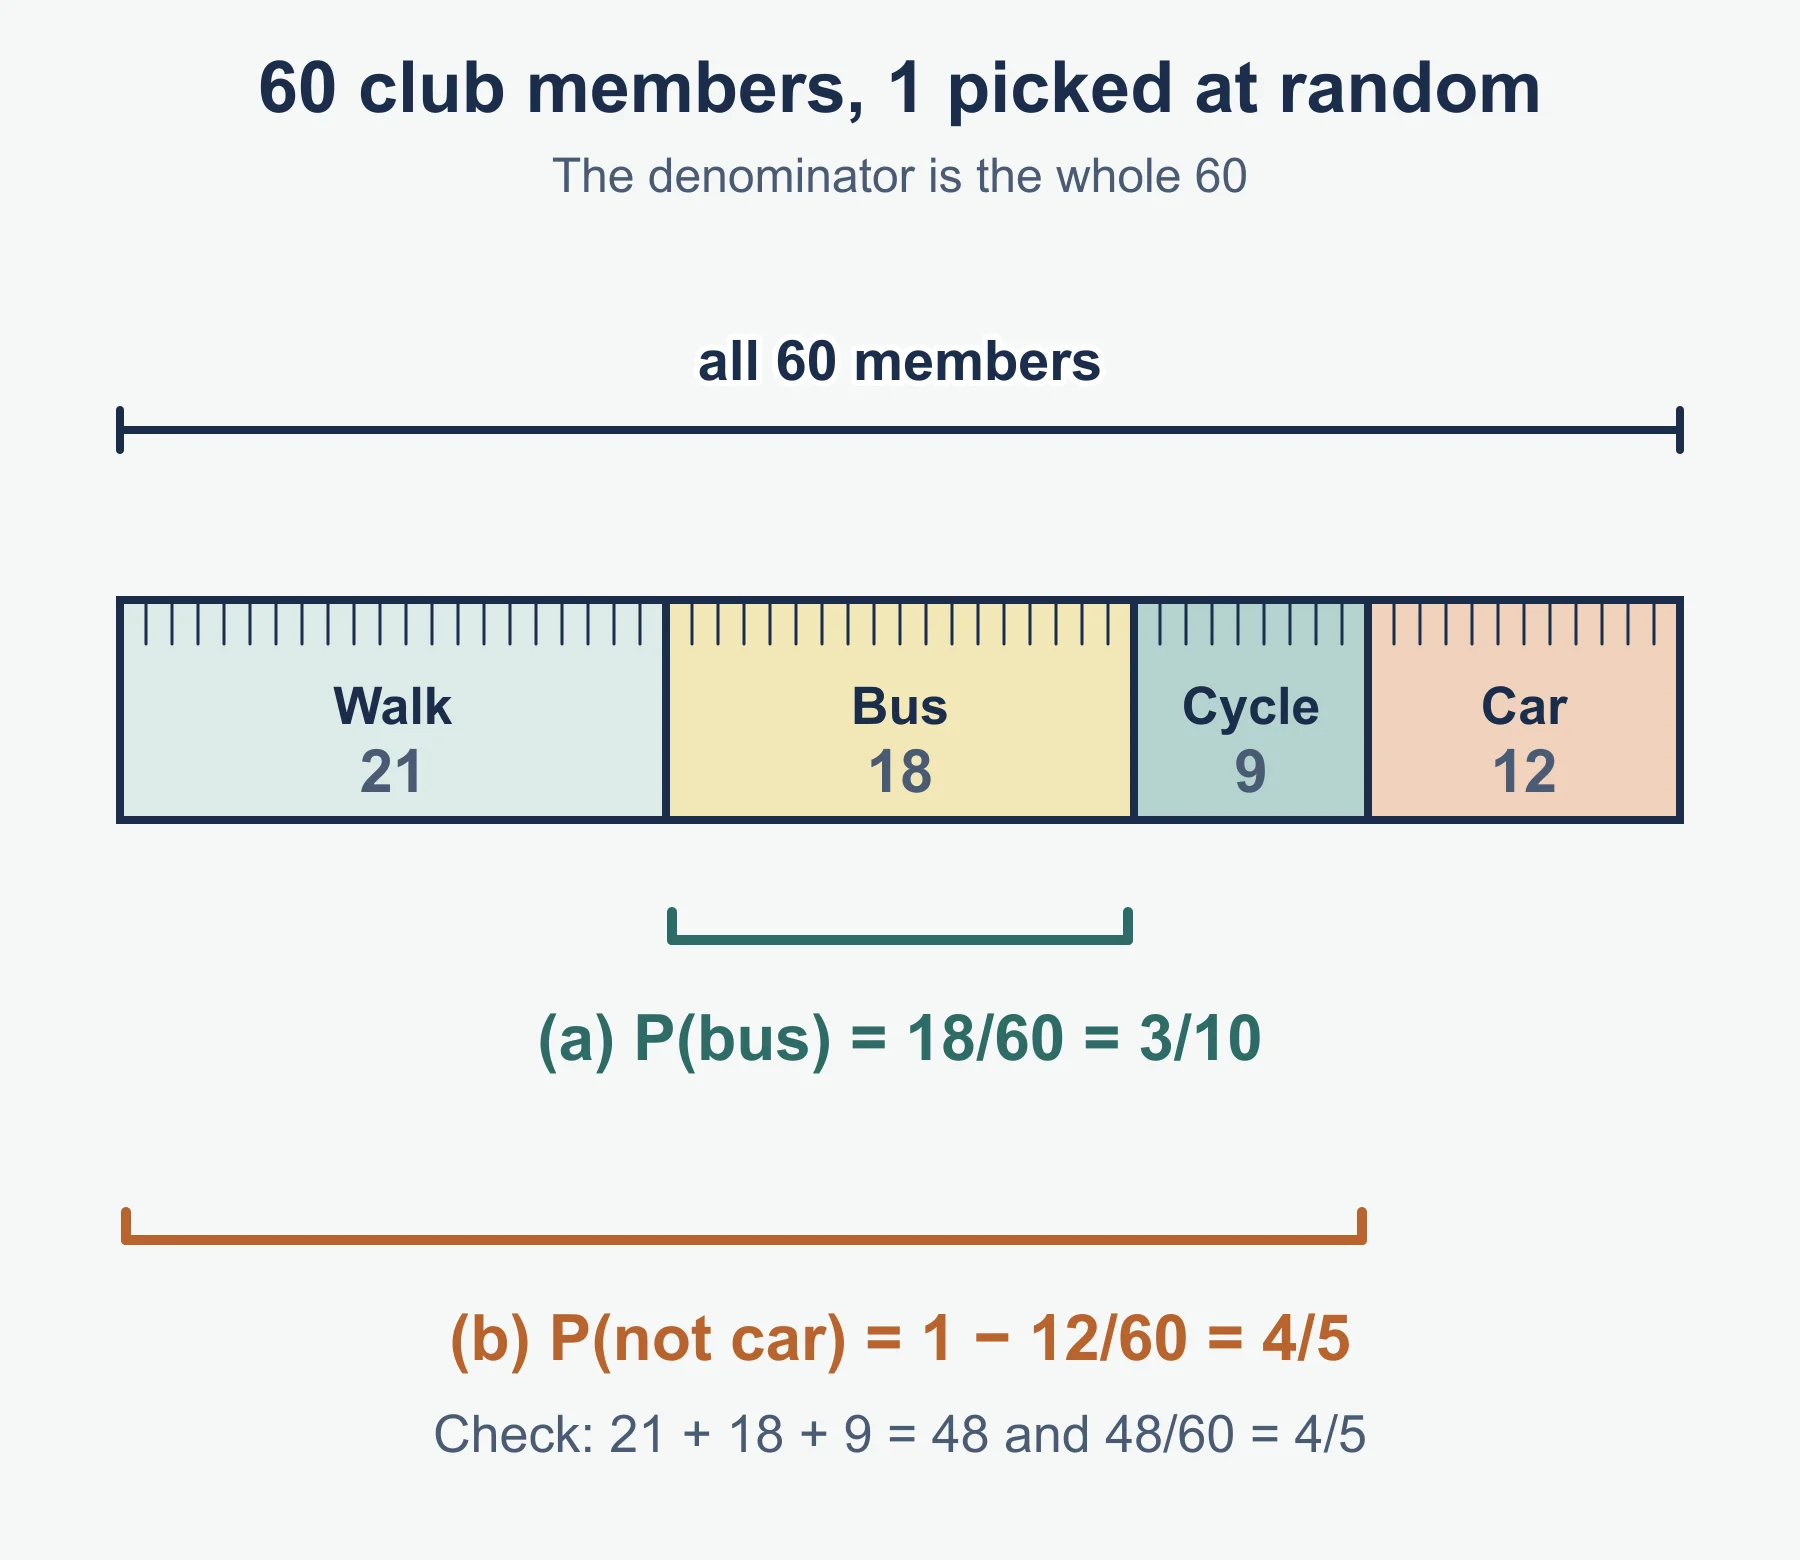
- Start with the total. Write the denominator first, then count the favourable outcomes.
- For tables and graphs, add up the whole table for the denominator. For Venn diagrams, the total includes the region outside the circles.
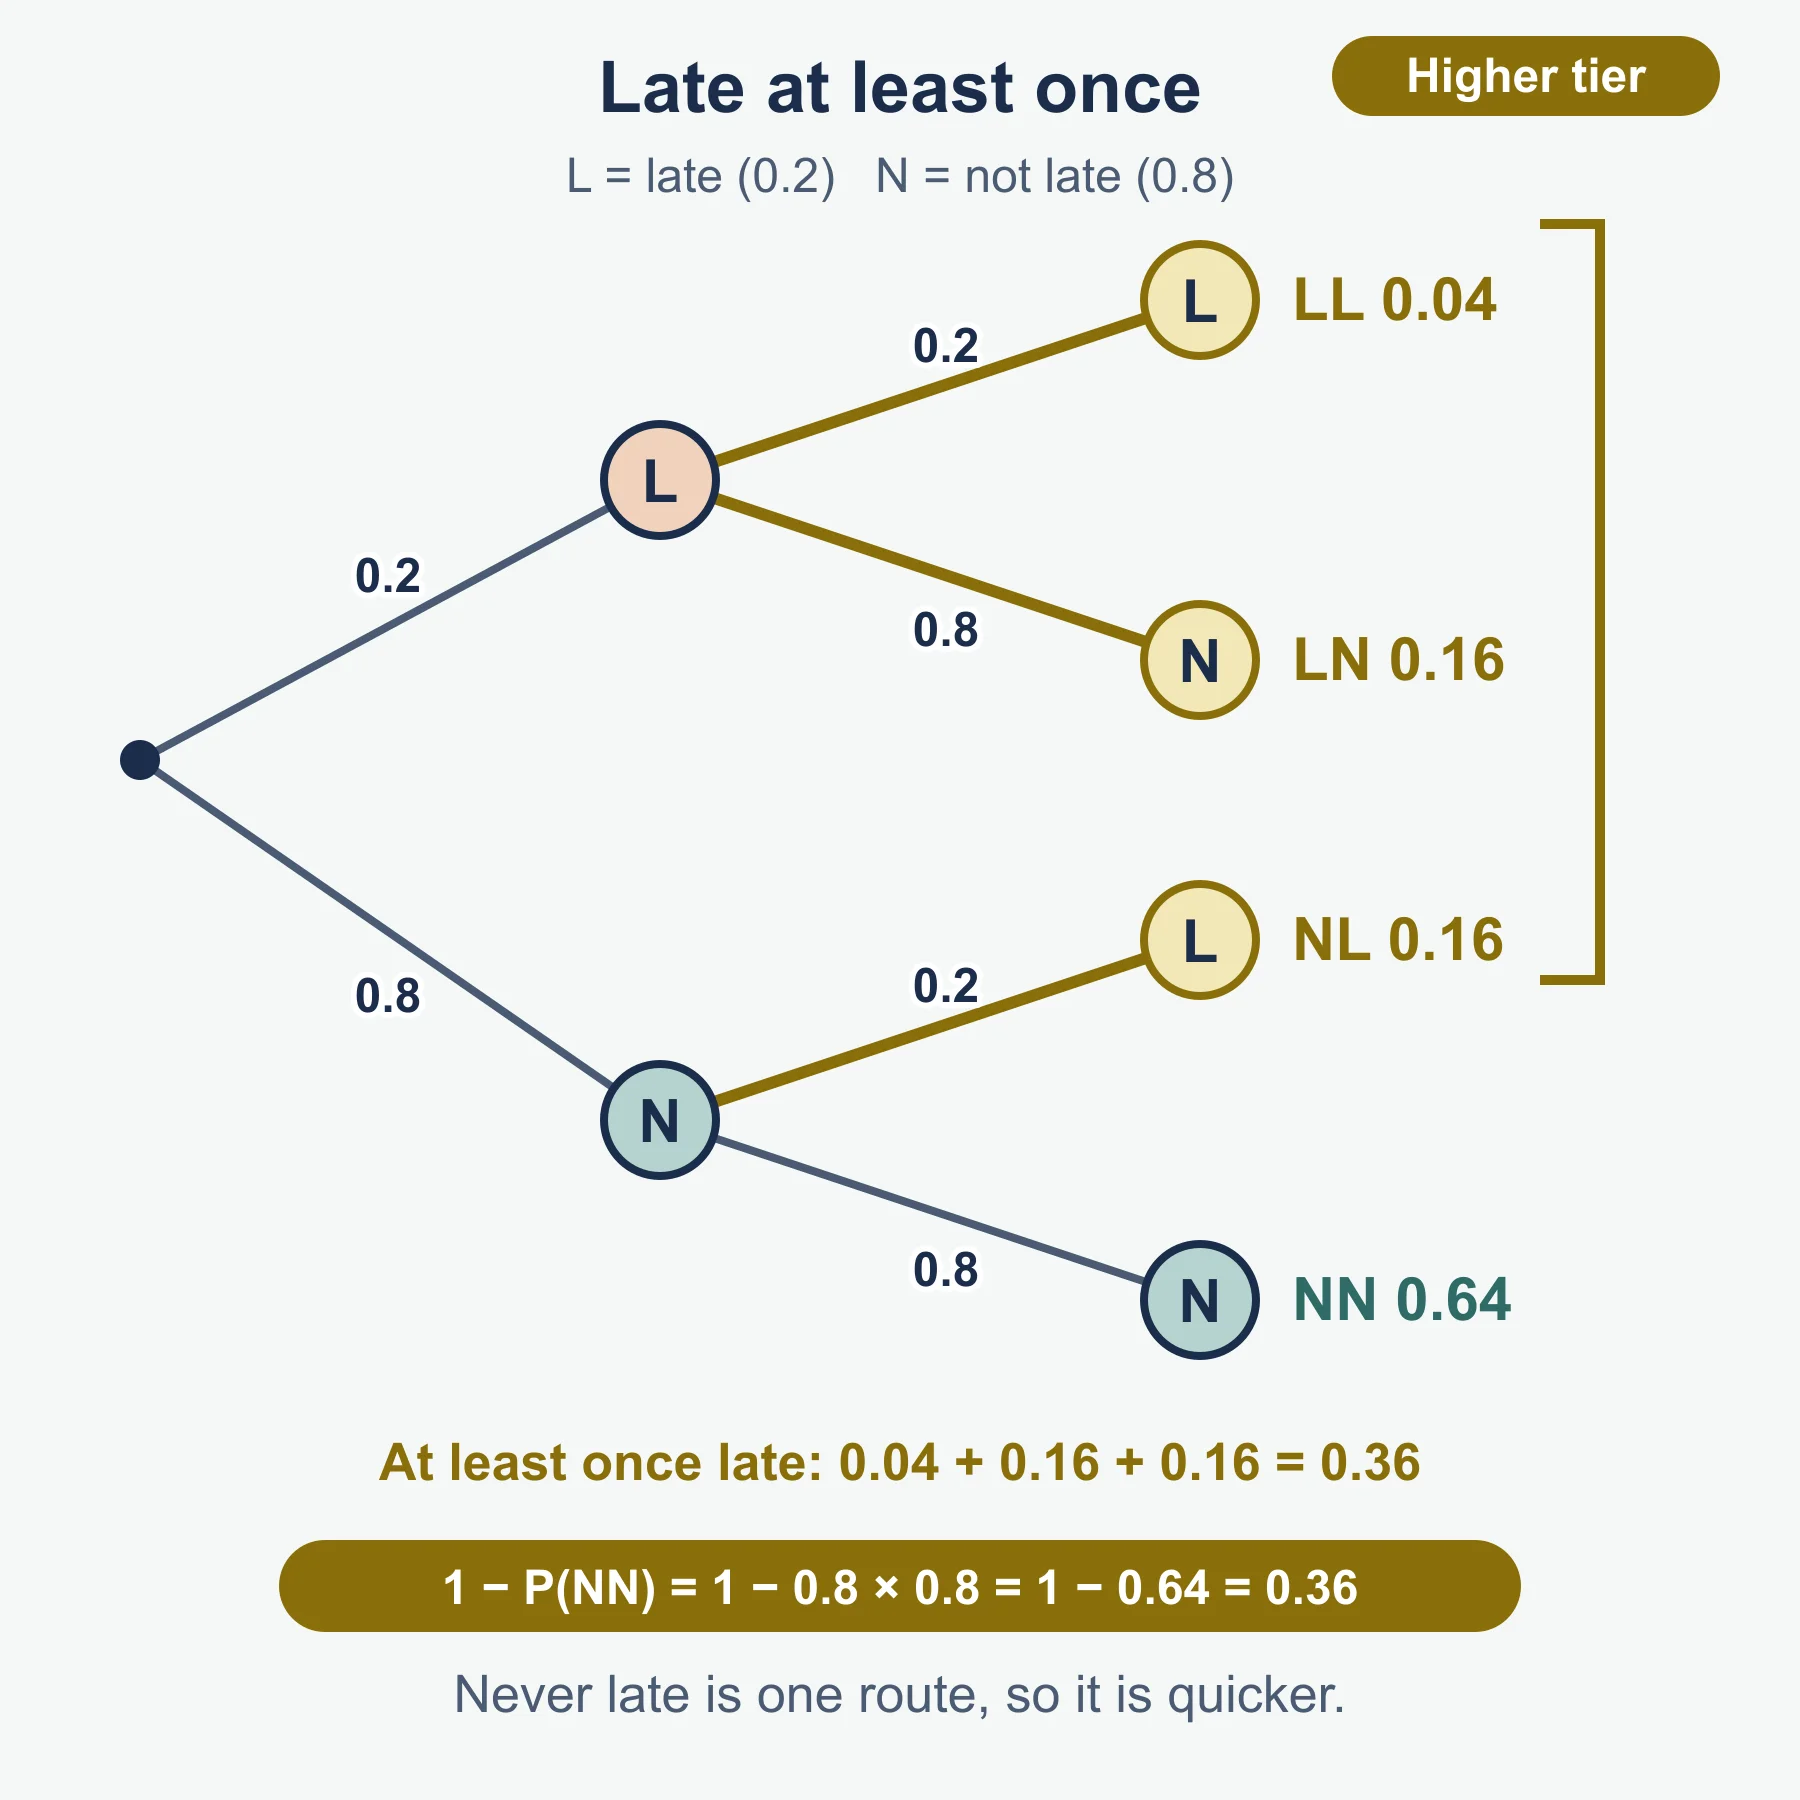
- Use the complement when the question says “not” or “at least one”.
Method for “at least one” in steps:
- Write the opposite event (“none”).
- Find the probability of “none”.
- Subtract from 1.
Quick reminder. A bag holds 20 cards, and 3 are blue. P(blue) = 3/20 = 0.15 = 15%. P(not blue) = 1 − 0.15 = 0.85, which is 17/20.
8.2 Relative and expected frequencies
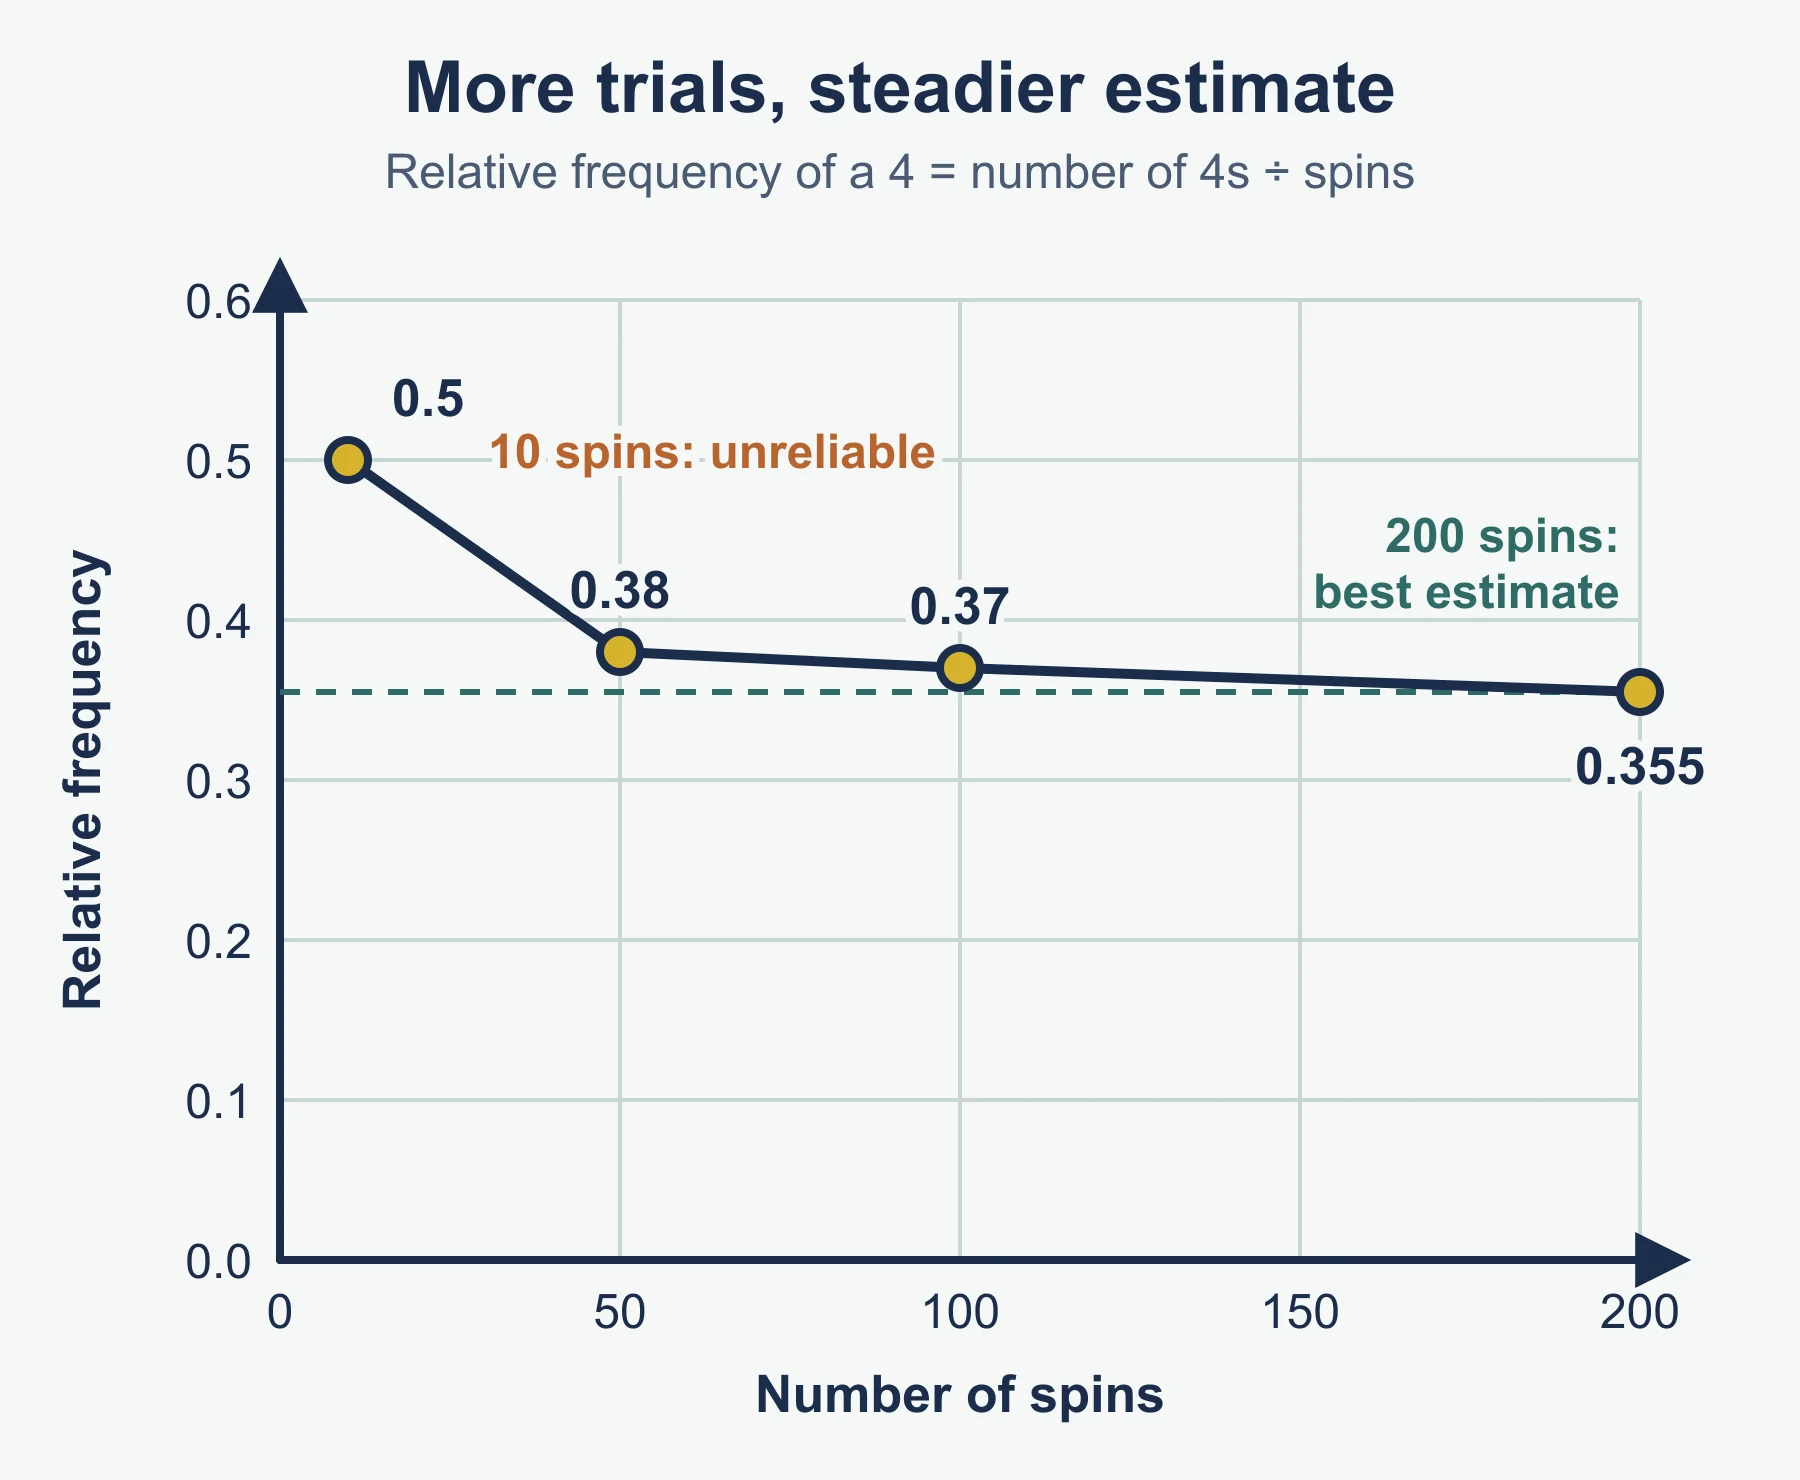
- Relative frequency is an estimate. It improves as the number of trials grows.
- The relative frequencies for all outcomes add up to 1.
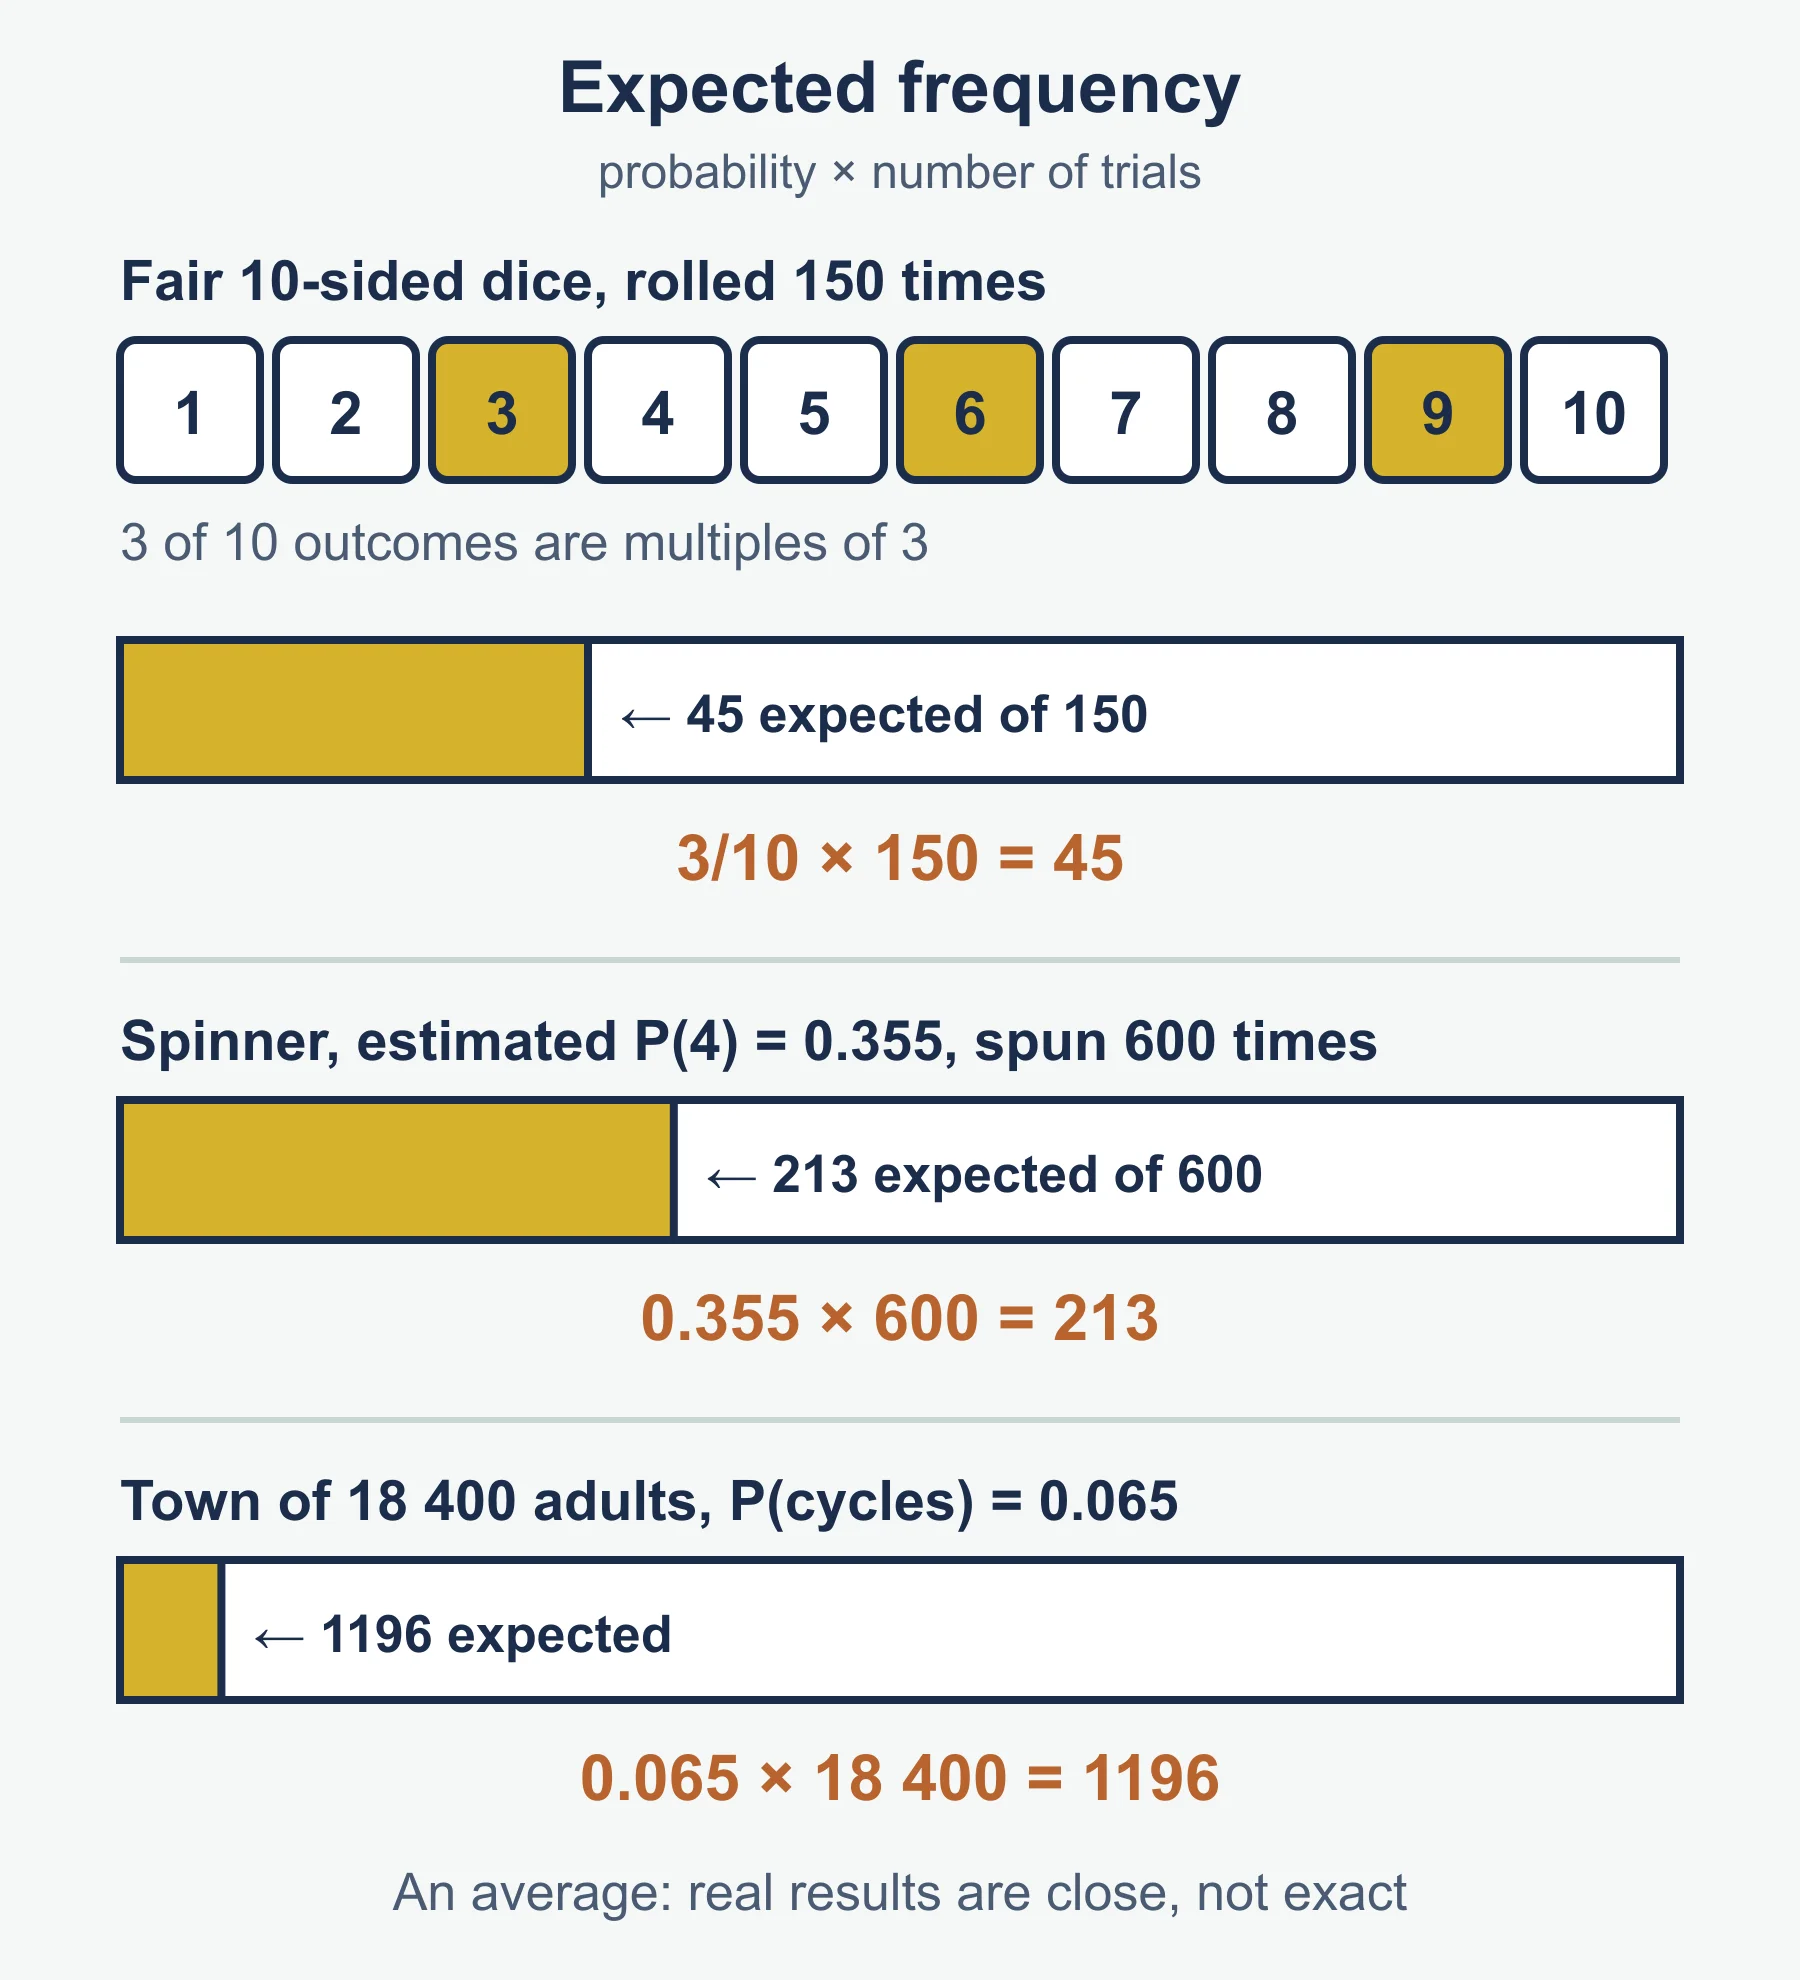
- To estimate how many times something will happen, multiply the probability by the number of trials.
Method for expected frequency in steps:
- Find the probability, either from symmetry or from relative frequency.
- Multiply by the number of trials or the size of the population.
- Say the answer is an expectation, and round sensibly if it is a count of people or objects.
Quick reminder. In 120 trials a drawing pin lands point up 36 times. Relative frequency = 36/120 = 0.3. In 1500 more trials, expect 0.3 × 1500 = 450 to land point up.
Fair, biased, random
| Word | Meaning |
|---|---|
| Fair | All outcomes are equally likely |
| Biased | Outcomes are not equally likely, some are favoured |
| Random | Chosen so each item has a chance and the choice cannot be predicted |
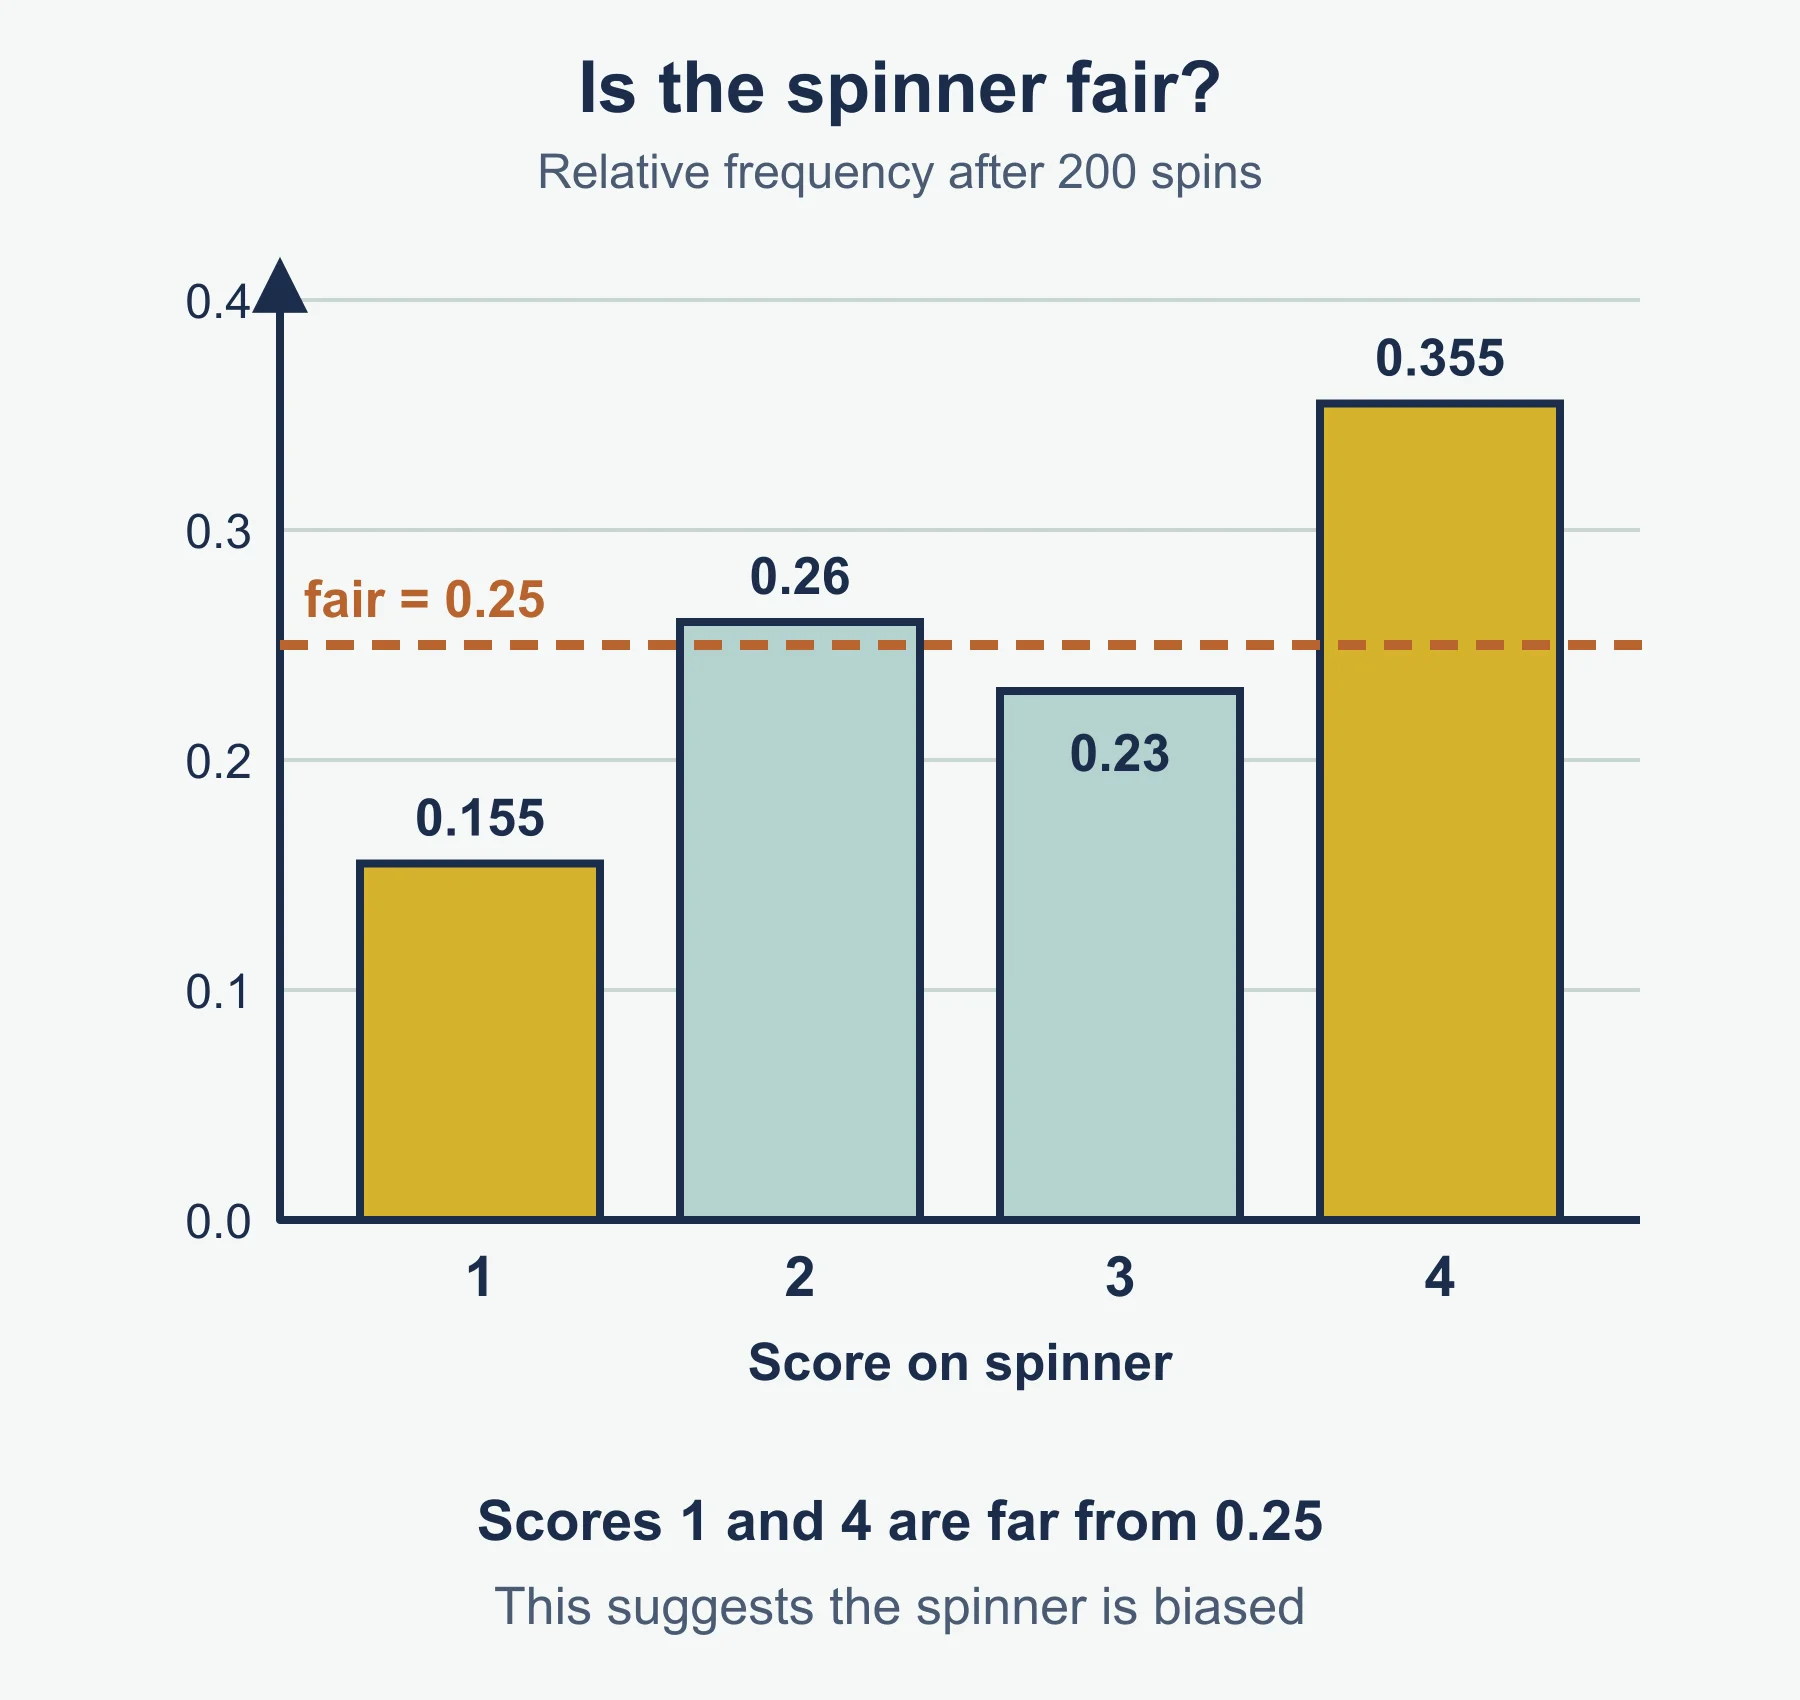
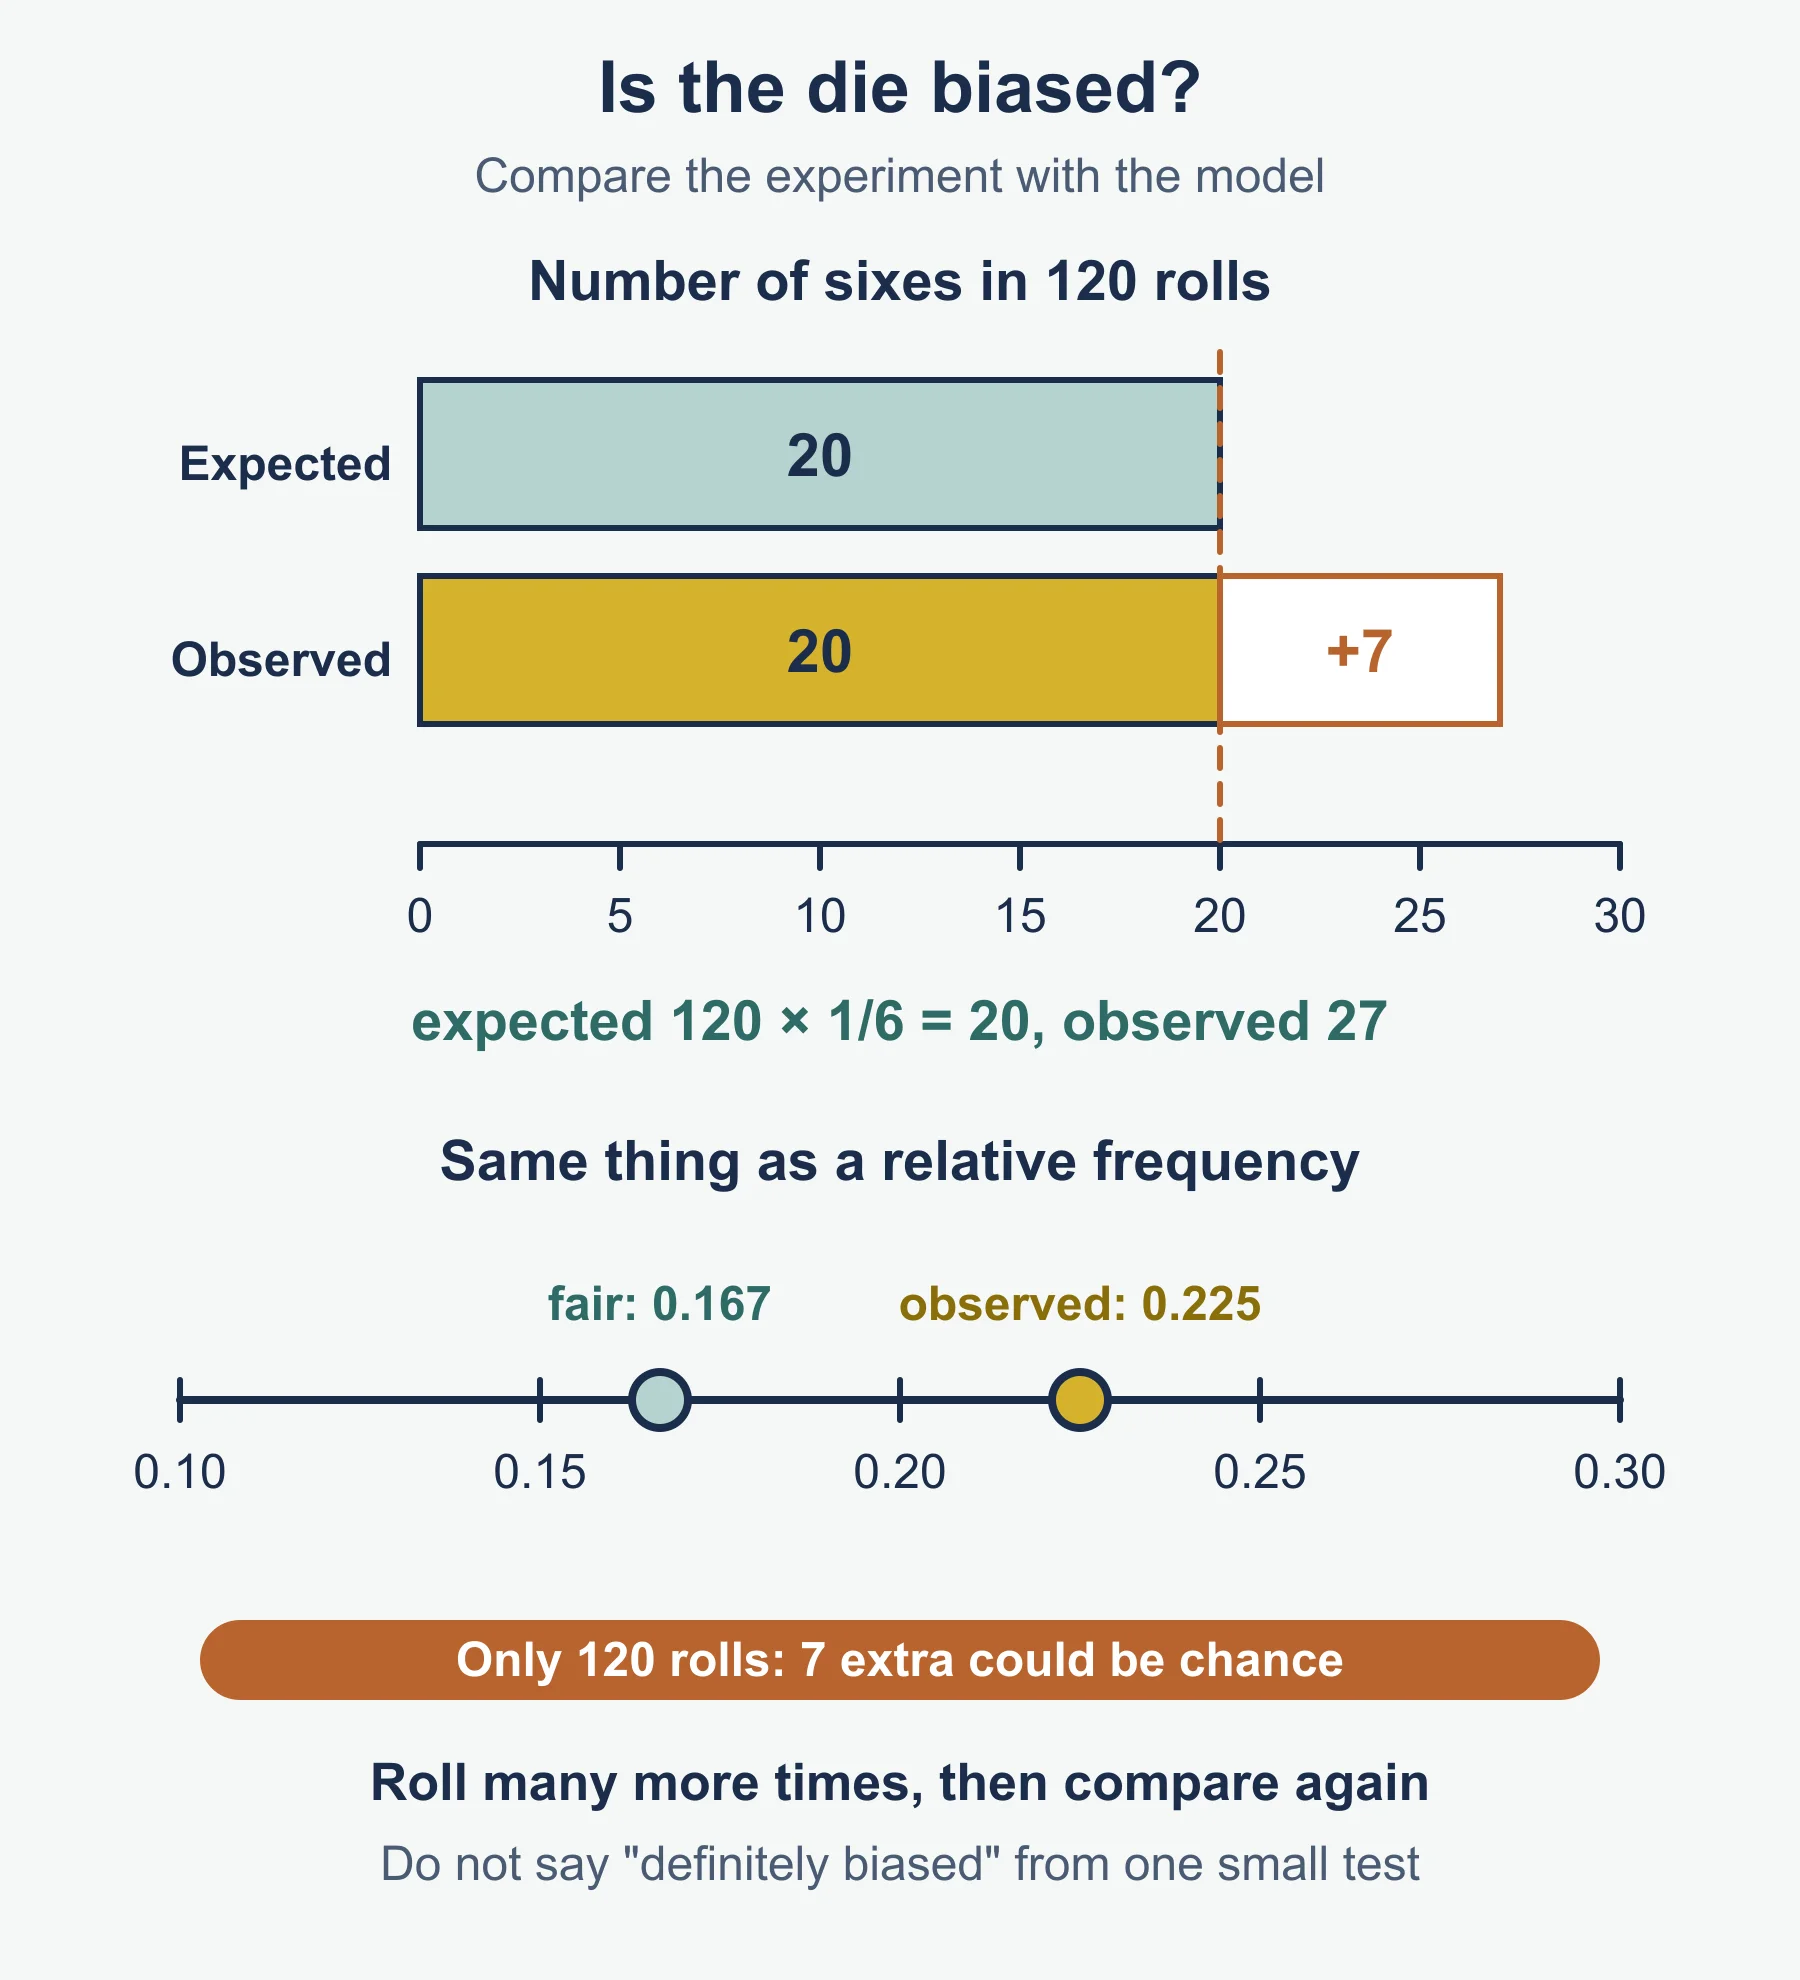
To argue a die is biased, compare each relative frequency with 1/6 and use numbers. More trials give a more convincing argument.
8.3 Combined events
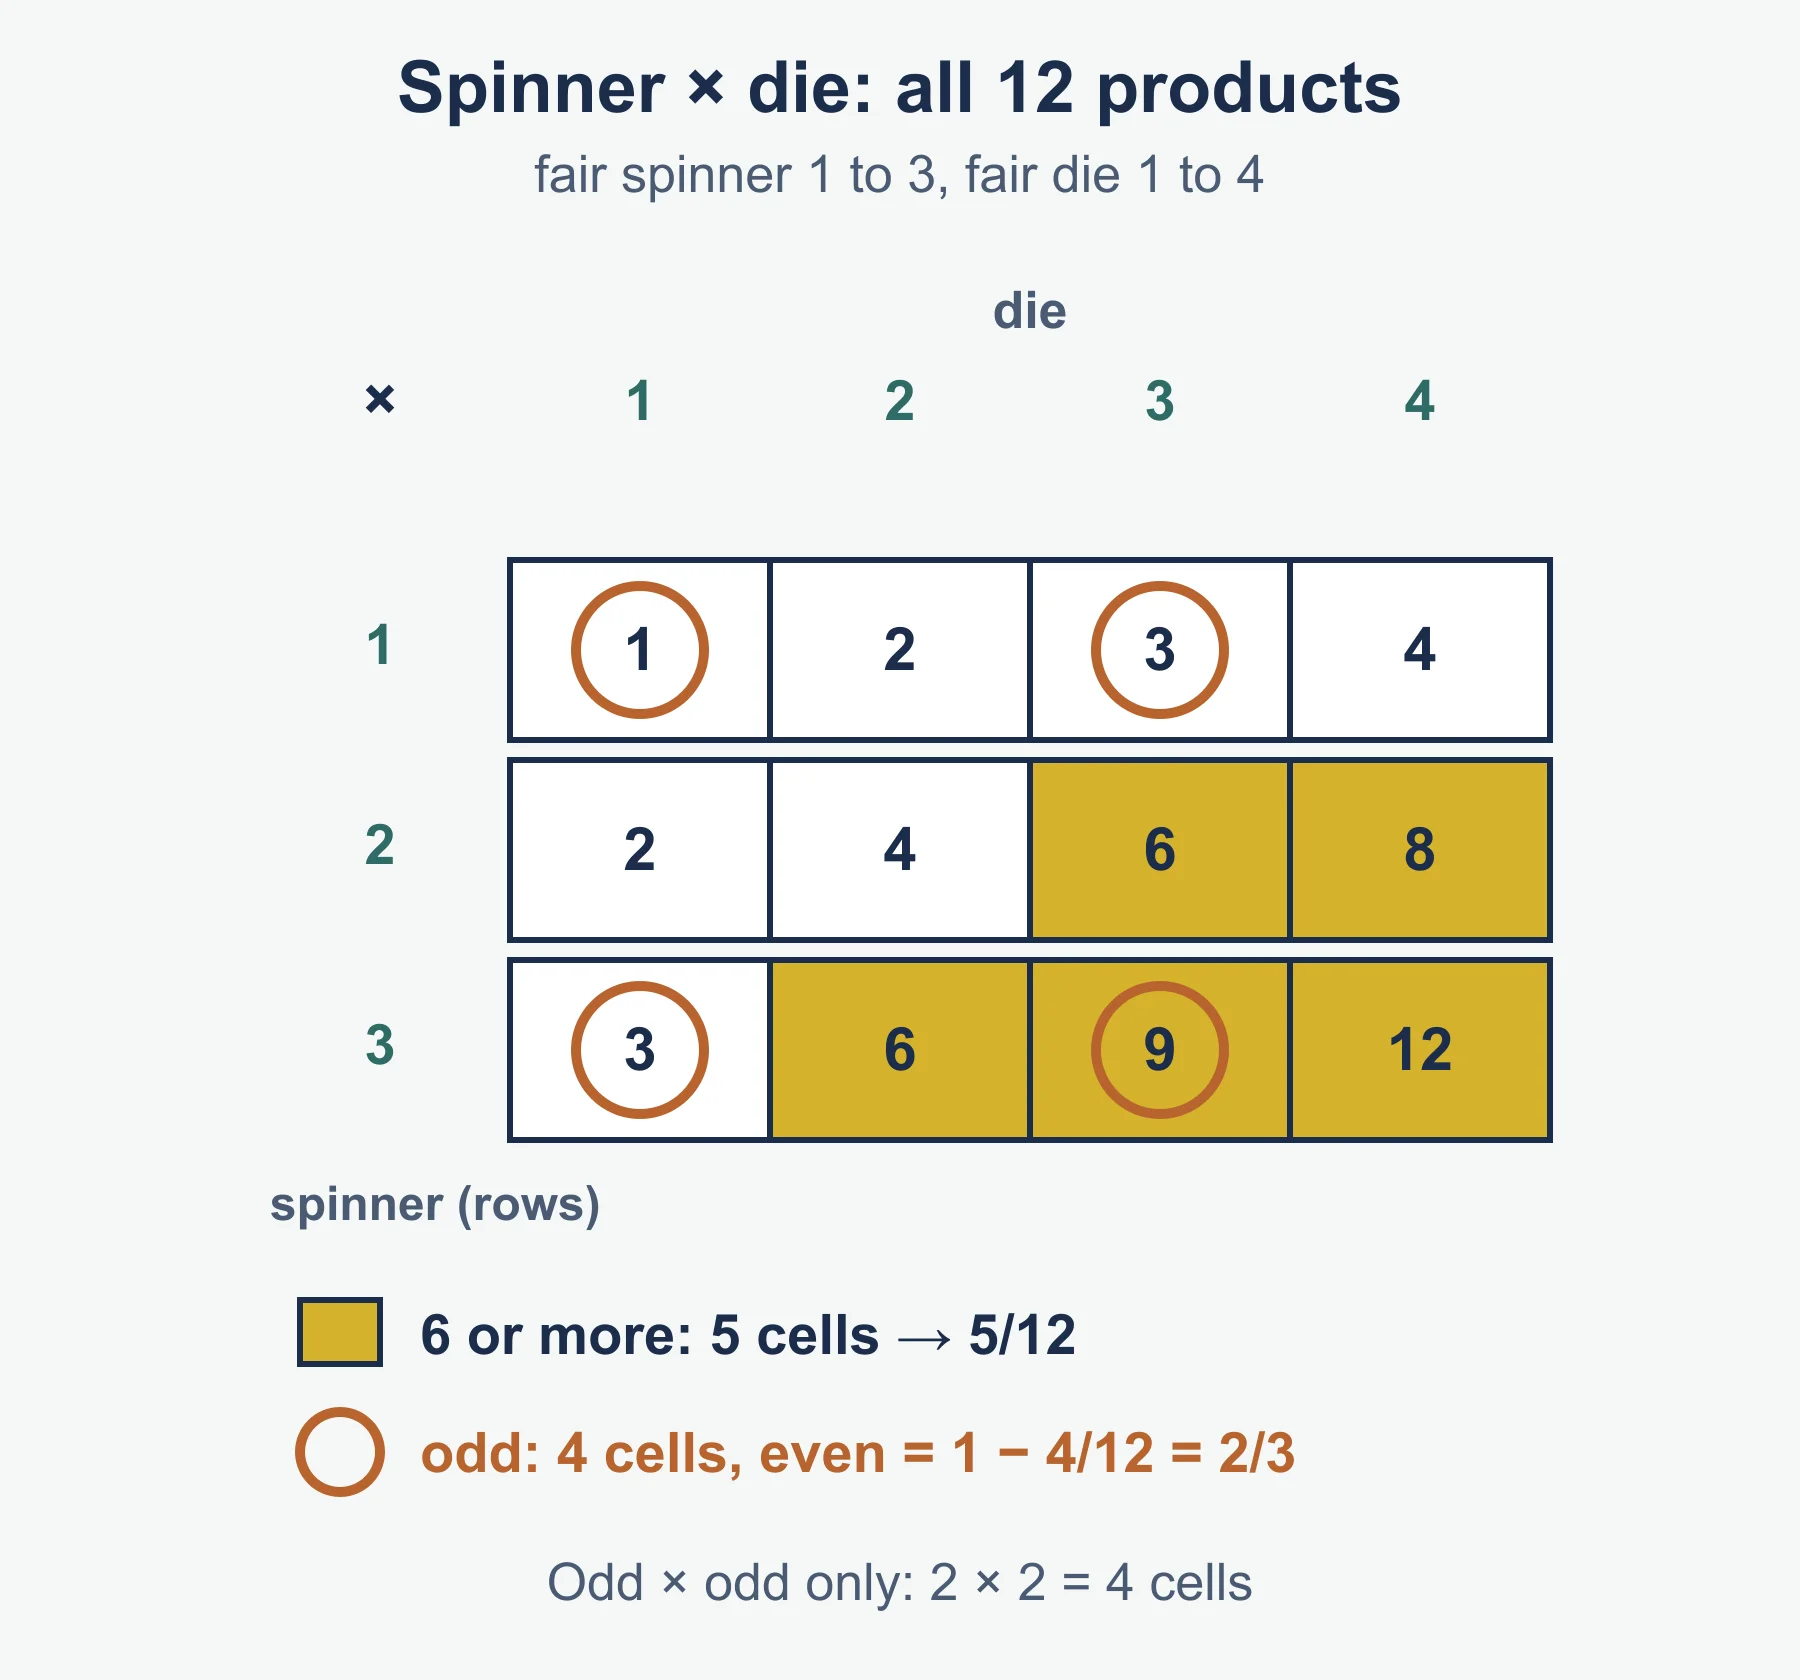
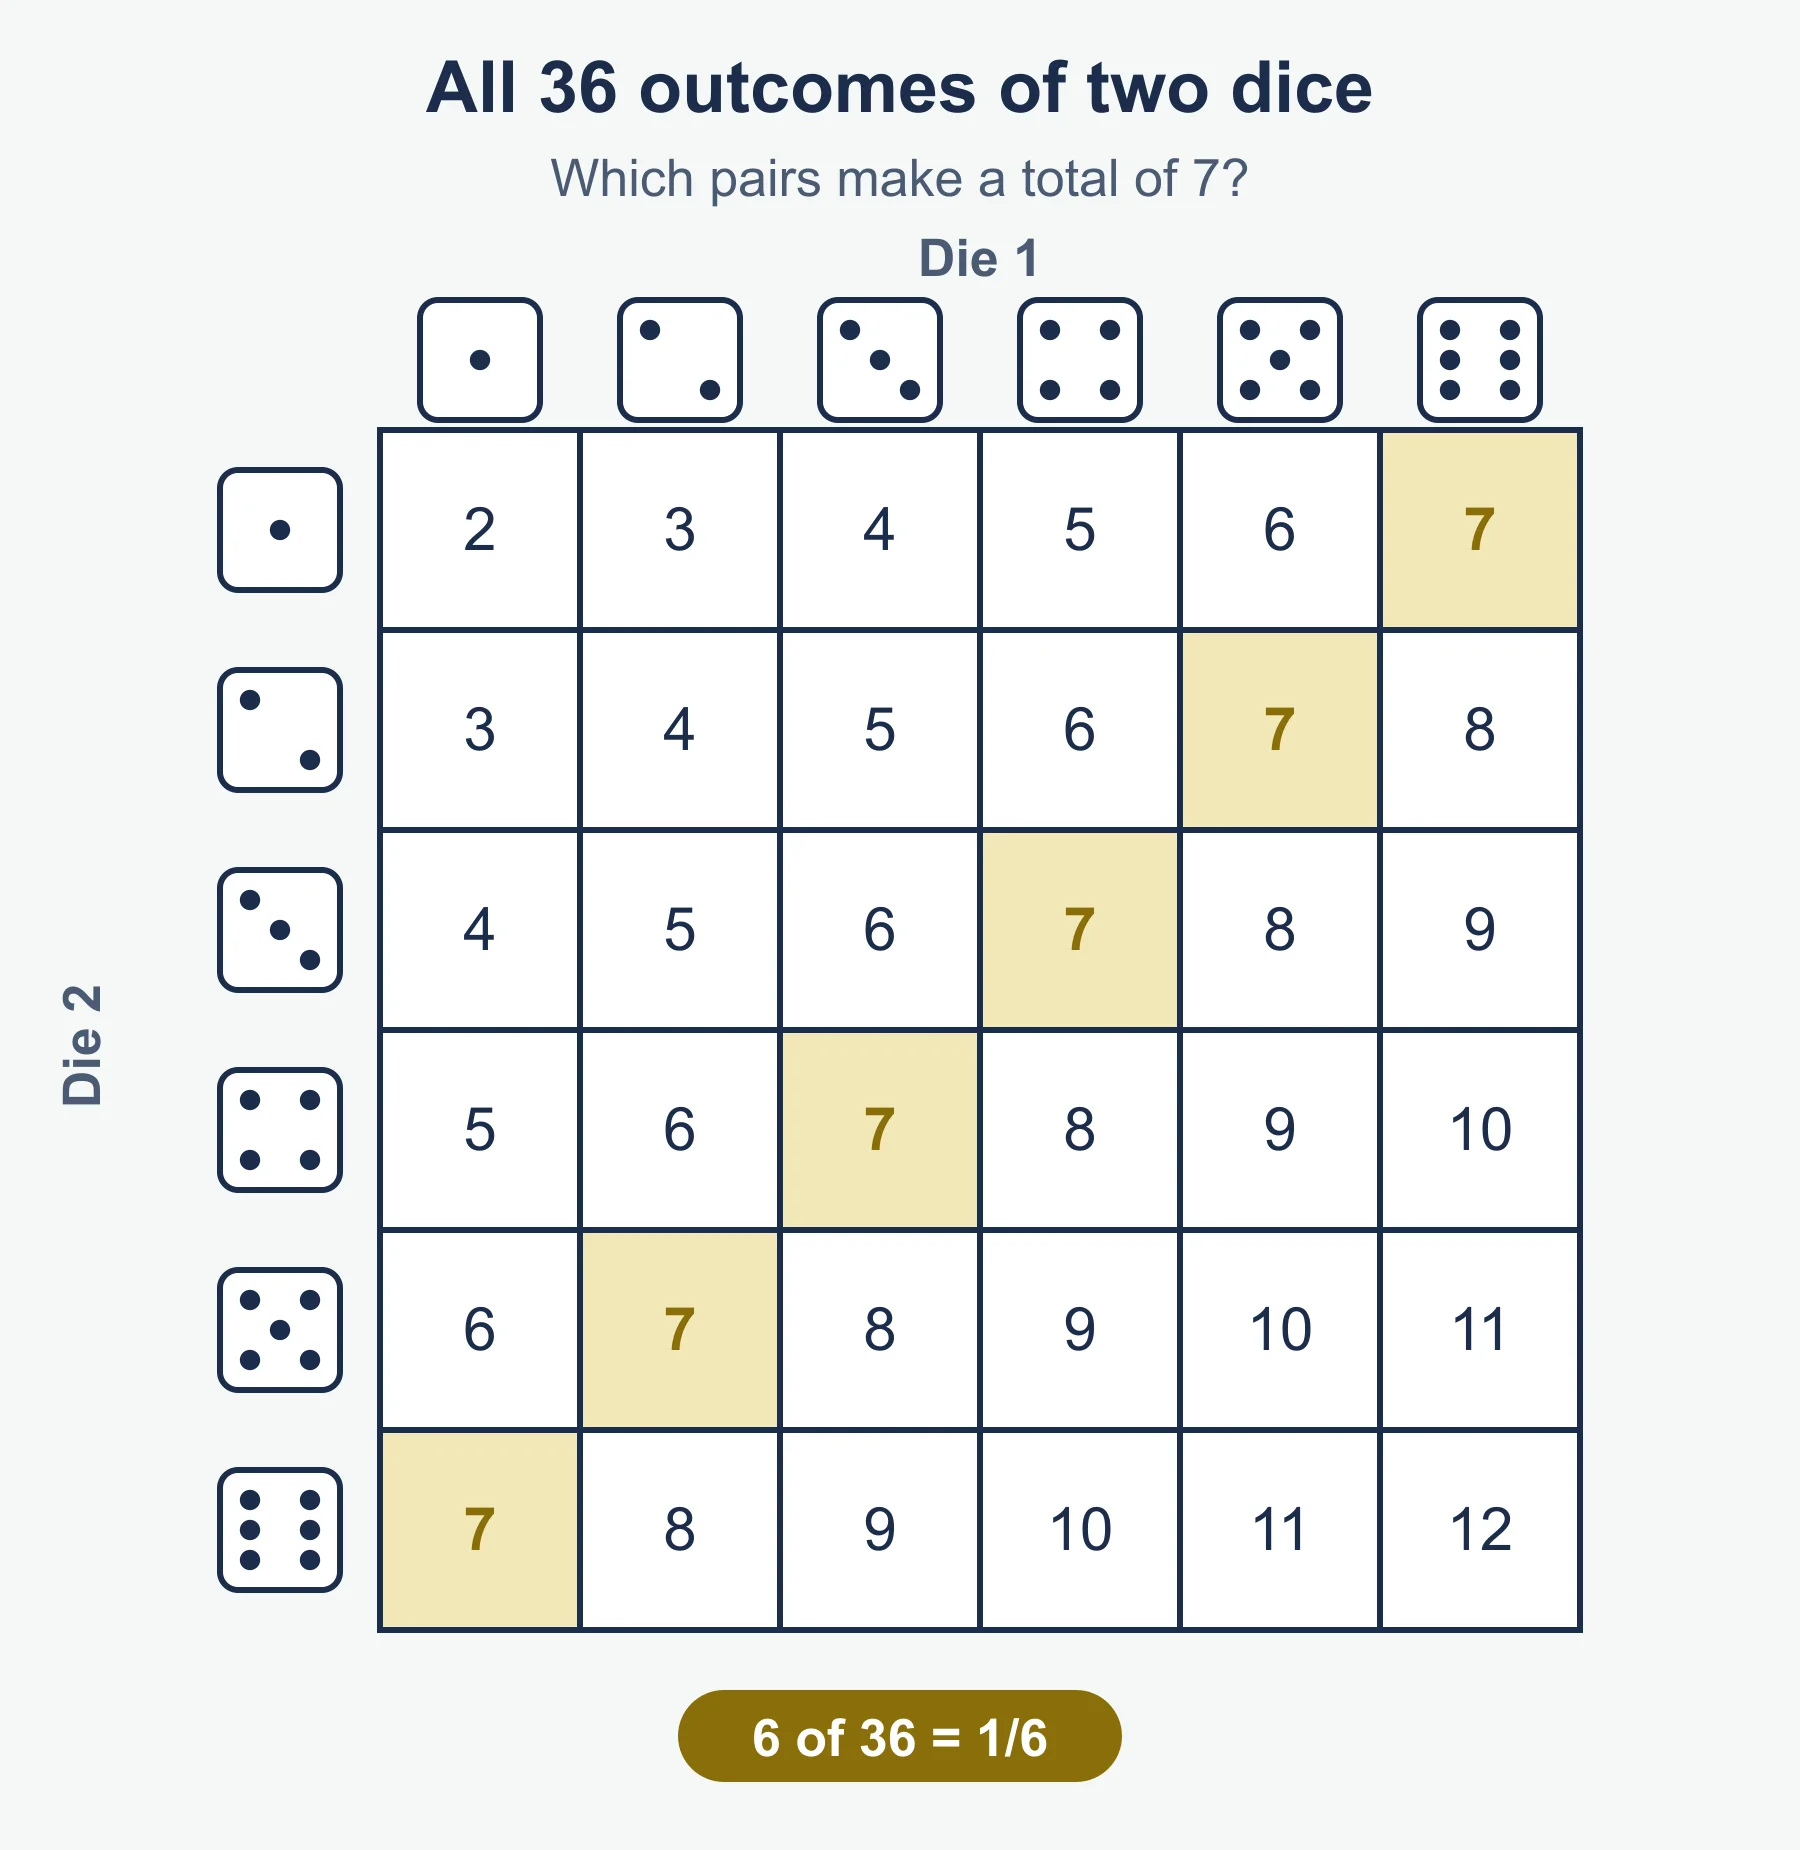
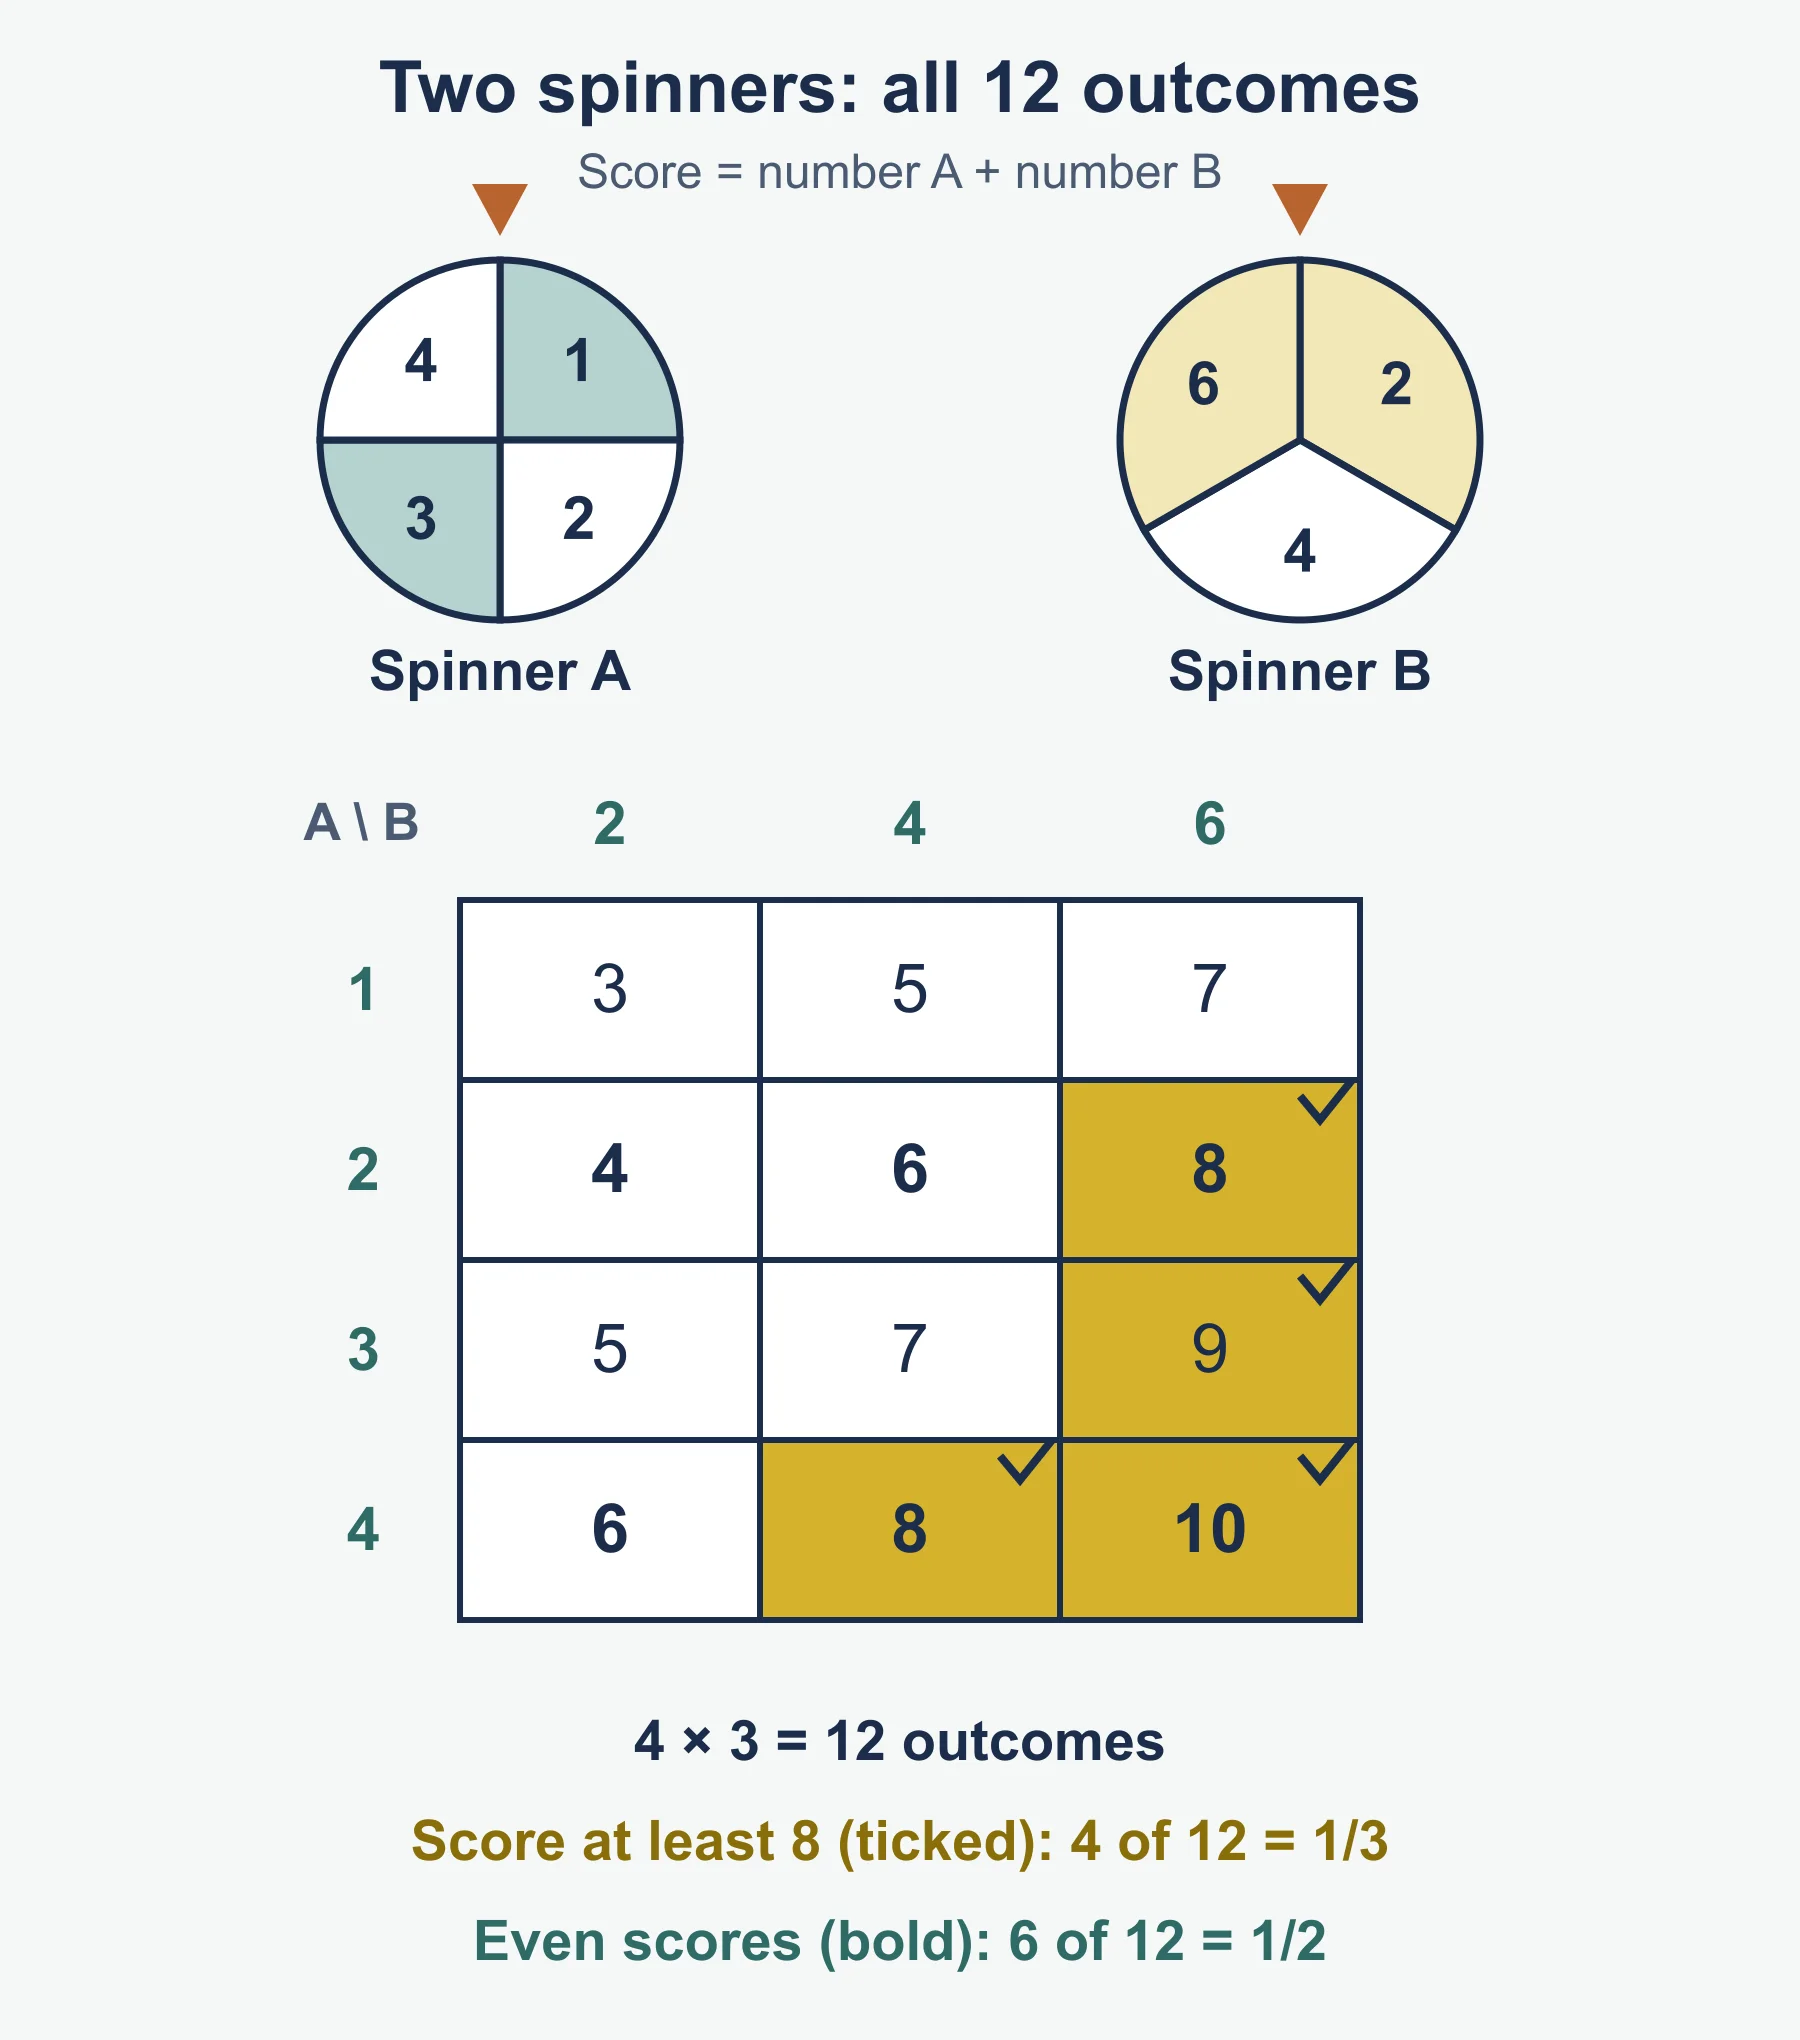
Sample space diagram
- List every outcome of the first event down the side and the second event across the top.
- Fill the table, count the cells that fit, and divide by the total number of cells.
- Use it only when outcomes are equally likely.
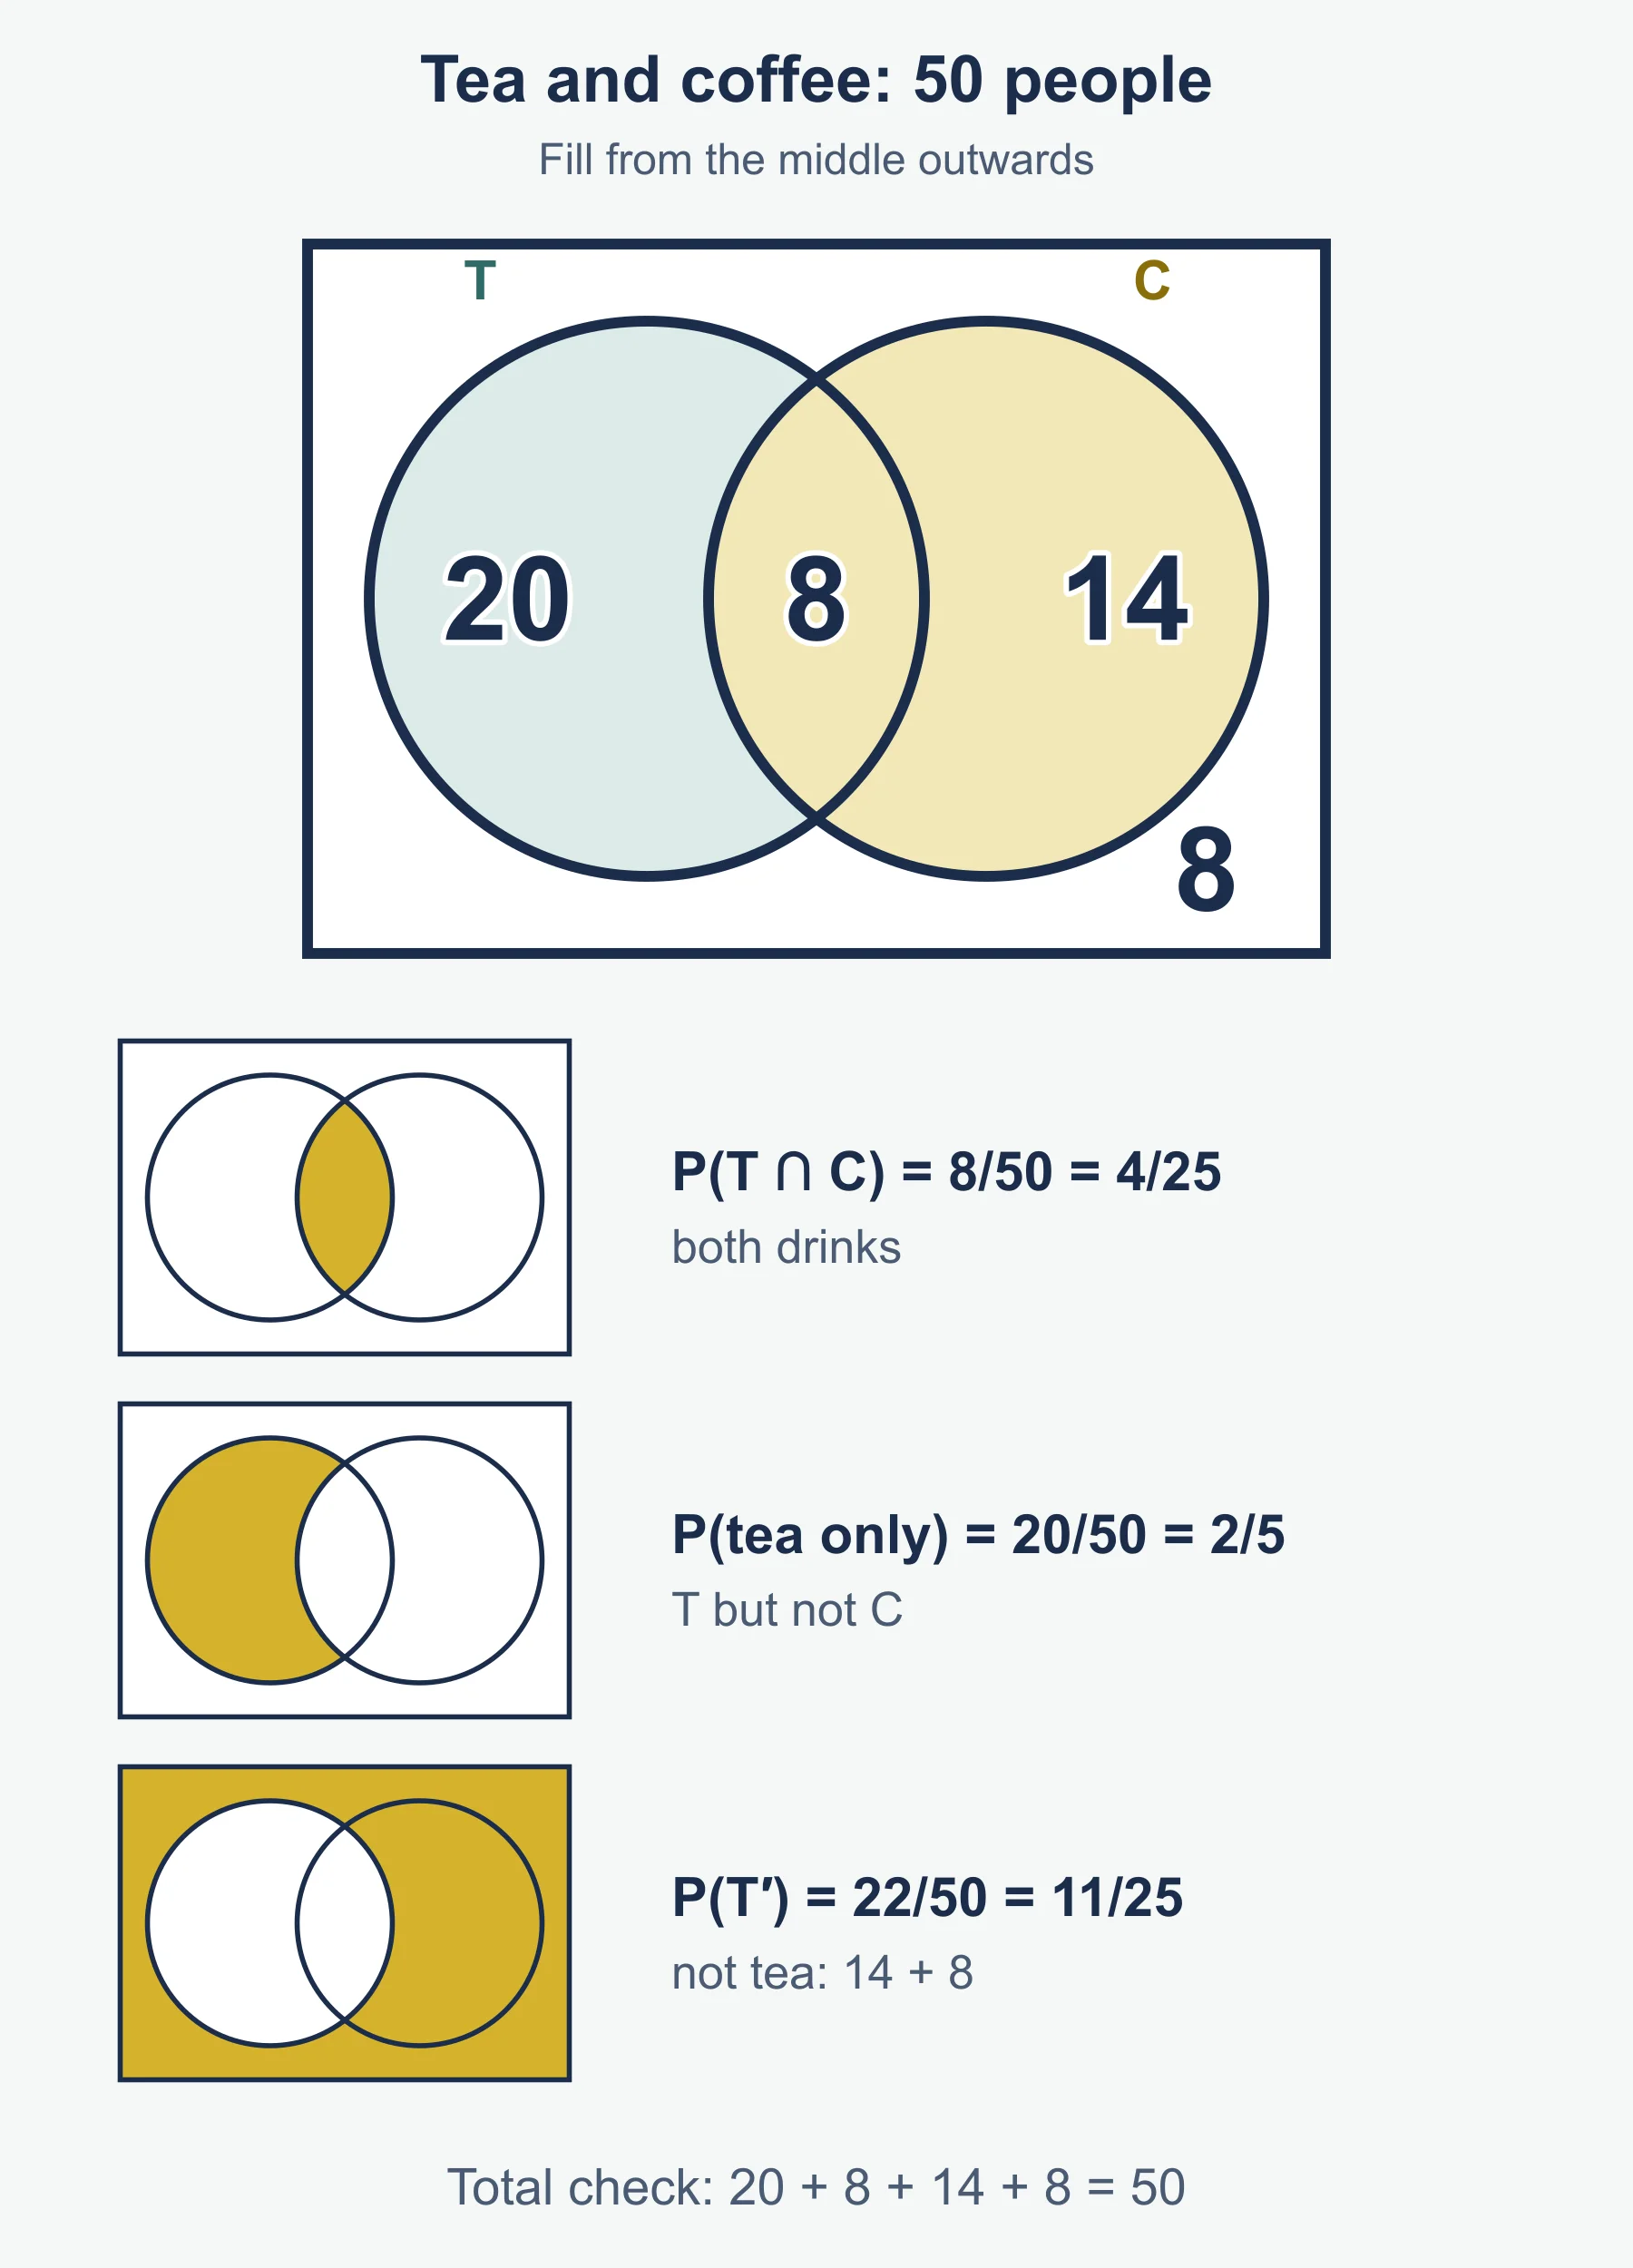
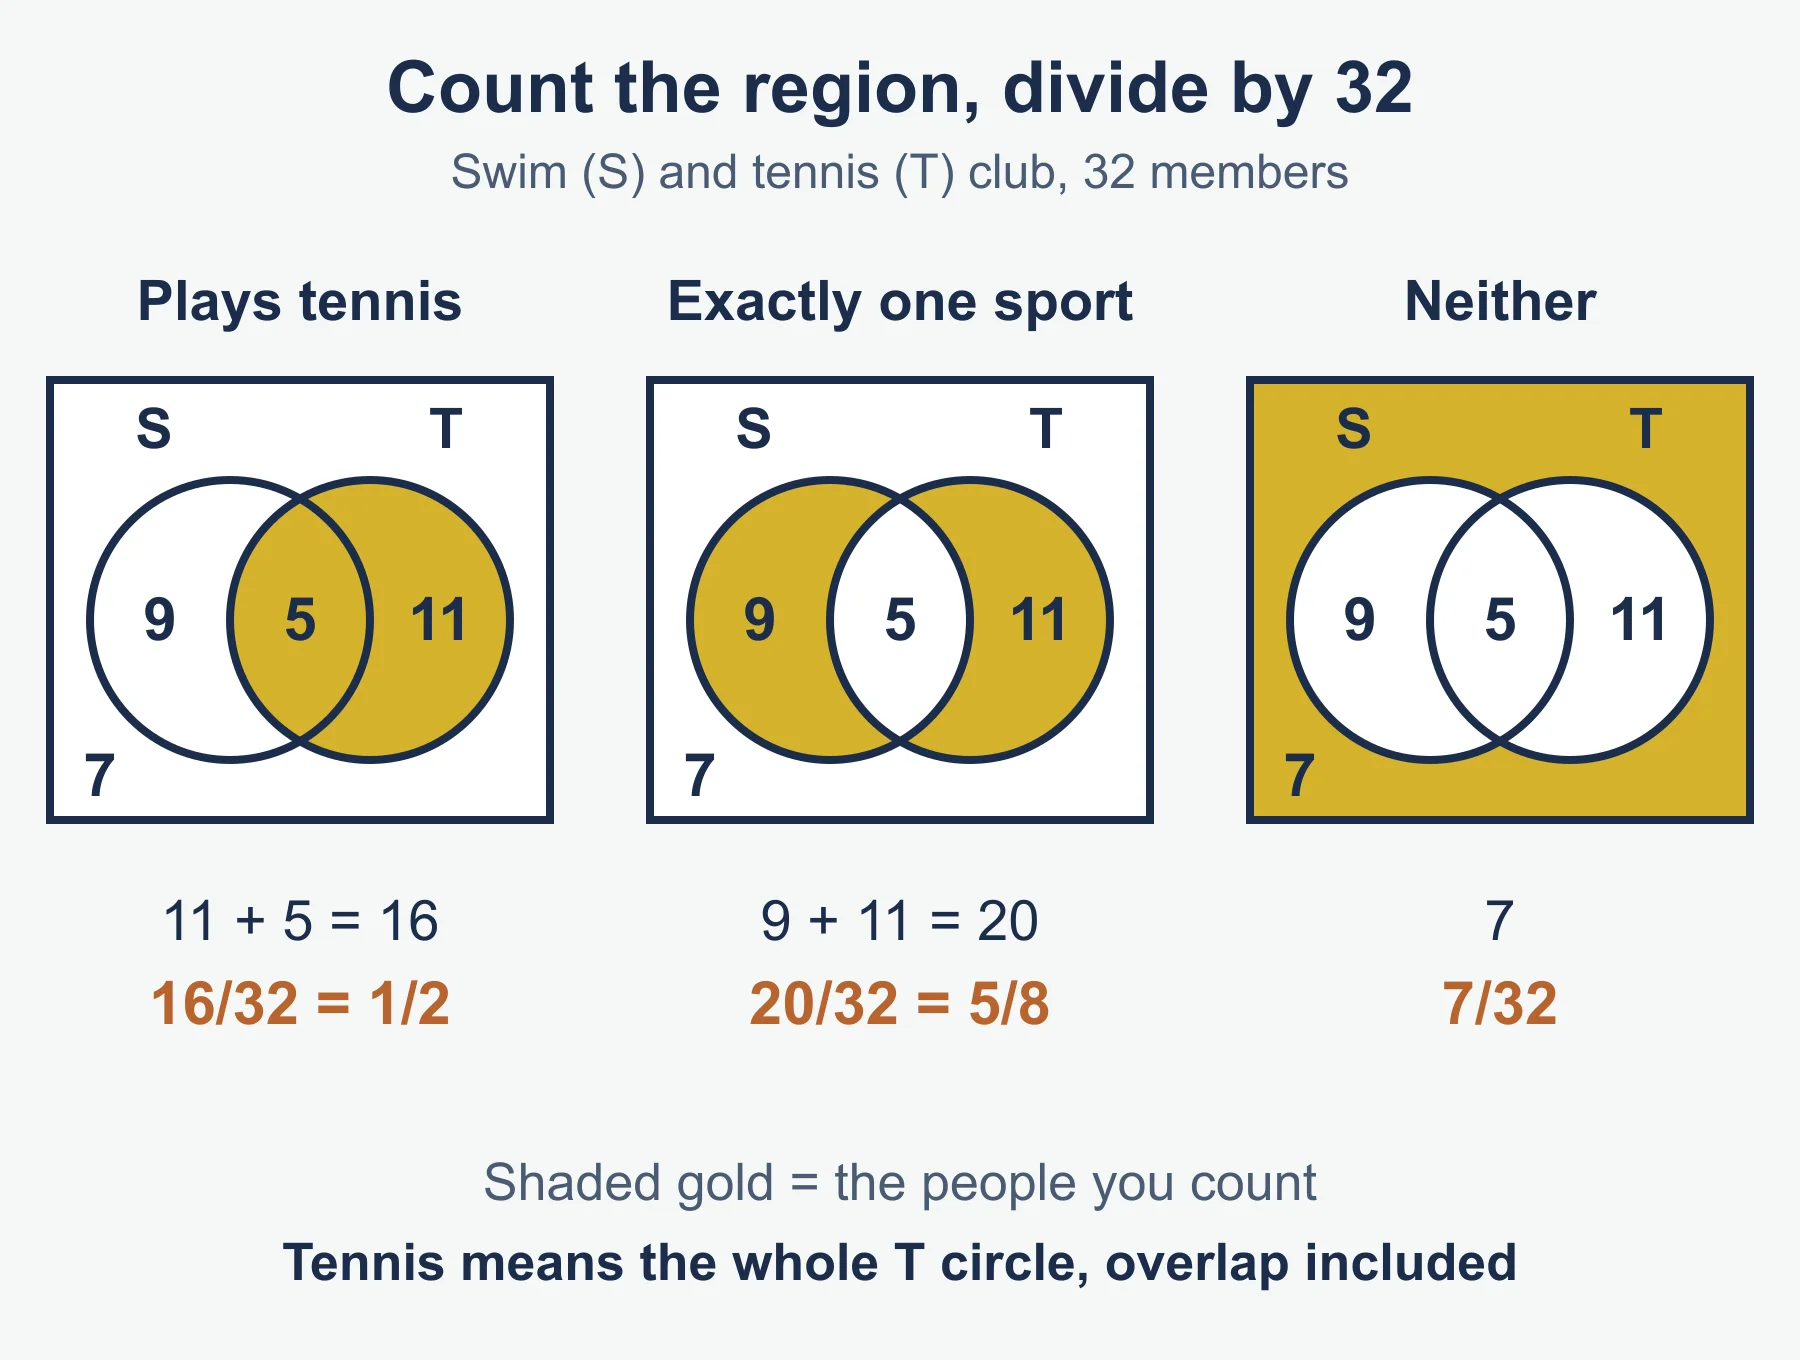
Venn diagram
Method in steps:
- Fill the overlap first.
- Take the overlap away from each set total to get the “only” regions.
- Put the people in neither set outside the circles.
- Check the regions add up to the total.
- Divide the region you want by the total.
Quick reminder. Total 40. n(A) = 22, n(B) = 15, n(A ∩ B) = 6, so n(A ∪ B) = 22 + 15 − 6 = 31 and neither = 40 − 31 = 9. Then P(A ∪ B) = 31/40 and P(A only) = 16/40 = 2/5.
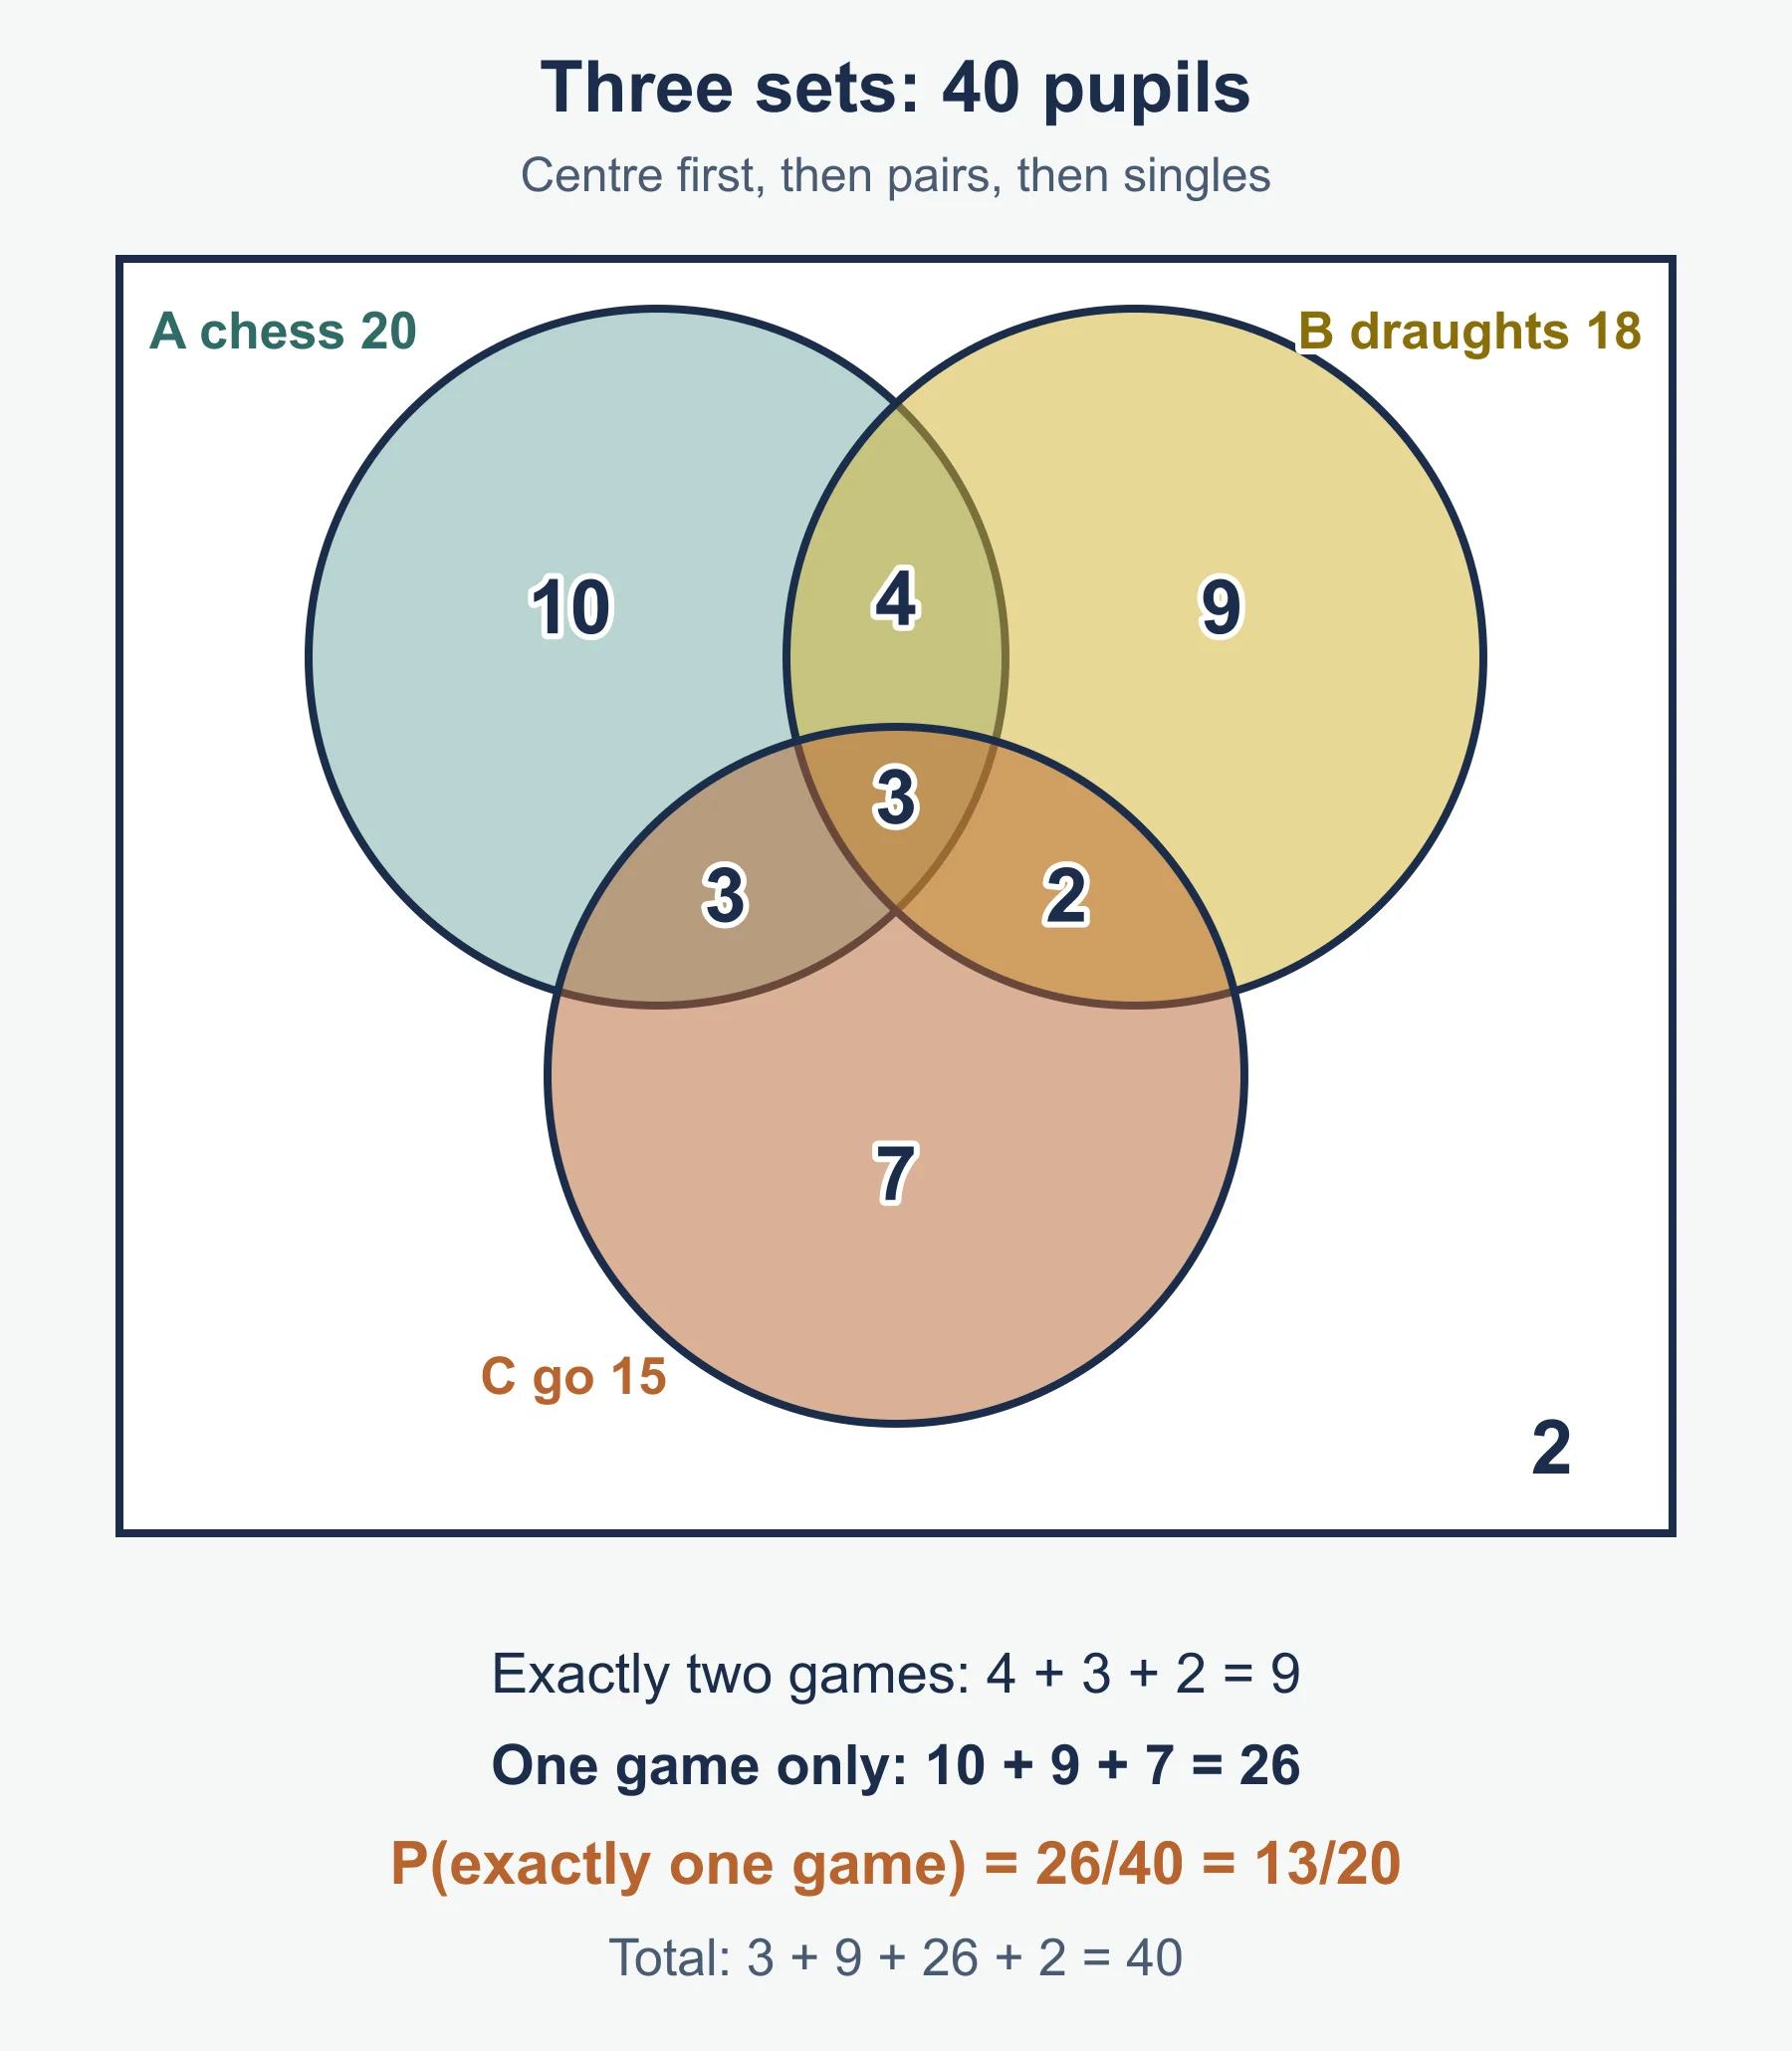
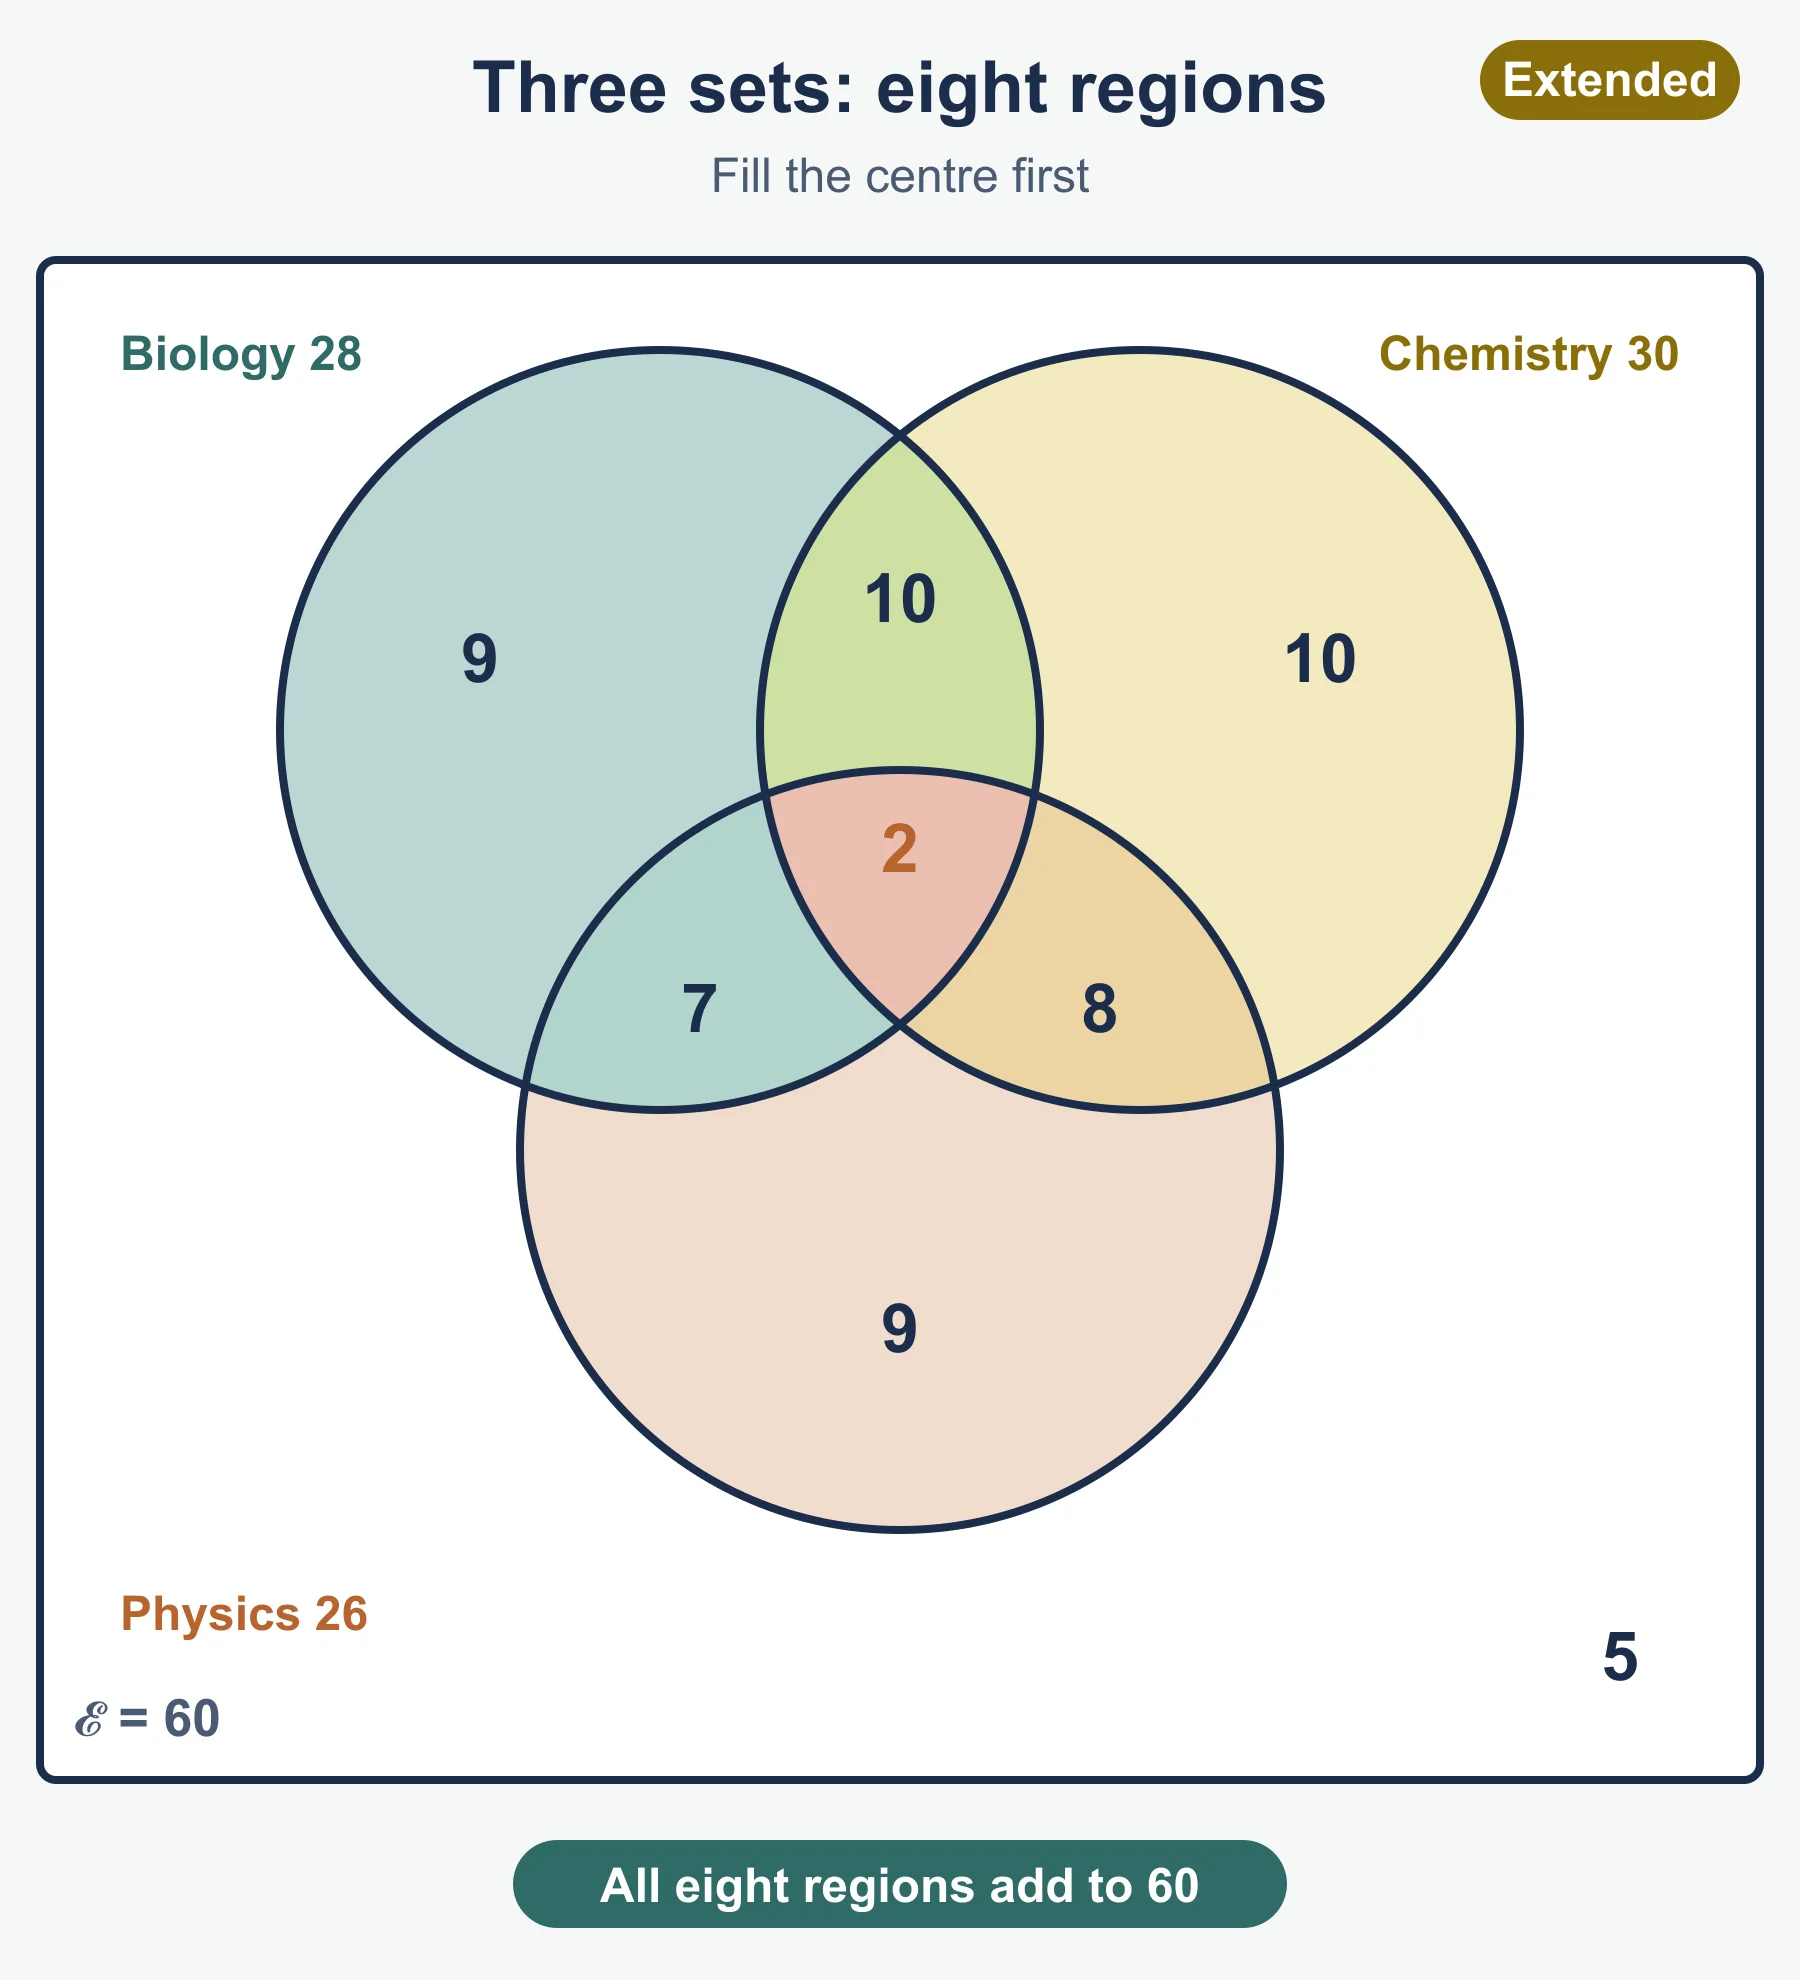
With three sets, fill the region where all three overlap first, then the regions where exactly two overlap, then the regions for one set only. Finish with the region outside every circle. Example: 3 in all three sets and 7 in A and B means 4 in A and B only. Remember that P(A′) counts everything outside A, including the people in neither set.
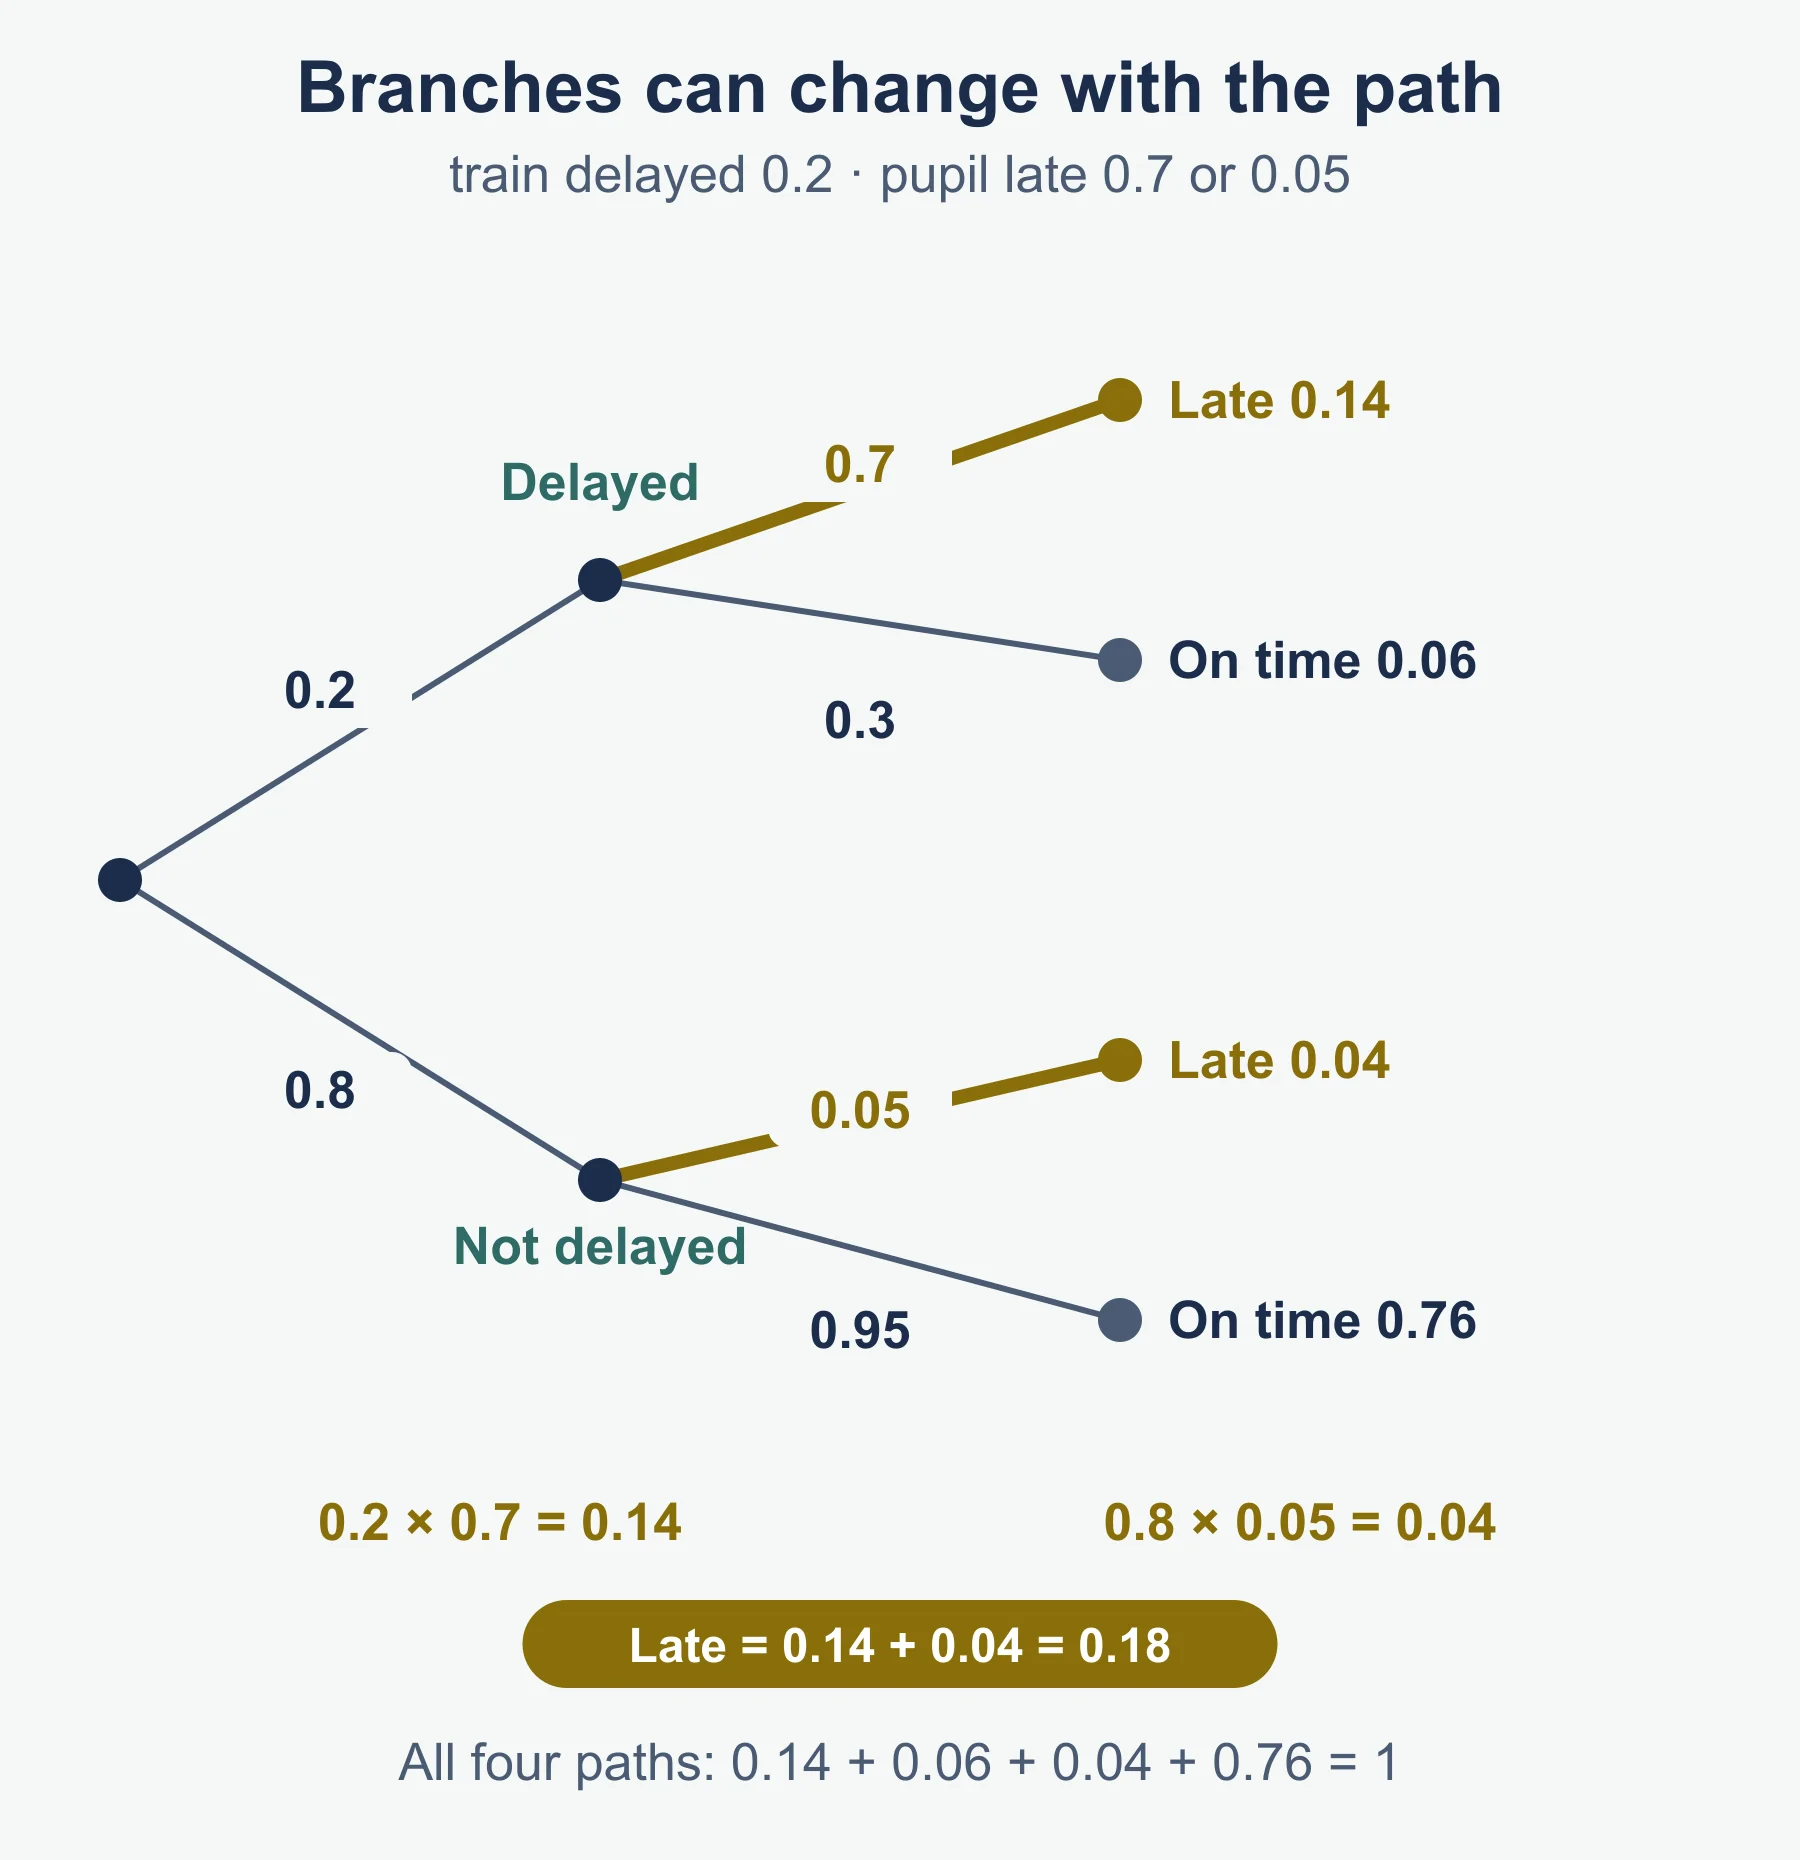
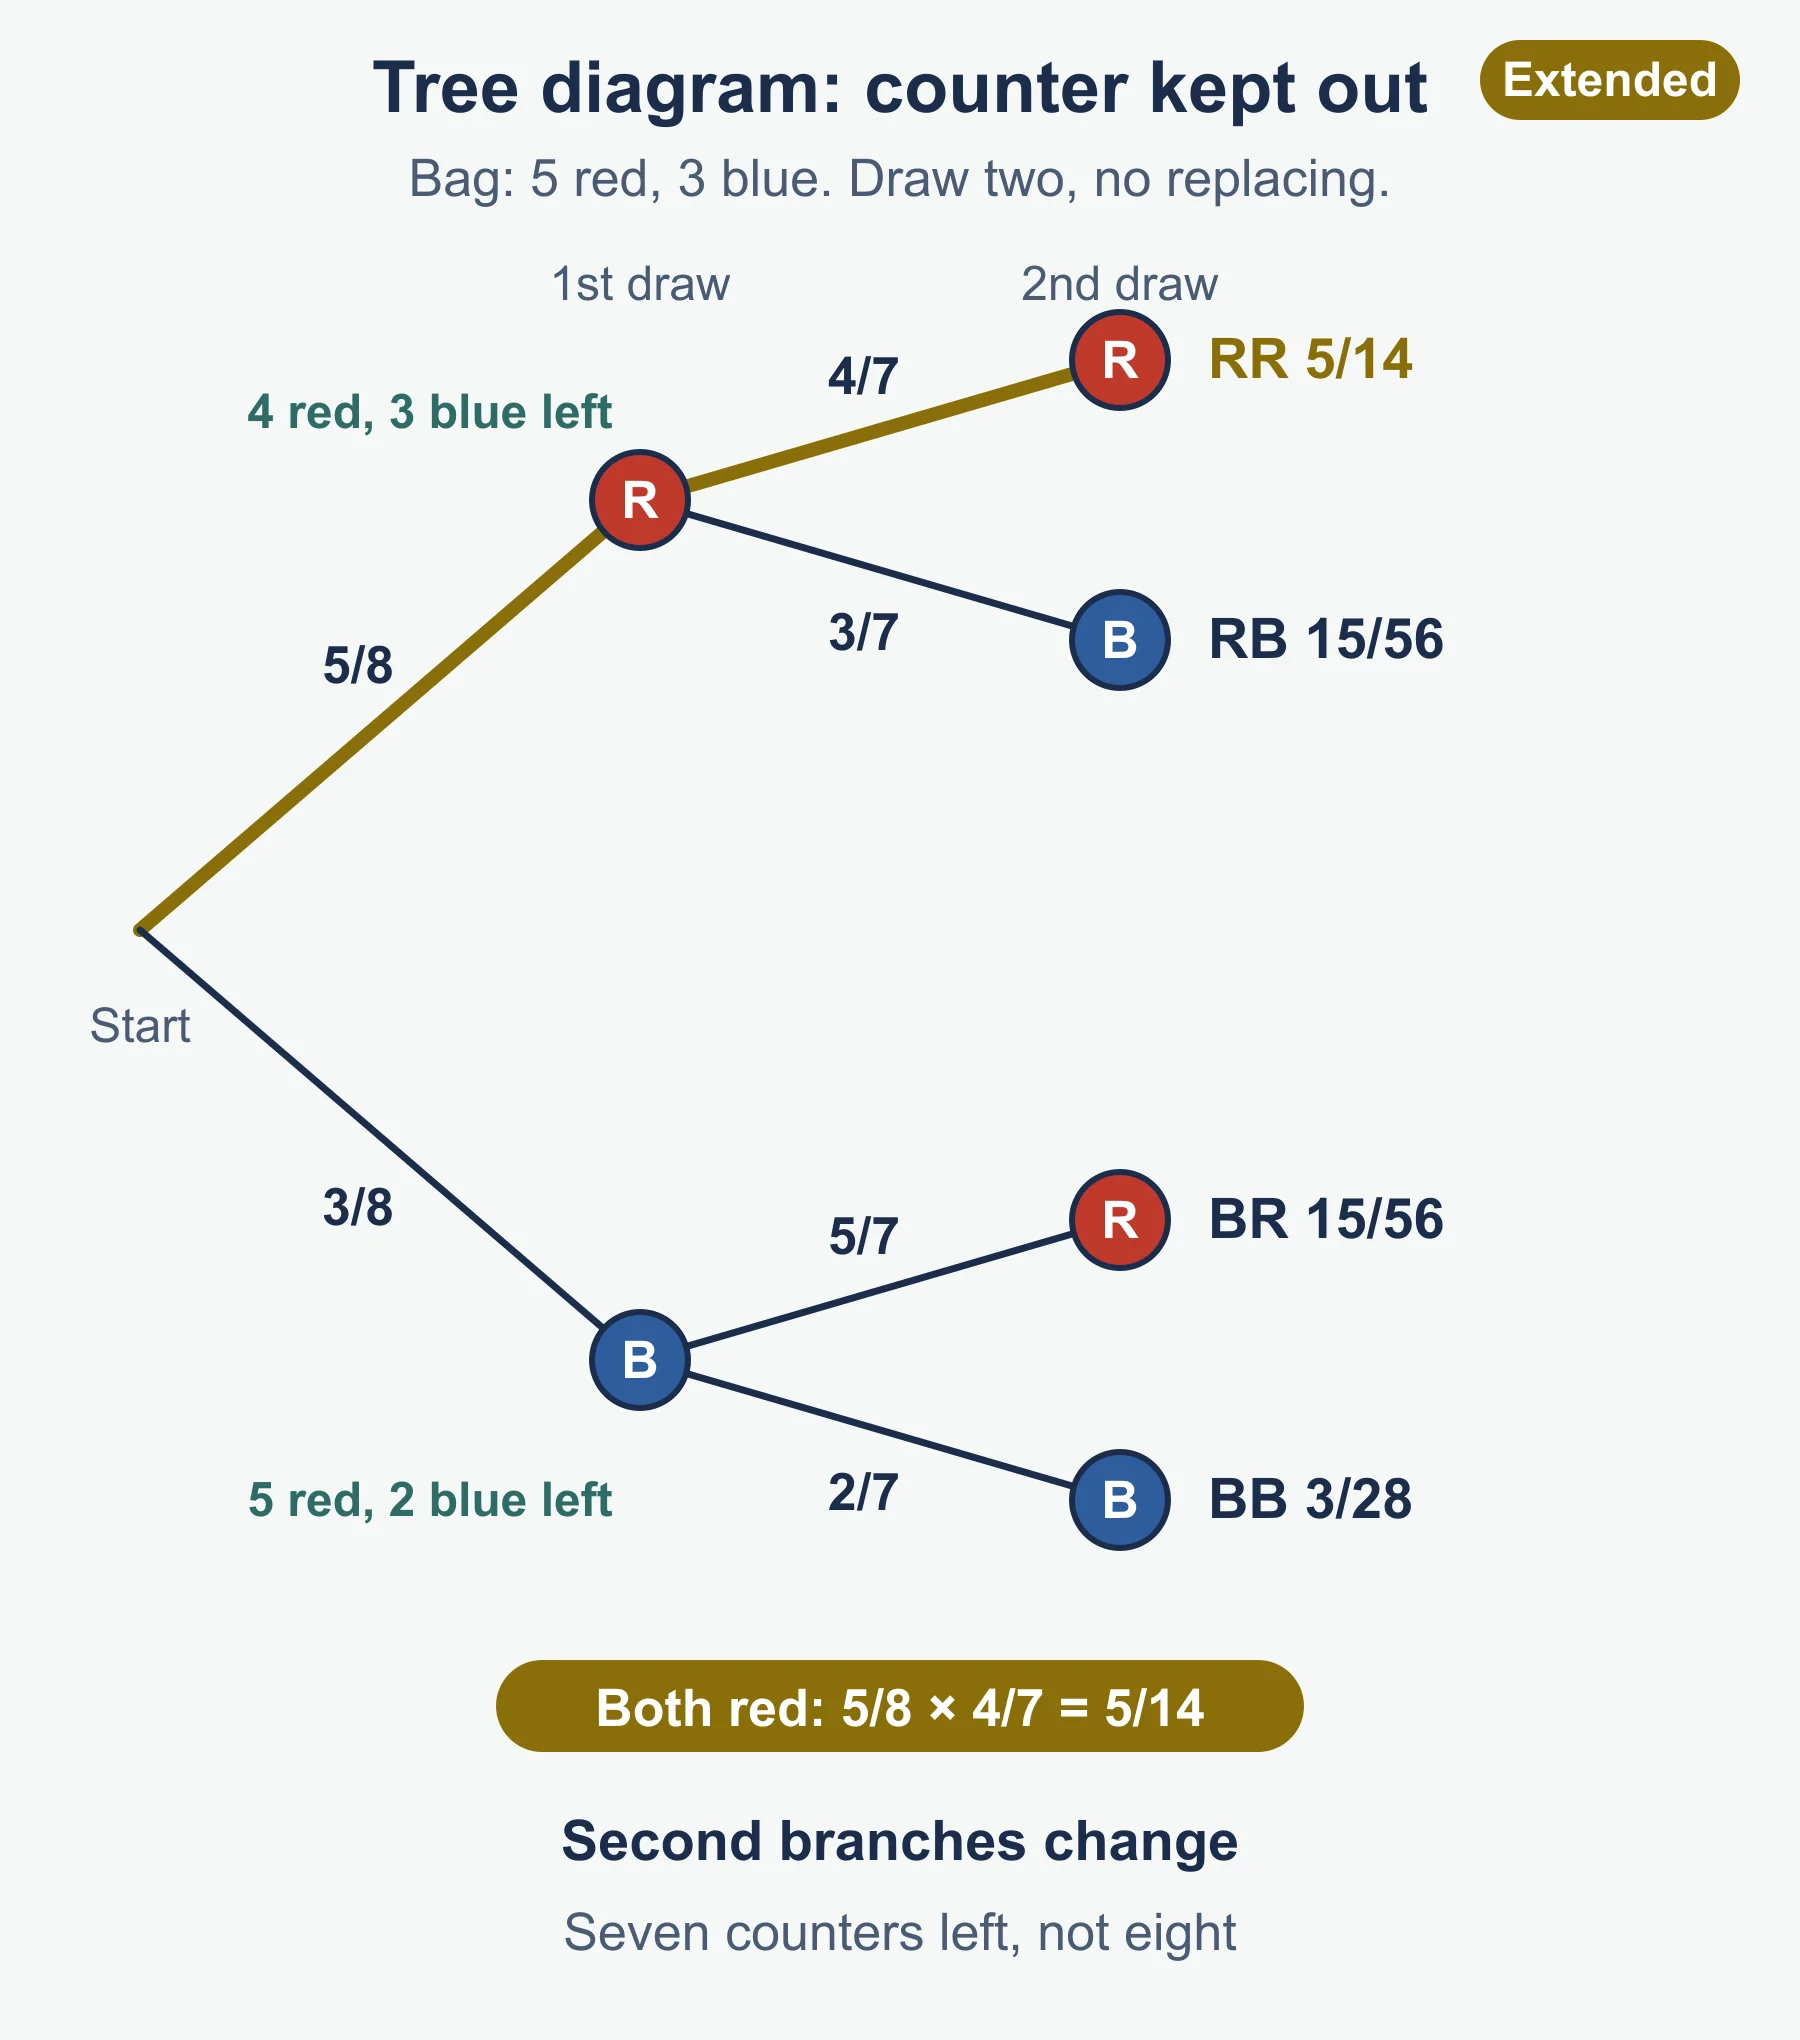
Tree diagram
Method in steps:
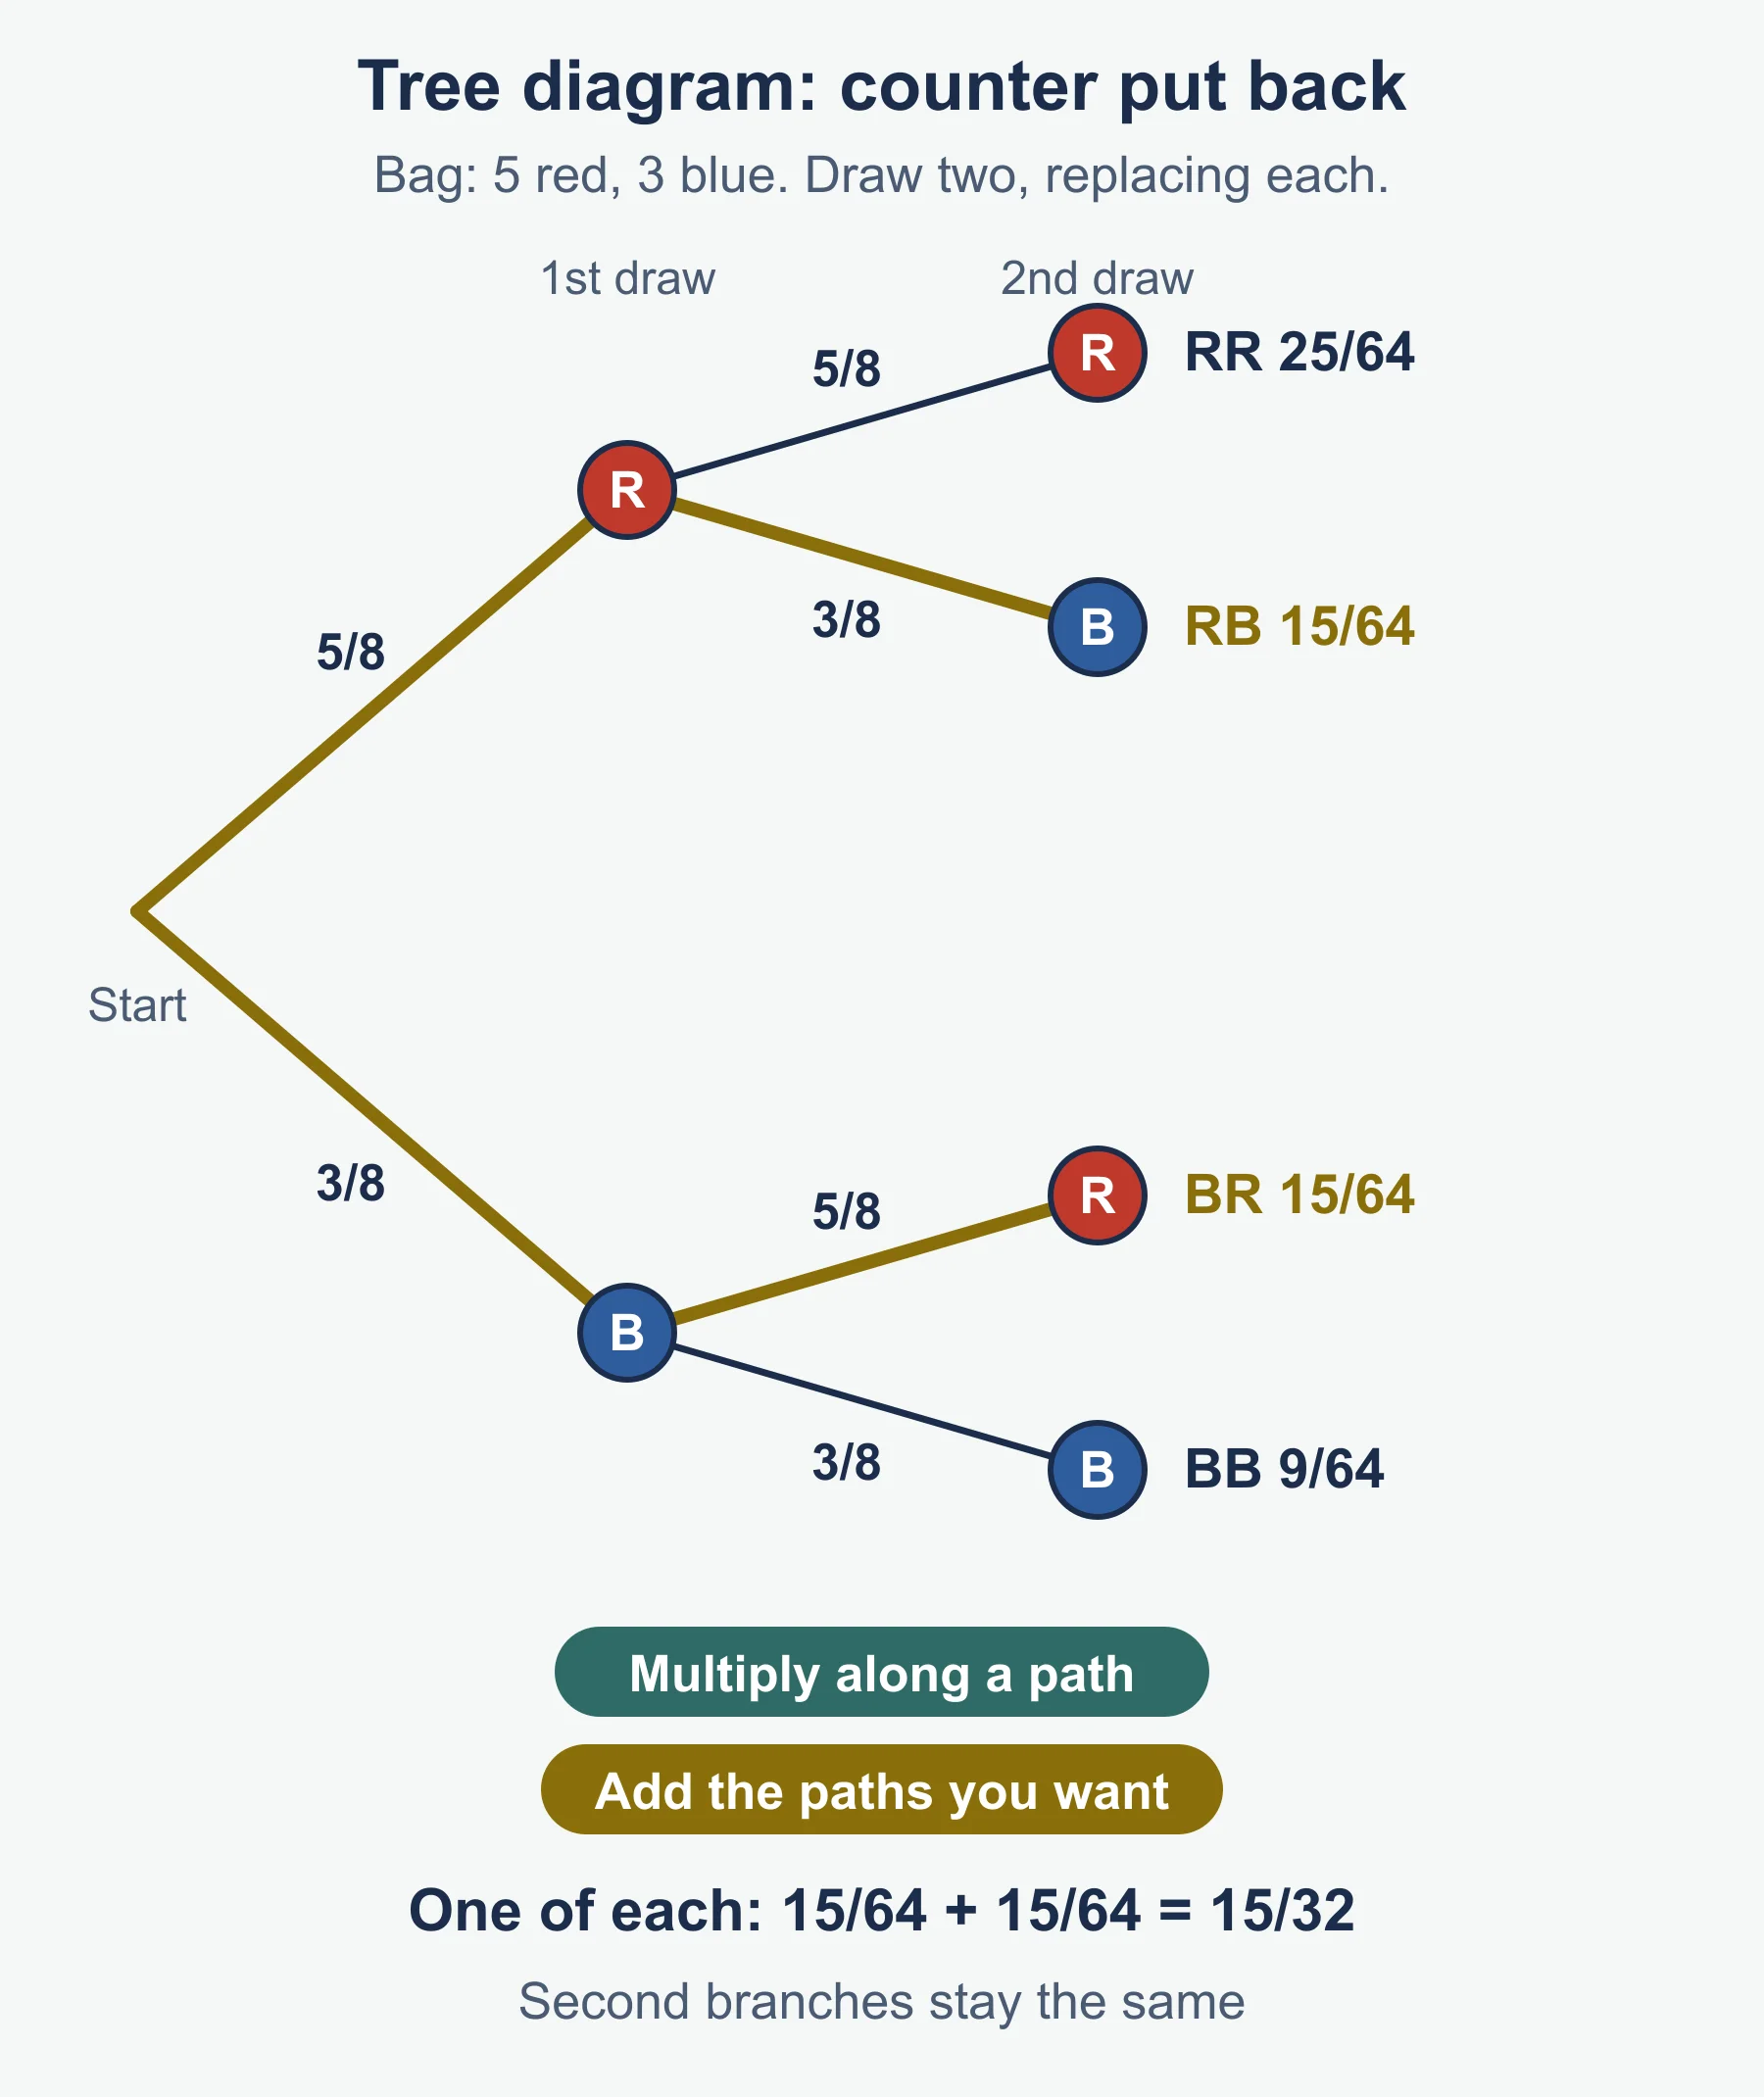
- Draw one stage at a time and label each branch with its probability.
- Check each set of branches from one point adds up to 1.
- Write the outcome at the end of each path.
- Multiply along each path you need.
- Add the paths that give the event.
Quick reminder. On a school day the probability of a test is 0.4. If there is a test, the probability a pupil revises is 0.9. If not, it is 0.5. P(revises) = 0.4 × 0.9 + 0.6 × 0.5 = 0.36 + 0.30 = 0.66. The four paths give 0.36, 0.04, 0.30 and 0.30, which add to 1.
With and without replacement
| With replacement | Without replacement | |
|---|---|---|
| Second-stage probabilities | Same as the first | Change, because the pool is smaller |
| Denominators | Same each time | Drop by one |
| Example, 4 red and 6 blue in a bag, P(two reds) | 4/10 × 4/10 = 4/25 | 4/10 × 3/9 = 2/15 |
Quick reminder. From the same bag of 4 red and 6 blue counters, without replacement, P(one of each colour) = 4/10 × 6/9 + 6/10 × 4/9 = 24/90 + 24/90 = 8/15.
Must-know distinctions
- P(A) and P(A′). They add up to 1, so one tells you the other.
- Multiply and add. Along one path, multiply. Between separate paths, add.
- Union and intersection. A ∪ B is in at least one set. A ∩ B is in both.
- Probability and expected frequency. A probability is a number from 0 to 1. An expected frequency is a count.
- Relative frequency and theoretical probability. The first comes from an experiment, the second from reasoning about equally likely outcomes.
- Independent picks and dependent picks. With replacement the second pick is unaffected. Without replacement it depends on the first.
Quick self-test
- A spinner has 8 equal sections, numbered 1 to 8. Find the probability of landing on a multiple of 3.
- The probability that a bus arrives early is 0.15. Find the probability that it does not arrive early.
- A coin is tossed 150 times and lands heads 66 times. Find the relative frequency of heads, as a decimal.
- The probability that a plant seed does not germinate is 0.12. How many of 800 seeds should be expected to germinate?
- Two fair spinners, each with sections 1, 2, 3 and 4, are spun and their scores added. Find the probability that the total is 4.
- In a group of 40 people, 18 speak French, 14 speak German and 12 speak neither. How many speak both languages?
- A bag has 6 yellow and 9 white counters. Without replacement, two are drawn out. Find P(both yellow).
- From the same bag, find P(one yellow and one white).
- A box has 2 faulty and 3 working lamps. Two are taken one after the other with replacement. Find the probability that at least one is faulty.
- Explain why 7/5 cannot be a probability.
Answers
- Multiples of 3 are 3 and 6, so 2/8 = 1/4.
- 1 − 0.15 = 0.85.
- 66/150 = 0.44.
- P(germinate) = 0.88, and 0.88 × 800 = 704.
- The pairs giving 4 are (1,3), (2,2) and (3,1), out of 16, so 3/16.
- At least one language: 40 − 12 = 28. Then 18 + 14 − n(both) = 28, so n(both) = 32 − 28 = 4.
- 6/15 × 5/14 = 30/210 = 1/7.
- 6/15 × 9/14 + 9/15 × 6/14 = 54/210 + 54/210 = 108/210 = 18/35.
- P(no faulty) = 3/5 × 3/5 = 9/25, so P(at least one faulty) = 1 − 9/25 = 16/25.
- 7/5 is greater than 1, and no probability can exceed 1.
Where marks are usually lost
- Writing the wrong denominator by using one row of a table instead of the whole table.
- Not reducing the total for the second pick when the question says without replacement.
- Adding probabilities along a branch instead of multiplying.
- Finding P(same colour) and forgetting to add the second colour’s path.
- Forgetting the region outside the circles on a Venn diagram, so the total does not add up.
- Giving P(A ∪ B) as n(A) + n(B) without subtracting the overlap.
- Using the wrong probability in an expected-frequency question, such as that of the opposite event.
- Rounding a probability early, then giving an inexact final answer. Keep fractions until the end.
- Stating that a die is biased from a few throws, without quoting numbers.
- Writing an answer such as 5:2 instead of a fraction, decimal or percentage.
Frequently asked questions
What is relative frequency in O Level Mathematics? Relative frequency is the number of times an outcome happens divided by the number of trials. It is an estimate of probability that improves as the number of trials grows.
How do you calculate expected frequency? Multiply the probability by the number of trials. If a pin lands point up with relative frequency 0.3, you would expect 0.3 × 1500 = 450 point-up landings in 1500 trials.
When should you use a sample space diagram? Use one for two events with a small number of equally likely outcomes, such as two dice or two spinners. List the outcomes of each event along the sides, fill the table and count the cells that fit.
How do you find P(A ∪ B) from a Venn diagram? Add n(A) and n(B), then subtract the overlap n(A ∩ B) so it is not counted twice, and divide by the total. The total must include the region outside the circles.
What is the difference between with and without replacement? With replacement the second pick is unaffected by the first, so the probabilities stay the same. Without replacement the second pick depends on the first, so the totals change.
Official syllabus
Cambridge O Level Mathematics (Syllabus D) 4024, syllabus for examination in 2025, 2026 and 2027, published by Cambridge University Press & Assessment.
Get free revision emails (optional)
Occasional emails with practice questions, worked explanations and links to free resources for the qualification and subjects you choose. No spam, and you can unsubscribe from any email. The free tools on this site never need an email.
Related resources
-
Study guides
Cambridge O Level Mathematics: Probability (4024)
Study guide to every Probability outcome in Cambridge O Level Mathematics 4024: the scale, relative frequency, expected frequency, Venn and tree diagrams.
Mathematics · Cambridge · O Level
Read guide -
Practice questions
O Level Mathematics: Probability Practice Questions (Cambridge 4024)
Original Cambridge O Level Mathematics 4024 probability questions on relative frequency, picks without replacement, Venn diagrams and tree diagrams.
Mathematics · Cambridge · O Level
Try questions -
Study guides
Cambridge O Level Mathematics: Trigonometry (4024)
A step-by-step Cambridge O Level Mathematics study guide to Pythagoras, right-angled and non-right-angled trigonometry, bearings and 3D problems.
Mathematics · Cambridge · O Level
Read guide
Related articles
-
exam preparation
Where IGCSE Mathematics marks are lost early
The first weeks of an IGCSE Mathematics course rarely go wrong on difficulty. They go wrong on method, command words, rounding and units — four habits that cost marks a student had already earned.
24 August 2026
-
teaching
A Level tuition in Dubai: Cambridge or Pearson Edexcel International A Level?
Schools in Dubai and Abu Dhabi teach either Cambridge International AS & A Level or Pearson Edexcel International A Level. How the two are structured, why it matters for tuition, and how online classes from Lahore work.
9 October 2026
Studying this with a teacher
Working through Mathematics O LEVELS?
This page is free and stays free. If you would rather be taught it, Marlbridge runs Mathematics classes one-to-one and in small groups of up to 15, online in your own time zone. The first trial class is free. WhatsApp replies within an hour (8am–11pm Pakistan time, every day); email the same day.
Cambridge Mathematics teachers at Marlbridge