
Revision Notes
OCR A Level Business: Marketing and marketing strategies (H431) – Revision Notes
Condensed revision notes for every part of OCR A Level Business (H431) content area 3, Marketing and marketing strategies, with formulas and a self-test.
- Subject
- Business
- Level
- A LEVELS
- Topic
- Marketing and marketing strategies
- Author
- Marlbridge Academic Team
- Updated
- Reviewed by
- Salman Ahmad (what this means)
Aligned to OCR A Level Business (H431), Version 2.1 (January 2026), for first assessment in 2017; final assessment summer 2027. Official specification .
Syllabus page (what it covers and how it is assessed): OCR A Level Business.
Syllabus points this page covers
H431
- 3 Marketing and marketing strategies (whole topic)
Found an error? Report a correction.
Need help with this topic? Request a free trial class for A Level Business (H431).
These notes condense the whole of content area 3, Marketing and marketing strategies, in the OCR A Level Business (H431) specification (Version 2.1, January 2026). For fuller explanations start with the study guide, then test yourself with the practice questions. Related guides: business objectives and strategic decisions and external influences. Course hub: OCR A Level Business. Tick points off on the checklist. Not sure where you are weak? Take a free diagnostic.
Map of the topic
The specification divides the topic into these sections, and each is covered below.
- Marketing within a business environment: marketing objectives; marketing resources (SWOT)
- Customer needs: identifying customer needs (market research, trial marketing, sampling, normal distribution, standard deviation, market analysis, market share and growth)
- Customer needs: anticipating consumer needs (buying behaviour, niche and mass marketing, AIDA, DAGMAR, ATR, orientation, customer service, segmentation); customers and consumers (B2B and B2C)
- Customer needs: the product life cycle and extension strategies
- The marketing strategy: the marketing mix and contexts; product; price (including elasticities); place; promotion (including advertising elasticity); service marketing
- Marketing within the external environment; the strategy as a whole
Briefest coverage: sampling methods, DAGMAR, and the individual external influences.
1. Marketing objectives and resources
- Marketing objectives are targets for the marketing function, such as a sales or market share target. They set direction, let results be measured, and should support the corporate objectives.
- A business needs clear ones so marketing teams share a purpose and spending can be judged. Evaluate by asking whether they are measurable and realistic, and whether they help or conflict with the interests of stakeholders.
- Marketing resources are the finance, people, technology, time and information needed to market a product. A small budget may rule out television advertising; skilled staff or good data widen the options.
- SWOT analysis: it sorts factors into internal ones (strengths, weaknesses) and external ones (opportunities, threats). Use it to judge a firm’s marketing position. Limits: it is a snapshot, it is subjective, and it does not rank issues or say what to do.
2. Identifying customer needs
- Market research is gathering and interpreting data on buyers, rivals and market conditions.
- Primary (field) research is new data gathered for the purpose: surveys, interviews, focus groups, observation. Its strength is relevance and freshness; the drawbacks are cost and time.
- Secondary (desk) research uses existing data: government statistics, trade reports, competitor accounts, internal sales records. It is cheaper and quick but may be dated or not fit the question.
- Trial marketing: launching a product in a limited area or to a limited group before a full launch. It tests demand and finds faults, but delays launch and alerts rivals.
- Sampling means researching a part of the market. Methods: random (everyone has an equal chance); stratified (population split into groups, then sampled in proportion); cluster (pick whole groups, such as certain towns); systematic (every nth person); quota (interviewers fill set numbers of each type); convenience (whoever is easiest to reach, cheap but biased).
- Normal distribution: a symmetrical bell-shaped spread around the mean. Roughly 68% of observations fall within one standard deviation either side of the mean and roughly 95% within two (standard results).
- Standard deviation measures how spread out data is around the mean. The standard form for n values is the square root of (sum of squared deviations from the mean divided by n). Some courses divide by n minus 1 for a sample; follow your teacher’s convention.
Worked example: weekly sales of 40, 44, 48, 52, 56. Mean 48. Squared deviations 64, 16, 0, 16, 64 total 160. Divide by 5 gives 32. Square root gives 5.7. A low value means steady sales and easier stock planning; a high one means unpredictable demand.
- Market analysis studies the market’s size, growth, trends and competitors. Quantitative analysis uses numbers (sales, share); qualitative analysis uses opinions and attitudes (why customers choose a brand). A business needs both, because numbers show what is happening and opinions suggest why.
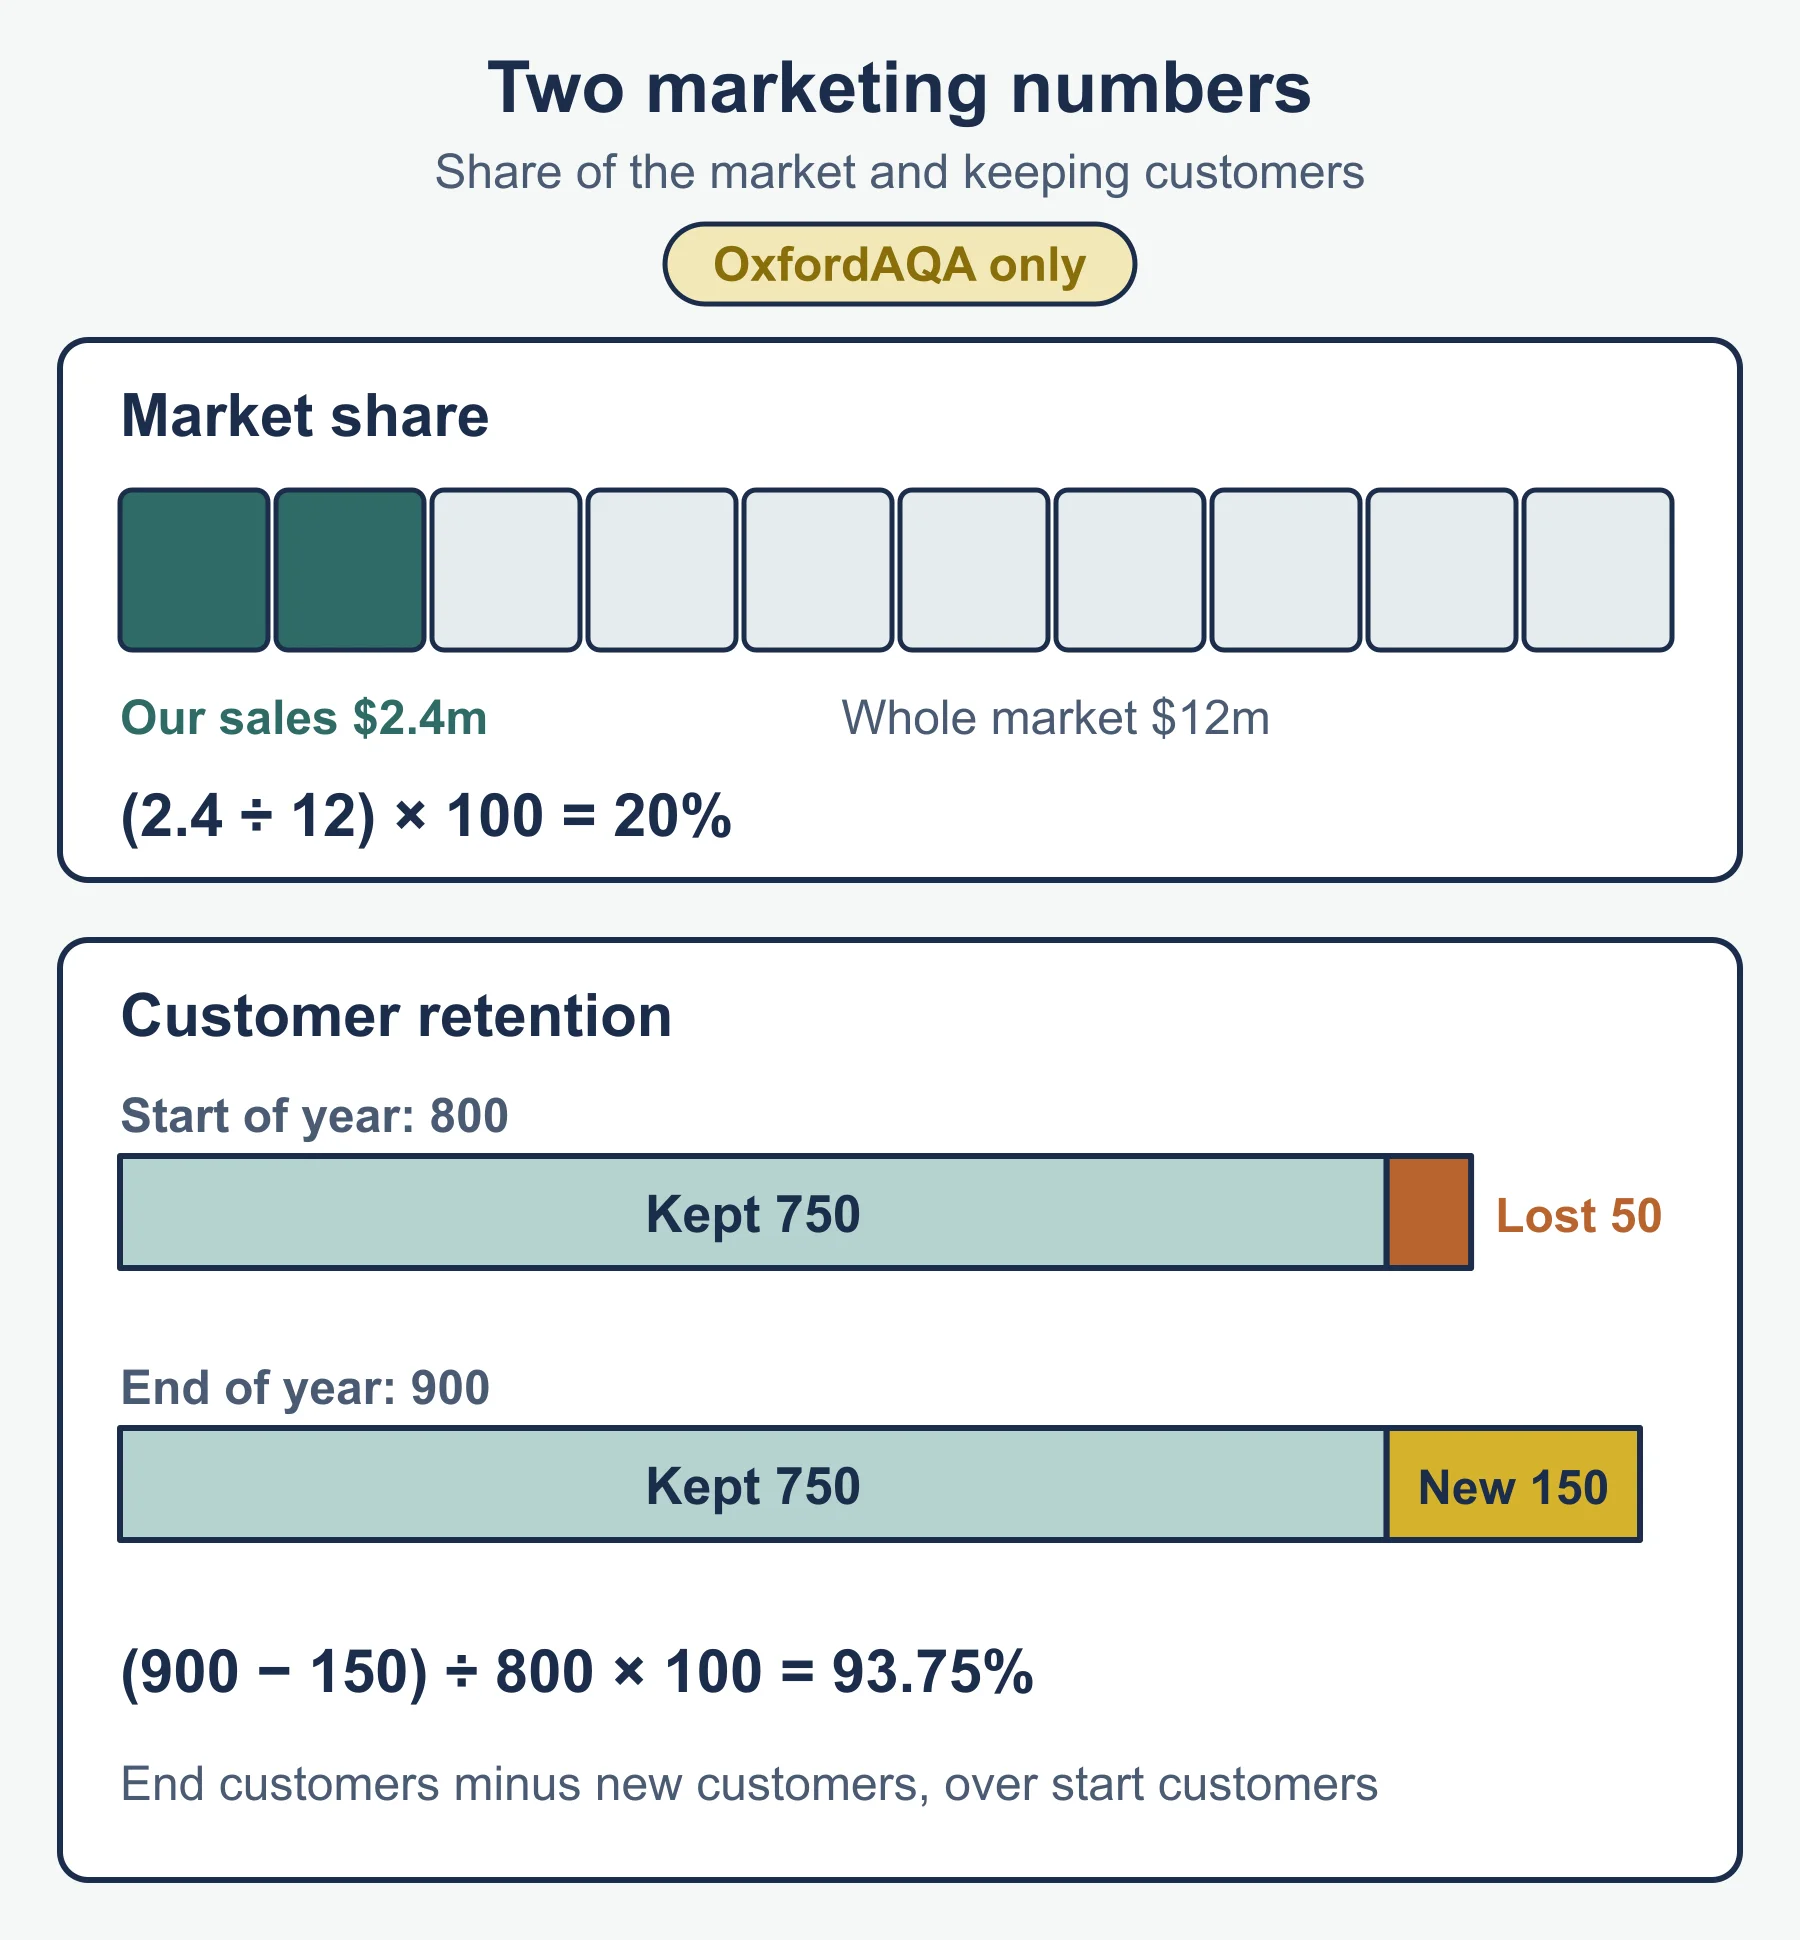
- Market share expresses the firm’s sales as a share, in percent, of the whole market. Market growth is the rise in market size divided by the starting size, times 100.
Worked example: a firm sells £1.8m in a £12m market, so share is 15%. The market grows to £13.2m: growth is 1.2/12 = 10%.
- Rising share may mean stronger competitiveness; falling share while sales rise means rivals are growing faster. Positive market growth suggests investing to keep share; negative growth suggests cutting costs, diversifying or leaving. Ignoring market data risks wasted launches and lost customers.
3. Anticipating consumer needs
- Buying behaviour: planned purchases are decided beforehand; impulse purchases are unplanned (shelf layout and till-point displays aim at these).
- Niche marketing targets a small, specific segment, often with higher prices and loyalty but limited growth. Mass marketing targets the whole market with one offer, giving economies of scale but more competition.
- AIDA: Attention, Interest, Desire, Action. Hierarchy of effects / DAGMAR: awareness, comprehension, conviction, action (DAGMAR stands for Defining Advertising Goals for Measured Advertising Results; it sets measurable communication goals). ATR: Awareness, Trial, Reinforcement. All describe how consumers move towards purchase, so promotion can be matched to the stage. Limits: real buyers do not always follow an order.
- Customer orientation starts with what customers want; product orientation begins from the firm’s own design and production strengths. Customer orientation reduces flop risk but costs research; product orientation suits genuine innovation.
- Customer service (advice, delivery, returns, after-sales) affects repeat purchase and word of mouth, especially where products are similar.
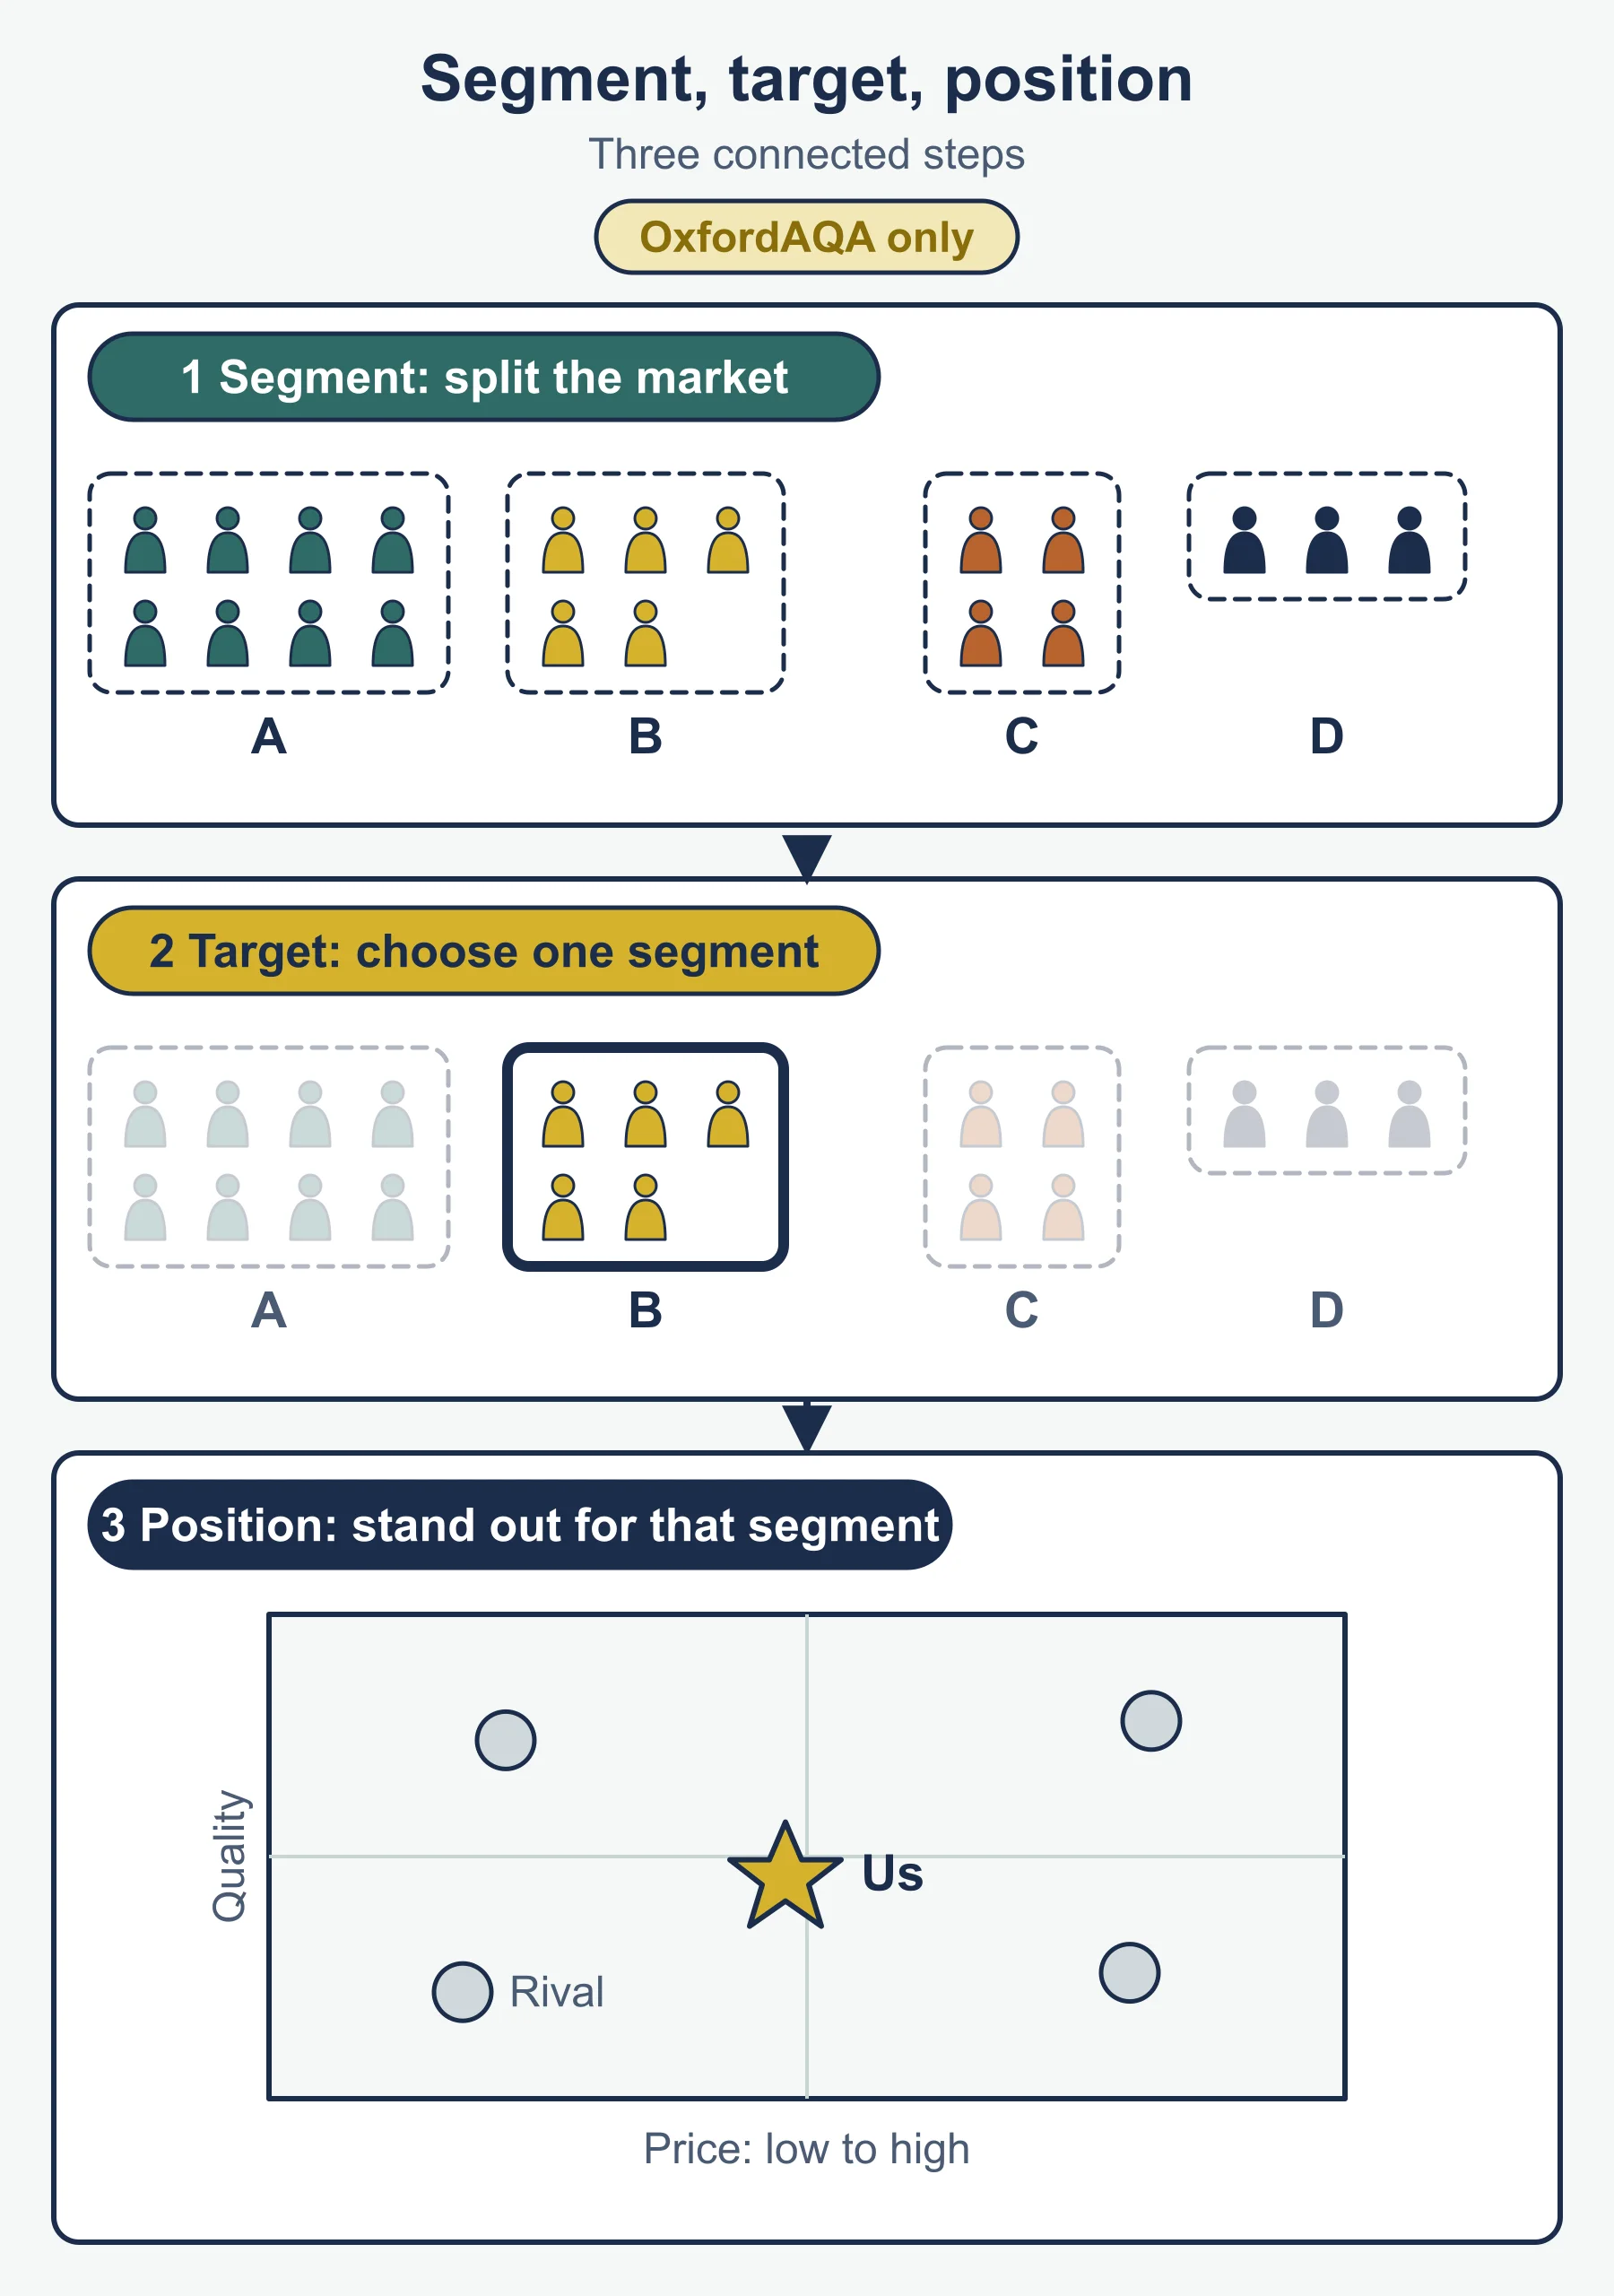
- Market segmentation splits a market into groups with shared characteristics. Ways: demographic (age, income, gender), geographic, psychographic or lifestyle, behavioural (usage, loyalty) and income or social class. It allows targeted mixes but adds cost.
- Customers are those who pay; consumers are those who use. A parent may be the customer and a child the consumer.
- B2C marketing tends to use mass media, branding, emotion and promotions. B2B marketing tends to use personal selling, trade fairs, long-term contracts, relationships and technical detail, with fewer, larger buyers.
4. Product life cycle and extension strategies
- A product life cycle diagram plots sales against time through these stages: development (no sales, costs only), introduction, growth, maturity, decline. Its purpose is to plan marketing and cash flow at each stage. Interpret diagrams by reading the sales curve; early stages carry negative cash flow, and sales flatten at maturity.
- Typical responses: heavy promotion at introduction, widening distribution in growth, defending share in maturity, and harvesting or withdrawing in decline.
- Extension strategies prolong a product’s life: new packaging, new uses, new markets, price cuts, redesign, promotions, new variants. They cost money and may only delay decline.
- Usefulness of the model: helpful for planning, but stages are not predictable in length, and not every product follows the curve.
5. The marketing strategy
- The marketing mix is the combination of product, price, place and promotion. A marketing strategy is the longer-term plan for achieving marketing objectives, which the mix puts into effect.
- Contexts: local (one area, personal service), national (country-wide distribution and media), international/global (adapting to culture, language, law and income, or standardising to save cost).
Product
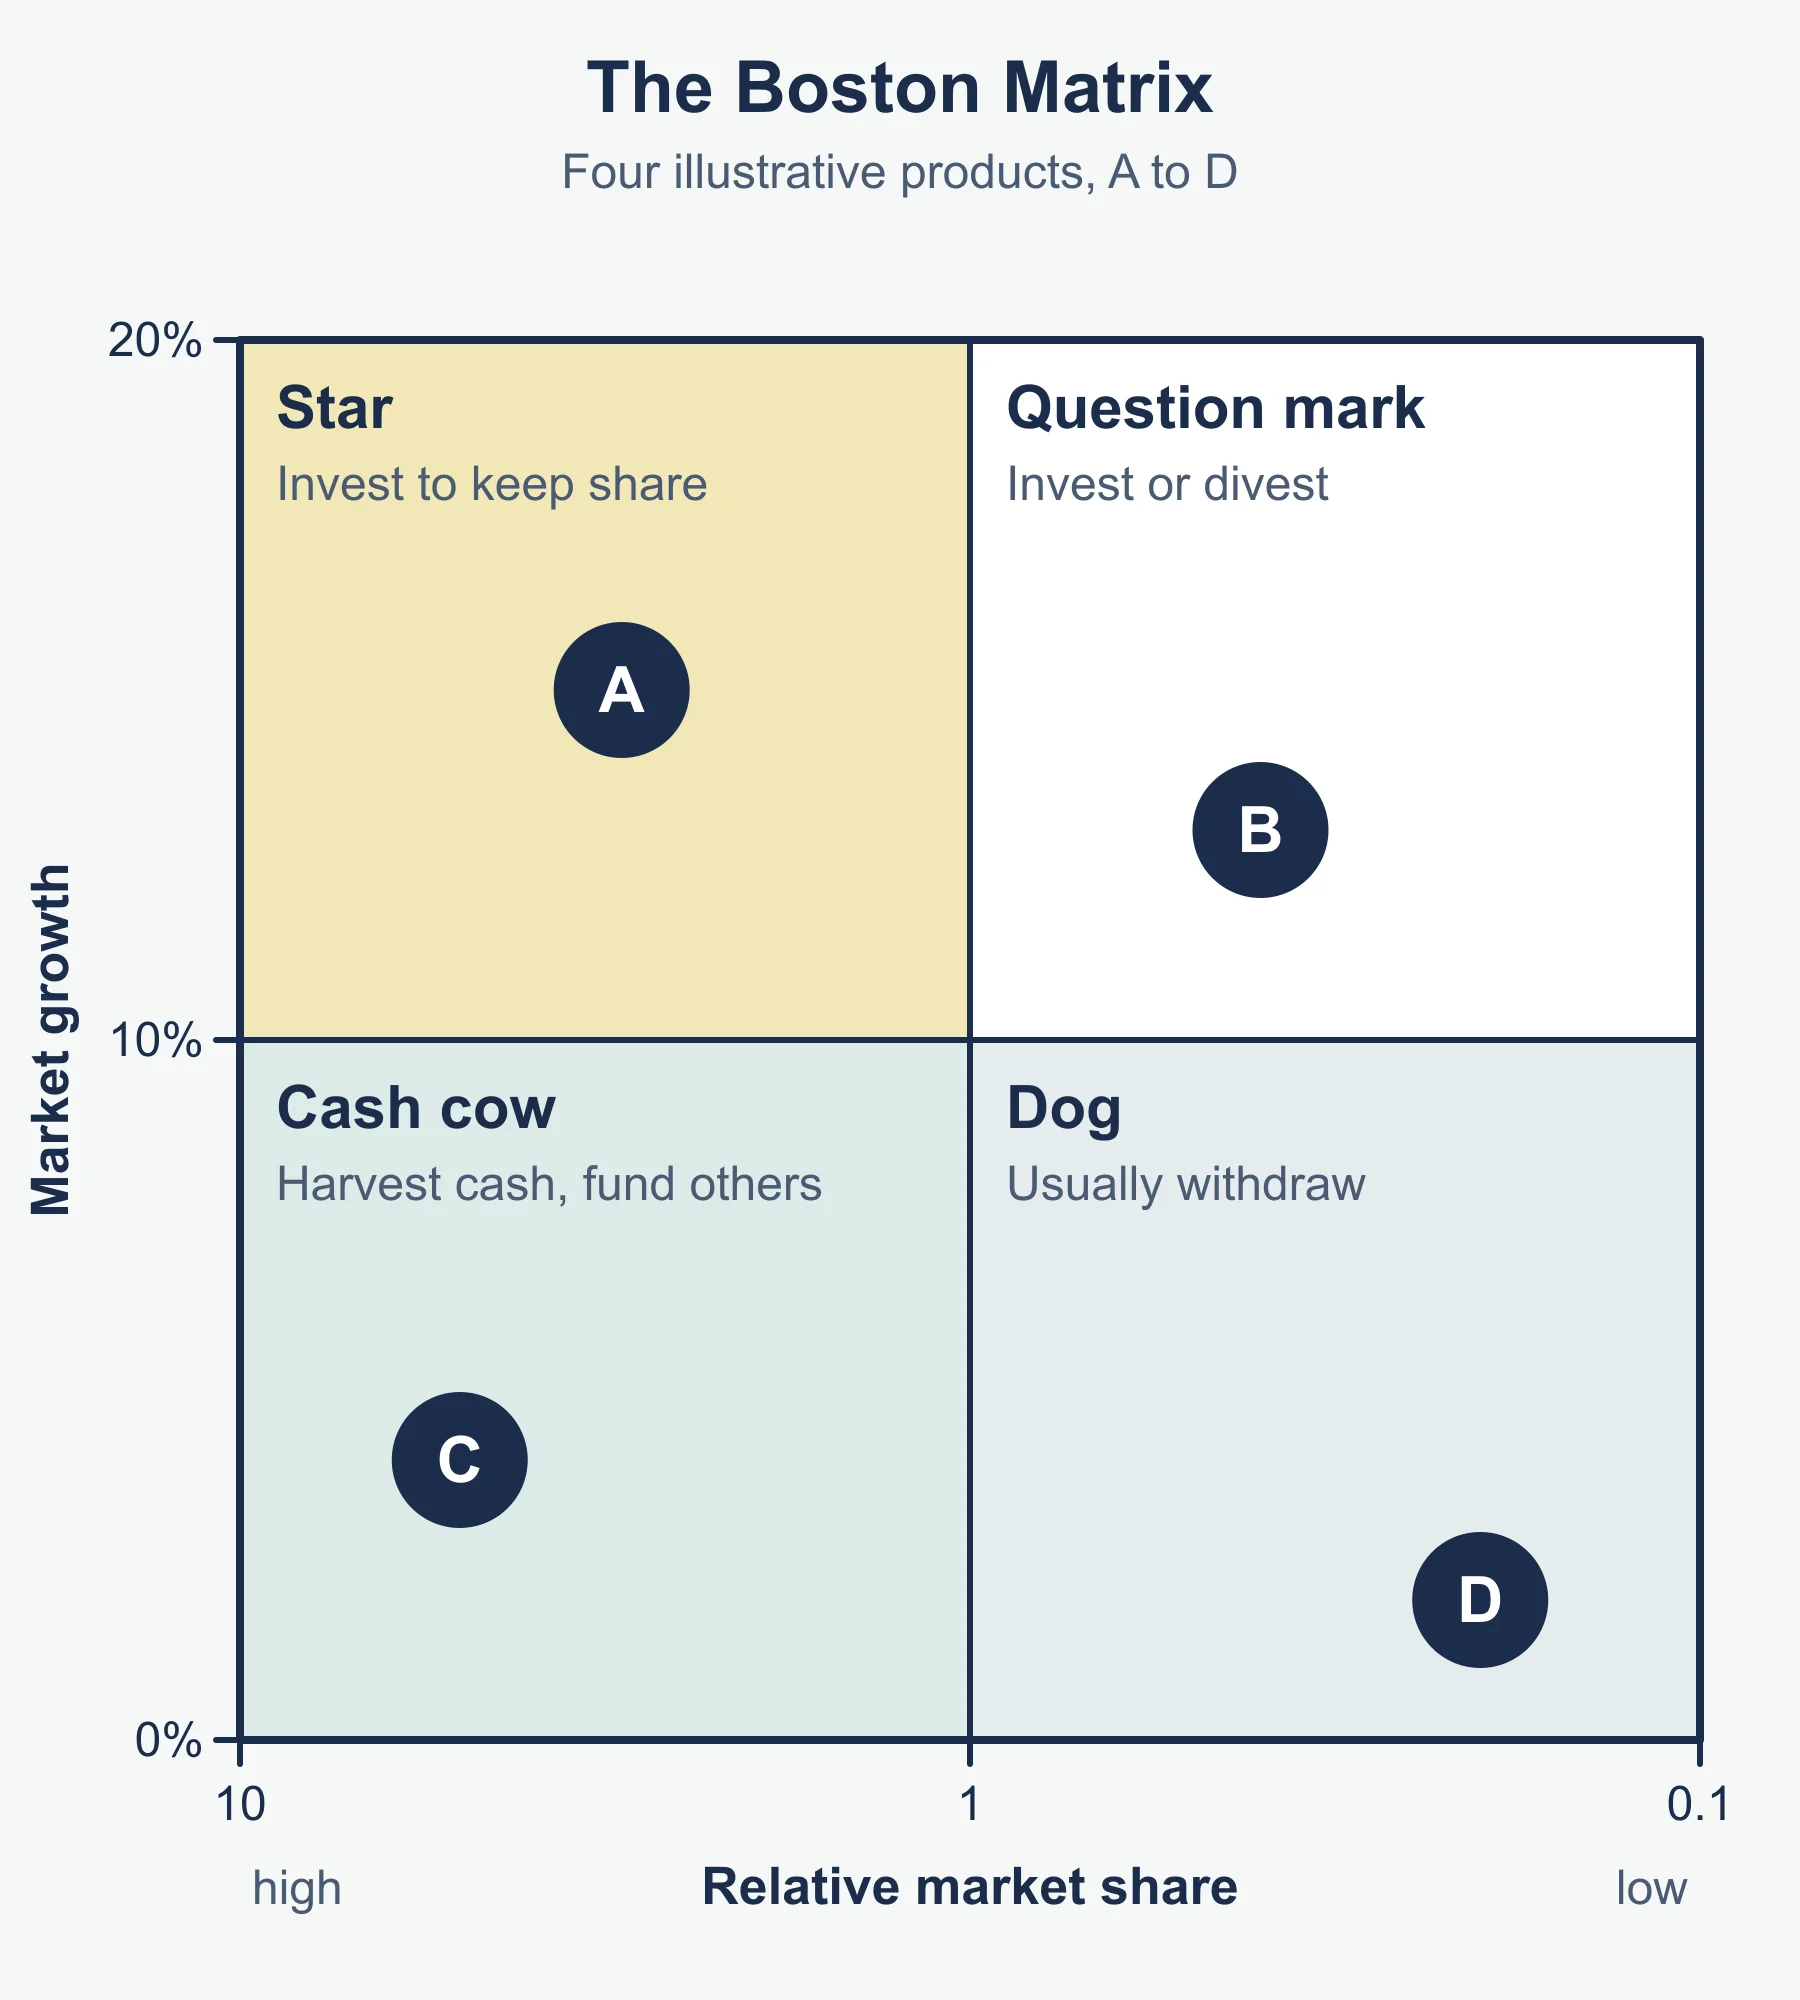
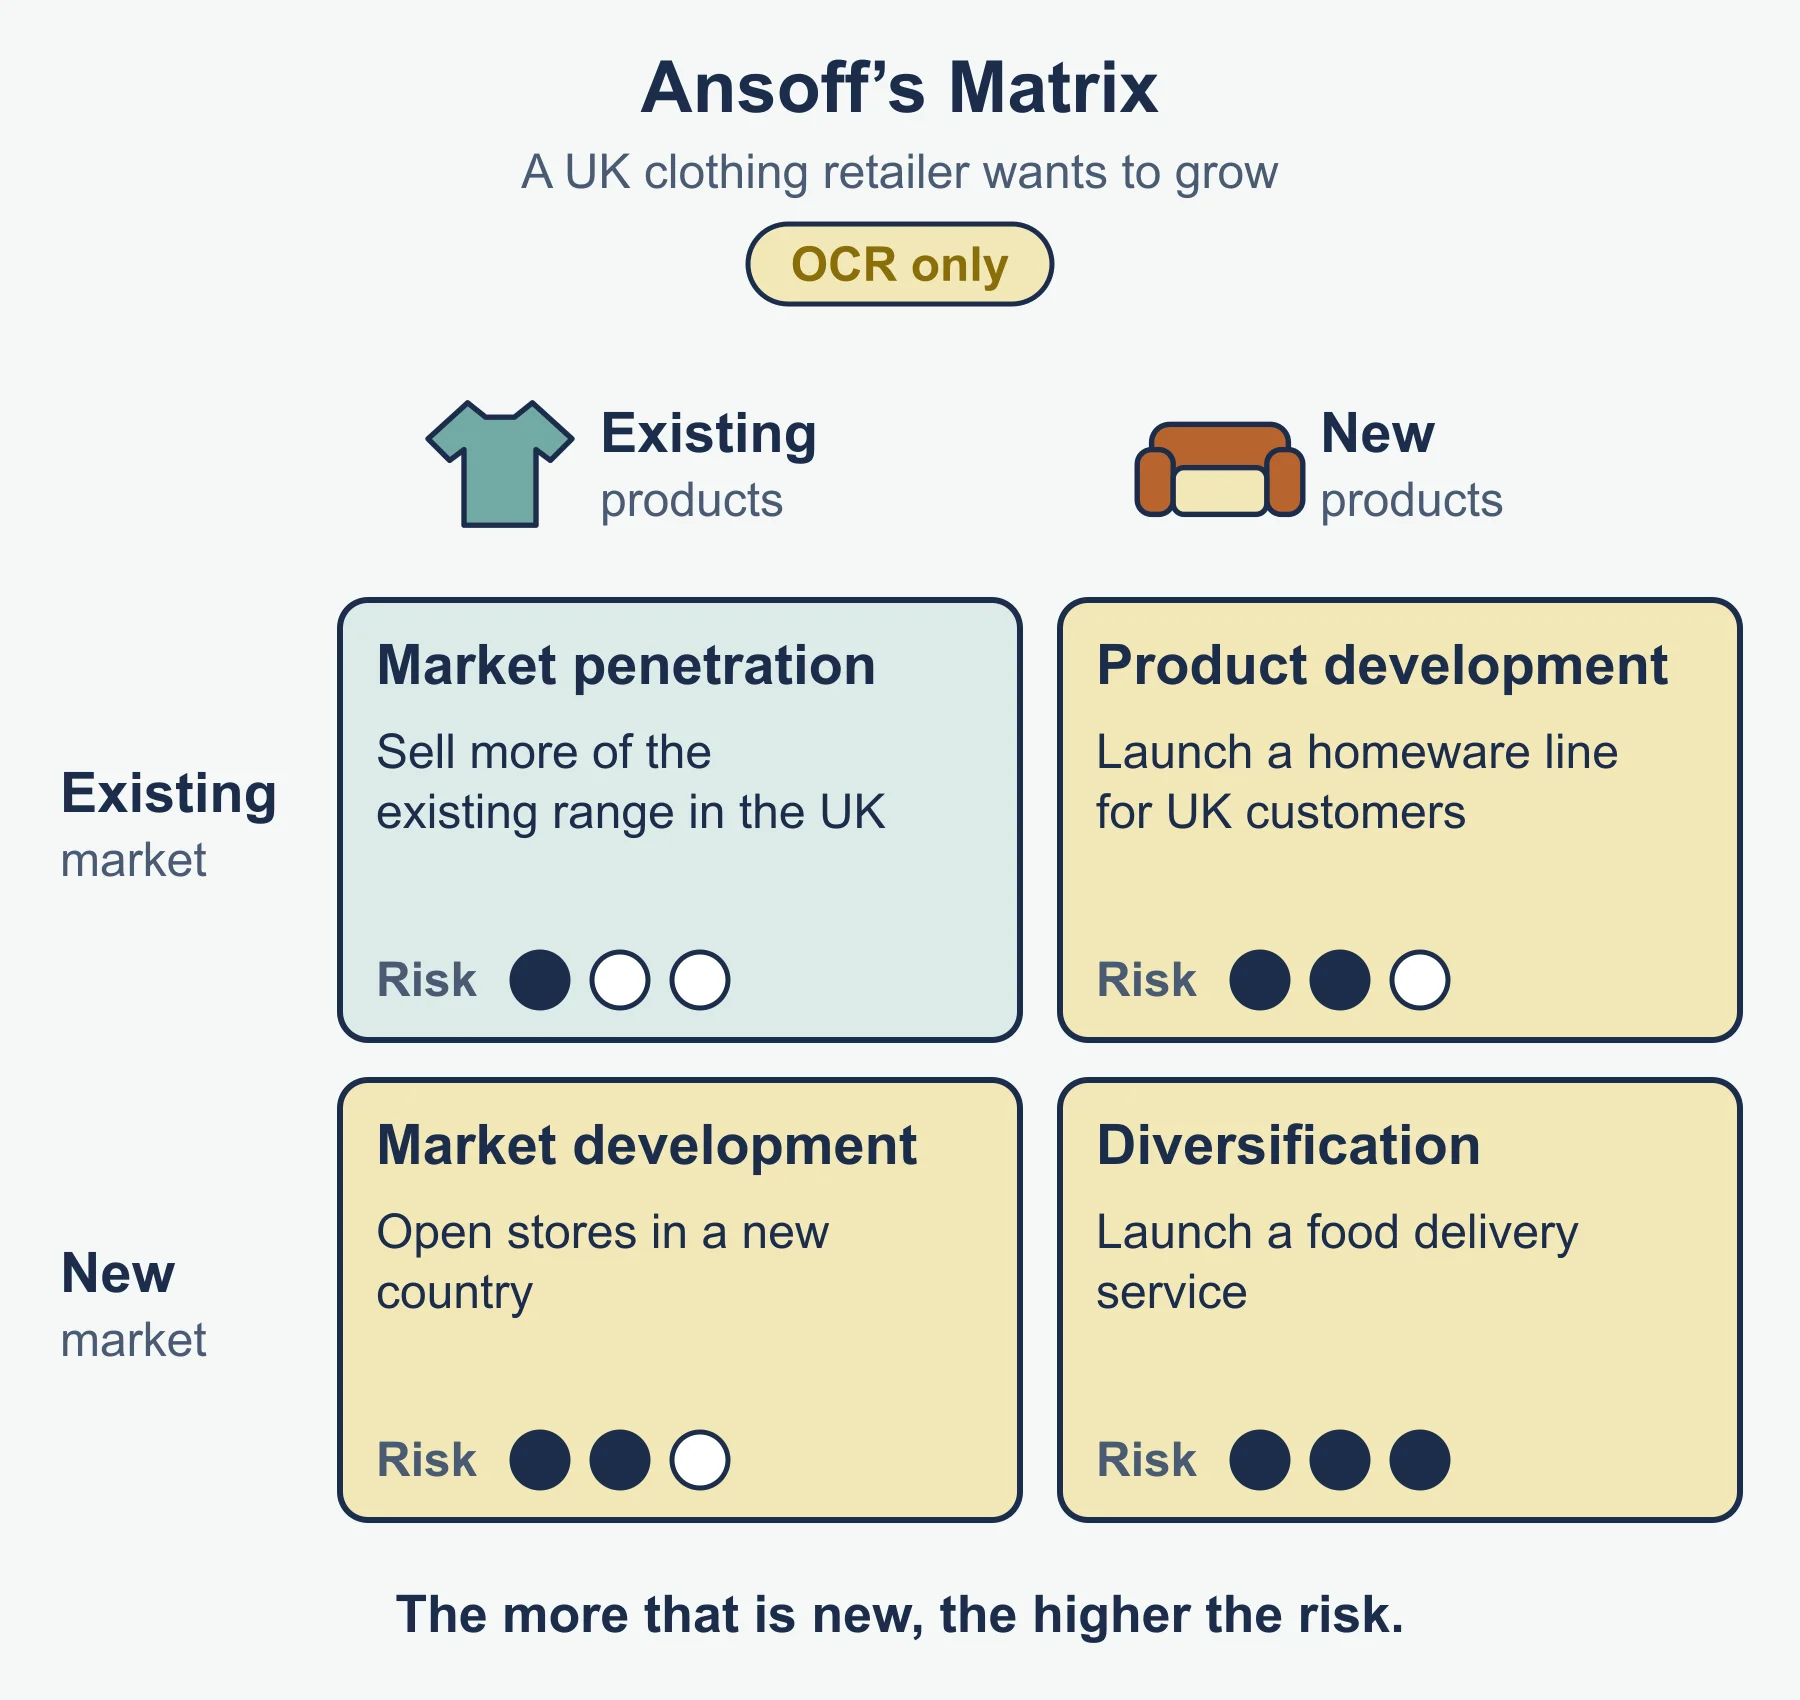
- Product means the goods or service and its features, design, quality and packaging. Evaluate product strategy using the product life cycle, value analysis (comparing the value customers see with the cost of providing each feature), the Boston matrix (stars, cash cows, question marks, dogs, by market share and market growth), Ansoff’s matrix (penetration, product development, market development, diversification) and product portfolio analysis (balancing the range of products).
- A USP is what makes the offer different from rivals. Identify it from features, price or service. It supports a premium price and loyalty, but rivals may copy it.
- A brand is the name, symbol and image identifying a product; branding builds that identity. Strong brands support loyalty and premium pricing but are costly to build and fragile after a scandal.
- Product differentiation makes a product distinct from competitors’, reducing price competition.
Price
- Price is the amount paid. Strategies: skimming (high initial price for new products), penetration (low initial price to gain share), competition-based (set by rivals’ prices), psychological (e.g. £9.99), cost-plus / full-cost (unit cost plus a mark-up), marginal (price covers only the extra cost of one more unit, useful for extra orders), contribution (price minus variable cost, contributing to fixed costs and profit).
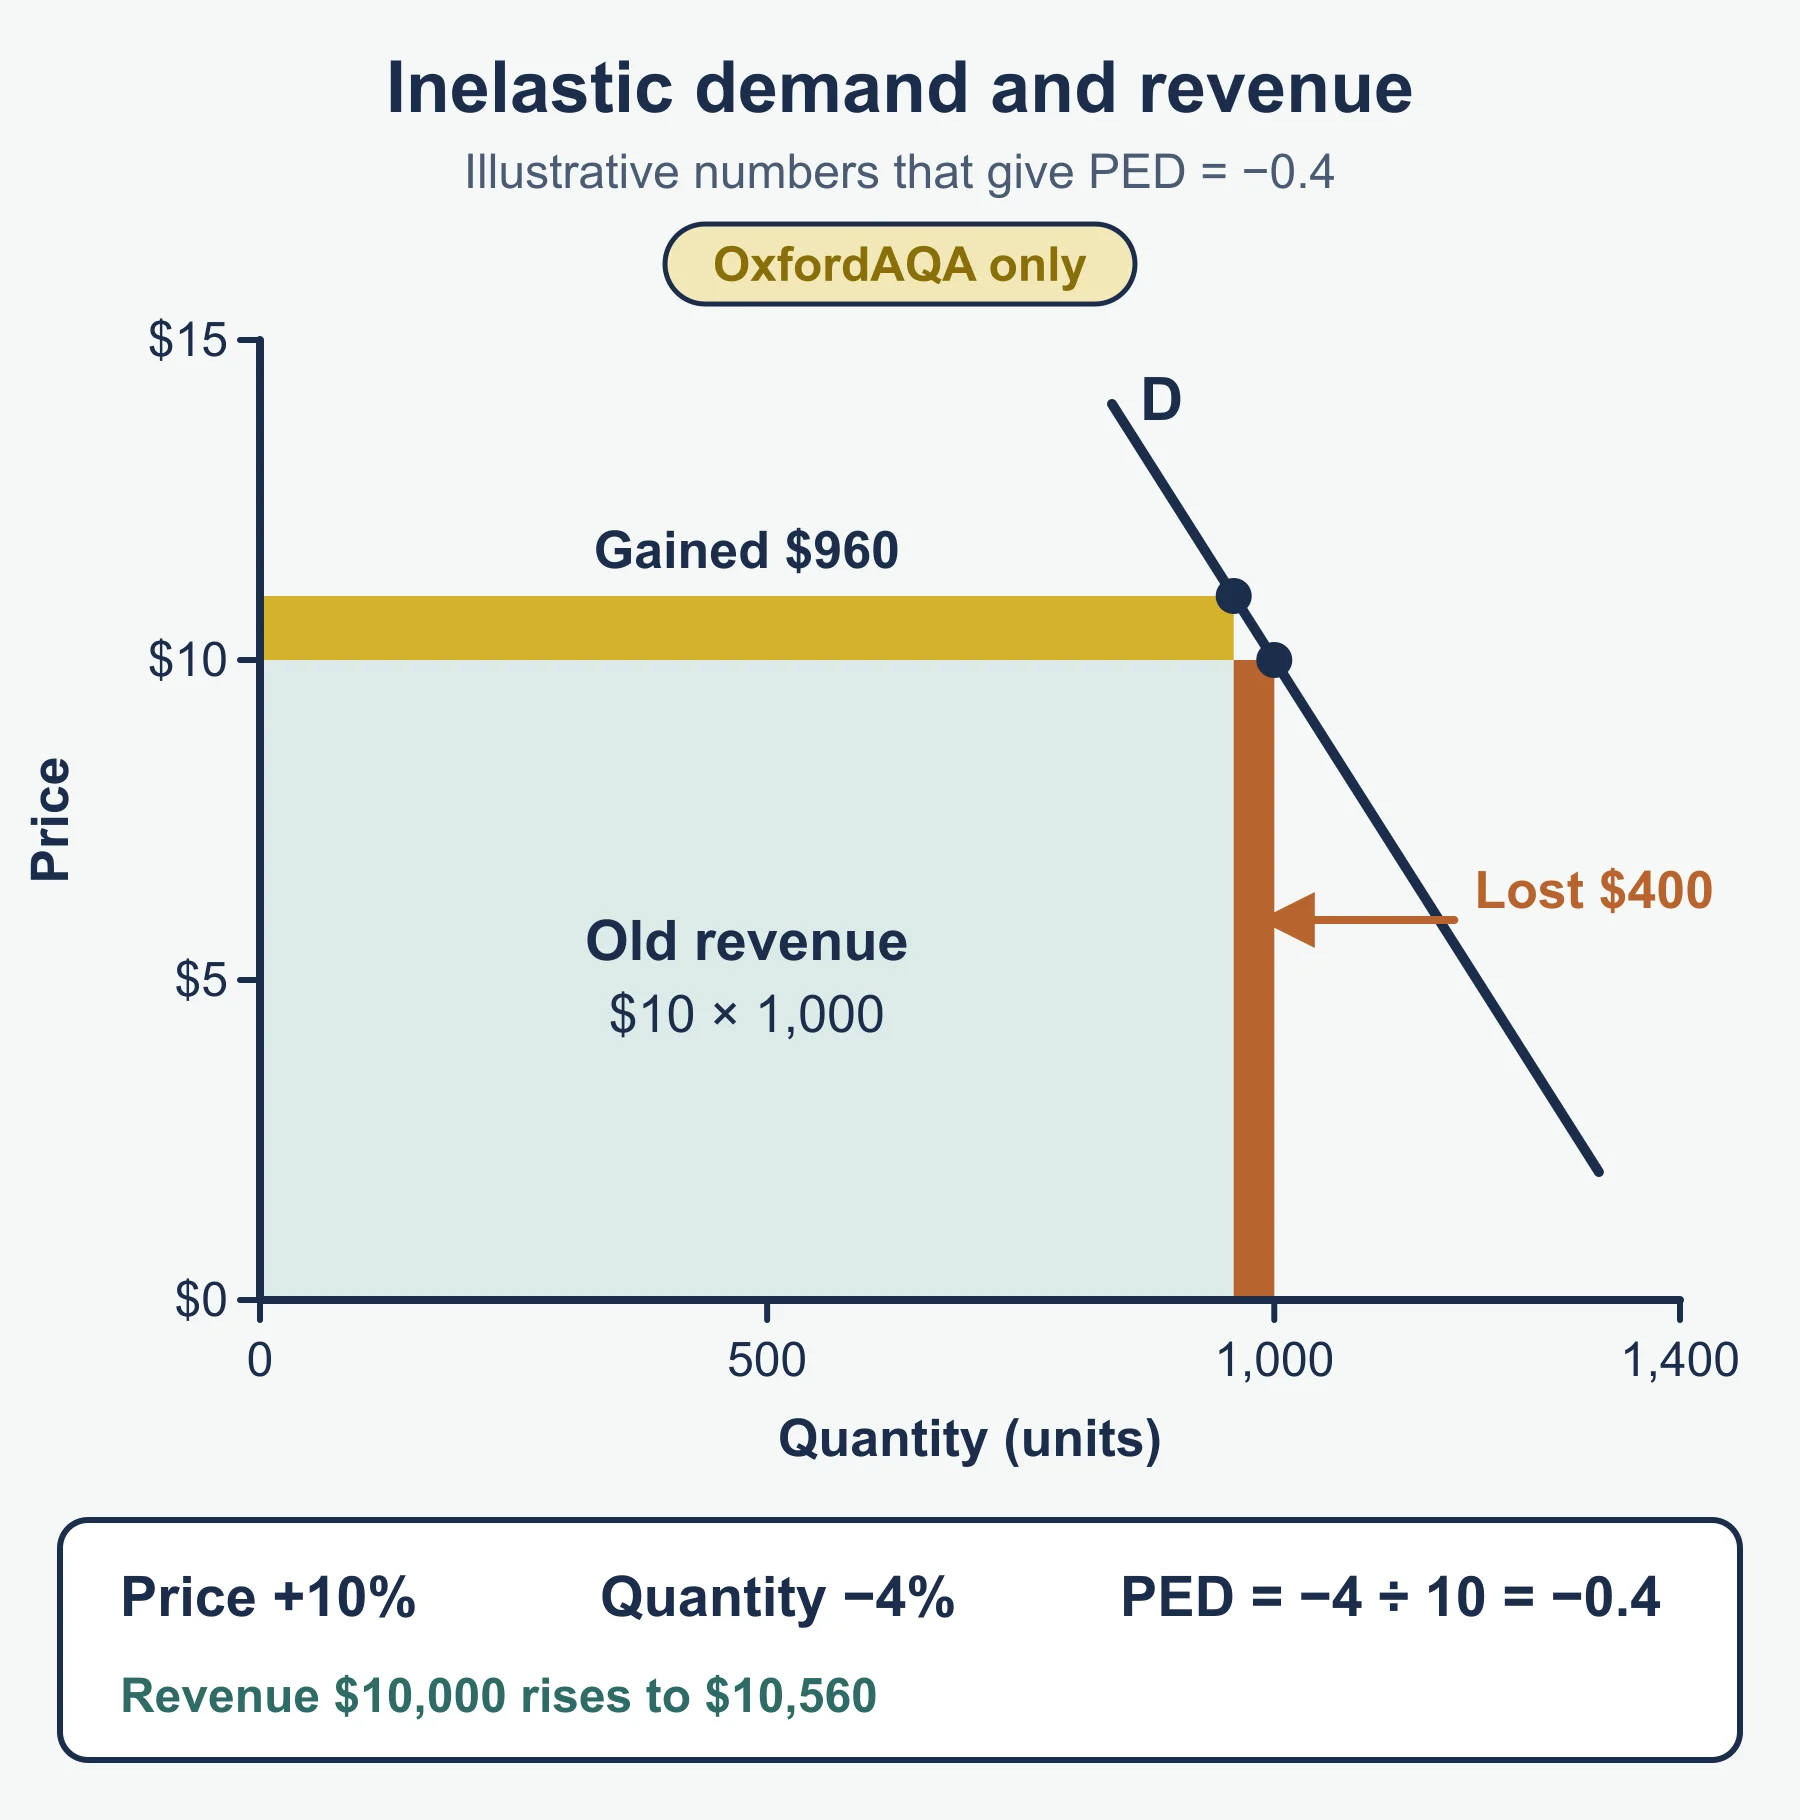
- Elasticities (standard forms): price elasticity of demand (PED) = %ΔQ demanded ÷ %ΔP. Income elasticity (YED) = %ΔQ demanded ÷ %Δ income. Cross elasticity (XED) = %ΔQ demanded of A ÷ %ΔP of B.
Worked example: price +10%, quantity -12%, PED = -1.2, so demand is elastic and revenue falls. YED above 1 suggests a luxury or normal good with high income sensitivity; a negative YED suggests an inferior good. XED positive means substitutes; negative means complements. Limits: they rely on past data and assume other factors are constant.
Place
- Place is how products reach customers. Consider channels of distribution (direct, via retailers, via wholesalers), online, digital and physical distribution (logistics), and patterns of distribution (intensive, selective, exclusive). Shorter channels keep more margin; longer channels reach more people.
Promotion
- Above the line is paid media advertising; below the line covers other methods such as discounts, displays and sponsorship. Also: branding, personal selling, Internet, social media, drip marketing (a steady series of messages over time) and viral marketing (customers spread the message themselves).
- Advertising elasticity of demand (AED) = %ΔQ demanded ÷ %Δ advertising spend. Example: spend +25%, sales +7.5%, AED = 0.3, a weak response. It ignores other influences and delays.
Service marketing
- Services are intangible and made and used at the same time. Besides the four Ps, add process (how the service is delivered), people (staff skills and manner) and physical evidence (premises, uniforms, website, receipts) that make the service tangible.
6. External influences and the strategy
- Evaluate effects on marketing of social change (tastes, demographics), legal rules (for example on advertising and consumer protection, in general terms), ethical expectations, environmental concerns, economic conditions (income, interest rates, exchange rates), political decisions, technological change (e-commerce, data) and international factors (trade, competitors, culture).
- A good strategy fits objectives, resources, customers and the environment, and the mix works together. To recommend and justify, give a choice, support it with evidence from the case, weigh a risk or alternative, and reach a judgement.
Quick self-test
- State two differences between primary and secondary research.
- A firm sells £2.4m in a £16m market. Calculate its market share.
- A market grows from £20m to £21m. Calculate growth.
- Name the three letters of ATR.
- Price falls 5% and quantity rises 8%. Calculate PED.
- Income rises 4% and demand rises 2%. Calculate YED.
- Which pricing strategy sets a high price at launch?
- Name the three extra elements in service marketing.
- Define a USP.
- Which sampling method fills set numbers of each type of person?
Answers
- Primary is new and specific, but costly and slow; secondary already exists, cheaper, but may be dated or not fit.
- 15%.
- 5%.
- Awareness, Trial, Reinforcement.
- 8/-5 = -1.6 (elastic).
- 2/4 = 0.5.
- Skimming.
- Process, people, physical evidence.
- A feature that makes a product different from rivals and gives customers a reason to choose it.
- Quota sampling.
Where marks are usually lost
- Giving a bare definition with no link to the business in the stem.
- Listing sampling methods or pricing strategies without judging which suits the situation.
- Mixing up market share (a proportion of the market) with sales growth or market growth.
- Dropping the sign or the unit when calculating elasticity, or not saying what the figure means.
- Treating the Boston matrix or product life cycle as exact predictions.
- Confusing a customer with a consumer, or B2B with B2C methods.
- Evaluating with a one-sided answer and no final judgement for “evaluate” or “justify”.
- Ignoring the stakeholders when the question names them.
Frequently asked questions
What is the difference between a customer and a consumer? Customers are those who pay and consumers are those who use the product. A parent may be the customer and a child the consumer.
How do you calculate price elasticity of demand for OCR A Level Business H431? PED = % change in quantity demanded ÷ % change in price, which is the standard form. For example, a 10% price rise with a 12% fall in quantity gives −1.2, so demand is elastic and revenue falls.
What extra elements are added for service marketing? Process, people and physical evidence are added to the four Ps, because services are intangible and are made and used at the same time.
Do the Boston Matrix and product life cycle predict exactly what will happen? No. Stages of the product life cycle are not predictable in length and not every product follows the curve, so treat both models as planning aids rather than exact predictions.
Official syllabus
OCR Level 3 Advanced GCE in Business (H431) specification, Version 2.1 (January 2026), for first assessment in 2017 (final assessment summer 2027), published by OCR.
Get free revision emails (optional)
Occasional emails with practice questions, worked explanations and links to free resources for the qualification and subjects you choose. No spam, and you can unsubscribe from any email. The free tools on this site never need an email.
Related resources
-
Study guides
OCR A Level Business: Marketing and Marketing Strategies (H431)
Study guide to marketing and marketing strategies for OCR A Level Business H431: the marketing mix, product life cycle, Boston Matrix and Ansoff's Matrix.
Business · OCR · A Level
Read guide -
Practice questions
OCR A Level Business: Marketing and marketing strategies (H431) – Practice Questions
Twelve original practice questions with worked answers on OCR A Level Business (H431) content area 3, Marketing and marketing strategies.
Business · OCR · A Level
Try questions -
Study guides
OCR A Level Business: Measures of performance: financial and non-financial (H431)
Guide to financial and non-financial measures of performance for OCR A Level Business H431, with worked ratio, cash-flow and variance examples.
Business · OCR · A Level
Read guide
Related articles
-
teaching
A Level tuition in Dubai: Cambridge or Pearson Edexcel International A Level?
Schools in Dubai and Abu Dhabi teach either Cambridge International AS & A Level or Pearson Edexcel International A Level. How the two are structured, why it matters for tuition, and how online classes from Lahore work.
9 October 2026
-
curriculum guides
Choosing subjects at IGCSE and A Level
How subject choices at 14 and 16 affect university options later, and how to keep pathways open without overloading a timetable.
28 July 2026
Studying this with a teacher
Working through Business A LEVELS?
This page is free and stays free. If you would rather be taught it, Marlbridge runs Business classes one-to-one, online in your own time zone. One-to-one only for this course: Rs 6,000 per class in Pakistan, with other currencies on the fees page. The first trial class is free. WhatsApp replies within an hour (8am–11pm Pakistan time, every day); email the same day.
OCR Business teachers at Marlbridge
