
Study Guides
OCR A Level Business: Measures of performance: financial and non-financial (H431)
Guide to financial and non-financial measures of performance for OCR A Level Business H431, with worked ratio, cash-flow and variance examples.
- Subject
- Business
- Level
- A LEVELS
- Topic
- Business objectives and strategic decisions
- Author
- Marlbridge Academic Team
- Updated
- Reviewed by
- Salman Ahmad (what this means)
Aligned to OCR A Level Business (H431), Version 2.1 (January 2026), for first assessment in 2017; final assessment summer 2027. Official specification .
Syllabus page (what it covers and how it is assessed): OCR A Level Business.
Syllabus points this page covers
H431
- 1.11 Measures of performance: financial and non-financial
Found an error? Report a correction.
Need help with this topic? Request a free trial class for A Level Business (H431).
This guide teaches the content point headed Measures of performance: financial and non-financial, in the Business objectives and strategy area of the OCR A Level Business H431 specification (Version 2.1, January 2026; final assessment summer 2027). It is part of the Business objectives and strategic decisions unit. The specification says content in one section may be assessed in any context, so expect these measures to turn up in case studies on any topic. Every example uses an invented business.
Use the OCR A Level Business hub, the printable checklist and the free 10-minute diagnostics alongside it. The companions are the revision notes and the practice questions. For the wider unit see the Objectives and Strategic Decisions study guide, the revision notes and the practice set.
What the specification asks you to do
| Strand | You must be able to |
|---|---|
| Types of measure | Distinguish financial from non-financial measures; identify each kind |
| Financial measures | Identify final accounts, ratio analysis, gearing, cash flow, budgets and variance analysis; calculate and interpret them |
| Key distinctions | Cash flow versus profit; liquidity versus profitability versus efficiency |
| Limits | Explain why published accounts are not a complete picture |
| Non-financial measures | Identify market share, resource utilisation, environmental impact, quality, customer satisfaction and similar; explain their importance |
| Purpose | Explain why businesses measure performance; evaluate the advantages and disadvantages |
| Evaluation | Judge performance using both kinds of measure, and from the viewpoint of different stakeholders |
Financial and non-financial measures
A financial measure is expressed in money terms or derived from money figures, such as profit, a ratio built from the accounts, or a cash balance. A non-financial measure describes performance in other units: percentages of customers satisfied, units of waste, hours of machine time. The measures the specification names are final accounts, ratio analysis, gearing, cash flow, budgets and variance analysis on the financial side, and market share, resource utilisation, environmental impact, quality and customer satisfaction on the other. “Etc.” in the text means you may add others, such as staff turnover or delivery times.
Final accounts and measures of profit
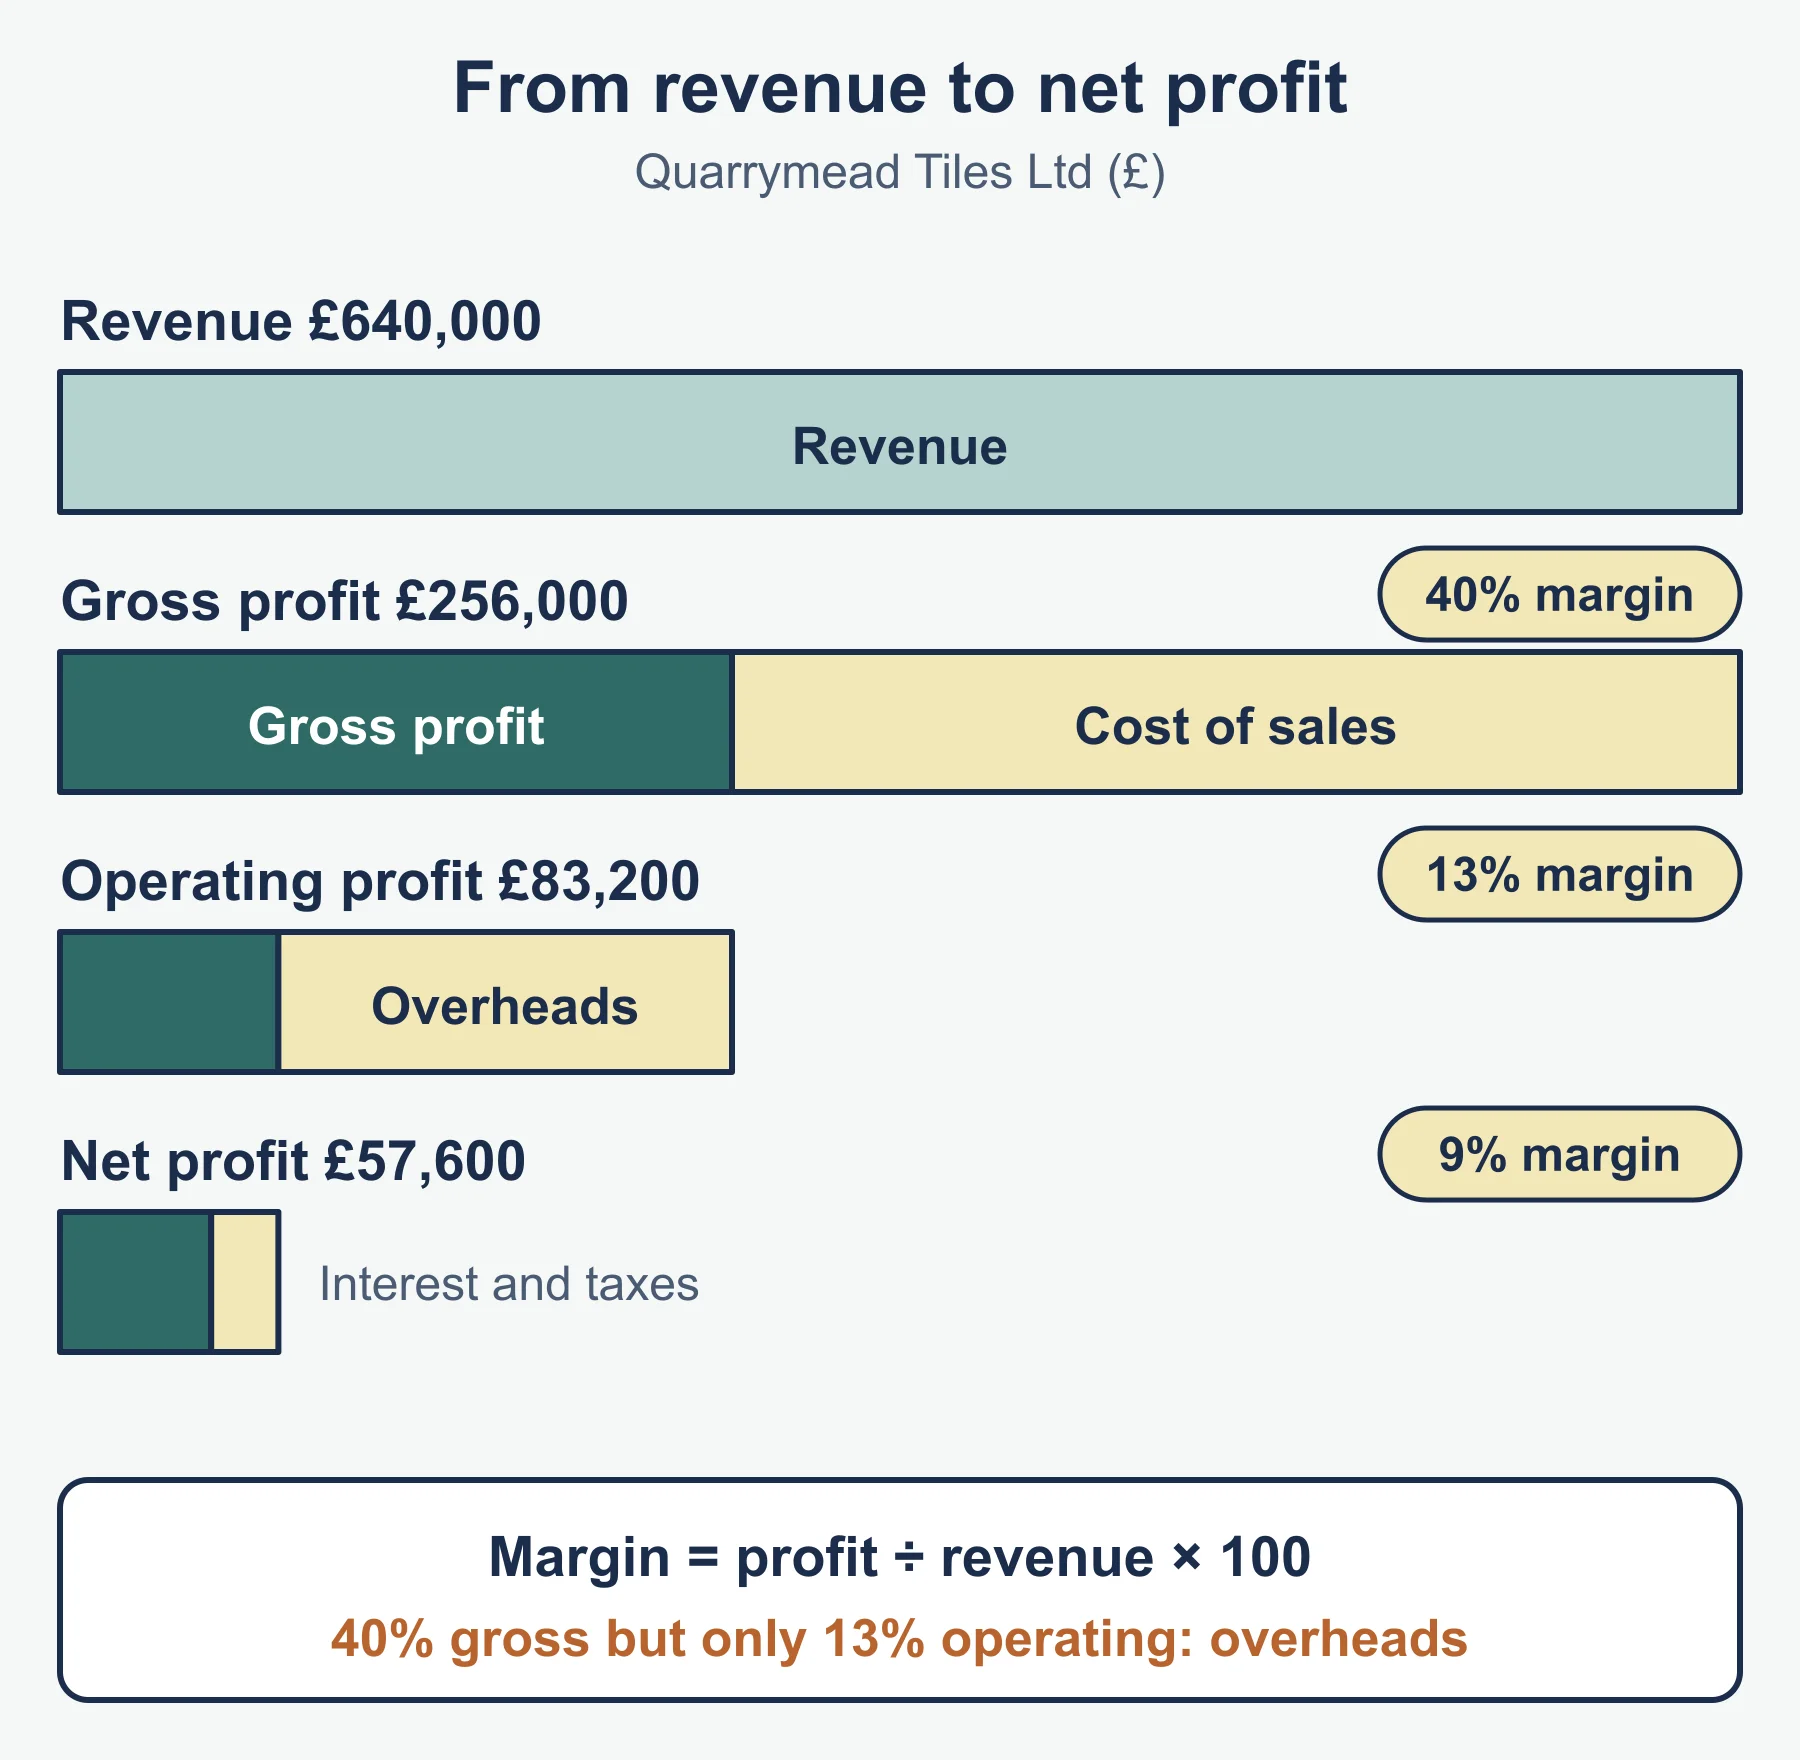
The final accounts are the income statement and the statement of financial position. The income statement gives three profit measures:
- Gross profit = sales revenue minus cost of sales.
- Operating profit = gross profit minus operating expenses.
- Net profit = operating profit minus finance costs (tax is ignored in the examples here).
The statement of financial position lists non-current assets, current assets (inventory, receivables, cash), current liabilities (payables), non-current liabilities, and the shareholders’ equity that funds them. It is a snapshot at one date, so it shows what the business owns and owes, not how it traded.
Ratio analysis
The specification does not print formulas. These are the standard forms; if a question defines a ratio differently, use its definition.
| Type | Ratio | Standard form |
|---|---|---|
| Liquidity | Current ratio | current assets / current liabilities |
| Liquidity | Acid test | (current assets - inventory) / current liabilities |
| Profitability | Gross profit margin | gross profit / sales revenue x 100 |
| Profitability | Net profit margin | net profit / sales revenue x 100 |
| Profitability | ROCE | operating profit / capital employed x 100 |
| Efficiency | Stock turnover | cost of sales / inventory (times a year) |
| Efficiency | Debtor days | receivables / sales revenue x 365 |
| Solvency | Gearing | non-current liabilities / capital employed x 100 |
| Solvency | Interest cover | operating profit / finance costs (times) |
Debtor days is the same idea as the specification’s debtor turnover, expressed in days. Capital employed here is shareholders’ equity plus non-current liabilities. Liquidity asks whether the business can pay short-term debts. Profitability asks how much profit it earns from revenue or capital. Efficiency asks how well it uses assets and credit. Do not mix them up: a firm can be highly profitable and still illiquid.
Worked example: Hallbrook Joinery Ltd
| Item (£) | Year 1 | Year 2 |
|---|---|---|
| Sales revenue | 840,000 | 960,000 |
| Cost of sales | 504,000 | 624,000 |
| Operating expenses | 252,000 | 288,000 |
| Finance costs | 12,000 | 18,000 |
| Inventory | 110,000 | 150,000 |
| Receivables | 90,000 | 130,000 |
| Cash | 40,000 | 10,000 |
| Payables | 100,000 | 160,000 |
| Capital employed | 560,000 | 580,000 |
| Non-current liabilities | 150,000 | 200,000 |
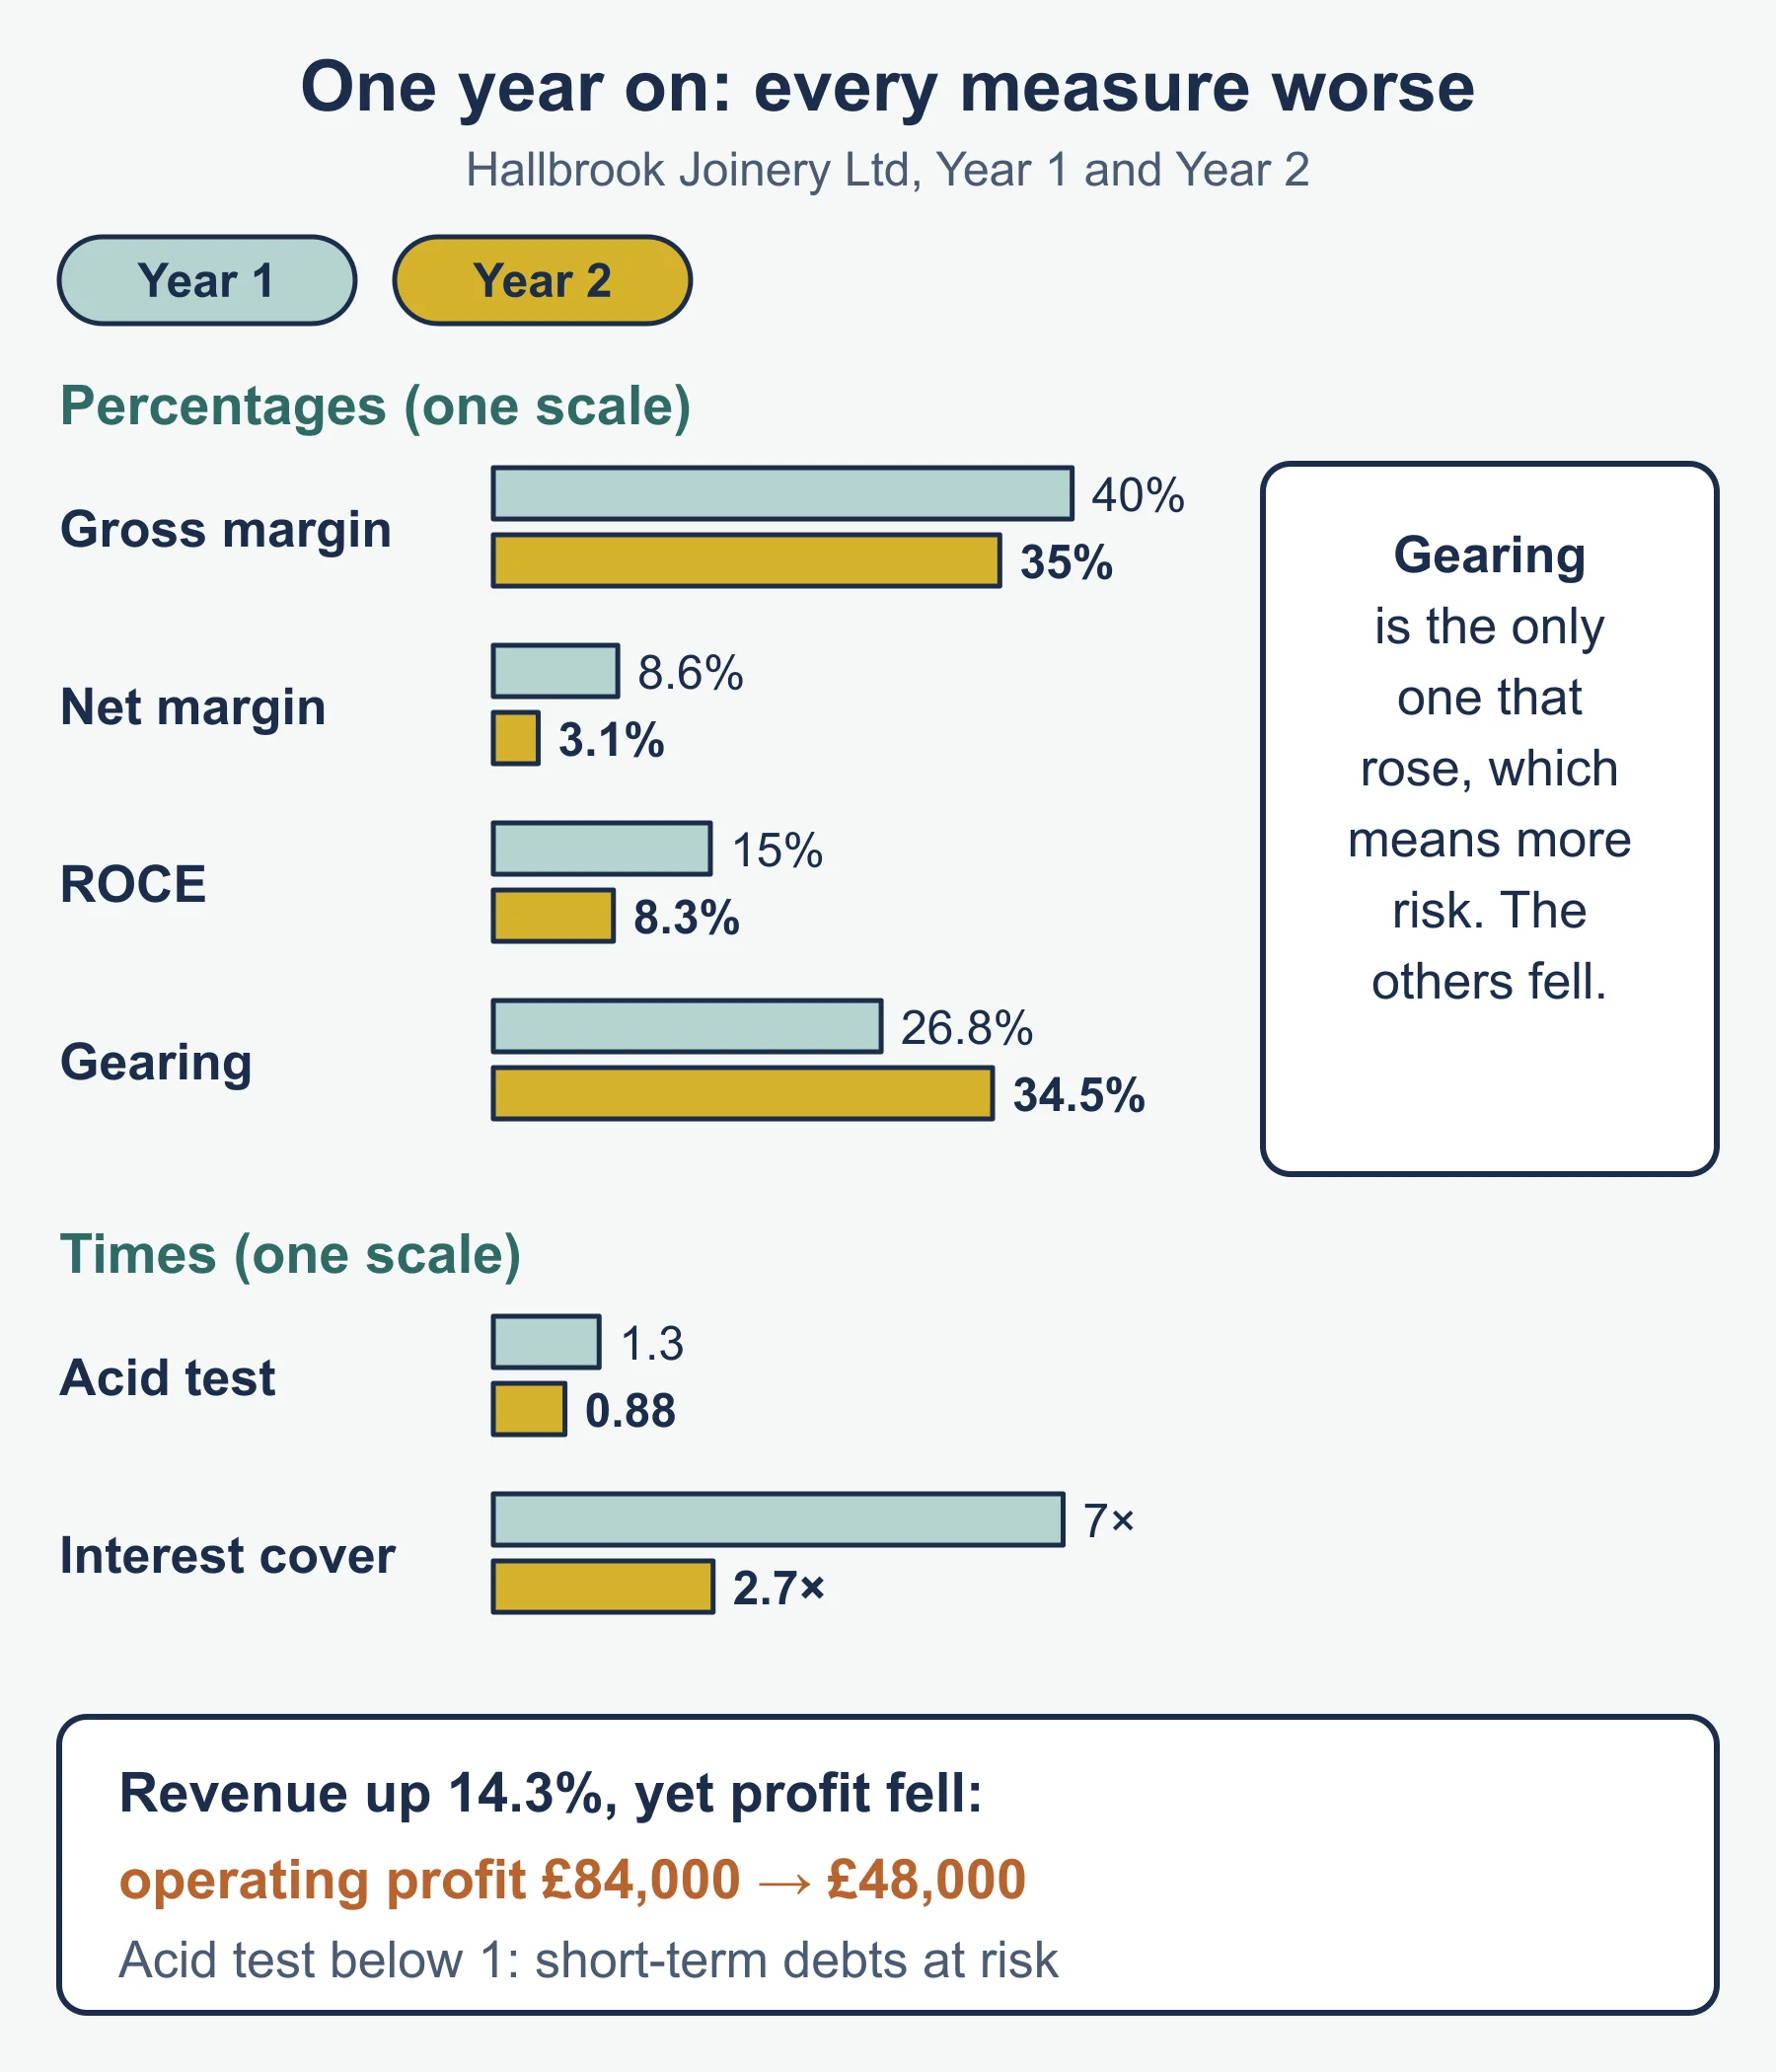
Gross profit is £336,000 in both years, so gross margin falls from 40.0% to 35.0%. Operating profit is £84,000 then £48,000, and net profit £72,000 then £30,000, so net margin falls from 8.6% to 3.1%. ROCE falls from 15.0% to 8.3%.
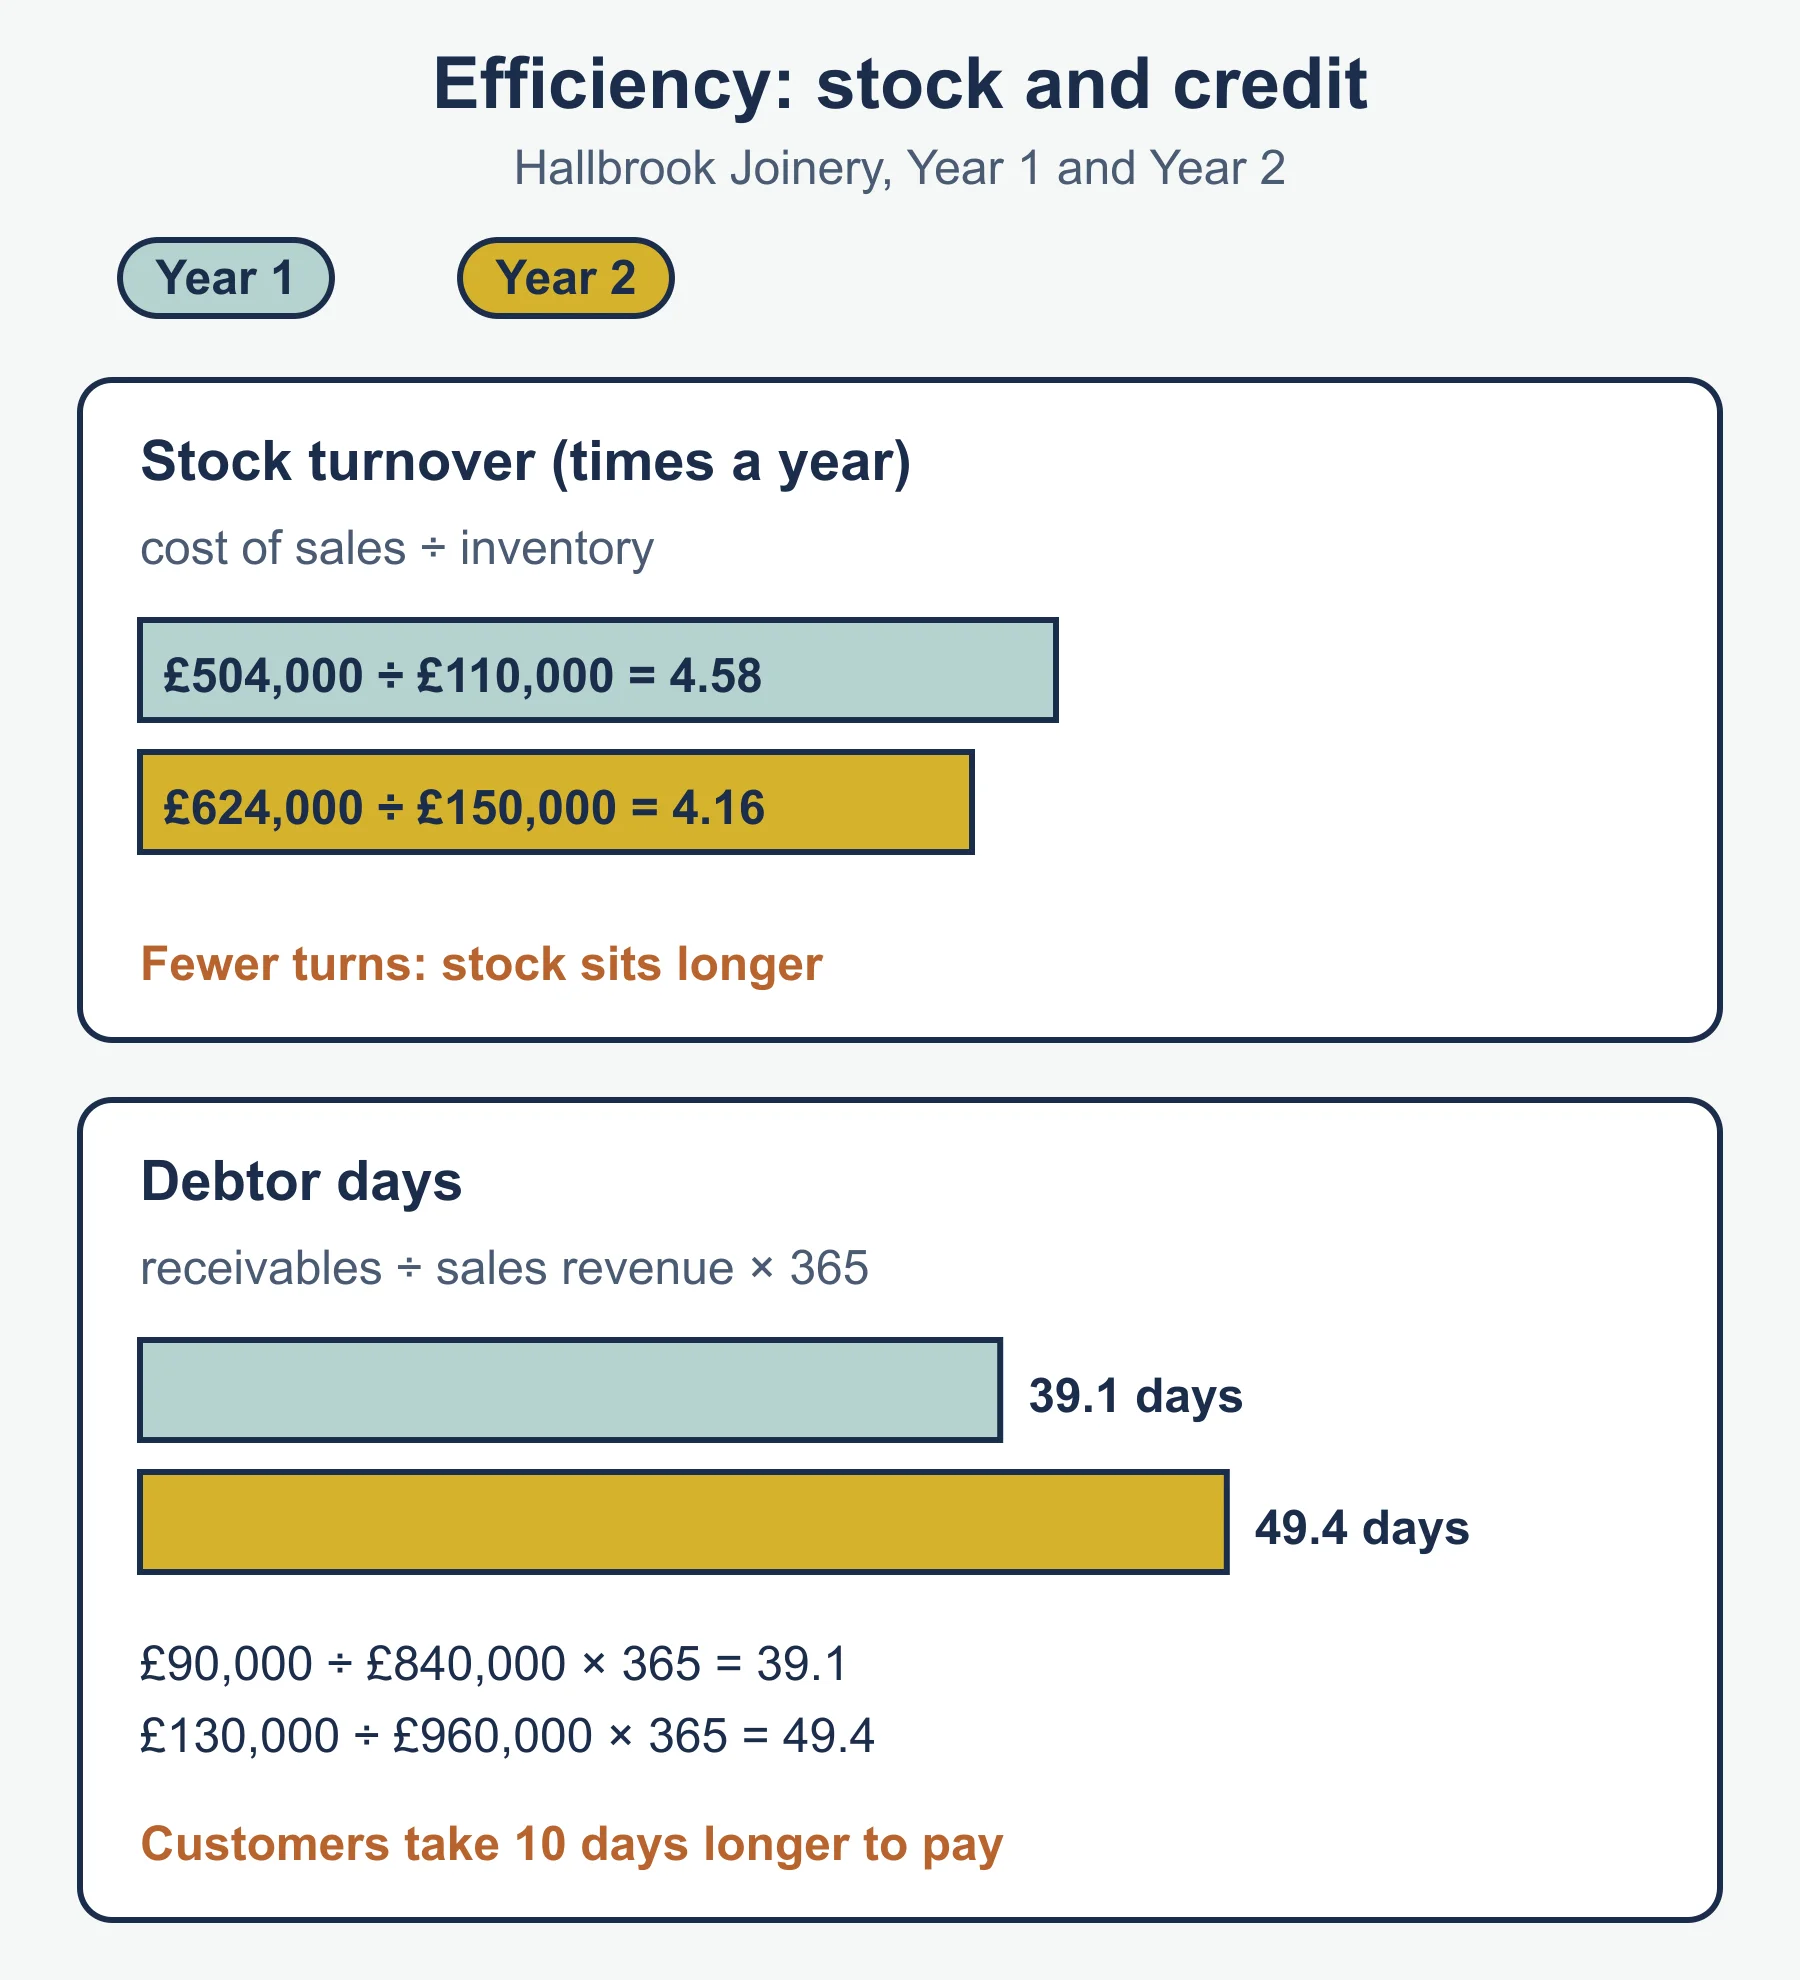
Current assets are £240,000 then £290,000, so the current ratio falls from 2.40 to 1.81. The acid test falls from 1.30 to 0.88, because inventory has grown to £150,000. Stock turnover slips from 4.58 to 4.16 times, and debtor days stretch from 39.1 to 49.4. Gearing rises from 26.8% to 34.5%, and interest cover drops from 7.0 to 2.7 times.
Interpretation. Revenue rose by 14.3%, yet profit fell sharply, so growth was bought with lower margins and more working capital. Cash fell from £40,000 to £10,000 while customers took longer to pay and borrowing rose. An acid test below 1 means liquid assets no longer cover short-term debts. The weakness is liquidity and profitability together. A fair judgement also notes that two years is a short trend, and that Hallbrook’s own targets and its rivals’ ratios would show how serious this is.
Gearing
Gearing shows how much of the capital employed comes from long-term borrowing. Higher gearing means more interest to pay whatever the trading result, and more exposure if interest rates rise. It can also raise returns to shareholders when profit is high. Interest cover tests the burden directly: Hallbrook’s 2.7 times means a further fall in operating profit of about 62% would leave nothing for interest.
Cash flow and profit
Profit is revenue minus costs on the income statement. Cash flow is the actual movement of money in and out. A cash-flow forecast looks ahead; a cash-flow statement reports what happened. They differ because of credit sales, credit purchases, the timing of payments, inventory, depreciation (a cost that involves no payment) and capital spending (cash out, but not a cost in one month).
Worked example: Penmarsh Bakehouse
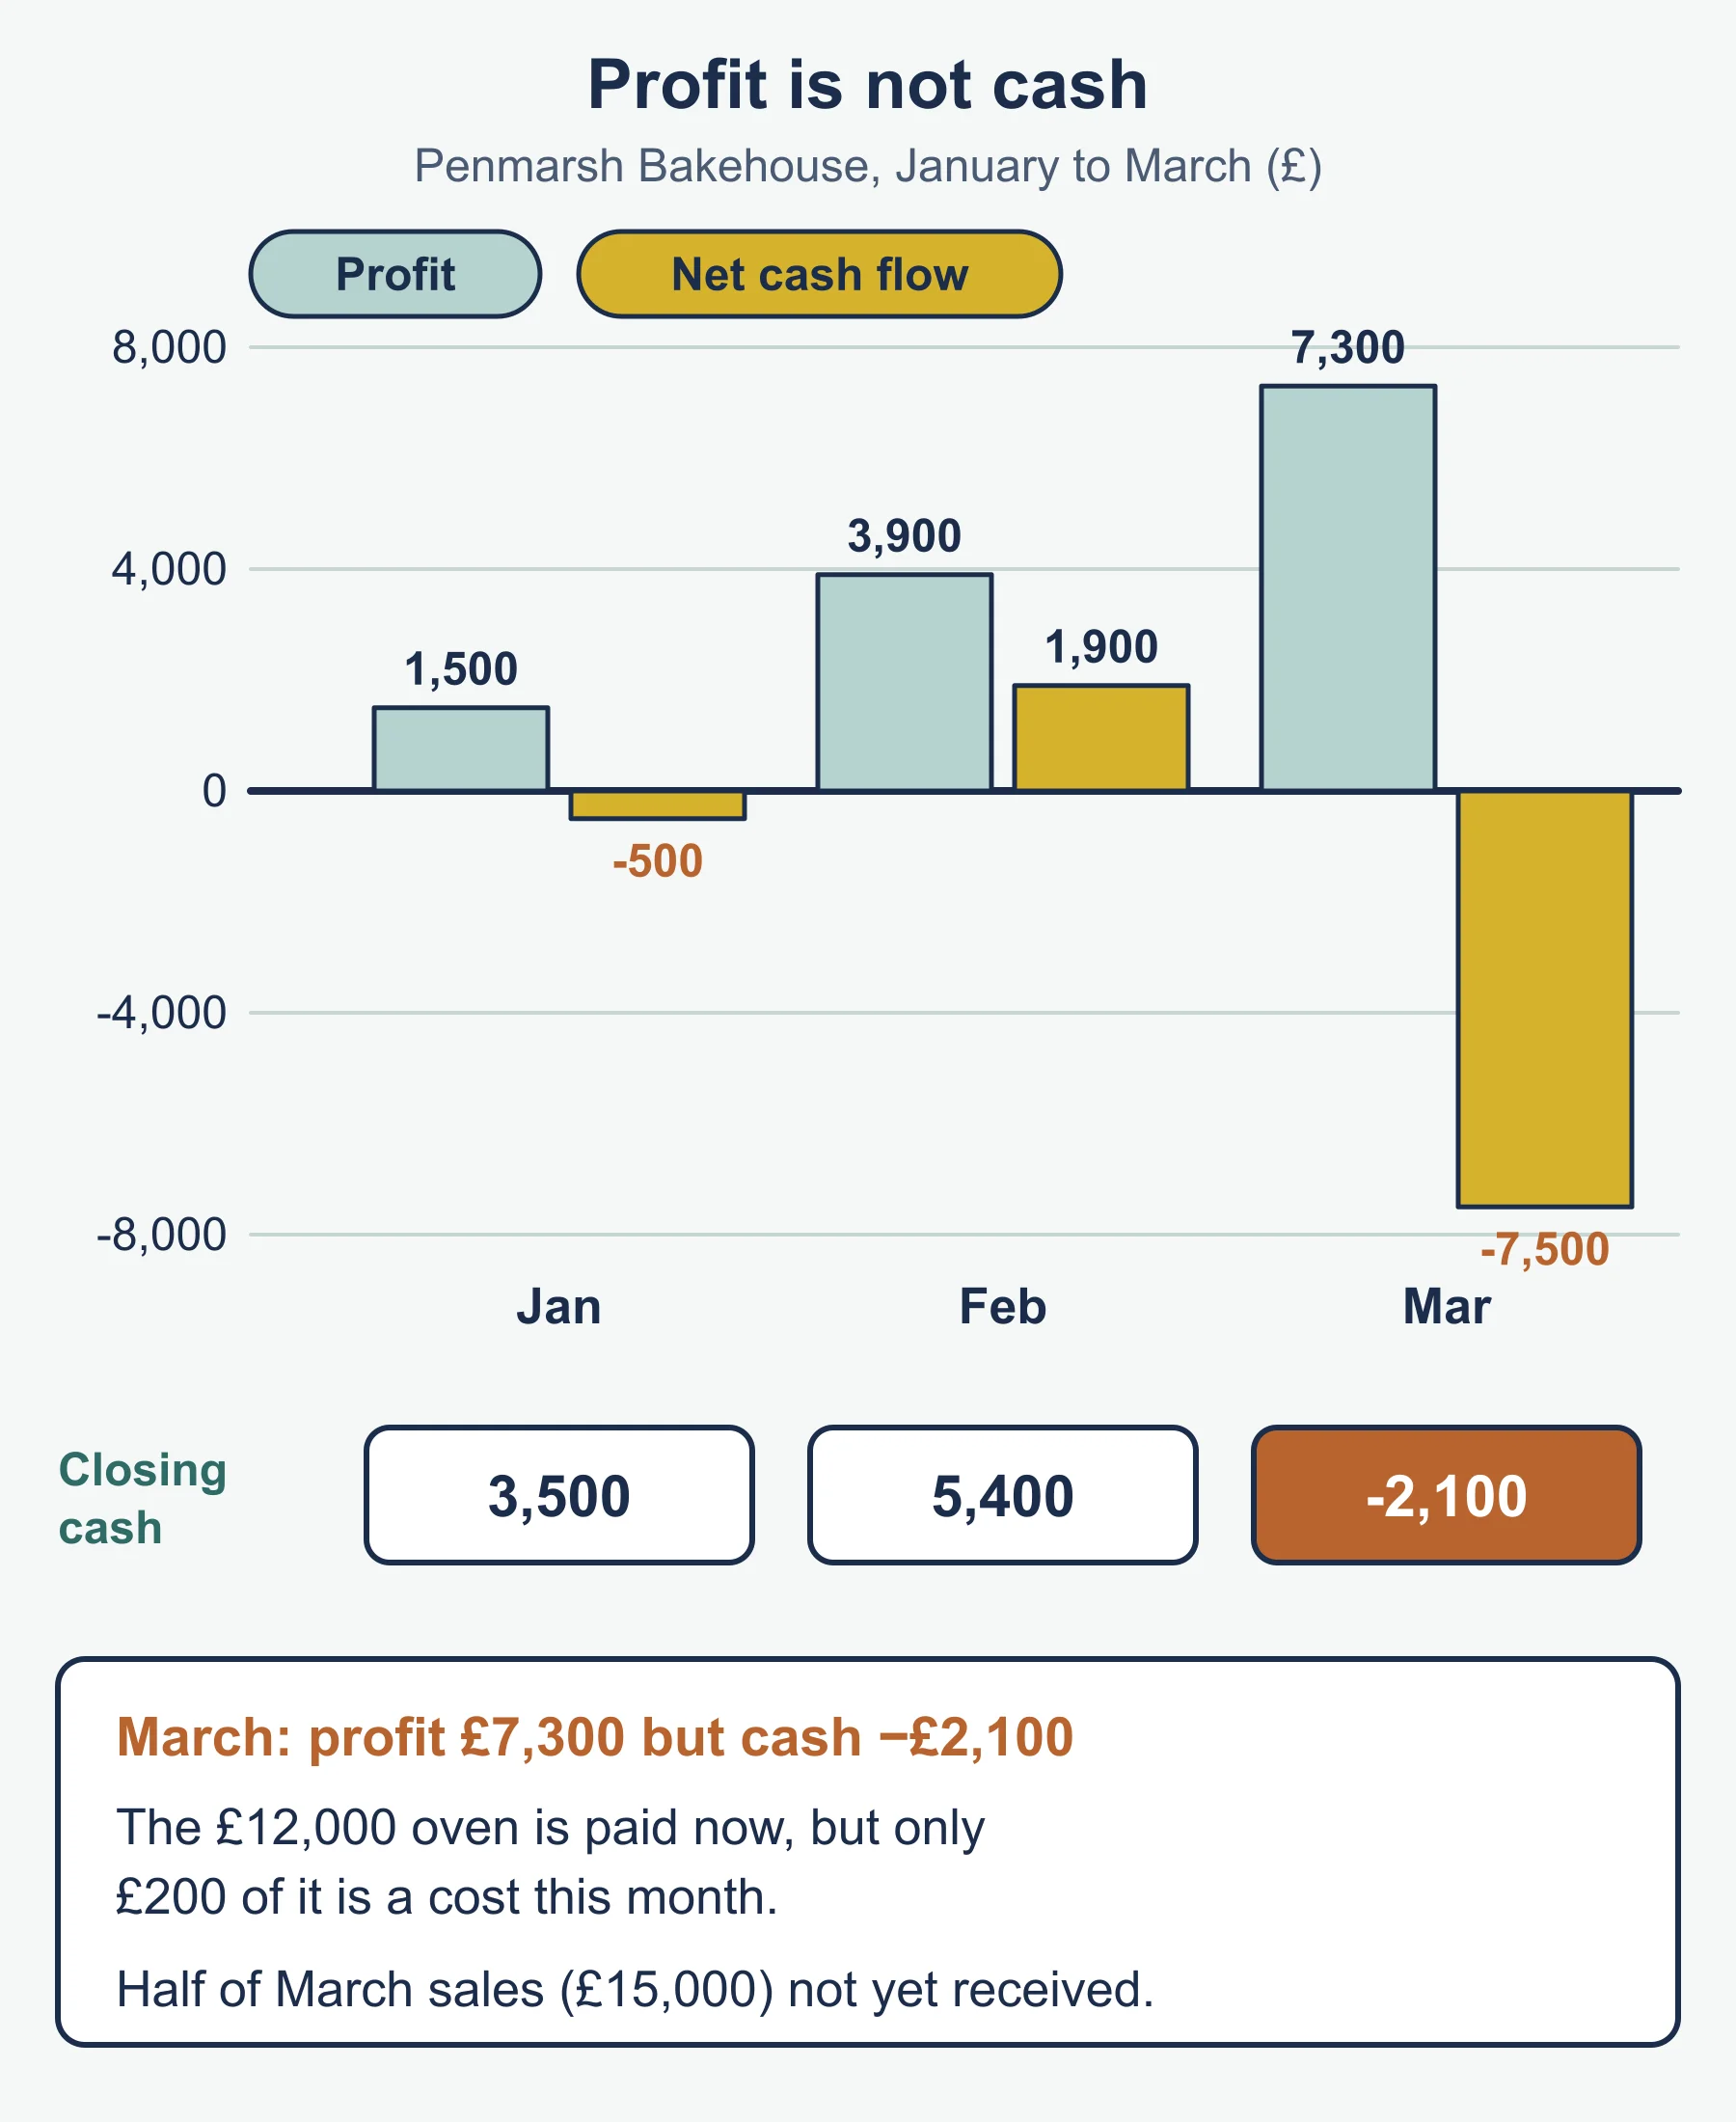
Customers pay half in the month of sale and half the month after. Ingredients cost 40% of sales and are paid at once. Wages, rent and other costs total £10,500 a month. A £12,000 oven is bought in March, depreciated at £200 a month from March. December sales were £16,000 and opening cash is £4,000.
| £ | Jan | Feb | Mar |
|---|---|---|---|
| Sales revenue | 20,000 | 24,000 | 30,000 |
| Cash received | 18,000 | 22,000 | 27,000 |
| Cash paid | 18,500 | 20,100 | 34,500 |
| Net cash flow | -500 | 1,900 | -7,500 |
| Closing cash | 3,500 | 5,400 | -2,100 |
| Profit | 1,500 | 3,900 | 7,300 |
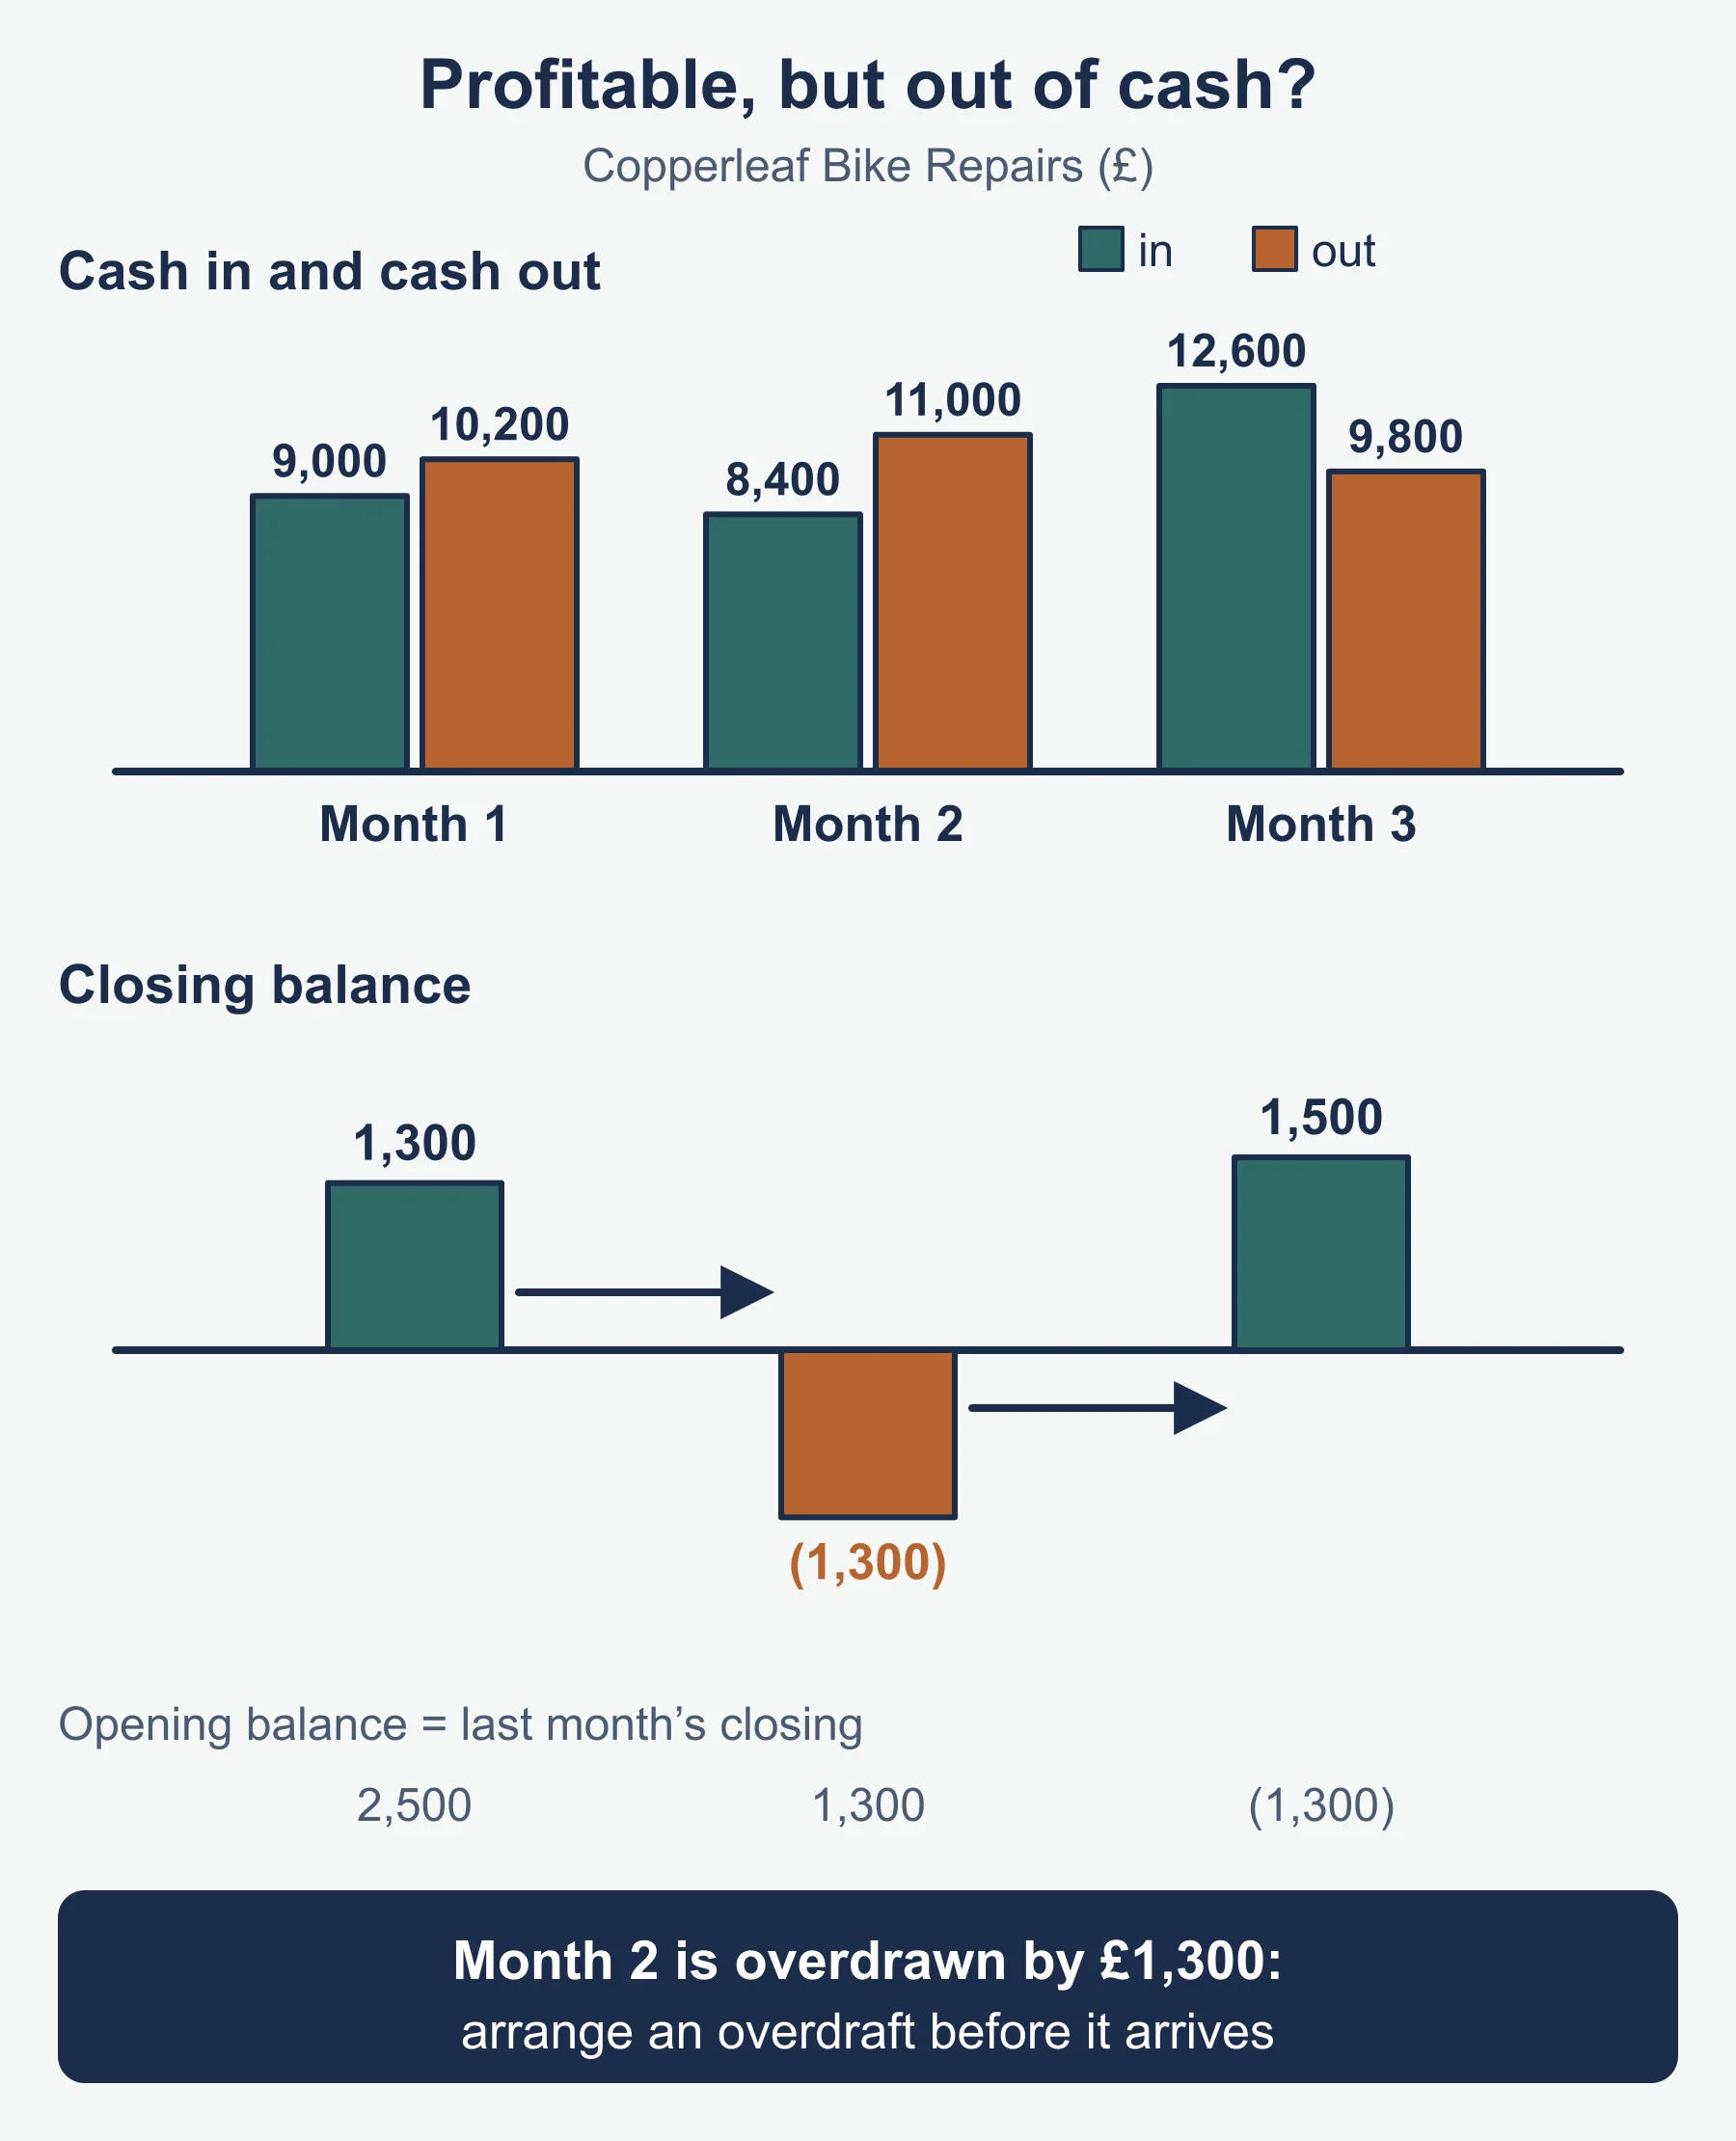
Penmarsh earns £12,700 profit over the quarter yet runs out of cash in March: the oven is paid for immediately, and half of March’s sales are still owed. Profit does not show this. Strategies to overcome such a problem include an overdraft or loan, asking customers to pay sooner, delaying the purchase or leasing the oven. Each has a cost, so evaluate them against the size and length of the shortfall.
Budgets and variance analysis
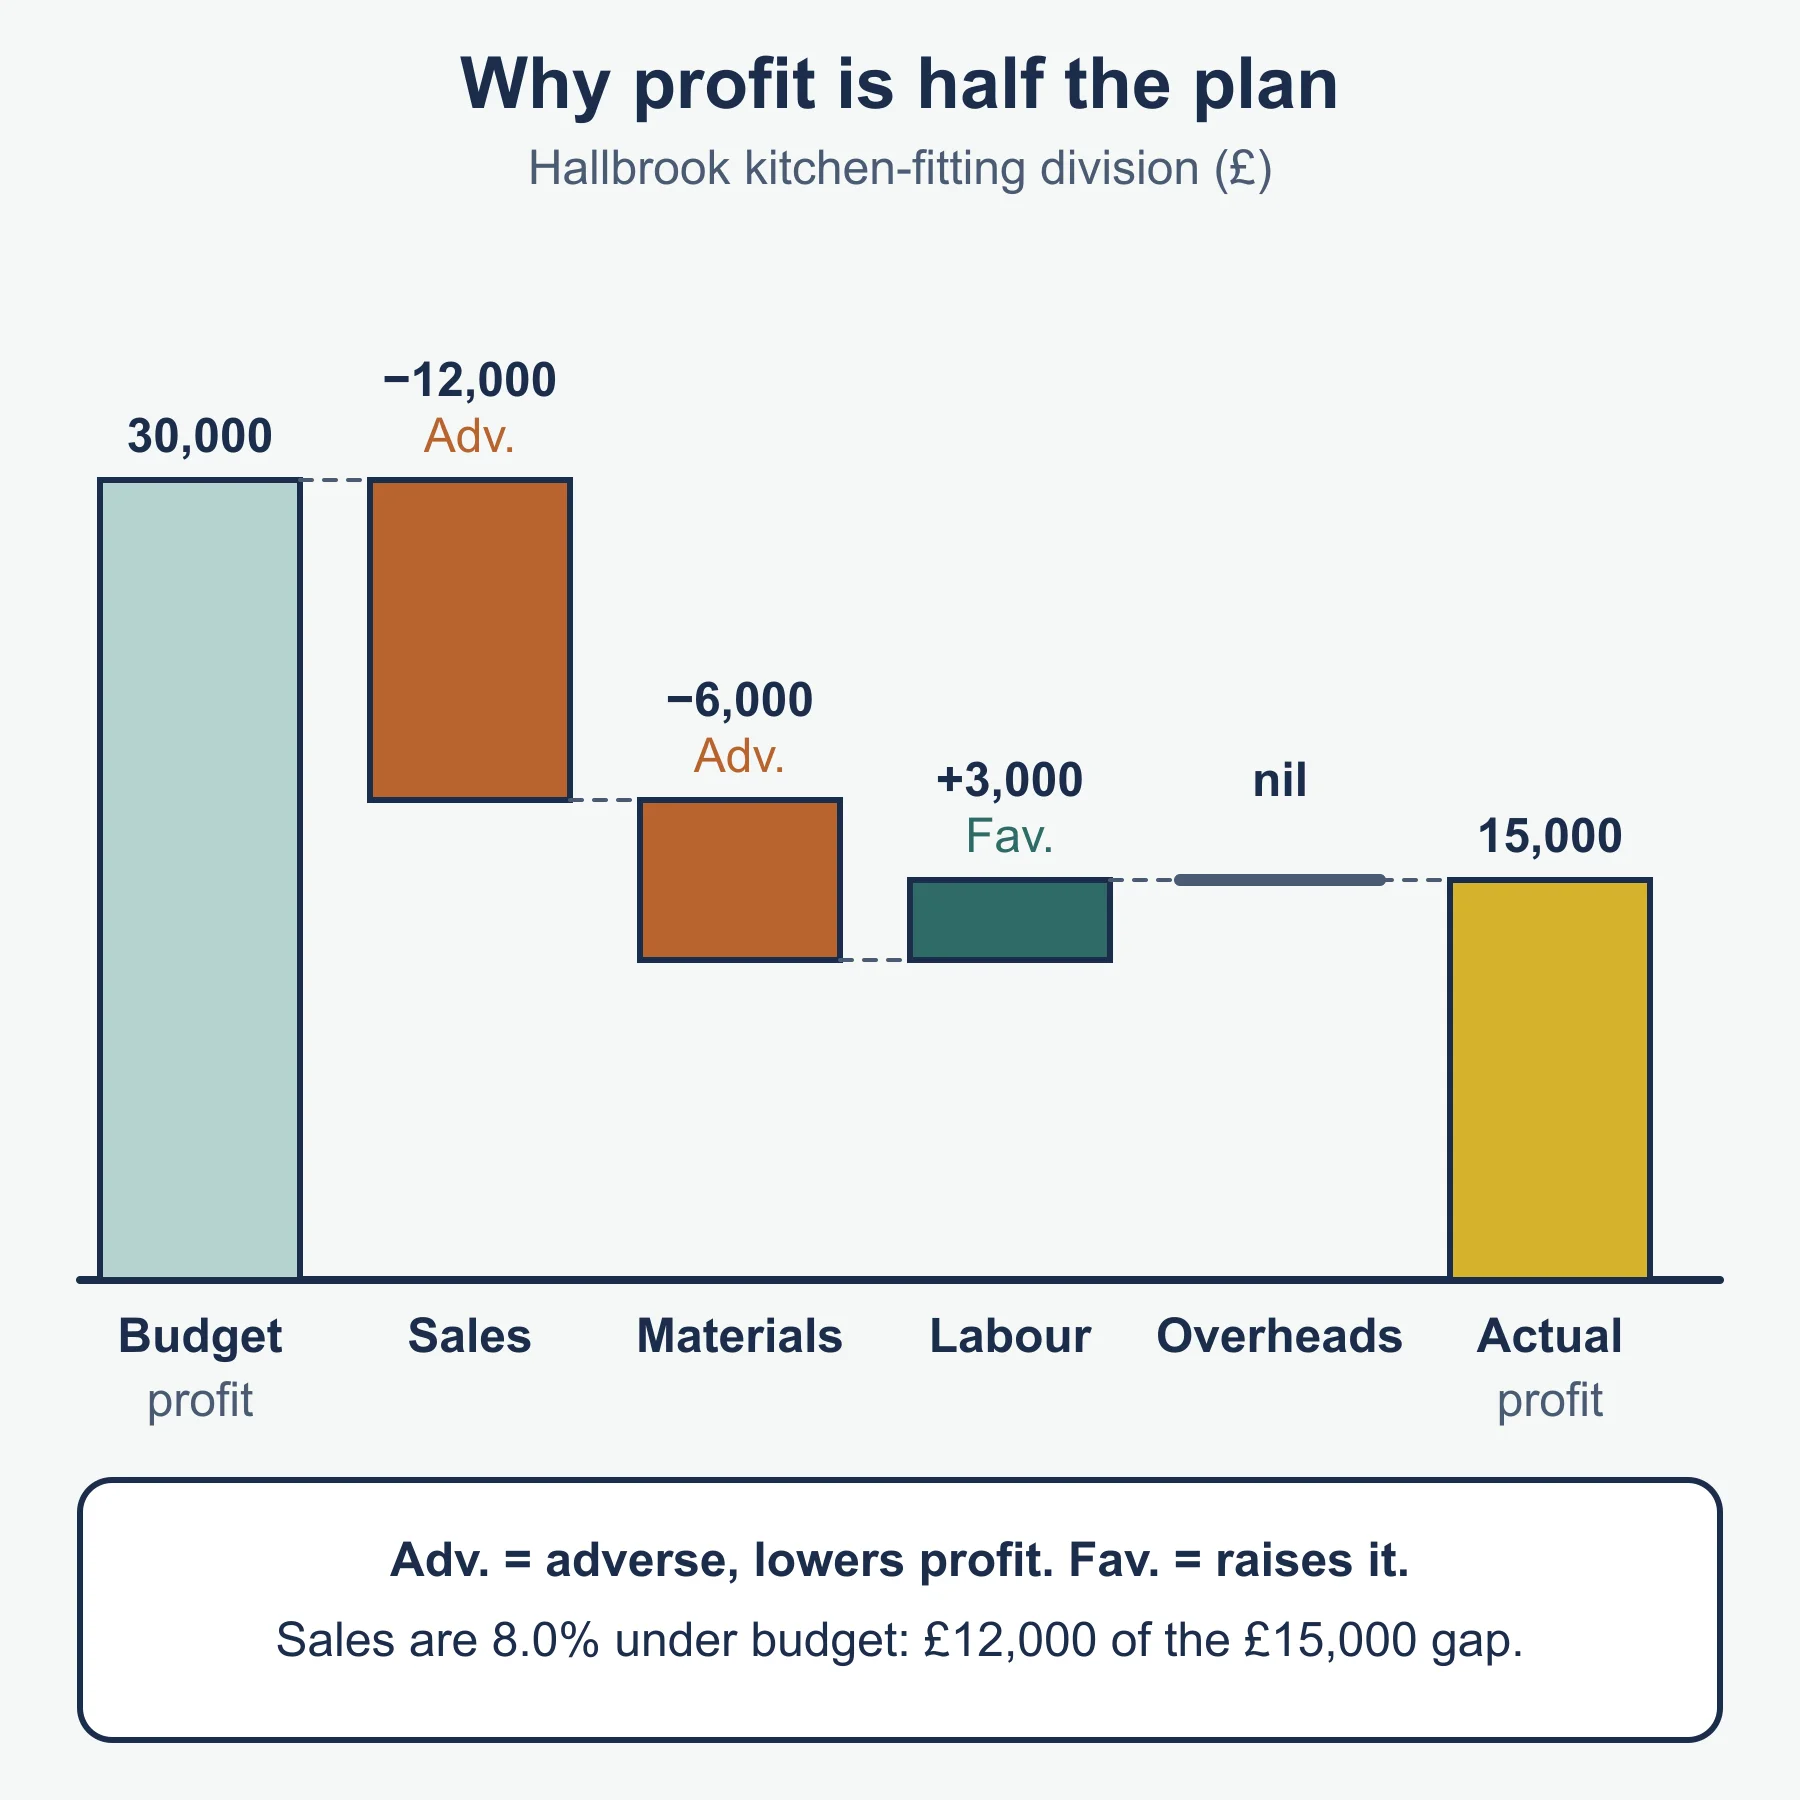
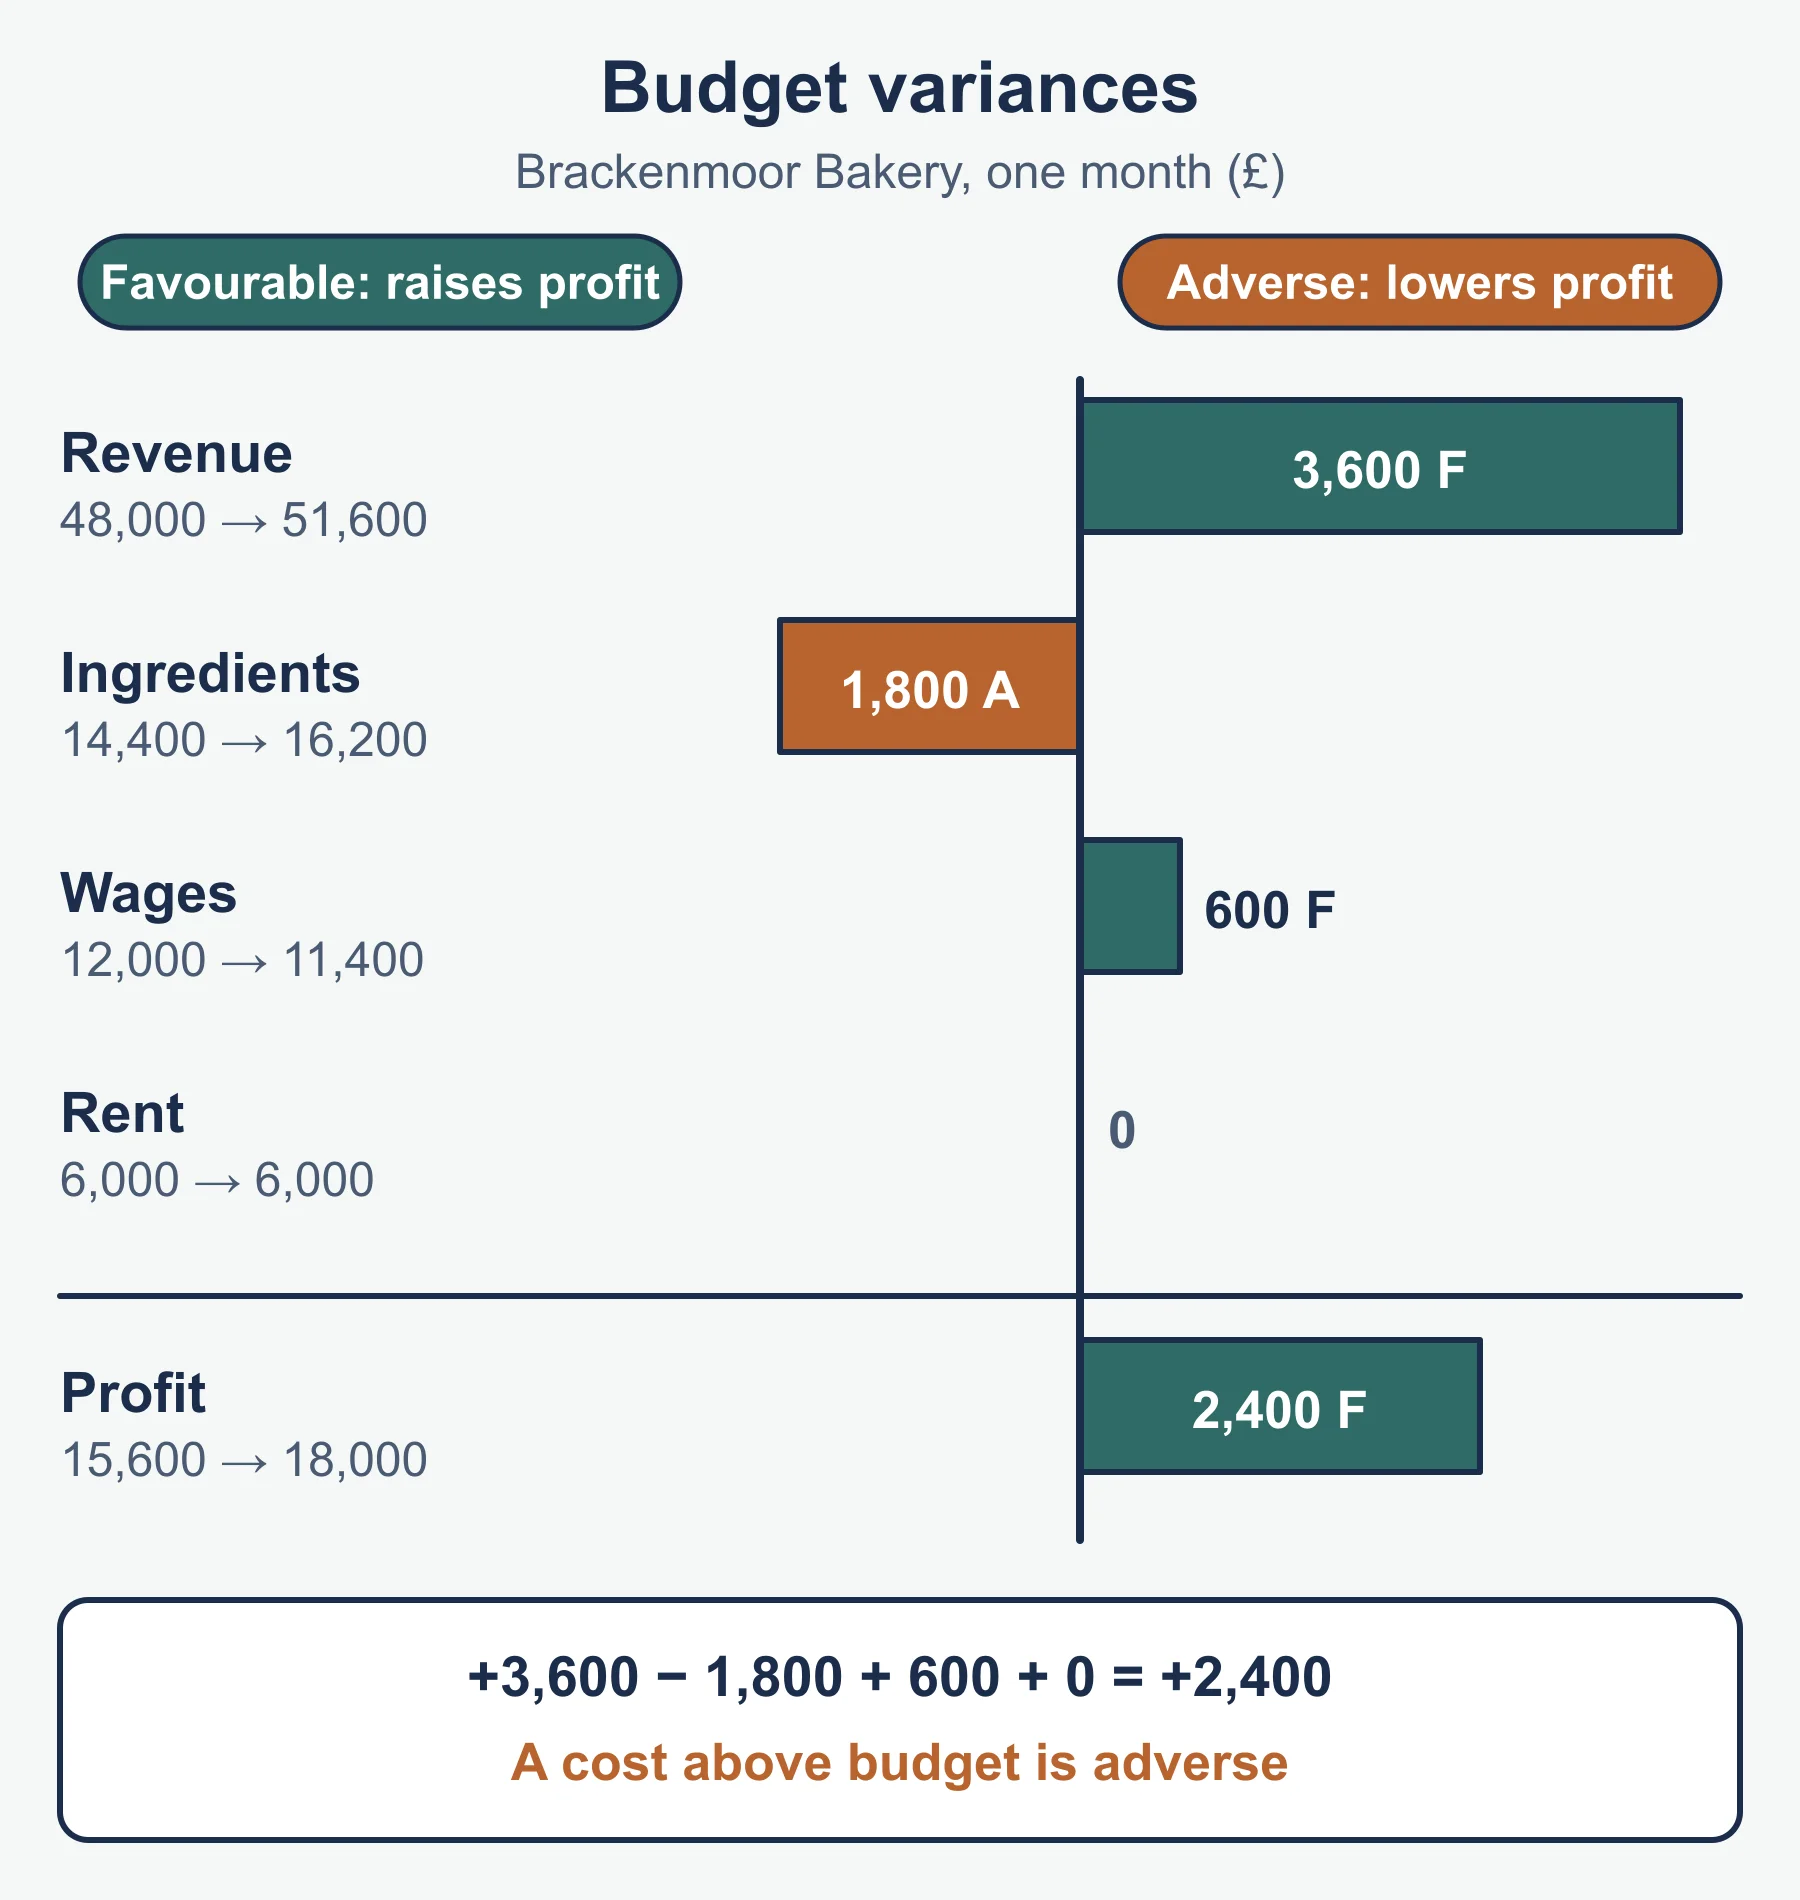
A budget is a financial plan for income and costs over a period. A variance is the difference between budget and actual. A variance is favourable if it raises profit (higher revenue, lower cost) and adverse if it lowers profit.
Worked example: Hallbrook’s kitchen-fitting division
| £ | Budget | Actual | Variance |
|---|---|---|---|
| Sales revenue | 150,000 | 138,000 | 12,000 adverse |
| Materials | 60,000 | 66,000 | 6,000 adverse |
| Labour | 40,000 | 37,000 | 3,000 favourable |
| Overheads | 20,000 | 20,000 | nil |
| Profit | 30,000 | 15,000 | 15,000 adverse |
Revenue is 8.0% under budget. Profit is half the plan. Cheaper labour partly offsets this, but may reflect fewer jobs rather than efficiency. Variance analysis tells managers where to look, not why. Possible causes are a price rise from suppliers, lost orders or poor forecasting, and the budget itself may have been unrealistic. Used well, it supports control and accountability; used rigidly, it can discourage sensible spending.
Why published accounts are not a complete picture
Published accounts are historic, so they show the past, not the future. They give no view of quality, staff morale, customer loyalty or environmental harm. Figures rest on judgements (depreciation, inventory valuation, bad debts). Year-end figures can hide seasonal swings, and accounts rarely compare the business with rivals or with its market. That is why non-financial measures sit alongside them. Financial measures matter because they are precise and comparable, and they show whether the business can pay its way and reward its owners; non-financial measures matter because they show why the numbers are moving and what may happen next.
Non-financial measures
| Measure | What it shows | Hallbrook, Year 1 to Year 2 |
|---|---|---|
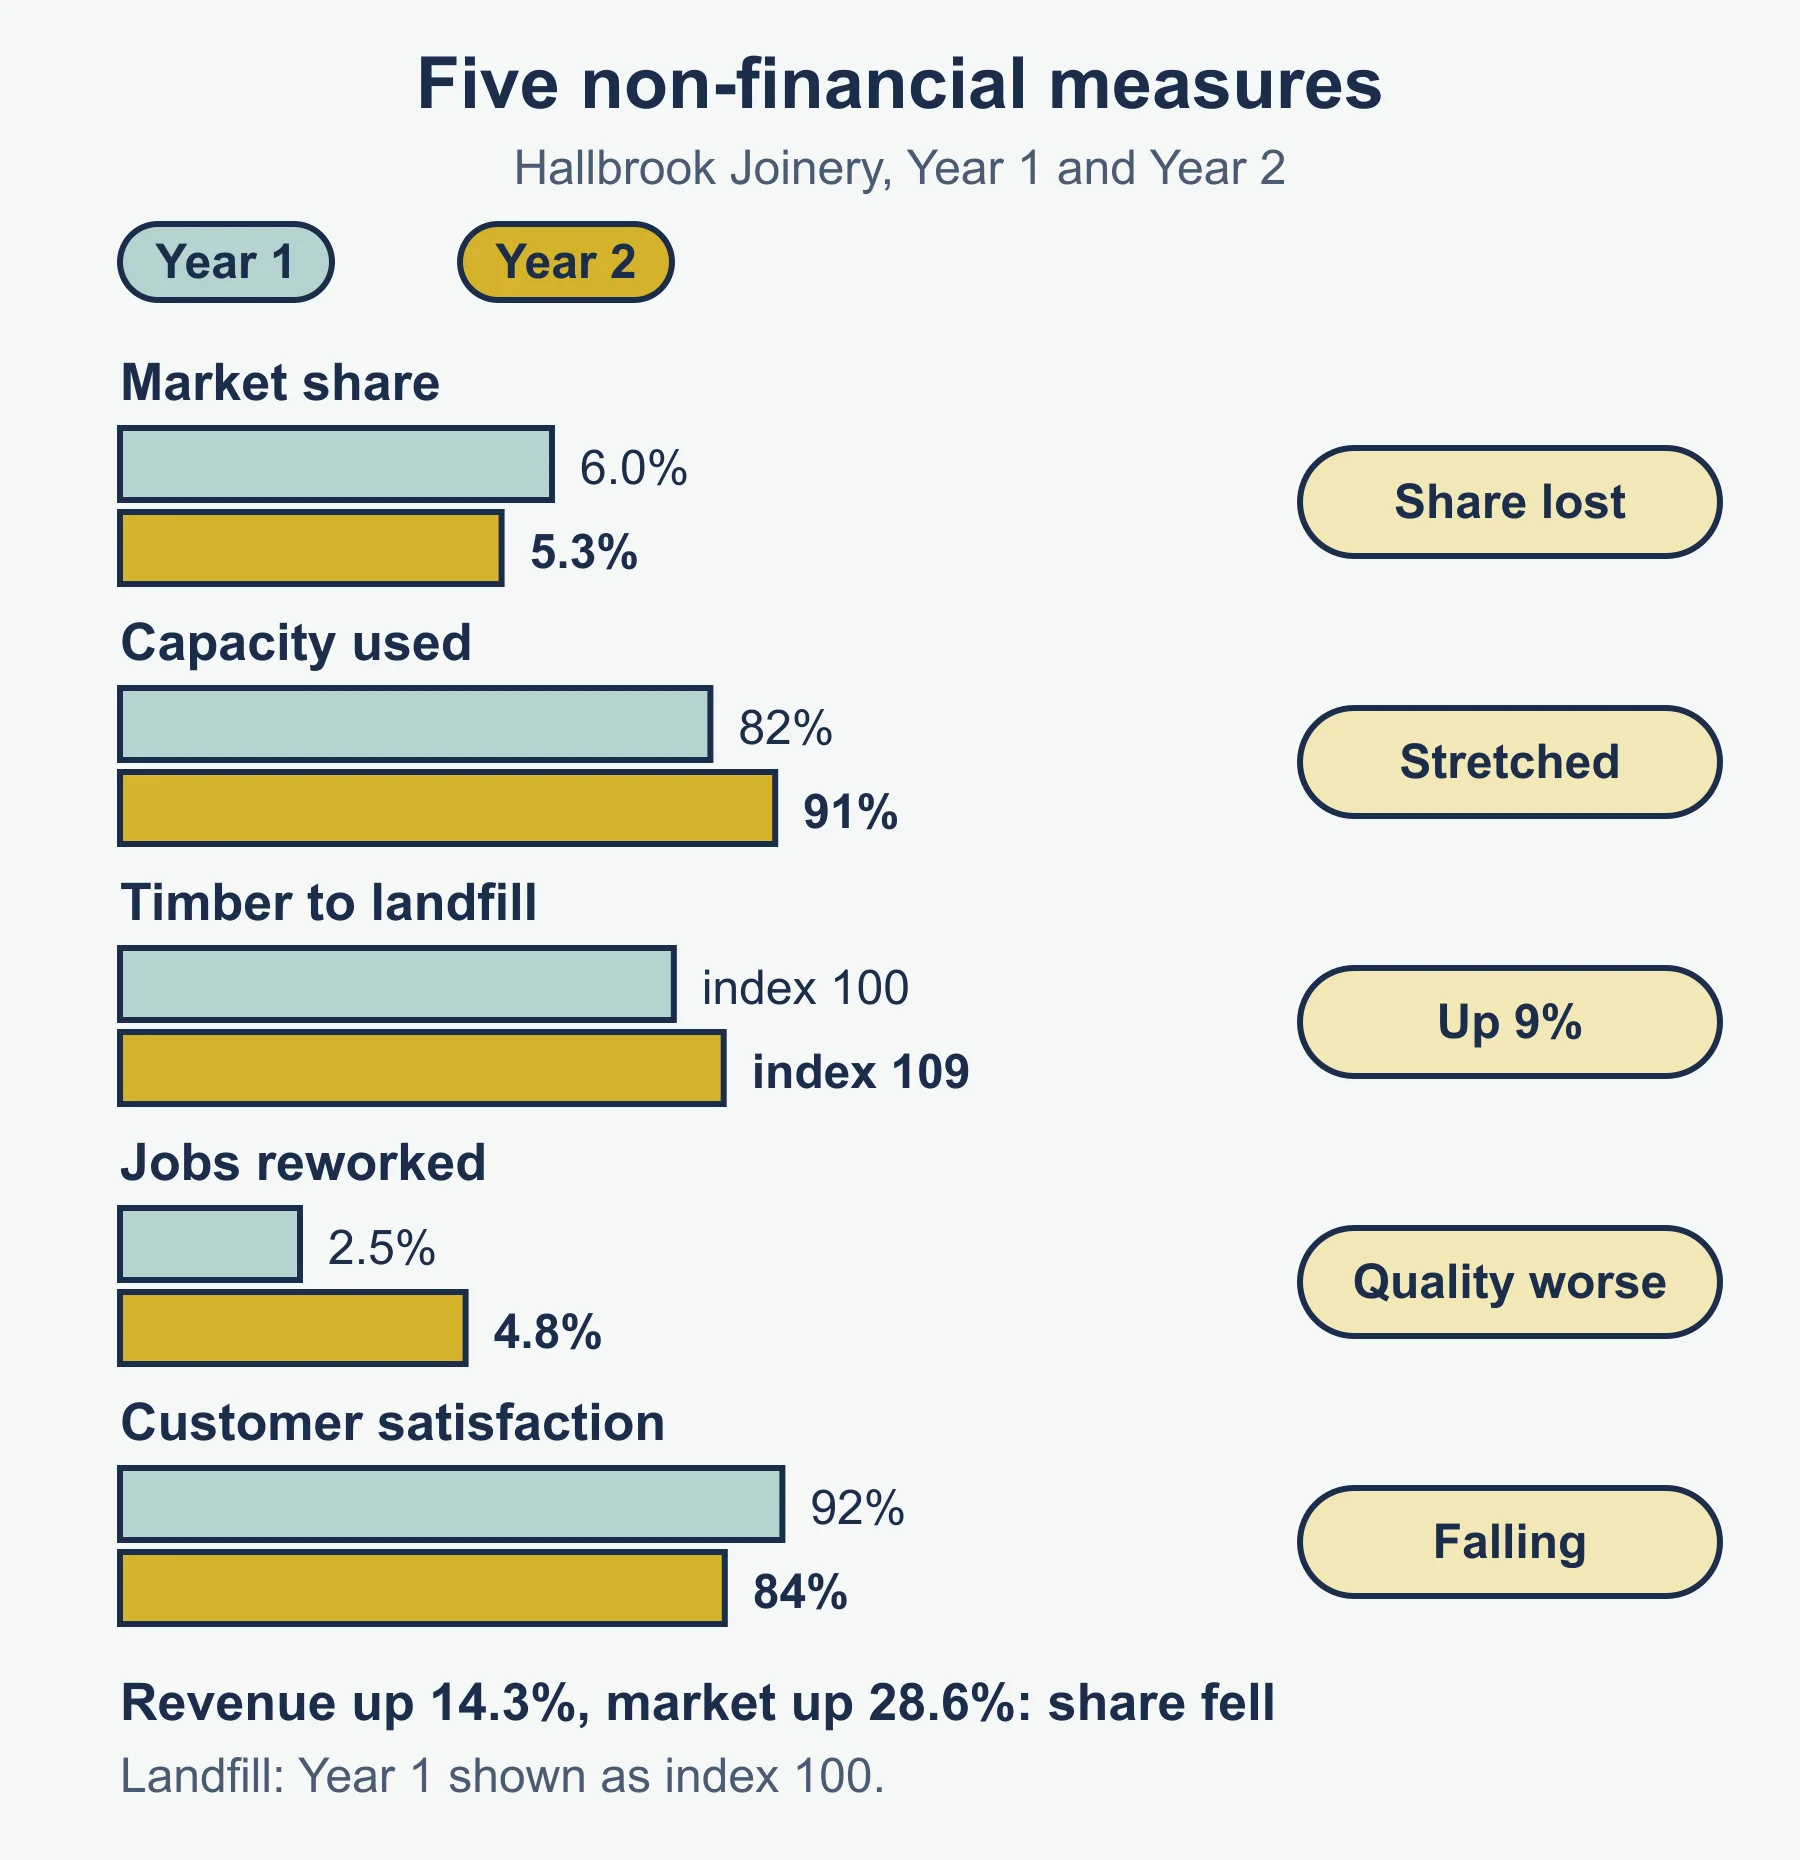
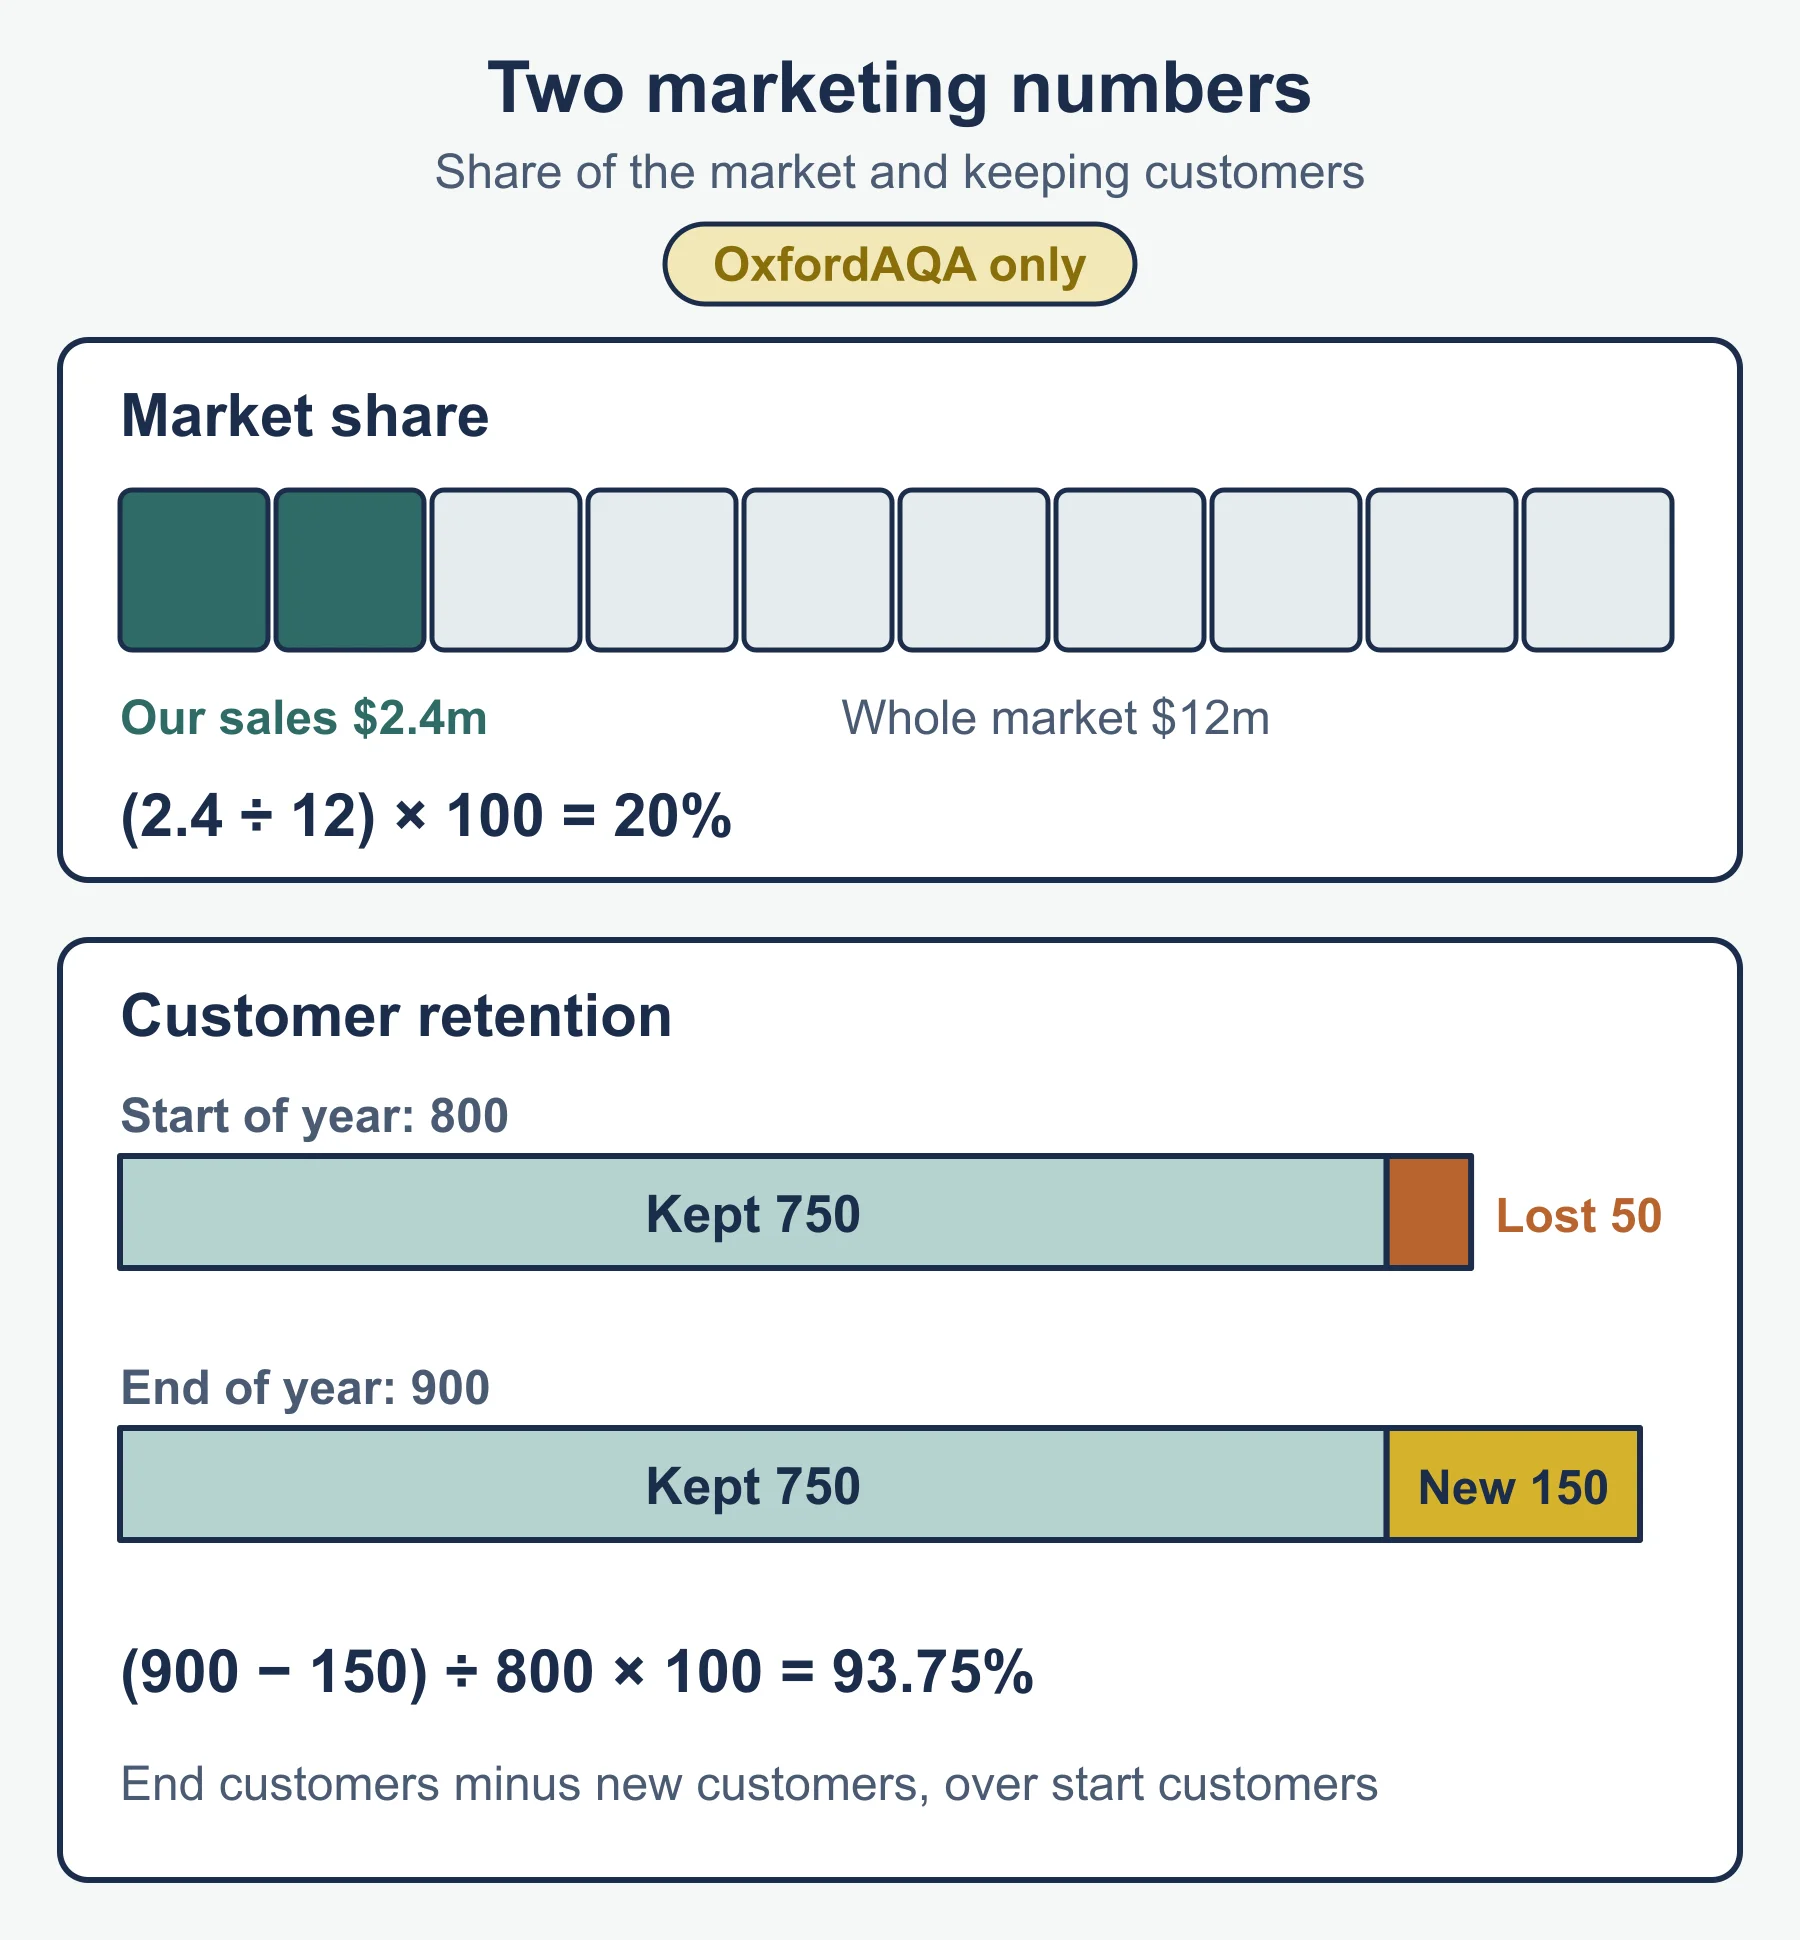
| Market share | Business sales as a share of market sales | 6.0% to 5.3% |
| Resource utilisation | Use of staff, machines and space; capacity utilisation is actual output / maximum output x 100 (standard form) | Workshop capacity used 82% to 91% |
| Environmental impact | Waste, emissions, energy use | Timber offcuts sent to landfill up 9% |
| Quality | Defects, returns, rework | Jobs needing rework 2.5% to 4.8% |
| Customer satisfaction | Survey scores, complaints, repeat orders | 92% to 84% |
Hallbrook’s revenue grew 14.3% but its market grew 28.6%, so market share fell even in a “growth” year. High utilisation alongside more rework suggests the workshop is stretched. These measures often warn of trouble before the accounts do: falling satisfaction usually comes before falling sales. They can look forward, and they relate to objectives the accounts cannot capture, such as sustainability. Their weaknesses are that surveys can be biased, targets may be arbitrary, and a good score does not pay the bills.
Why measure, and with what drawbacks?
Businesses measure performance to see whether objectives are being met, to compare with past results, targets and rivals, to control costs, to reassure lenders and shareholders, and to decide what to do next. The advantages are better decisions, early warnings and accountability. The disadvantages are cost and time, a focus on what is easy to count, short-term pressure to hit a number, and the risk of manipulation.
Stakeholders and the judgement
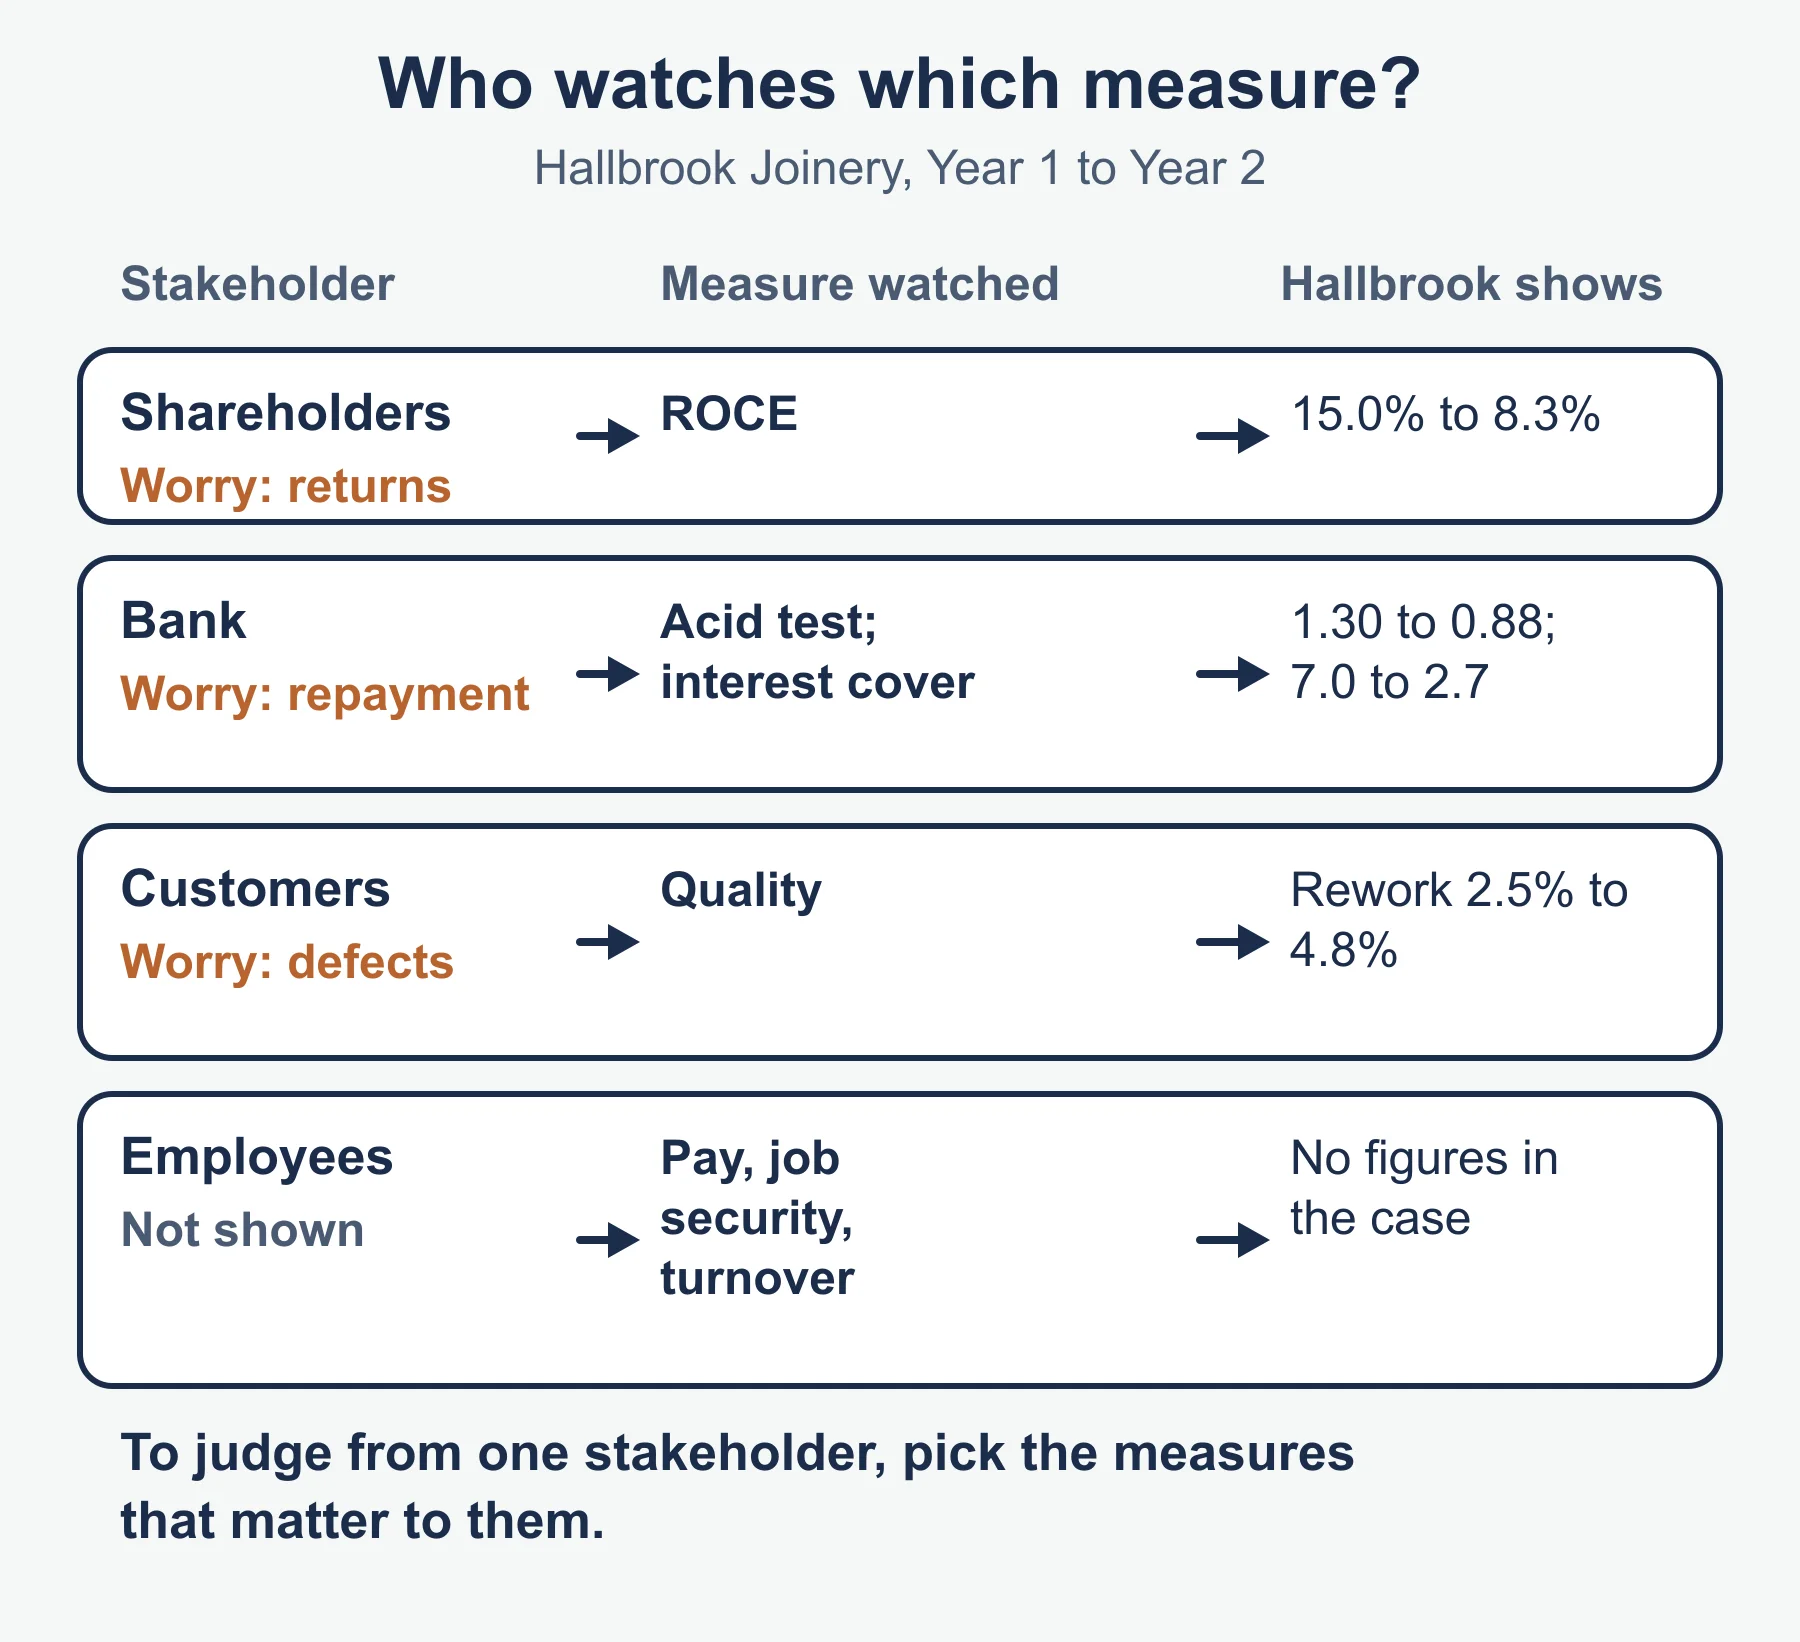
Different stakeholders prioritise different measures. Shareholders look at profit margins, ROCE and share-related returns. A bank looks at liquidity, gearing and interest cover. Employees look at job security, pay and turnover. Customers care about quality and satisfaction. Suppliers watch the payables position and payment record. The local community cares about environmental impact and jobs. Evaluating performance from one stakeholder’s view means choosing the measures that matter to them and judging against their interests.
To evaluate overall, combine both kinds of measure, compare over time or against a benchmark, and reach a reasoned judgement. Hallbrook’s lenders would worry about the falling acid test and interest cover. Its customers would worry about rework. Its owners would worry about ROCE. A strong answer says which concern is most urgent and why.
Common errors
- Treating profit and cash as the same thing.
- Calling a rise in revenue “improved performance” without checking margins.
- Writing “adverse” for every variance: lower costs are favourable.
- Quoting a ratio without comparing it with anything.
- Dividing by the wrong figure, for example using revenue instead of capital employed for ROCE.
- Listing non-financial measures without saying what they reveal.
Frequently asked questions
Does the OCR H431 specification give ratio formulas? No. The specification does not print formulas, so the standard forms are used; if a question defines a ratio differently, use its definition.
What is the difference between gross, operating and net profit? Gross profit is sales revenue minus cost of sales. Operating profit is gross profit minus operating expenses, and net profit is operating profit minus finance costs.
Is a rise in revenue the same as improved performance? No. Revenue can rise while margins, cash and market share fall, so check profitability and the growth of the market before calling a rise in revenue an improvement.
Can a profitable business run out of cash? Yes. Profit is revenue minus costs on the income statement, while cash flow is the actual movement of money, so a firm can earn a profit yet run short of cash when it buys assets or waits for customers to pay.
Official syllabus
OCR Level 3 Advanced GCE in Business (H431), Version 2.1 (January 2026), OCR; section Measures of Performance: financial and non-financial, Business objectives and strategy.
Get free revision emails (optional)
Occasional emails with practice questions, worked explanations and links to free resources for the qualification and subjects you choose. No spam, and you can unsubscribe from any email. The free tools on this site never need an email.
Related resources
-
Practice questions
OCR A Level Business: Measures of performance: financial and non-financial (H431) – Practice Questions
Twelve original practice questions with worked answers on financial and non-financial measures of performance for OCR A Level Business H431.
Business · OCR · A Level
Try questions -
Revision notes
OCR A Level Business: Measures of performance: financial and non-financial (H431) – Revision Notes
Condensed recall notes on financial and non-financial measures of performance for OCR A Level Business H431: ratios, cash flow, variances and a self-test.
Business · OCR · A Level
Revise topic -
Study guides
OCR A Level Business: Mission statement and Corporate social responsibility (CSR) (H431)
Study guide to mission statements and corporate social responsibility for OCR A Level Business, with worked examples and evaluation skills.
Business · OCR · A Level
Read guide
Related articles
-
teaching
A Level tuition in Dubai: Cambridge or Pearson Edexcel International A Level?
Schools in Dubai and Abu Dhabi teach either Cambridge International AS & A Level or Pearson Edexcel International A Level. How the two are structured, why it matters for tuition, and how online classes from Lahore work.
9 October 2026
-
curriculum guides
Choosing subjects at IGCSE and A Level
How subject choices at 14 and 16 affect university options later, and how to keep pathways open without overloading a timetable.
28 July 2026
Studying this with a teacher
Working through Business A LEVELS?
This page is free and stays free. If you would rather be taught it, Marlbridge runs Business classes one-to-one, online in your own time zone. One-to-one only for this course: Rs 6,000 per class in Pakistan, with other currencies on the fees page. The first trial class is free. WhatsApp replies within an hour (8am–11pm Pakistan time, every day); email the same day.
OCR Business teachers at Marlbridge
