
Revision Notes
OCR A Level Business: The market, market size and growth and Demand and supply (H431) – Revision Notes
Condensed revision notes on markets, market share, market structures, demand, supply, equilibrium, excesses and shortages for OCR A Level Business H431.
- Subject
- Business
- Level
- A LEVELS
- Topic
- External influences facing businesses
- Author
- Marlbridge Academic Team
- Updated
- Reviewed by
- Salman Ahmad (what this means)
Aligned to OCR A Level Business (H431), Version 2.1 (January 2026), for first assessment in 2017; final assessment summer 2027. Official specification .
Syllabus page (what it covers and how it is assessed): OCR A Level Business.
Syllabus points this page covers
H431
- 2.1 The market, market size and growth
- 2.2 Demand and supply
Found an error? Report a correction.
Need help with this topic? Request a free trial class for A Level Business (H431).
Quick recall for the market, market size and growth and demand and supply in the External influences area of the OCR Advanced GCE in Business (H431) Specification, Version 2.1 (January 2026). Full explanations and worked diagrams are in the study guide. Test yourself with the practice questions. Wider topic notes: external influences revision notes. Course hub: OCR A Level Business. Checklist: printable checklist. Not sure where to start? Take a free diagnostic.
Definitions to know
| Term | Short definition |
|---|---|
| Market | A setting, physical or online, where buyers and sellers meet to trade |
| Competition | Rivalry between businesses for the same customers |
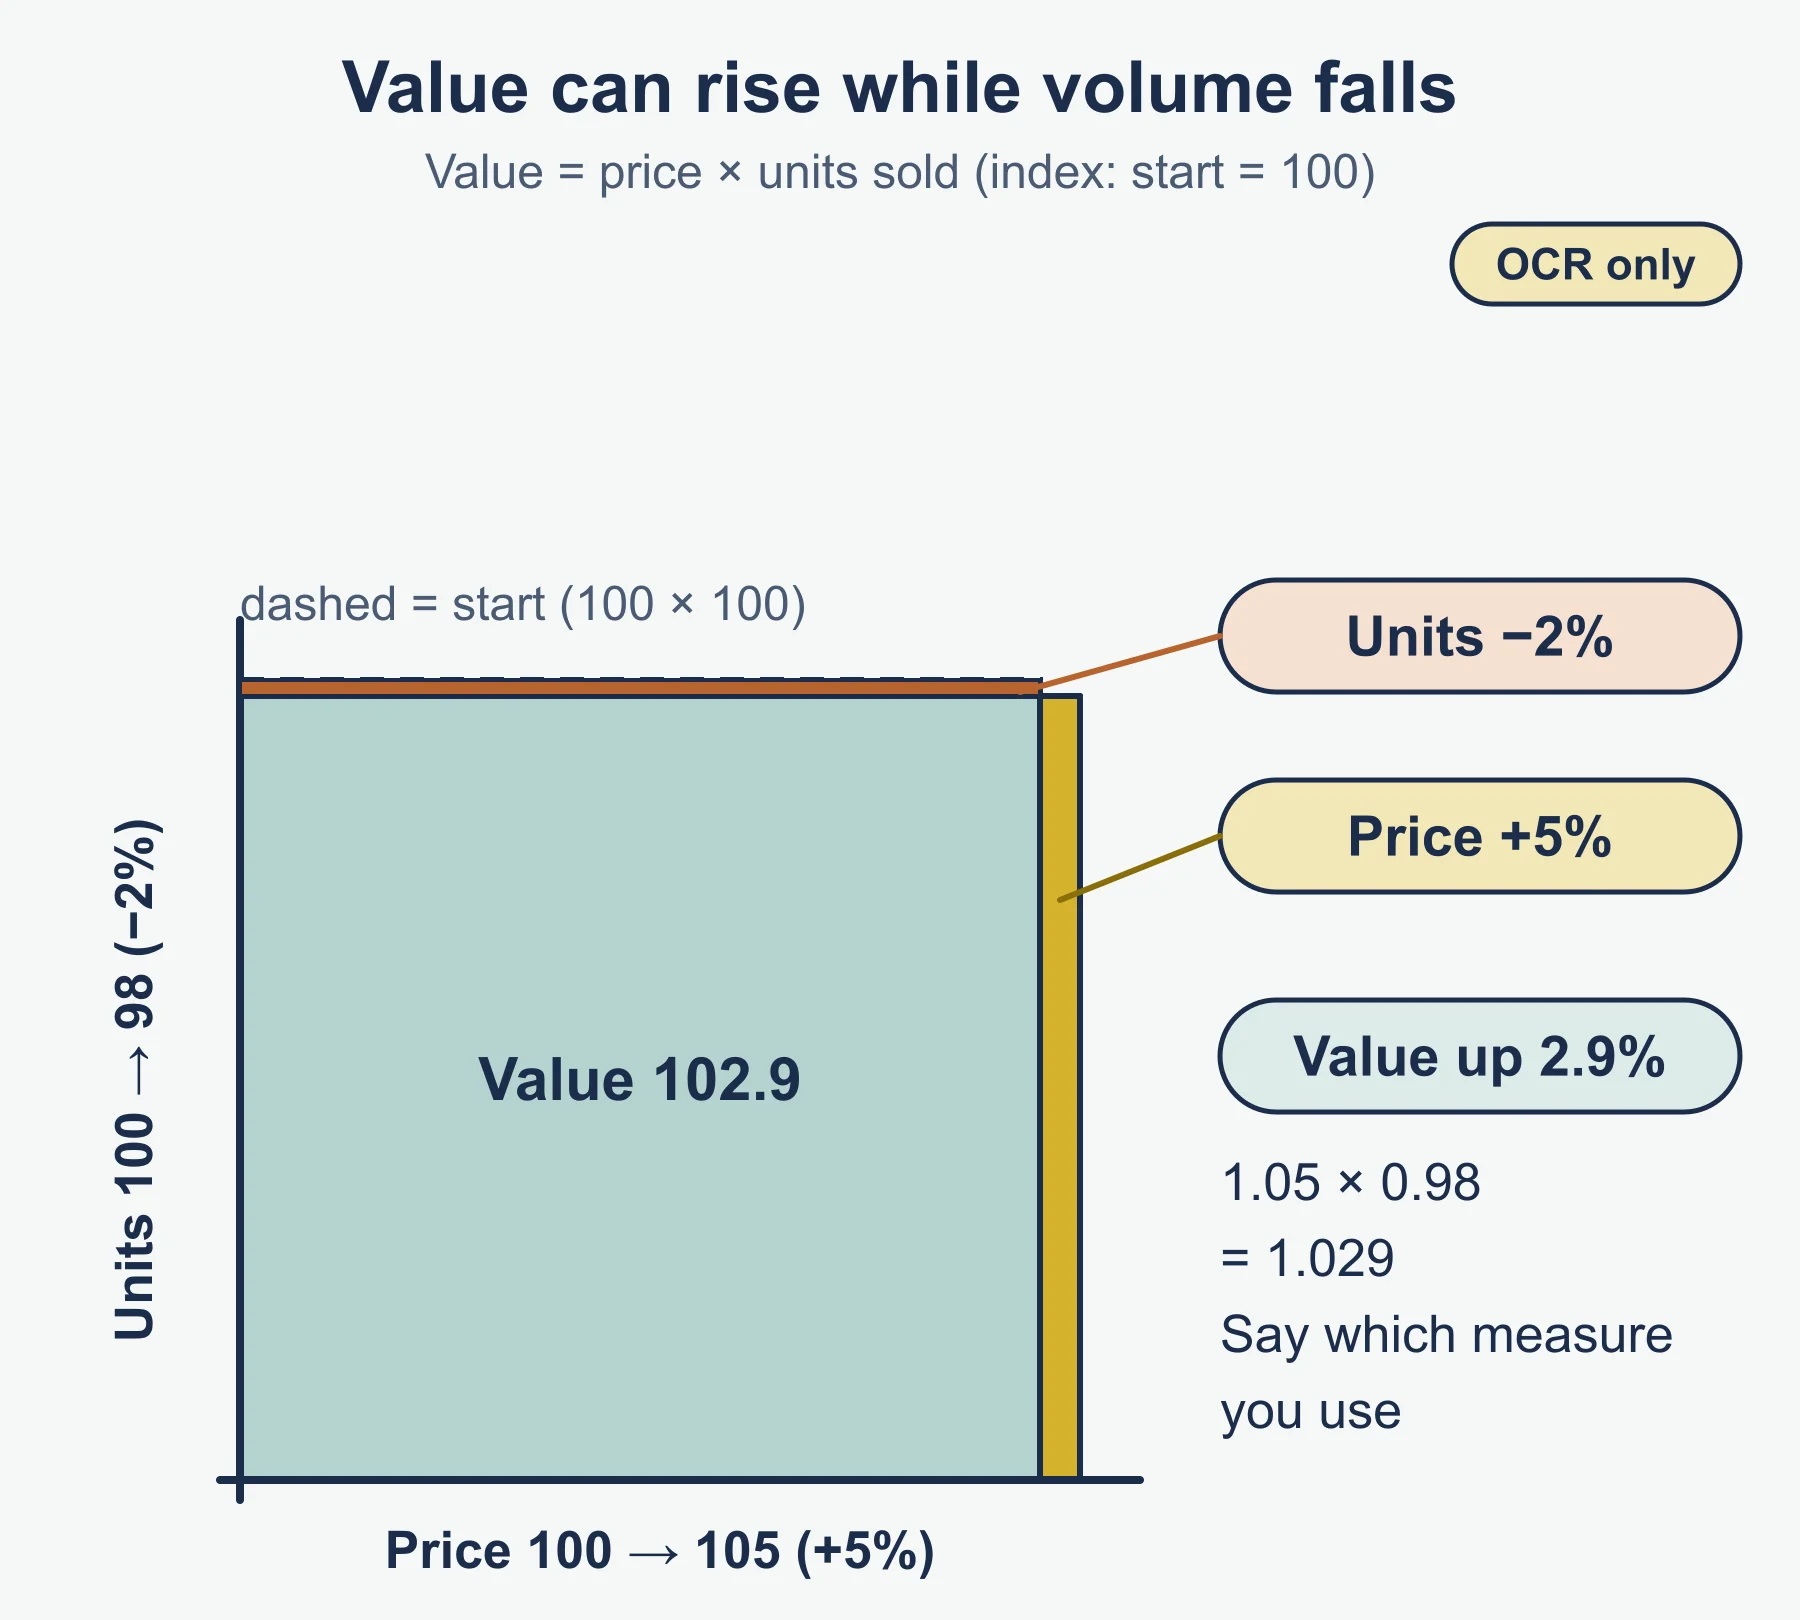
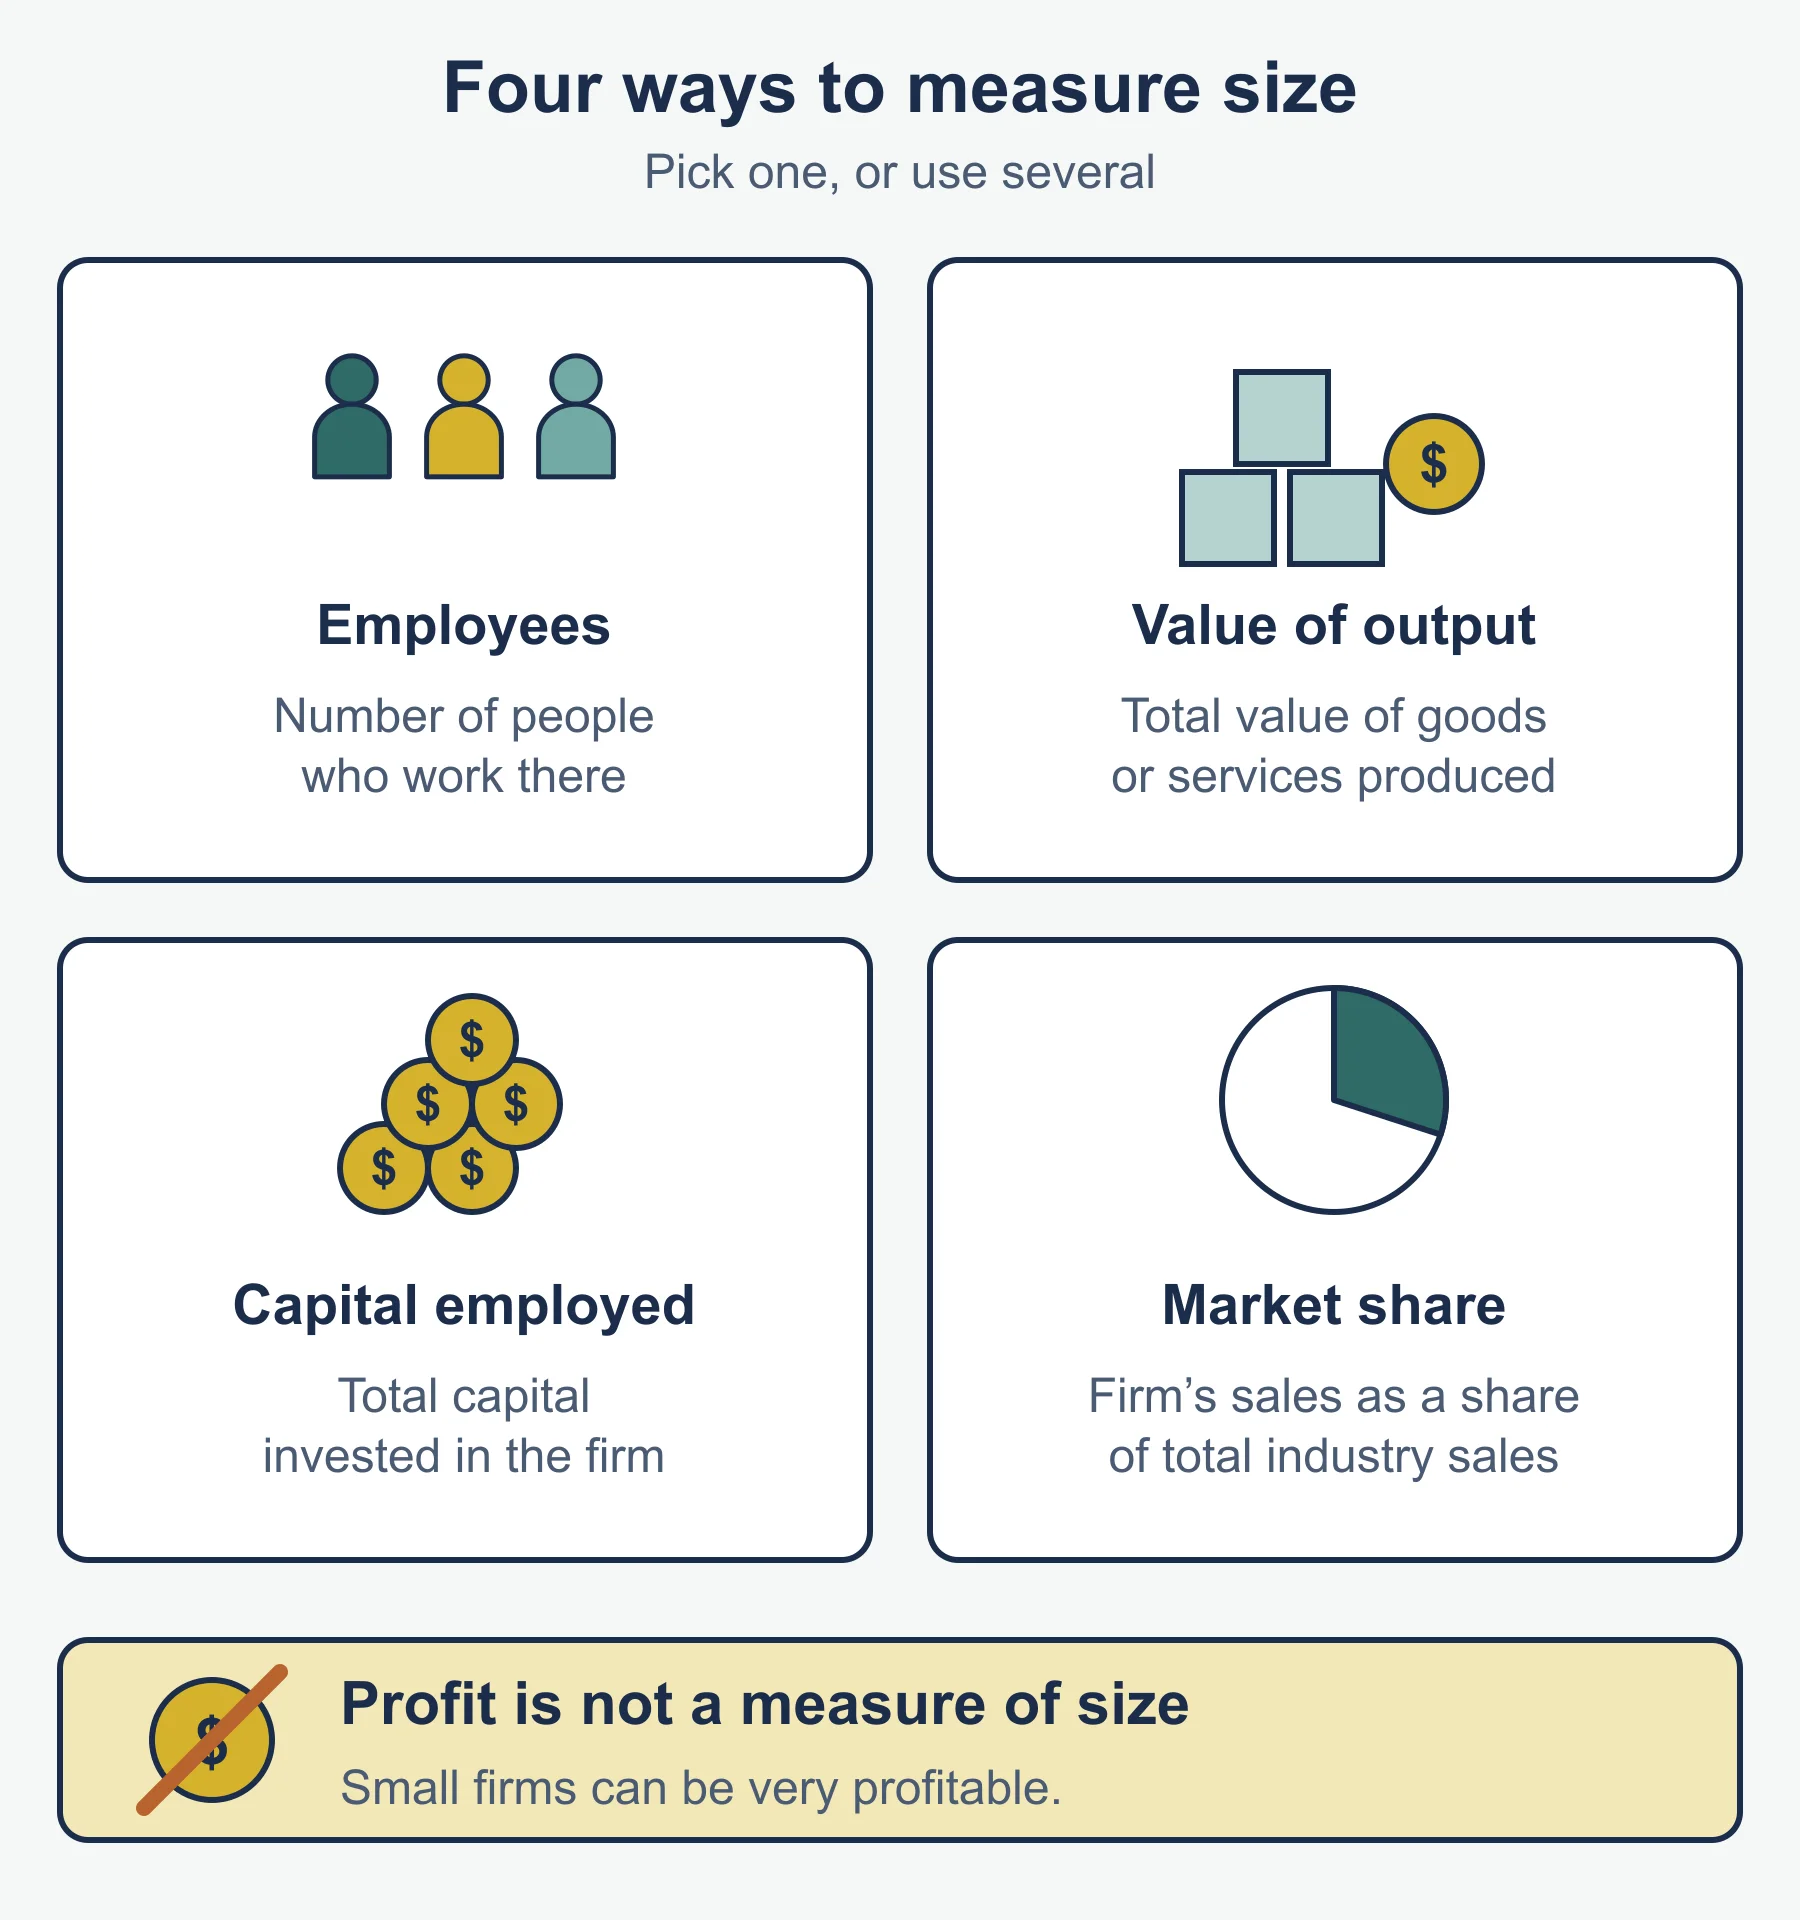
| Market size | Total sales of all firms in the market over a period, by value (£) or volume (units) |
| Market growth | The change in market size over time, usually as a percentage |
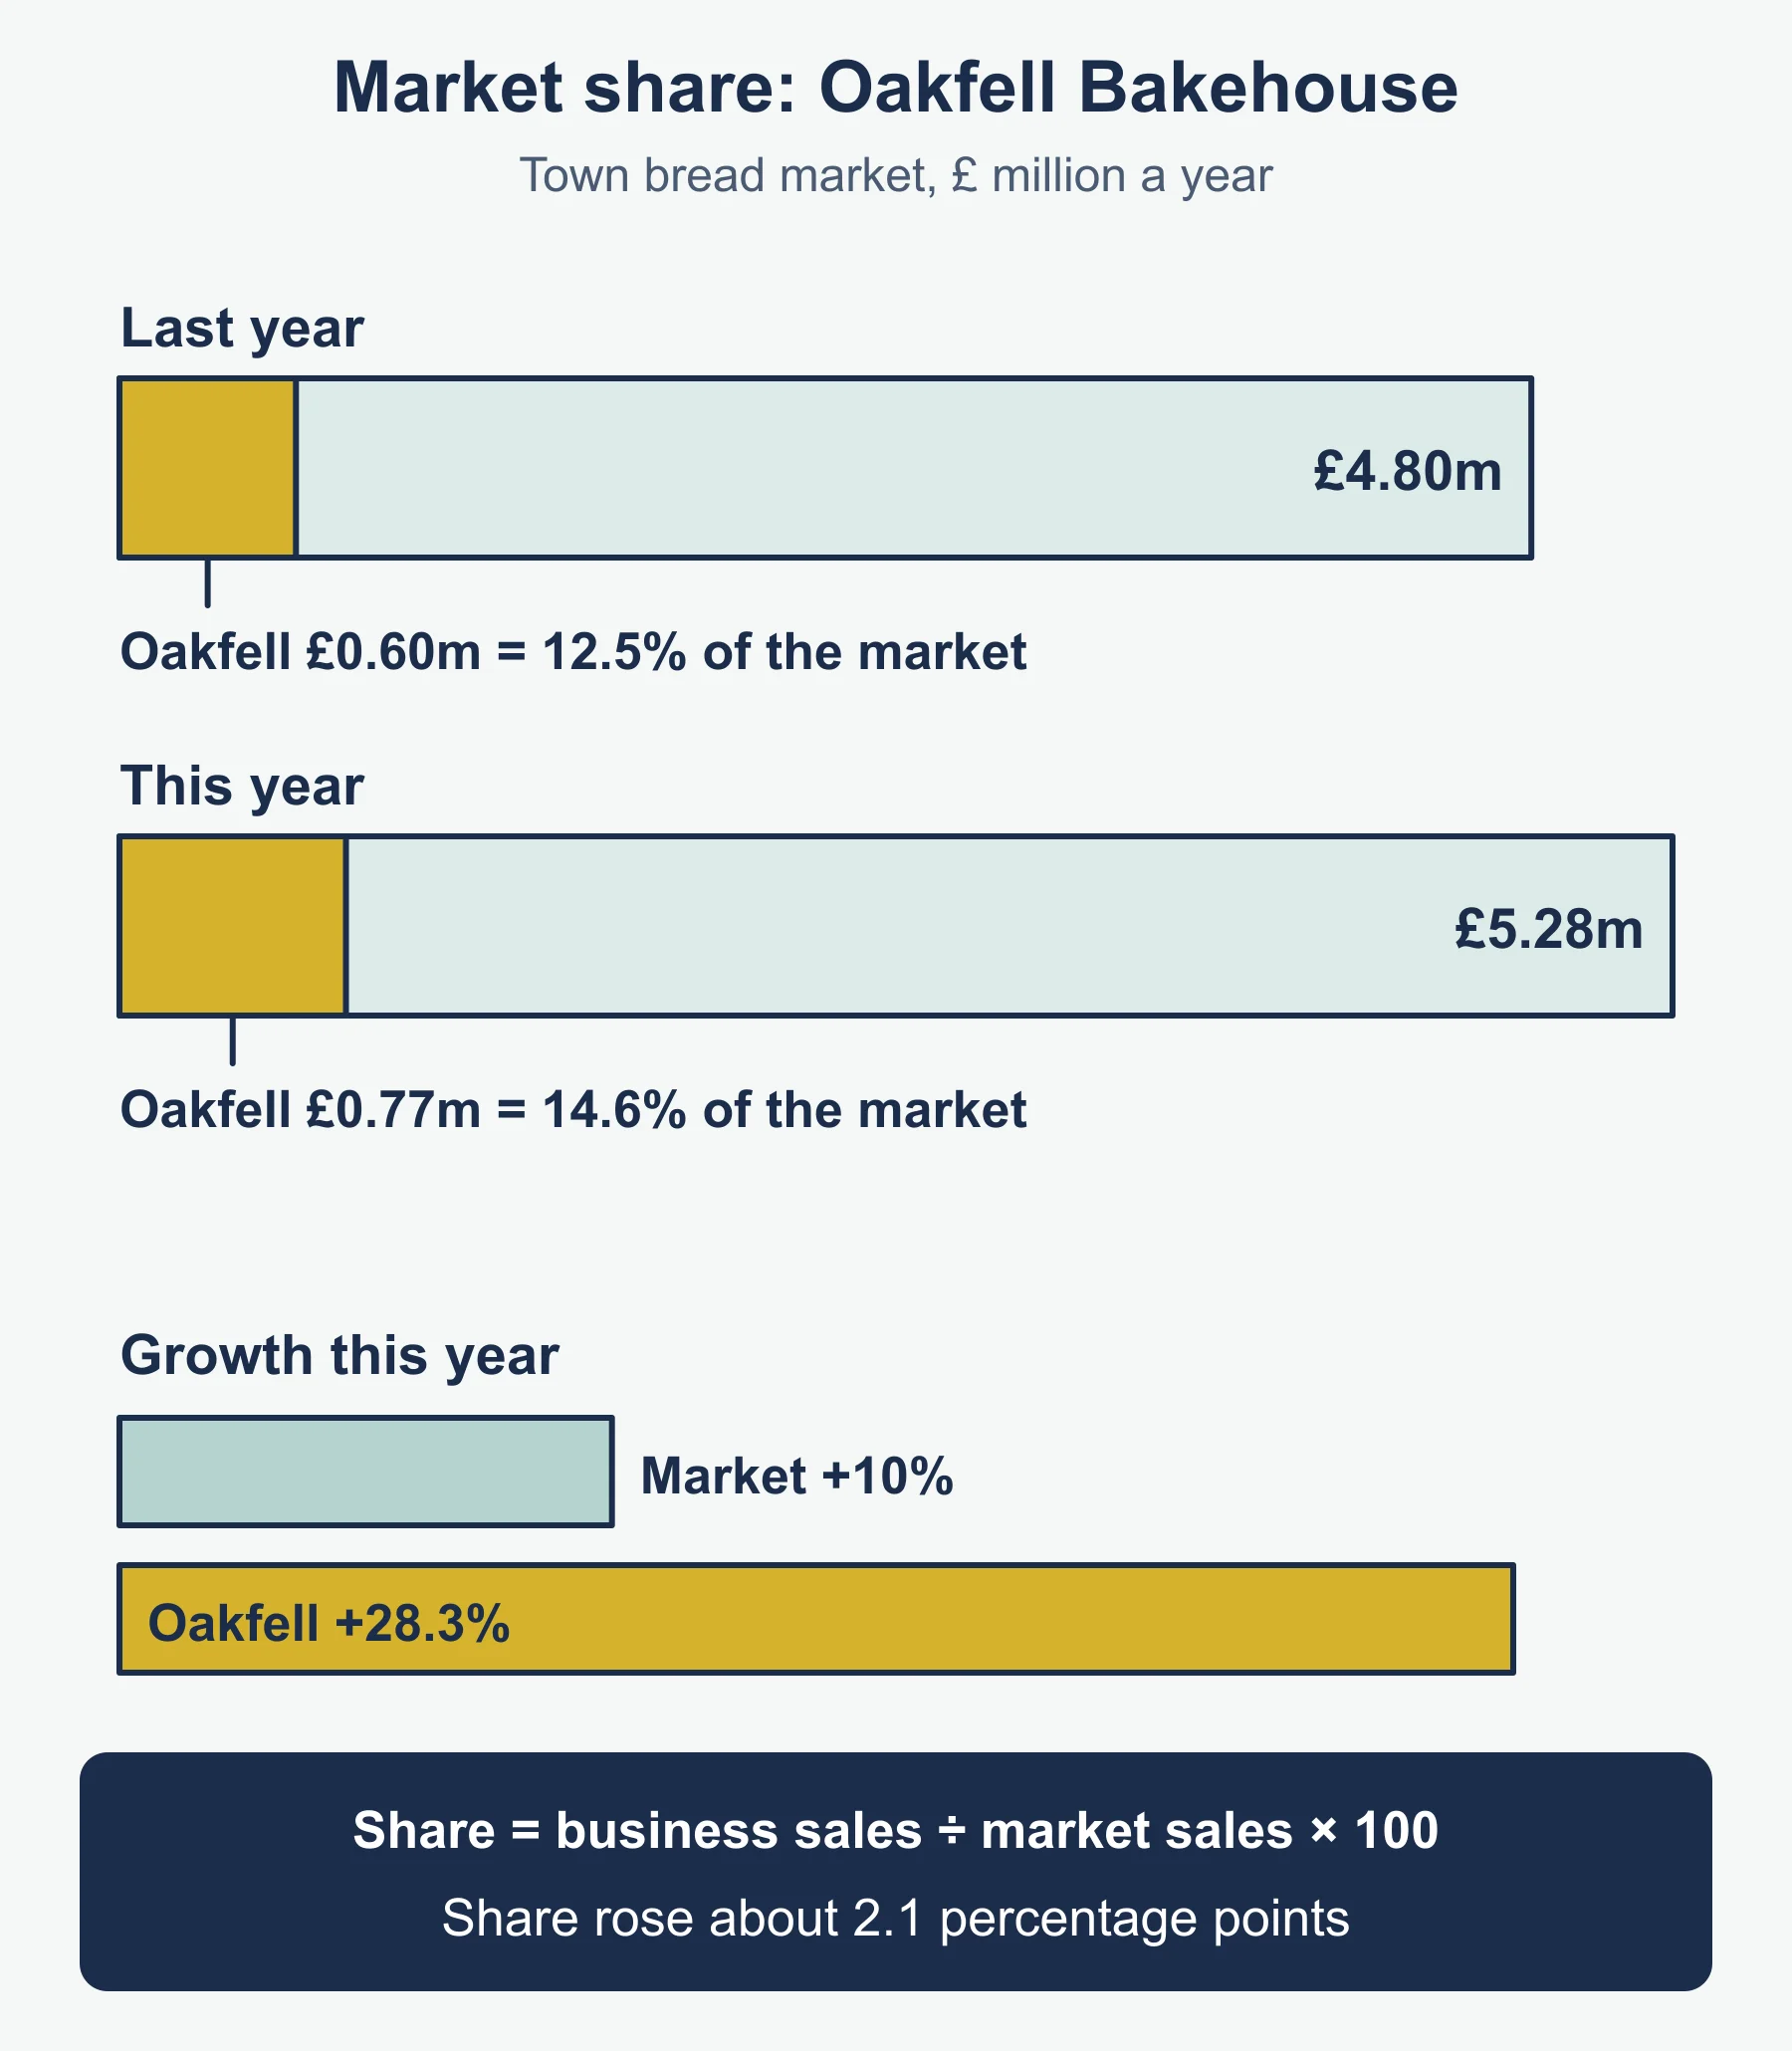
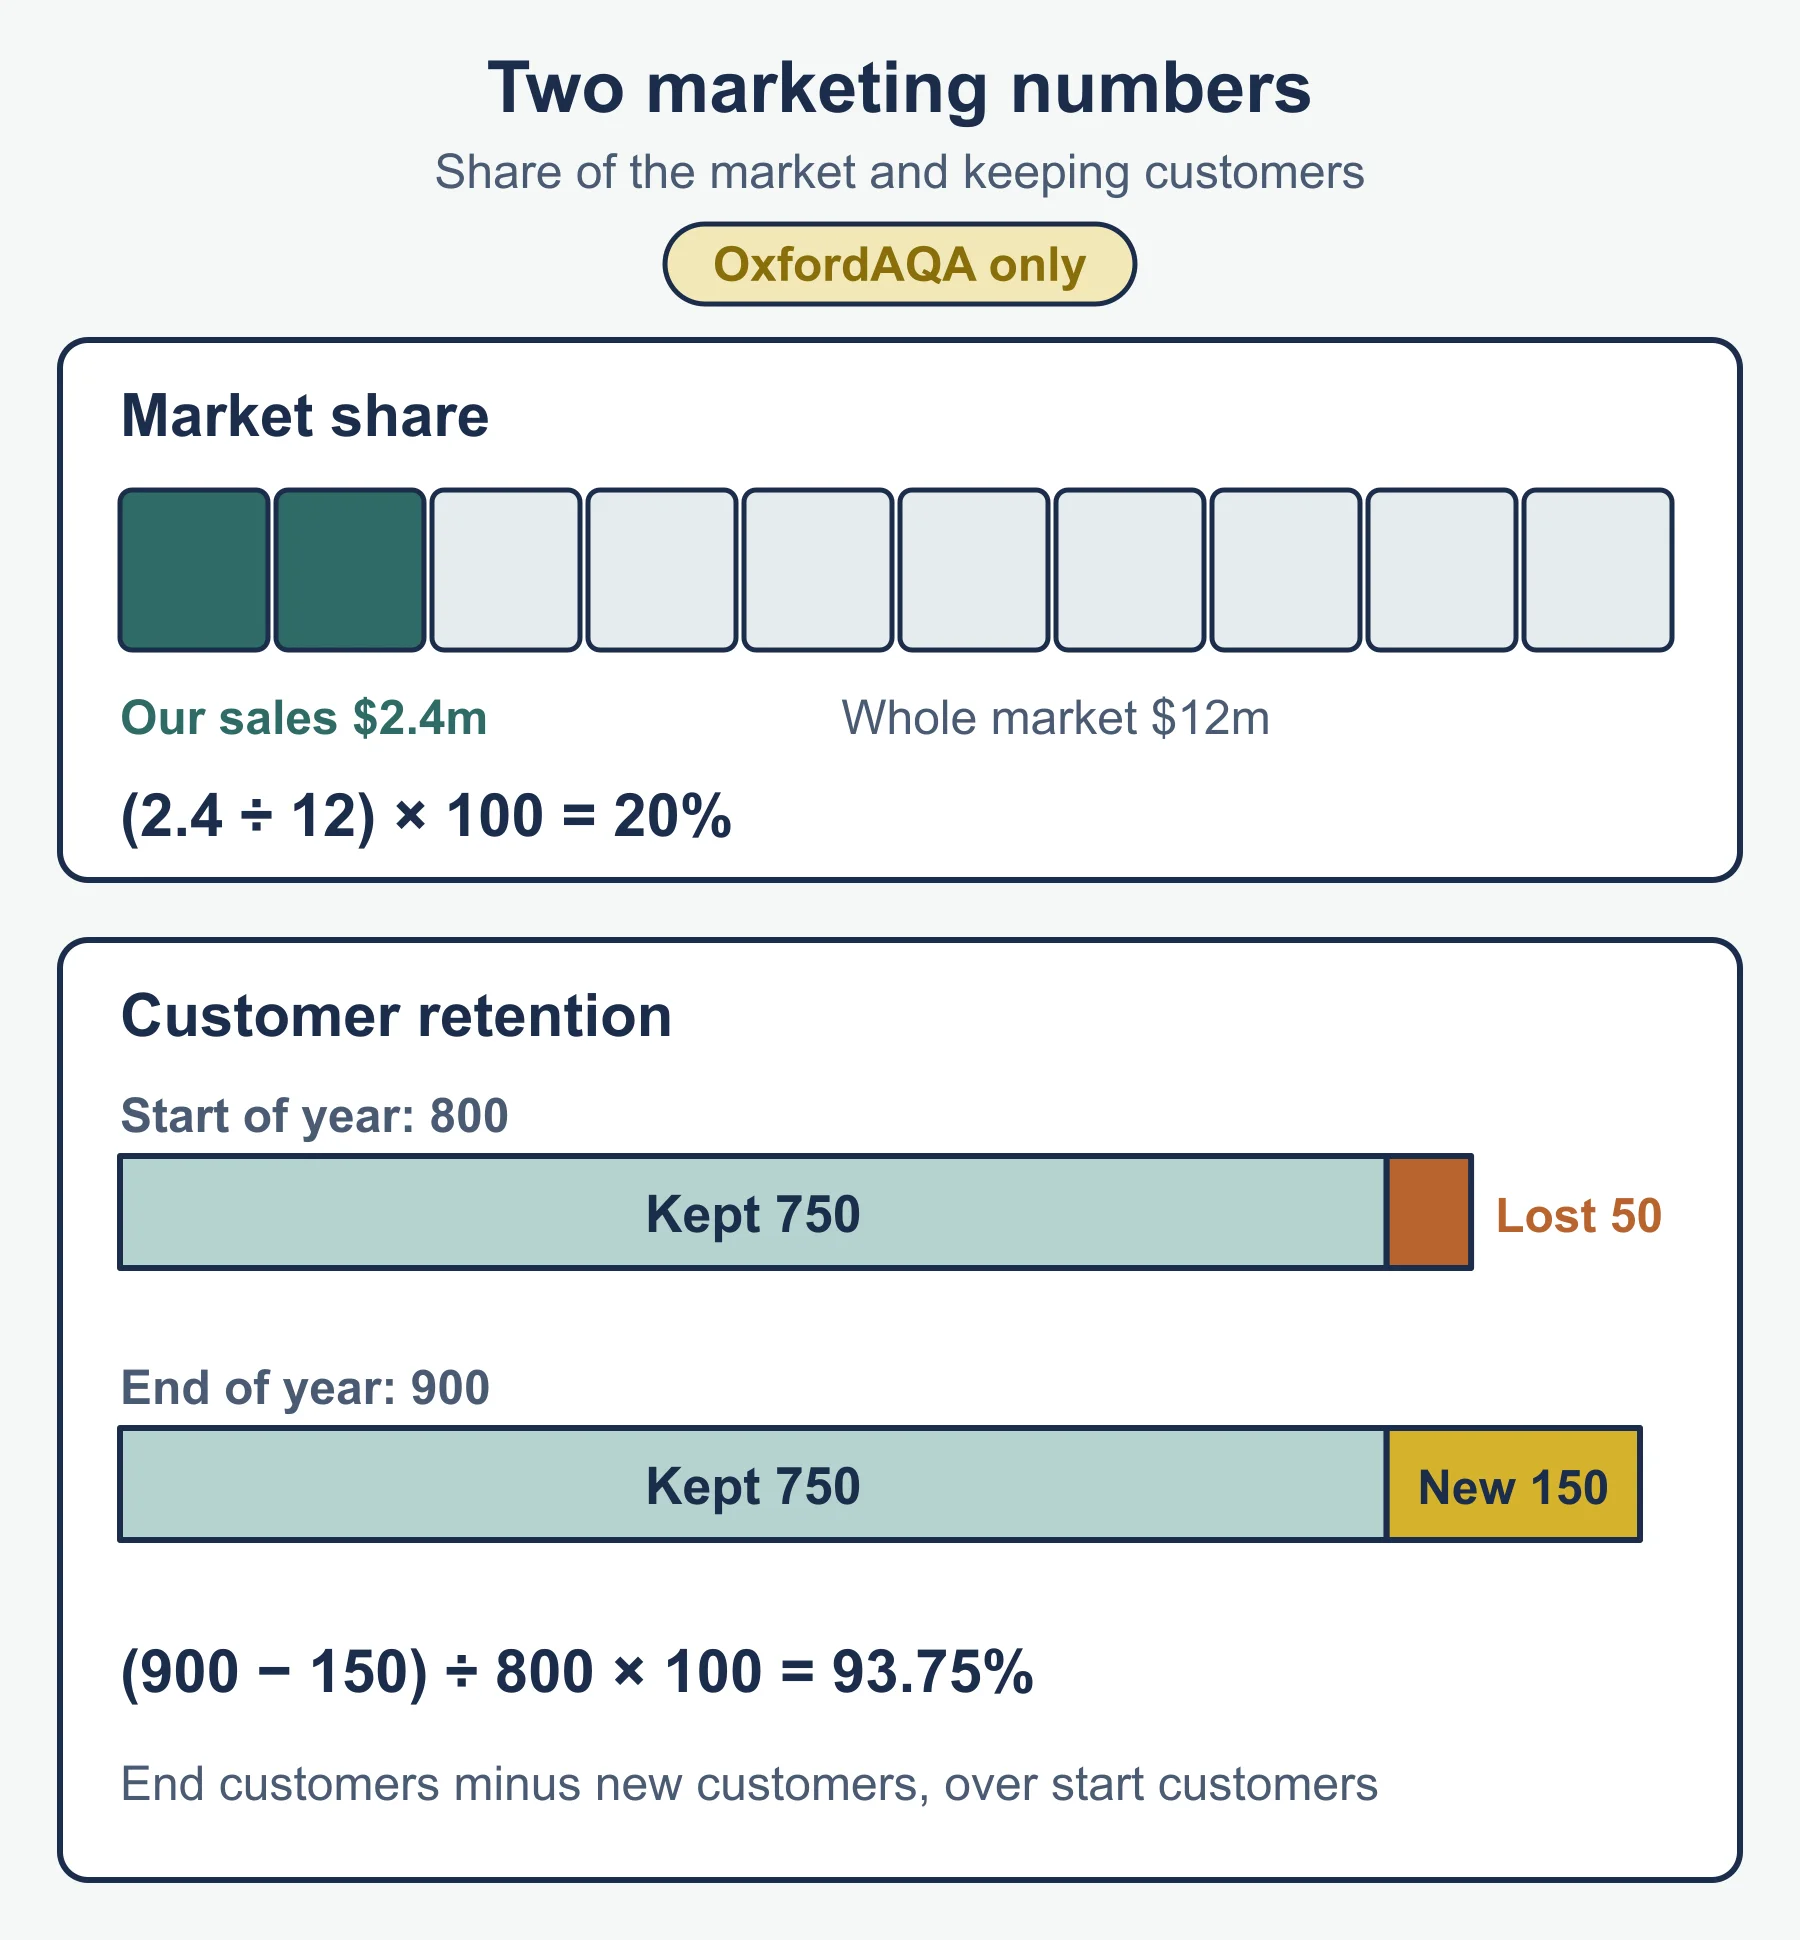
| Market share | The portion of the whole market that one firm’s sales represent, as a percentage |
| Demand | Amount consumers are ready and able to buy at every price during a set period |
| Supply | Amount producers are ready and able to sell at every price during a set period |
| Equilibrium | The price where buyers’ wishes match sellers’ offers |
| Excess supply | Quantity supplied is greater than quantity demanded at the price (a surplus) |
| Excess demand | Buyers want more than sellers offer at that price (a shortage) |
Formulas (standard forms)
The specification does not print formulas for this area, so these are the standard forms.
| Measure | Formula |
|---|---|
| Market growth (%) | (new size − old size) ÷ old size × 100 |
| Market share (%) | firm sales ÷ total market sales × 100 |
| Sales growth (%) | (new sales − old sales) ÷ old sales × 100 |
Method in steps:
- Check whether the data are by value or by volume, and use one measure throughout.
- Subtract old from new before dividing by old.
- Give a unit or a percentage sign and round sensibly.
- Comment: a firm whose sales grow more slowly than the market is losing share.
Why market size matters
- Shows the ceiling on potential sales revenue.
- Guides investment decisions and the chance of economies of scale.
- Tells you how attractive the market is to new entrants.
- Gives context for the firm’s own share and growth.
- A big, static market suggests saturation: gains must come from rivals.
Raising market share: evaluation prompts
| Route | For | Against |
|---|---|---|
| Price cuts | Fast | Copied; lower margins |
| Differentiation or new products | Hard to copy | Costly; uncertain |
| Promotion | Awareness | May not convert |
| Distribution (including online) | New customers | Needs investment |
| Acquisition or merger | Instant share | Expensive; integration risk |
| Organic growth | Lower risk | Slow |
Judge by: how alike products are, how price-sensitive buyers are, the firm’s cash, how rivals may respond, and the time available.
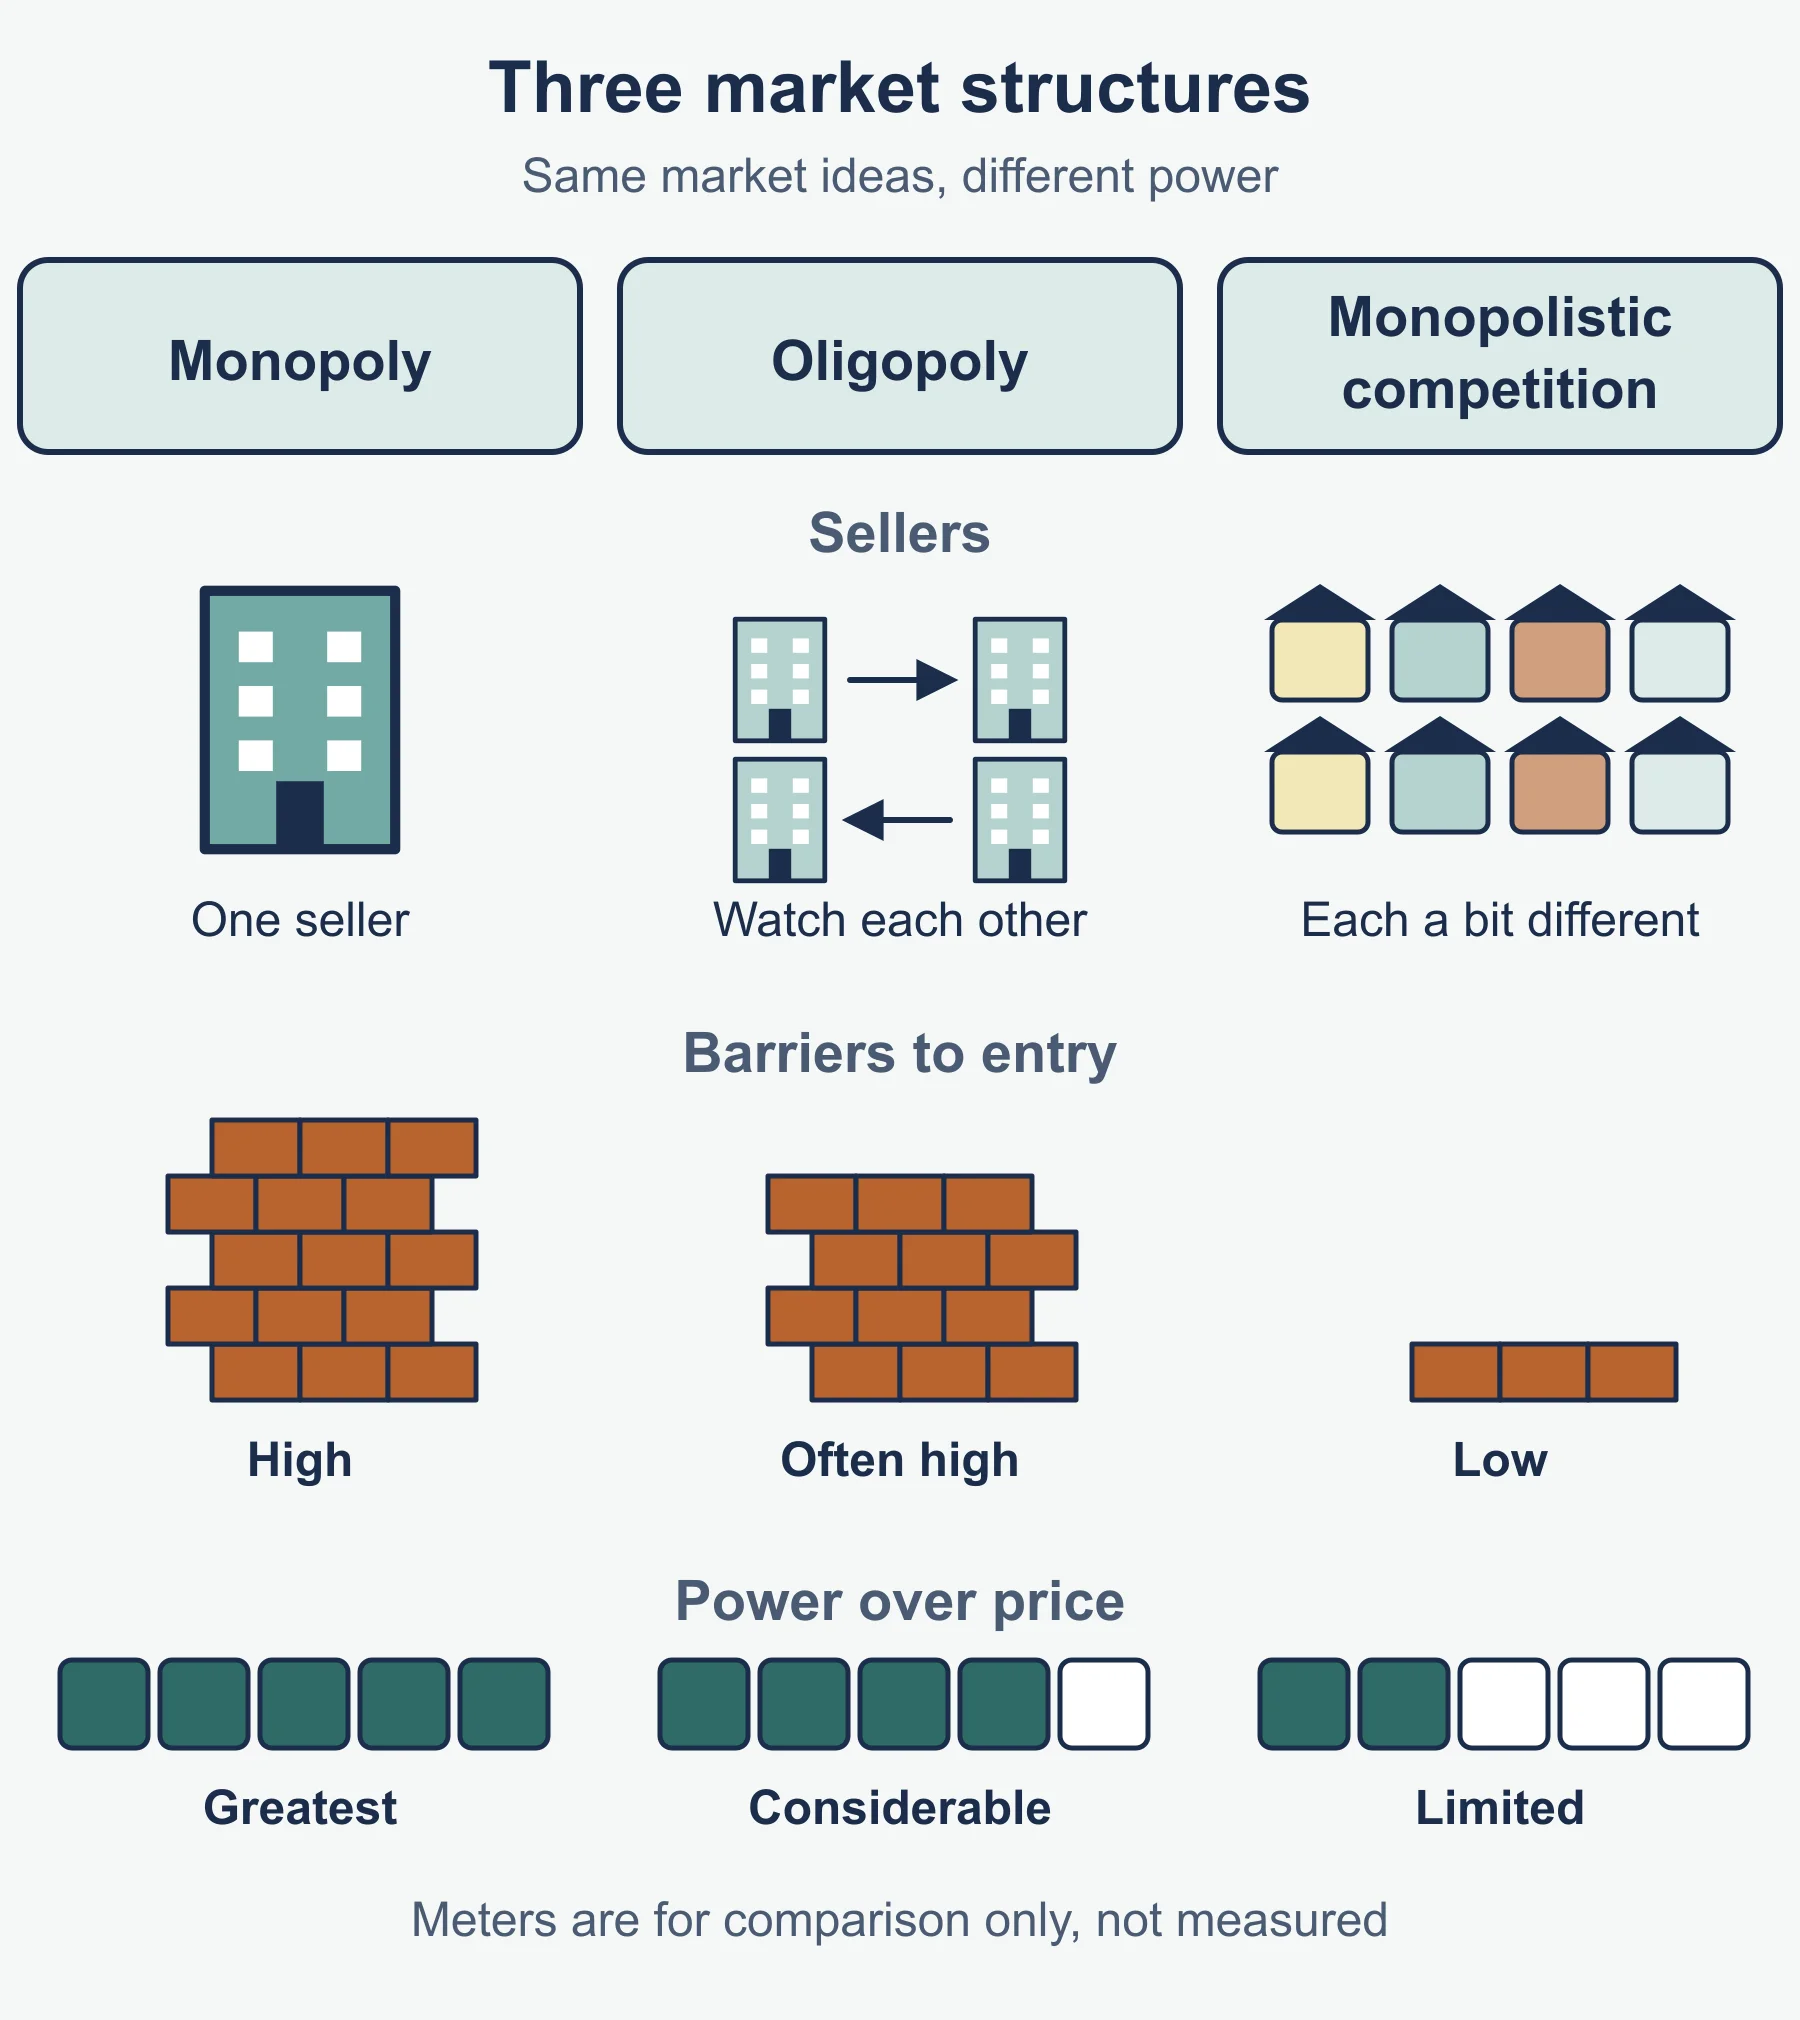
Market structures at a glance
| Monopoly | Oligopoly | Monopolistic competition | |
|---|---|---|---|
| Sellers | One dominant | Few large | Many small |
| Barriers to entry | High | Often high | Low |
| Products | No close substitute | Branded, similar | Differentiated |
| Rivals’ reactions | Not a worry | Central: interdependence | Minor |
| Decision making power | Greatest | Considerable but constrained | Limited |
Must-know distinction: dominant is not the same as large. Power comes from few substitutes and high barriers, not from size alone.
Demand and supply essentials
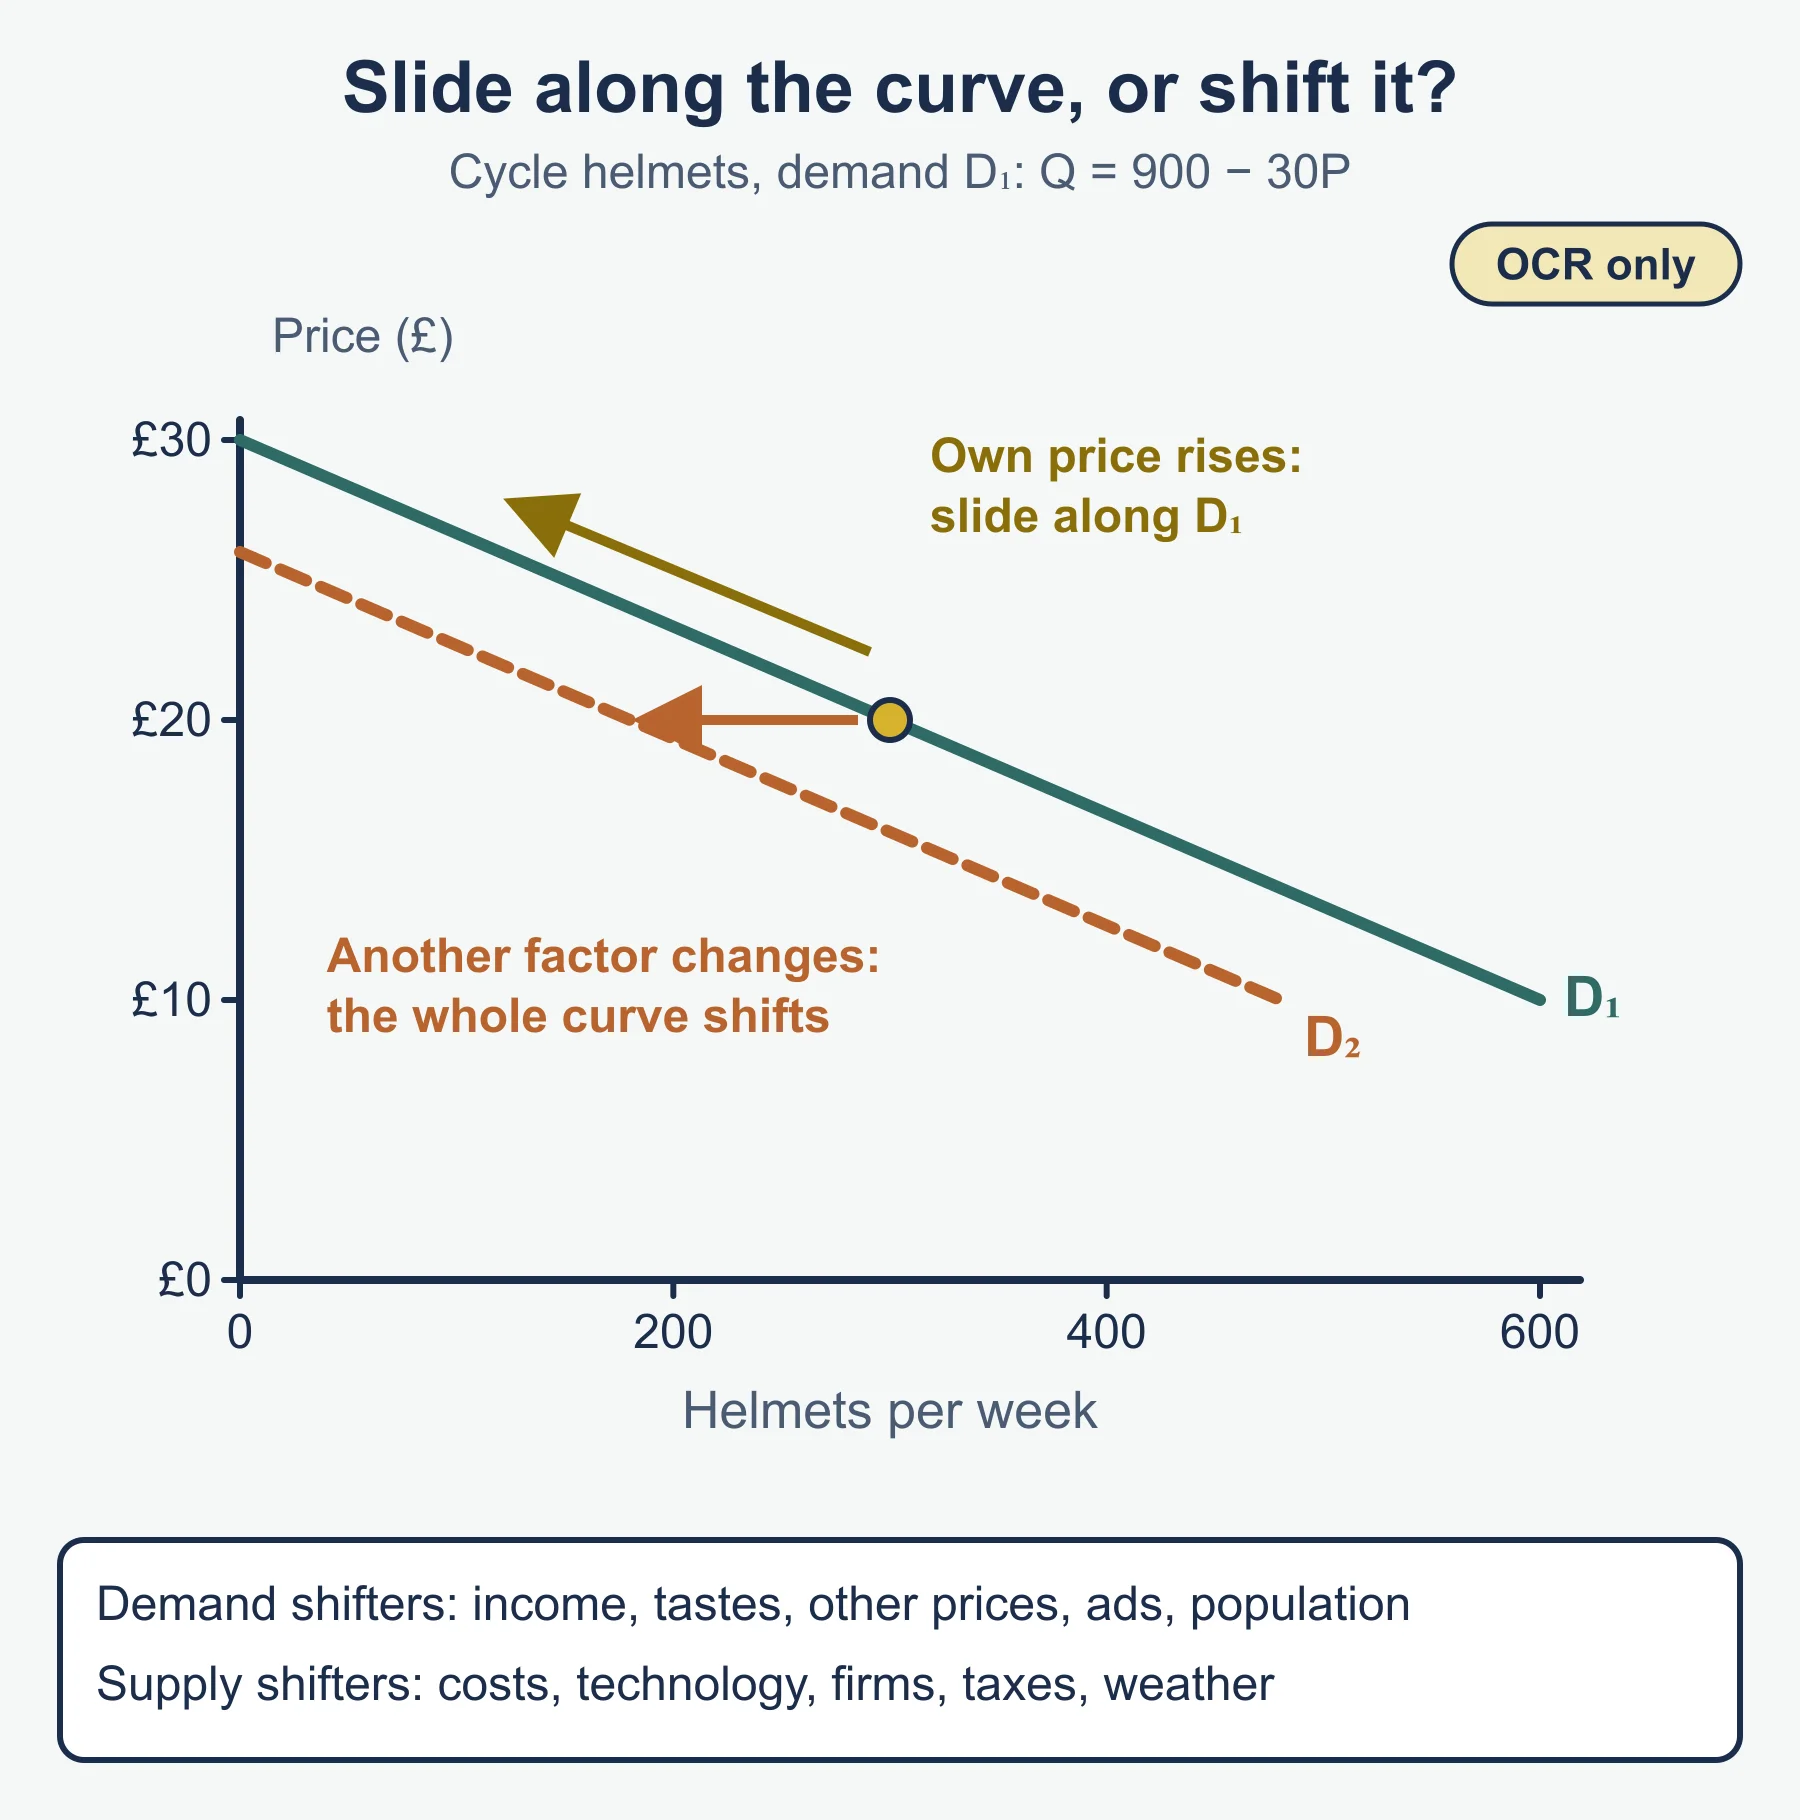
- Demand slopes downward; supply slopes upward.
- Own-price change: movement along the curve.
- Any other determinant: shift of the whole curve.
- Rightward shift means more at every price; leftward means less.
| Curve | Determinants (standard list) |
|---|---|
| Demand | income; prices of substitutes and complements; tastes and trends; advertising; population; expectations; seasons |
| Supply | costs of production; technology; number of firms; taxes and subsidies; weather; expectations |
Effects of a shift (one curve, other fixed):
| Change | Price | Quantity |
|---|---|---|
| Demand shifts right | up | up |
| Demand shifts left | down | down |
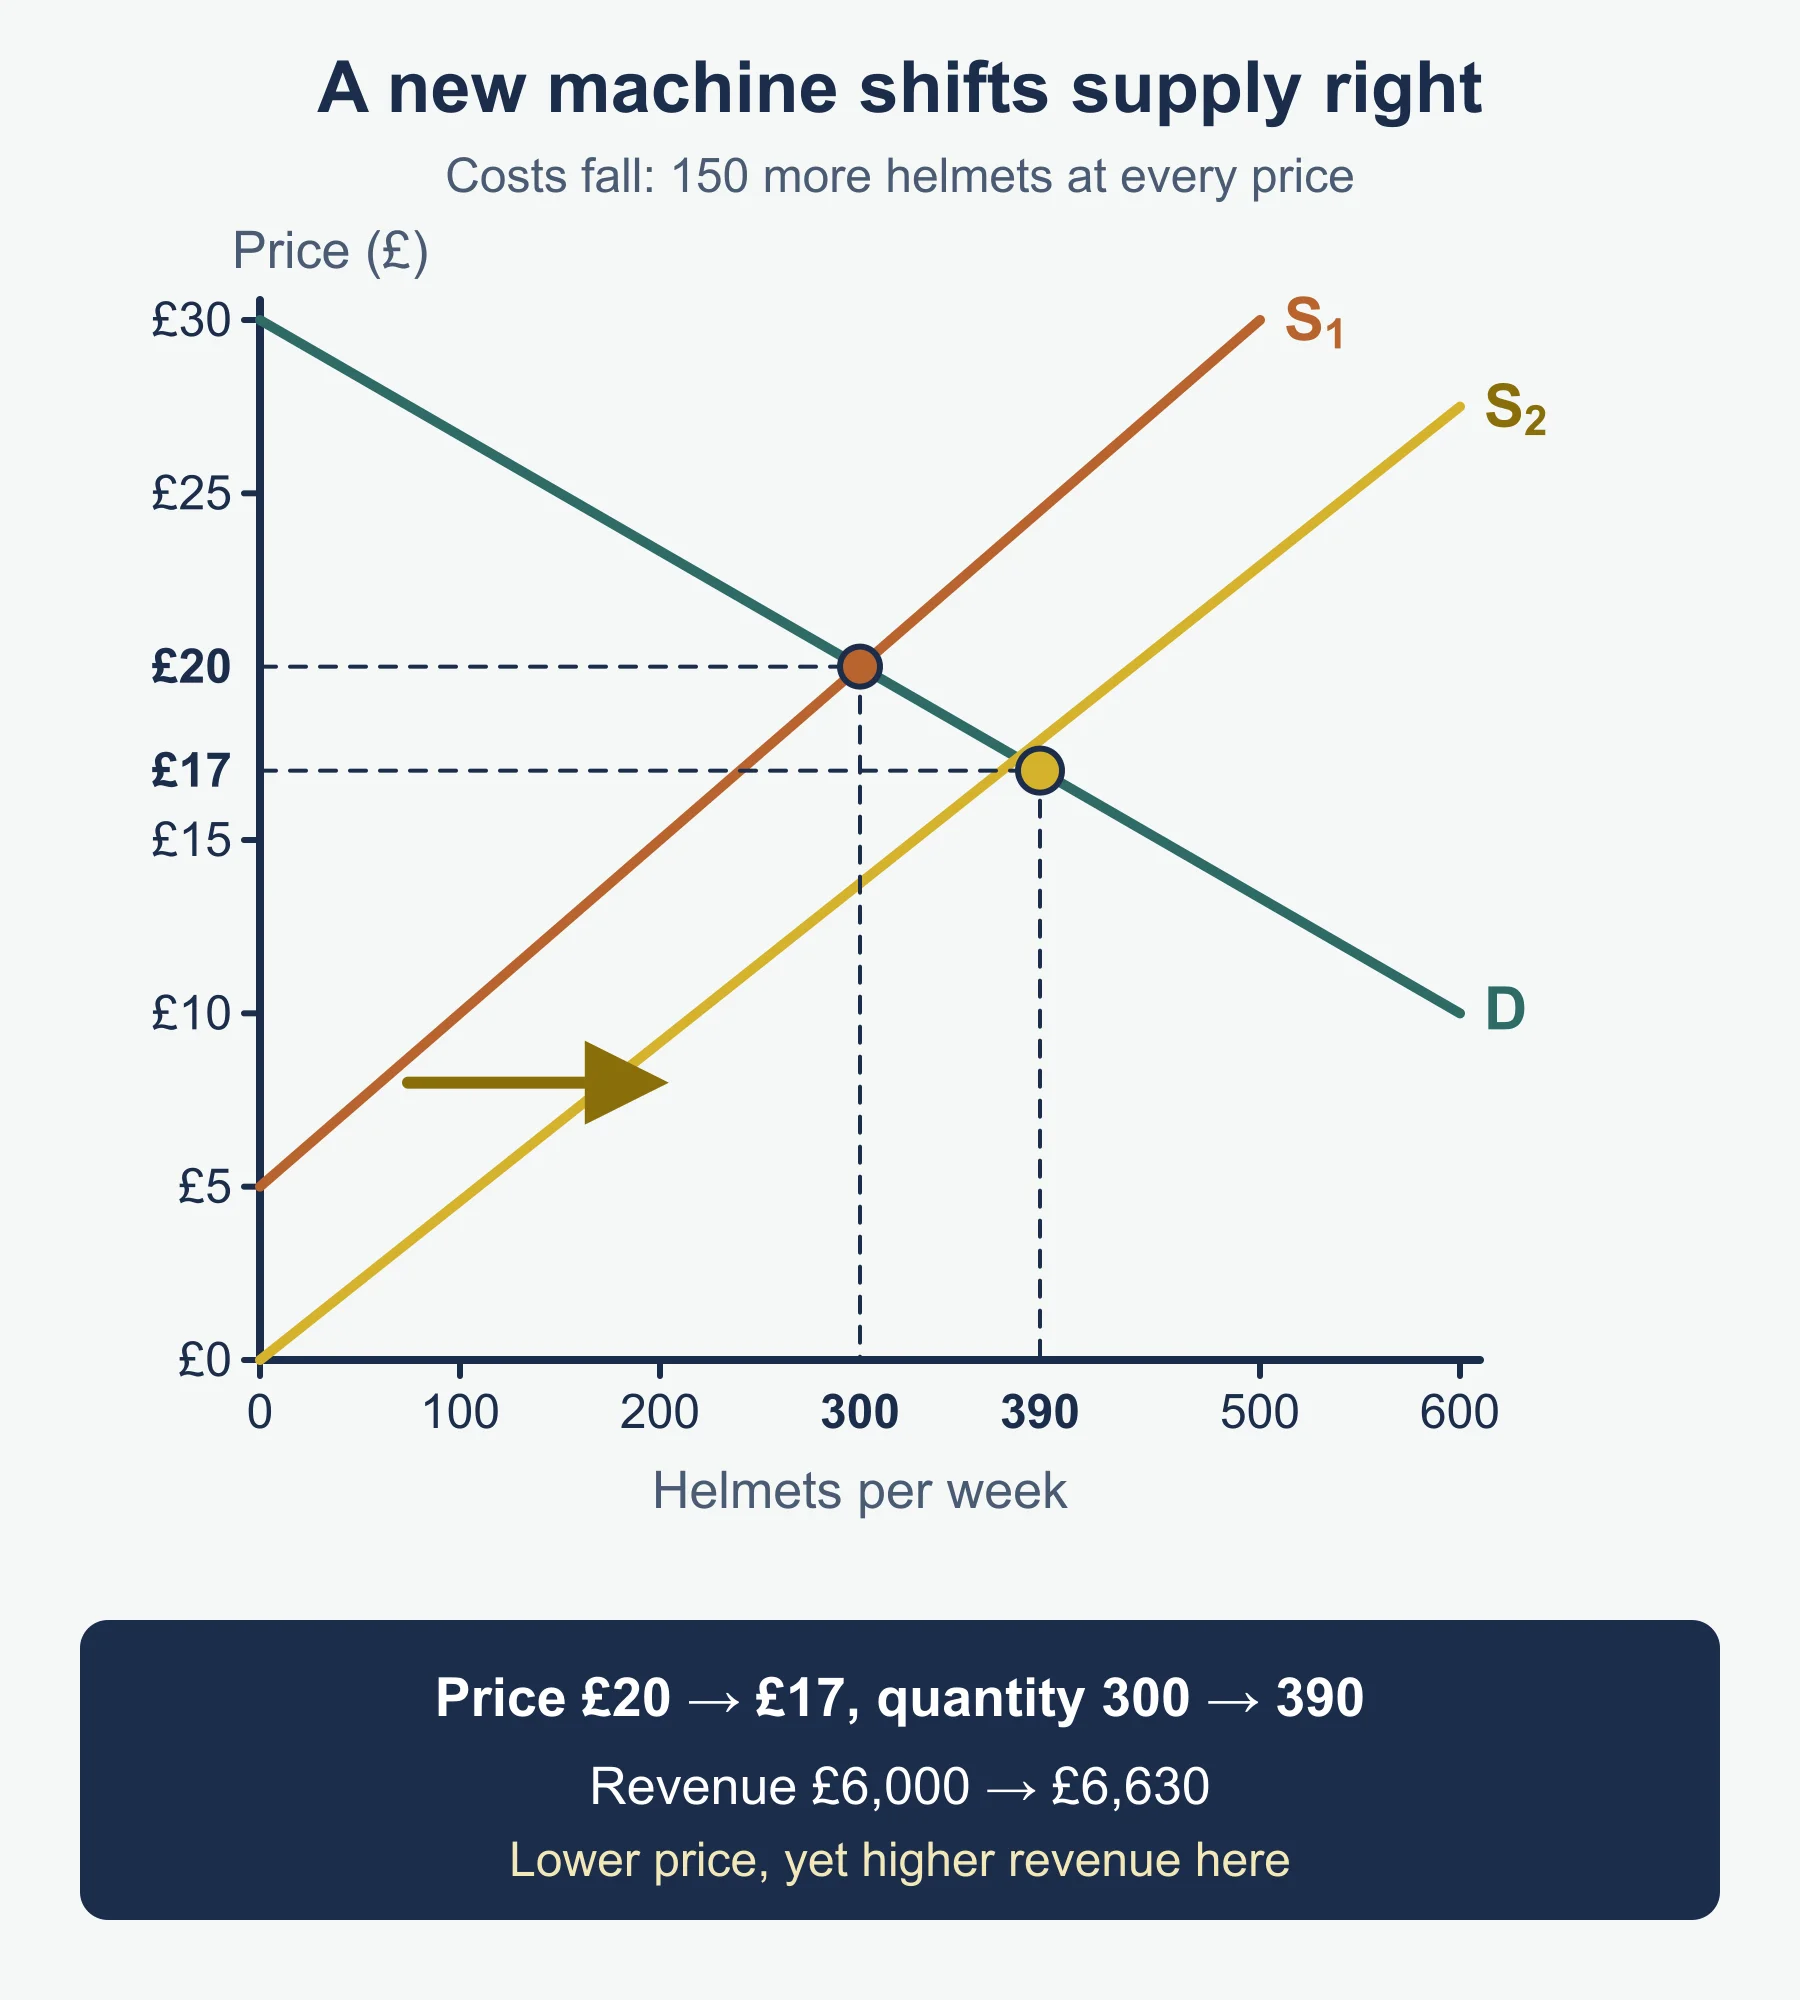
| Supply shifts right | down | up |
| Supply shifts left | up | down |
Diagram method in steps:
- Draw axes: price (vertical), quantity (horizontal).
- Sketch the starting curves and mark the equilibrium.
- Move one curve and label it new.
- Mark the new equilibrium and read price and quantity.
- Write one sentence on what changed, why, and what the business might do.
Excess and shortage
| Excess supply | Shortage | |
|---|---|---|
| Price vs equilibrium | Above | Below |
| Typical effects | Unsold stock, storage cost, price cuts, falling margin, waste if perishable, output cuts | Lost sales, price rises, higher margin for sellers with stock, frustrated customers, new entrants attracted |
| Evaluate by | How long it lasts, perishability, ability to change price | Whether customers wait or switch, how fast supply can respond |
Price and output decisions
- Demand up: firms can raise price, increase output, take on staff or stock.
- Demand down: firms cut price, reduce output, cut promotions or seek new markets.
- Costs down (supply right): lower prices to build share or keep prices for margin.
- Costs up (supply left): absorb the cost or pass it on, depending on market power.
Worked reminder
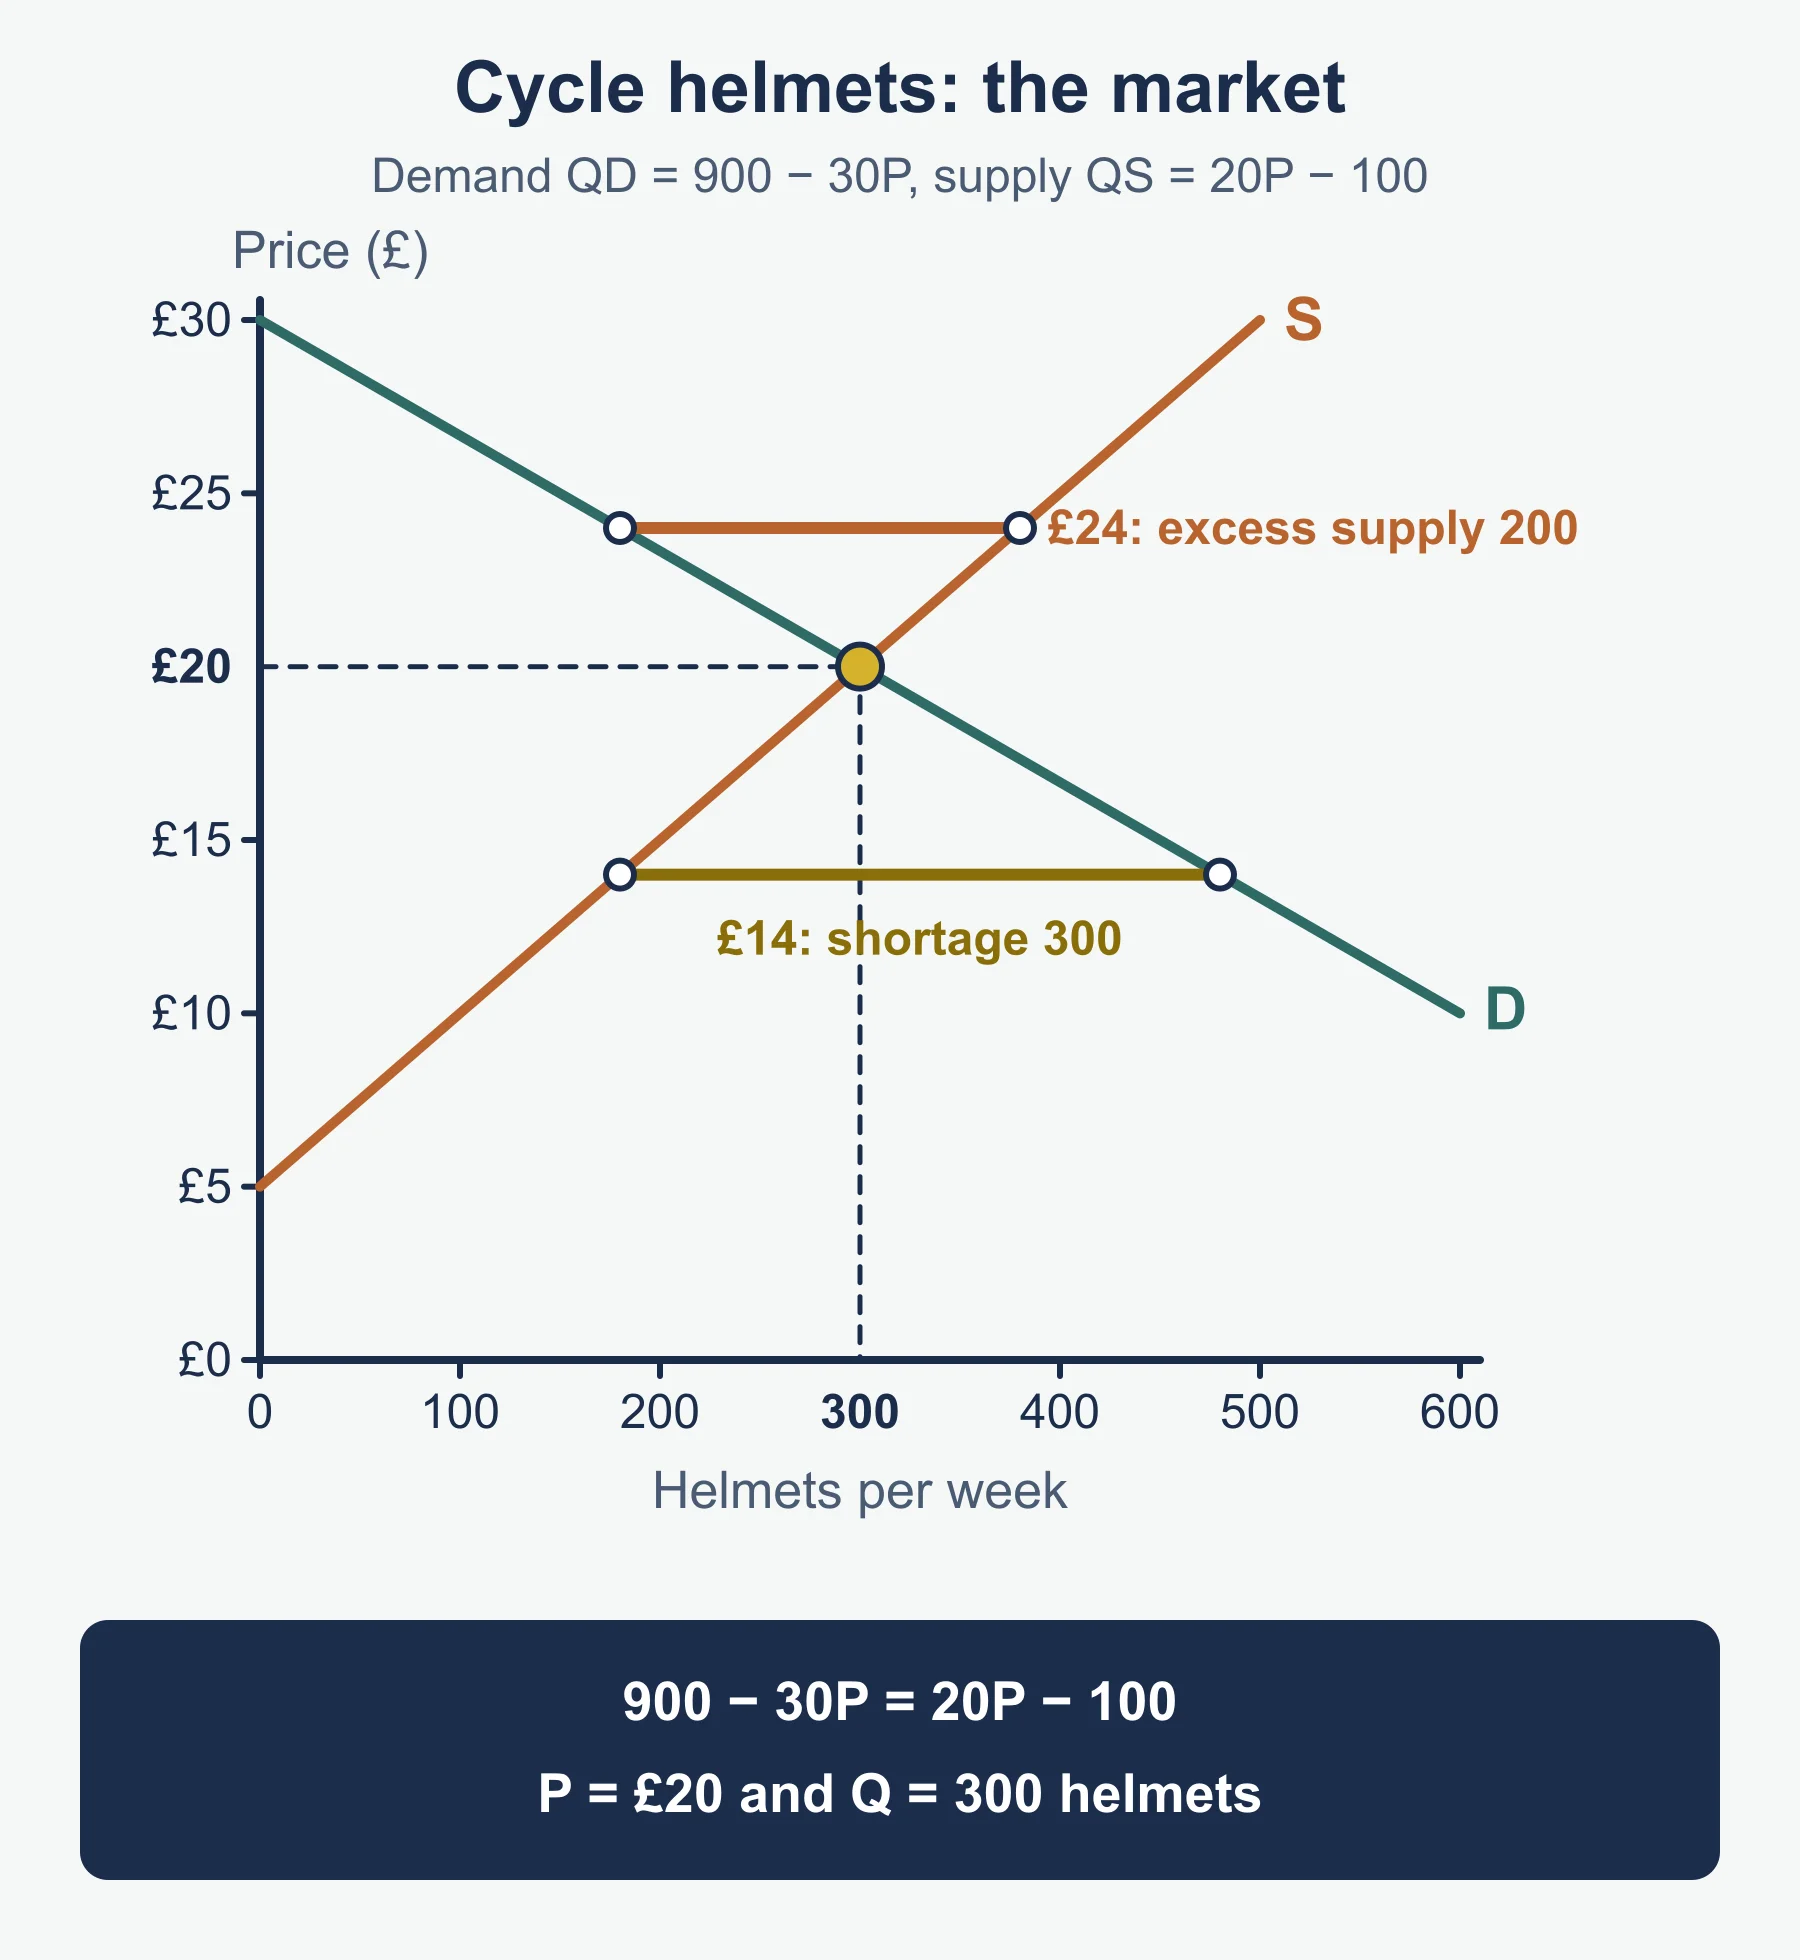
Demand QD = 600 − 20P, supply QS = 40P − 120. Equilibrium: 600 − 20P = 40P − 120, so 720 = 60P, P = £12 and Q = 360. At £16 QD = 280 and QS = 520, an excess supply of 240.
Competition: points to recall
- Competition is rivalry for customers; it can be on price or on non-price factors such as quality, design, service and promotion.
- Strong competition tends to push prices down, raise the cost of winning customers and shrink margins.
- Weak competition, usually from high barriers or few rivals, gives a business more freedom on price and output.
- The number of rivals, how similar their products are and how easily new firms enter all affect how intense it feels.
Analysis chains to practise
A good paragraph links a cause to a consequence for the named business, then adds a judgement. Practise these:
- Rising incomes, demand for a premium product shifts right, price and quantity rise, so the seller can raise price or add output, but only if it can obtain extra stock.
- A new rival enters a market with low barriers, so supply shifts right, price falls, so existing firms see lower margins unless they differentiate.
- A subsidy cuts costs, so supply shifts right, so the price falls and output rises, which helps a firm seeking share.
- A fall in the price of a substitute, demand for the firm’s product shifts left, so price and quantity fall; the firm may respond with promotion.
- Fashion moves away from a product, so demand shifts left and stock builds up, which may force discounting.
Evaluation checklist
- Which determinant is largest in this case?
- Is the change short-lived or lasting?
- Can the business predict or control it?
- Does the firm have the cash and capacity to respond?
- Do rivals face the same change?
- What is your reasoned judgement, and what would change it?
Quick self-test
- Define market share and write its formula.
- A market grows from 250,000 units to 275,000 units. State the growth rate.
- A firm sells 30,000 units in the first market above and 30,000 in the second. Calculate its share each time. What does the change show?
- A market’s value rises from £15m to £18m. Calculate growth.
- State two features of monopolistic competition.
- Why might an oligopolist avoid cutting price?
- Demand is QD = 500 − 20P and supply is QS = 30P − 100. Find the equilibrium price and quantity.
- In question 7, find the gap at £15.
- In question 7, find the gap at £9.
- Explain the effect on price and quantity if supply decreases but demand is unchanged.
Answers
- The portion of all market sales that one firm makes, as a percentage: firm sales ÷ market sales × 100.
- (275,000 − 250,000) ÷ 250,000 × 100 = 10%.
- 30,000 ÷ 250,000 = 12%, then 30,000 ÷ 275,000 = 10.9% (1 decimal place). Its sales did not grow while the market did, so it lost share.
- (18 − 15) ÷ 15 × 100 = 20%.
- Any two: many small sellers; low barriers to entry; differentiated products; limited pricing power.
- Rivals may copy the cut, leaving everyone with lower revenue and no gain in share: this is interdependence.
- 500 − 20P = 30P − 100, so 600 = 50P: P = £12, Q = 260.
- At £15: QD = 200, QS = 350, so excess supply of 150.
- At £9: QD = 320, QS = 170, so shortage of 150.
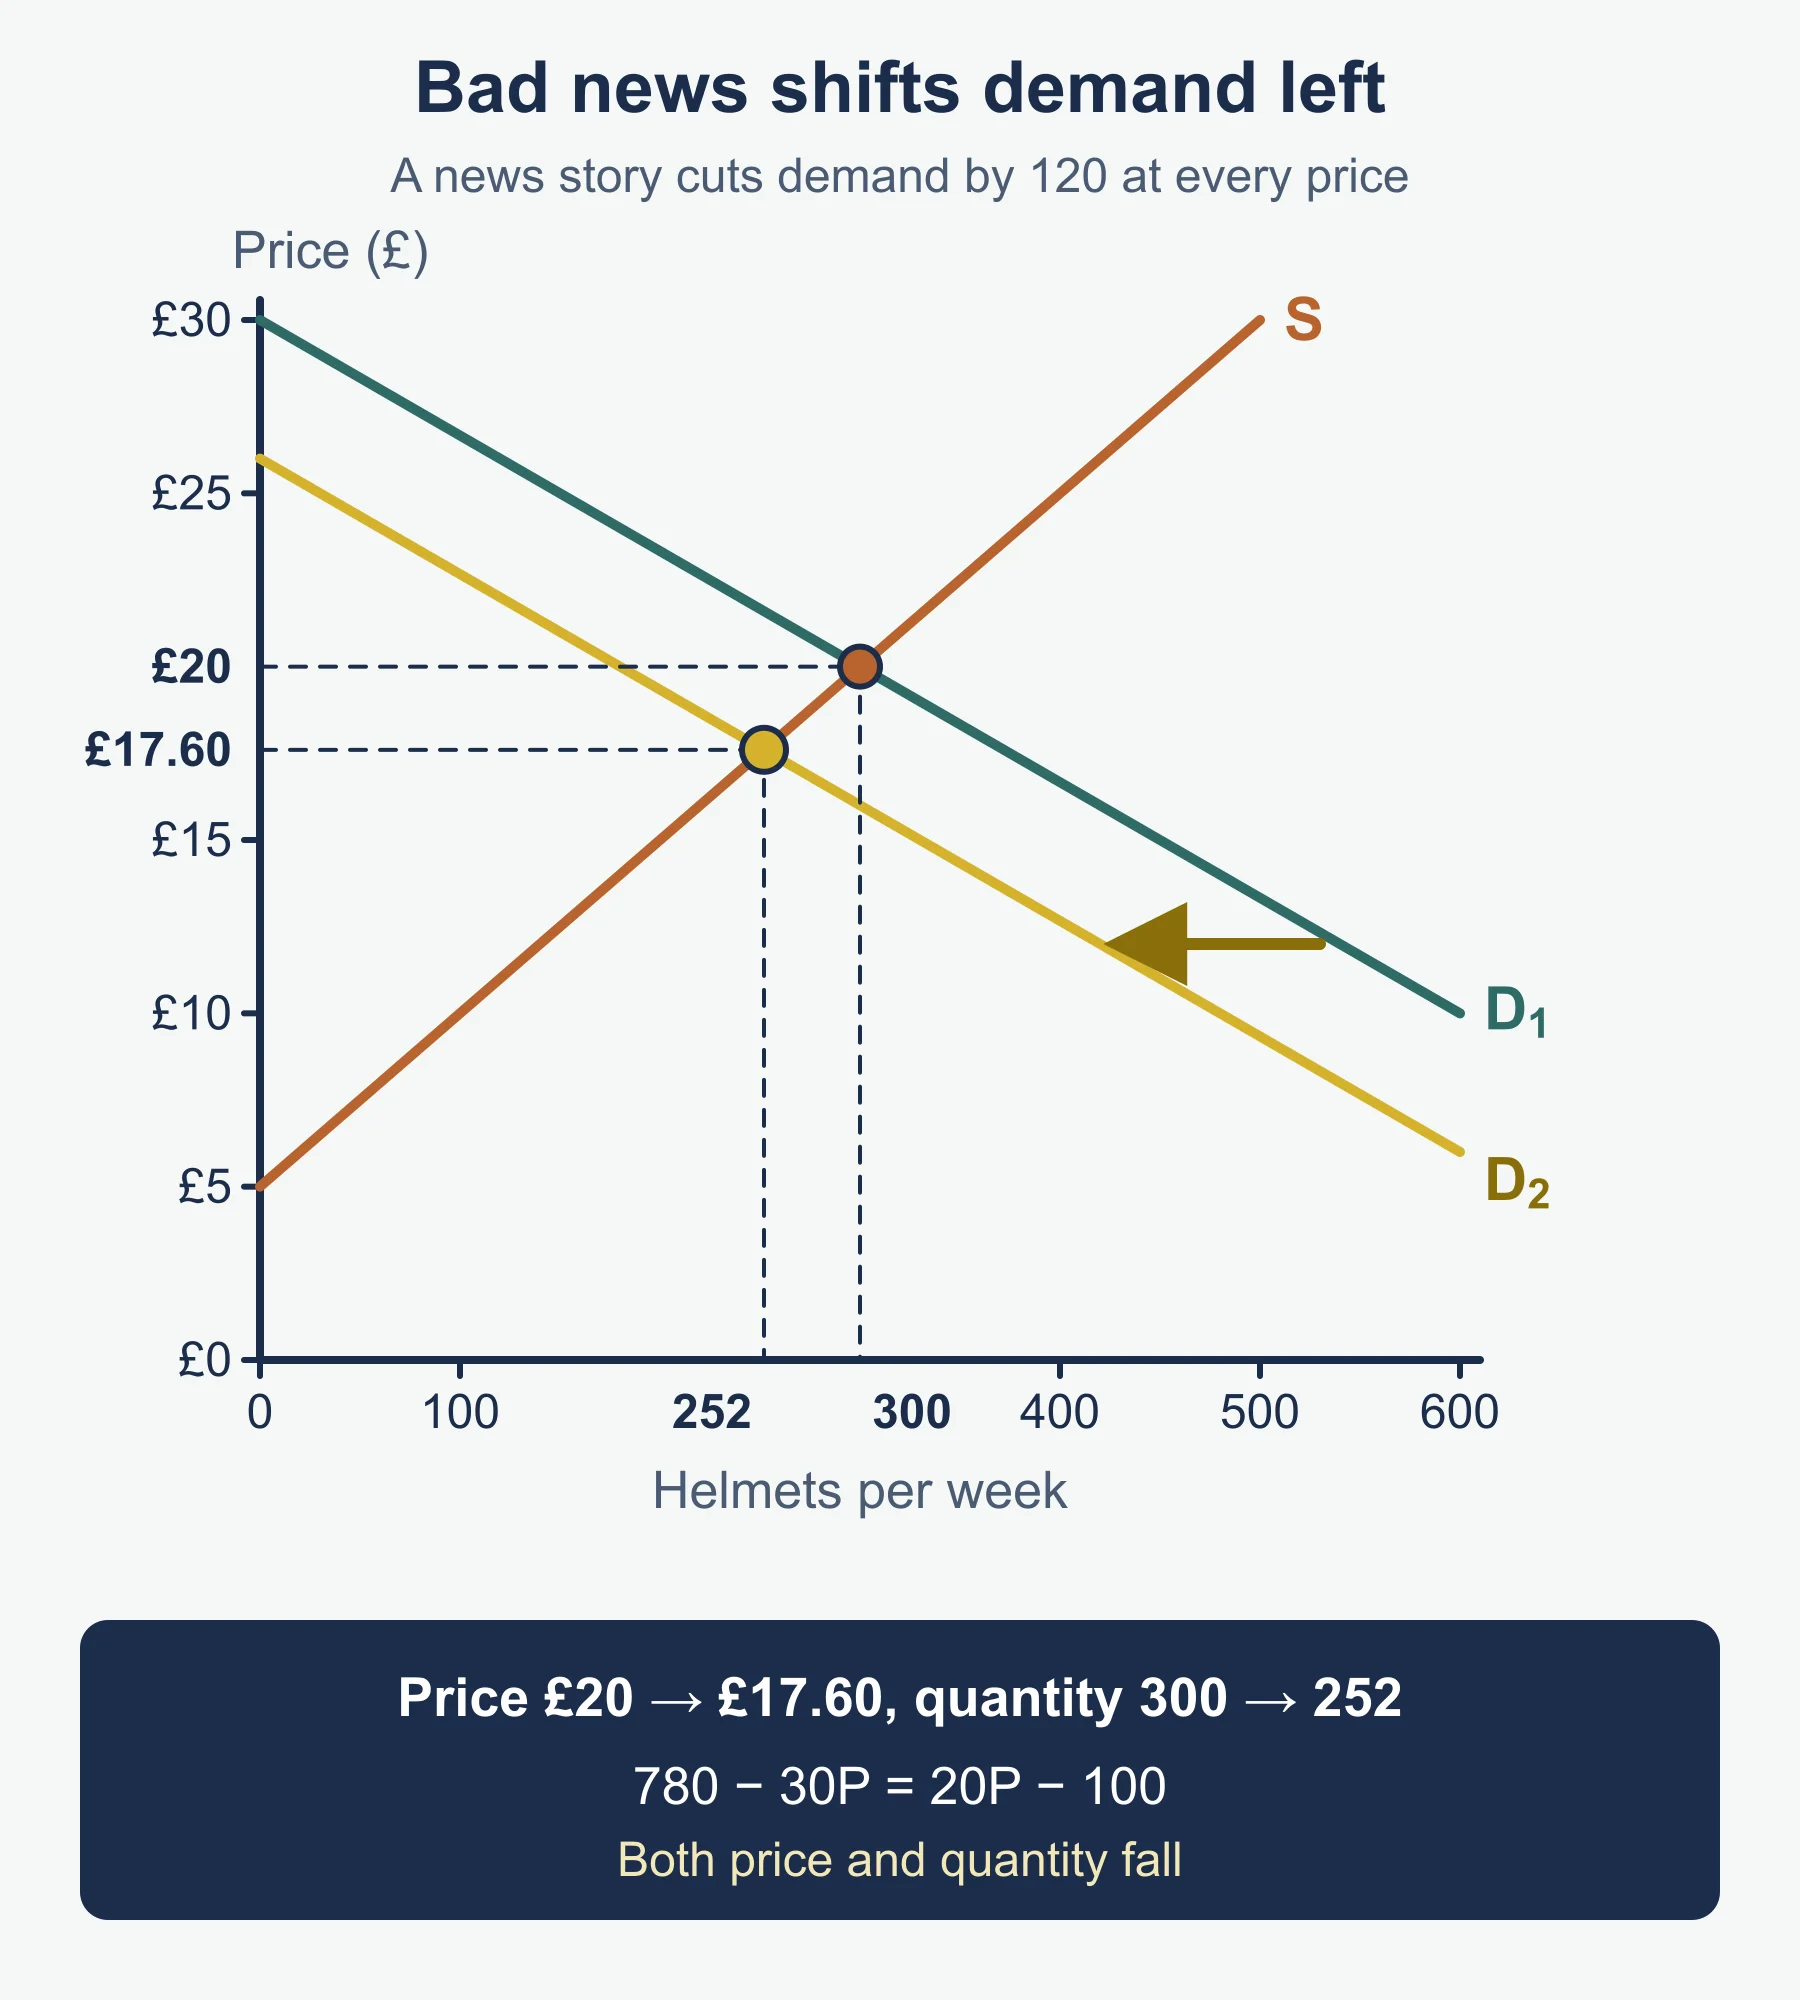
- The supply curve shifts left; at the starting price buyers want more than is offered, so price rises and the equilibrium quantity falls. Example: if supply falls by 75 at each price (QS = 30P − 175), P = £13.50 and Q = 230.
Where marks are usually lost
- Using market share and sales as if they were the same measure.
- Using the later figure as the divisor when finding growth.
- Mixing value and volume in one calculation.
- Describing a price change as a shift of demand.
- Unlabelled axes, or curves without labels, or no equilibrium marked.
- Saying “supply increases” without stating the direction of the shift on the diagram.
- Listing market structure features without linking them to decision making power.
- Evaluation that ends with “it depends” and no stated judgement tied to the business.
Frequently asked questions
What is the formula for market share? Market share is a business’s sales divided by total market sales, multiplied by 100. Check whether the data are by value or by volume and use the same measure throughout.
What is the difference between a movement along a demand curve and a shift? A change in the product’s own price causes a movement along the curve. A change in any other determinant, such as income, the price of substitutes or tastes, shifts the whole curve.
What happens to price and quantity when demand shifts right? When demand shifts right with supply unchanged, both equilibrium price and quantity rise. When demand shifts left, both fall.
Is a dominant firm the same as a large firm? No. Market power comes from having few substitutes and high barriers to entry, not from size alone, so a large firm in a competitive market may have little power over price.
Official syllabus
OCR, Advanced GCE in Business (H431) Specification, Version 2.1 (January 2026), External influences: the market, market size and growth, and demand and supply.
Get free revision emails (optional)
Occasional emails with practice questions, worked explanations and links to free resources for the qualification and subjects you choose. No spam, and you can unsubscribe from any email. The free tools on this site never need an email.
Related resources
-
Study guides
OCR A Level Business: External Influences Facing Businesses (H431)
Study guide to External influences for OCR A Level Business H431: markets, competition, market dominance, the global context and PESTLE factors in case studies.
Business · OCR · A Level
Read guide -
Practice questions
OCR A Level Business: External Influences Facing Businesses — Practice Questions
Original practice questions with worked answers on markets, market forces, globalisation and PESTLE factors for OCR A Level Business H431 External influences.
Business · OCR · A Level
Try questions -
Revision notes
OCR A Level Business: External Influences Facing Businesses — Revision Notes
Condensed recall notes on markets, market forces, globalisation and PESTLE factors for OCR A Level Business (H431), External Influences Facing Businesses.
Business · OCR · A Level
Revise topic
Related articles
-
teaching
A Level tuition in Dubai: Cambridge or Pearson Edexcel International A Level?
Schools in Dubai and Abu Dhabi teach either Cambridge International AS & A Level or Pearson Edexcel International A Level. How the two are structured, why it matters for tuition, and how online classes from Lahore work.
9 October 2026
-
curriculum guides
Choosing subjects at IGCSE and A Level
How subject choices at 14 and 16 affect university options later, and how to keep pathways open without overloading a timetable.
28 July 2026
Studying this with a teacher
Working through Business A LEVELS?
This page is free and stays free. If you would rather be taught it, Marlbridge runs Business classes one-to-one, online in your own time zone. One-to-one only for this course: Rs 6,000 per class in Pakistan, with other currencies on the fees page. The first trial class is free. WhatsApp replies within an hour (8am–11pm Pakistan time, every day); email the same day.
OCR Business teachers at Marlbridge
