
Study Guides
OxfordAQA A-Level Business: Marketing objectives and plans and Marketing data (9625/9725)
Study guide to OxfordAQA International AS Business marketing objectives, plans, market research, sampling and data interpretation, with worked examples.
- Subject
- Business
- Level
- AS LEVEL
- Topic
- Marketing
- Author
- Marlbridge Academic Team
- Updated
- Reviewed by
- Salman Ahmad (what this means)
Aligned to OxfordAQA A Level Business (9625, 9725), 9625: first teaching September 2018 (current cohorts). 9725: first teaching September 2026 (AS) / September 2027 (A2), the successor specification.. Official specification .
Syllabus page (what it covers and how it is assessed): OxfordAQA A Level Business.
Found an error? Report a correction.
Need help with this topic? Request a free trial class for A Level Business (9625 / 9725).
This guide covers sections 3.1.2.1 Marketing objectives and plans and 3.1.2.2 Marketing data of the OxfordAQA International AS and A-level Business specification. The 9625 and 9725 wordings differ, so points are labelled: (9625 only) or (9725 only); unlabelled points appear in both. Money is in dollars.
Related pages: the Marketing overview study guide, the revision notes for this unit, the practice questions for this unit, the course hub and the printable checklist. To find weak spots first, try the free diagnostics.
Neither specification prints formulas for the calculations, so the formulas below are the standard forms.
The importance of marketing (9625 only)
- Competitiveness: marketing decisions decide whether customers choose the business or a rival.
- Links with other functions: operations must be able to supply what is promoted, finance sets the budget and tracks cash, and human resources provides staff with the skills to deliver the offer.
- Global business: customers and rivals can be anywhere, and online selling reaches abroad. Opportunities are larger markets and new customers. Challenges are different tastes and languages, unfamiliar competitors and the cost of reaching distant buyers. Adapting the offer may be needed.
Marketing objectives
A marketing objective is a measurable, time-limited target for the marketing function. Both versions list sales volume, sales value, market share, customer retention and repeat sales, and sales per product, employee, region, store or customer, with calculation and interpretation. Brand loyalty is listed in 9725 only.
- Sales volume: how many units are sold.
- Sales value: sales revenue, which is price multiplied by quantity.
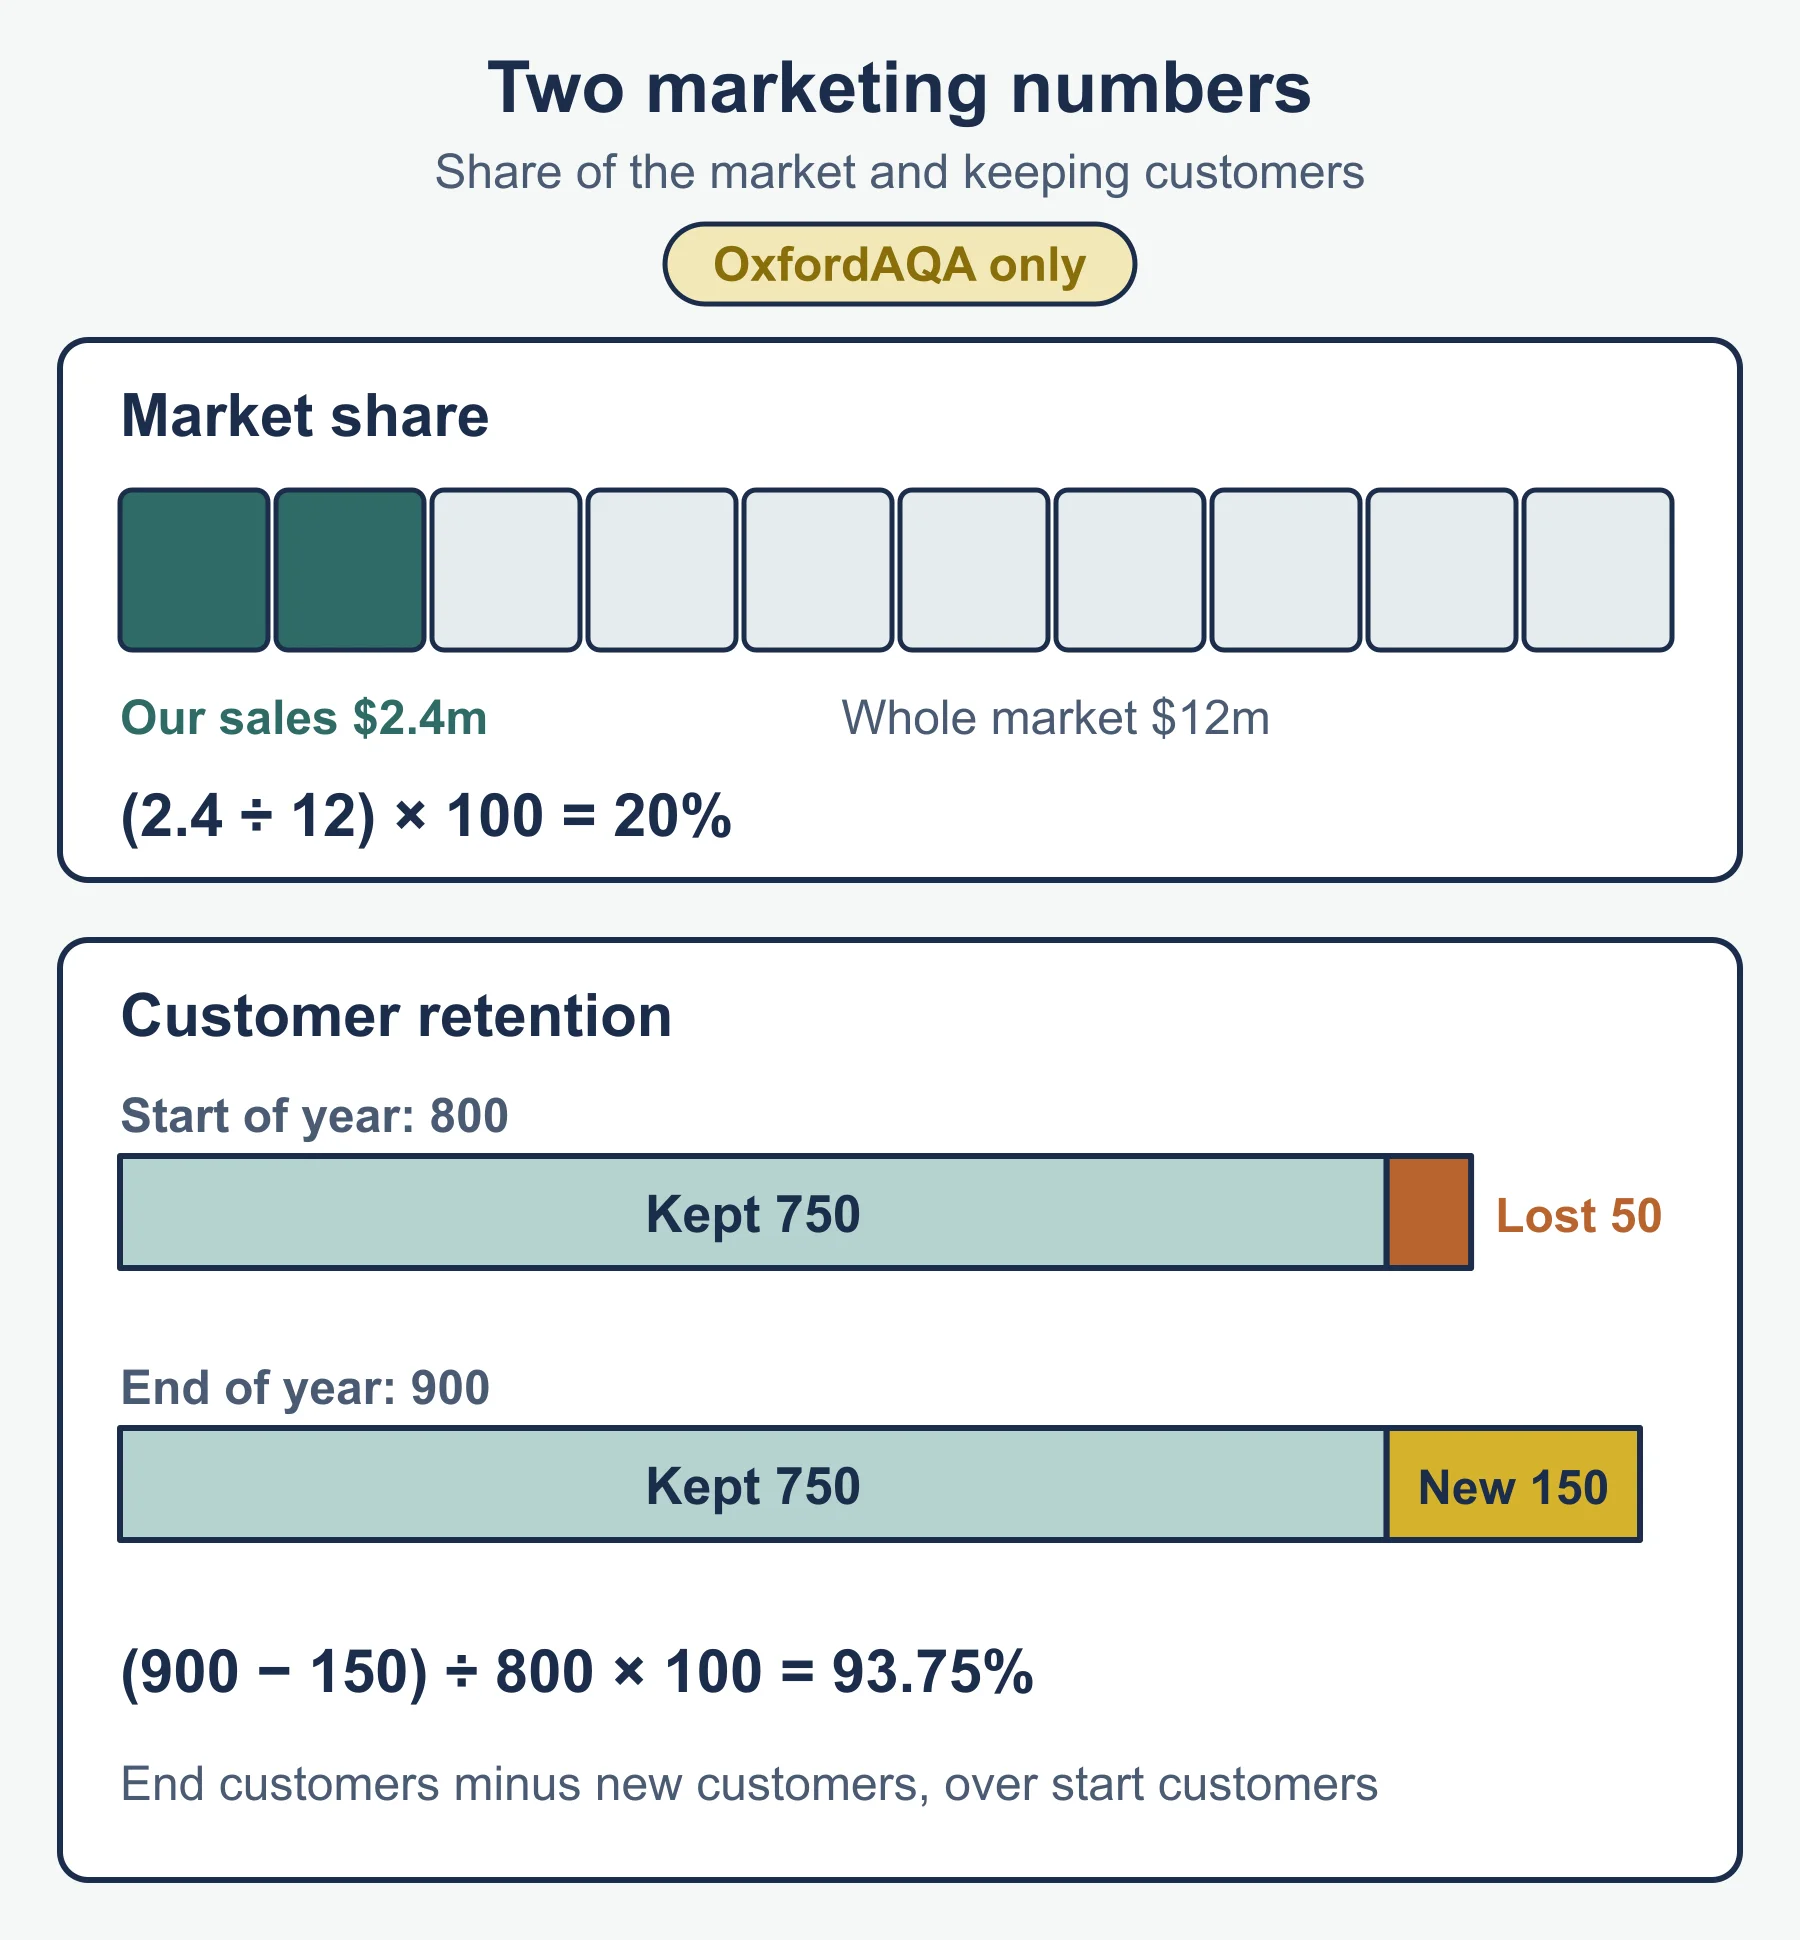
- Market share: the business’s sales as a percentage of total market sales.
- Customer retention and repeat sales: keeping customers and getting them to buy again.
- Brand loyalty (9725 only): customers choosing the same brand again, often over rivals.
- Sales per product, employee, region, store or customer: sales divided by the count.
Standard forms:
| Measure | Standard form |
|---|---|
| Market share | business sales / total market sales x 100 |
| Customer retention rate | (customers at end - new customers gained) / customers at start x 100 |
| Sales per employee, store, region, product or customer | total sales / number of employees, stores, regions, products or customers |
Brand loyalty has no single number: businesses look at repeat purchase rates, loyalty card use or survey answers.
Worked example: Sandgrove Sportswear
Sandgrove sells sportswear through its own stores.
| 2025 | 2026 | |
|---|---|---|
| Units sold | 48,000 | 54,000 |
| Sales value | 1,320,000 | 1,512,000 |
| Total market sales value | 10,560,000 | 11,200,000 |
| Stores | 5 | 6 |
- Average price rose from 27.50 to 28.00 (1,320,000 / 48,000 and 1,512,000 / 54,000).
- Volume rose 12.5% and value about 14.5%, partly from the higher average price.
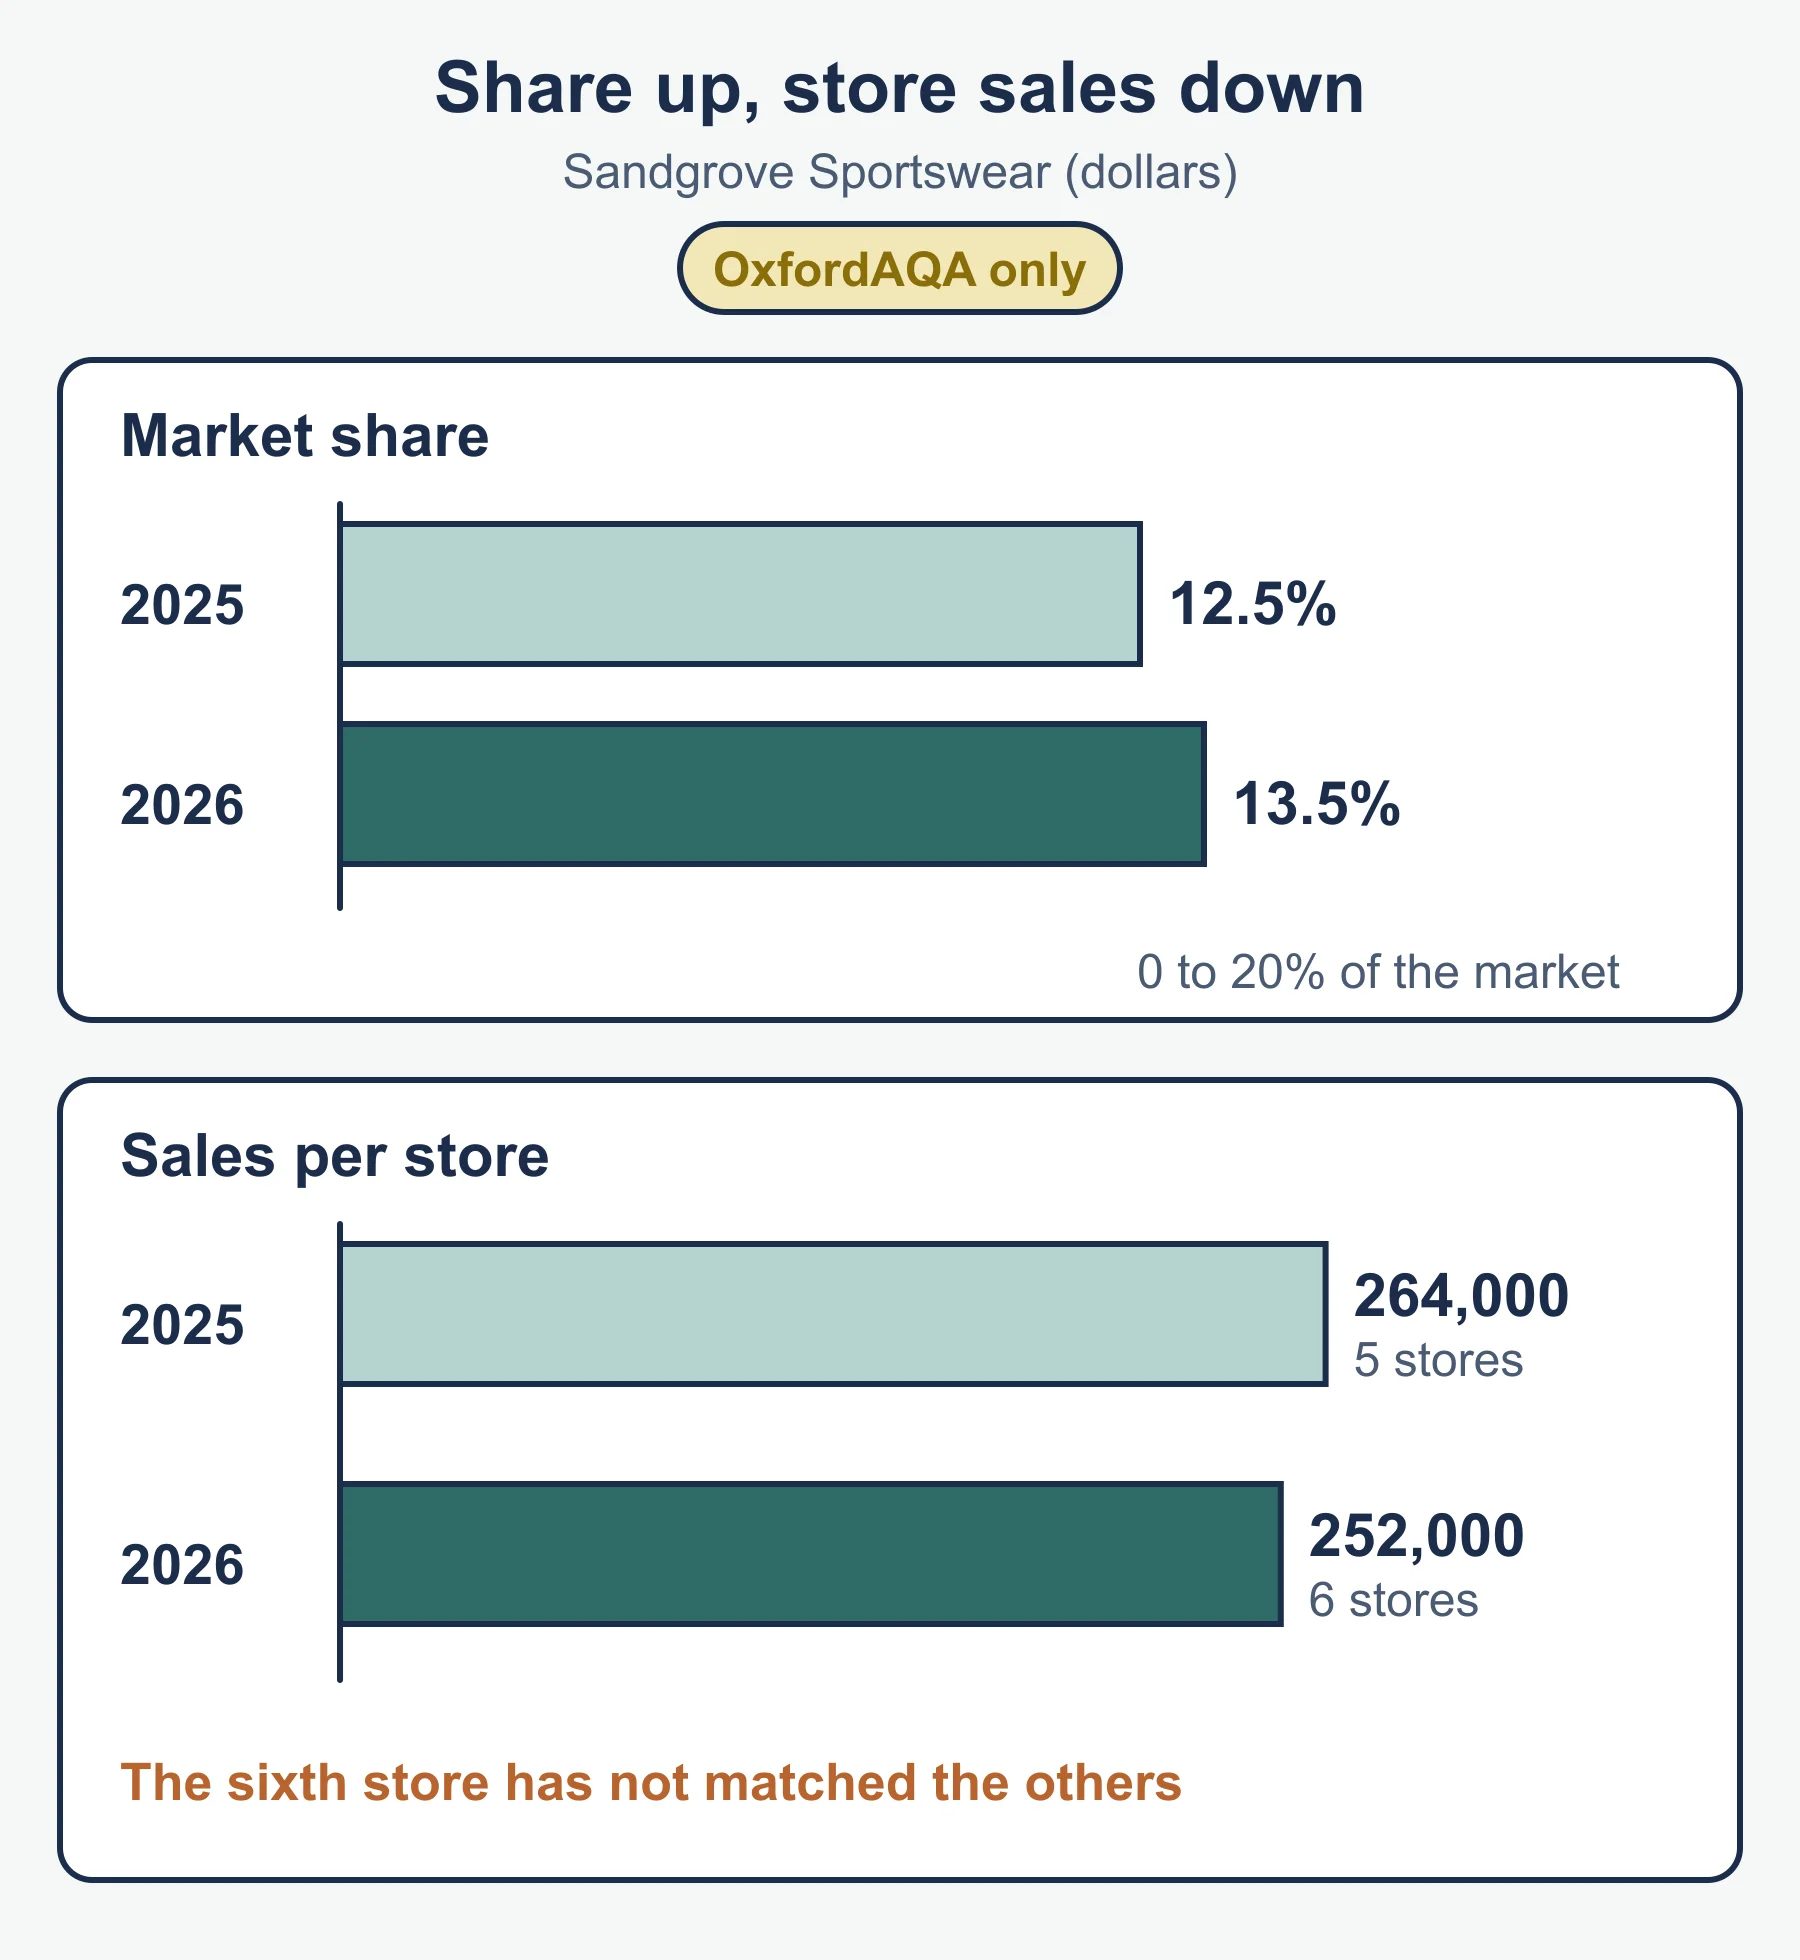
- Market share: 2025 is 1,320,000 / 10,560,000 x 100 = 12.5%. 2026 is 1,512,000 / 11,200,000 x 100 = 13.5%. The market grew about 6.1%, so Sandgrove gained share.
- Sales per store: 264,000 in 2025 (1,320,000 / 5) and 252,000 in 2026 (1,512,000 / 6). Total sales rose but each store sold less on average.
Interpretation: the share gain looks good, but the fall per store suggests the sixth store has not matched the others. Use both figures.
Worked example: retention and repeat sales
Orchardway delivers fruit boxes by subscription. It began the year with 2,400 subscribers, gained 600 new ones and ended with 2,520.
- Subscribers kept from the start of the year: 2,520 - 600 = 1,920.
- Retention rate: 1,920 / 2,400 x 100 = 80%.
- In one month, 6,300 of 9,000 orders came from existing customers ordering again: repeat sales of 70% of orders.
- Annual sales of 1,008,000 divided by 2,520 subscribers gives sales per customer of 400.
New customers hide the one in five who left.
Marketing plans
A marketing plan is a written plan for achieving marketing aims. The elements differ by version.
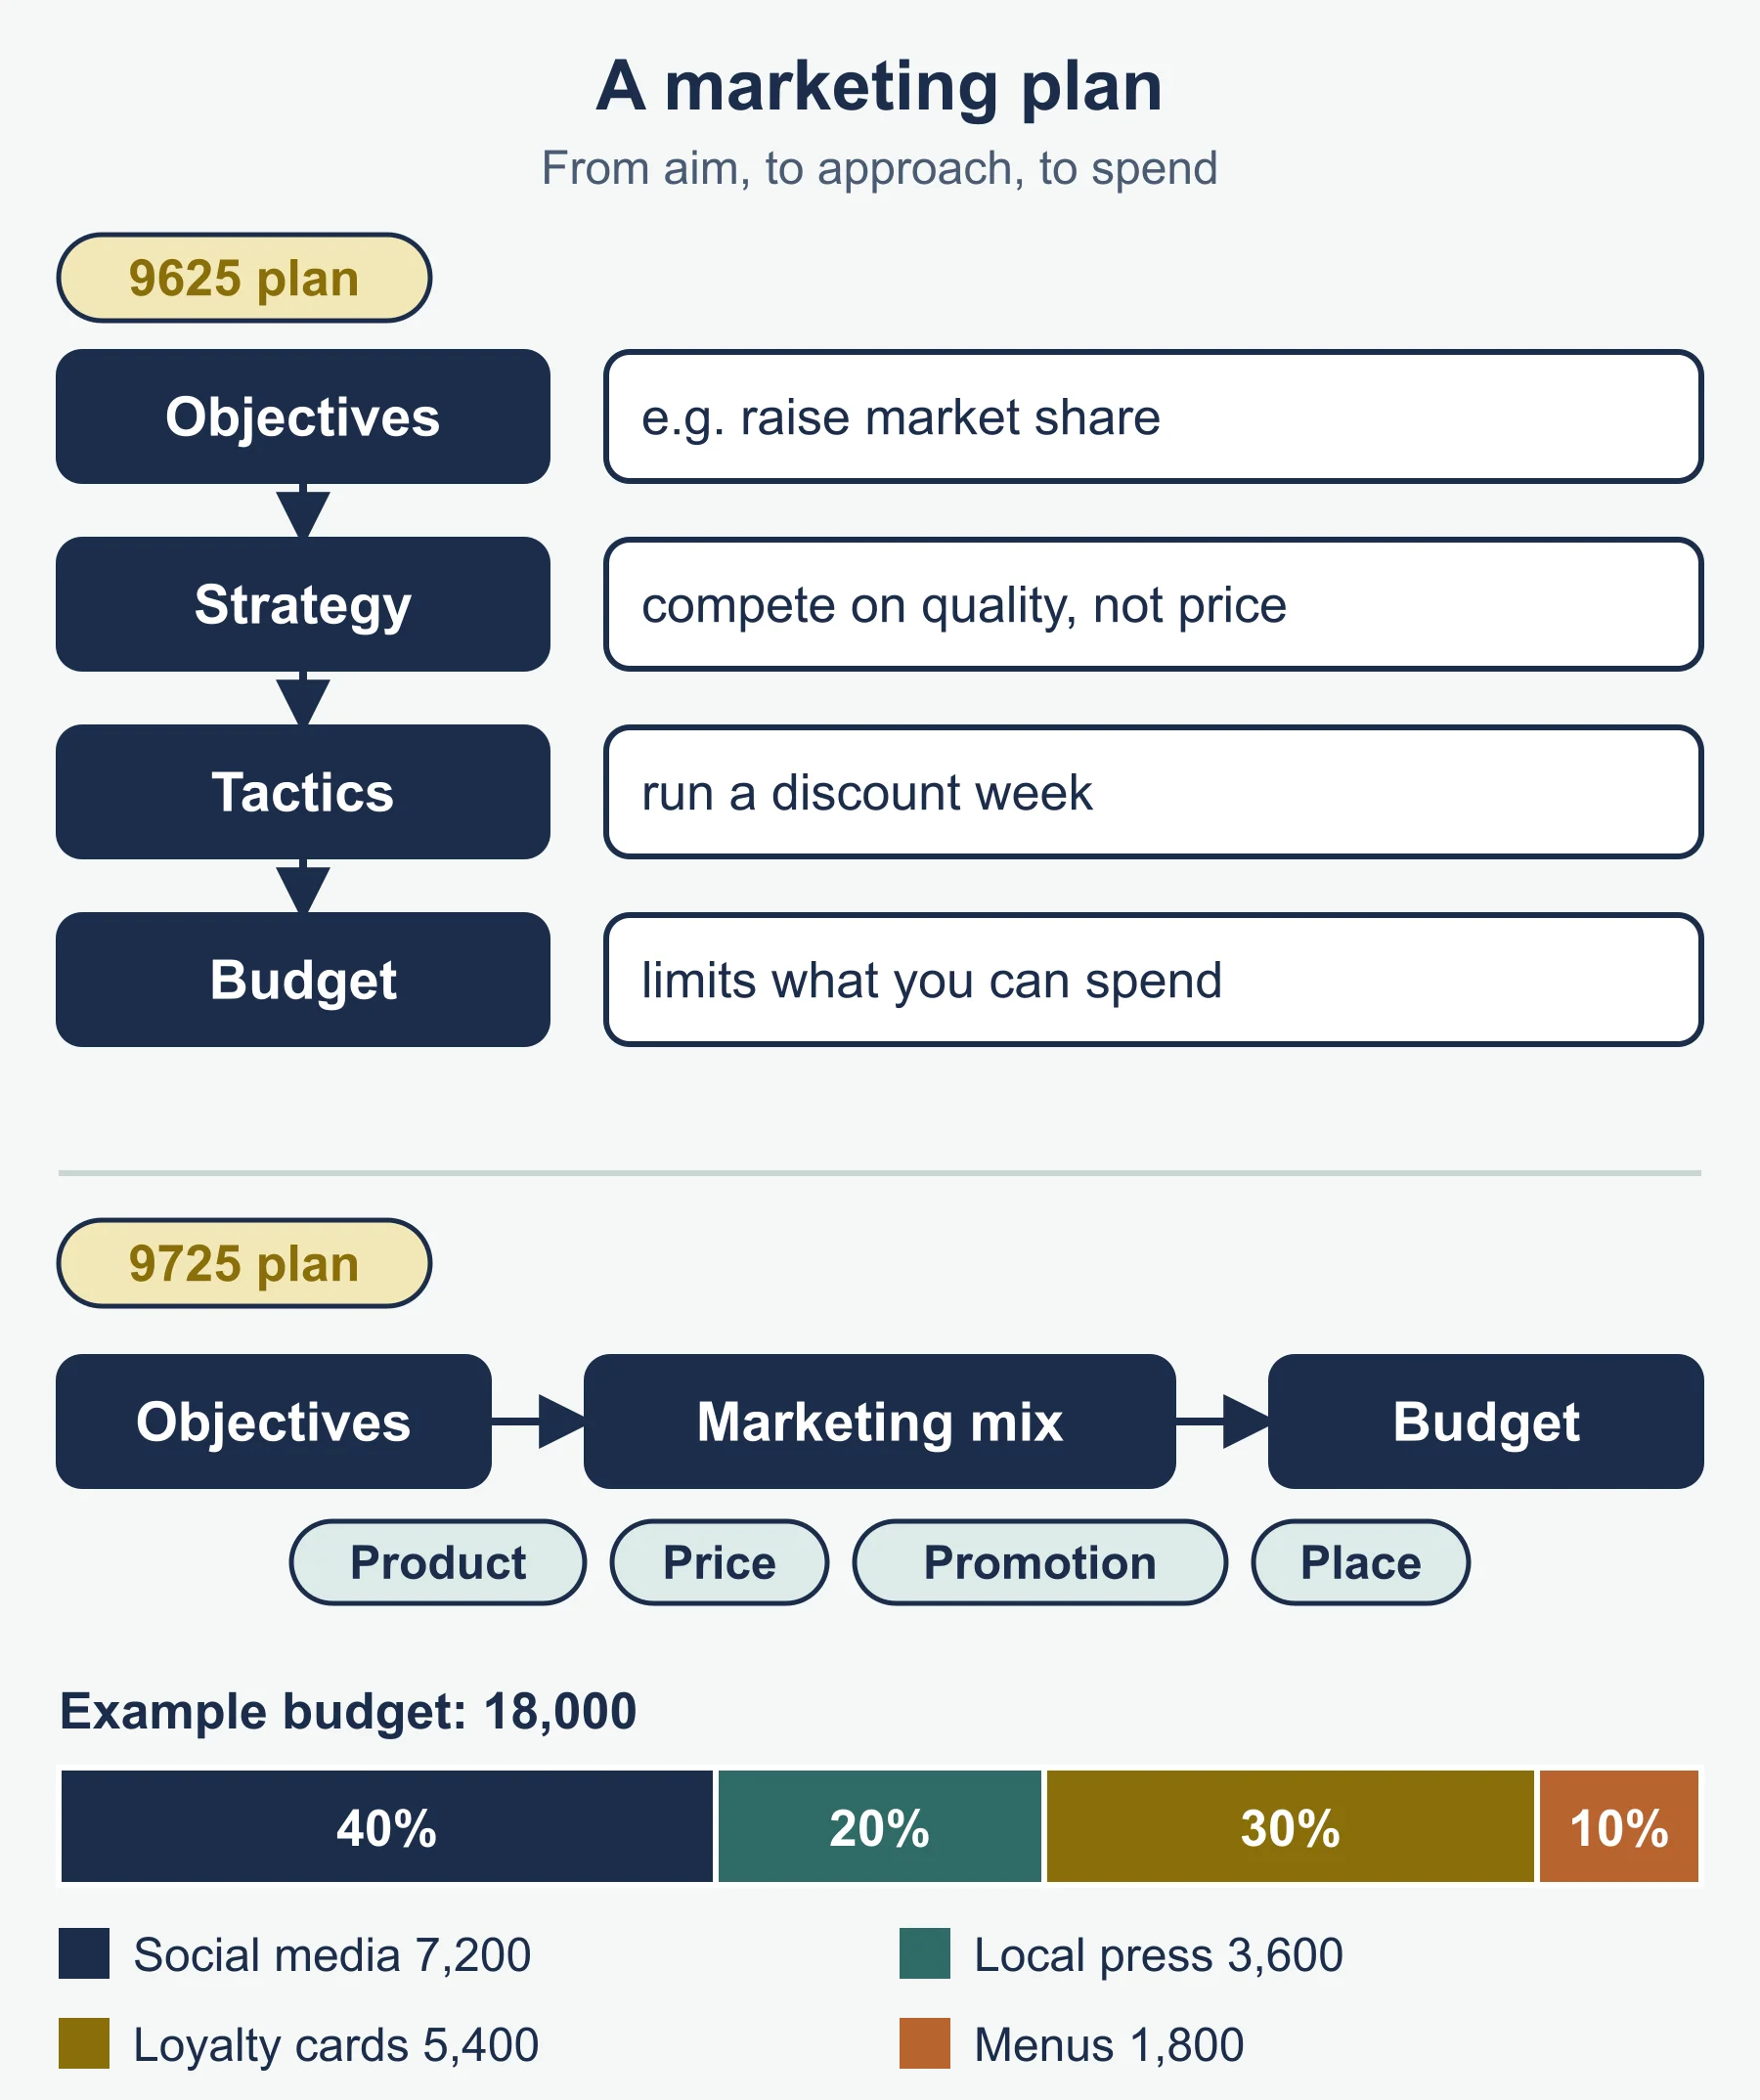
- 9625: marketing objectives, strategy (the overall approach to reaching the objectives, such as competing on quality rather than price) and tactics (the specific, shorter-term actions, such as a discount week), and the budget.
- 9725: marketing objectives, marketing mix (decisions on product, price, promotion and place, see the marketing overview) and the marketing budget.
Value of a plan: it turns an aim into actions, ties spending to objectives, lets managers compare results with targets and aligns departments. The budget forces choices. Limit: a rigid plan reacts slowly.
Return on marketing spending (9725 only)
Use the standard form and state what you are measuring:
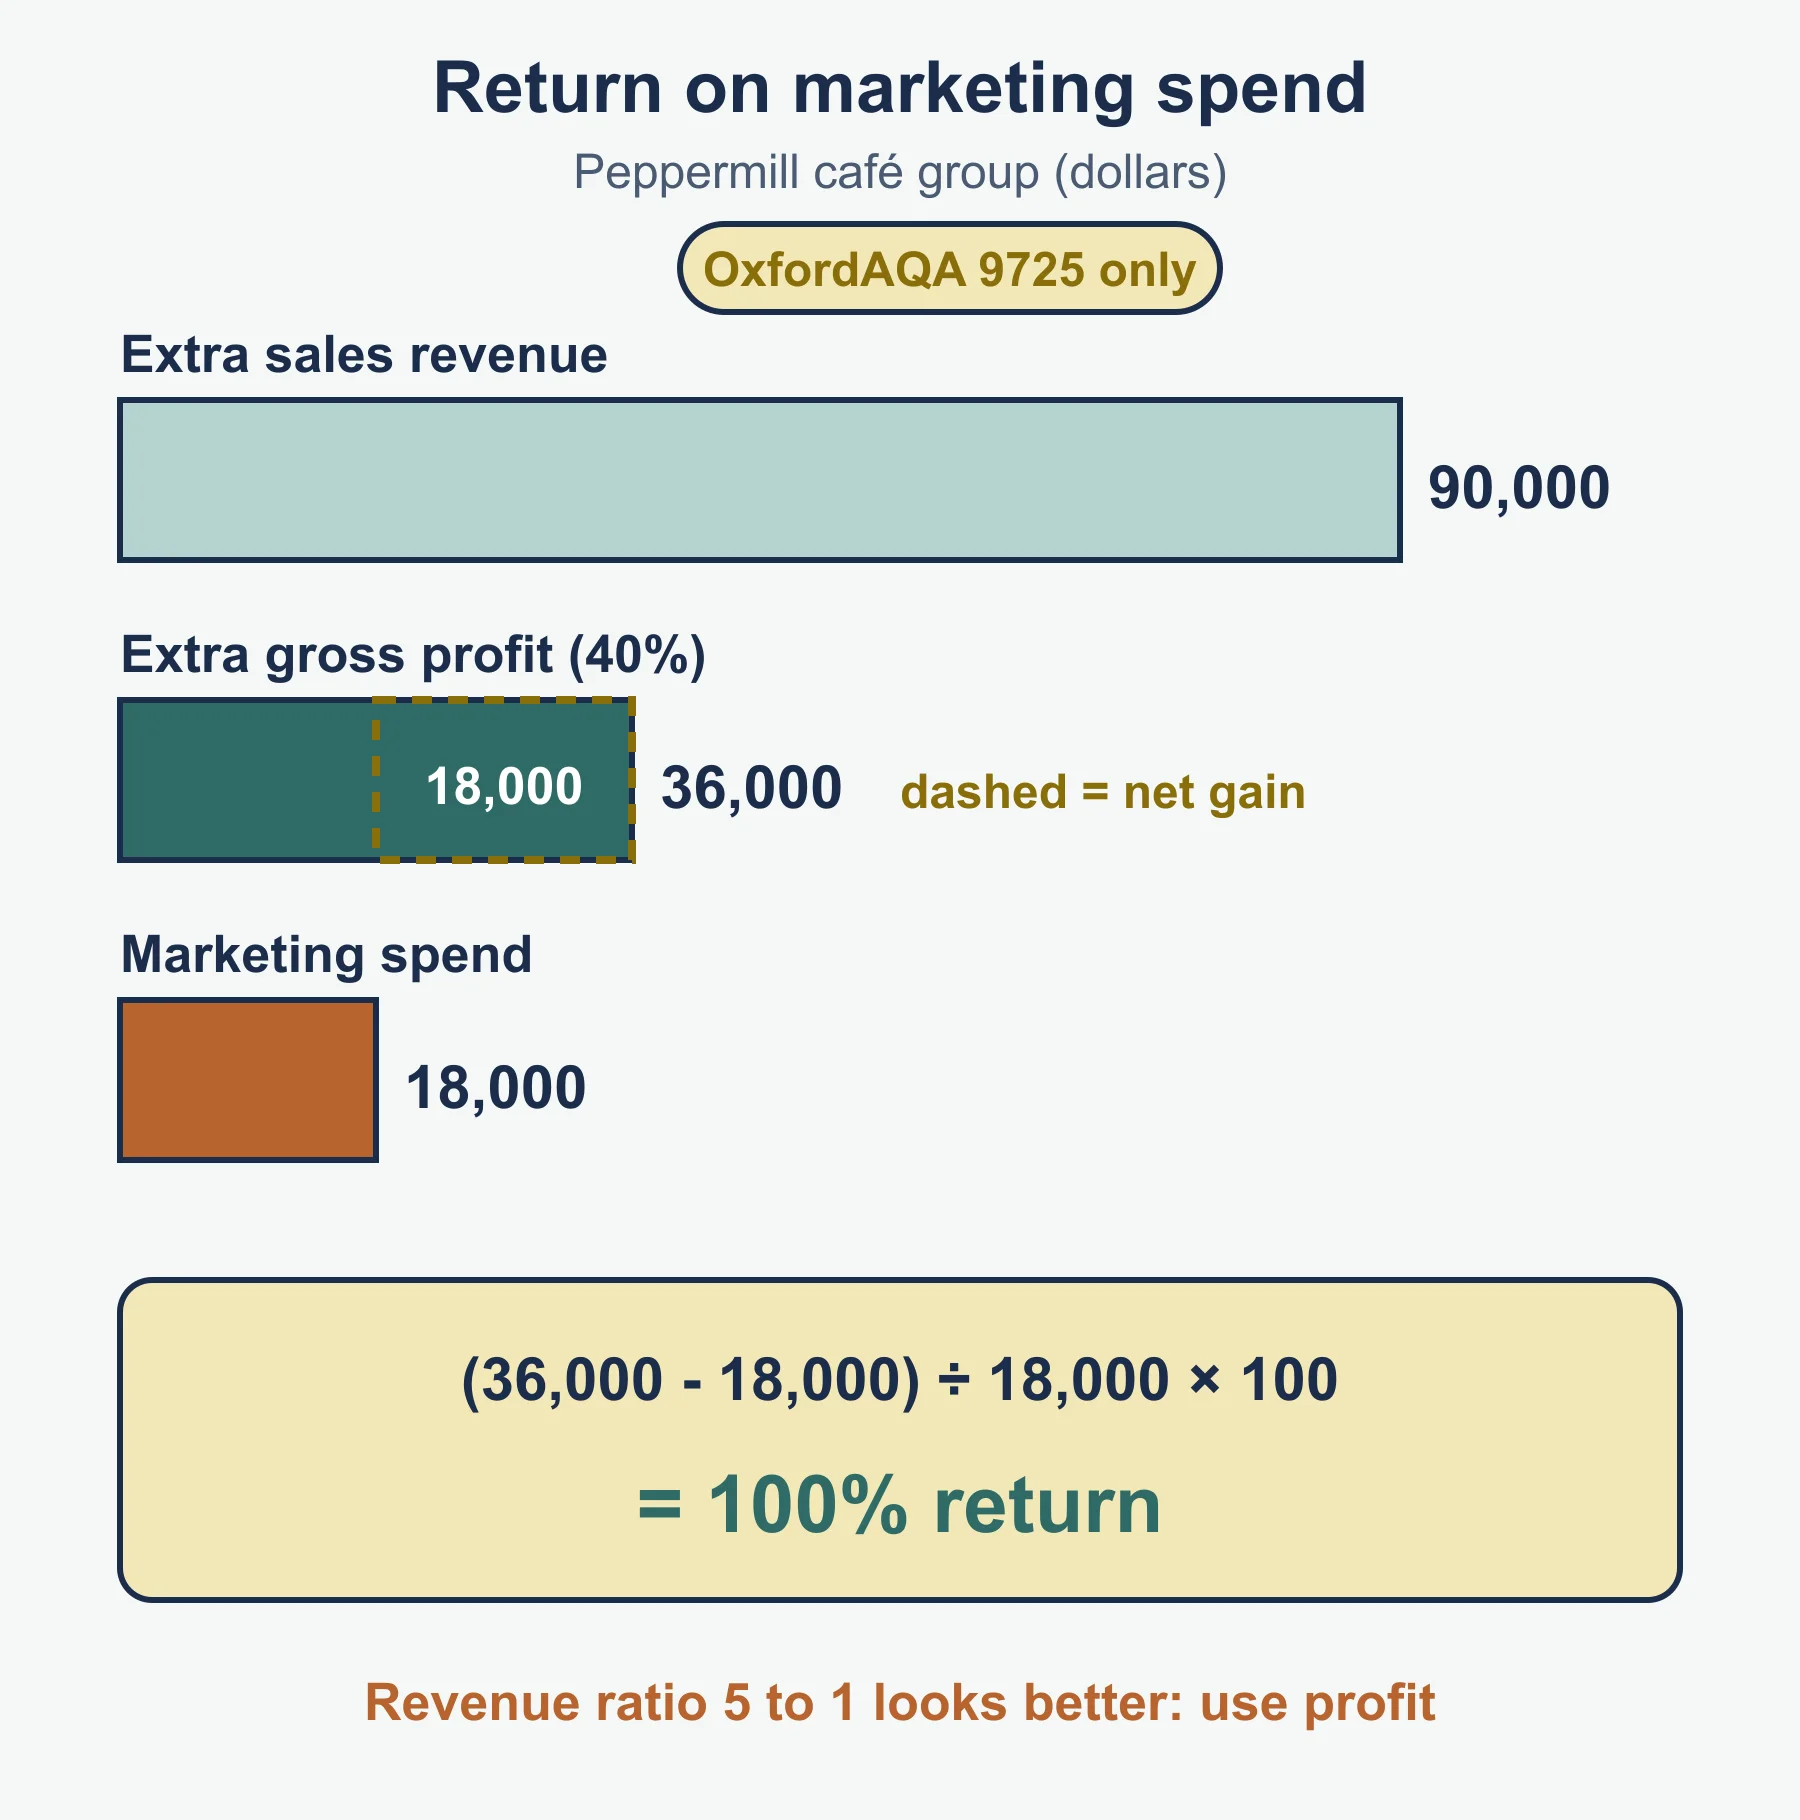
Return on marketing spending (%) = (extra profit gained from the marketing - marketing spend) / marketing spend x 100
Worked example: Peppermill café group. Peppermill had a marketing budget of 18,000 (social media 40%, local press 20%, loyalty cards 30%, menus 10%). It estimated the campaign produced 90,000 of extra sales revenue. Its gross profit margin is 40%.
- Extra gross profit = 90,000 x 0.40 = 36,000.
- Return = (36,000 - 18,000) / 18,000 x 100 = 100%.
- Revenue ratio = 5 to 1 looks better than the profit measure, which is why profit is preferred.
Limit: not all extra sales may come from the campaign.
Influences on marketing plans, objectives and decisions
Influences on demand (9725 only). Price, income, competition, marketing activities, number of customers and customer preferences. Lower prices tend to raise quantity demanded. Higher incomes raise demand for normal goods and lower it for inferior goods (a YED of +1.5 and a 4% rise in income suggests demand rises about 6%). Shifting preferences can move demand either way.
Market conditions and competition. Growing markets suit volume and share objectives; mature or shrinking ones suit retention or taking share. With many close competitors, price and differentiation matter more. 9625 adds domestic and international competition.
Resources (both). Budget limits the choice of promotion and research. Skills of employees limit what can be run well. Capacity matters because a promotion that creates more orders than can be supplied disappoints customers.
Developments in technology (9625 only).
- Digital marketing and social media: low-cost, targeted reach and quick customer feedback.
- Relationship marketing: building long-term relationships with customers to raise retention and repeat sales.
- Dynamic pricing: prices change with demand or timing, for example higher at peak times.
- E-commerce and m-commerce: selling online, and through mobile devices such as phone apps.
Ethical influences (9625 only). A business may limit or change marketing to avoid misleading claims, protect customers’ data or avoid unfair treatment, even when this lowers short-term sales. Ethical behaviour can build trust but may cost money.
Market research
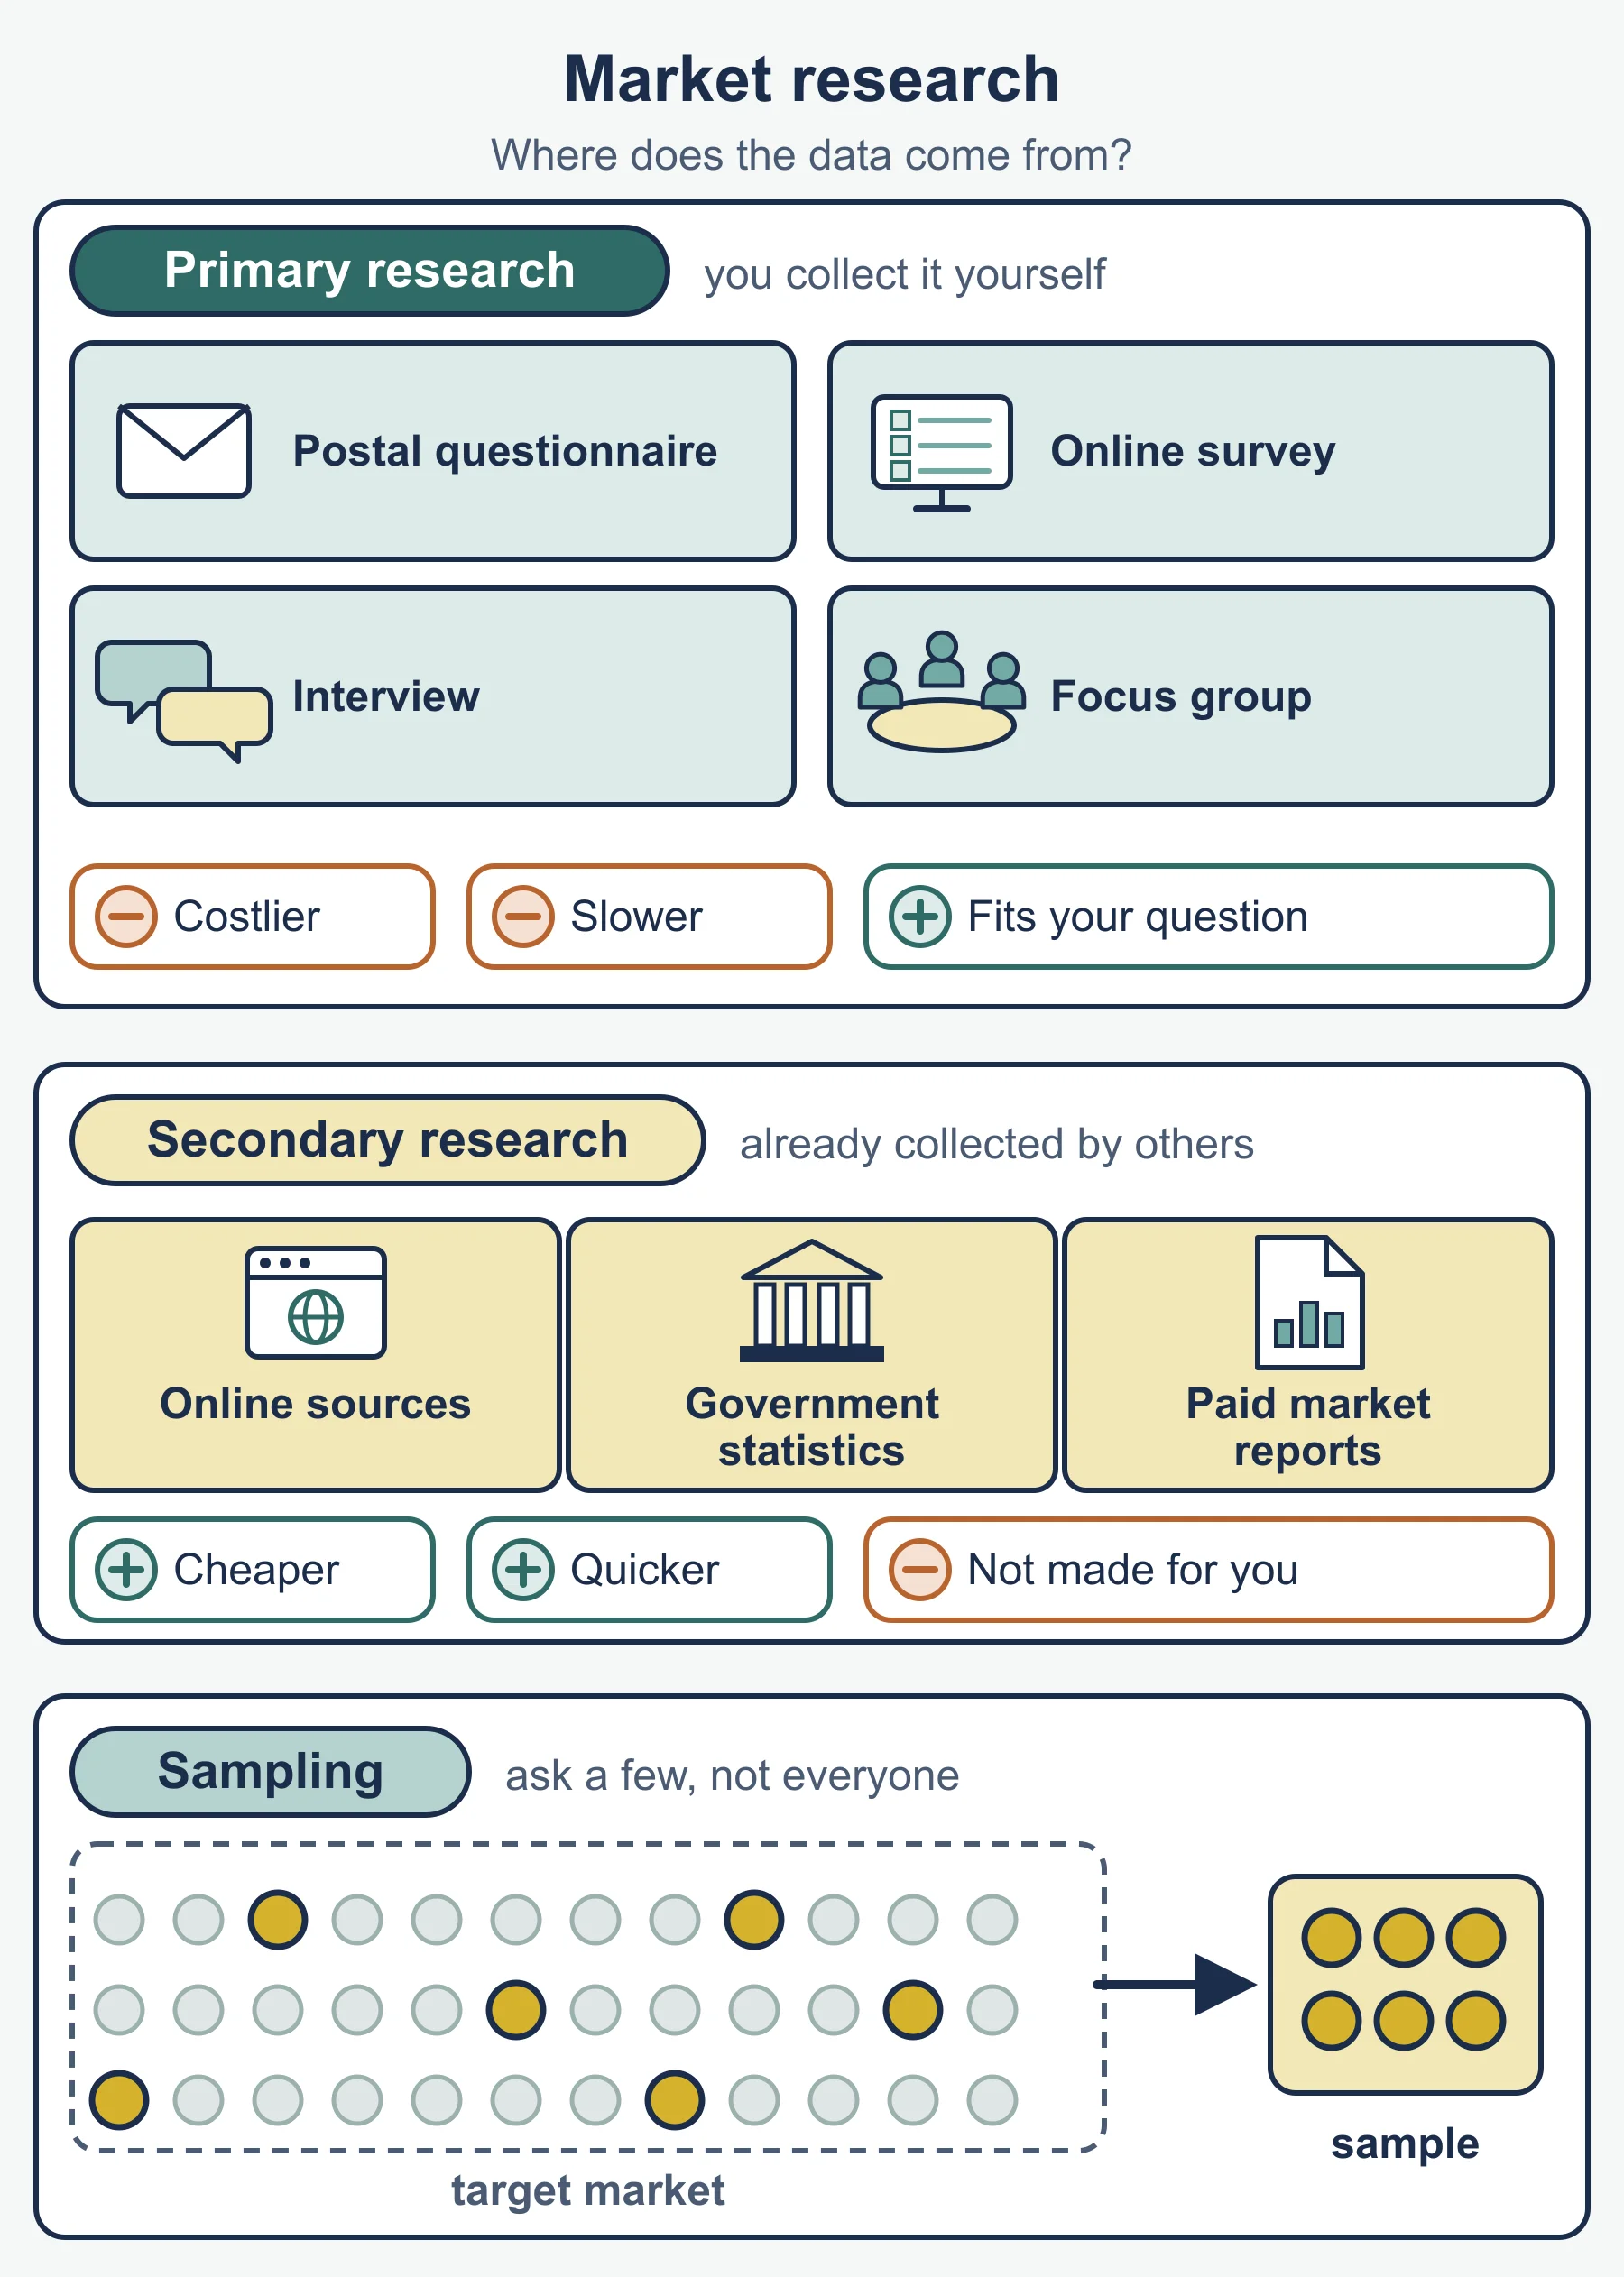
Primary research is new data collected for a specific purpose. Secondary research uses data that already exists.
The 9725 text names these primary and secondary methods and asks for their advantages and disadvantages; 9625 asks for the value of primary and secondary research.
| Primary method | Advantage | Disadvantage |
|---|---|---|
| Surveys / questionnaires | Reach many people cheaply, produce numbers | Low response, shallow answers, poor wording can bias |
| Interviews | Detailed answers, can ask follow-up questions | Slow, costly per person, interviewer can influence answers |
| Focus groups | Reveal opinions and reasons, ideas build on each other | Small groups, one voice can dominate, may not represent the market |
| Observations | Show what people actually do, not what they say | Do not explain why, can be time-consuming |
| Secondary source | Advantage | Disadvantage |
|---|---|---|
| Websites / social media | Quick, cheap, up to date | Uneven quality, opinions of vocal users only |
| Academic journals | Rigorous and well tested | Not specific to the business, may be dated |
| Government publications | Large samples, trusted | General rather than product-specific, may be out of date |
| Media articles | Easy to find, current | May be biased or simplified |
Value. Primary research fits the exact question but costs more and takes longer. Secondary research is faster and cheaper but was collected for another purpose.
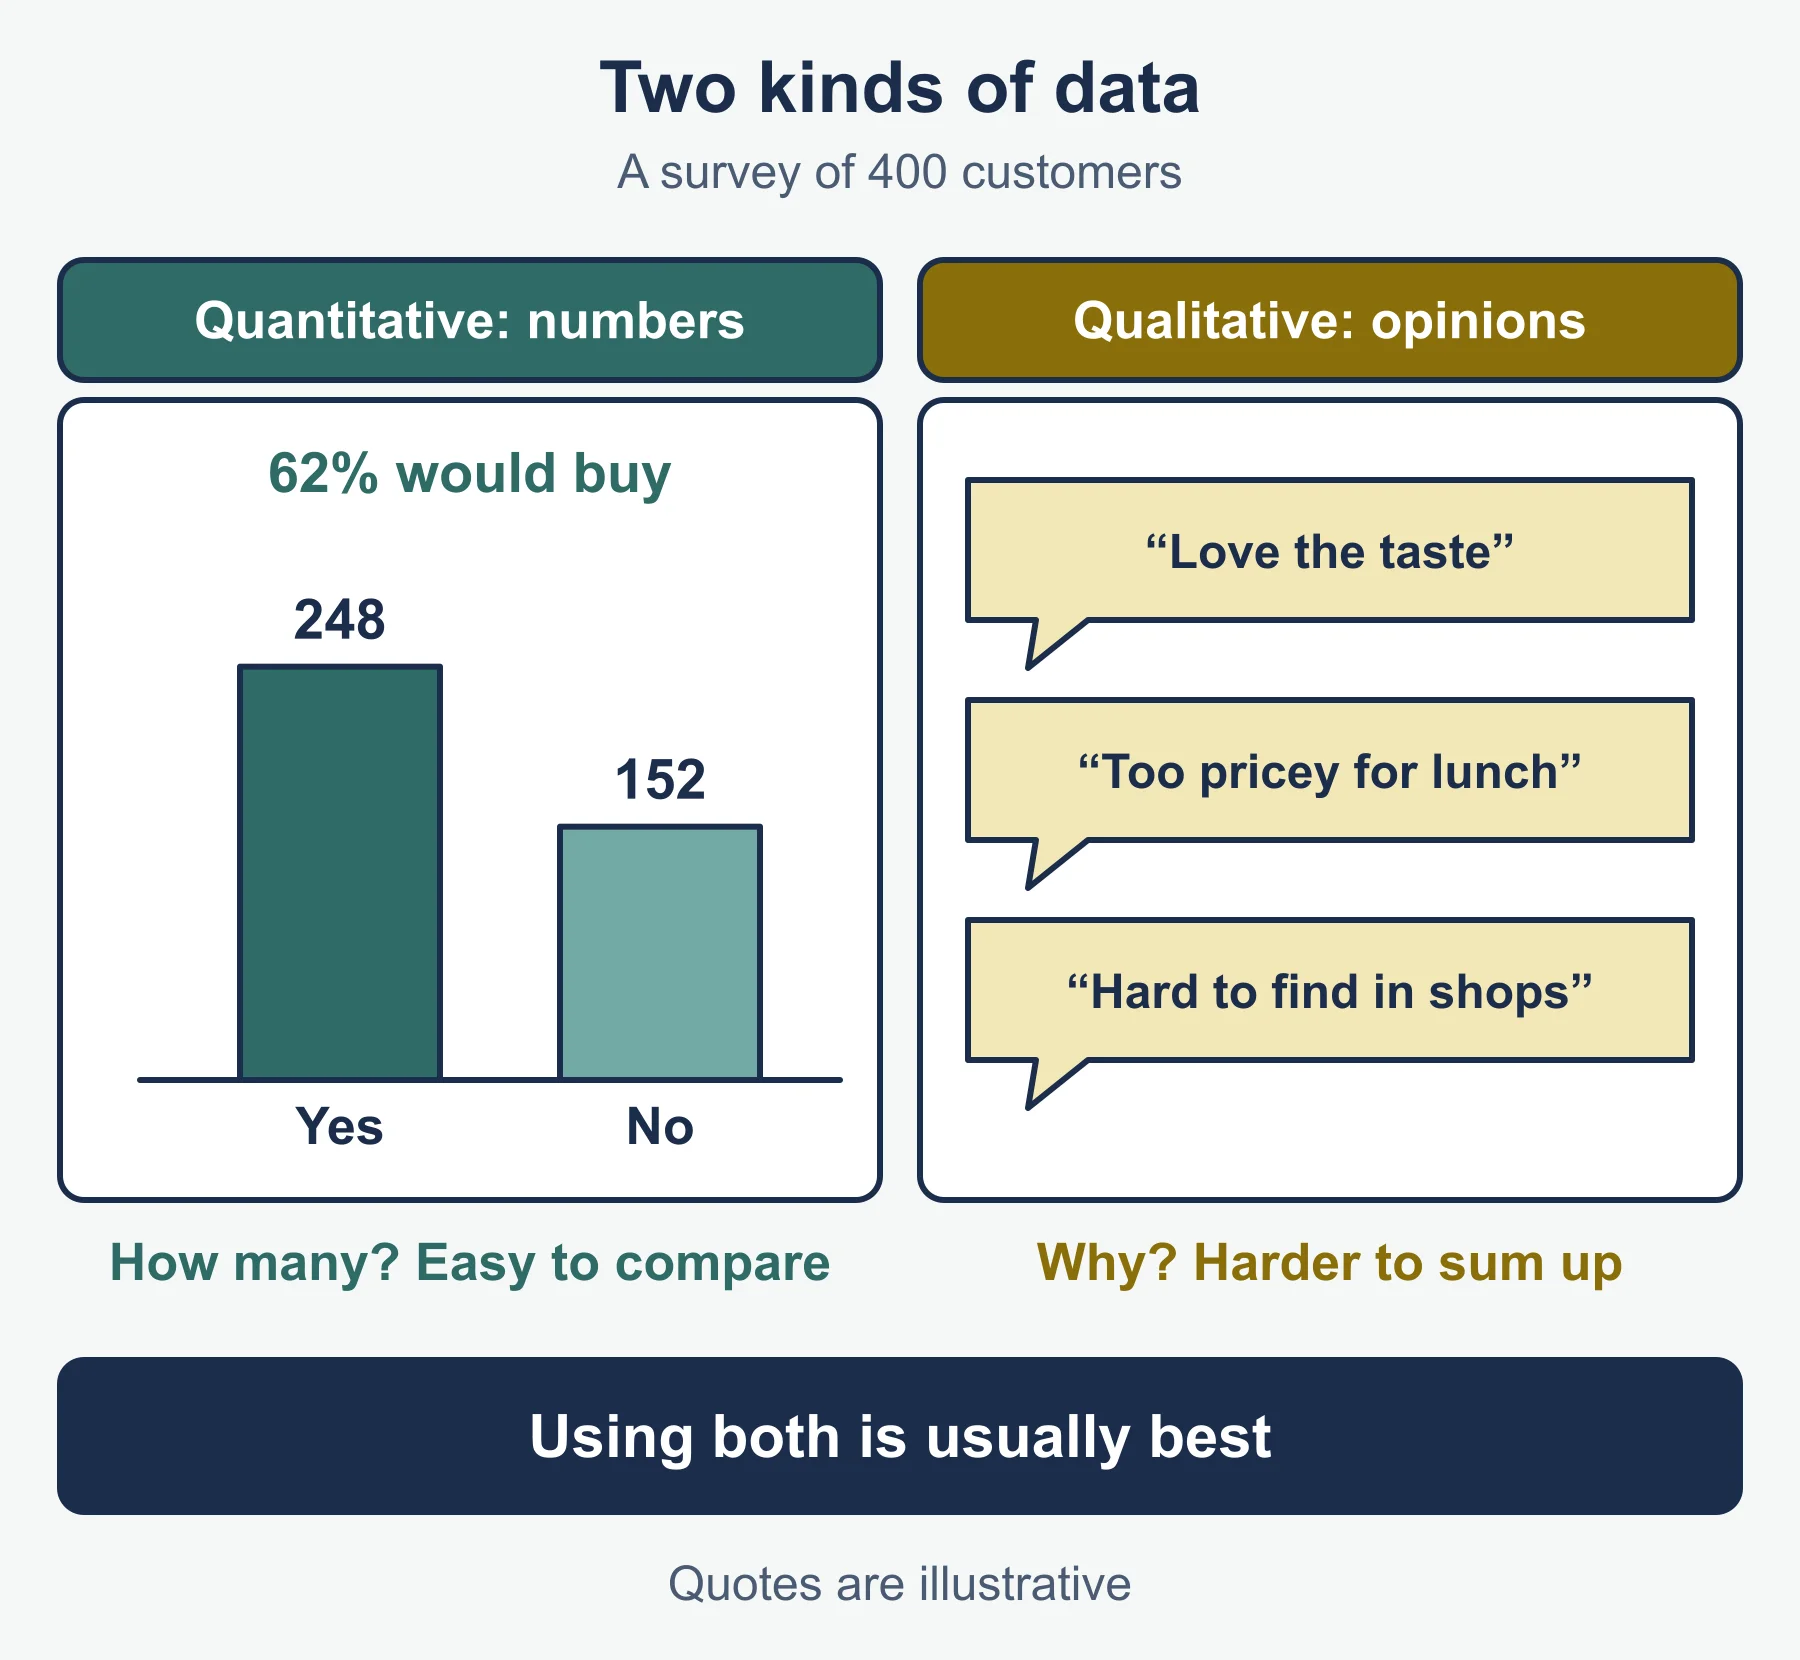
Qualitative and quantitative data. Quantitative data is numerical and can be compared statistically. Qualitative data is descriptive (opinions, feelings) and explains why people behave as they do, but is harder to summarise. Using both is usually best.
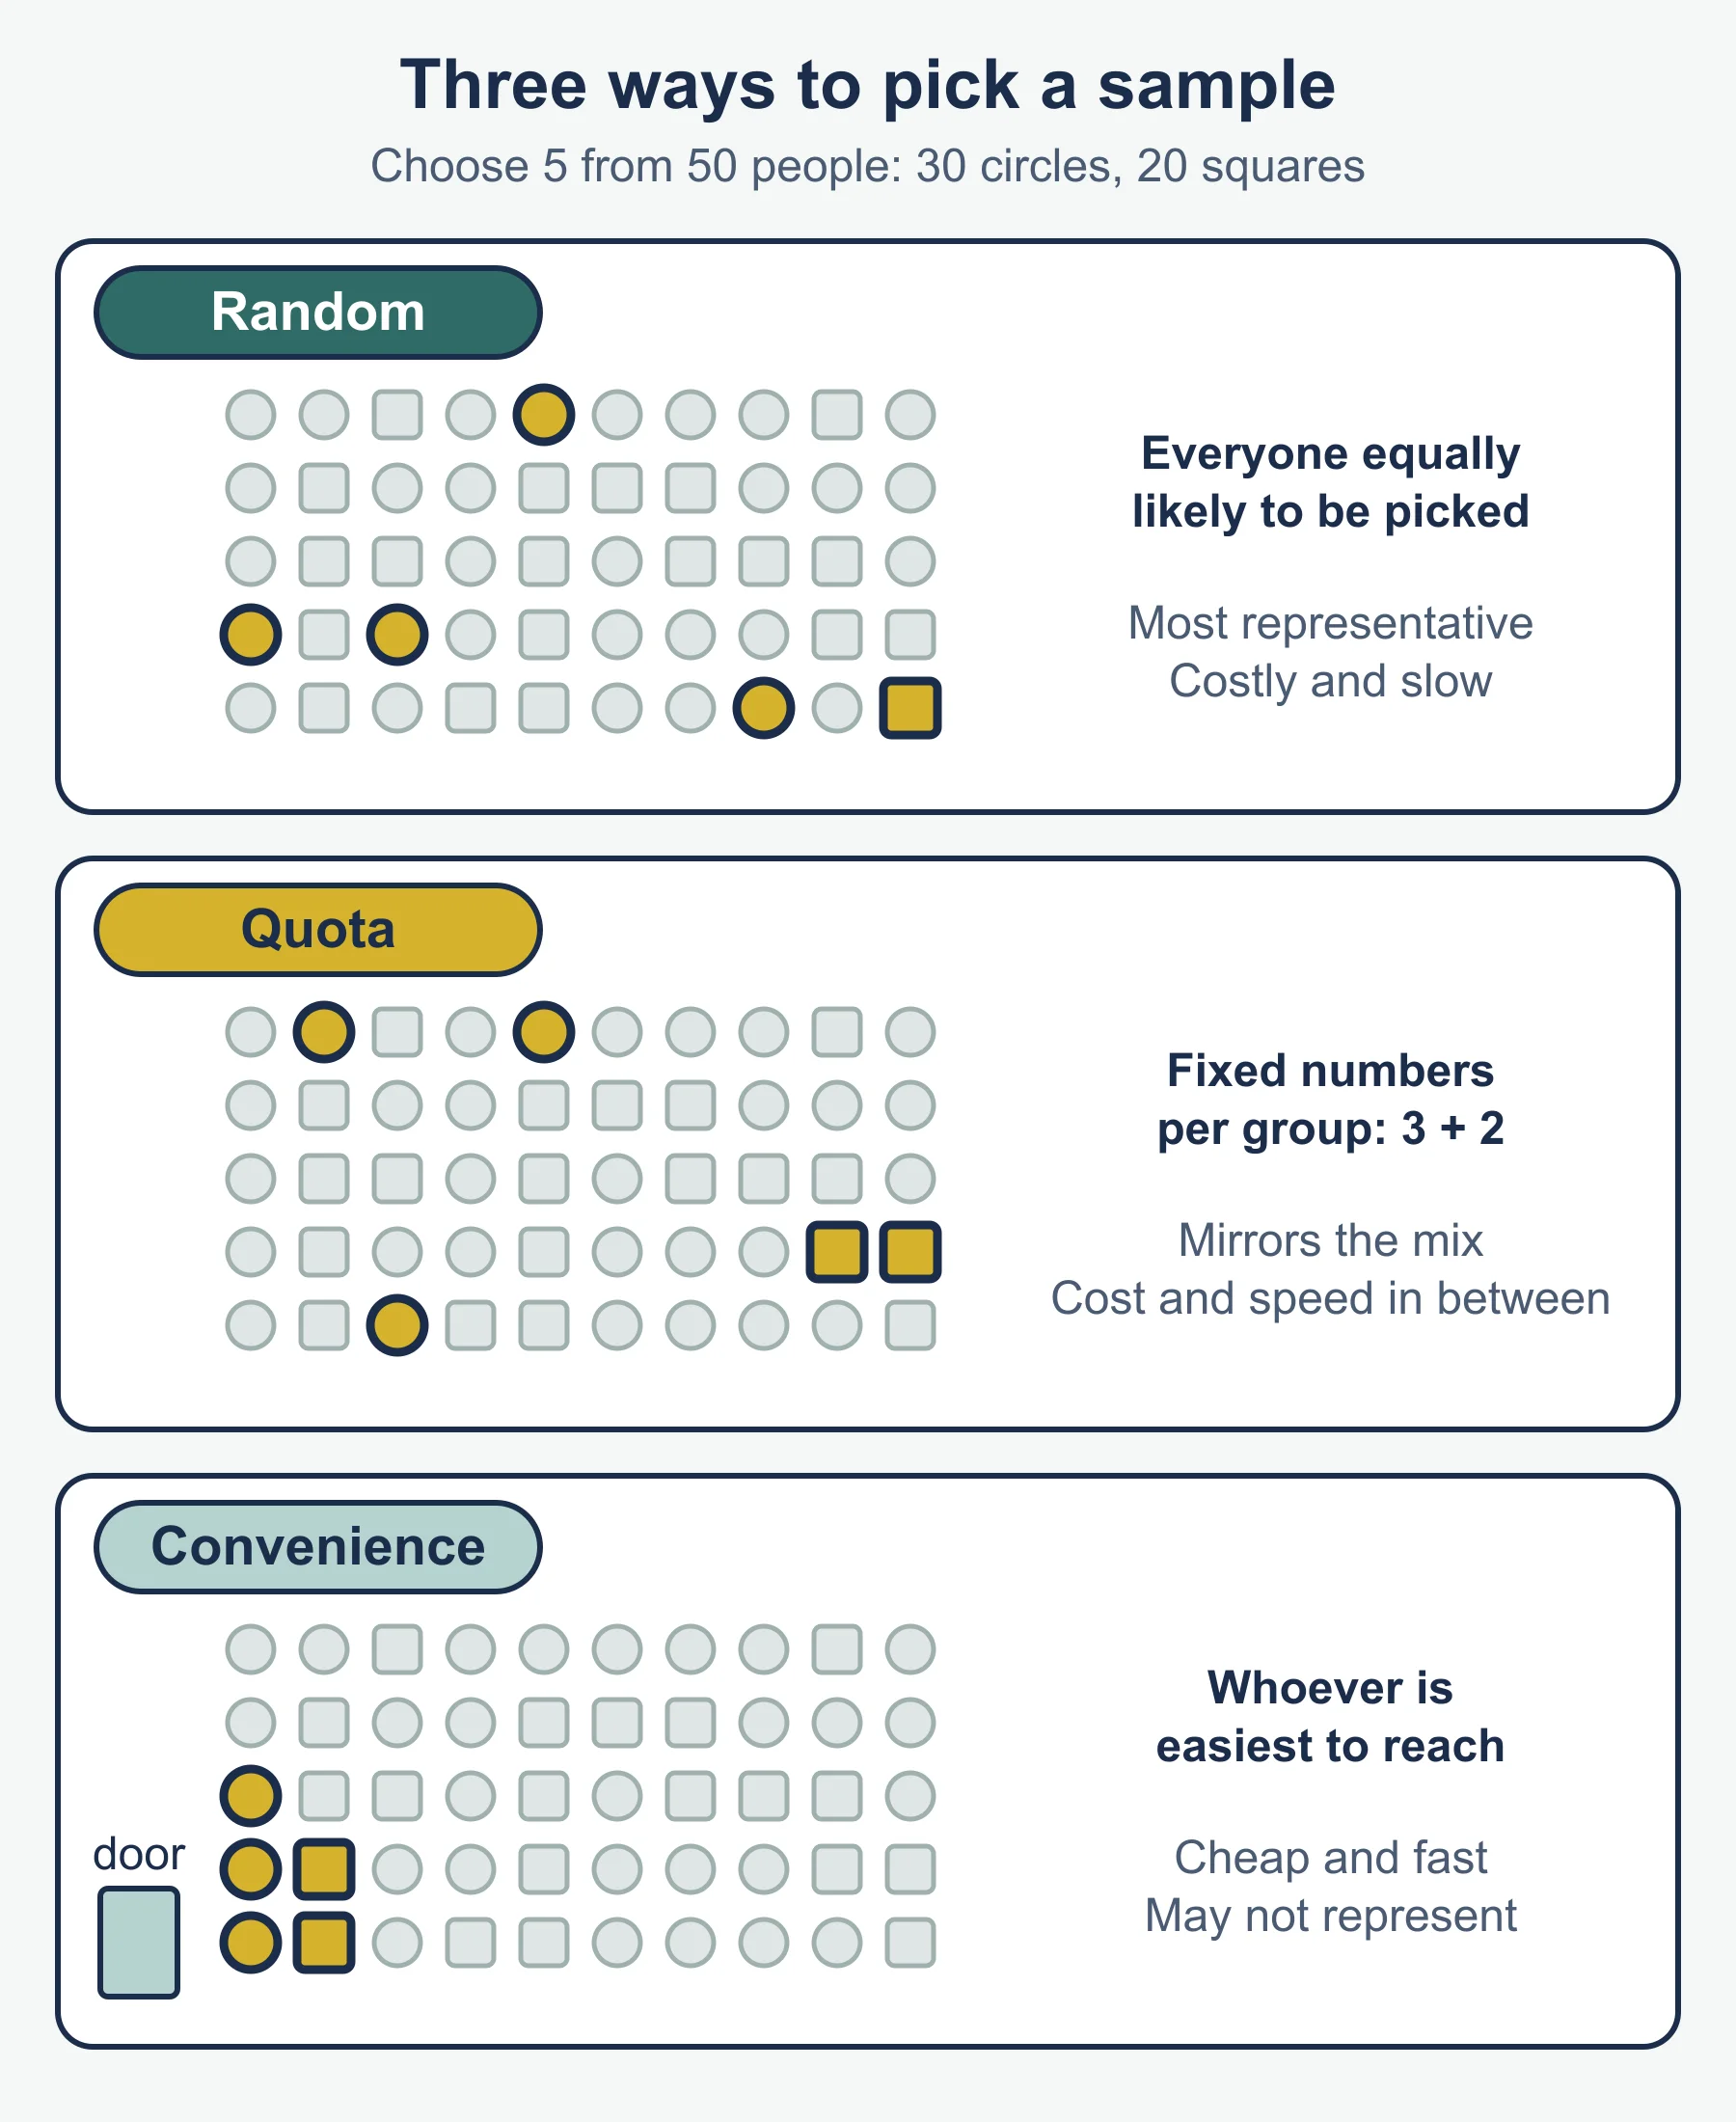
Sampling. Questioning every customer is too costly and slow, so a business uses a sample. Sampling saves cost and time, if the sample represents the whole.
| Sample | How it works | Advantage | Disadvantage |
|---|---|---|---|
| Random | Everyone has an equal chance of selection | Unbiased, easy to justify | Can miss small groups, needs a full list |
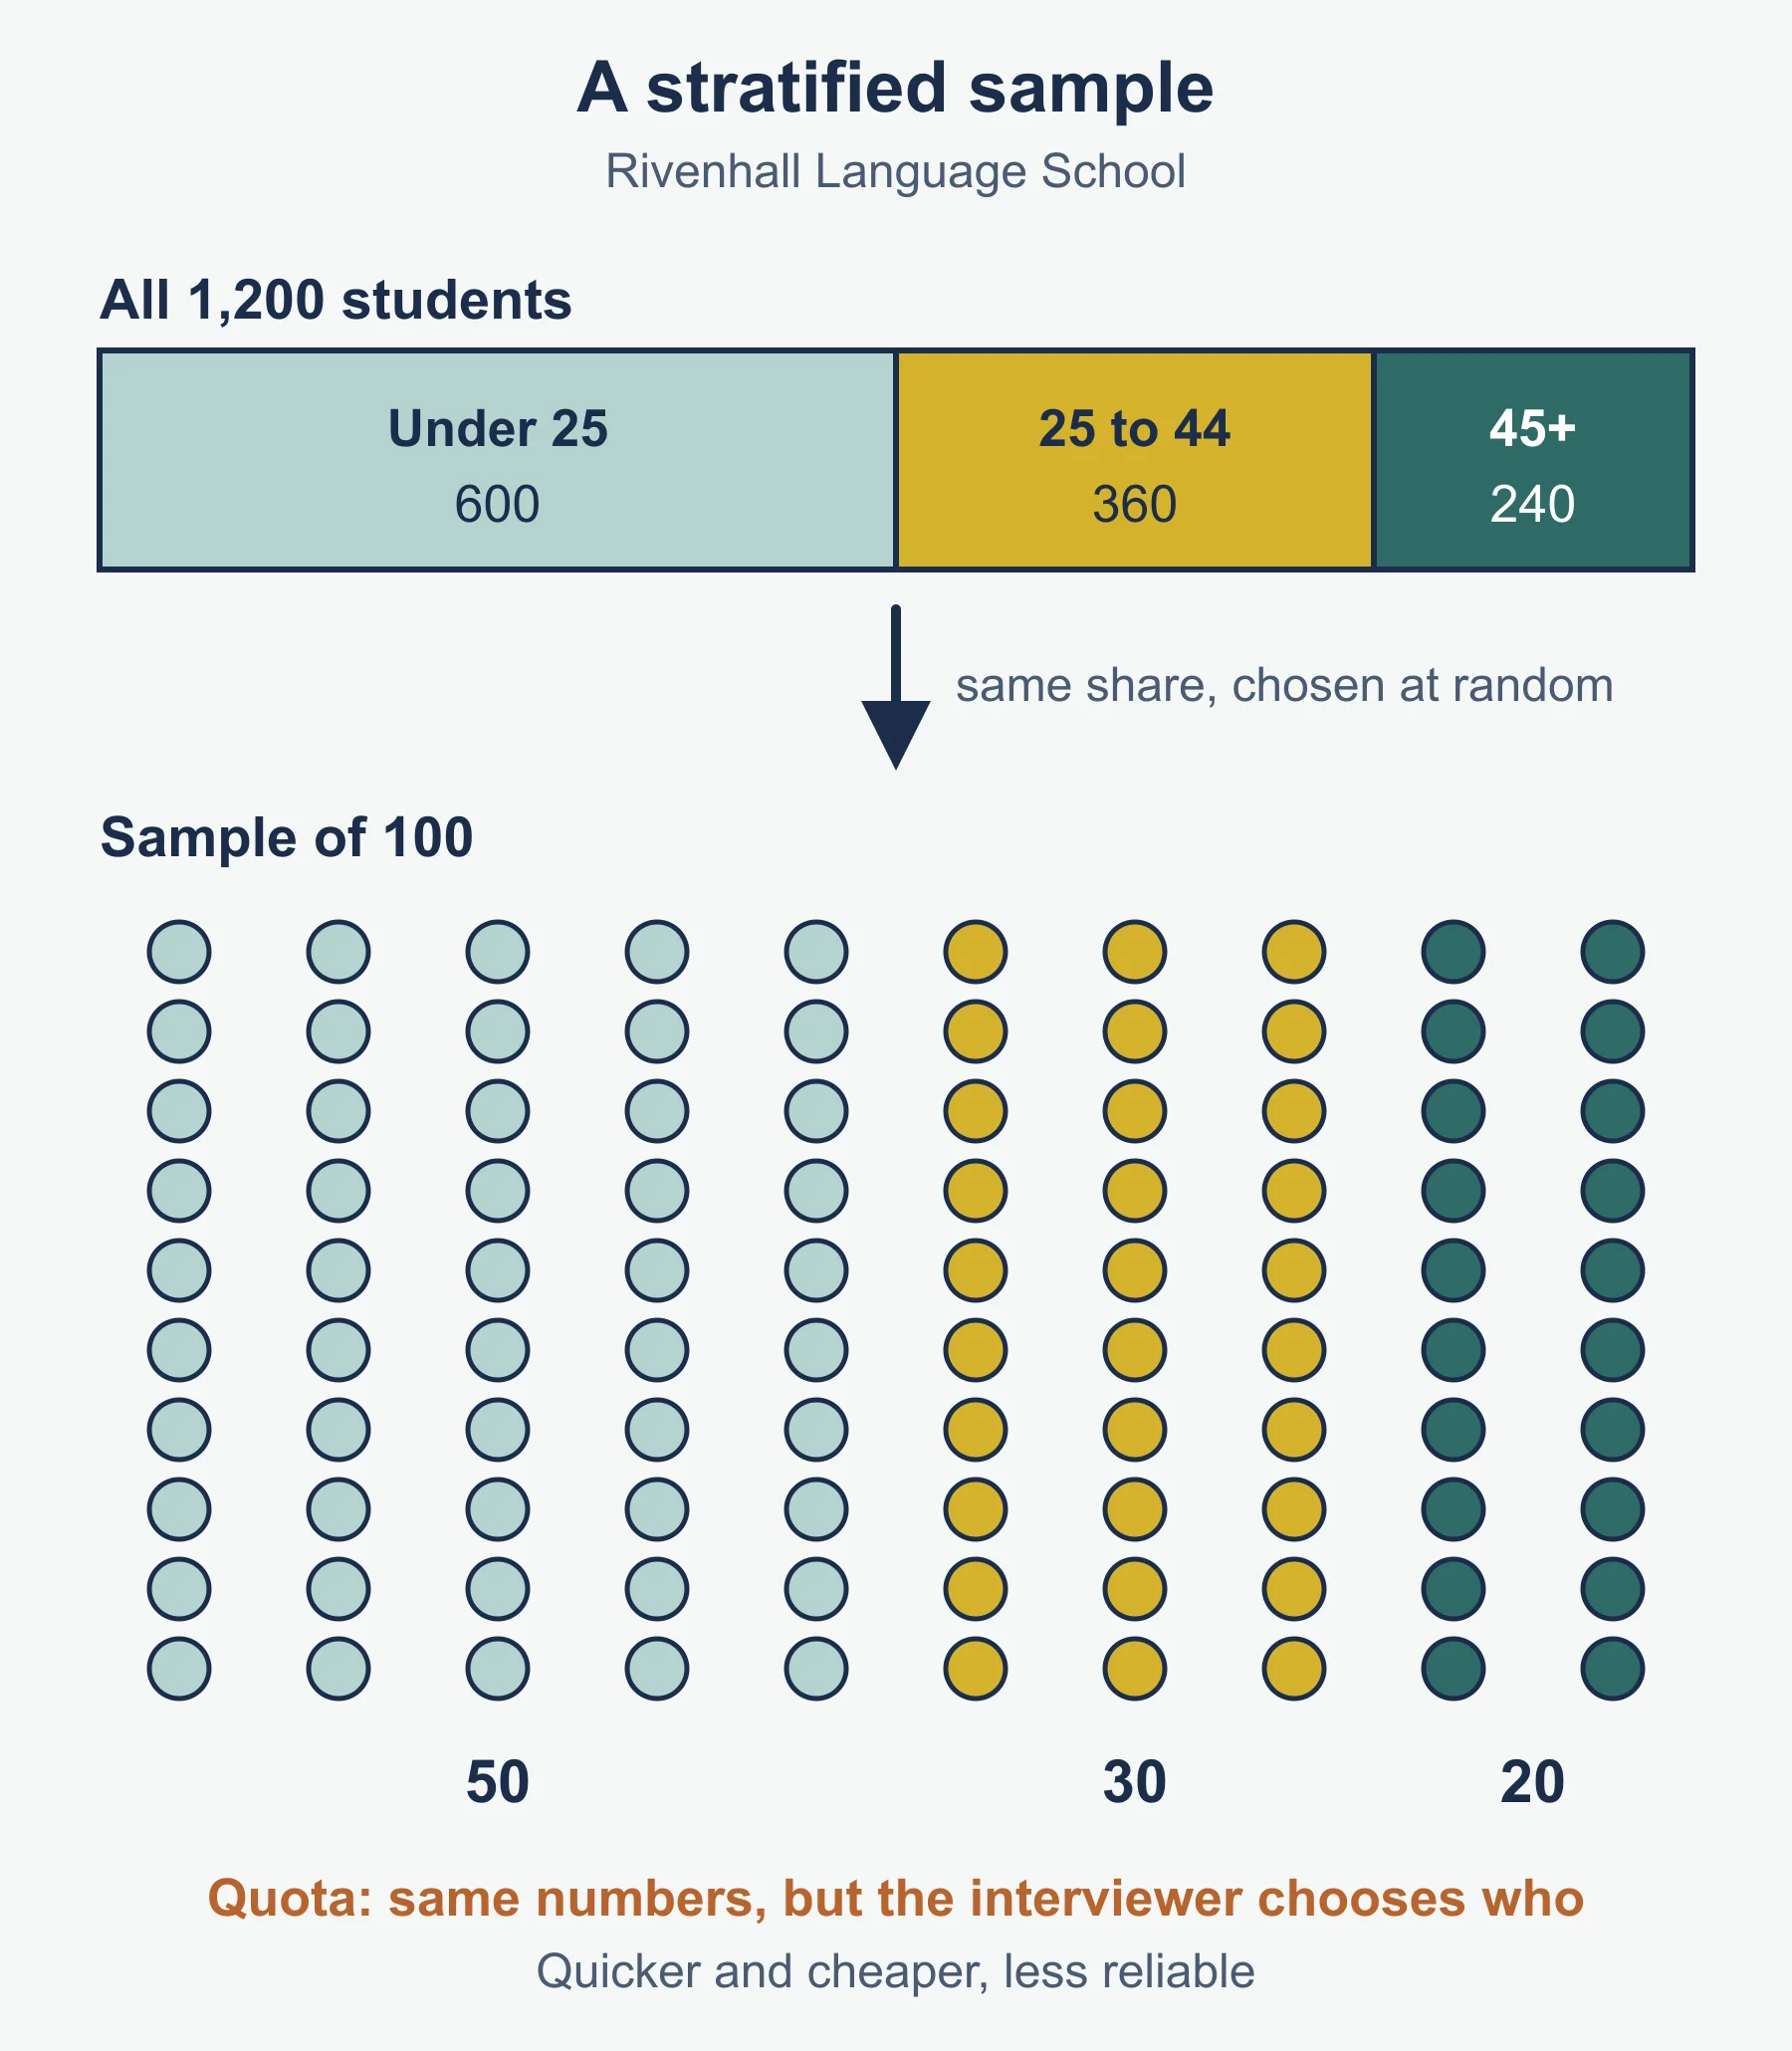
| Stratified | Population split into groups, then a random sample from each, in proportion | Represents every group | Needs good information about the population, more complex |
| Quota | Interviewers fill set numbers from each group, choosing whom to ask | Fast and cheap, covers groups | Interviewer choice can bring bias, not truly random |
Worked example. Rivenhall Language School has 1,200 students: 600 under 25, 360 aged 25 to 44 and 240 aged 45 or over. It wants a sample of 100. A stratified sample takes 50, 30 and 20 students (the same 50%, 30% and 20% as the population), chosen at random within each group. A quota sample sets the same numbers, but the interviewer decides whom to approach: quicker and cheaper, less reliable.
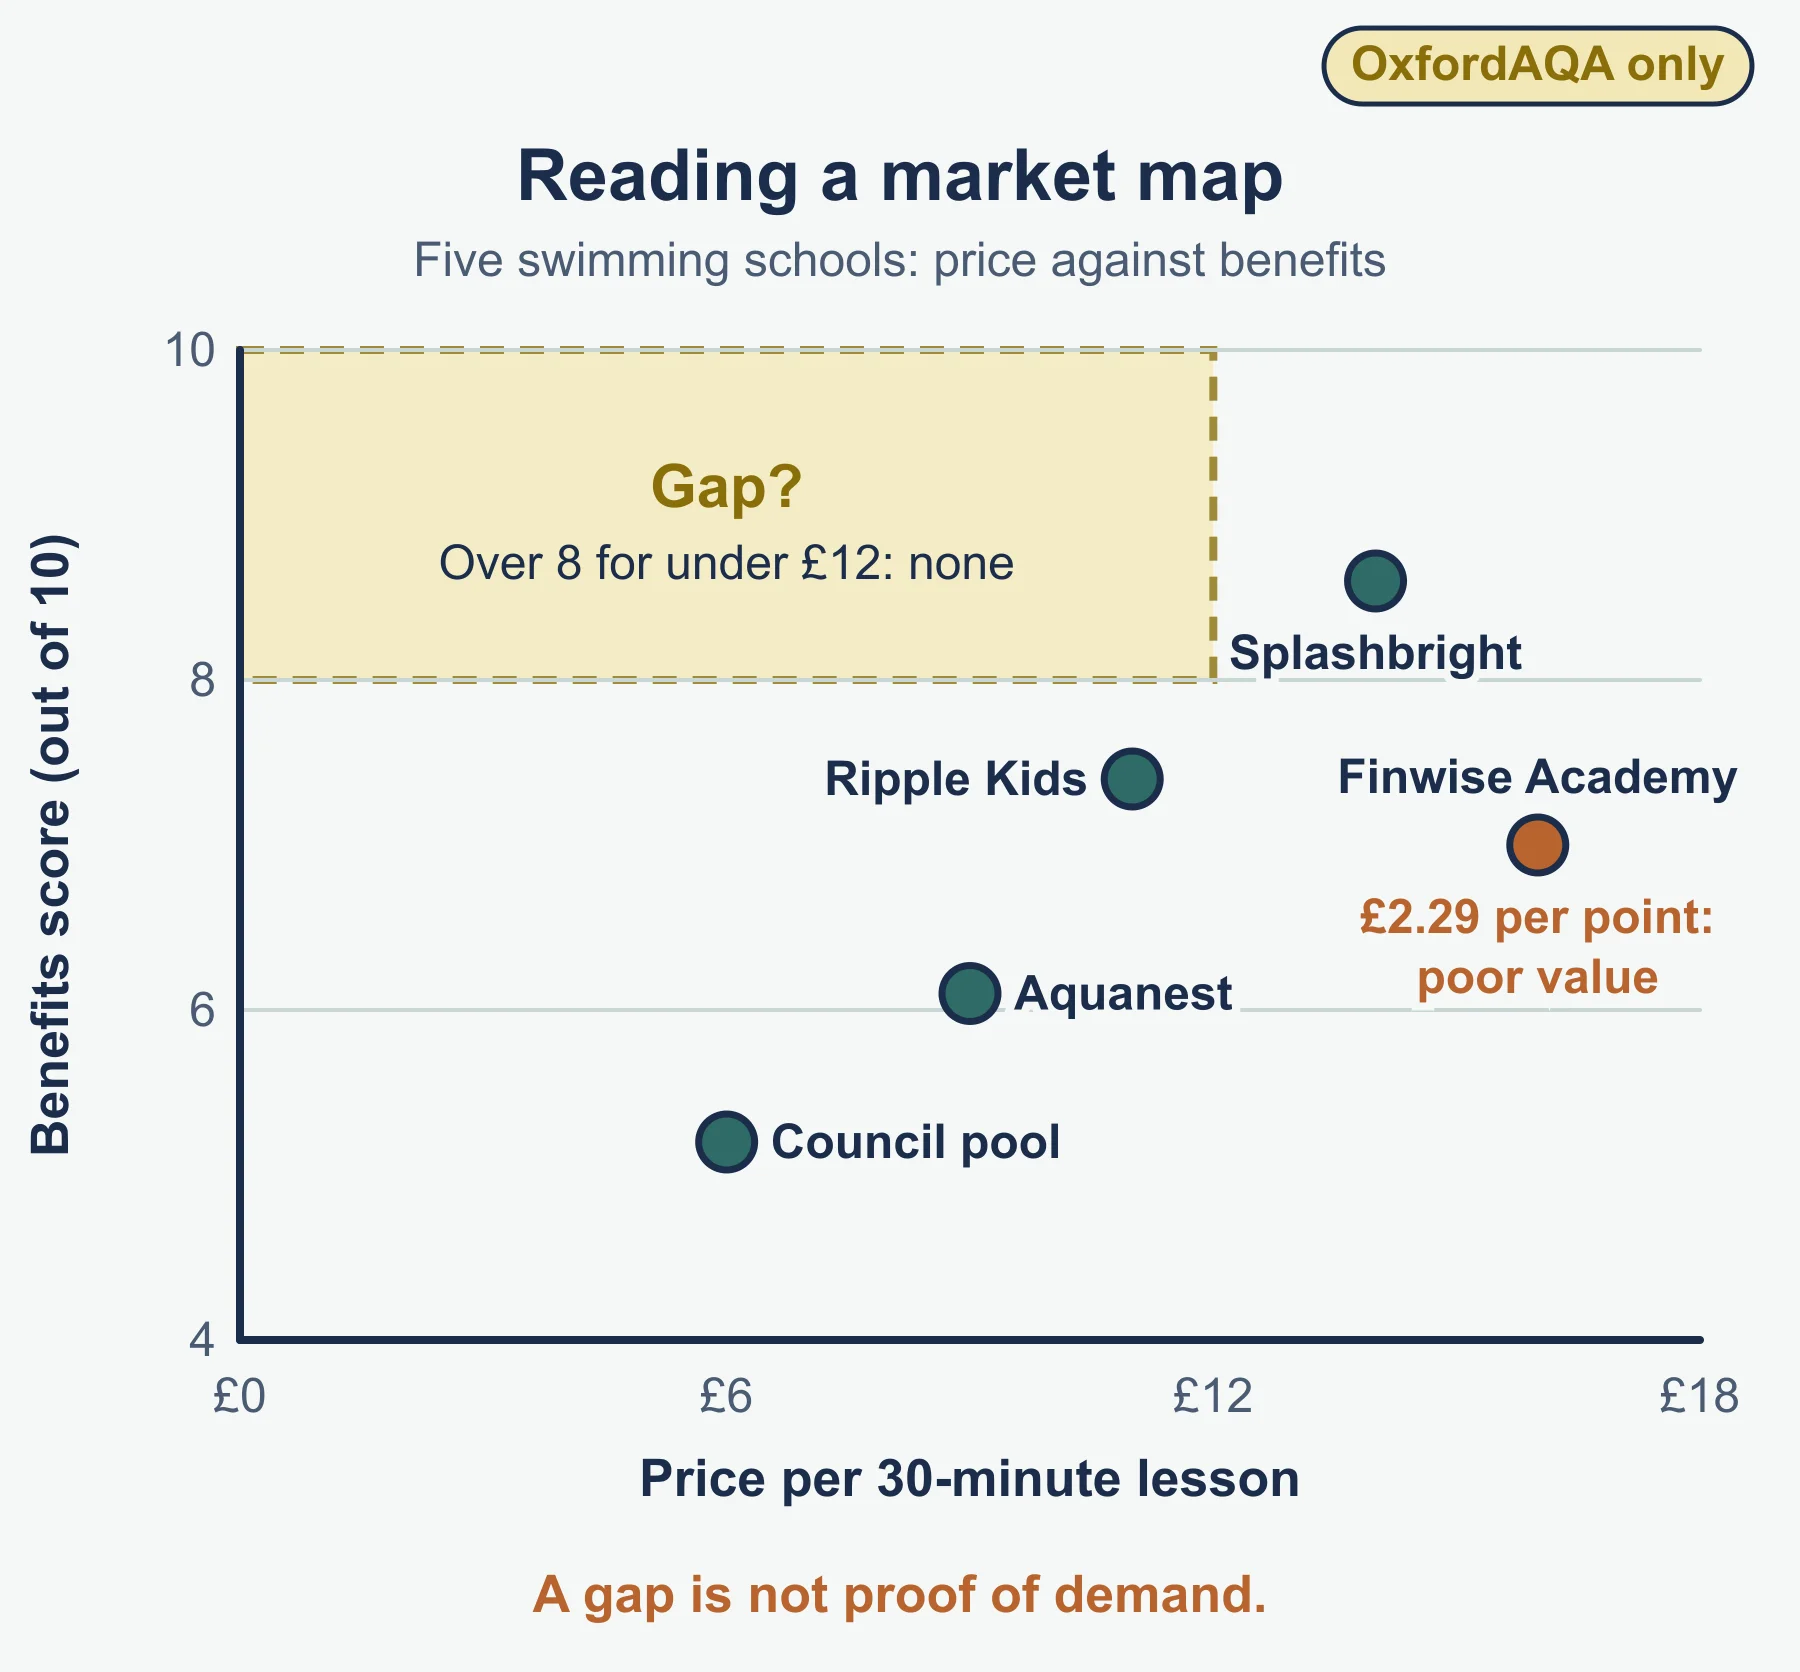
Market mapping (9625 only). A market map is a diagram placing brands or products on two axes, such as price and quality. This is the standard idea, as the specification only names it. It shows where rivals cluster and where there may be a gap, but positions are judgements.
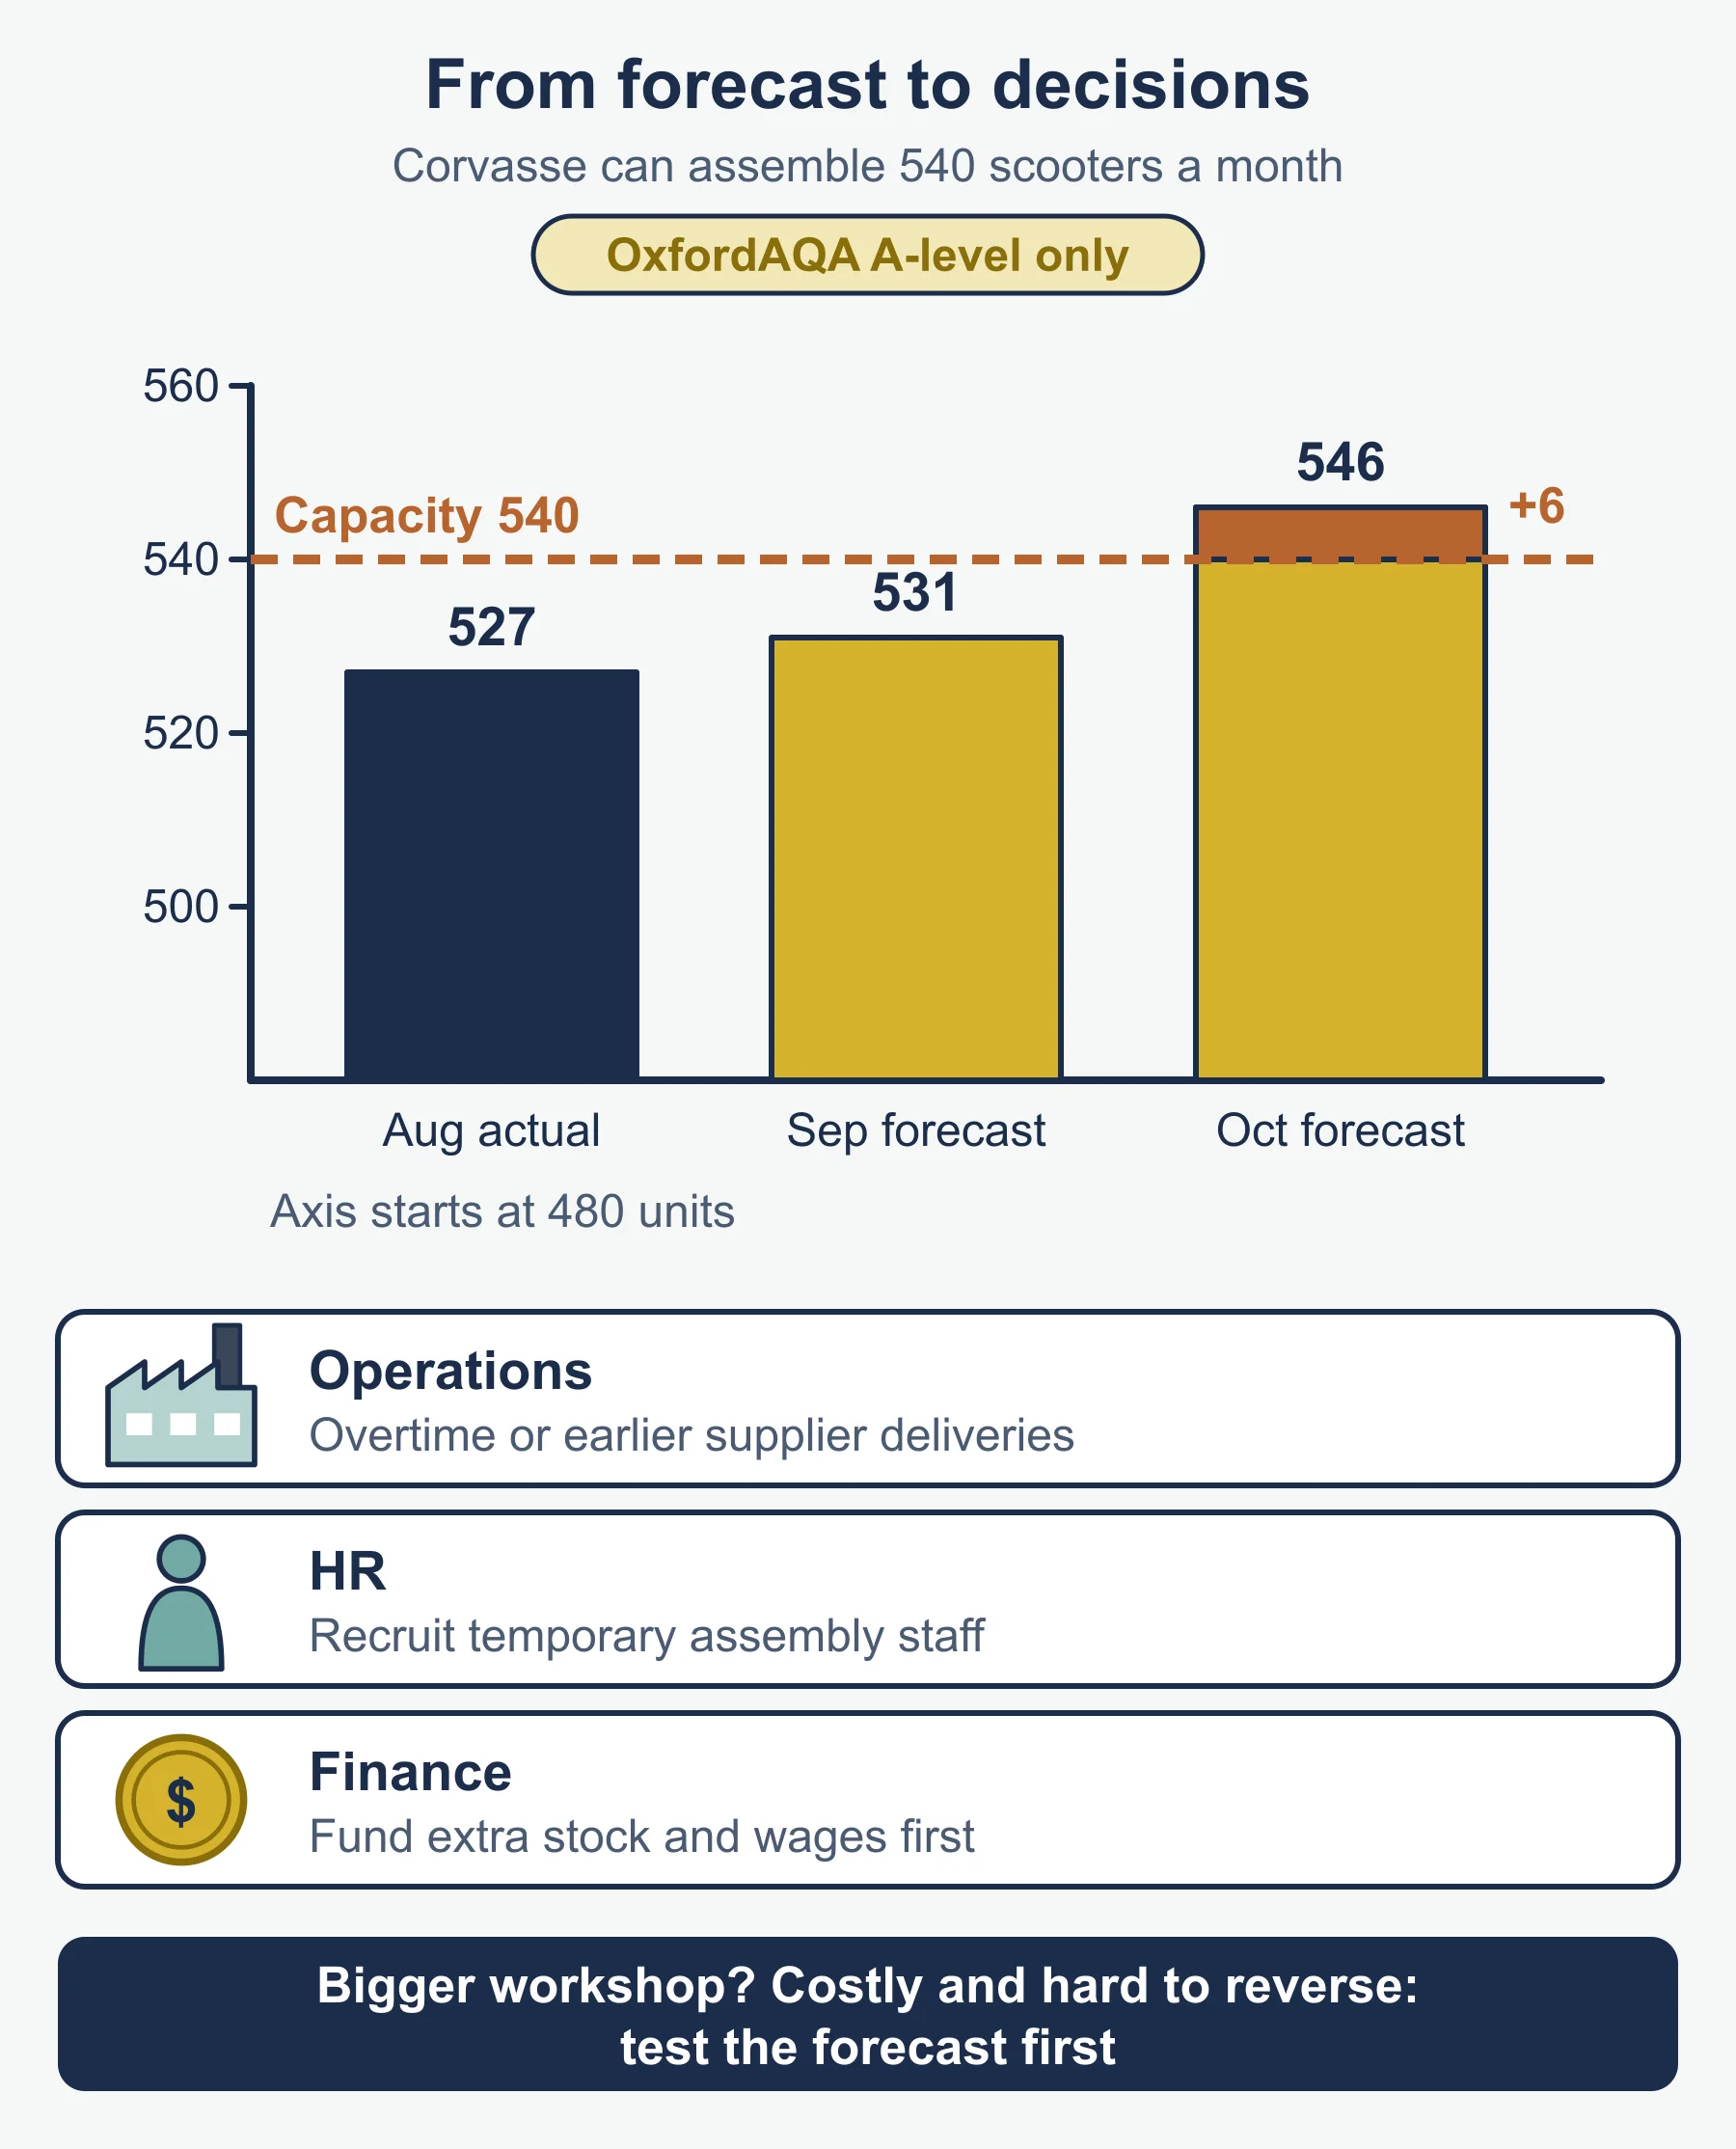
Sales forecasts (9625 only). A sales forecast is an estimate of future sales. It matters because production, stock, staffing, cash flow and the budget all depend on it, and objectives can be set against it. Difficulties: changing tastes, unpredictable rival actions, economic change, no history for a new product, and unreliable research data. Forecasts should be revised as results arrive.
Influences on choosing a method. Cost: small firms may rely on secondary data. Time required: a quick decision cannot wait for weeks of fieldwork. Reliability of findings: larger, well-chosen samples give findings you can trust. These often conflict, so say which matters most.
Interpretation of marketing data
Both versions ask you to interpret and use marketing data in decisions and planning. State what the number shows, how reliable it is, then what the business should do.
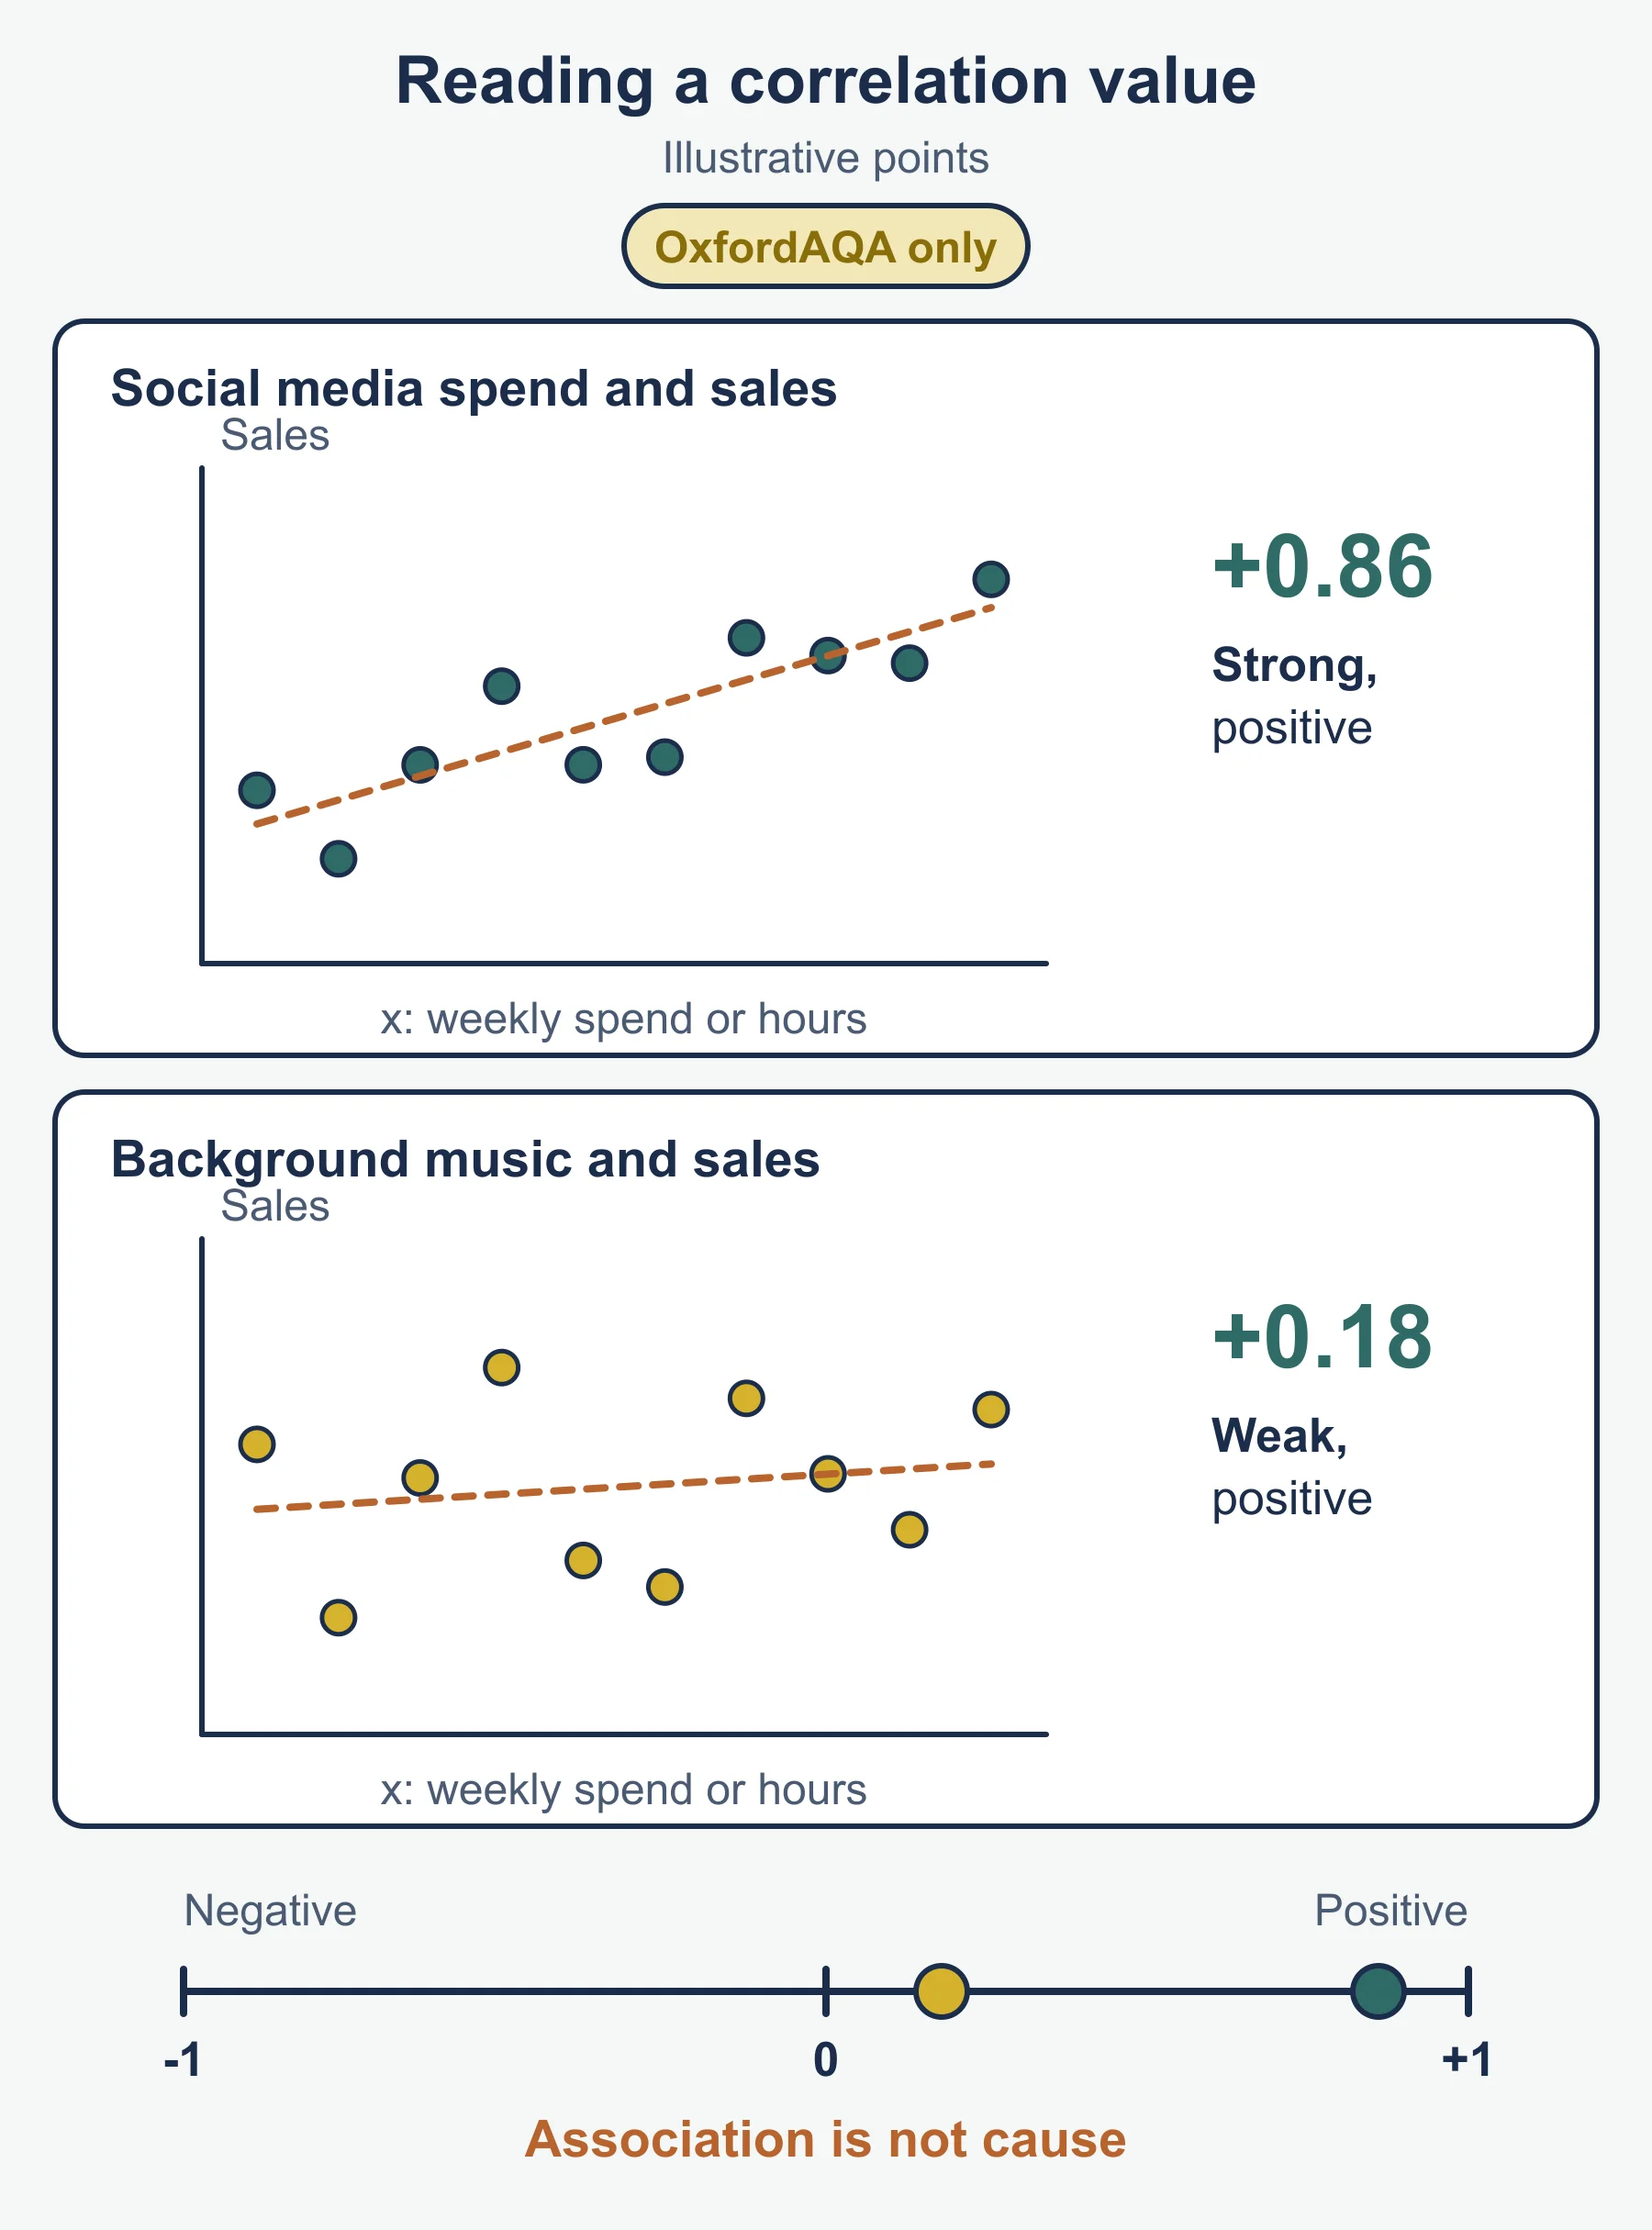
Correlation. The correlation value runs from -1 to +1. The sign gives direction: positive means the variables rise together, negative means one rises as the other falls. The size gives strength: near 1 (ignoring sign) is strong, near 0 is weak. Weekly social media spend against weekly sales at one cafe group gave +0.86: strong and positive. Hours of background music against sales gave about +0.18: weak. Correlation shows association, not cause. You need to understand the value, not calculate it.
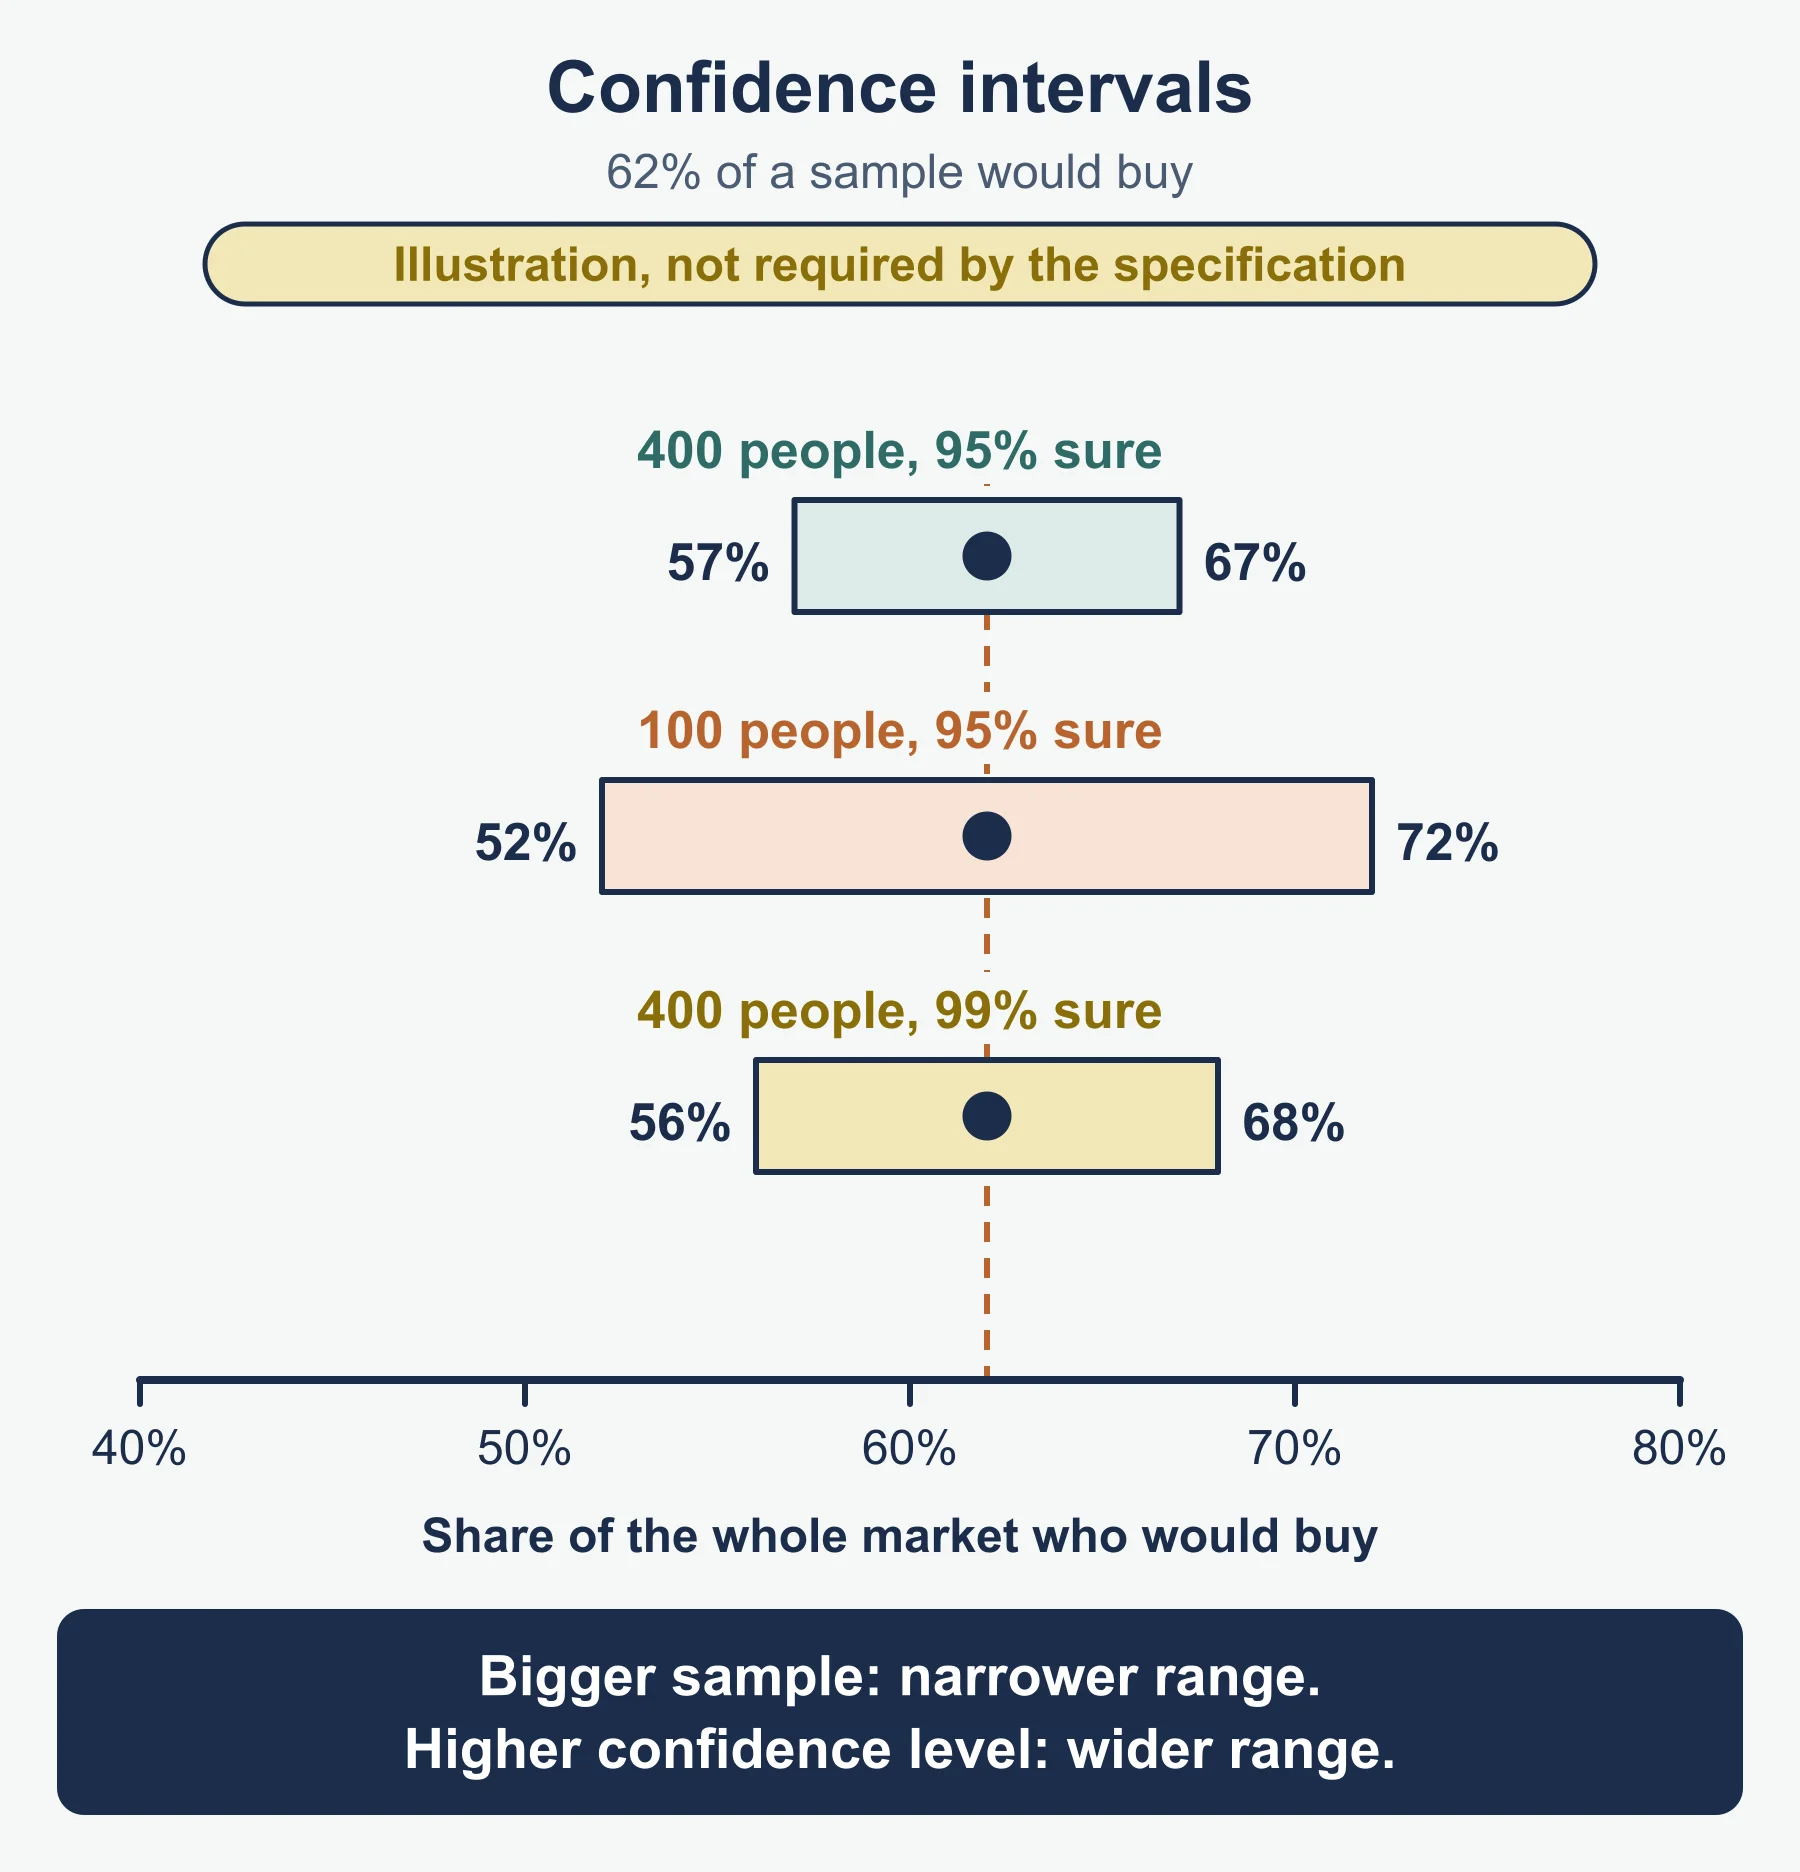
Confidence levels and confidence intervals. A survey of a sample gives an estimate for the whole market. A confidence interval is the range within which the true figure is expected to lie, and the confidence level (such as 95%) says how sure we can be that the method captures the true value. Illustration, not required by the specification: 62% of a sample of 400 customers would buy a new product. At 95% confidence the interval is about 57% to 67%. A sample of 100 with the same result gives about 52% to 72%, which is wider and less useful. A 99% level widens it. A bigger sample narrows it but costs more.
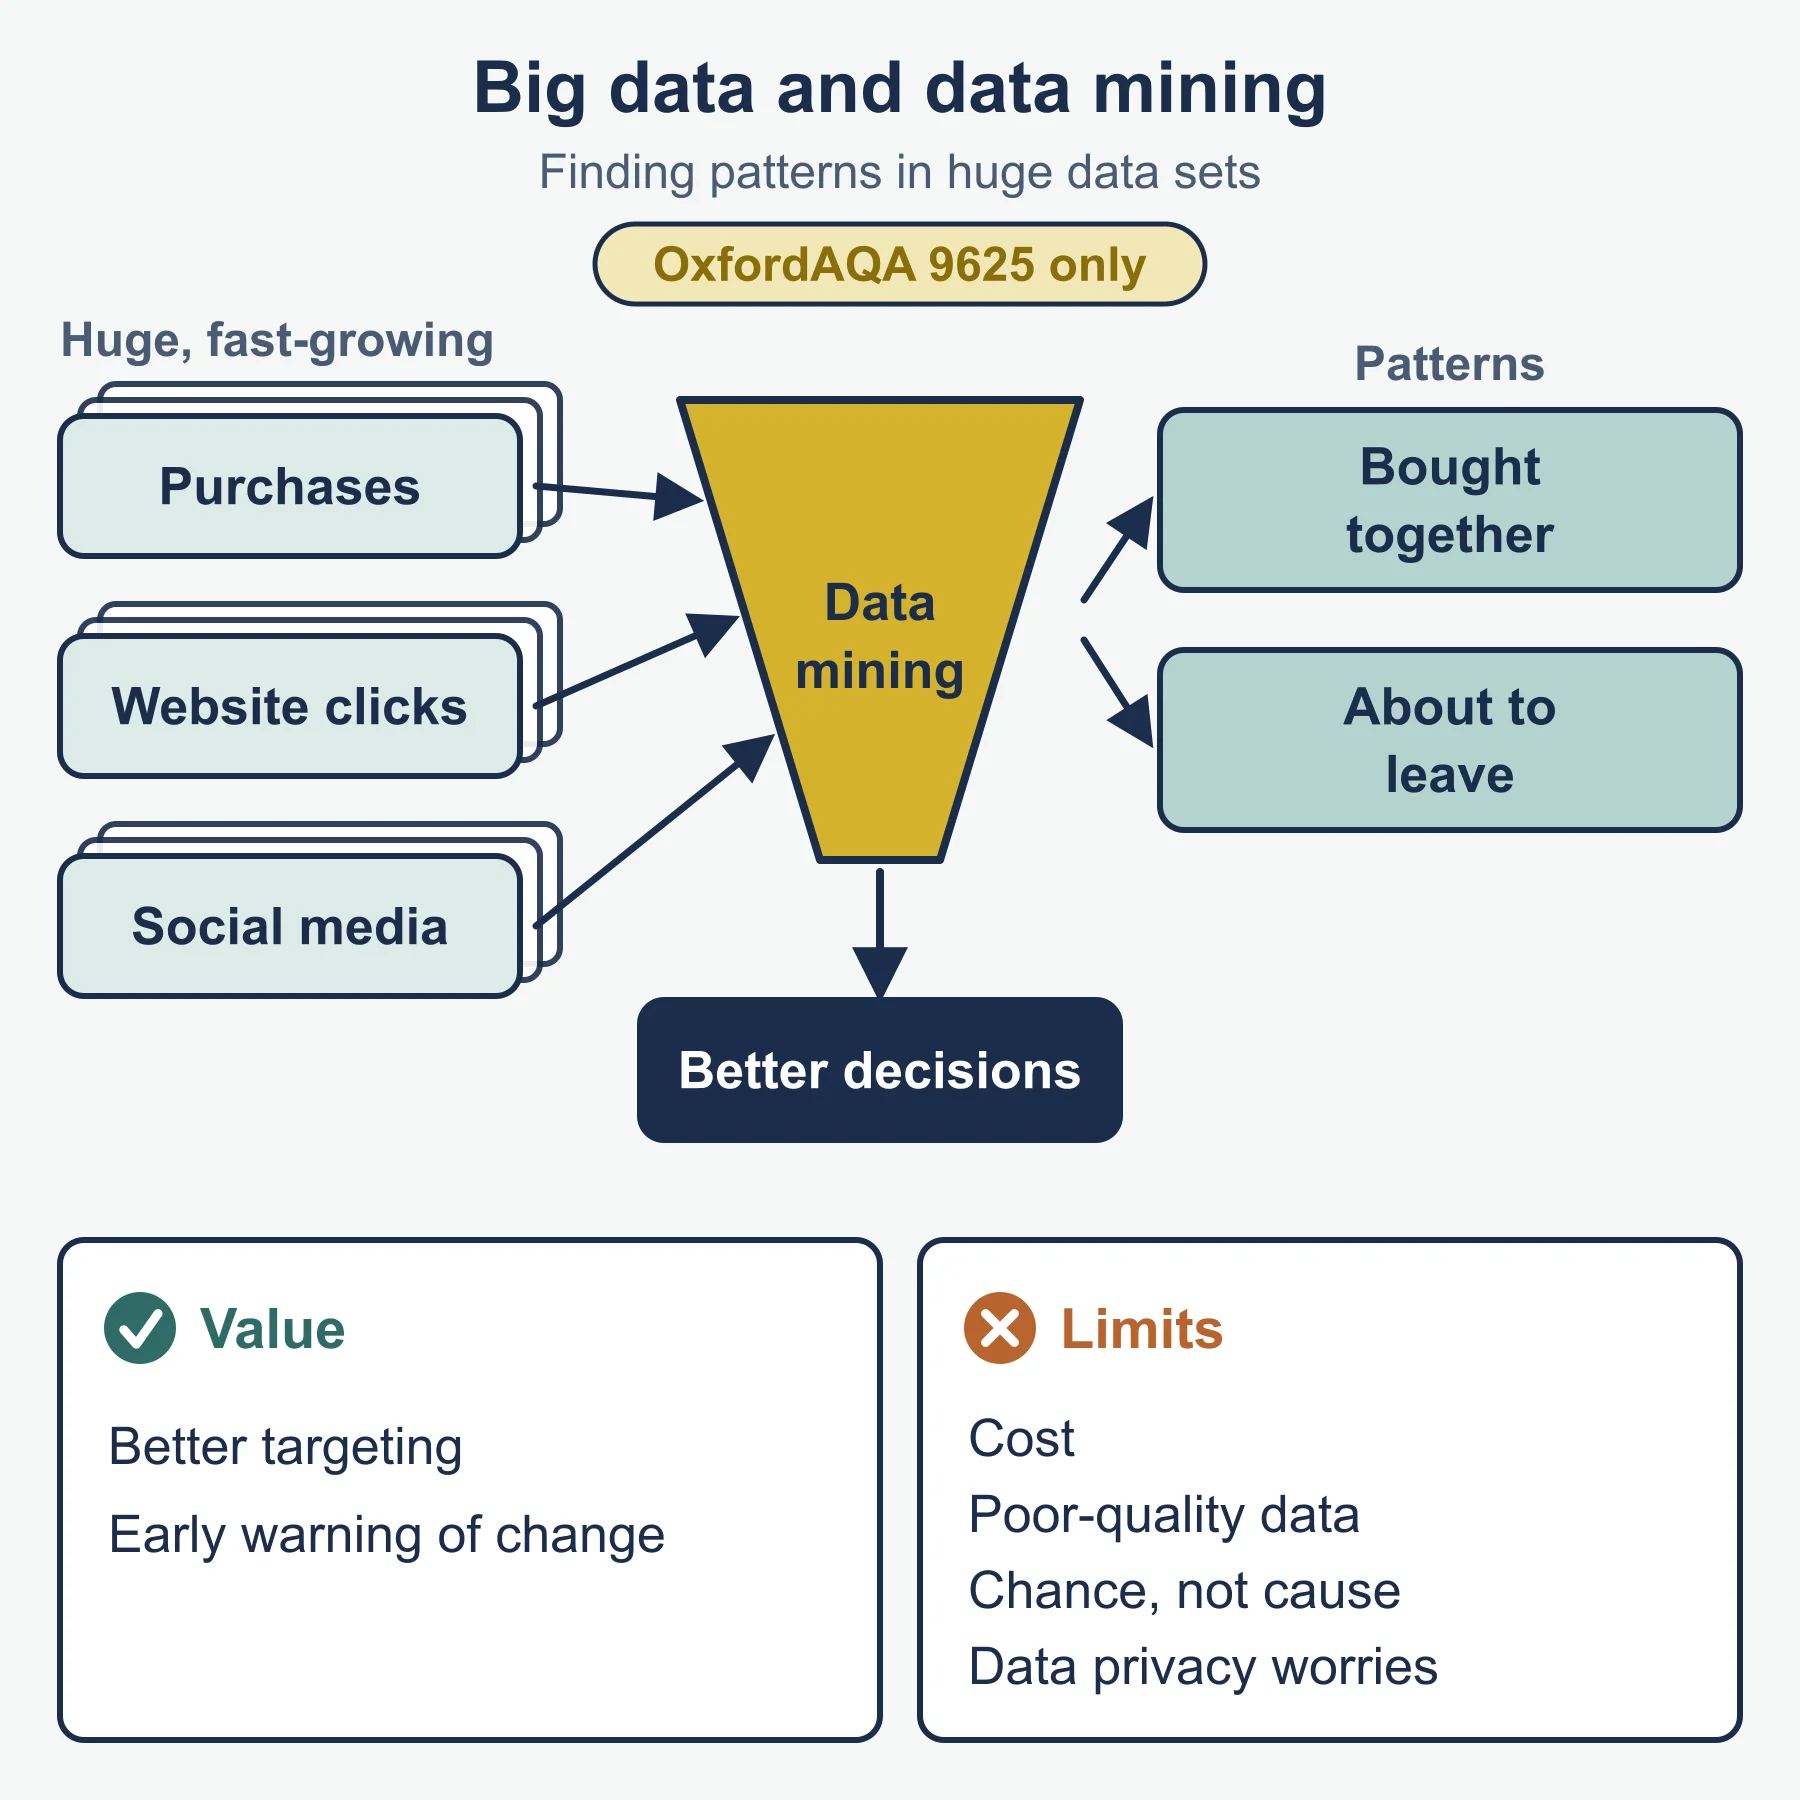
Big data and data mining (9625 only). Big data means very large, fast-growing sets of data, such as purchase records, website clicks and social media activity. Data mining means searching such data for patterns, for example which products are bought together or which customers are about to leave. Value: better targeting and early warning of change. Limits: cost, poor-quality data, patterns that are chance rather than cause, and customer concern about personal data.
Common errors
- Using the wrong base for retention, or revenue where profit is asked for.
- Saying primary research is always more reliable.
- Treating a strong correlation as proof of cause.
Frequently asked questions
What are the elements of a marketing plan in 9625 and 9725? In 9625 the elements are marketing objectives, strategy, tactics and the budget. In 9725 they are marketing objectives, the marketing mix and the marketing budget.
What does a correlation value tell a business? A correlation value runs from -1 to +1. The sign gives the direction and the size gives the strength, with values near 1 strong and values near 0 weak, but correlation shows association, not cause, and you only need to understand the value, not calculate it.
What is a confidence interval in market research? A confidence interval is the range within which the true figure for the whole market is expected to lie, based on a sample. The confidence level, such as 95%, says how sure we can be that the method captures the true value, and a bigger sample gives a narrower interval.
What is the difference between primary and secondary research? Primary research is new data collected for a specific purpose, which fits the exact question but costs more and takes longer. Secondary research uses data that already exists, which is faster and cheaper but was collected for another purpose.
What is a marketing objective? A marketing objective is a measurable, time-limited target for the marketing function, such as a target for sales volume, sales value or market share.
Official syllabus
OxfordAQA International AS and A-level Business specification (9625, first teaching September 2018; successor 9725, first teaching September 2026 for AS and September 2027 for A2), sections 3.1.2.1 and 3.1.2.2, published by OxfordAQA.
Get free revision emails (optional)
Occasional emails with practice questions, worked explanations and links to free resources for the qualification and subjects you choose. No spam, and you can unsubscribe from any email. The free tools on this site never need an email.
Related resources
-
Practice questions
OxfordAQA A-Level Business: Marketing objectives and plans and Marketing data (9625/9725) – Practice Questions
Original practice questions with worked answers on OxfordAQA International AS Business marketing objectives, plans, market research and data.
Business · OxfordAQA · AS Level
Try questions -
Revision notes
OxfordAQA A-Level Business: Marketing objectives and plans and Marketing data (9625/9725) – Revision Notes
Condensed OxfordAQA International AS Business revision notes on marketing objectives, plans, research, sampling and data interpretation, with a self-test.
Business · OxfordAQA · AS Level
Revise topic -
Study guides
OxfordAQA A-Level Business: Segmentation, targeting and positioning (9625/9725)
Study guide to segmentation, targeting and positioning for OxfordAQA International AS and A-level Business: methods, niche, mass, repositioning.
Business · OxfordAQA · AS Level
Read guide
Related articles
-
teaching
A Level tuition in Dubai: Cambridge or Pearson Edexcel International A Level?
Schools in Dubai and Abu Dhabi teach either Cambridge International AS & A Level or Pearson Edexcel International A Level. How the two are structured, why it matters for tuition, and how online classes from Lahore work.
9 October 2026
-
curriculum guides
Choosing subjects at IGCSE and A Level
How subject choices at 14 and 16 affect university options later, and how to keep pathways open without overloading a timetable.
28 July 2026
Studying this with a teacher
Working through Business AS LEVEL?
This page is free and stays free. If you would rather be taught it, Marlbridge runs Business classes one-to-one and in small groups of up to 15, online in your own time zone. The first trial class is free. WhatsApp replies within an hour (8am–11pm Pakistan time, every day); email the same day.
OxfordAQA Business teachers at Marlbridge
