
Revision Notes
OxfordAQA A Level Economics: Measurement of Macroeconomic Performance — Revision Notes
Revision notes on macroeconomic objectives, the Gini coefficient, performance indicators and index numbers for OxfordAQA International A-level Economics 9640.
- Subject
- Economics
- Level
- AS LEVEL
- Topic
- The national economy in a global environment
- Author
- Marlbridge Academic Team
- Updated
- Reviewed by
- Salman Ahmad (what this means)
Aligned to OxfordAQA A Level Economics (9640), First teaching September 2020, first AS exams May/June 2021, first A-level exams May/June 2022. Official specification .
Syllabus page (what it covers and how it is assessed): OxfordAQA A Level Economics.
Syllabus points this page covers
9640 (AS Level)
- 3.2.1 The measurement of macroeconomic performance
Found an error? Report a correction.
Need help with this topic? Request a free trial class for A Level Economics (9640).
Condensed for the final weeks. For the full explanation, use the Measurement of Macroeconomic Performance study guide.
Government macroeconomic objectives (3.2.1.1)
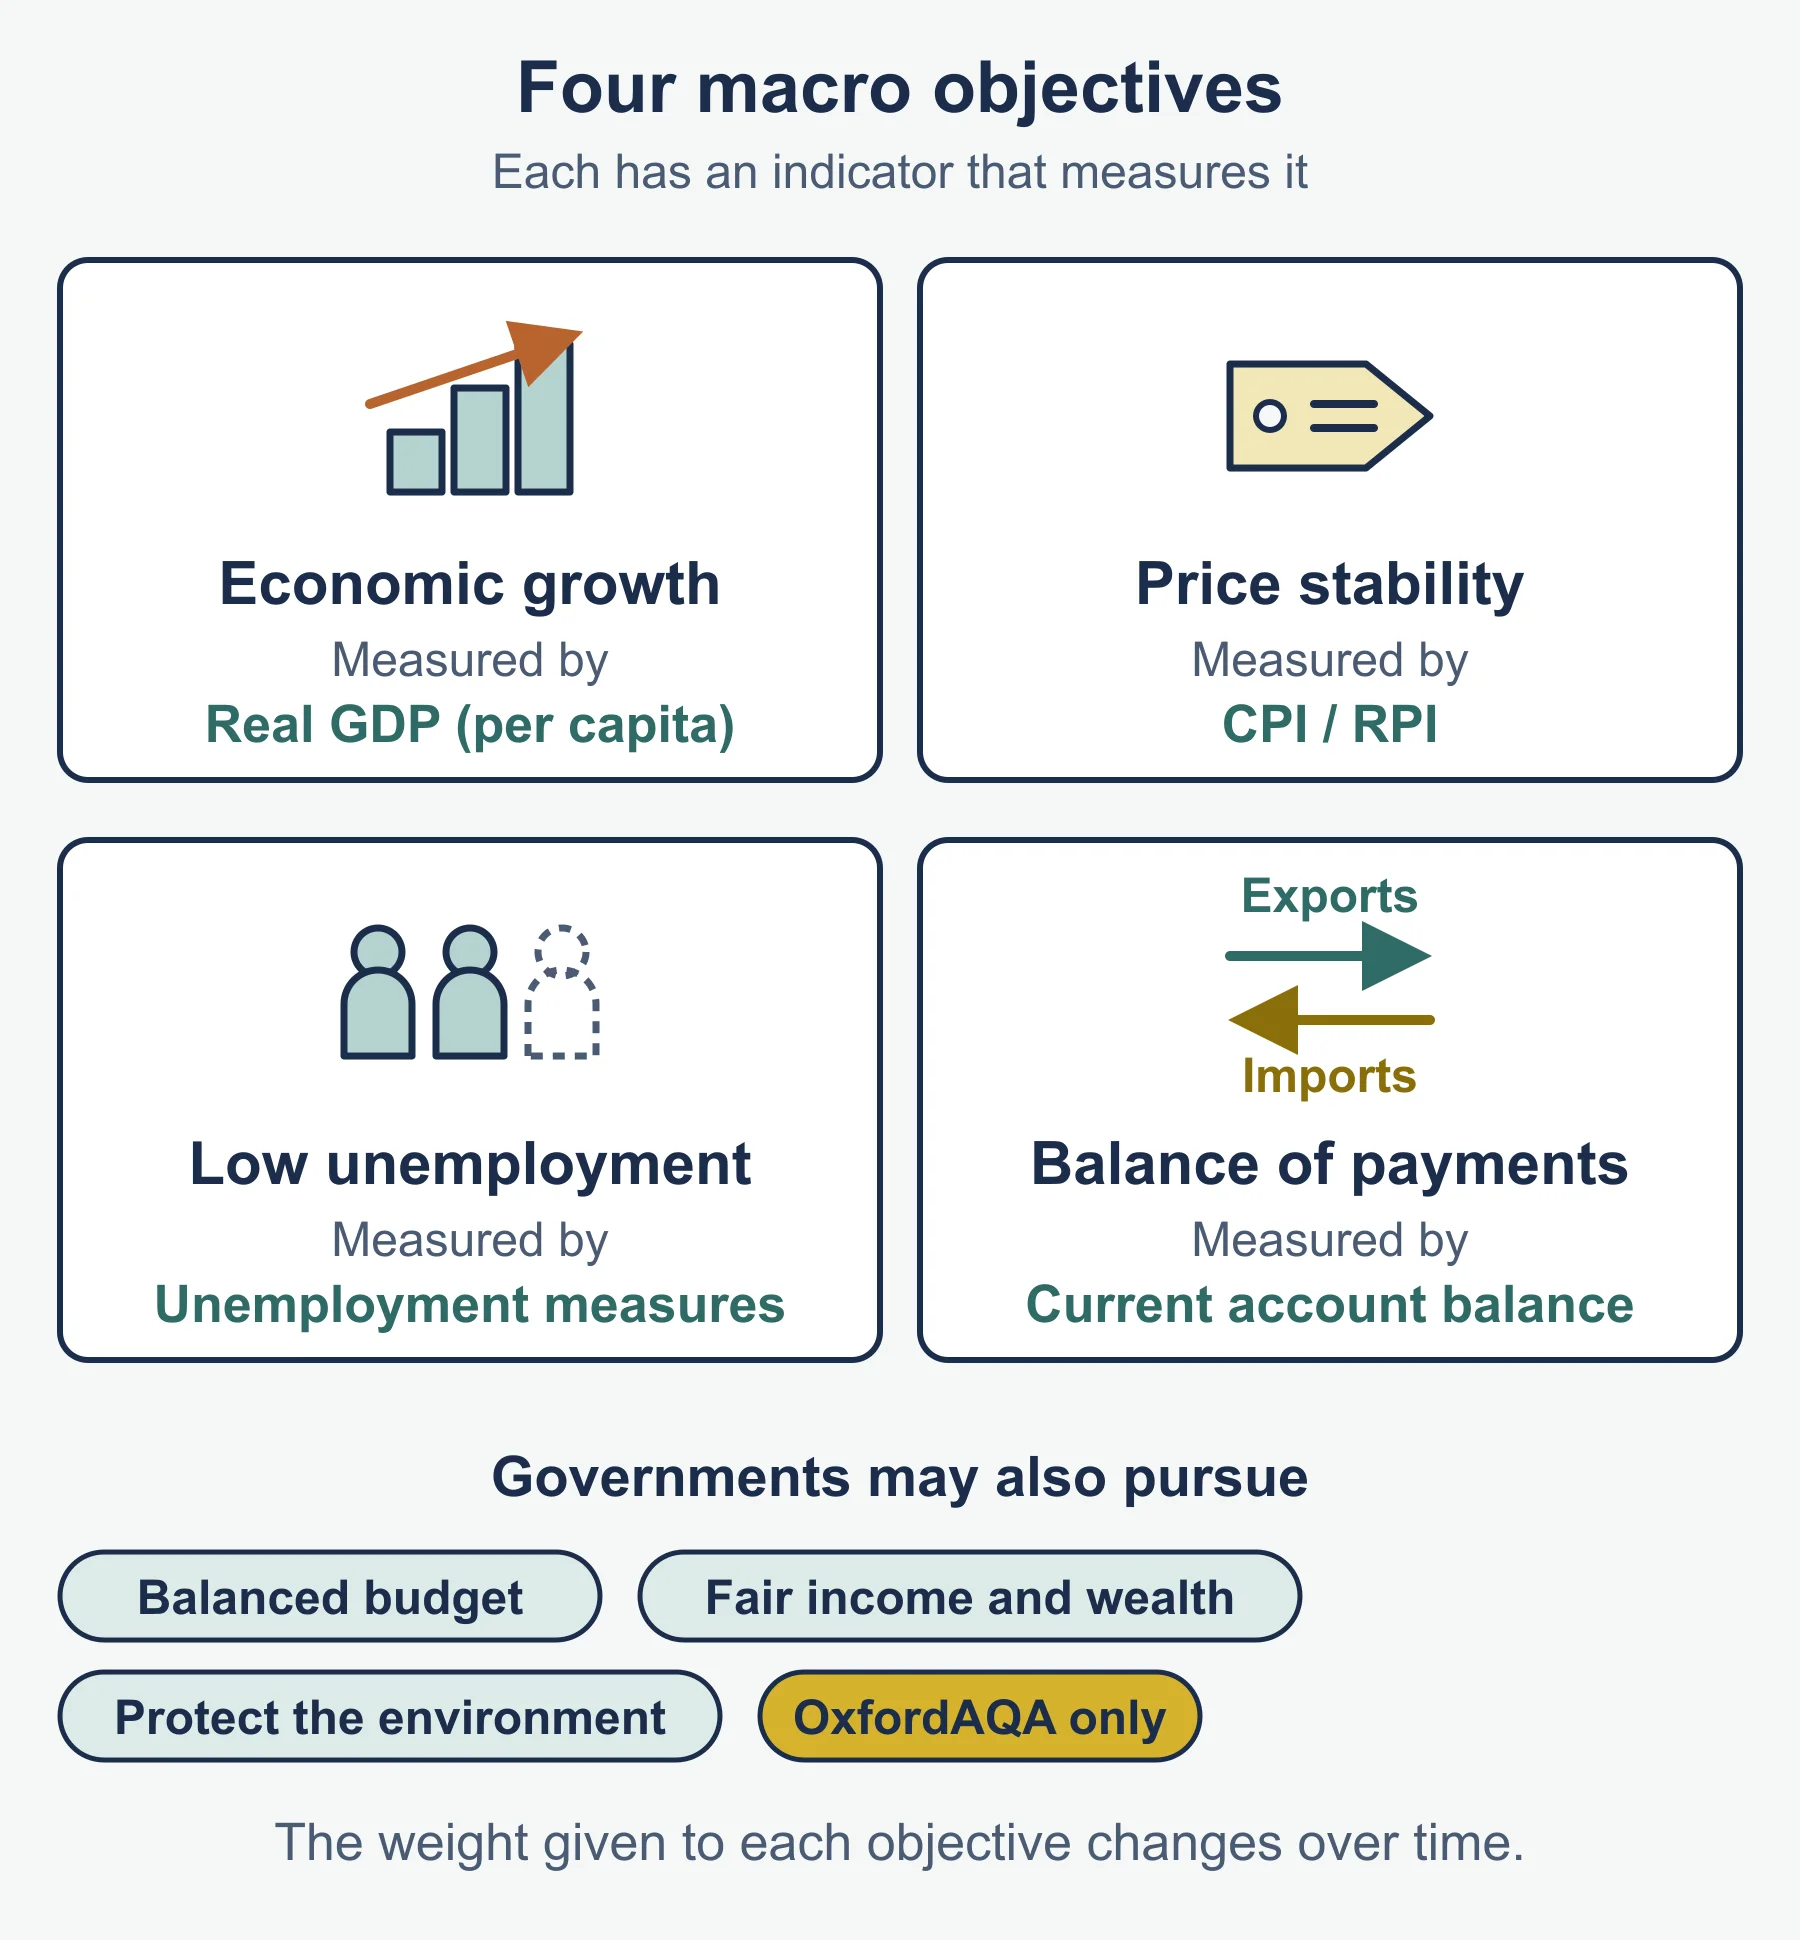
Four core objectives: economic growth, price stability, minimising unemployment, a stable balance of payments on current account. Three additional objectives this specification names: balancing the budget, an equitable distribution of income and wealth, protecting the environment. Objectives can conflict — always be ready to explain one specific short-run conflict (e.g. growth vs price stability) rather than just listing the objectives.
Matching indicator to objective (3.2.1.2)
| Objective | Indicator |
|---|---|
| Economic growth | Real GDP, real GDP per capita |
| Price stability | Consumer price index |
| Minimising unemployment | Unemployment rate/measures |
| External balance | Balance of payments (current account) |
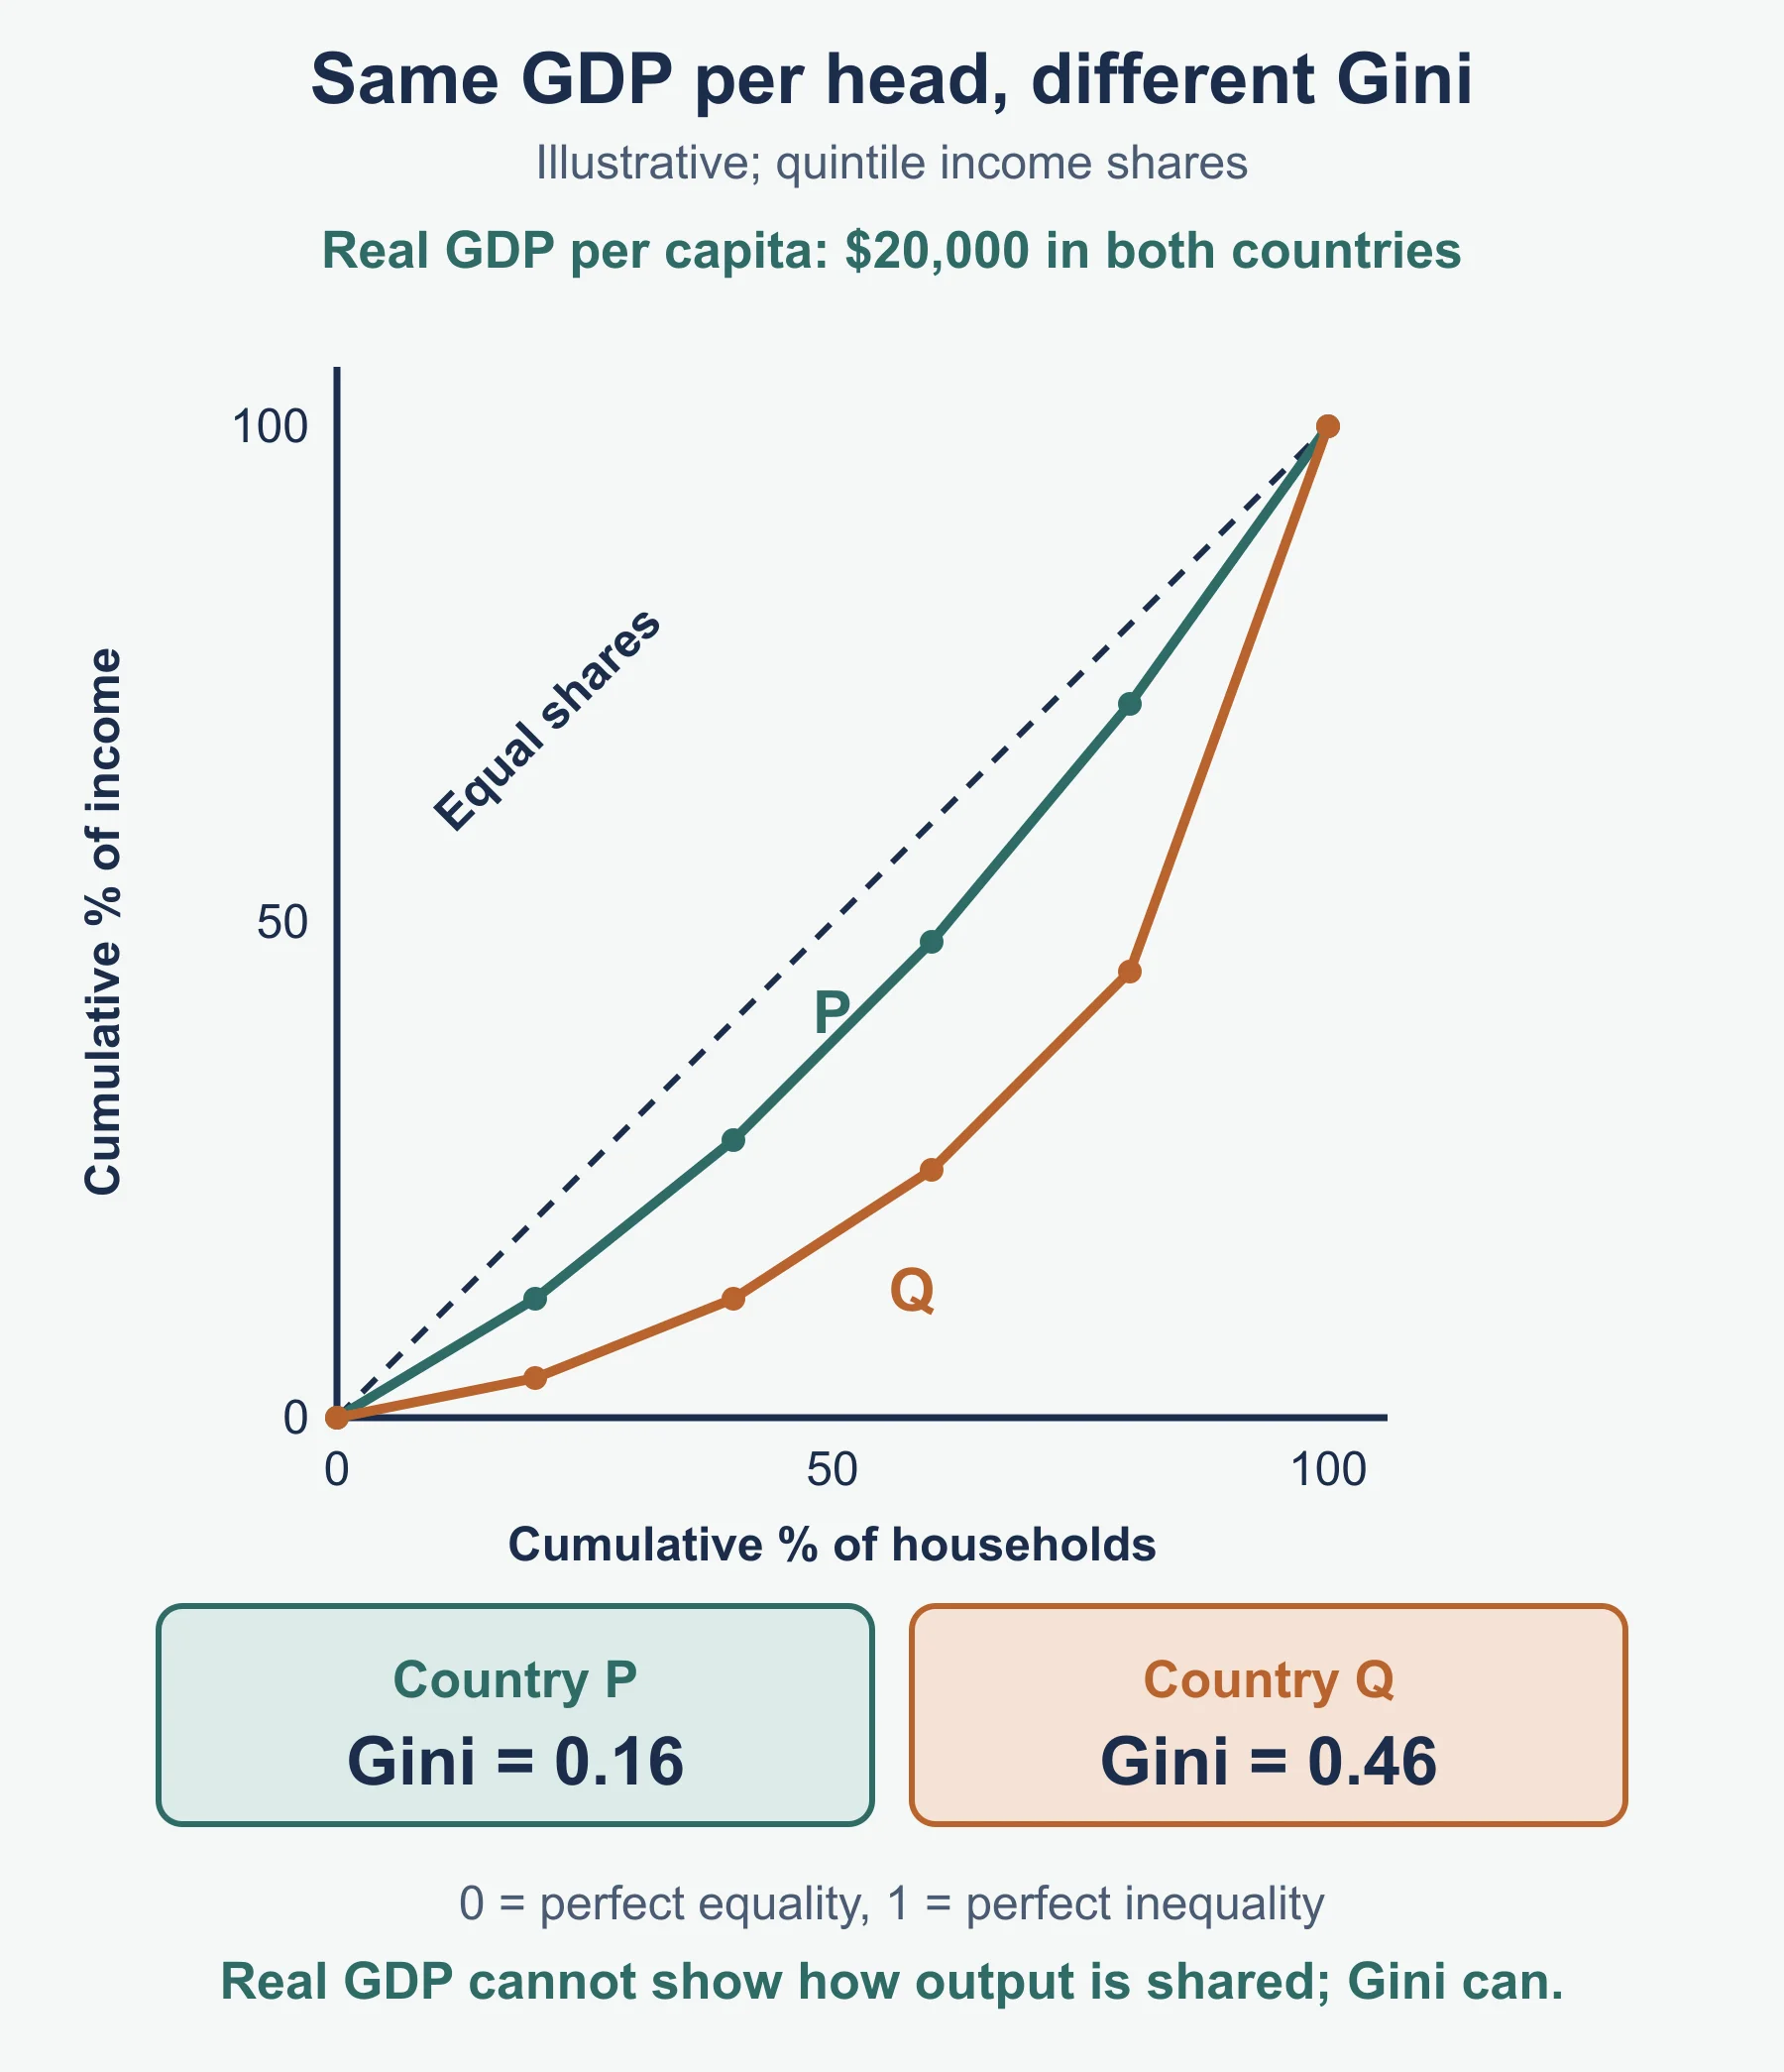
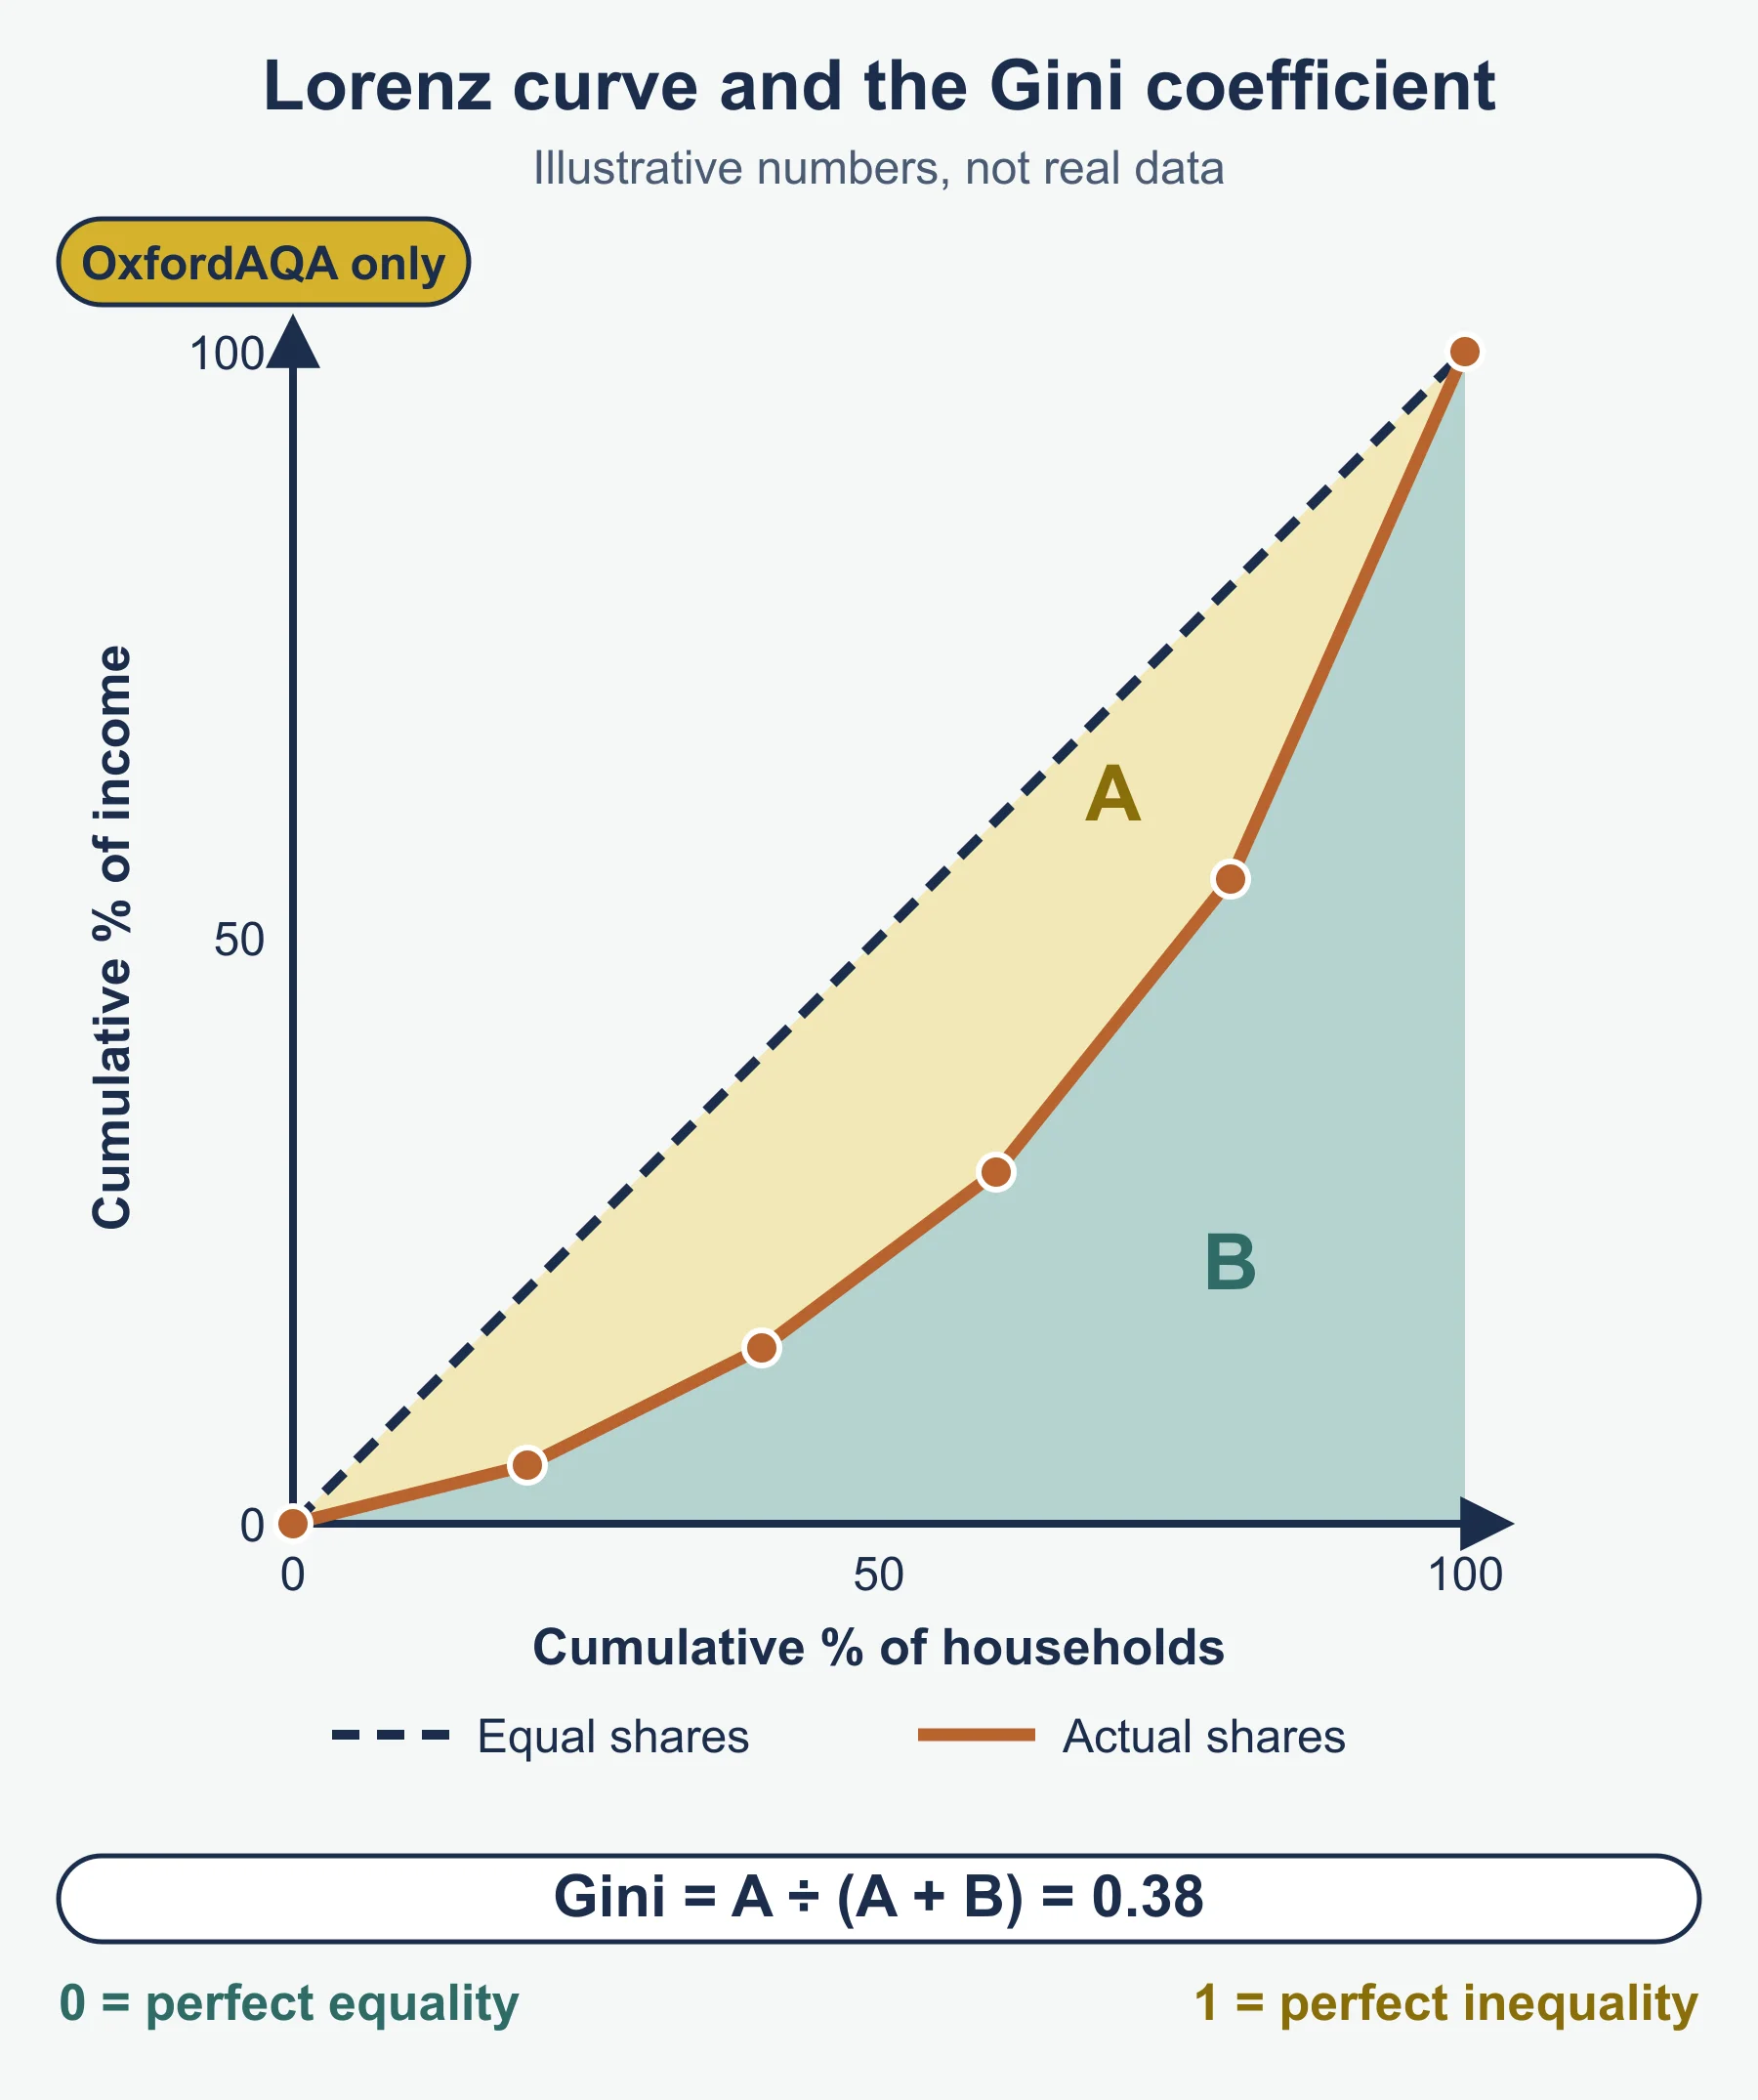
| Equitable distribution | Gini coefficient (0 = perfect equality, 1 = perfect inequality) |
| Productivity | Output per worker |
Real vs nominal, and index numbers
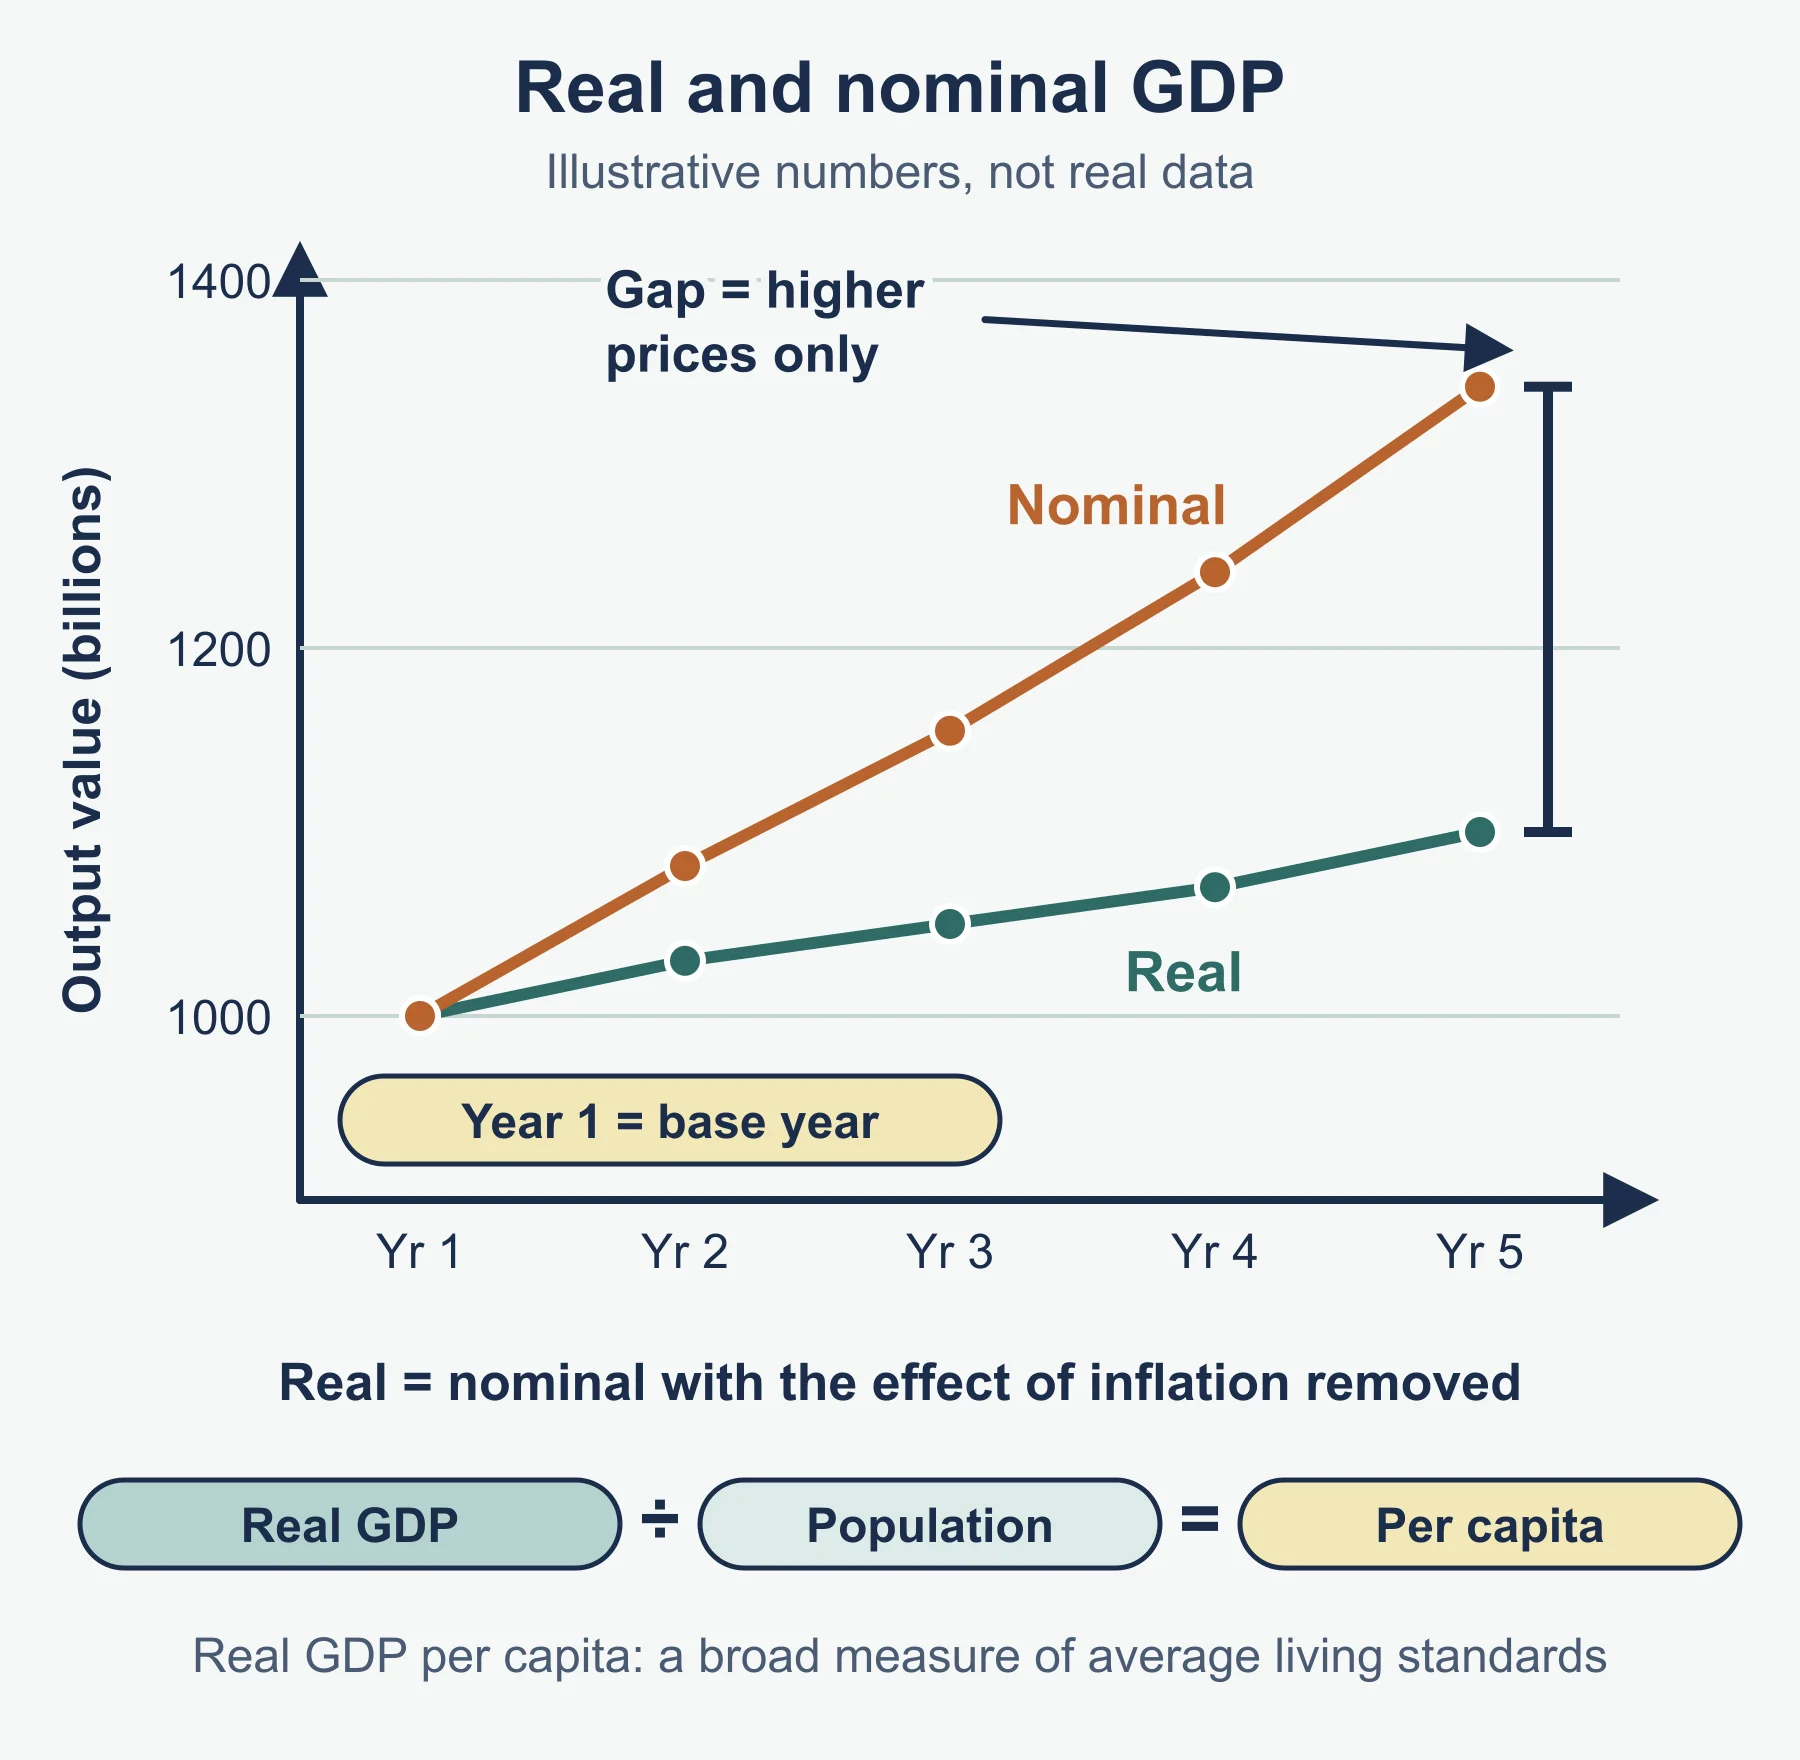
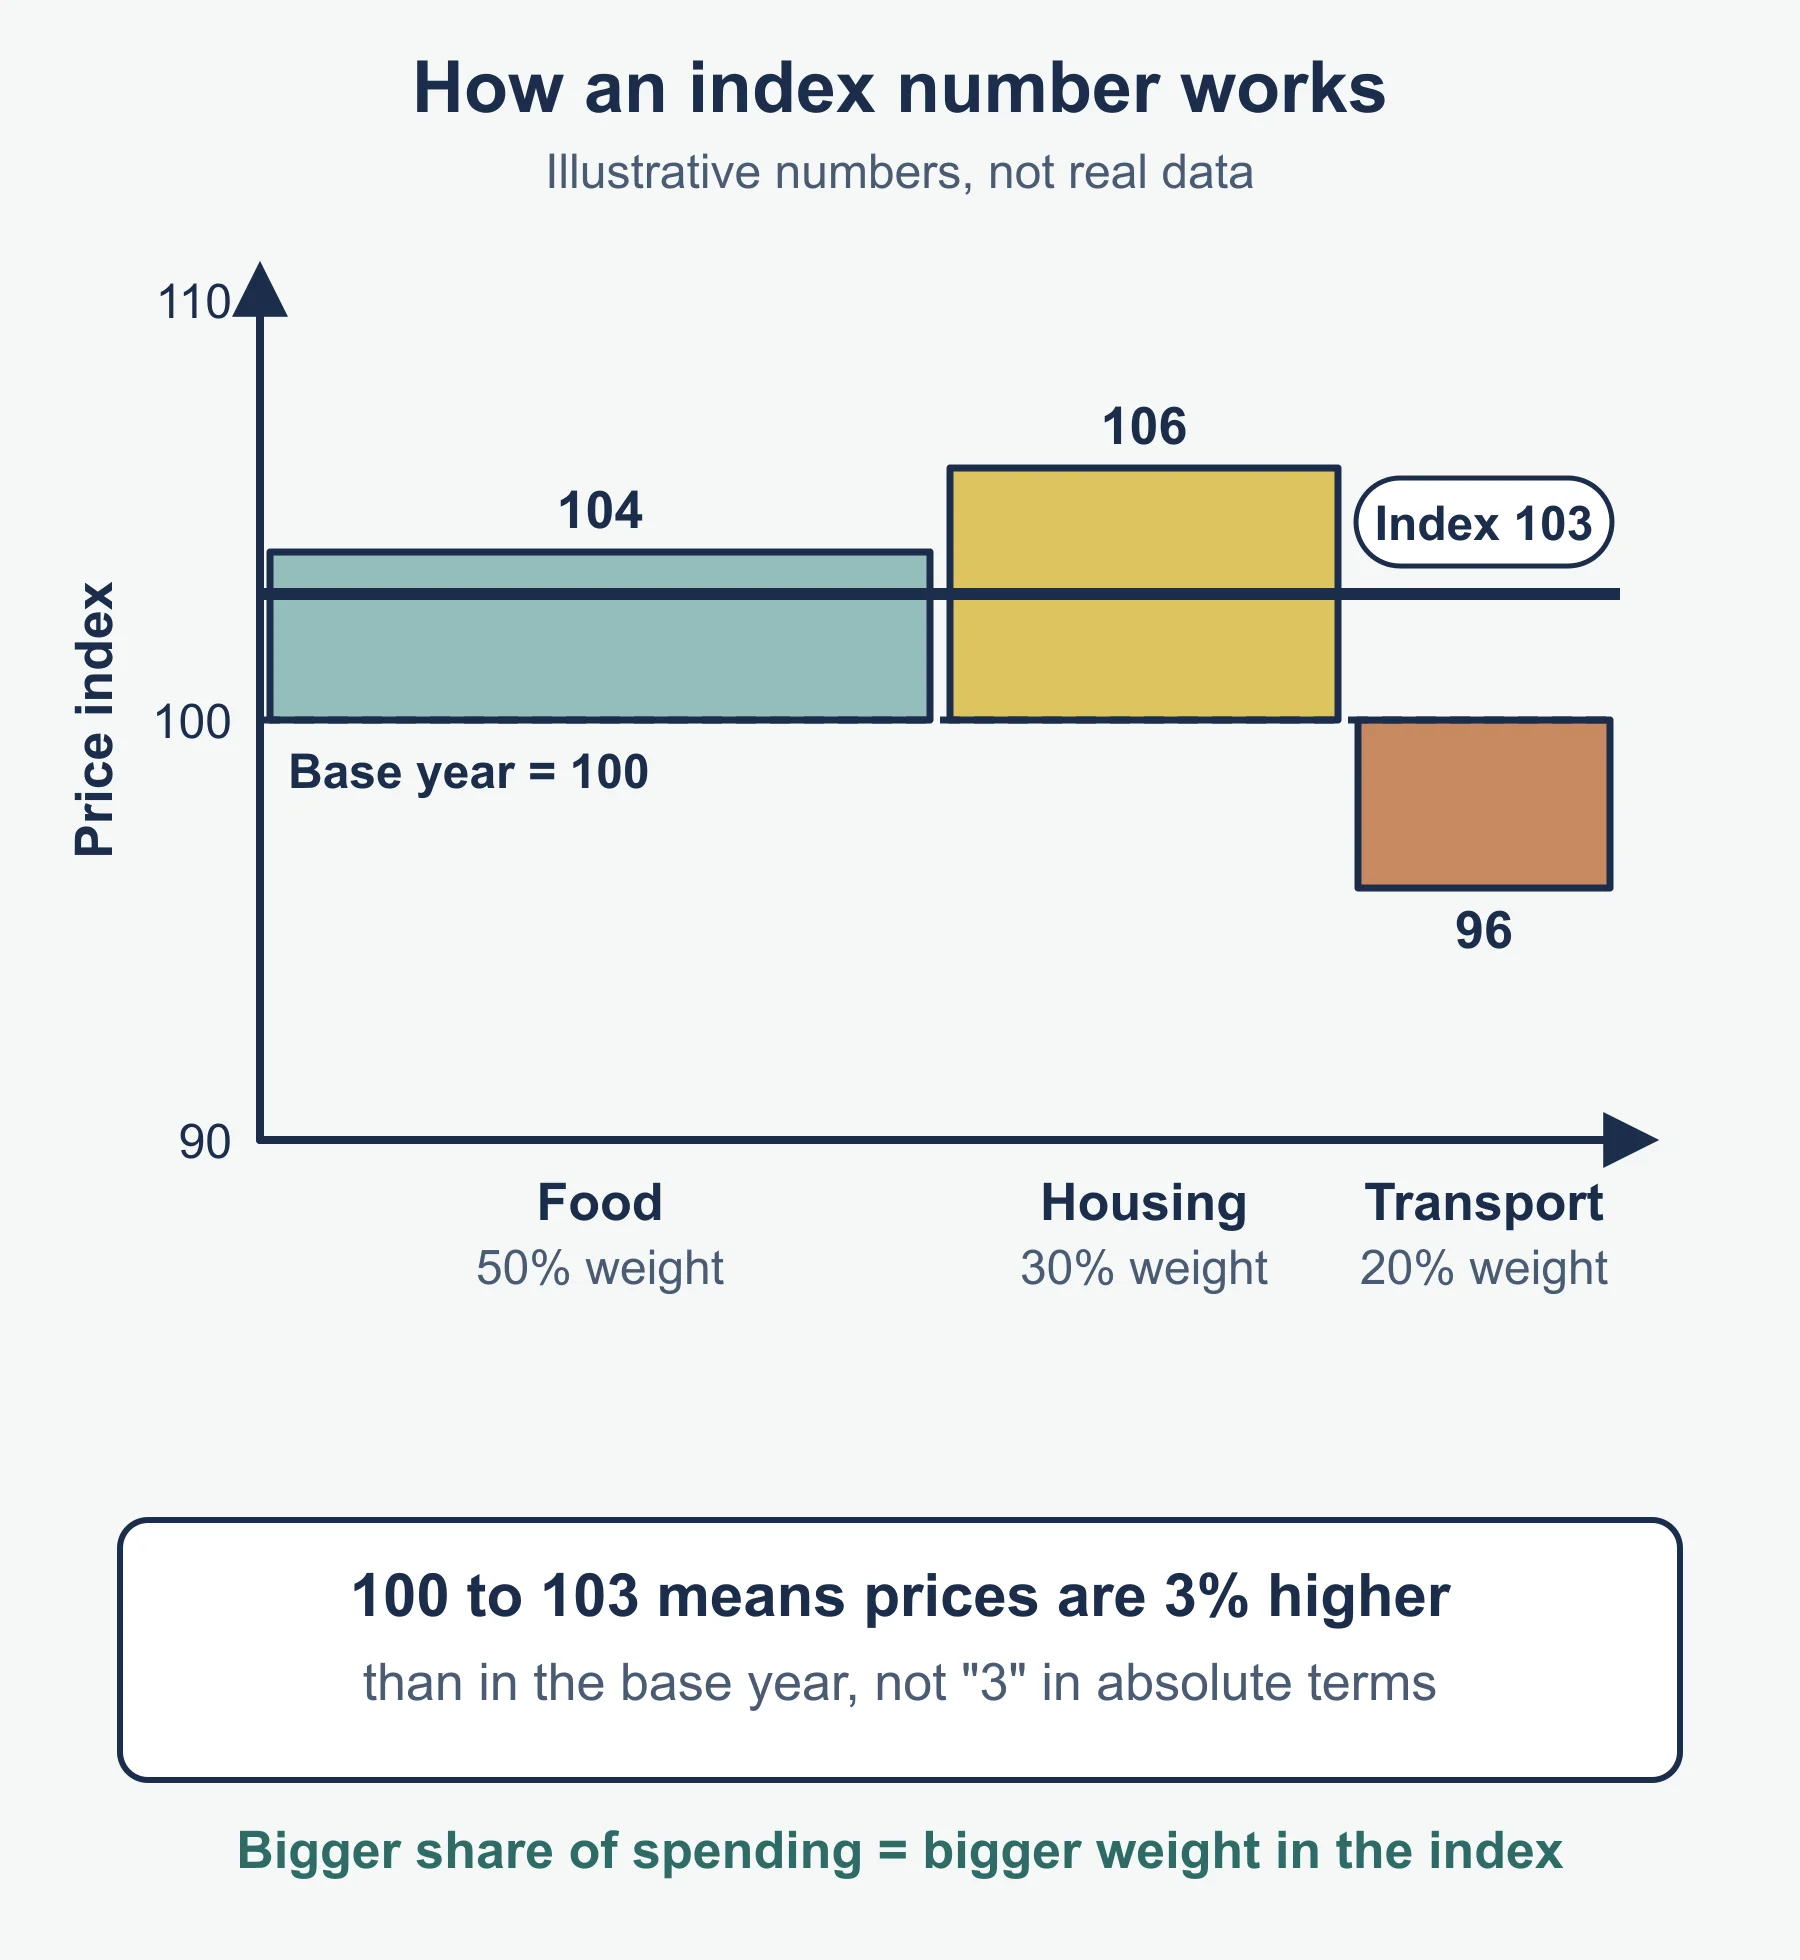
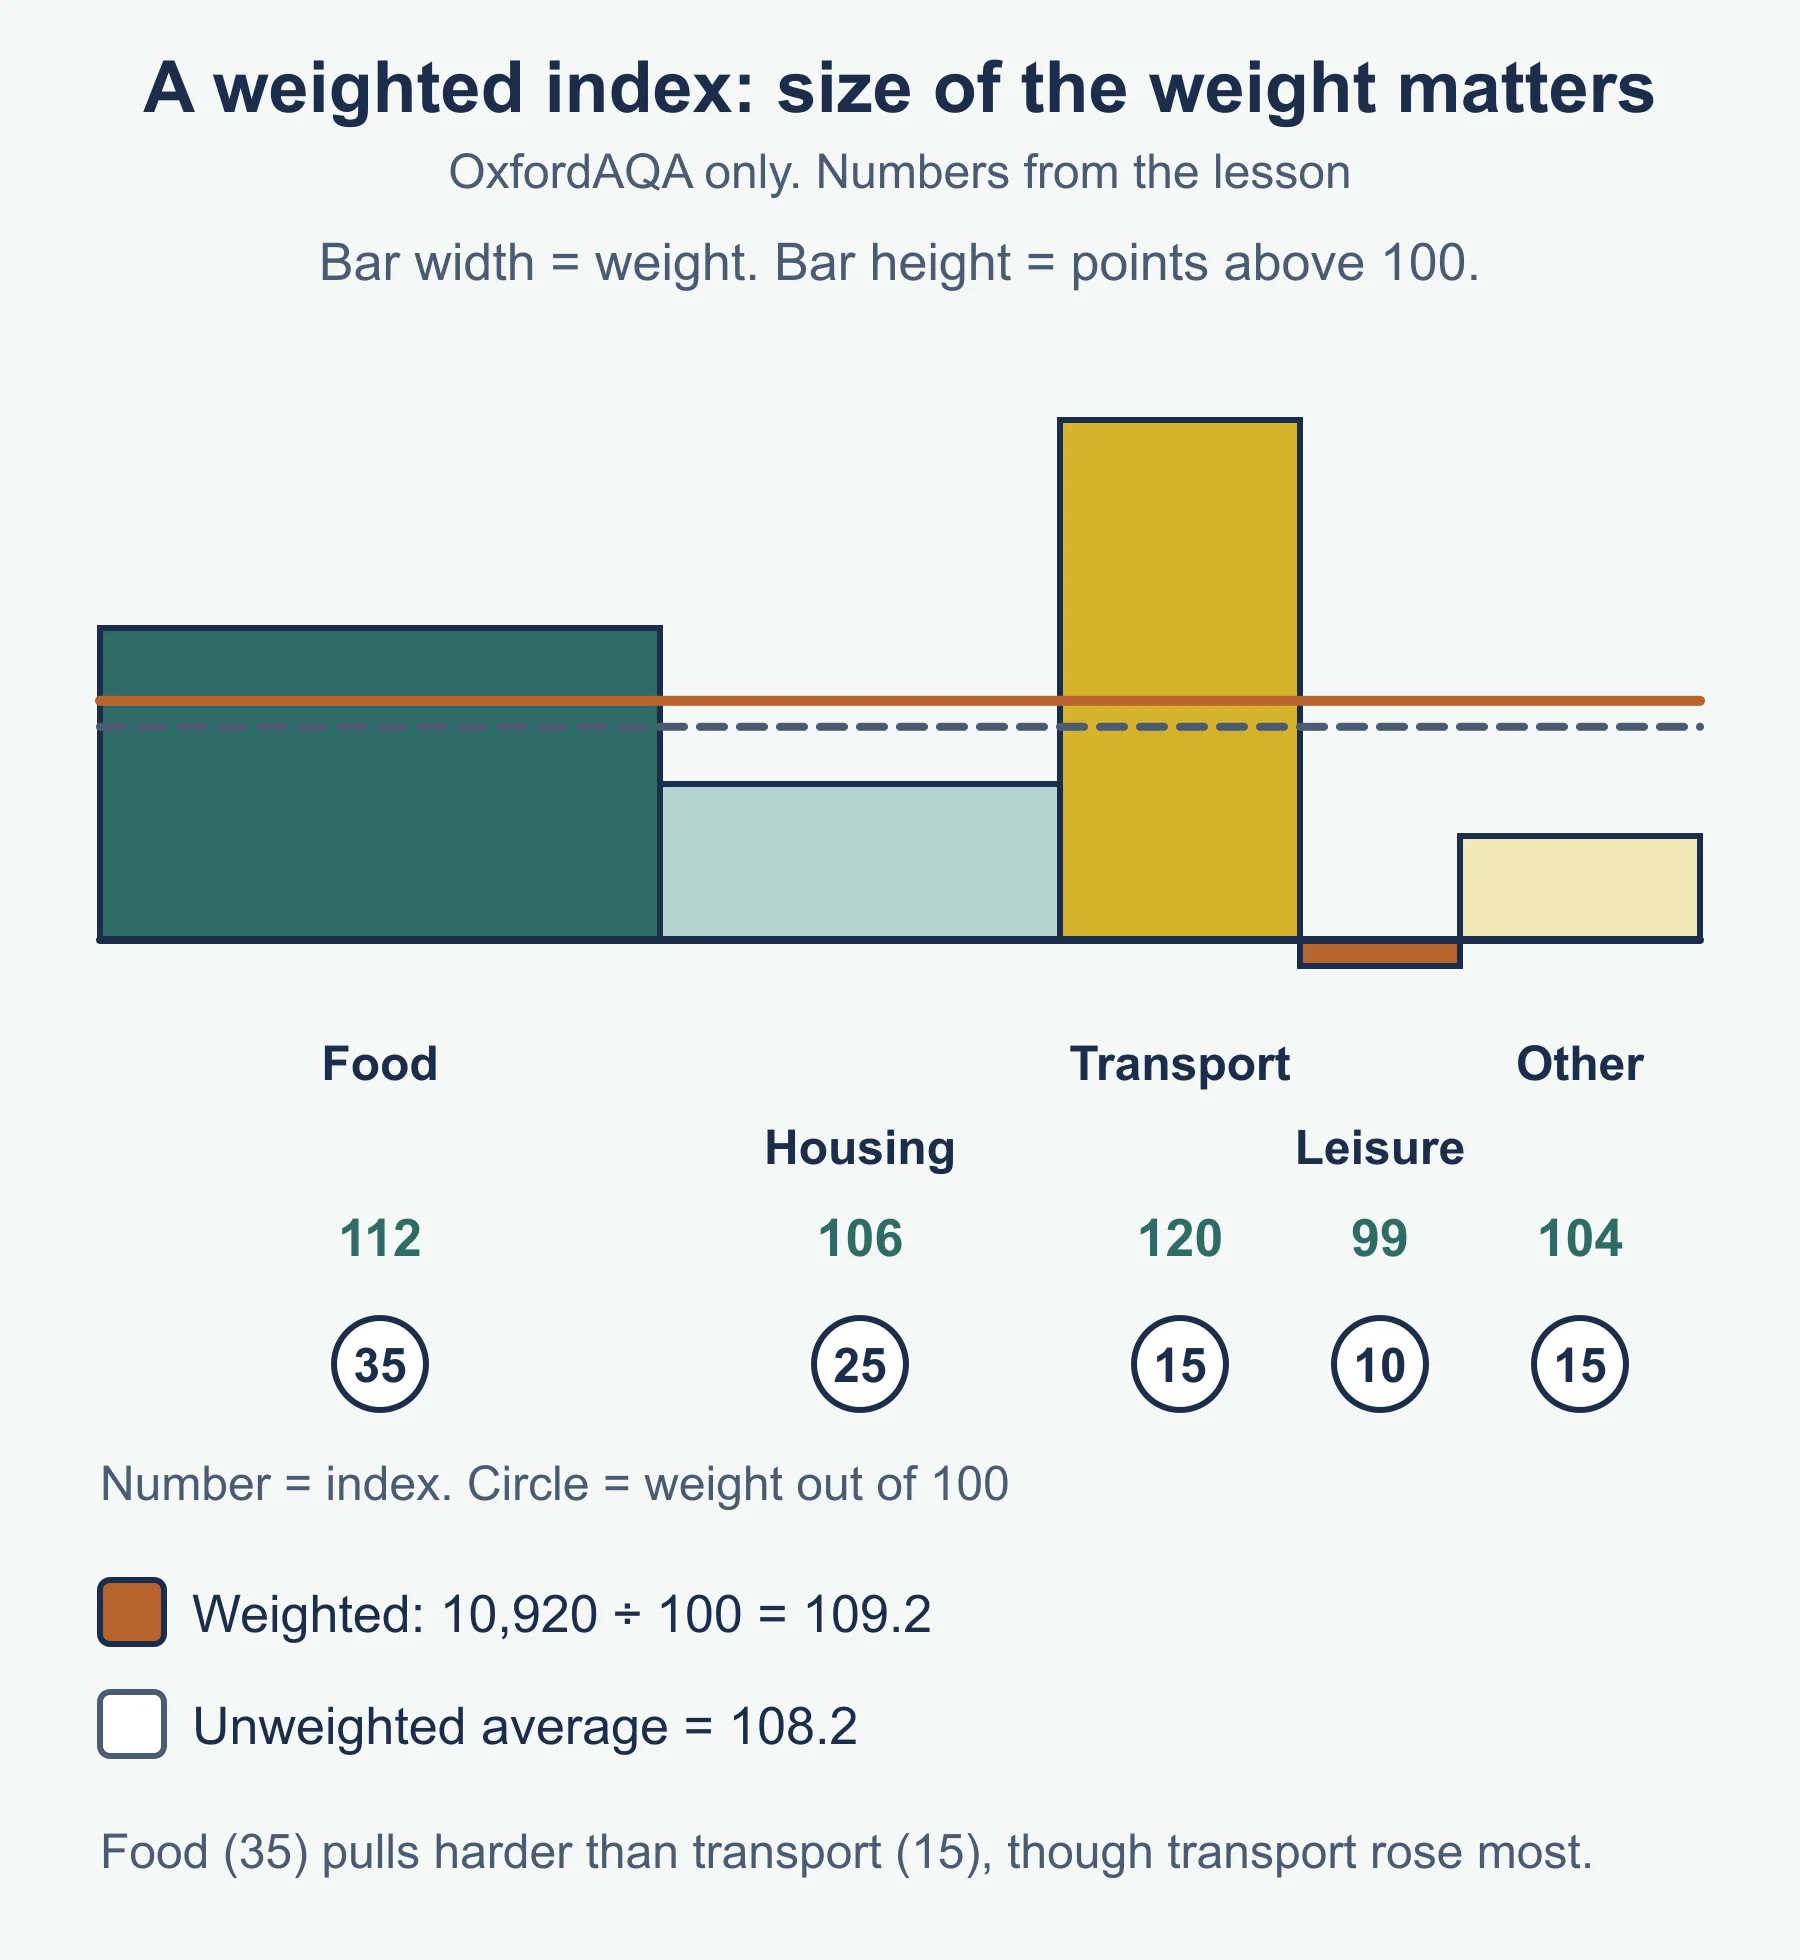
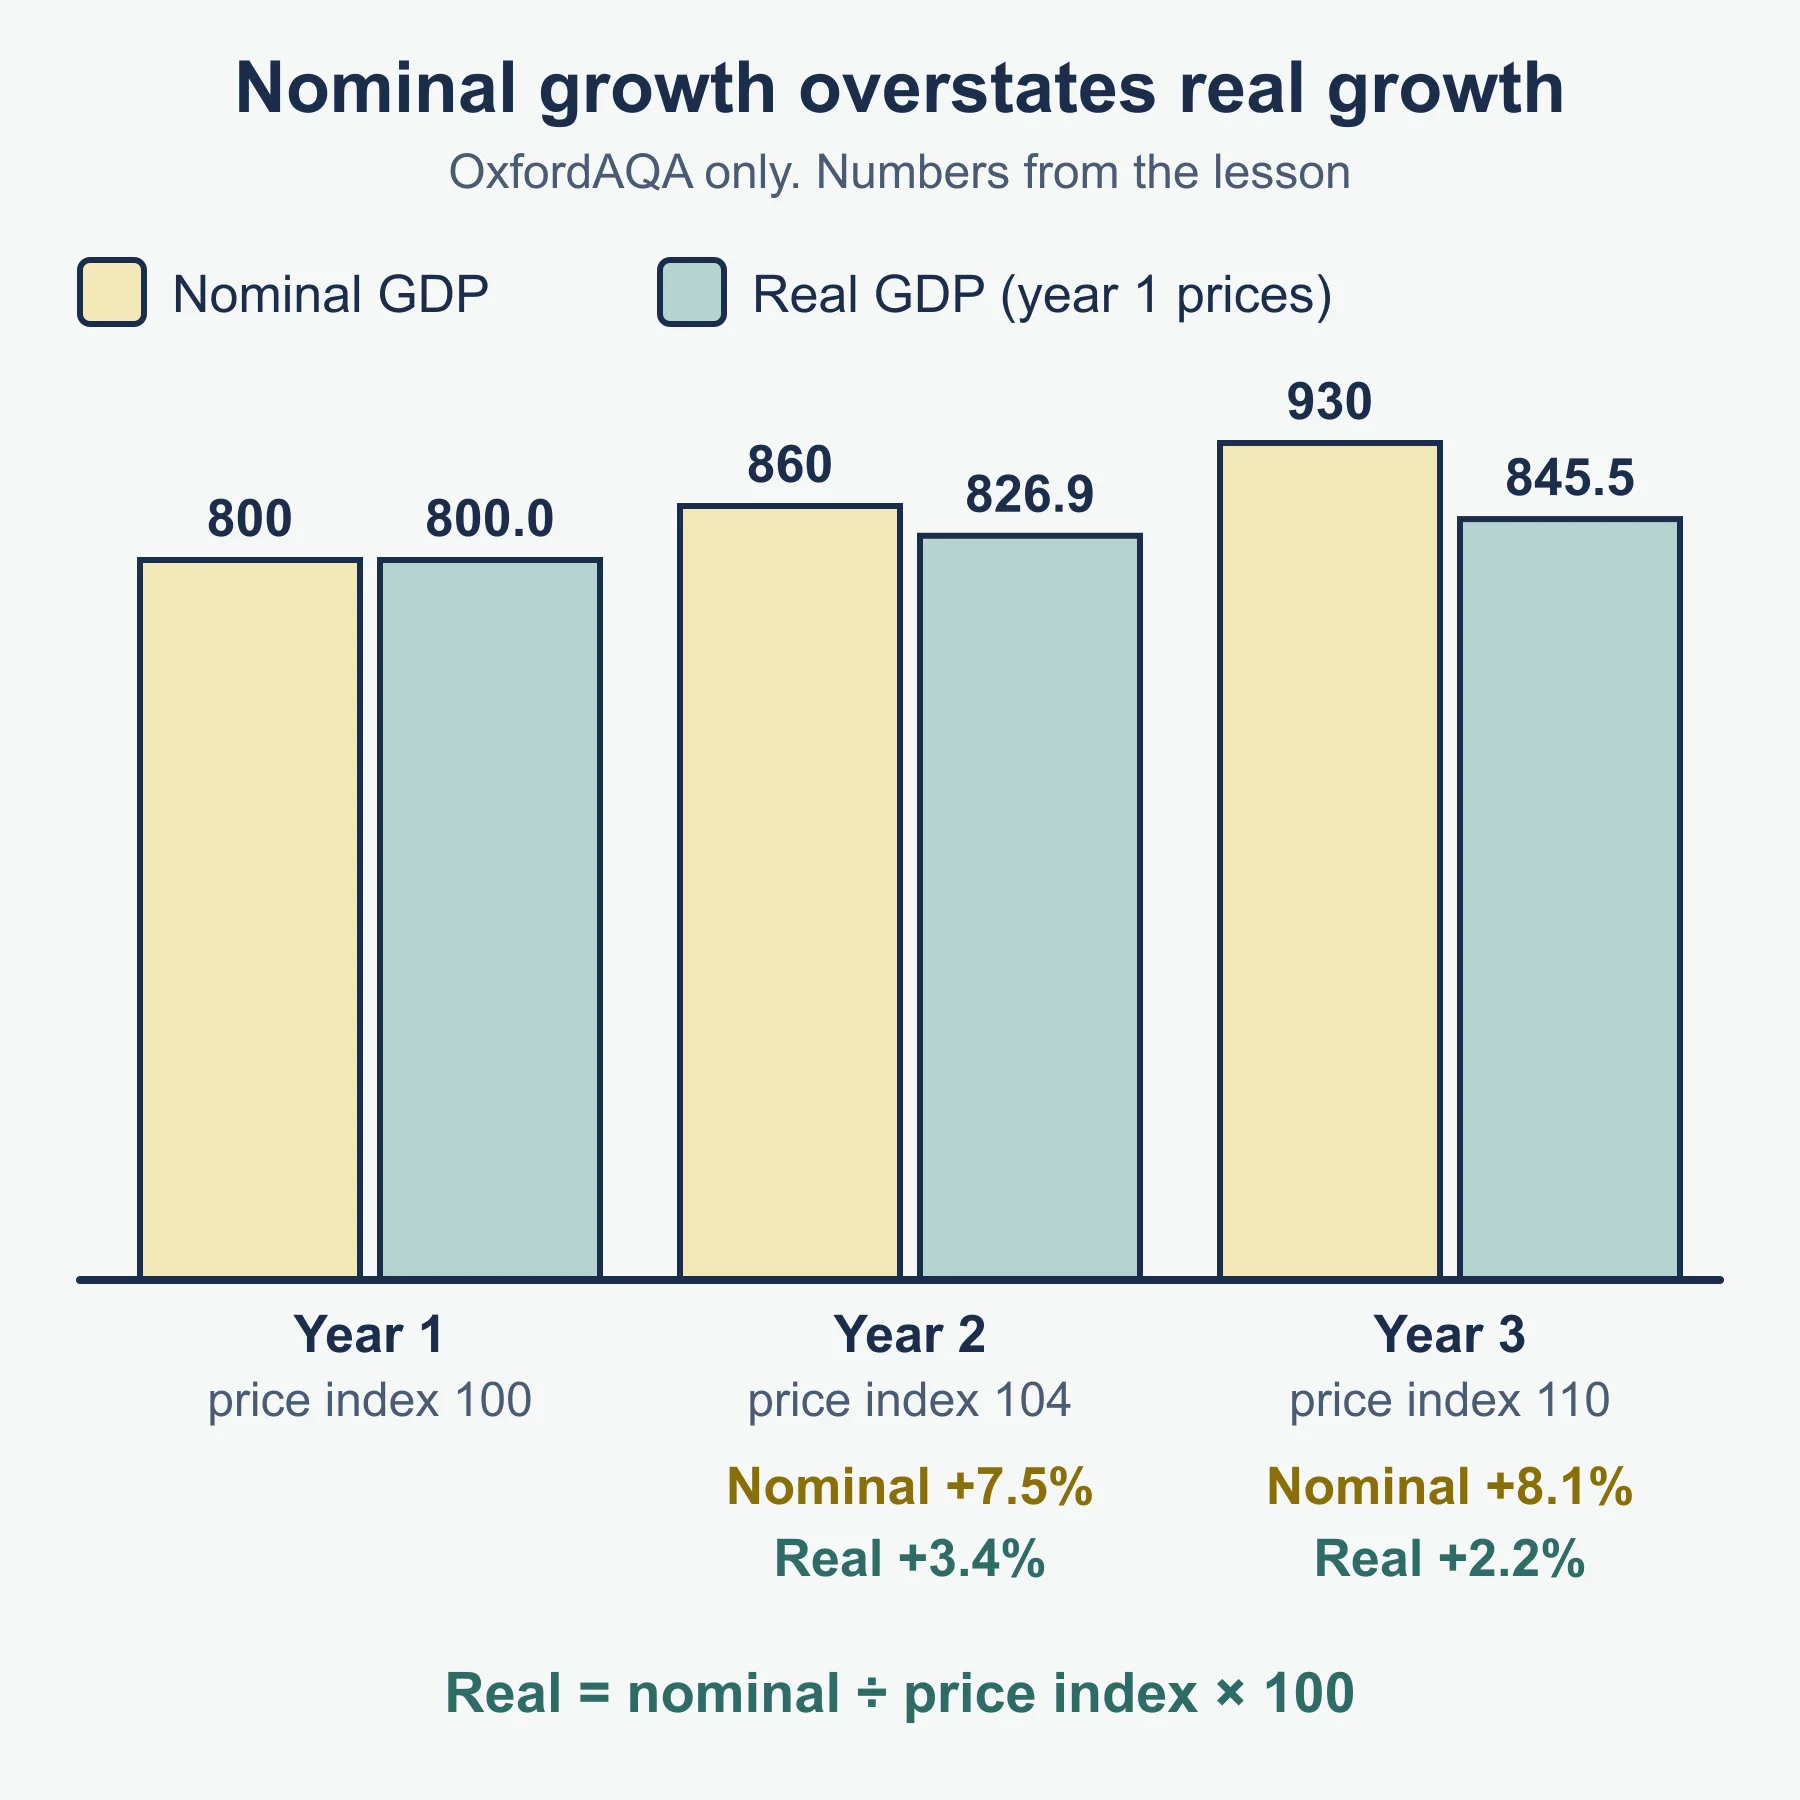
Nominal data = value in the prices of the year recorded. Real data = adjusted to remove inflation, so genuine change over time can be compared. Index numbers measure proportional change, anchored to a base year (value = 100) and built from weighted components — components with a larger share of what’s measured carry more influence on the index value.
Worked example: matching indicator to objective
Objective:      equitable distribution of income and wealth
Indicator:      Gini coefficient
Justification:  directly measures inequality across the whole
                population in a single 0-to-1 value, unlike an
                aggregate measure such as real GDP, which reflects
                output but says nothing about how it is distributed
This objective-indicator-justification structure applies to every pairing in this sub-topic, not just this example — practise it for each row of the table above.
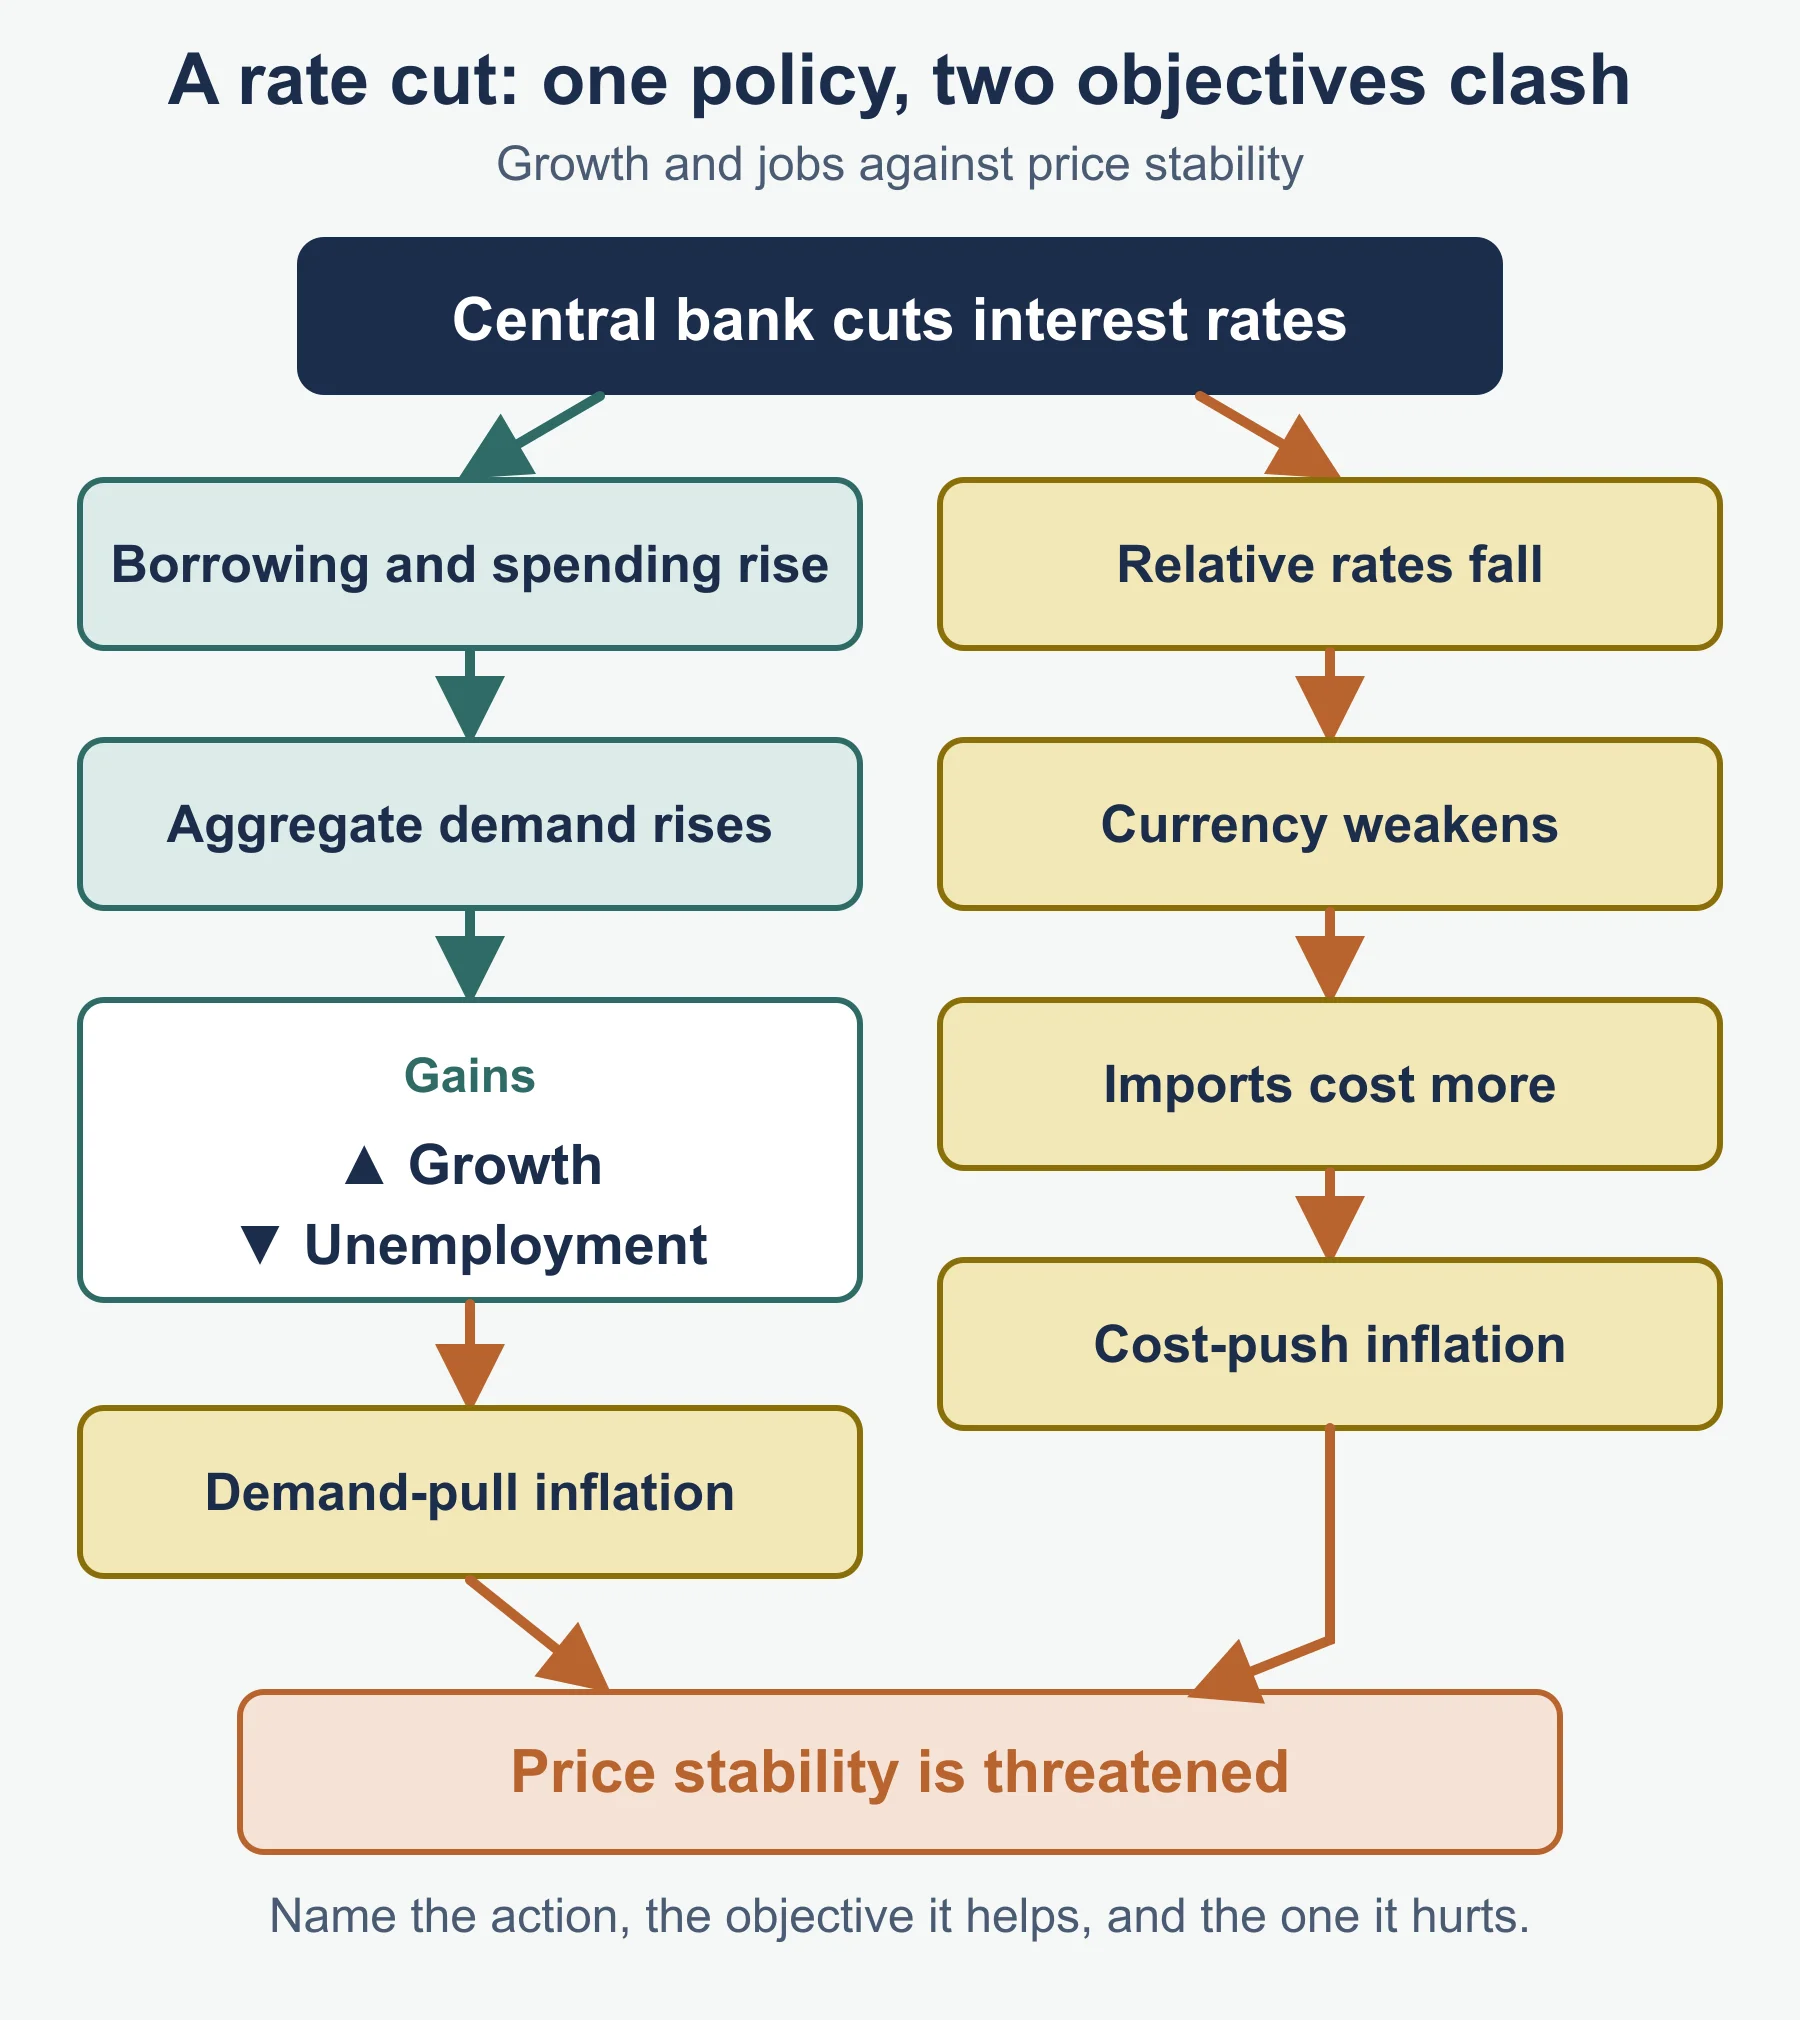
Worked example: a conflict between objectives
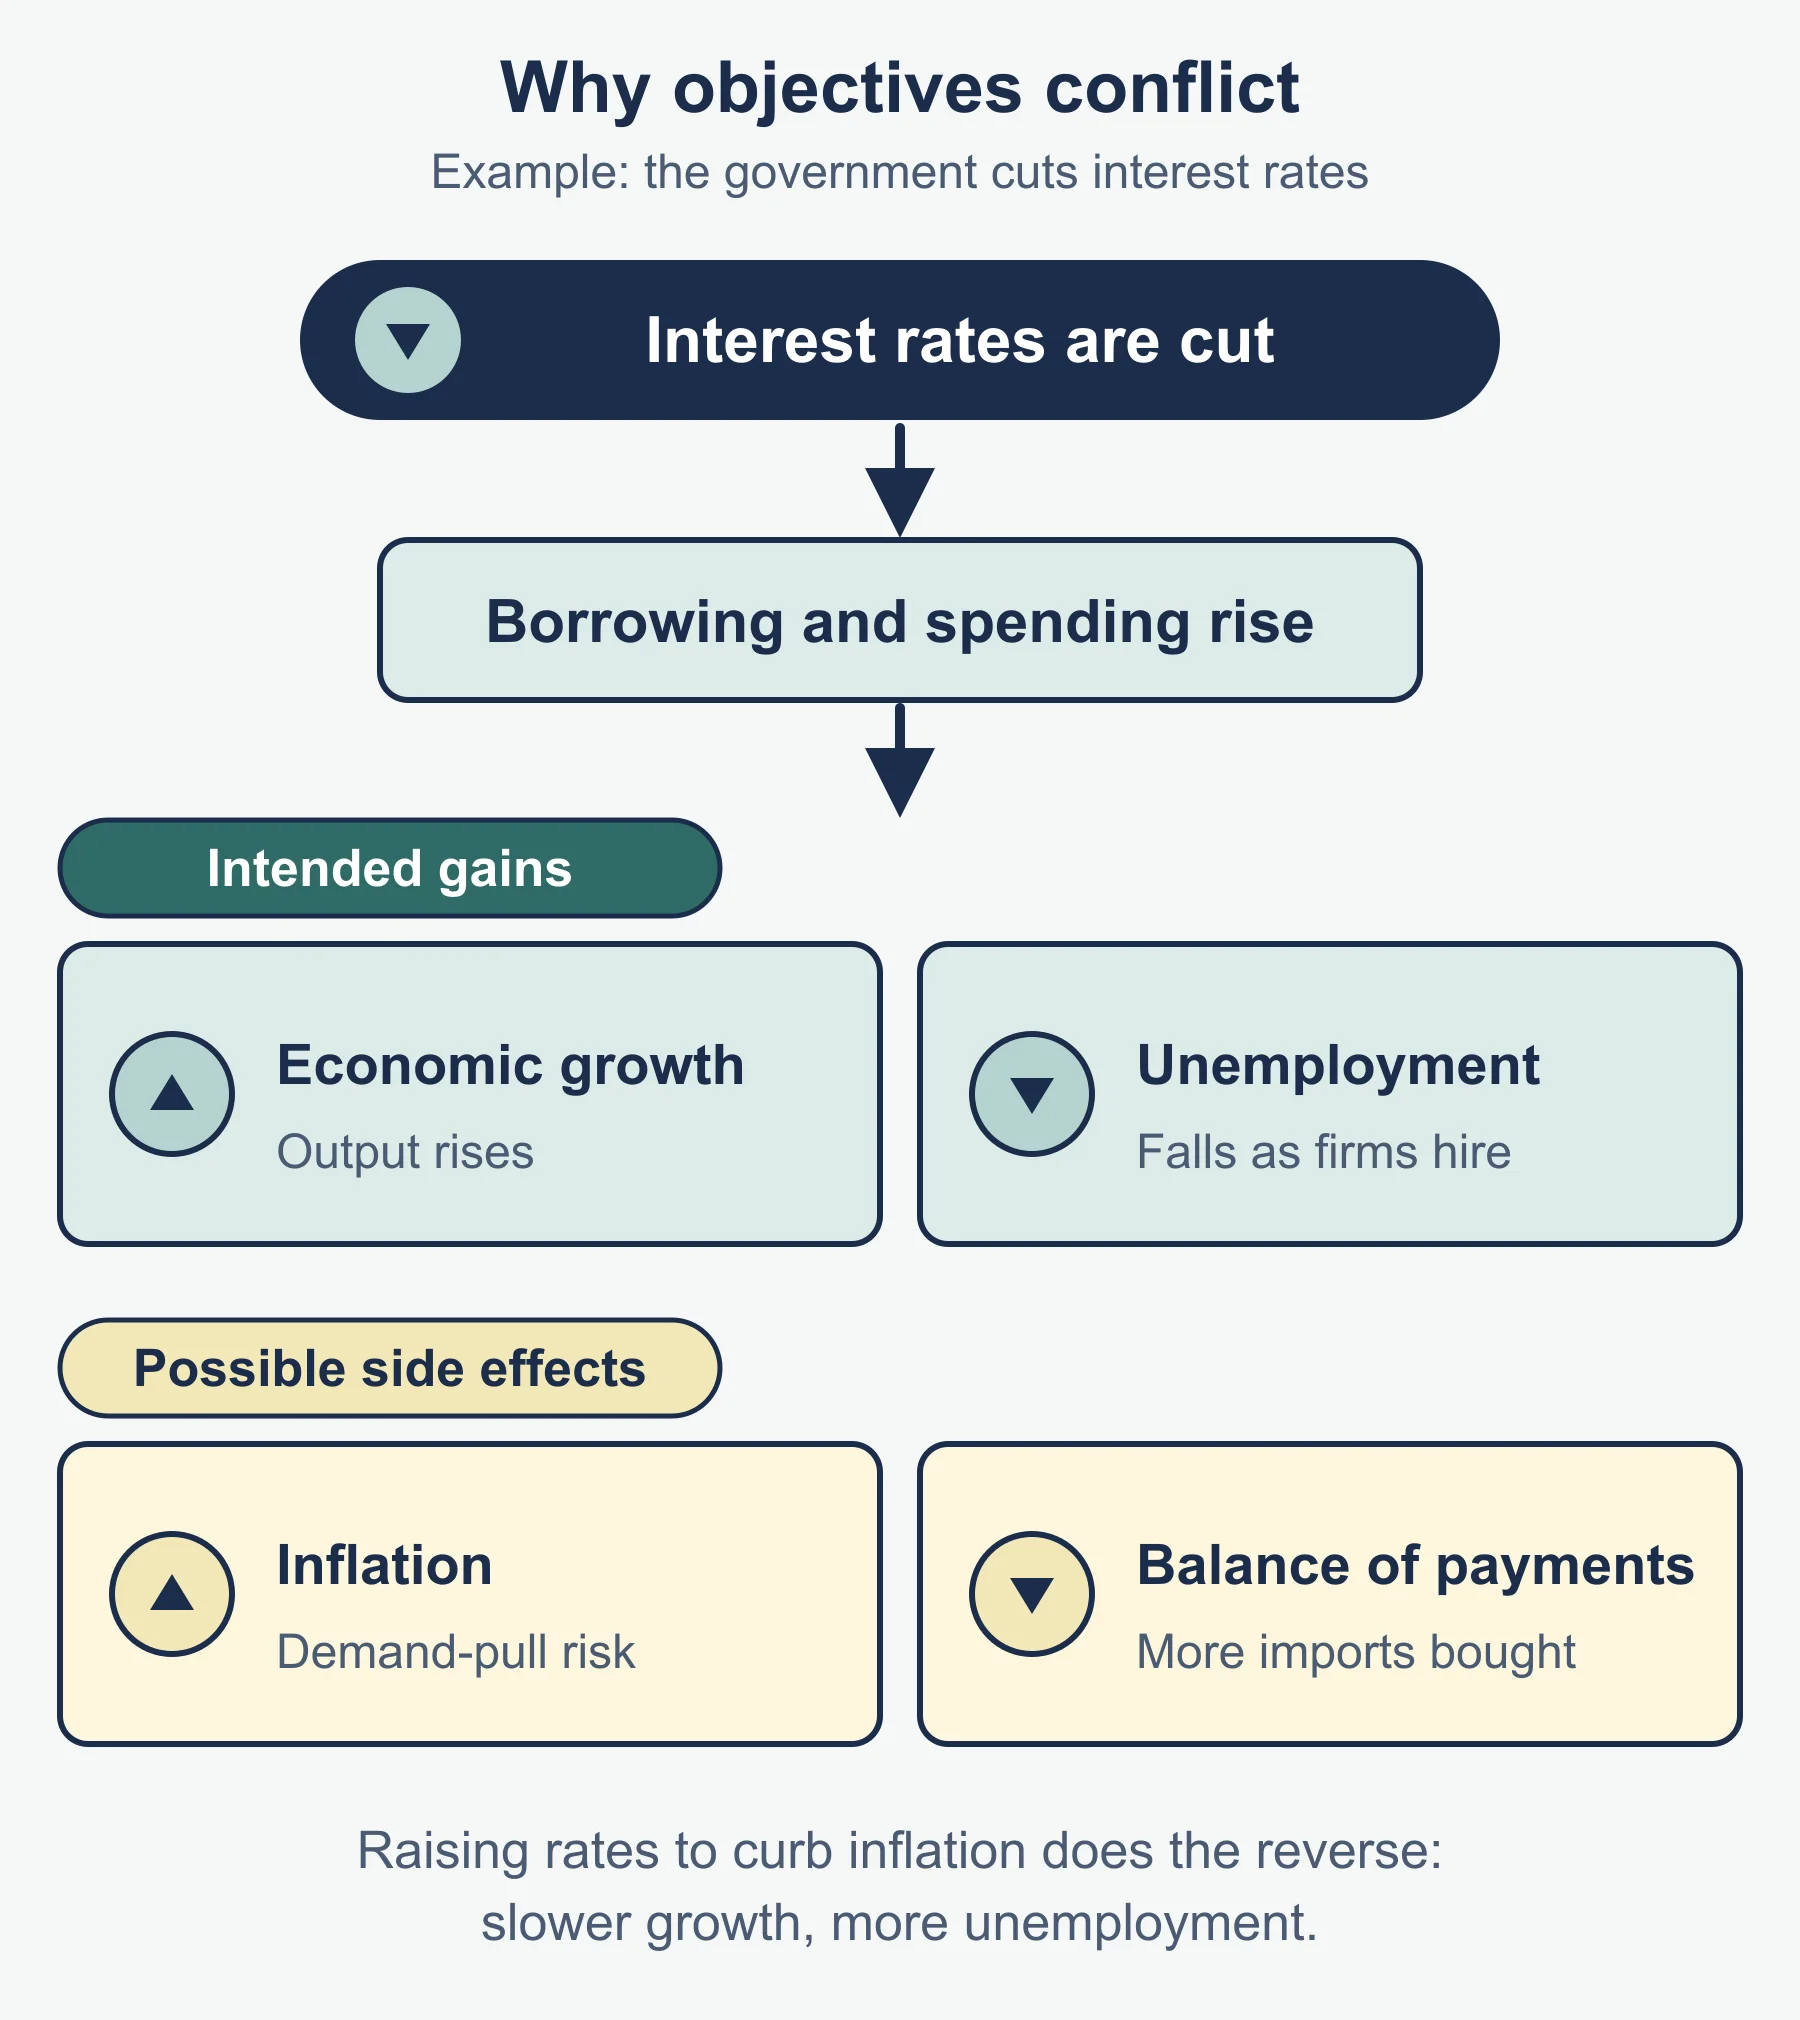
A government cuts interest rates to boost economic growth and reduce unemployment.
Objective pursued:   economic growth / minimising unemployment
                     (lower rates encourage borrowing, investment
                     and consumer spending)
Objective threatened: price stability -- higher spending can push
                     demand-pull inflation above target, and a
                     weaker currency (if rates fall relative to
                     other countries) can raise import prices,
                     adding cost-push inflationary pressure
Being able to name a specific policy action, state which objective it advances, and explain the mechanism by which it threatens a second objective is exactly the applied skill 3.2.1.1 tests – a list of objectives alone does not answer this kind of question.
Calculating an index number
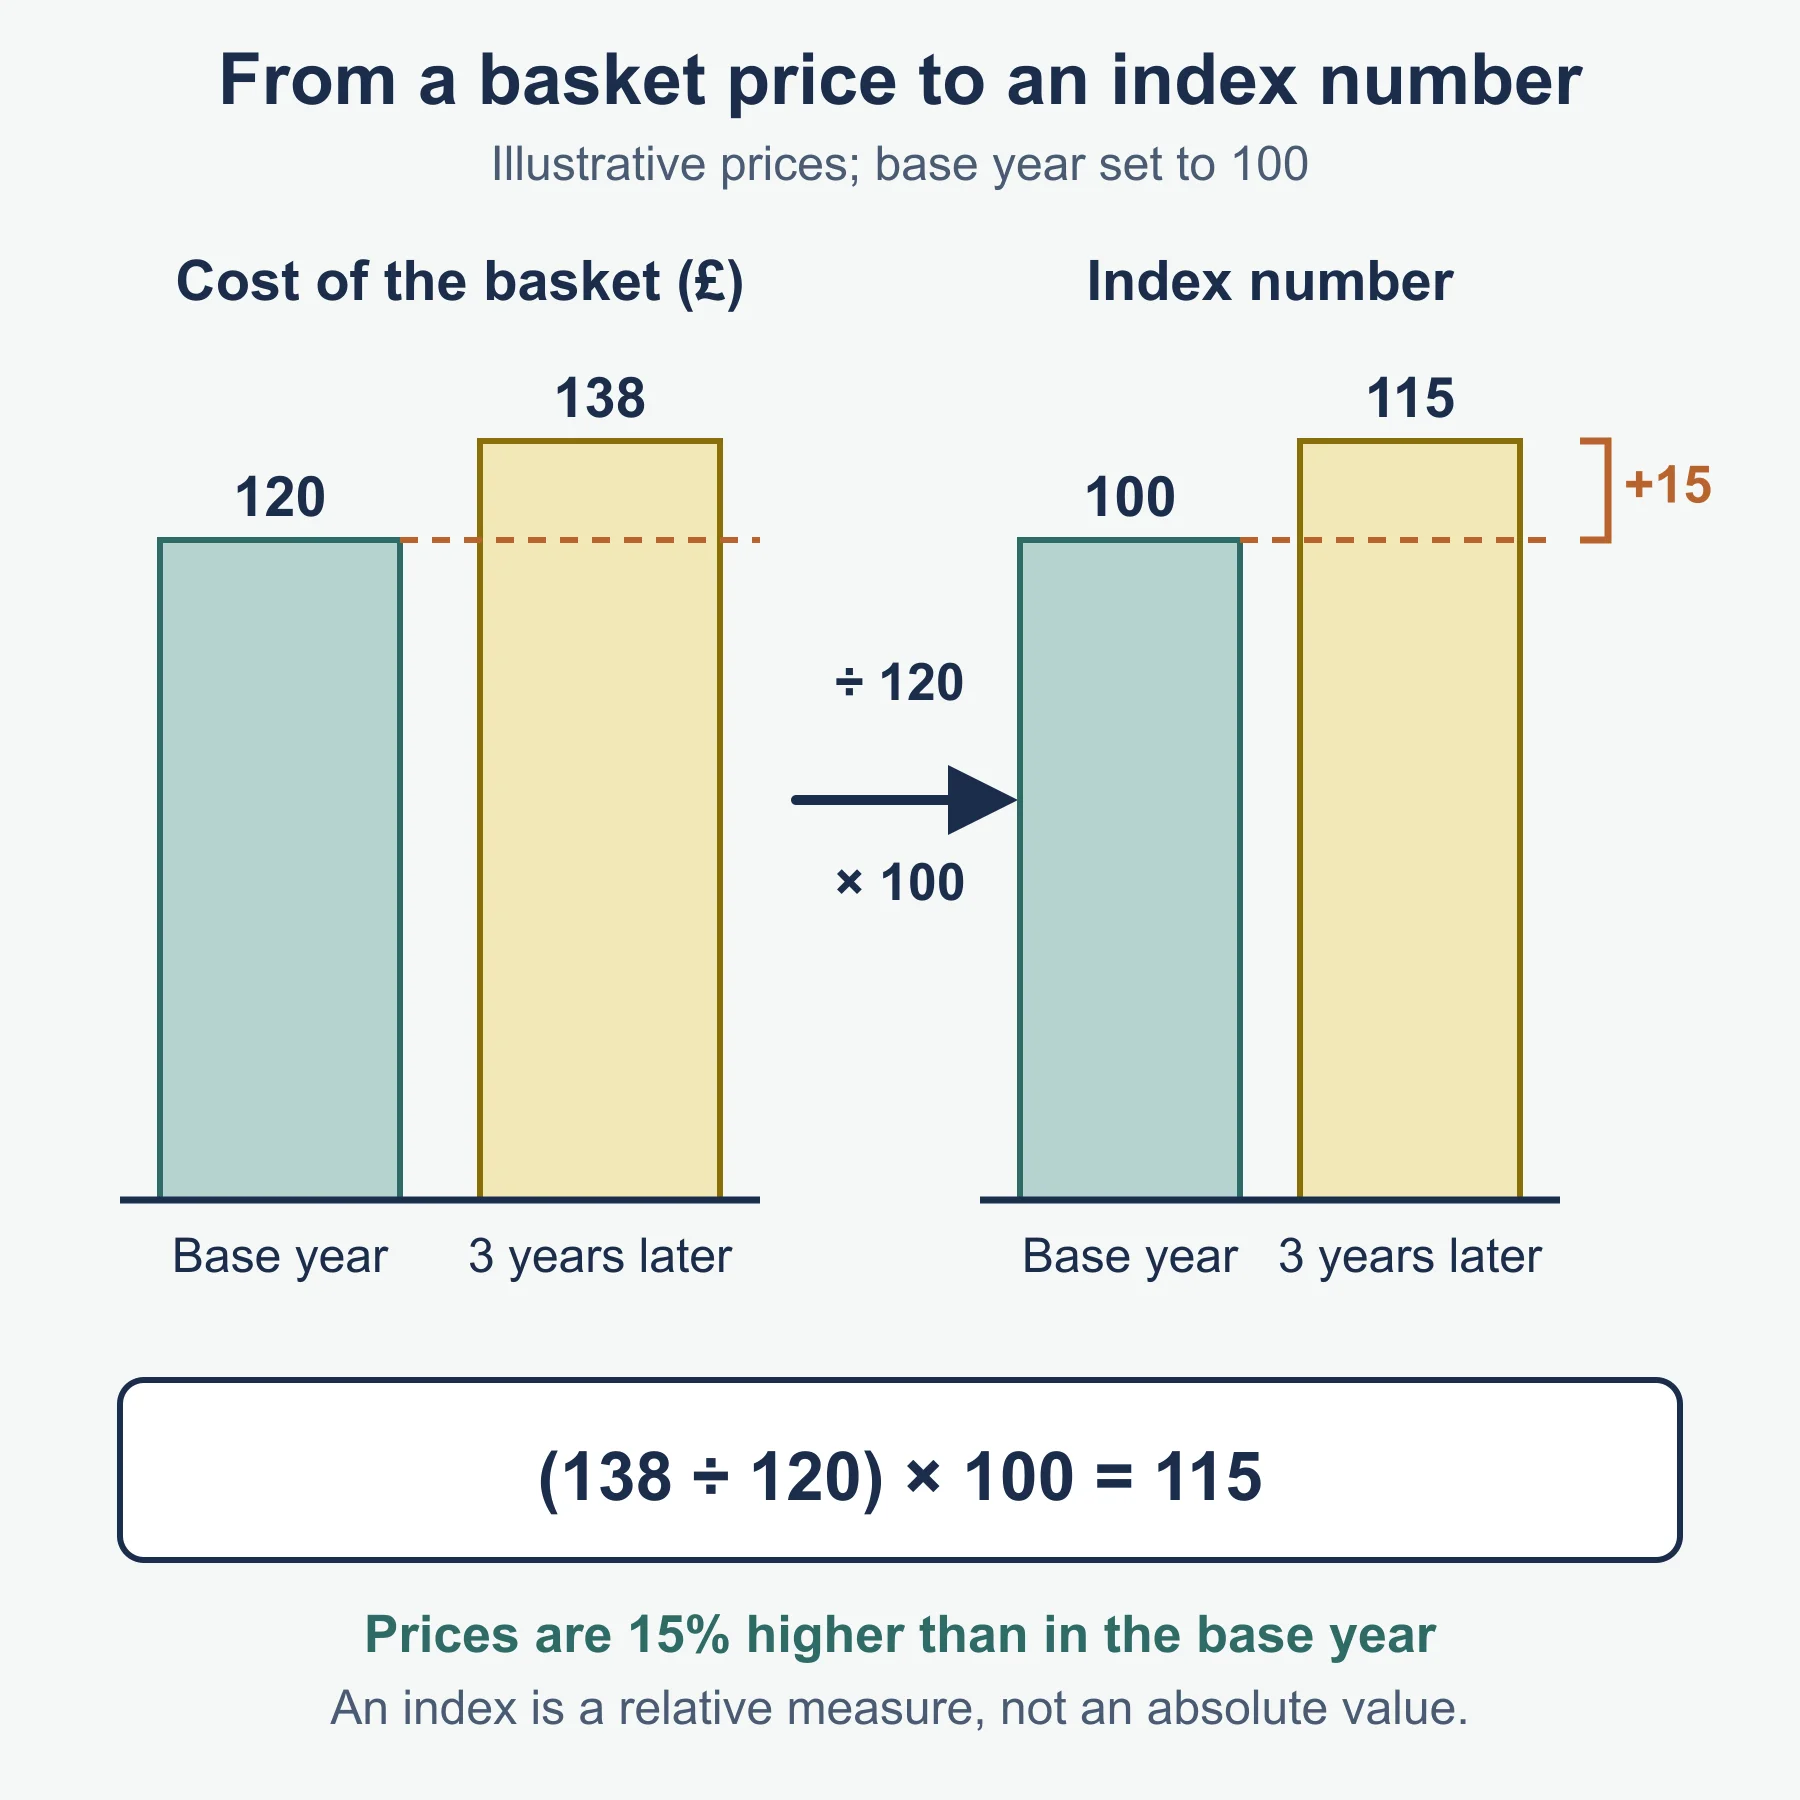
Index numbers let you compare a variable across years relative to a fixed base year, rather than comparing raw values directly.
Index number = (value in given year / value in base year) x 100

Example: a price index has a base year value of 120 (set to 100).
Three years later the same basket costs 138.
Index number = (138 / 120) x 100 = 115

Interpretation: prices have risen by 15% relative to the base year.
Practise this calculation directly rather than only reciting the definition, since exam questions frequently ask for the index value itself, not just an explanation of what an index number is.
Key terms
Real GDP — output in constant prices, adjusted to remove inflation. Nominal data — a value in the prices of the period recorded, unadjusted. Gini coefficient — a summary measure of income/wealth inequality, 0 (perfect equality) to 1 (perfect inequality). Base year — the reference year in an index series, given value 100. Weighting — the relative importance given to a component within a composite index.
Common mistakes
- Naming only the four headline objectives and omitting the three additional ones this specification names.
- Confusing real and nominal data, or not explaining why the distinction matters when comparing performance over time.
- Treating the Gini coefficient as interchangeable with “inequality” generally, without stating its 0-to-1 scale.
- Describing an index number as an absolute value rather than a relative measure anchored to a base year.
Quick self-test
- Name the four core objectives of government macroeconomic policy.
- Name the three additional objectives this specification includes.
- Which indicator best measures an equitable distribution of income, and why?
- What does a base year of 100 in an index series represent?
- Explain the difference between real and nominal GDP.
Answers: 1. Economic growth, price stability, minimising unemployment, stable balance of payments. 2. Balancing the budget, equitable distribution of income and wealth, protecting the environment. 3. The Gini coefficient, because it directly summarises income/wealth inequality across the population in a single value, unlike an aggregate output measure. 4. The reference point against which proportional change in later years is measured. 5. Nominal GDP is measured in the prices of the year recorded; real GDP is adjusted to remove the effect of inflation, allowing genuine comparison of output over time.
How this connects forward
This sub-topic’s indicators and objectives recur throughout the rest of Topic 2 (The National Economy in a Global Environment), since later sub-topics on fiscal and monetary policy are assessed against exactly these objectives – a policy is judged “successful” by whether it moves the named indicators toward the stated objectives without triggering an unacceptable conflict elsewhere. Treat the objective-indicator pairing built here as a tool you will reuse for the rest of the topic, not content specific to 3.2.1 alone.
Related resources
- Measurement of Macroeconomic Performance study guide
- Measurement of Macroeconomic Performance practice questions
Frequently asked questions
What does the Gini coefficient measure? The Gini coefficient is a summary measure of income or wealth inequality, on a scale from 0 (perfect equality) to 1 (perfect inequality). It is the indicator used for the objective of an equitable distribution of income.
Why are weights used in an index number? A composite index is built from weighted components, so components with a larger share of what is being measured have more influence on the index value. An index measures proportional change from a base year, not an absolute value.
How can government macroeconomic objectives conflict? A policy that advances one objective can threaten another. For example, cutting interest rates to boost economic growth and reduce unemployment can work against price stability, so explain the mechanism rather than just listing objectives.
Why do these indicators matter for later topics? Later topics on fiscal and monetary policy are assessed against these objectives. A policy is judged successful by whether it moves the named indicators towards the objectives without causing an unacceptable conflict elsewhere.
Which part of the OxfordAQA 9640 specification covers macroeconomic performance? Sub-topic 3.2.1 of the OxfordAQA International AS and A-level Economics (9640) specification, which covers government macroeconomic objectives (3.2.1.1) and the indicators and index numbers used to measure them (3.2.1.2).
Official syllabus
OxfordAQA International AS and A-level Economics (9640) specification — oxfordaqa.com/9640.
Get free revision emails (optional)
Occasional emails with practice questions, worked explanations and links to free resources for the qualification and subjects you choose. No spam, and you can unsubscribe from any email. The free tools on this site never need an email.
Related resources
-
Study guides
OxfordAQA A-Level Economics: The Measurement of Macroeconomic Performance (9640)
OxfordAQA International A-level Economics (9640) 3.2.1: macroeconomic objectives and conflicts, indicators including the Gini coefficient, and index numbers.
Economics · OxfordAQA · AS Level
Read guide -
Practice questions
OxfordAQA A Level Economics: Measurement of Macroeconomic Performance — Practice Questions
Practice questions with worked answers on macroeconomic objectives, indicators, the Gini coefficient and index numbers for OxfordAQA A-level Economics 9640.
Economics · OxfordAQA · AS Level
Try questions -
Study guides
OxfordAQA International AS and A-level Economics: Market failure, public goods and externalities (9640)
Study guide to market failure, public and quasi-public goods, the commons and externalities for OxfordAQA International AS and A-level Economics.
Economics · OxfordAQA · AS Level
Read guide
Related articles
-
teaching
A Level tuition in Dubai: Cambridge or Pearson Edexcel International A Level?
Schools in Dubai and Abu Dhabi teach either Cambridge International AS & A Level or Pearson Edexcel International A Level. How the two are structured, why it matters for tuition, and how online classes from Lahore work.
9 October 2026
-
curriculum guides
Choosing subjects at IGCSE and A Level
How subject choices at 14 and 16 affect university options later, and how to keep pathways open without overloading a timetable.
28 July 2026
Studying this with a teacher
Working through Economics AS LEVEL?
This page is free and stays free. If you would rather be taught it, Marlbridge runs Economics classes one-to-one and in small groups of up to 15, online in your own time zone. The first trial class is free. WhatsApp replies within an hour (8am–11pm Pakistan time, every day); email the same day.
OxfordAQA Economics teachers at Marlbridge
