Study Guides
A Level Accounting: Analysis and communication of accounting information (A Level) (Cambridge 9706)
Working capital cycle, gearing, interest cover and investor ratios worked through with one company, with analysis and advice, for Cambridge 9706 A Level.
- Subject
- Accounting
- Level
- A LEVEL
- Topic
- Financial accounting
- Author
- Marlbridge Academic Team
- Updated
- Reviewed by
- Zain Ud Din Ahmed (what this means)
Aligned to Cambridge A Level Accounting (9706), 2026-2028. Official specification .
Syllabus page (what it covers and how it is assessed): Cambridge A Level Accounting.
Syllabus points this page covers
9706 (A Level)
- 3.5 Analysis and communication of accounting information
Found an error? Report a correction.
Need help with this topic? Request a free trial class for A Level Accounting (9706).
This guide covers section 3.5 Analysis and communication of accounting information (A Level), from topic 3, Financial accounting, in the Cambridge International AS & A Level Accounting 9706 syllabus for 2026, 2027 and 2028. It is A Level content, examined on Paper 3 (Financial Accounting), where each structured question comes with source material on a separate insert. AS Level content, including the ratios in section 1.6, is assumed knowledge. Use it with the course hub, the printable checklist, the revision notes, the practice questions, the exam preparation guide and the free diagnostics.
What section 3.5 asks you to do
| Outcome in the syllabus | Where this guide teaches it |
|---|---|
| Calculate working capital cycle (days) and net working assets to revenue (sales) | Working capital ratios |
| Calculate interest cover and gearing | Financing ratios |
| Calculate earnings per share, price/earnings, dividend per share, dividend yield and dividend cover | Investor ratios |
| Analyse and evaluate the results and draw conclusions | Turning figures into analysis |
| Make appropriate recommendations to stakeholders | Recommendations and improvement measures |
| Understand the interrelationships between ratios | How the ratios connect |
Rules the syllabus sets for ratio work
- The formulae in the appendix to section 3 are the only ones accepted in answers, and ratios are not given in the question paper. Learn each formula exactly.
- The syllabus says an incorrect formula is not credited, but the figure it produces is credited as your own figure when used in later calculations. A wrong formula costs that calculation only if you carry on sensibly.
- Use year-end balances unless the question specifies average figures, and give the number of decimal places the question asks for.
- Where you are asked for a recommendation or decision, support it with a balance of reasons and justify it.
- Calculators are essential for every paper.
The data used in this guide
Ardenmoor Textiles plc (an invented company) weaves curtain fabric. Amounts are in $000 unless shown per share. Interest is 12% on loan notes: the loan notes stood at 1,000 in 2025, a further 1,000 was issued on the first day of 2026, and 2026 interest also includes 40 of overdraft interest.
| 2025 | 2026 | |
|---|---|---|
| Revenue | 8,400 | 9,600 |
| Credit sales | 7,560 | 8,640 |
| Cost of sales | 5,040 | 6,048 |
| Credit purchases | 4,200 | 5,400 |
| Year-end inventories | 840 | 1,260 |
| Trade receivables | 840 | 1,296 |
| Trade payables | 560 | 600 |
| Profit from operations | 1,260 | 1,344 |
| Interest payable | 120 | 280 |
| Profit for the year (after tax) | 855 | 798 |
| Issued ordinary shares (thousands) | 3,000 | 3,000 |
| Non-current liabilities (loan notes) | 1,000 | 2,000 |
| Issued ordinary share capital | 3,000 | 3,000 |
| Reserves | 2,400 | 2,928 |
| Interim dividend paid | 90 | 90 |
| Final dividend proposed | 180 | 120 |
| Market price per share (dollars) | 3.99 | 3.20 |
Working capital ratios
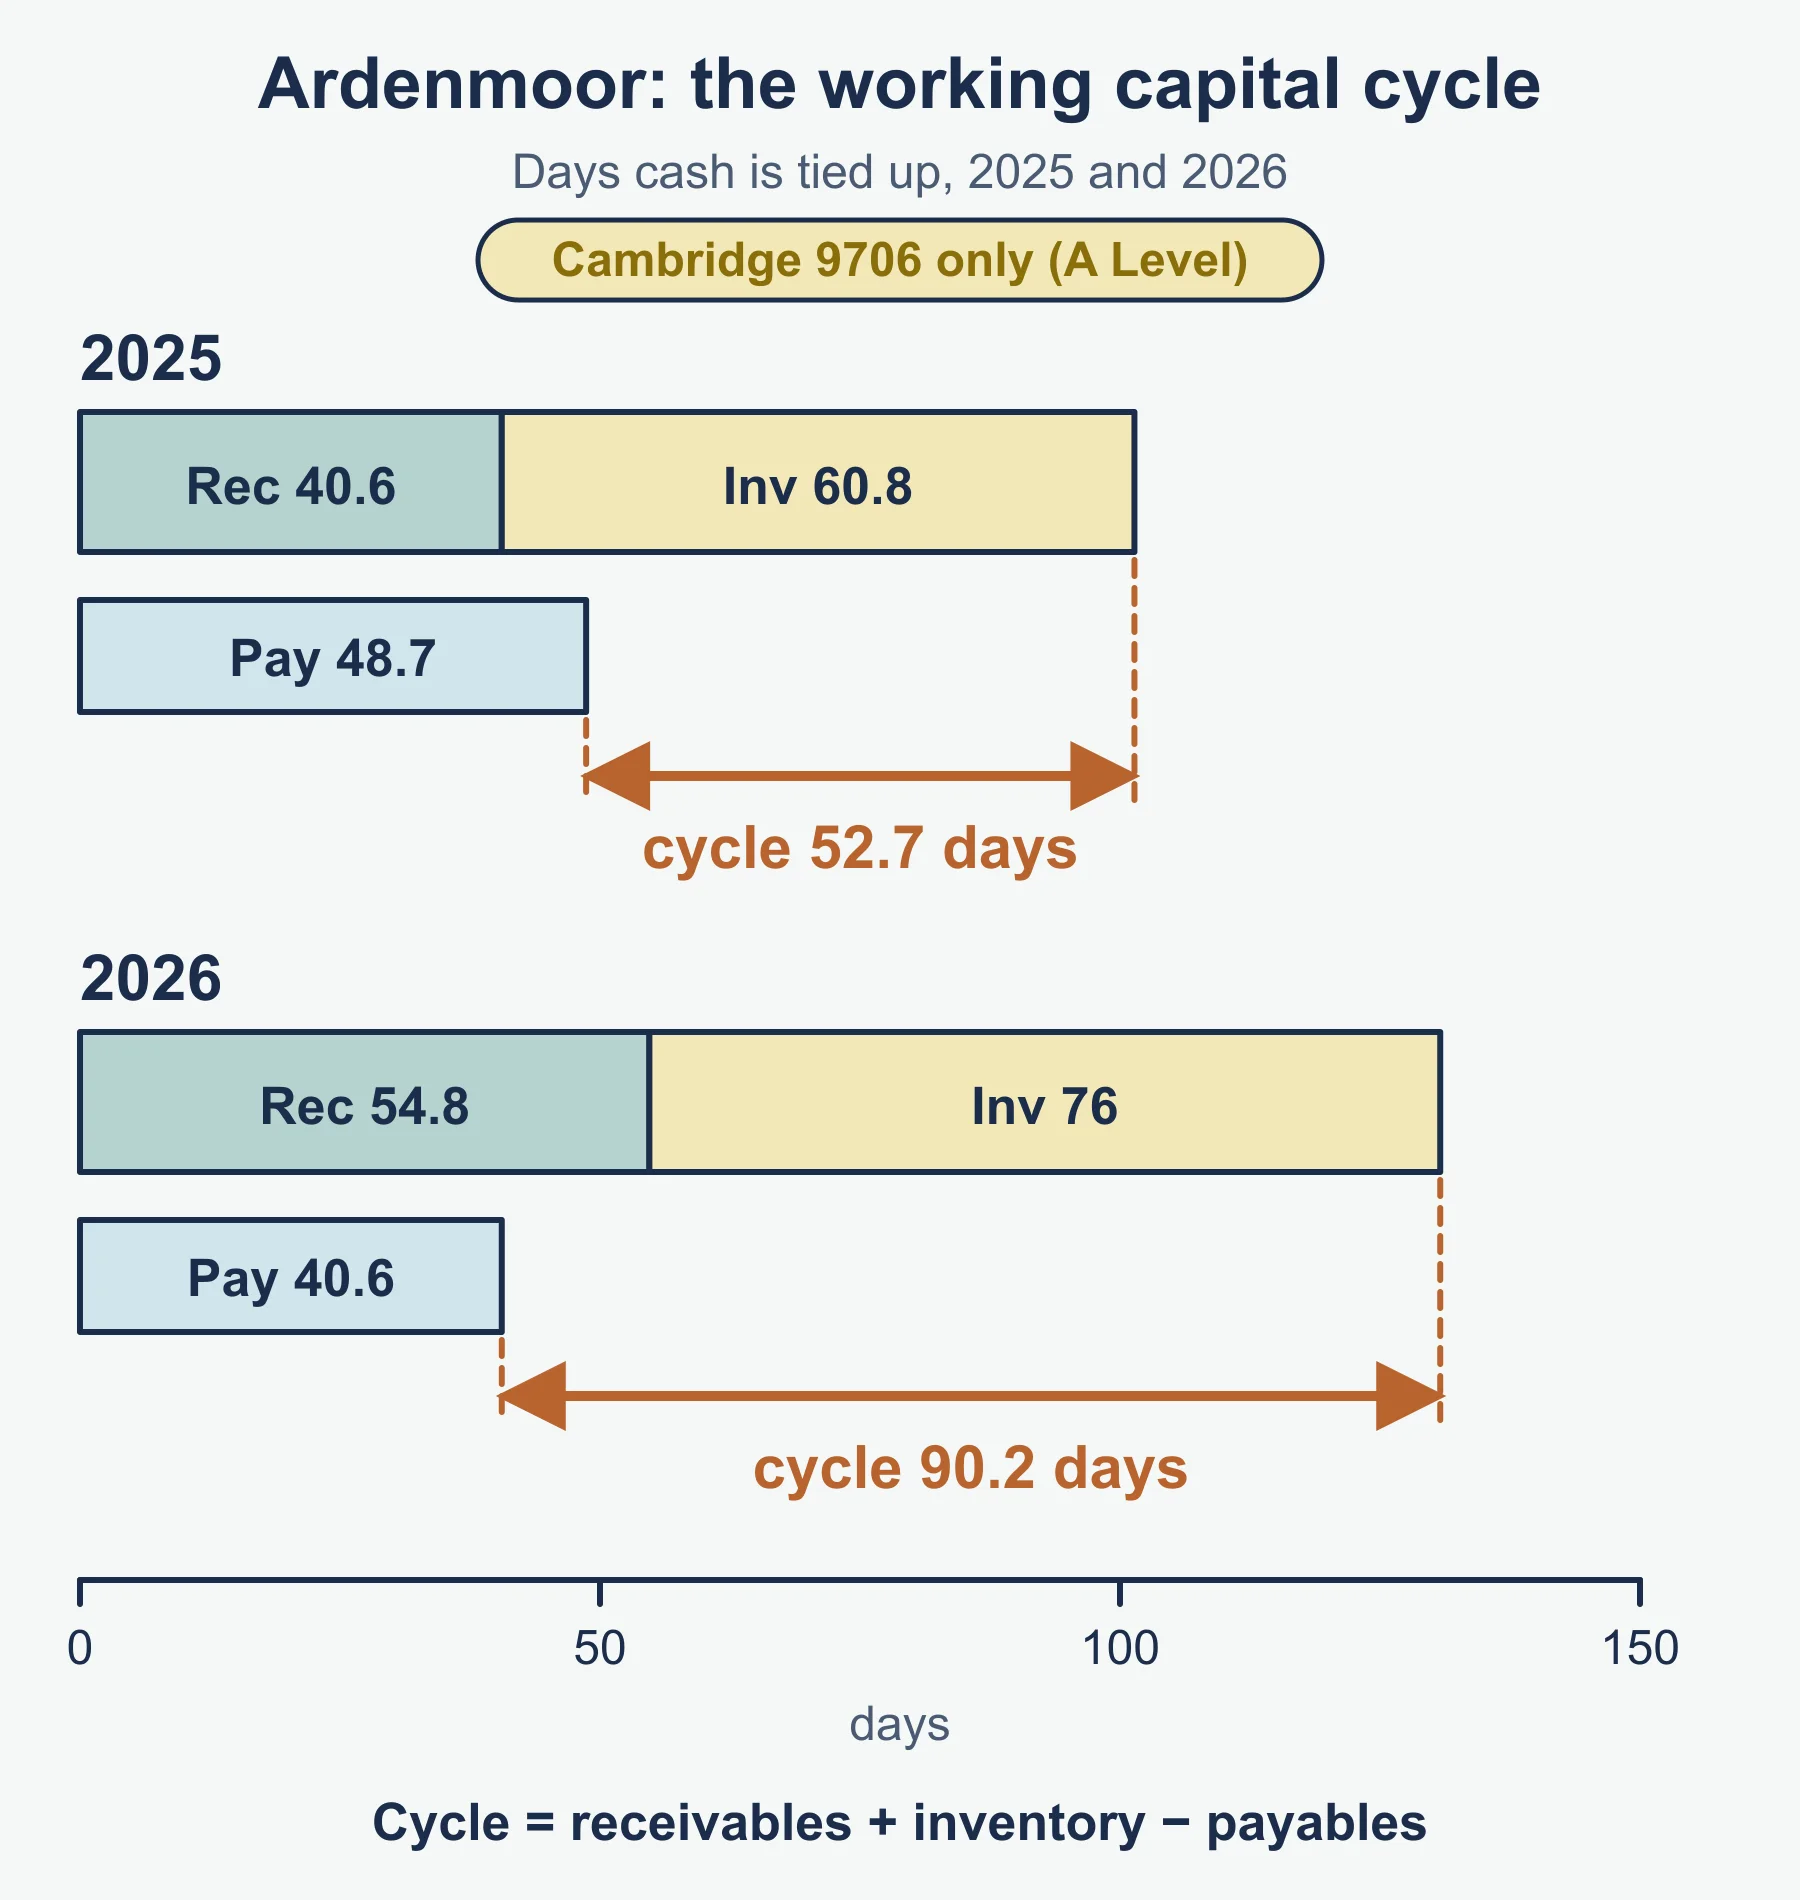
Working capital cycle (days) = trade receivables turnover (days) + inventory turnover (days) − trade payables turnover (days). It measures how long cash is tied up between paying suppliers and collecting from customers. Each part comes from the appendix:
- Trade receivables turnover = trade receivables ÷ credit sales × 365
- Inventory turnover = average inventory ÷ cost of sales × 365 (year-end inventory here, as no average is specified)
- Trade payables turnover = trade payables ÷ credit purchases × 365
| 2026 | Working | Days |
|---|---|---|
| Receivables | 1,296 ÷ 8,640 × 365 | 54.8 |
| Inventory | 1,260 ÷ 6,048 × 365 | 76.0 |
| Payables | 600 ÷ 5,400 × 365 | 40.6 |
| Working capital cycle | 54.8 + 76.0 − 40.6 | 90.2 |
For 2025 the same method gives 40.6 + 60.8 − 48.7 = 52.7 days.
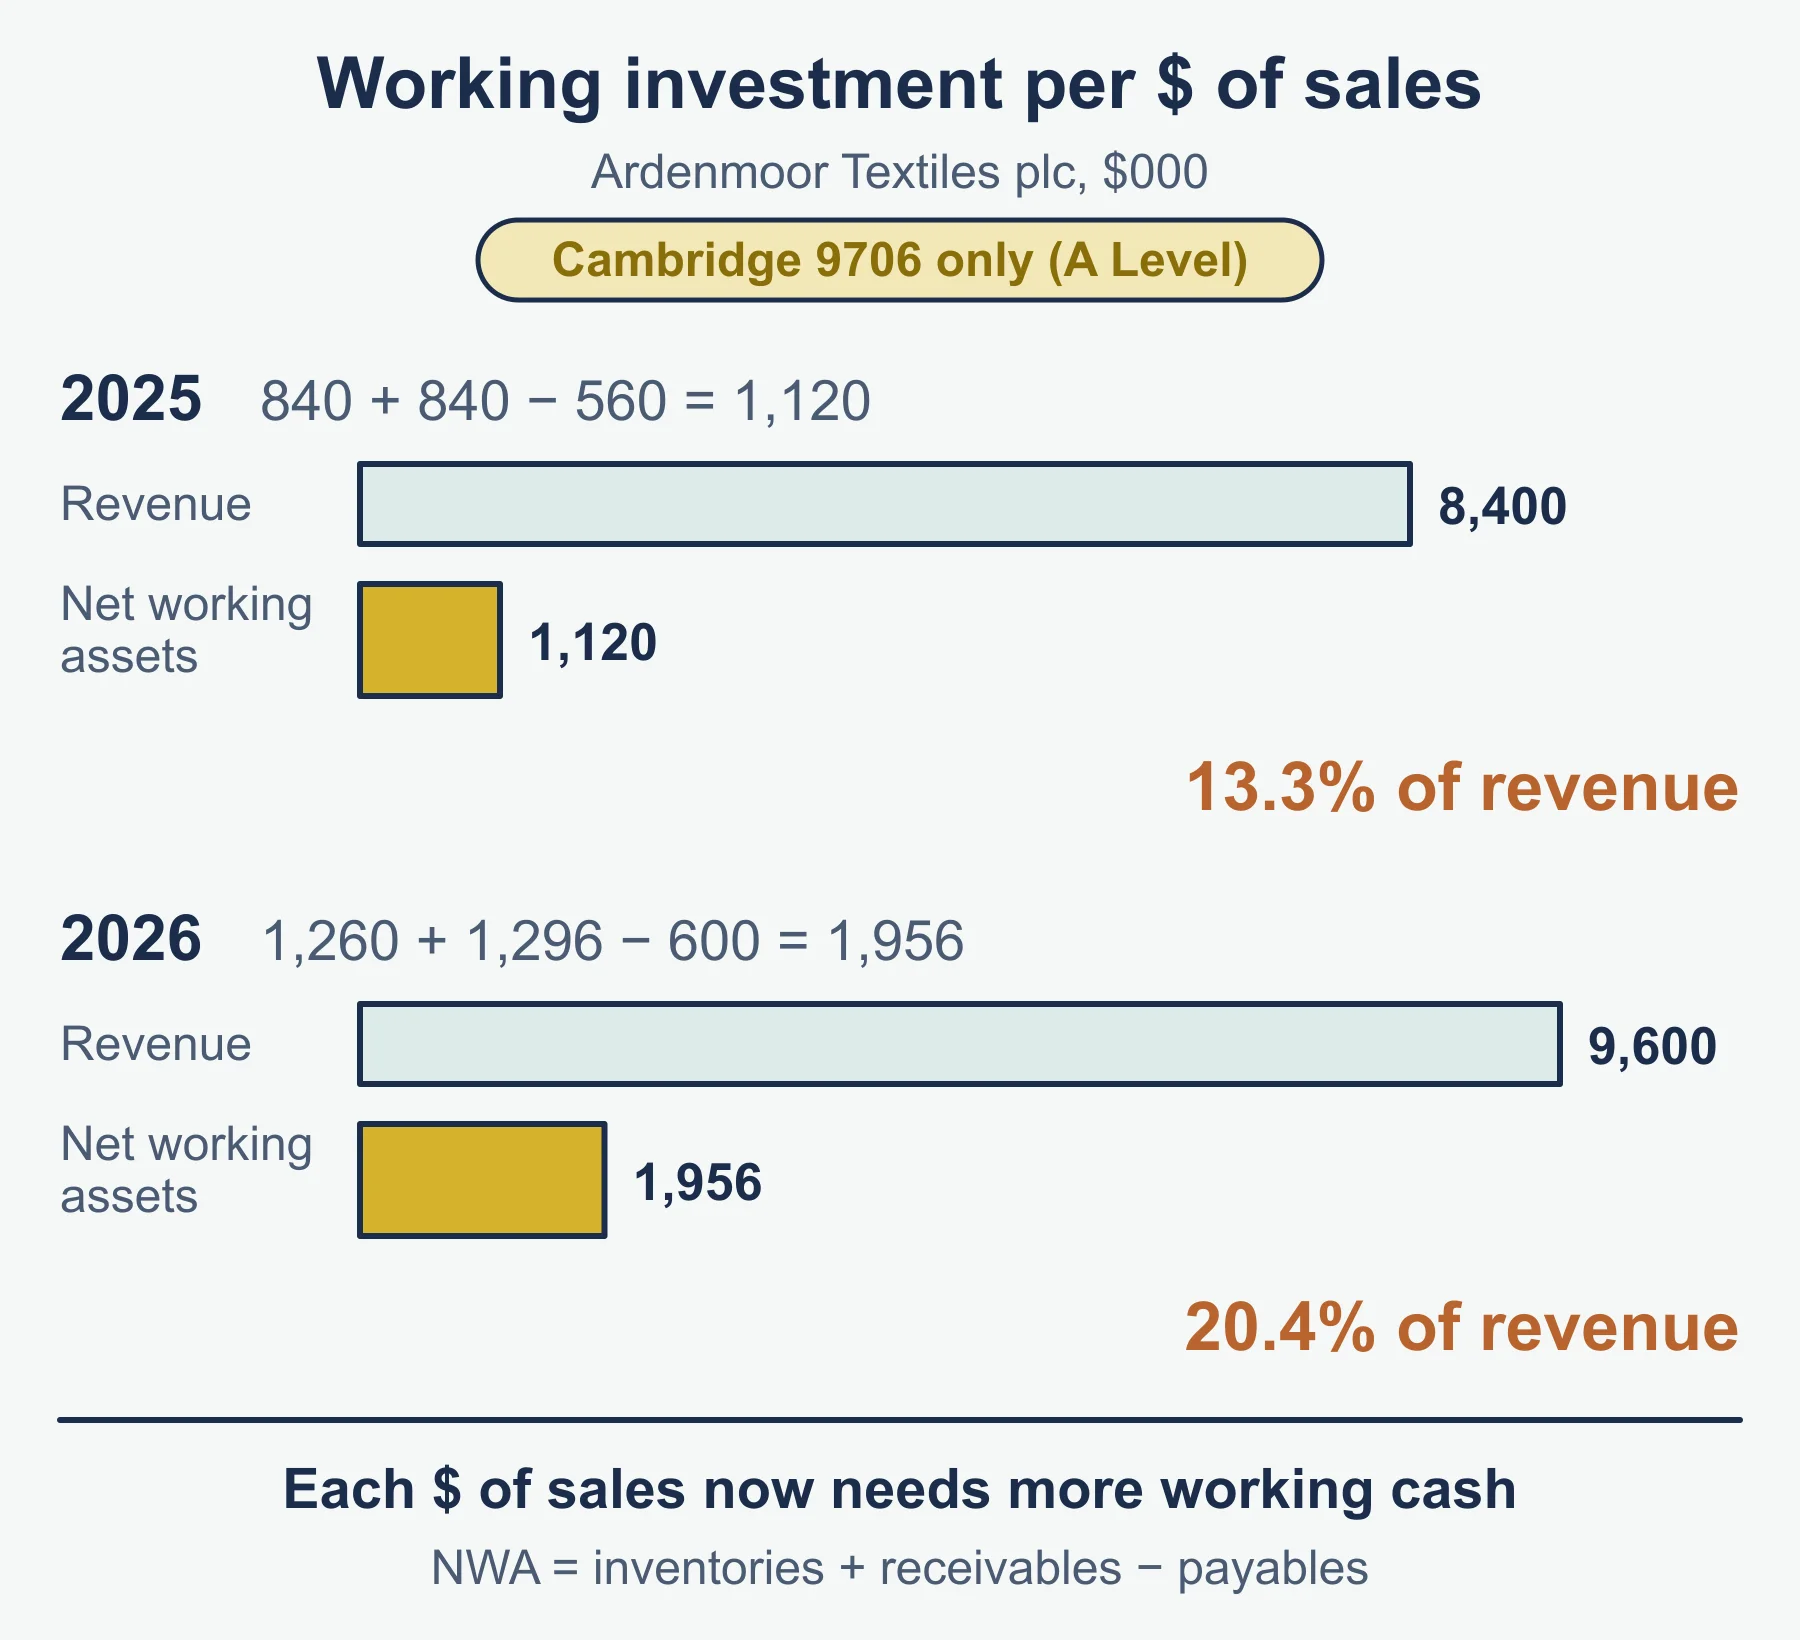
Net working assets to revenue (%) = net working assets ÷ revenue × 100, where net working assets = inventories + trade receivables − trade payables. For 2026: (1,260 + 1,296 − 600) = 1,956; 1,956 ÷ 9,600 × 100 = 20.4%. For 2025: 1,120 ÷ 8,400 × 100 = 13.3%. This shows how much working investment each dollar of sales needs.
Financing ratios
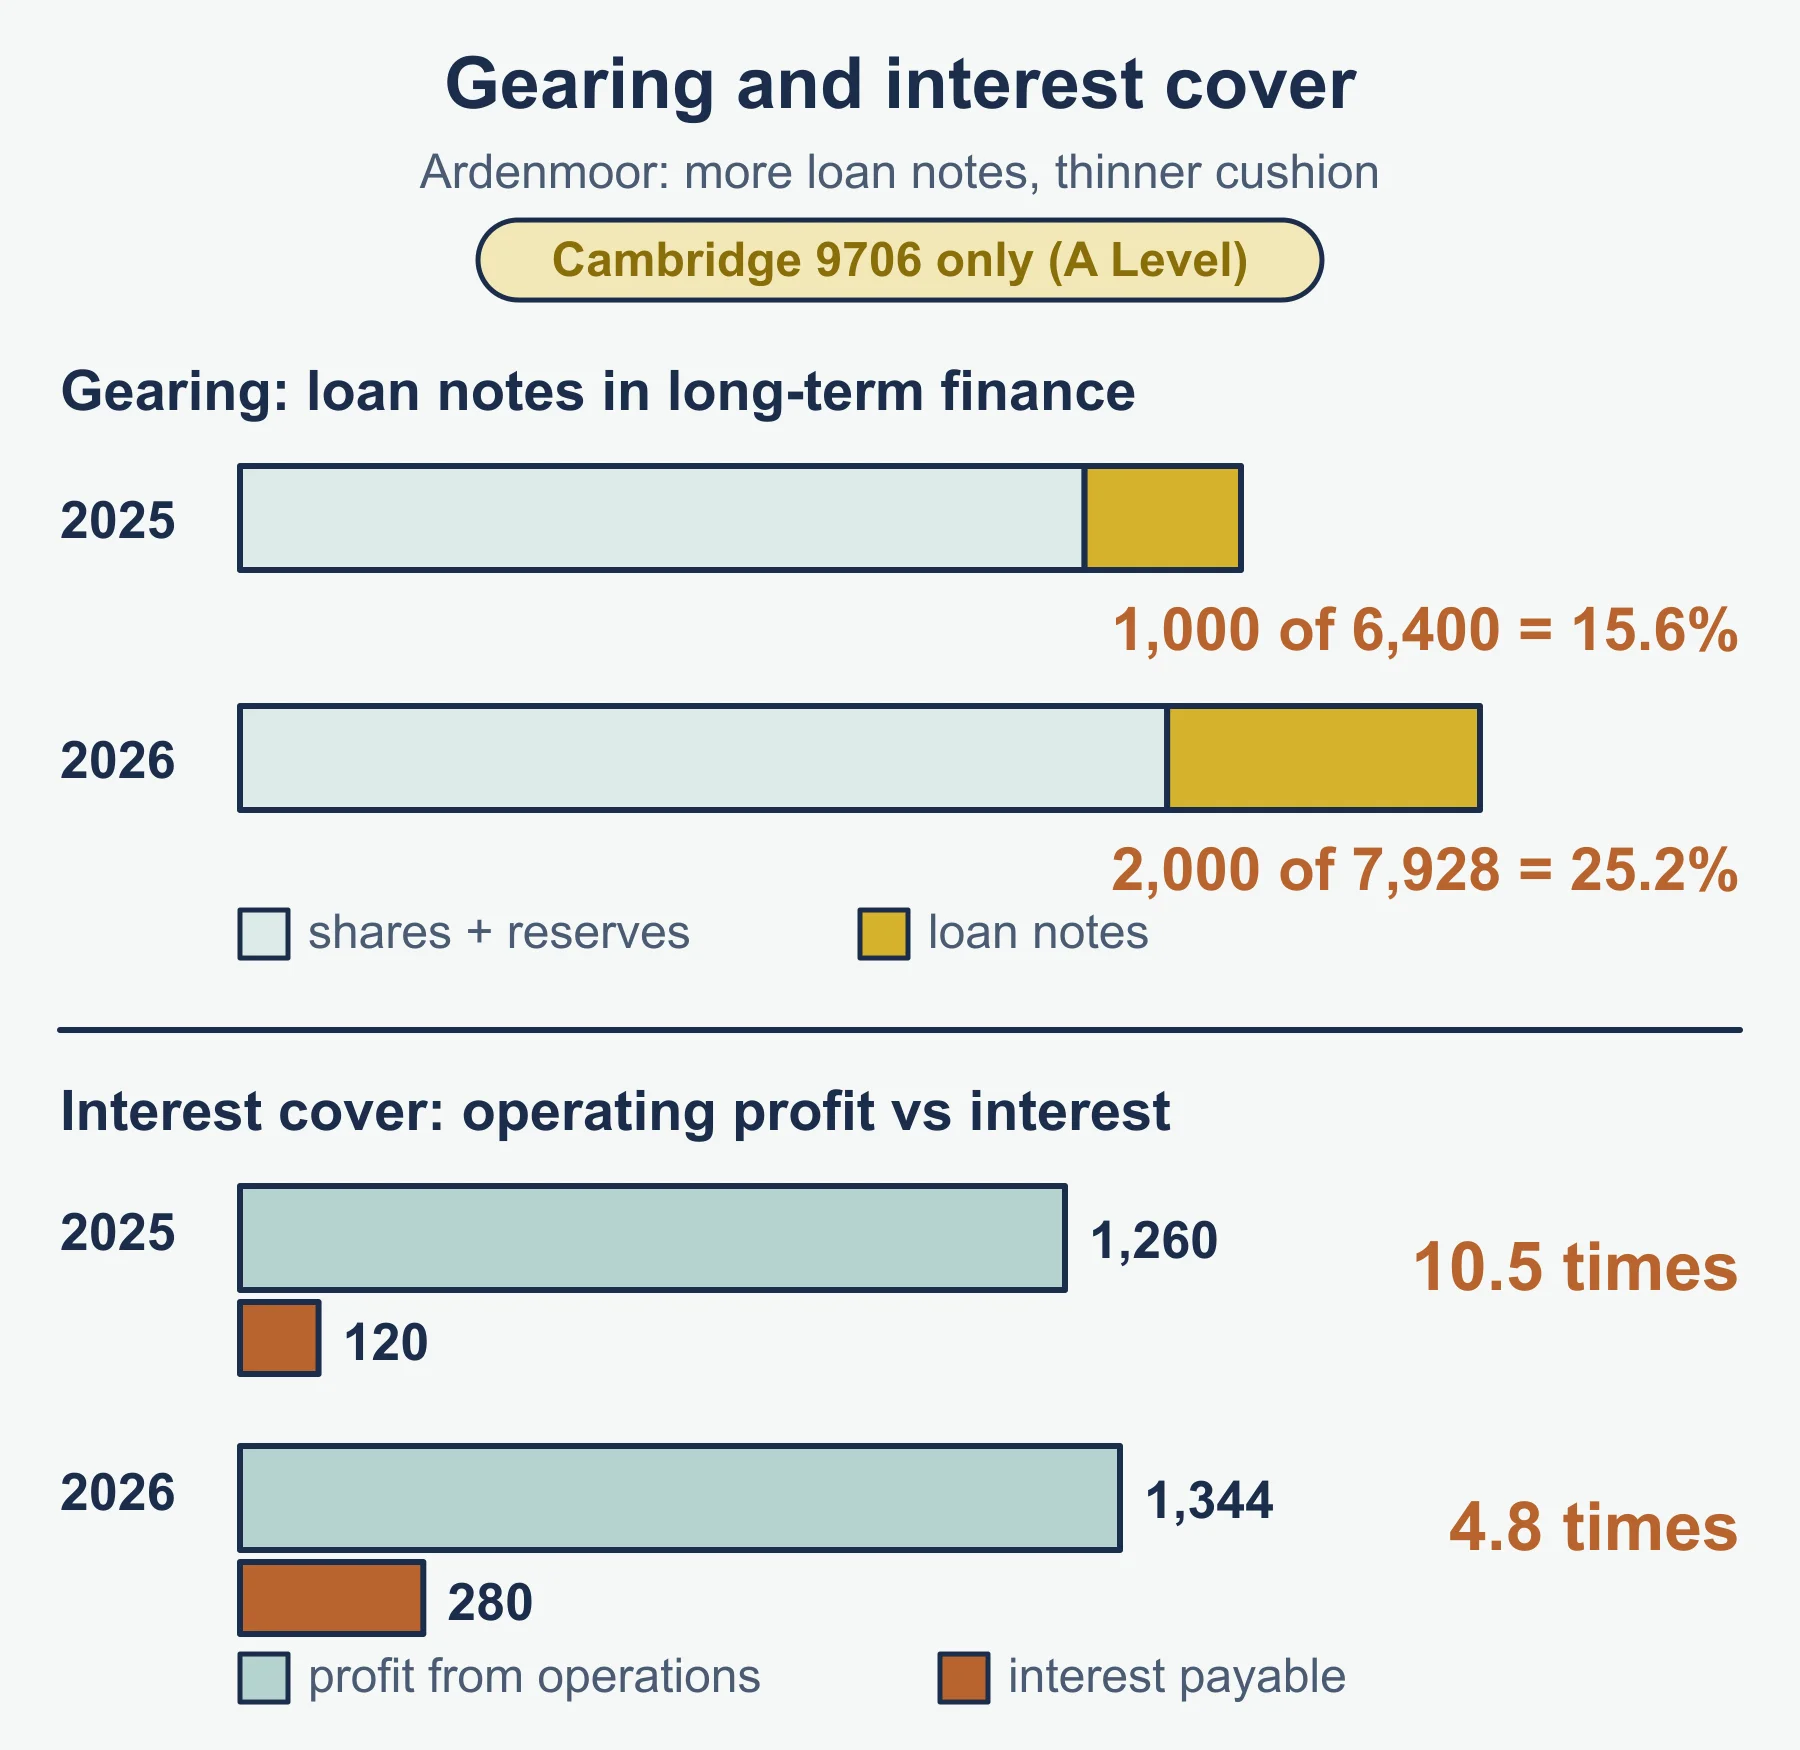
Interest cover (times) = profit from operations ÷ interest payable. 2026: 1,344 ÷ 280 = 4.8 times. 2025: 1,260 ÷ 120 = 10.5 times.
Gearing (%) = non-current liabilities ÷ (issued ordinary share capital + all reserves + non-current liabilities) × 100. 2026: 2,000 ÷ (3,000 + 2,928 + 2,000) × 100 = 2,000 ÷ 7,928 × 100 = 25.2%. 2025: 1,000 ÷ 6,400 × 100 = 15.6%.
Investor ratios
These are the stock exchange ratios in the appendix, labelled A Level only.
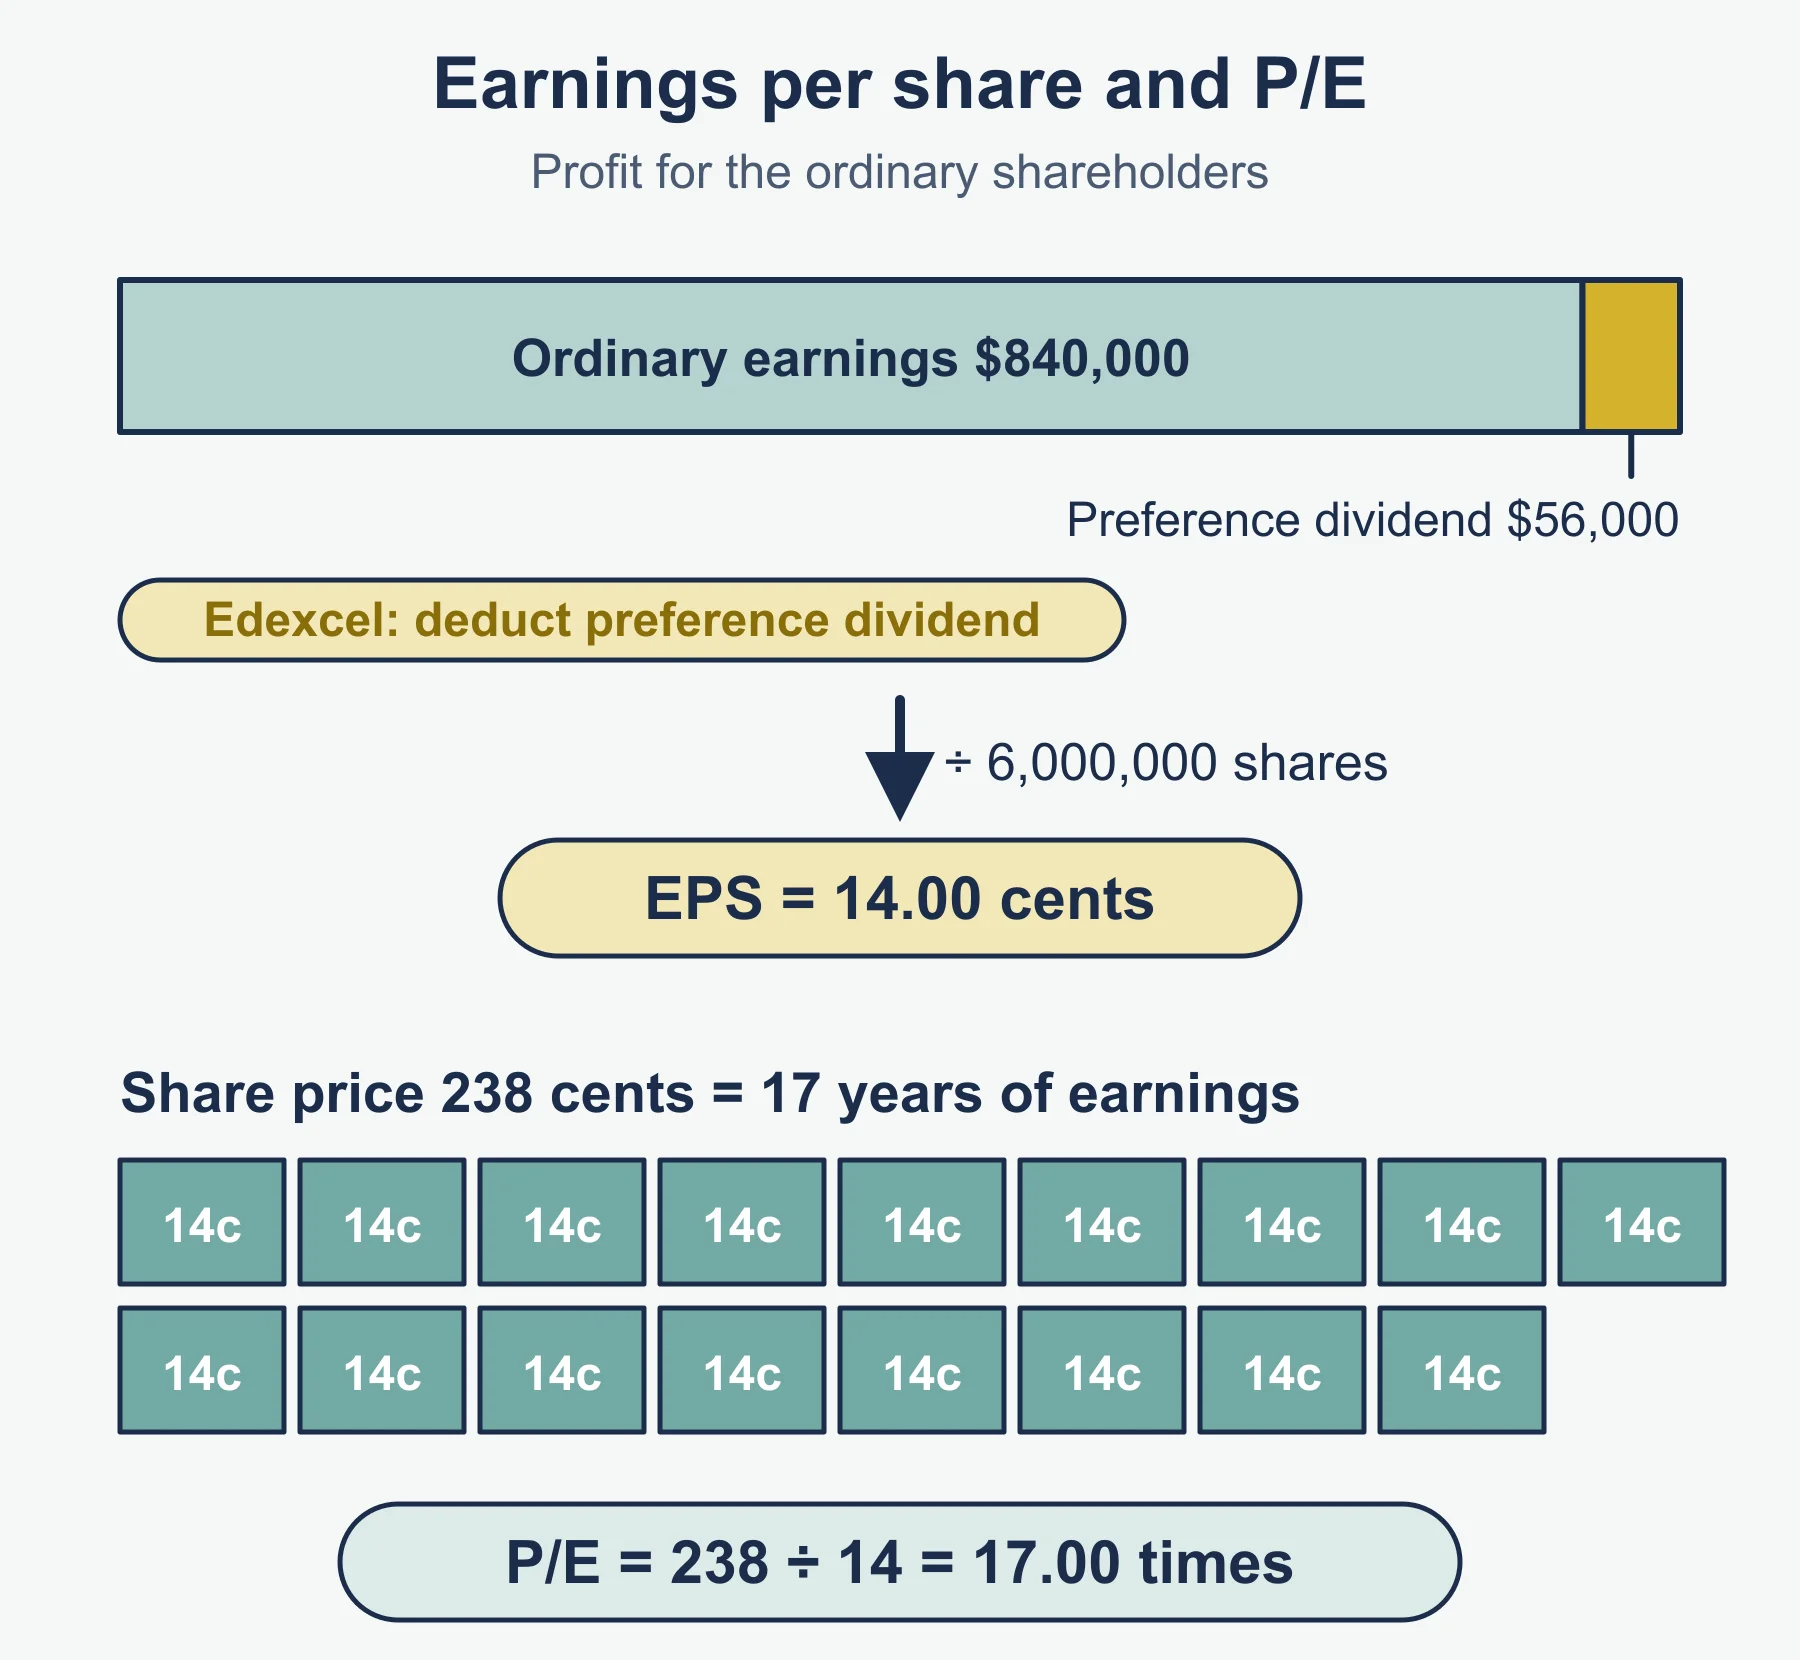
- Earnings per share = profit for the year ÷ number of issued ordinary shares. 2026: 798 ÷ 3,000 = $0.266, which is 26.6 cents. 2025: 855 ÷ 3,000 = 28.5 cents.
- Price/earnings = market price per share ÷ earnings per share. 2026: 3.20 ÷ 0.266 = 12.0. 2025: 3.99 ÷ 0.285 = 14.0. It is the number of years of current earnings the price represents.
- Dividend per share = annual ordinary dividend ÷ number of issued ordinary shares, where annual ordinary dividend = interim dividend paid + final dividend proposed. 2026: (90 + 120) ÷ 3,000 = 7.0 cents. 2025: (90 + 180) ÷ 3,000 = 9.0 cents.
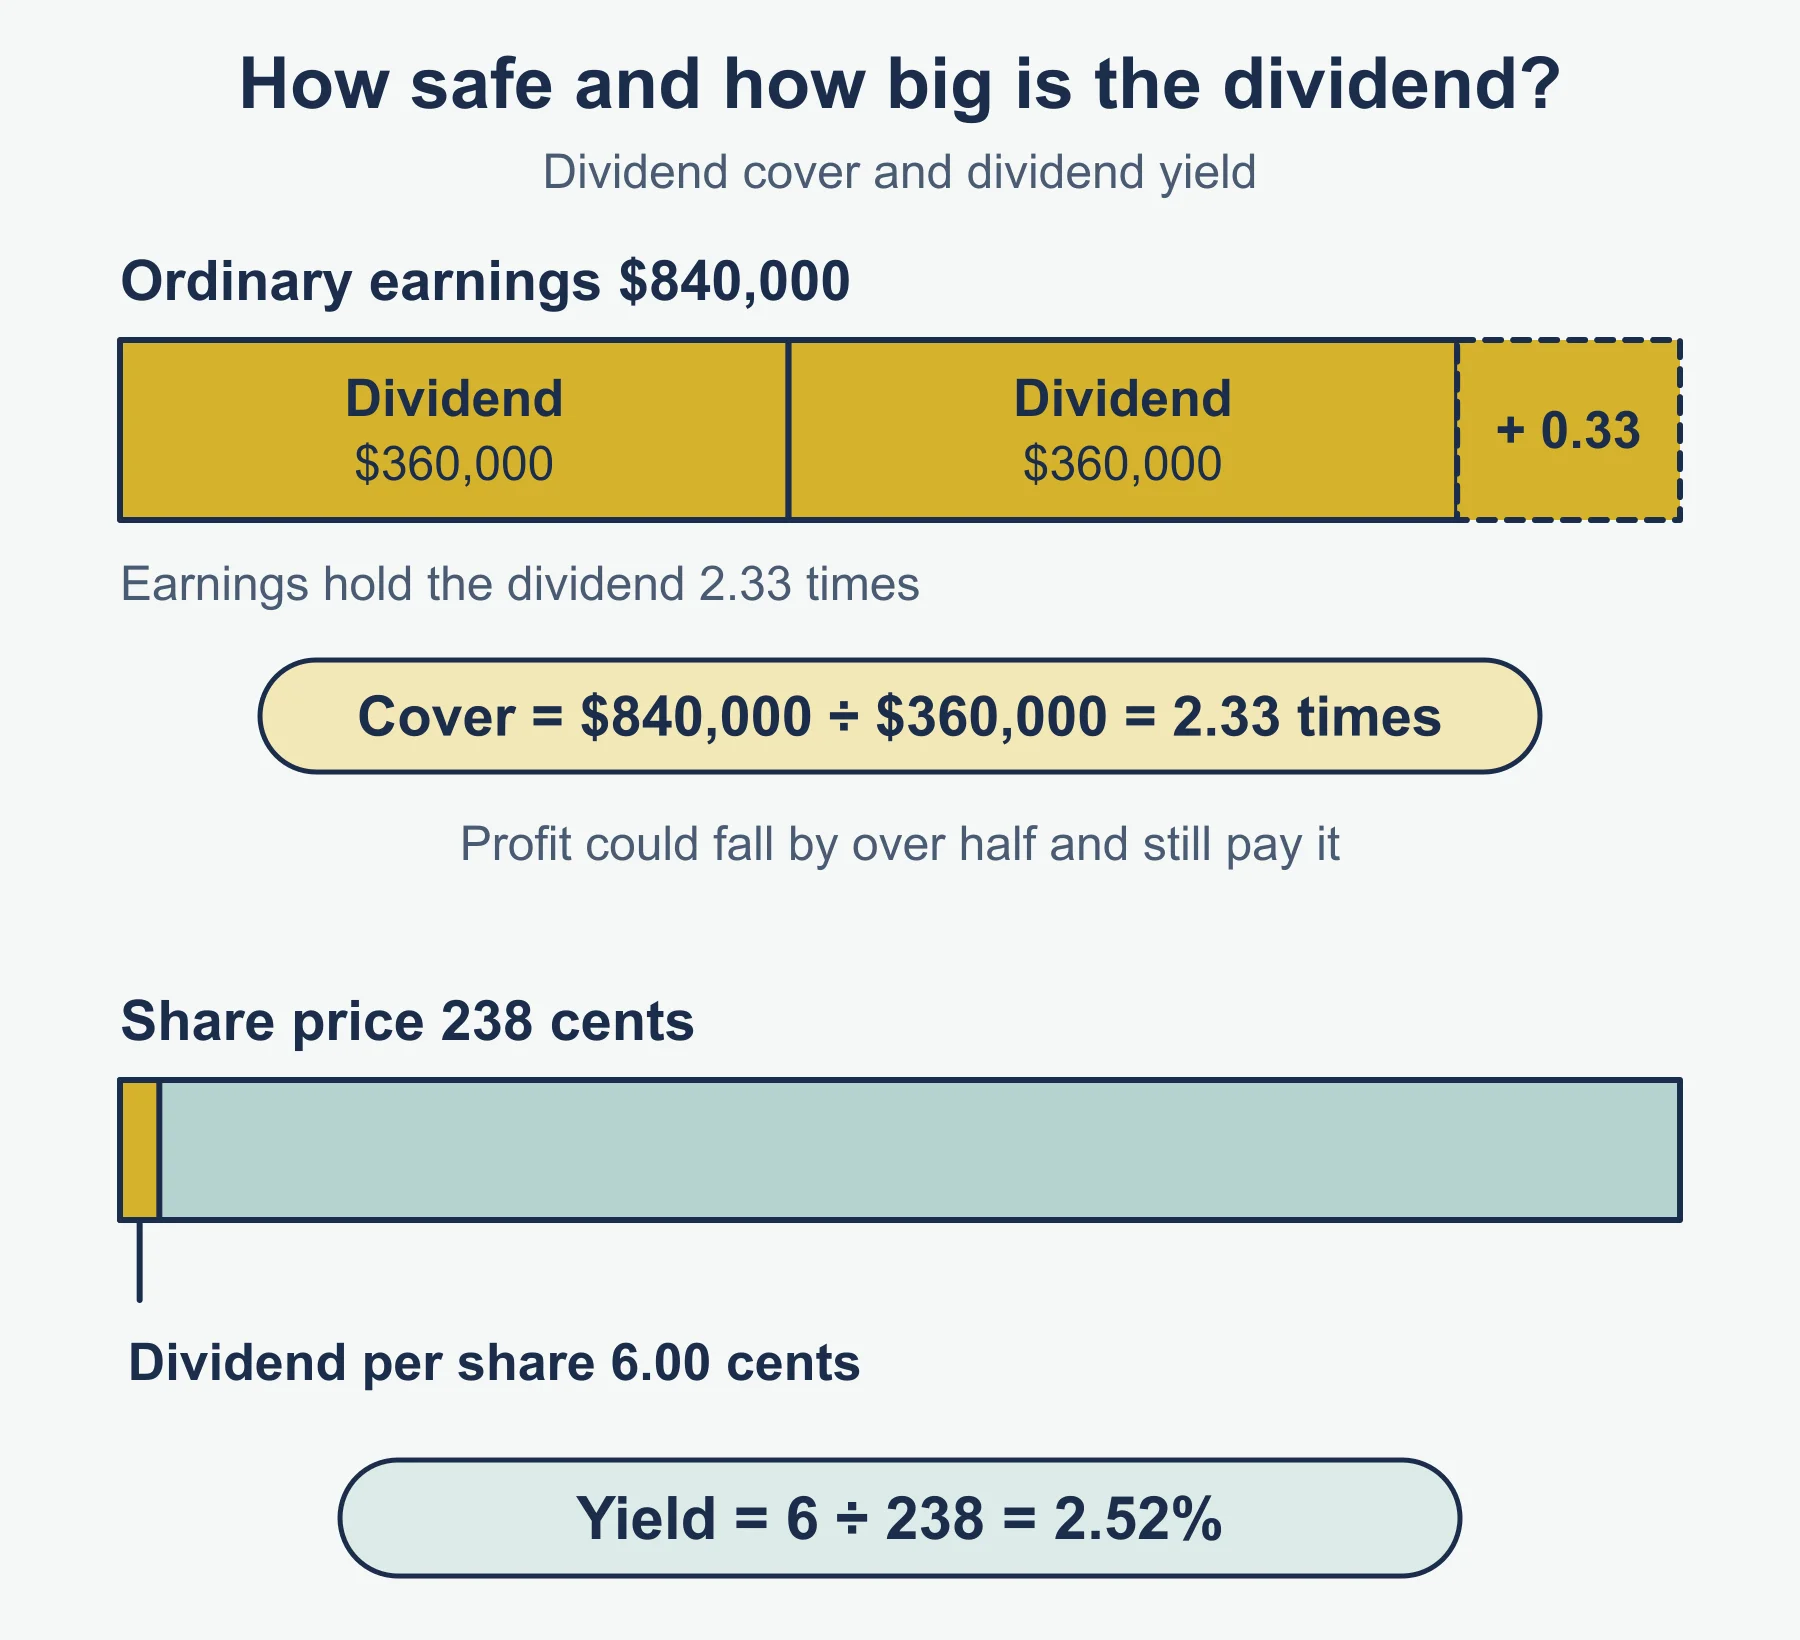
- Dividend yield = dividend per share ÷ market price per share. 2026: 0.07 ÷ 3.20 = 0.0219, or 2.19% when written as a percentage. 2025: 0.09 ÷ 3.99 = 0.0226 (2.26%). The appendix prints no multiplier or unit for this ratio, so give the form the question asks for.
- Dividend cover = profit for the year available to pay ordinary dividend ÷ annual ordinary dividend. 2026: 798 ÷ 210 = 3.8 times. 2025: 855 ÷ 270 = 3.2 times. Ardenmoor has only ordinary shares, so all of the profit is available. If a question gives another prior claim on profit, deduct it before dividing.
Turning figures into analysis
A calculation alone earns little here, because Paper 3 assesses analysis and evaluation as well as knowledge. For each ratio, write a four-part point: state the change with both figures, give a likely cause, explain the effect on a named stakeholder, then judge how serious it is.
| Ratio | A rise usually suggests | Look out for |
|---|---|---|
| Working capital cycle | Cash is tied up longer; more finance needed | A fall can come from stretching payables |
| Net working assets to revenue | More working investment per dollar of sales | Growth, or slack control of inventory and receivables |
| Interest cover | A bigger safety margin for lenders | A low figure means profit could be wiped out by a small fall |
| Gearing | More fixed-cost finance, so more risk | Borrowing can lift returns when the business earns more than it pays |
| Earnings per share | More profit for each share | Only comparable if share numbers are unchanged |
| Price/earnings | The market expects growth or low risk | A fall can signal lost confidence |
| Dividend per share | A larger cash reward | May be paid out of profits that are falling |
| Dividend yield | A higher return on the current price | A high yield can come from a fallen price |
| Dividend cover | A safer dividend and more retained profit | Very high cover may mean cash is held back |
Ardenmoor conclusions. Revenue rose 14.3% but profit for the year fell 6.7%. The working capital cycle lengthened from 52.7 to 90.2 days because customers took longer to pay (40.6 to 54.8 days), inventory was held longer (60.8 to 76.0 days) and suppliers were paid sooner (48.7 to 40.6 days). Net working assets rose by 836, financed partly by loan notes and overdraft, so interest payable more than doubled and interest cover halved to 4.8. Gearing rose to 25.2%, which is still moderate, yet the borrowing costs 12% while ROCE (profit from operations ÷ capital employed × 100, from section 1.6) fell from 19.7% to 17.0%, so the margin of benefit from borrowing is narrowing.
How the ratios connect
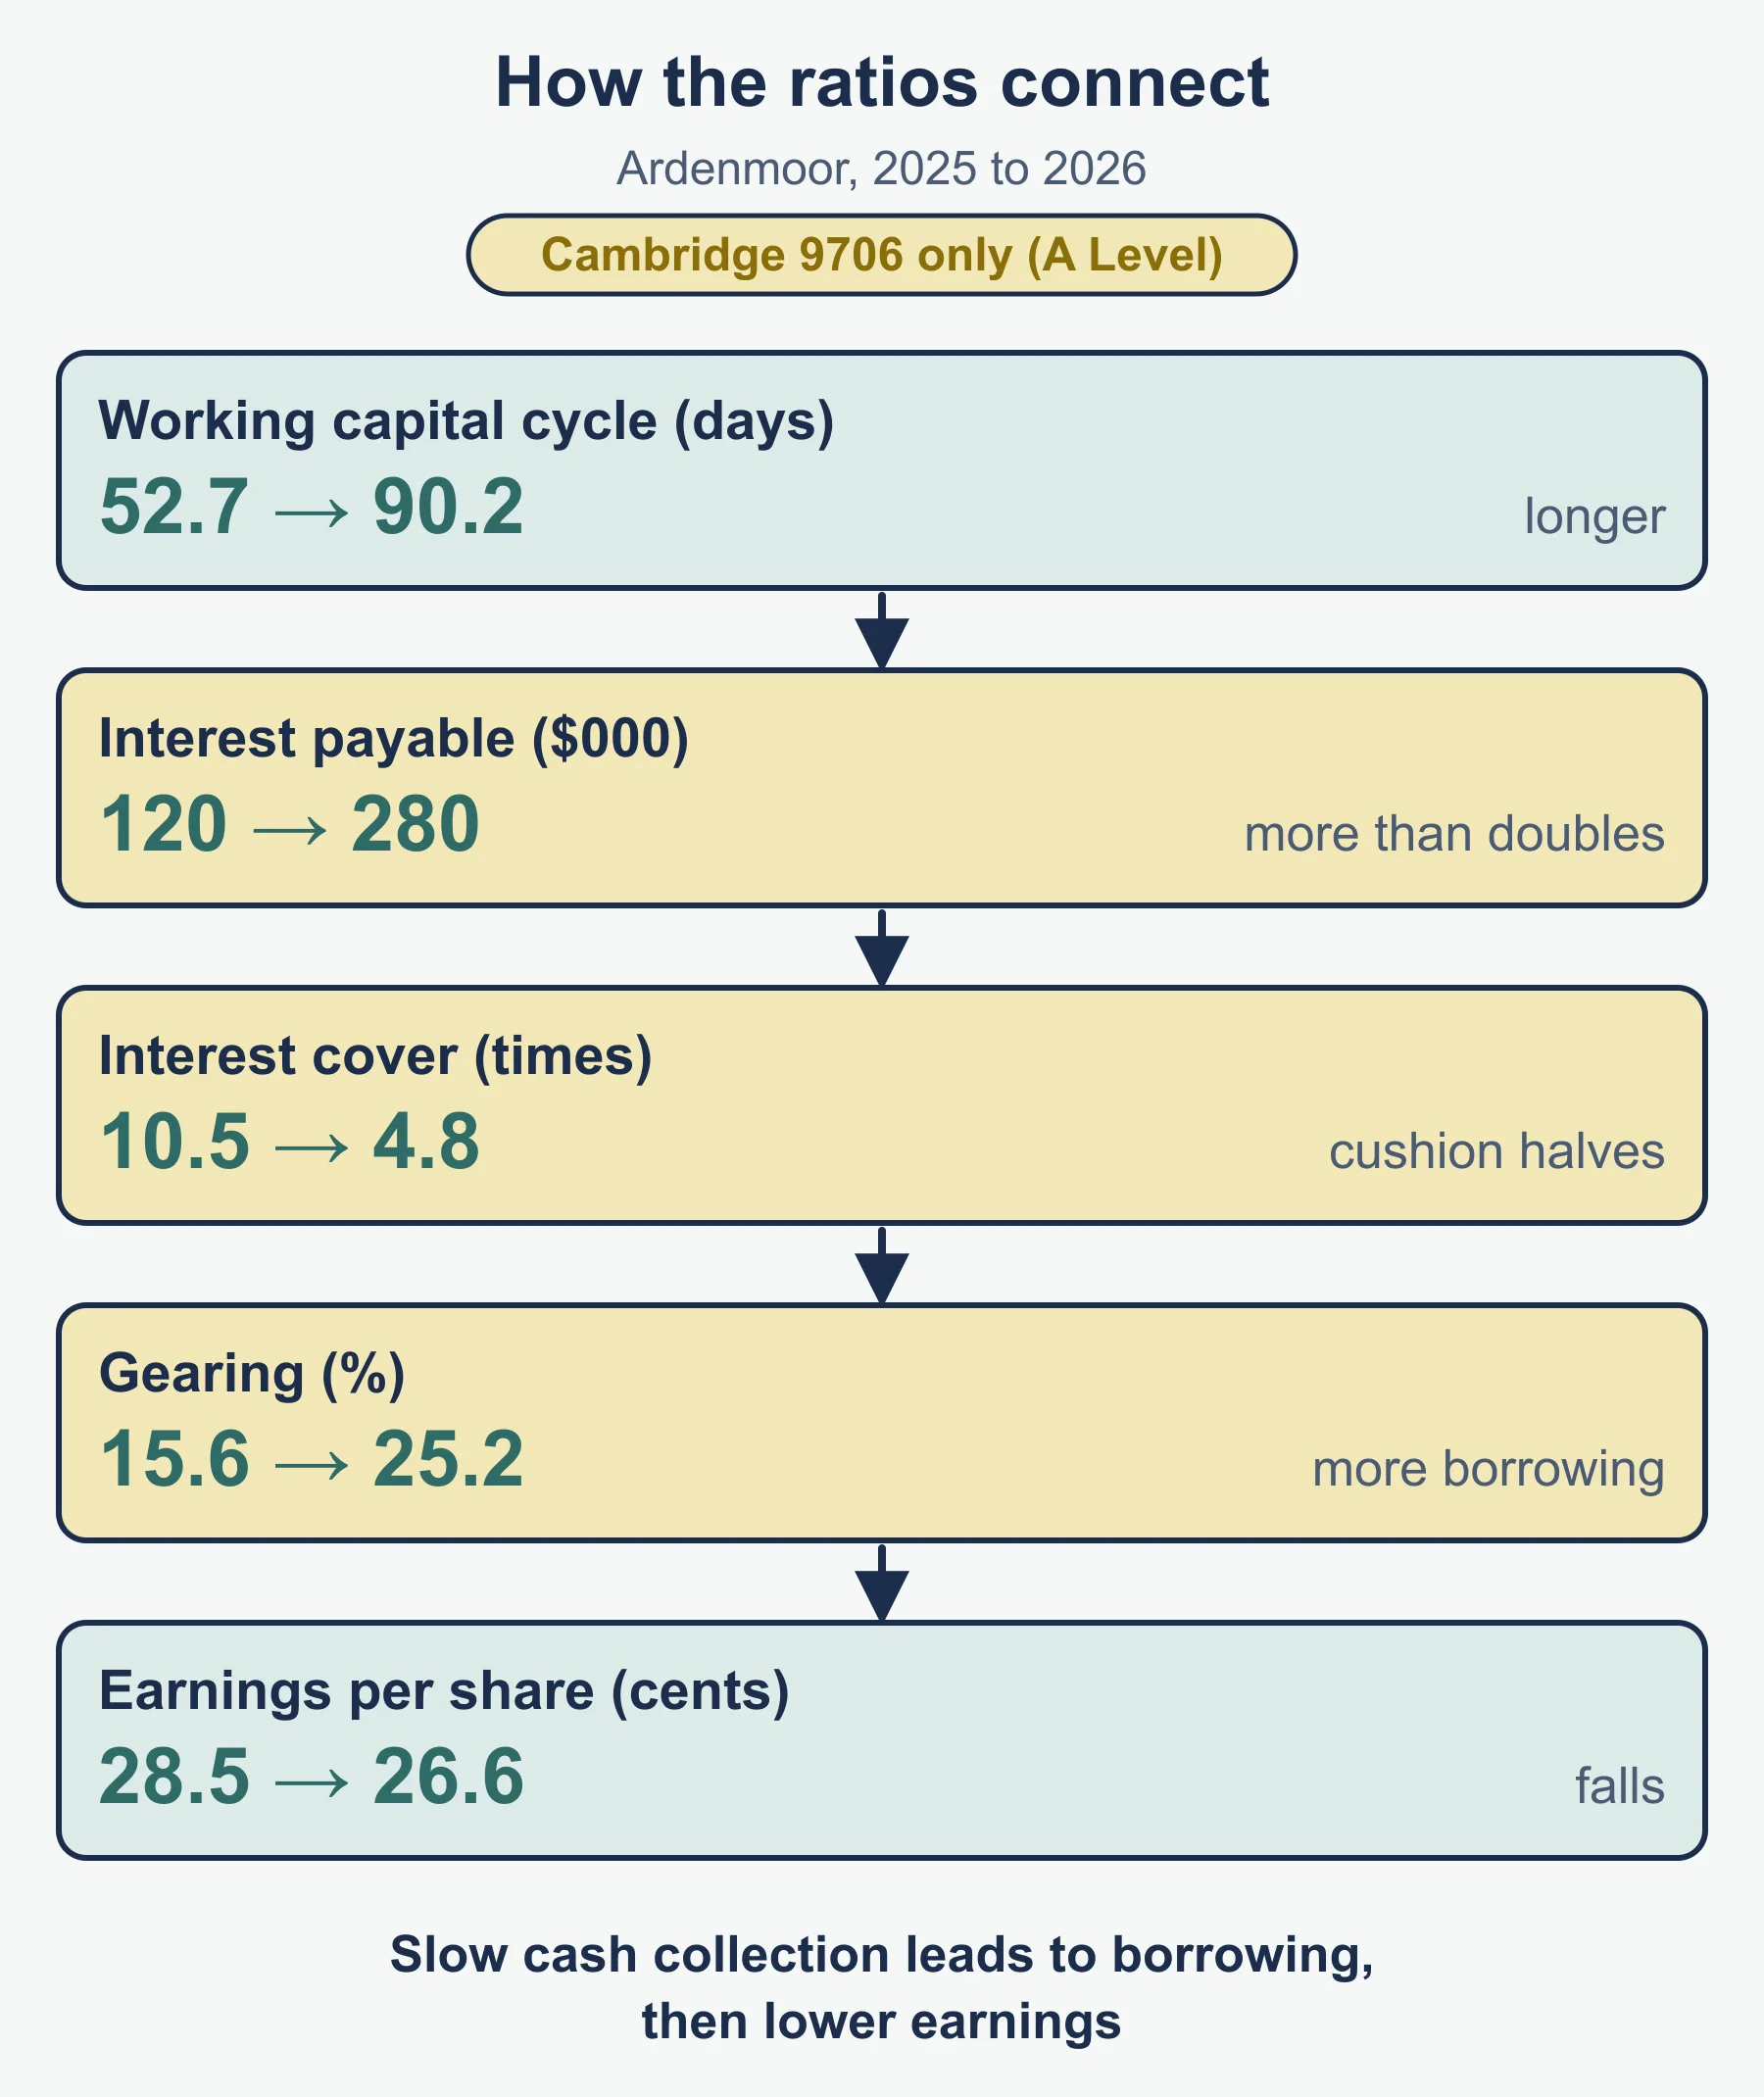
- Working capital to profit. A longer cycle needs more finance. Borrowing adds interest, which lowers interest cover and profit for the year, so earnings per share falls.
- Gearing and interest cover. They move together: new loan notes raise gearing and, unless operating profit grows by enough, lower cover. A highly geared business has a larger fall in earnings when profit from operations drops.
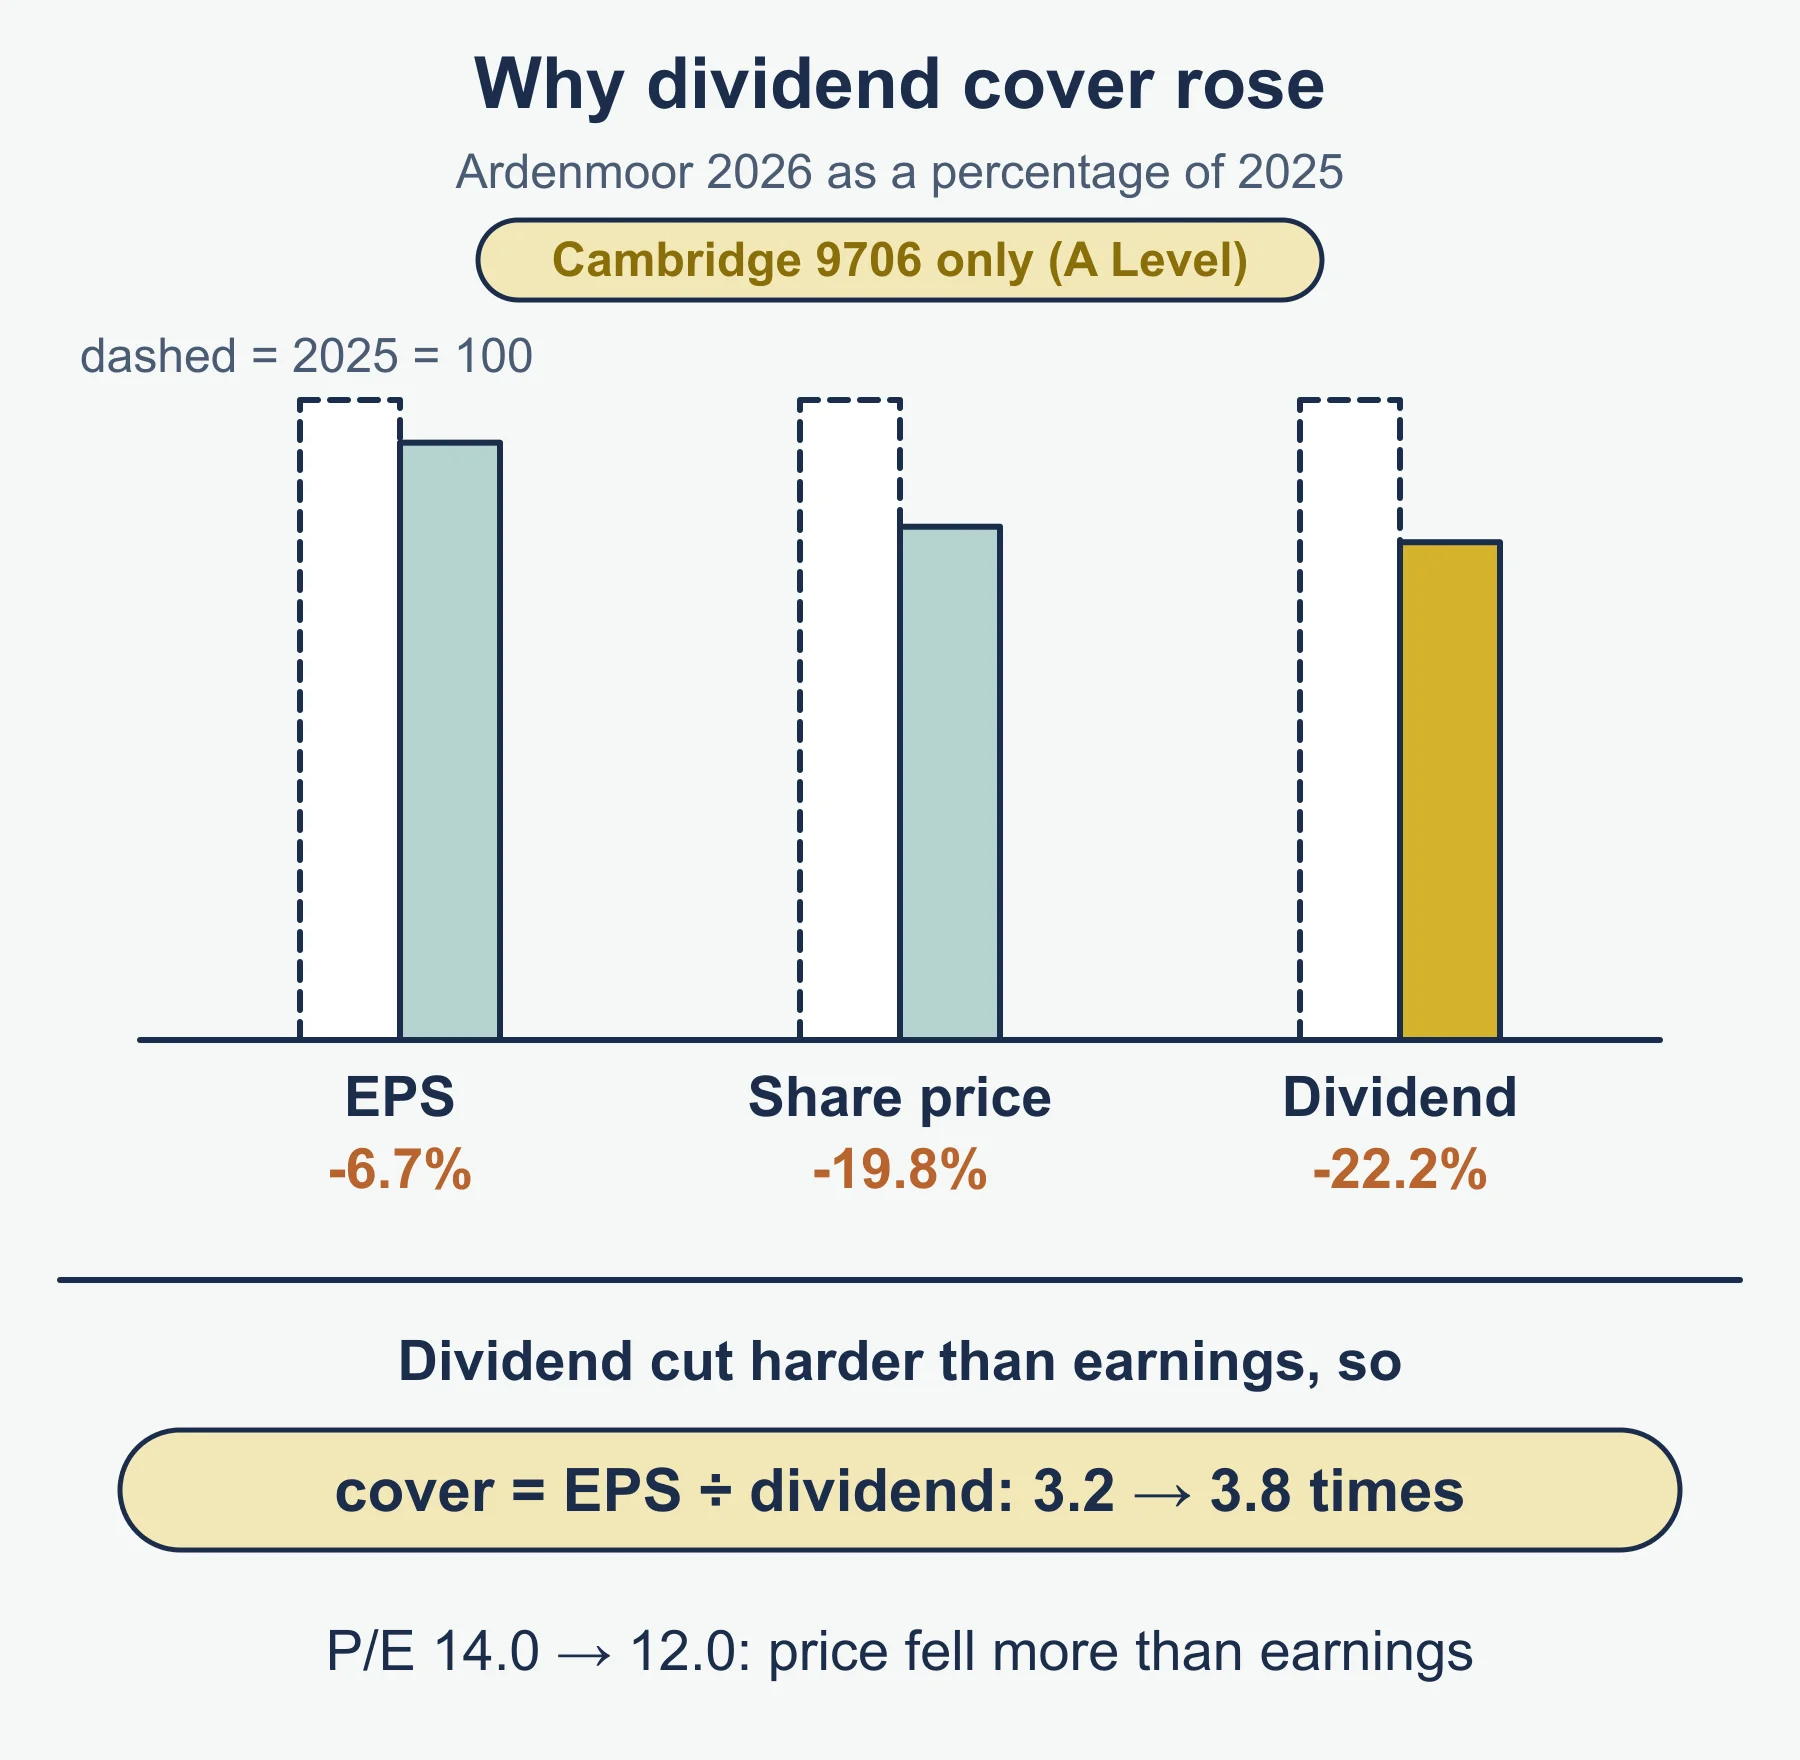
- Earnings, price and dividends. With only ordinary shares, dividend cover equals earnings per share ÷ dividend per share. Ardenmoor’s cover rose from 3.2 to 3.8 only because the dividend was cut harder (22.2%) than earnings fell (6.7%). Price/earnings fell from 14.0 to 12.0 because the price fell by 19.8%, more than the earnings.
- Yield and price. Yield = dividend per share ÷ price, so a lower dividend and a lower price pull in opposite directions; Ardenmoor’s yield barely moved.
- Efficiency and return. Slower inventory and receivables turnover tie up capital, which depresses ROCE even when sales grow.
Recommendations and improvement measures
A model point on Ardenmoor: “Interest cover fell from 10.5 to 4.8 times because interest payable rose from 120 to 280 while profit from operations rose only 6.7%. A lender has a thinner safety margin, although 4.8 times is still adequate, so the lender should watch the next set of accounts.”
State who you are advising, give the recommendation, then a reason for and a reason against, then your decision.
- Shareholder: hold rather than buy. For: earnings per share is still positive, cover of 3.8 means the dividend is safe. Against: earnings are falling and the dividend has been cut, so the price may fall further.
- Lender: do not lend more without conditions. For: interest cover of 4.8 still covers payments. Against: it has halved and the cycle is the cause, so extra lending may only fund slow collection.
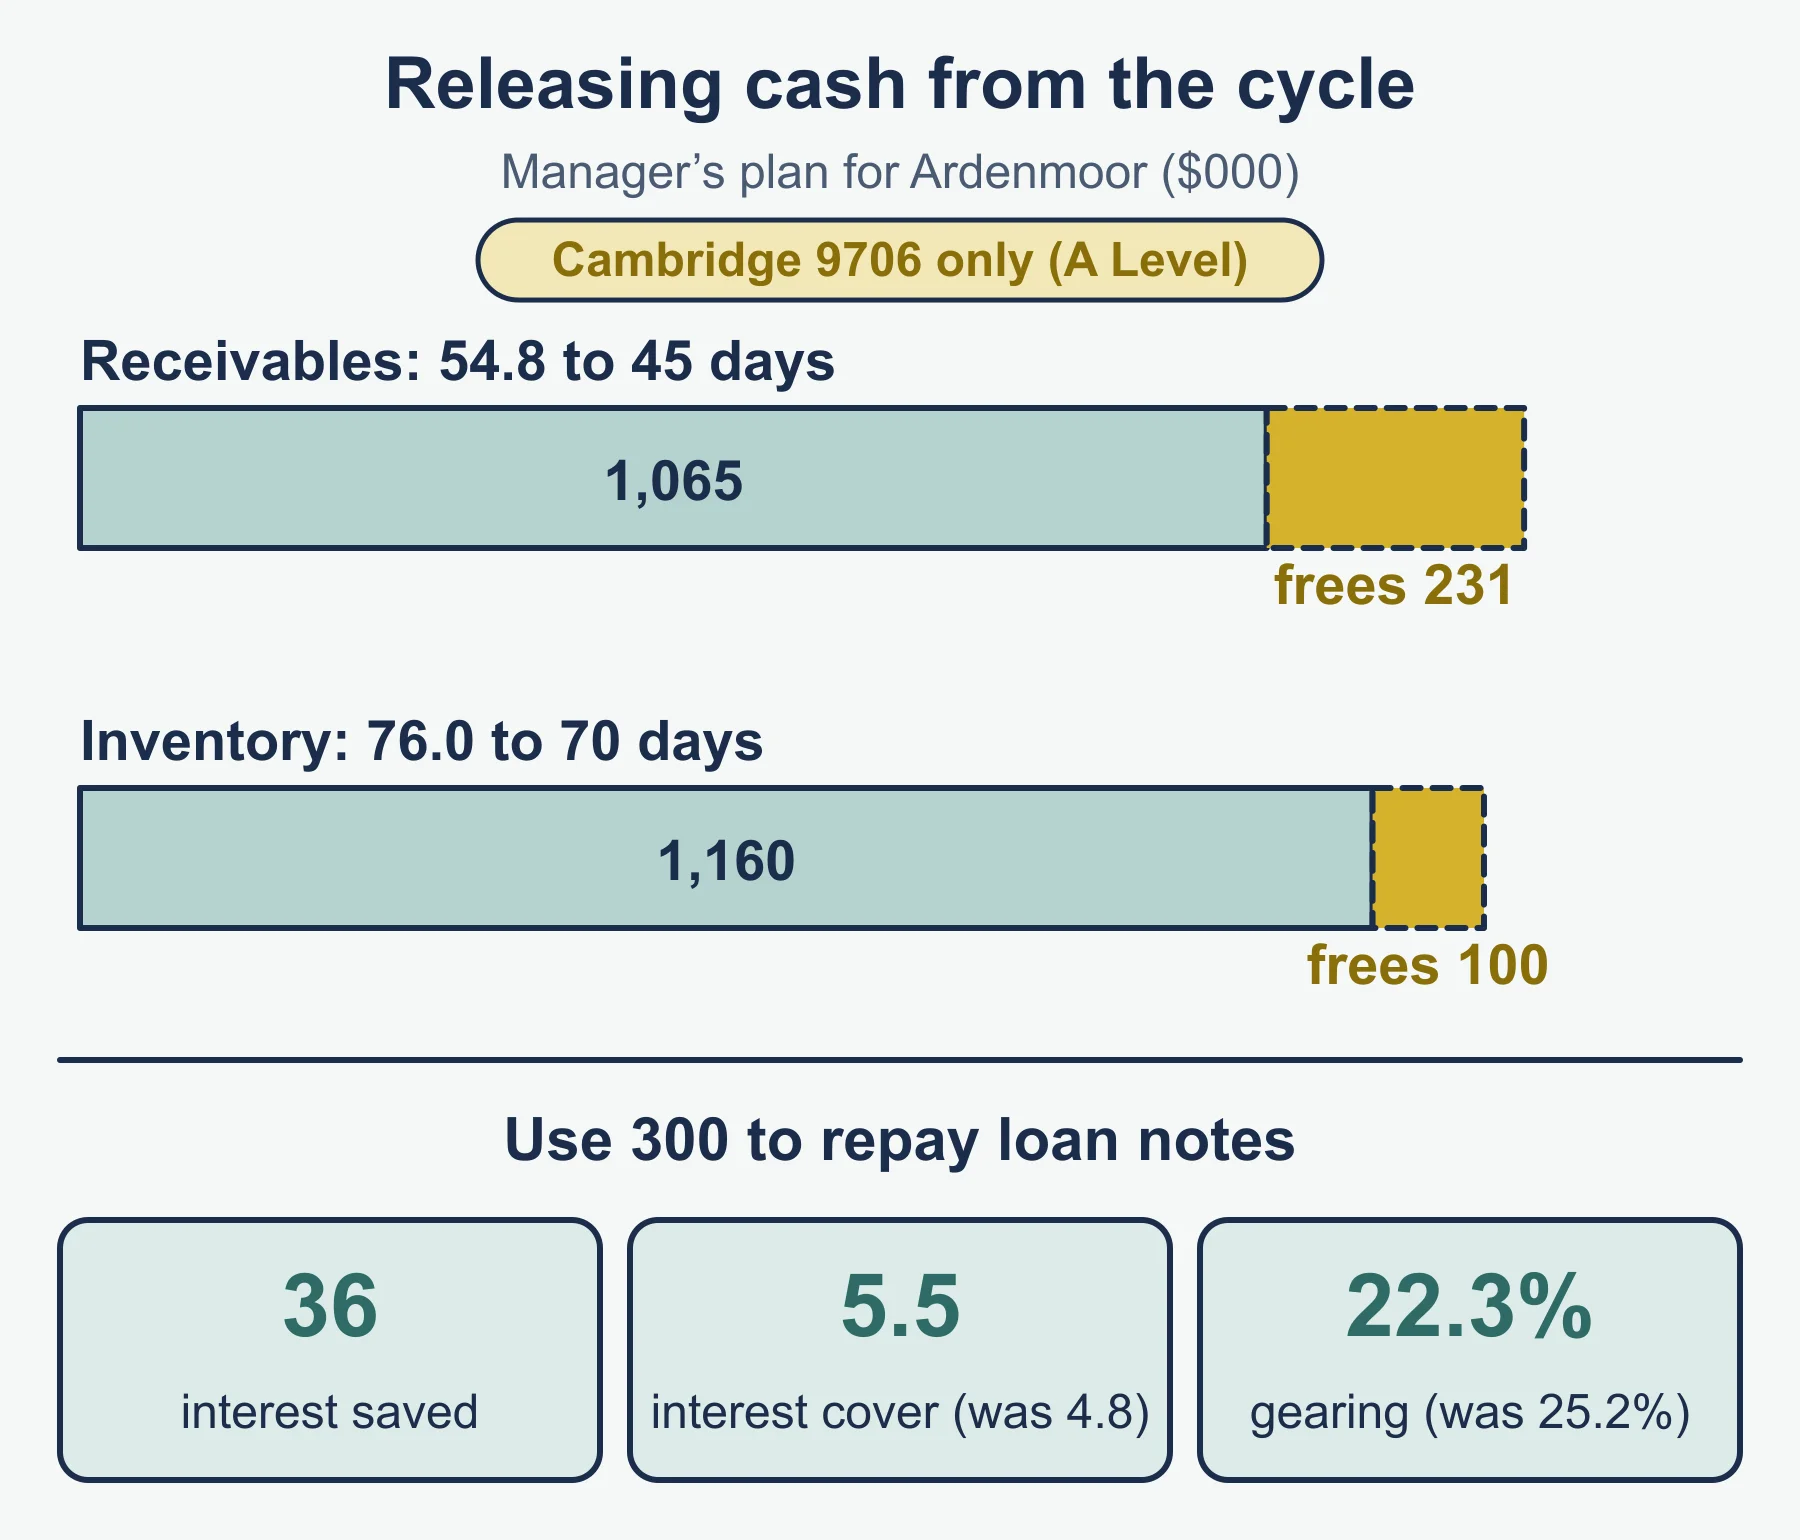
- Manager: target the cycle. Cutting receivables to 45 days releases about 231 (1,296 less 1,065). Cutting inventory to 70 days releases about 100 (1,260 less 1,160). Using 300 of the cash to repay loan notes would save interest of 36, lift interest cover to 5.5 and cut gearing to 22.3%, but pressing customers may cost sales if they value credit.
Other measures: negotiate longer supplier credit without losing discounts, reduce slow-moving inventory, fund growth with share capital rather than debt, and hold dividends until earnings recover.
Common errors
- Using total revenue instead of credit sales or credit purchases in the days ratios.
- Adding the payables days to the cycle instead of subtracting them.
- Using profit for the year in interest cover instead of profit from operations.
- Leaving non-current liabilities out of the denominator of gearing.
- Using only the final dividend in dividend per share, rather than interim plus final.
- Describing a ratio without saying whether the change is good or bad for a stated user.
Frequently asked questions
How do you calculate the working capital cycle? Working capital cycle (days) = trade receivables turnover (days) + inventory turnover (days) − trade payables turnover (days). A longer cycle needs more finance.
How is gearing calculated in Cambridge 9706? Gearing (%) = non-current liabilities ÷ (issued ordinary share capital + all reserves + non-current liabilities) × 100. Leaving non-current liabilities out of the denominator is a common error.
Which profit figure is used for interest cover? Interest cover = profit from operations ÷ interest payable. Using profit for the year instead of profit from operations is a common mistake.
Can I use any ratio formula in a Cambridge 9706 answer? No. Only the formulae in the appendix to section 3 of the syllabus are accepted. An incorrect formula is not credited, although the figure it produces can be credited as your own figure in later work.
How should a recommendation be structured in ratio analysis? State who you are advising, give the recommendation, then a reason for and a reason against, and finish with a justified decision. A recommendation without a reason against is judged incomplete.
Official syllabus
Cambridge International AS & A Level Accounting 9706 syllabus for 2026, 2027 and 2028, published by Cambridge University Press & Assessment (Cambridge International Education): section 3.5 Analysis and communication of accounting information, and the appendix to section 3.
Get free revision emails (optional)
Occasional emails with practice questions, worked explanations and links to free resources for the qualification and subjects you choose. No spam, and you can unsubscribe from any email. The free tools on this site never need an email.
Related resources
-
Study guides
A Level Accounting: Accounting for Non-Current Assets (Cambridge 9706)
Capital versus revenue spending, why assets depreciate depreciation methods, cost and revaluation models and disposals, for Cambridge 9706 Accounting topic 1.3.
Accounting · Cambridge · AS Level
Read guide -
Practice questions
A Level Accounting: Analysis and communication of accounting info (Cambridge 9706) – Practice Questions
Eleven original questions with worked answers on working capital cycle, gearing, interest cover and investor ratios for Cambridge 9706 A Level Accounting.
Accounting · Cambridge · A Level
Try questions -
Revision notes
A Level Accounting: Analysis and communication of accounting information (Cambridge 9706) – Revision Notes
Formula tables, a worked company, self-test questions and common mistakes for Cambridge 9706 A Level Accounting ratio analysis, section 3.5.
Accounting · Cambridge · A Level
Revise topic
Related articles
-
teaching
A Level tuition in Dubai: Cambridge or Pearson Edexcel International A Level?
Schools in Dubai and Abu Dhabi teach either Cambridge International AS & A Level or Pearson Edexcel International A Level. How the two are structured, why it matters for tuition, and how online classes from Lahore work.
9 October 2026
-
curriculum guides
Choosing subjects at IGCSE and A Level
How subject choices at 14 and 16 affect university options later, and how to keep pathways open without overloading a timetable.
28 July 2026
Studying this with a teacher
Working through Accounting A LEVEL?
This page is free and stays free. If you would rather be taught it, Marlbridge runs Accounting classes one-to-one and in small groups of up to 15, online in your own time zone. The first trial class is free. WhatsApp replies within an hour (8am–11pm Pakistan time, every day); email the same day.
Cambridge Accounting teachers at Marlbridge