Revision Notes
A Level Accounting: Analysis and communication of accounting information (Cambridge 9706) – Revision Notes
Formula tables, a worked company, self-test questions and common mistakes for Cambridge 9706 A Level Accounting ratio analysis, section 3.5.
- Subject
- Accounting
- Level
- A LEVEL
- Topic
- Financial accounting
- Author
- Marlbridge Academic Team
- Updated
- Reviewed by
- Zain Ud Din Ahmed (what this means)
Aligned to Cambridge A Level Accounting (9706), 2026-2028. Official specification .
Syllabus page (what it covers and how it is assessed): Cambridge A Level Accounting.
Syllabus points this page covers
9706 (A Level)
- 3.5 Analysis and communication of accounting information
Found an error? Report a correction.
Need help with this topic? Request a free trial class for A Level Accounting (9706).
Quick-recall notes for section 3.5 Analysis and communication of accounting information (A Level) in the Cambridge International AS & A Level Accounting 9706 syllabus for 2026, 2027 and 2028, examined on Paper 3 (Financial Accounting). For explanations and a full worked company, read the study guide, then test yourself with the practice questions. See also the course hub, the printable checklist and the free diagnostics.
Formulae to know exactly
The syllabus says the appendix formulae are the only ones accepted in answers and that ratios are not given in the question paper. Use year-end balances unless the question specifies average figures, and the number of decimal places the question asks for.
| Ratio | Formula | Shown as |
|---|---|---|
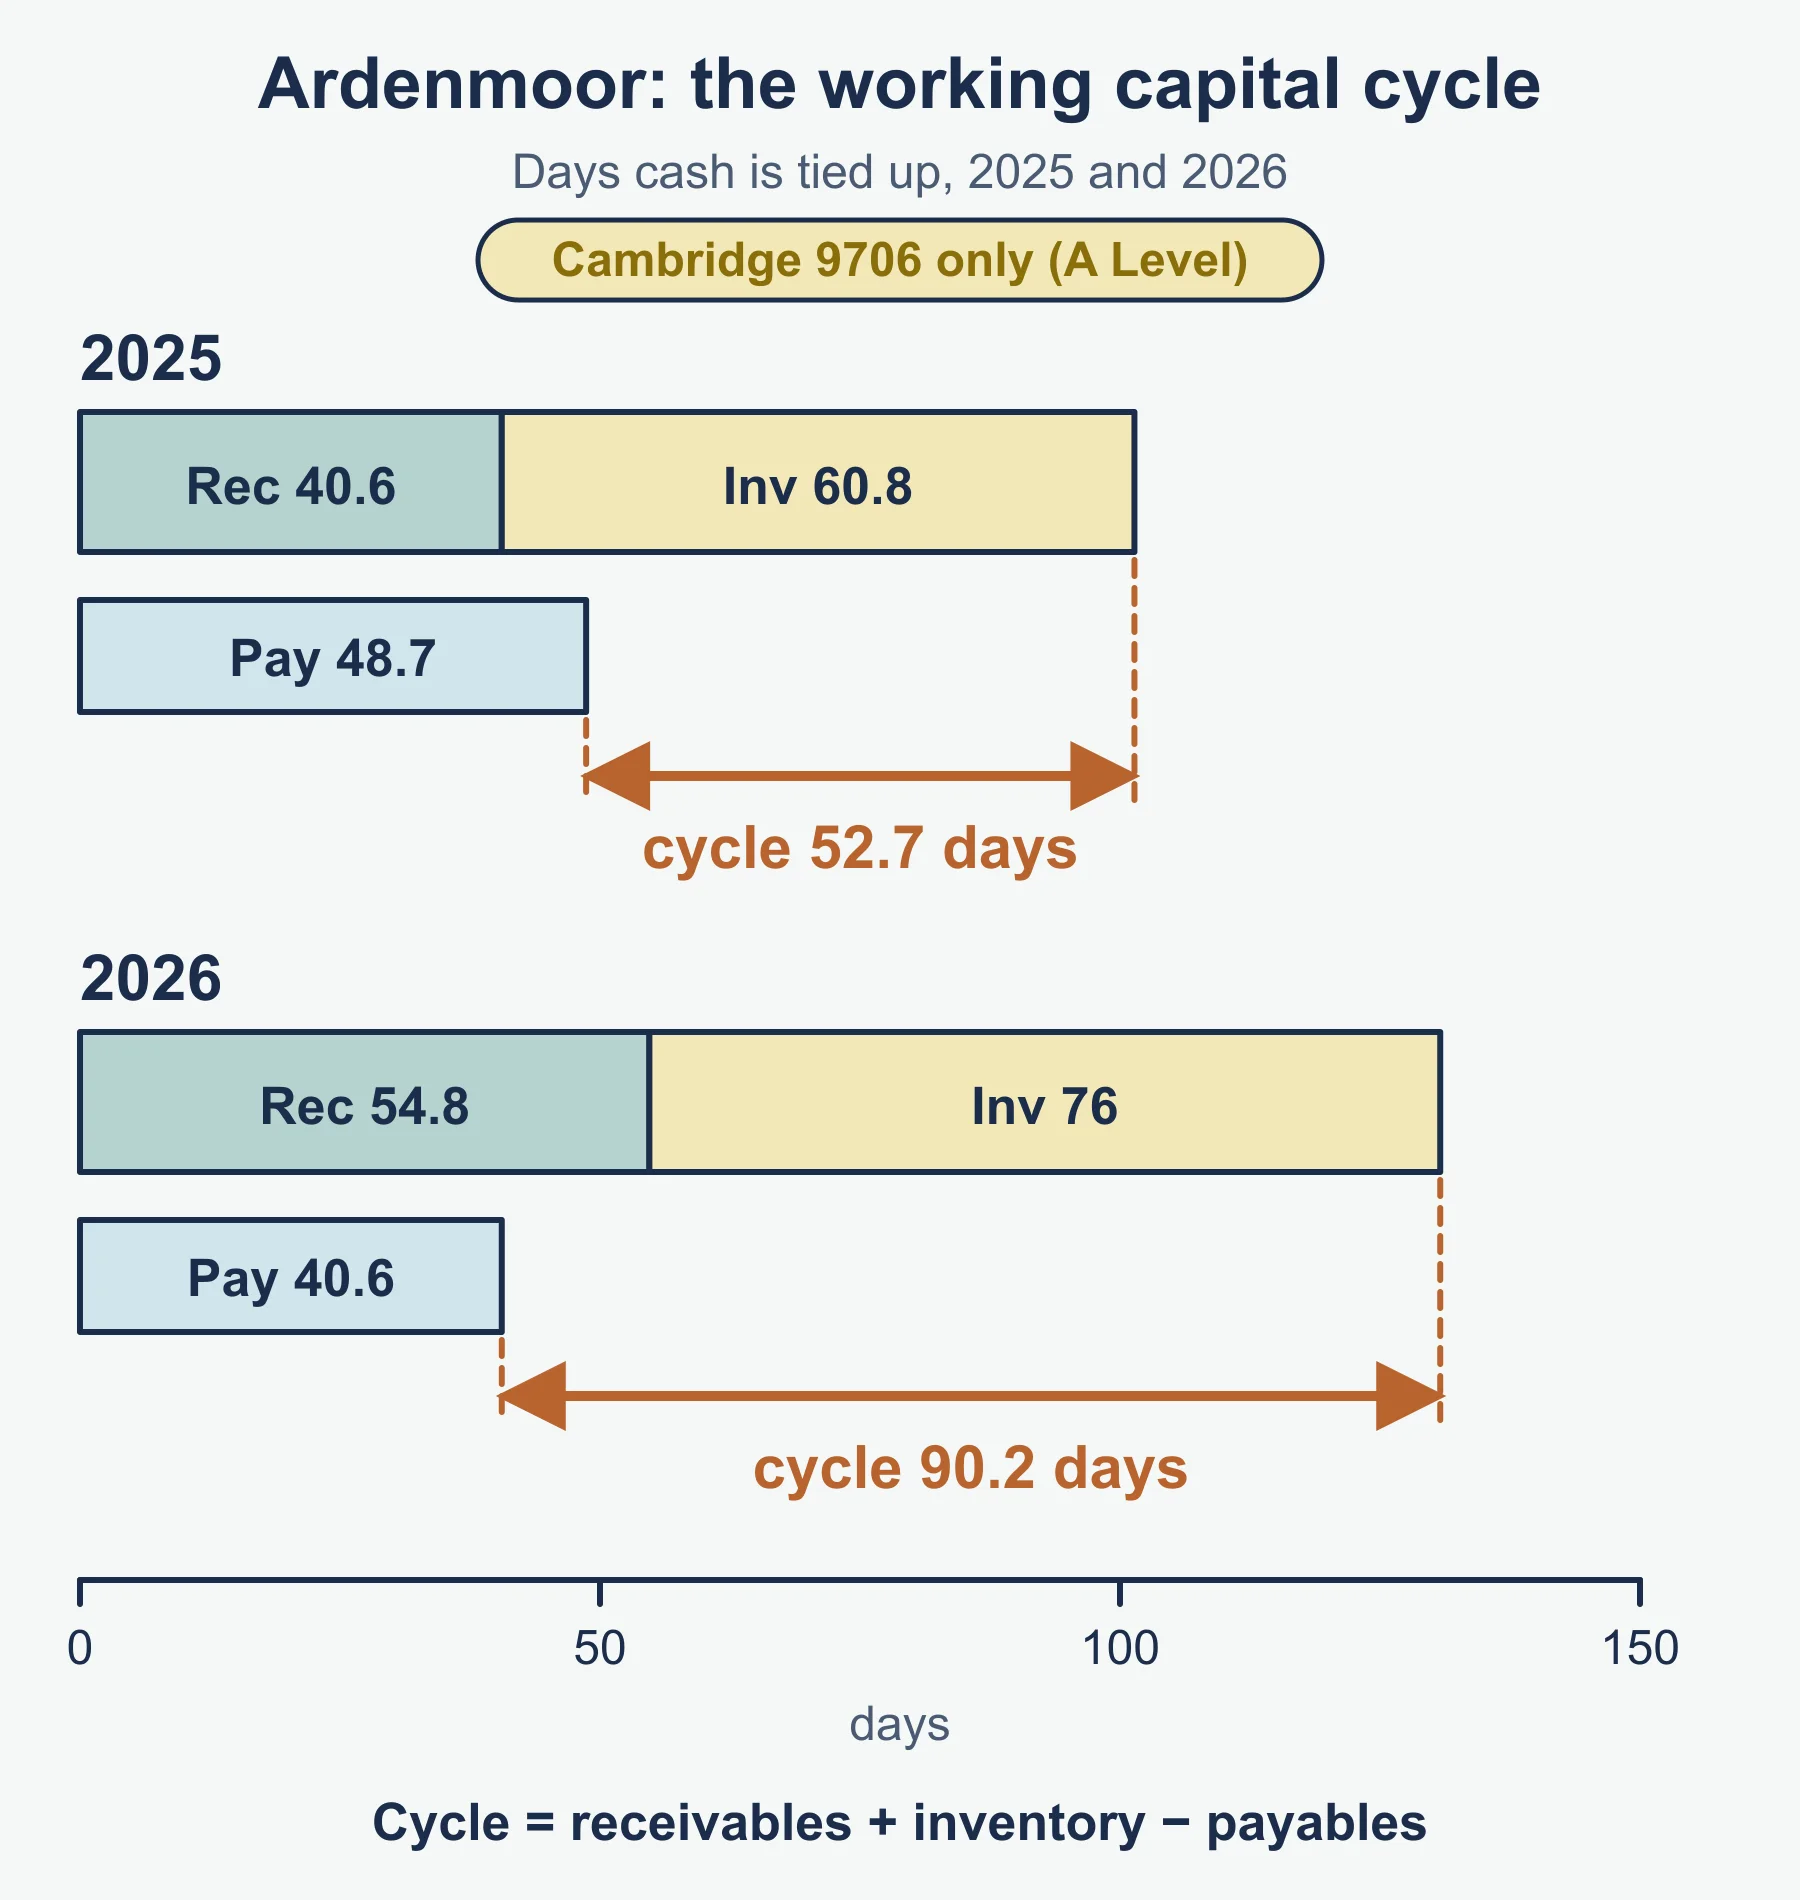
| Working capital cycle | Receivables days + inventory days − payables days | days |
| Receivables days | Trade receivables ÷ credit sales × 365 | days |
| Inventory days | Average inventory ÷ cost of sales × 365 | days |
| Payables days | Trade payables ÷ credit purchases × 365 | days |
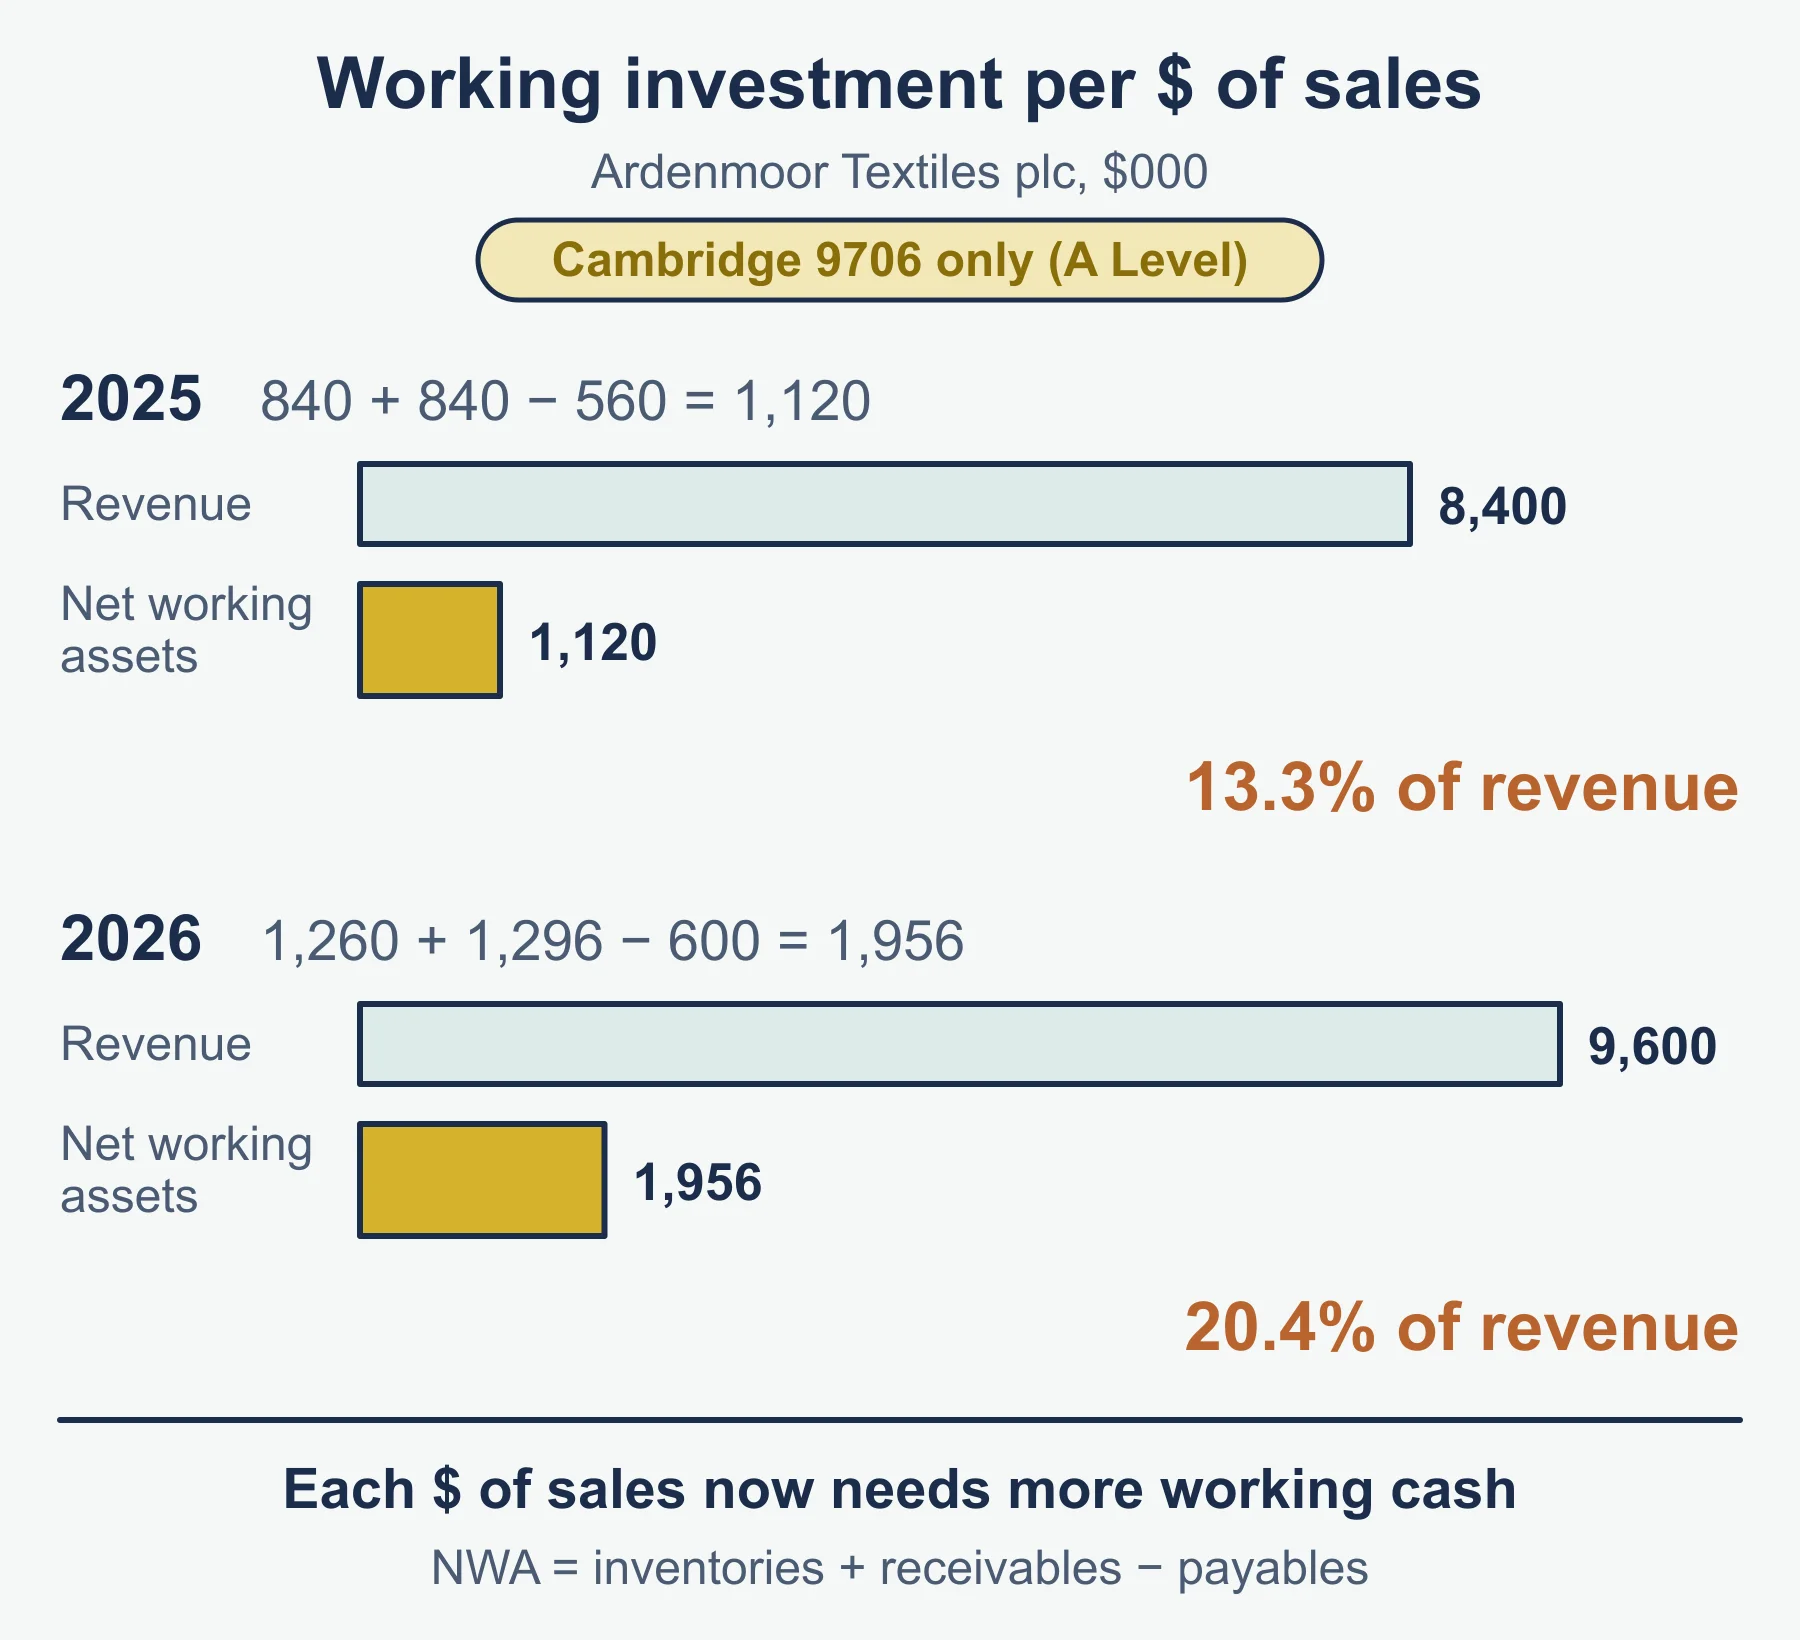
| Net working assets to revenue | (Inventories + trade receivables − trade payables) ÷ revenue × 100 | % |
| Interest cover | Profit from operations ÷ interest payable | times |
| Gearing | Non-current liabilities ÷ (issued ordinary share capital + all reserves + non-current liabilities) × 100 | % |
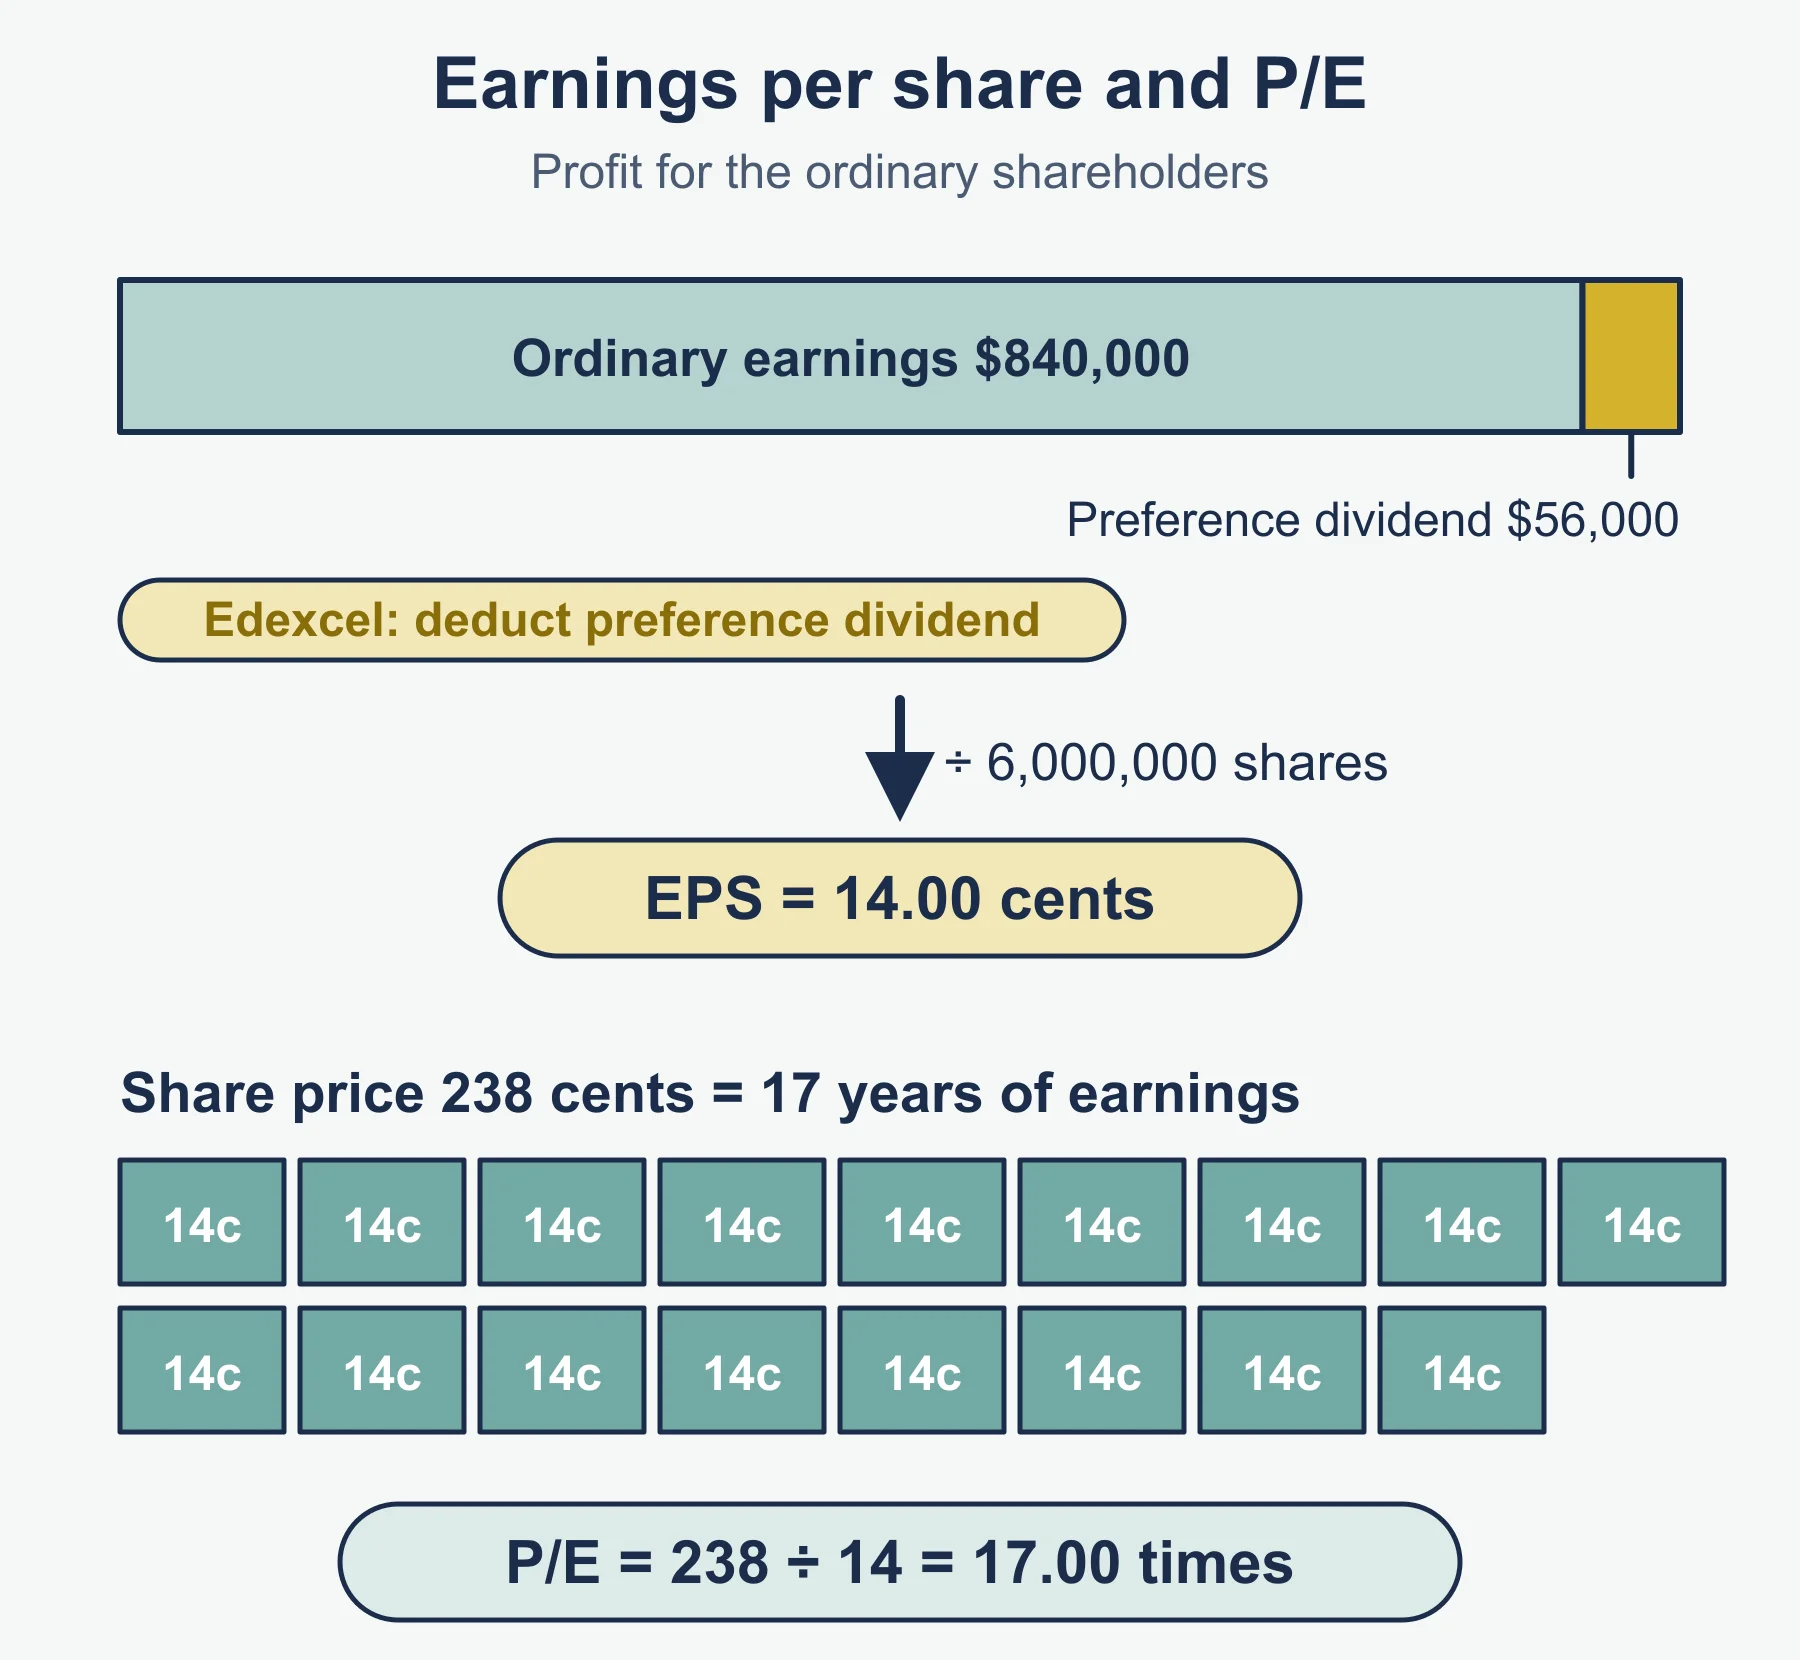
| Earnings per share | Profit for the year ÷ number of issued ordinary shares | cents or dollars |
| Price/earnings | Market price per share ÷ earnings per share | no unit printed |
| Dividend per share | (Interim dividend paid + final dividend proposed) ÷ number of issued ordinary shares | cents or dollars |
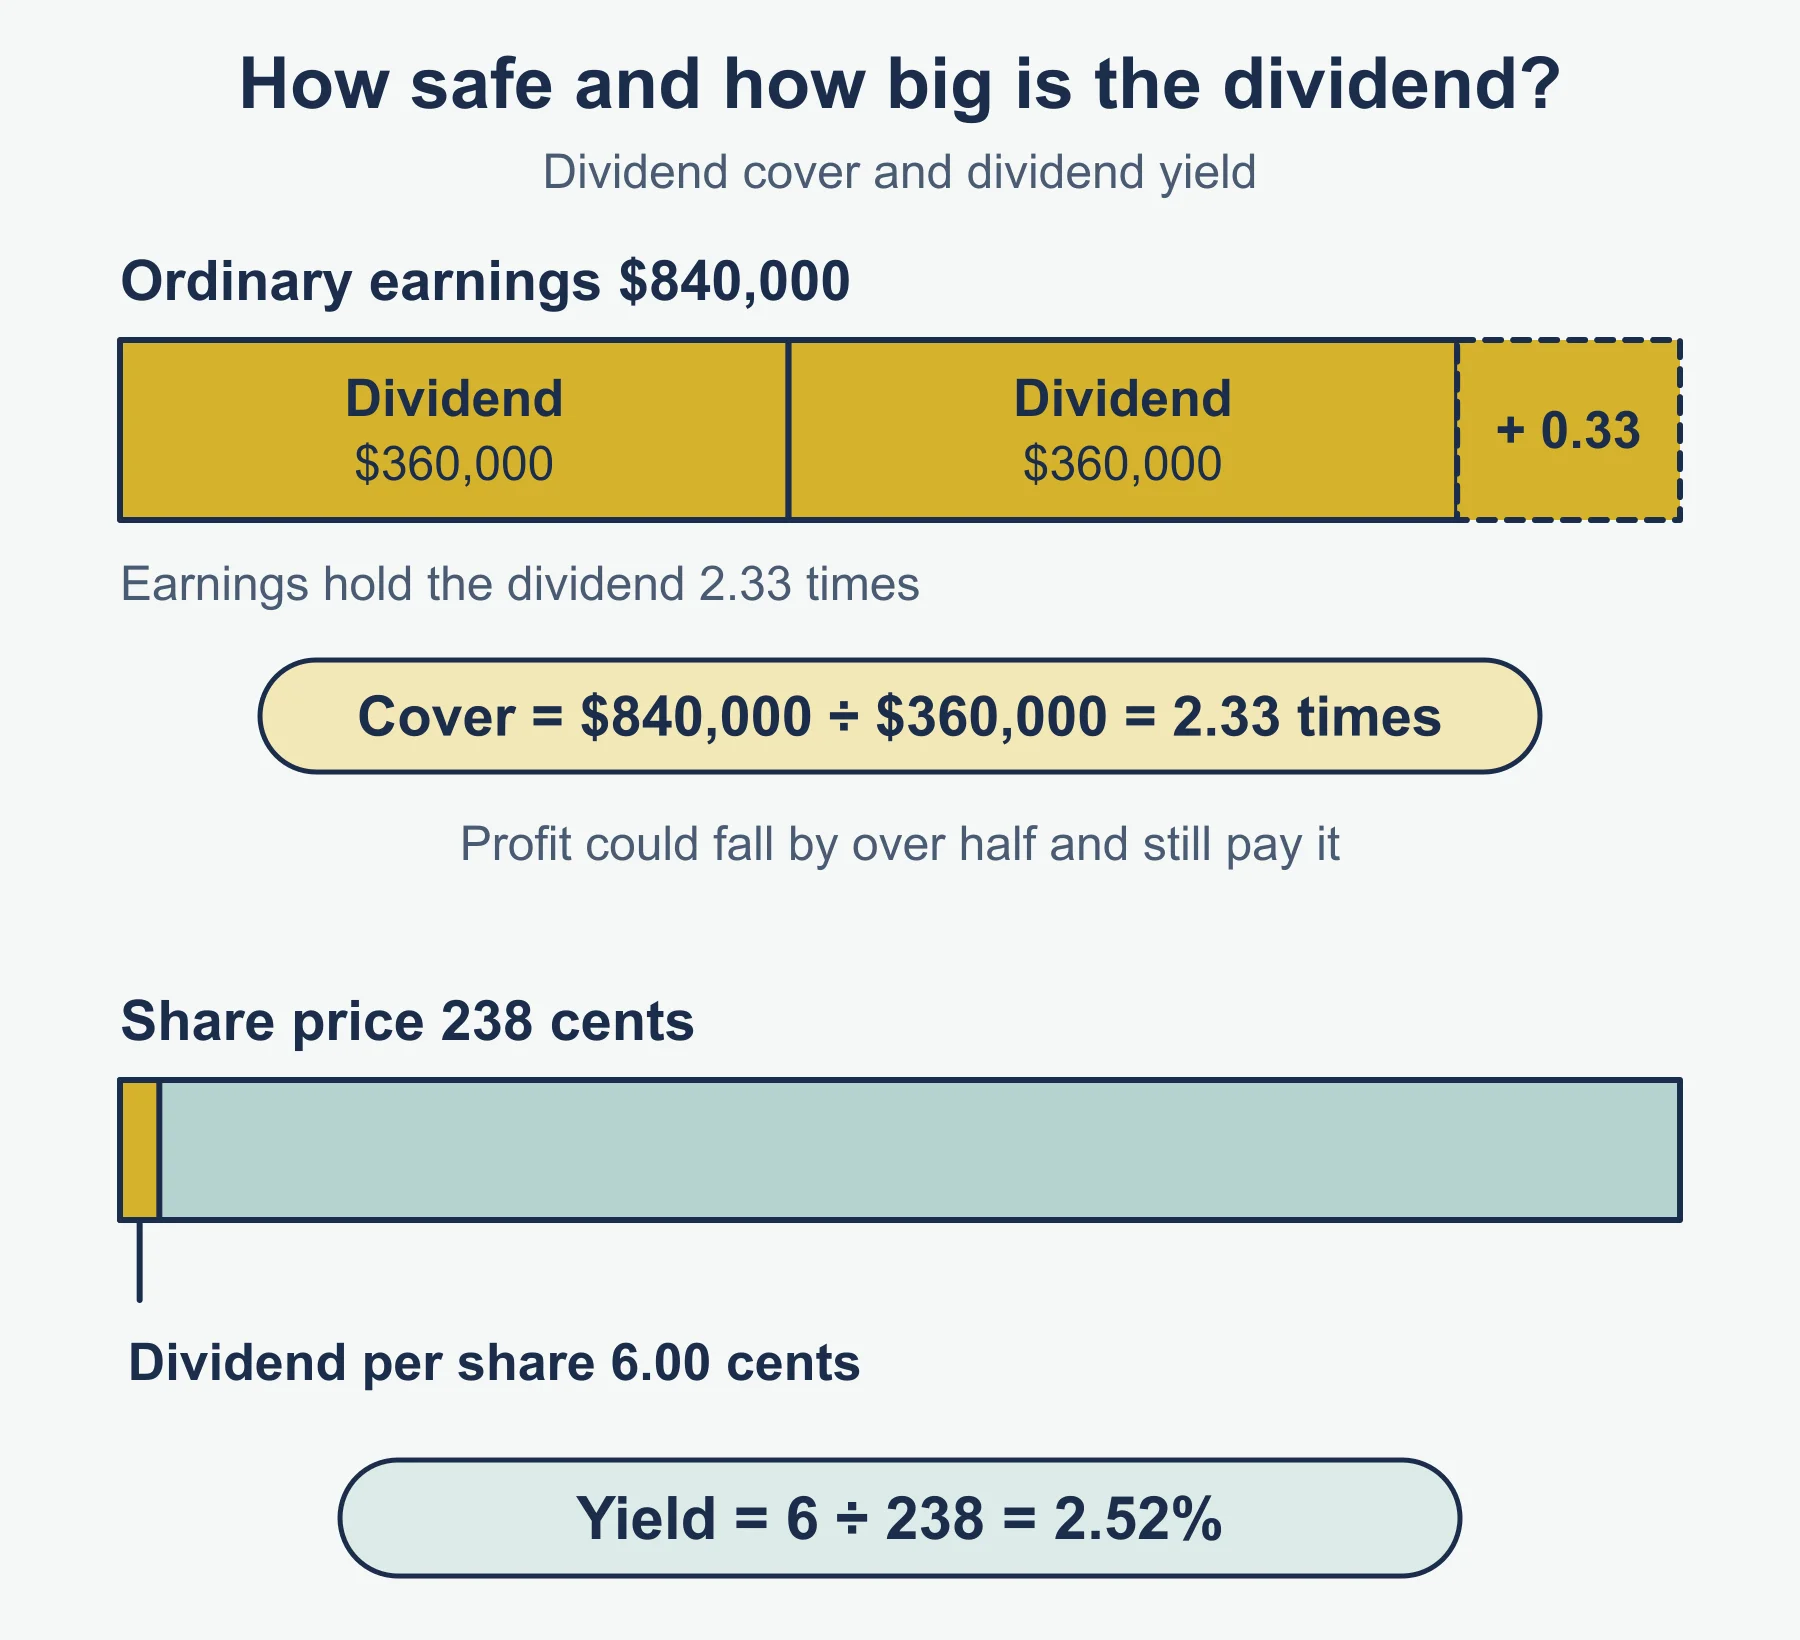
| Dividend yield | Dividend per share ÷ market price per share | no multiplier or unit printed |
| Dividend cover | Profit for the year available to pay ordinary dividend ÷ annual ordinary dividend | times |
Method in six steps
- Write the formula from memory before touching the figures.
- Pick the right inputs: credit sales for receivables, credit purchases for payables, cost of sales for inventory, profit from operations (before interest) for interest cover.
- Keep share numbers and money in the same units (thousands with thousands).
- Calculate, then round only at the end, to the decimal places asked.
- Calculate the same ratio for the comparison year or business.
- State the change, the likely cause, who is affected and your judgement.
Worked reminder: Saltwick Tools plc
Invented figures in $000: revenue 5,000; credit sales 4,000; cost of sales 3,000; credit purchases 2,400; inventories 500; trade receivables 400; trade payables 300; profit from operations 600; interest payable 150; profit for the year 360; 1,500 thousand ordinary shares; non-current liabilities 1,250; share capital 1,500; reserves 1,900; interim dividend 45; final dividend proposed 75; market price 4.80 dollars.
| Ratio | Working | Result |
|---|---|---|
| Receivables days | 400 ÷ 4,000 × 365 | 36.5 |
| Inventory days | 500 ÷ 3,000 × 365 | 60.8 |
| Payables days | 300 ÷ 2,400 × 365 | 45.6 |
| Working capital cycle | 36.5 + 60.8 − 45.6 | 51.7 days |
| Net working assets to revenue | (500 + 400 − 300) ÷ 5,000 × 100 | 12.0% |
| Interest cover | 600 ÷ 150 | 4.0 times |
| Gearing | 1,250 ÷ (1,500 + 1,900 + 1,250) × 100 | 26.9% |
| Earnings per share | 360 ÷ 1,500 | 24.0 cents |
| Price/earnings | 4.80 ÷ 0.24 | 20.0 |
| Dividend per share | (45 + 75) ÷ 1,500 | 8.0 cents |
| Dividend yield | 0.08 ÷ 4.80 | 0.0167 (1.67%) |
| Dividend cover | 360 ÷ 120 | 3.0 times |
Must-know distinctions
- Working capital cycle versus net working assets to revenue. One is in days and measures time; the other is a percentage and measures the amount invested per dollar of sales.
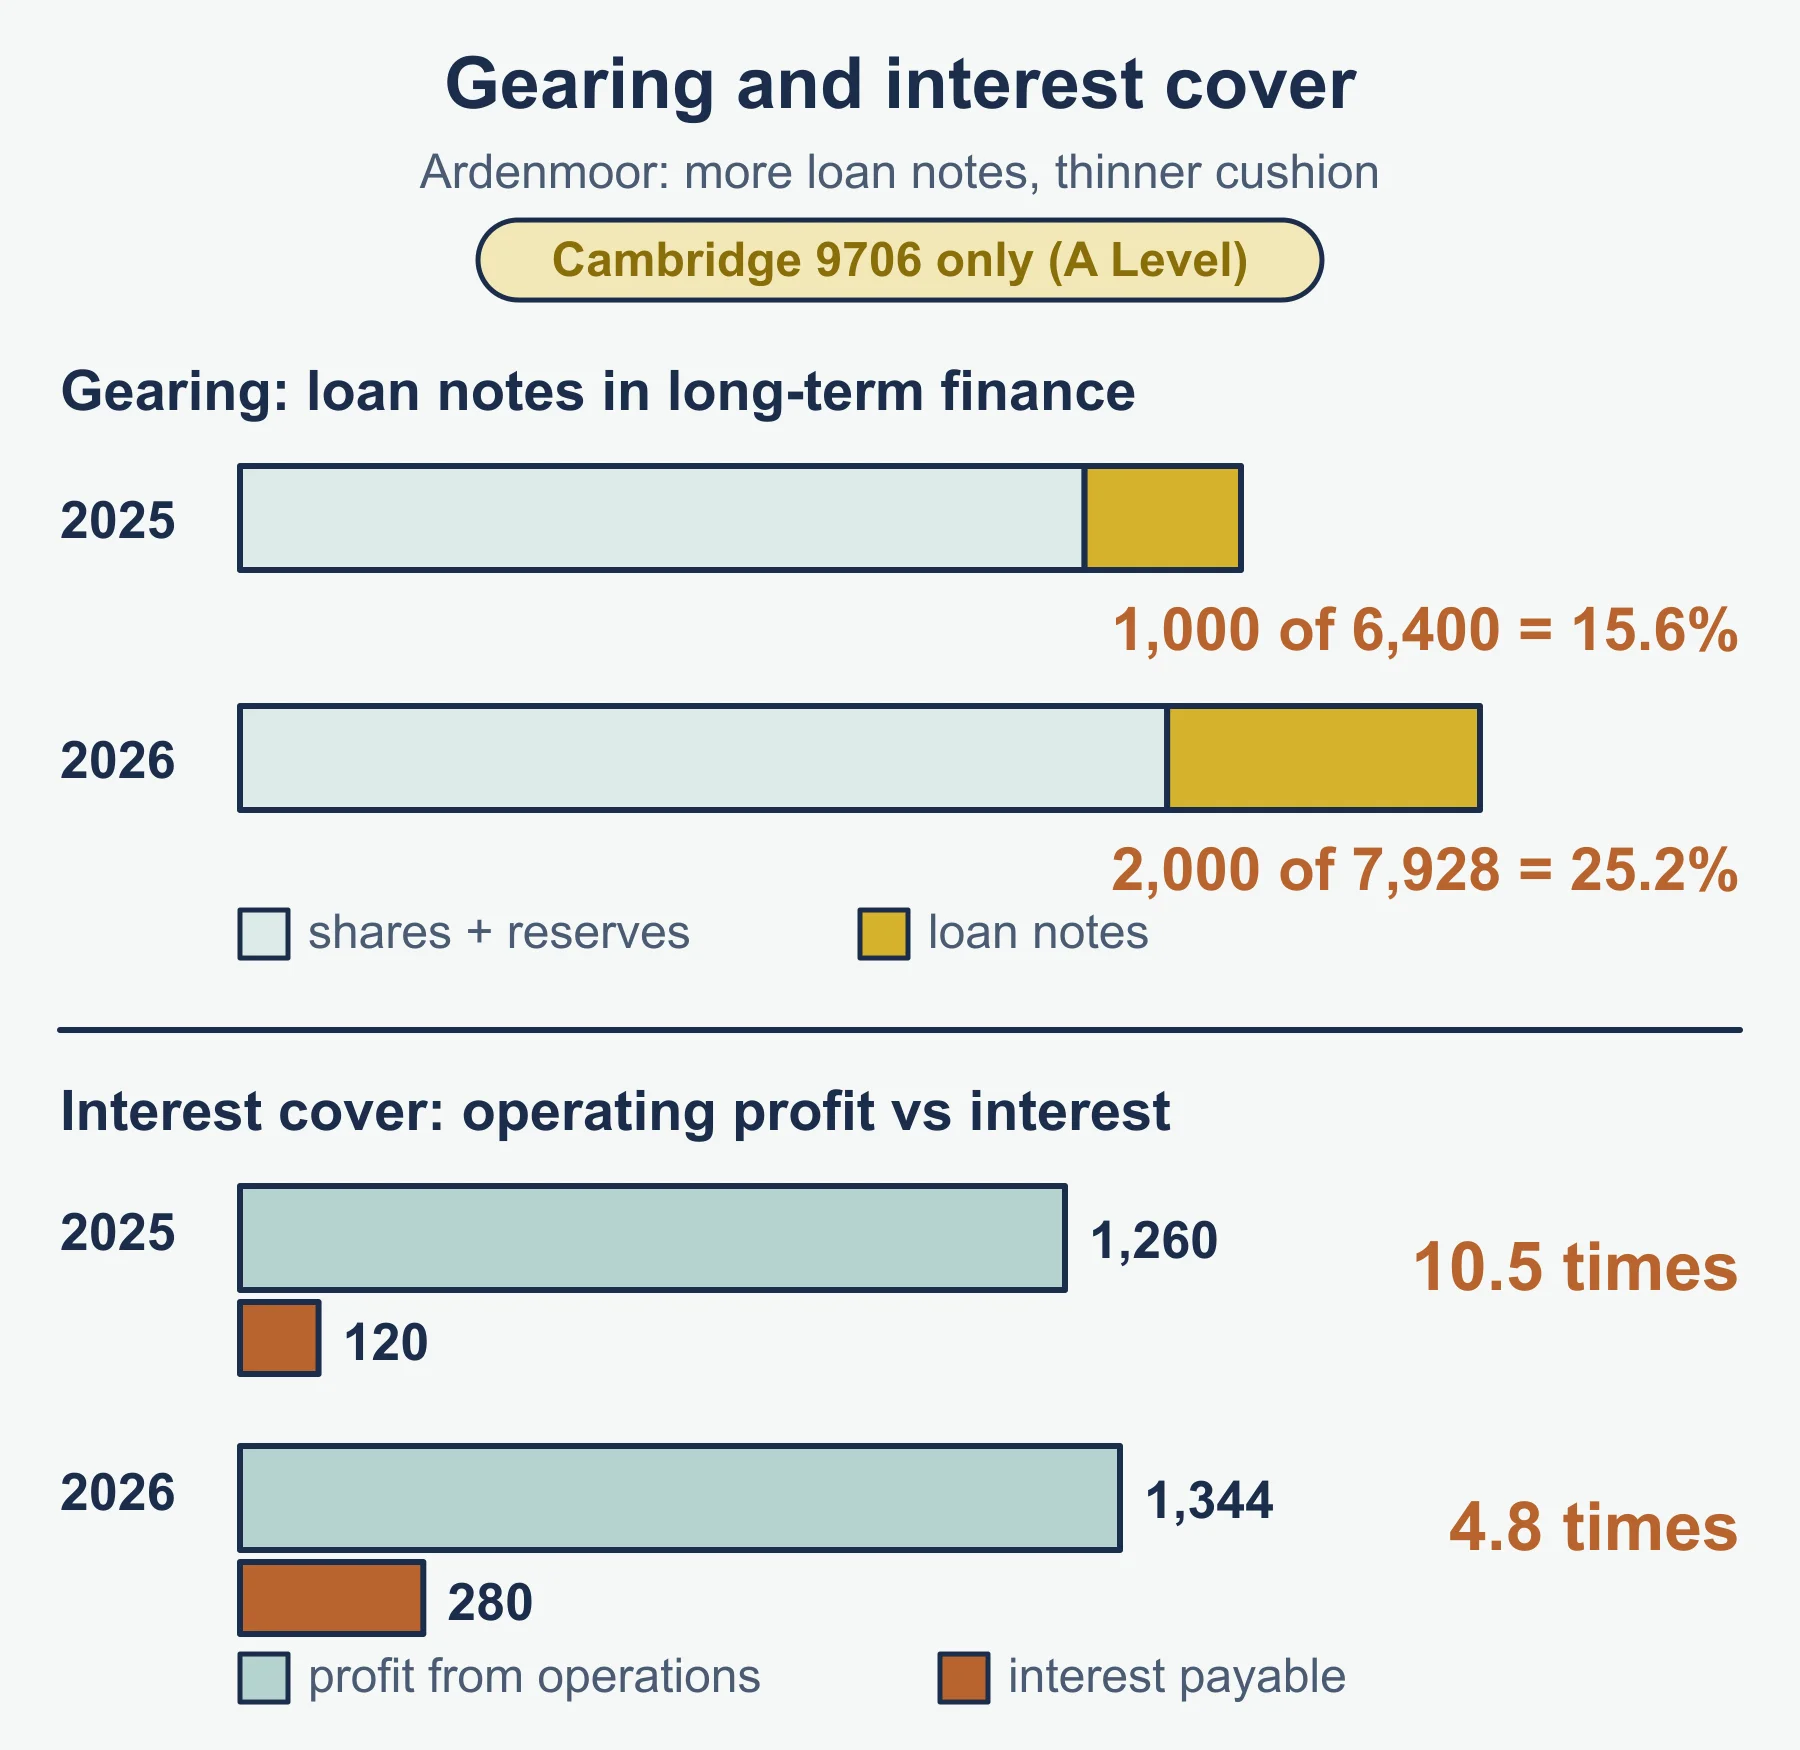
- Interest cover versus gearing. Interest cover tests whether profit pays the interest now. Gearing tests how much of the long-term capital is borrowed. A business can have low gearing and weak cover if profit is small.
- Earnings per share versus dividend per share. Earnings belong to shareholders whether paid or kept. Dividend per share is what is declared, interim plus final.
- Dividend cover versus dividend yield. Cover looks at the company’s side (how safely it can pay). Yield looks at the investor’s side (return on today’s price).
- Price/earnings versus yield. P/E compares price with profit; yield compares price with dividend. A high P/E with a low yield suggests investors expect growth.
- Profit from operations versus profit for the year. Interest cover uses the first; earnings per share and the dividend ratios use profit for the year.
Reading the movement
| If this happens | The usual consequence |
|---|---|
| Customers pay more slowly | Cycle lengthens, more finance needed, possible overdraft cost |
| Inventory builds up | Cycle lengthens, more storage and obsolescence risk |
| Suppliers are paid sooner | Cycle lengthens; suppliers happier but cash lower |
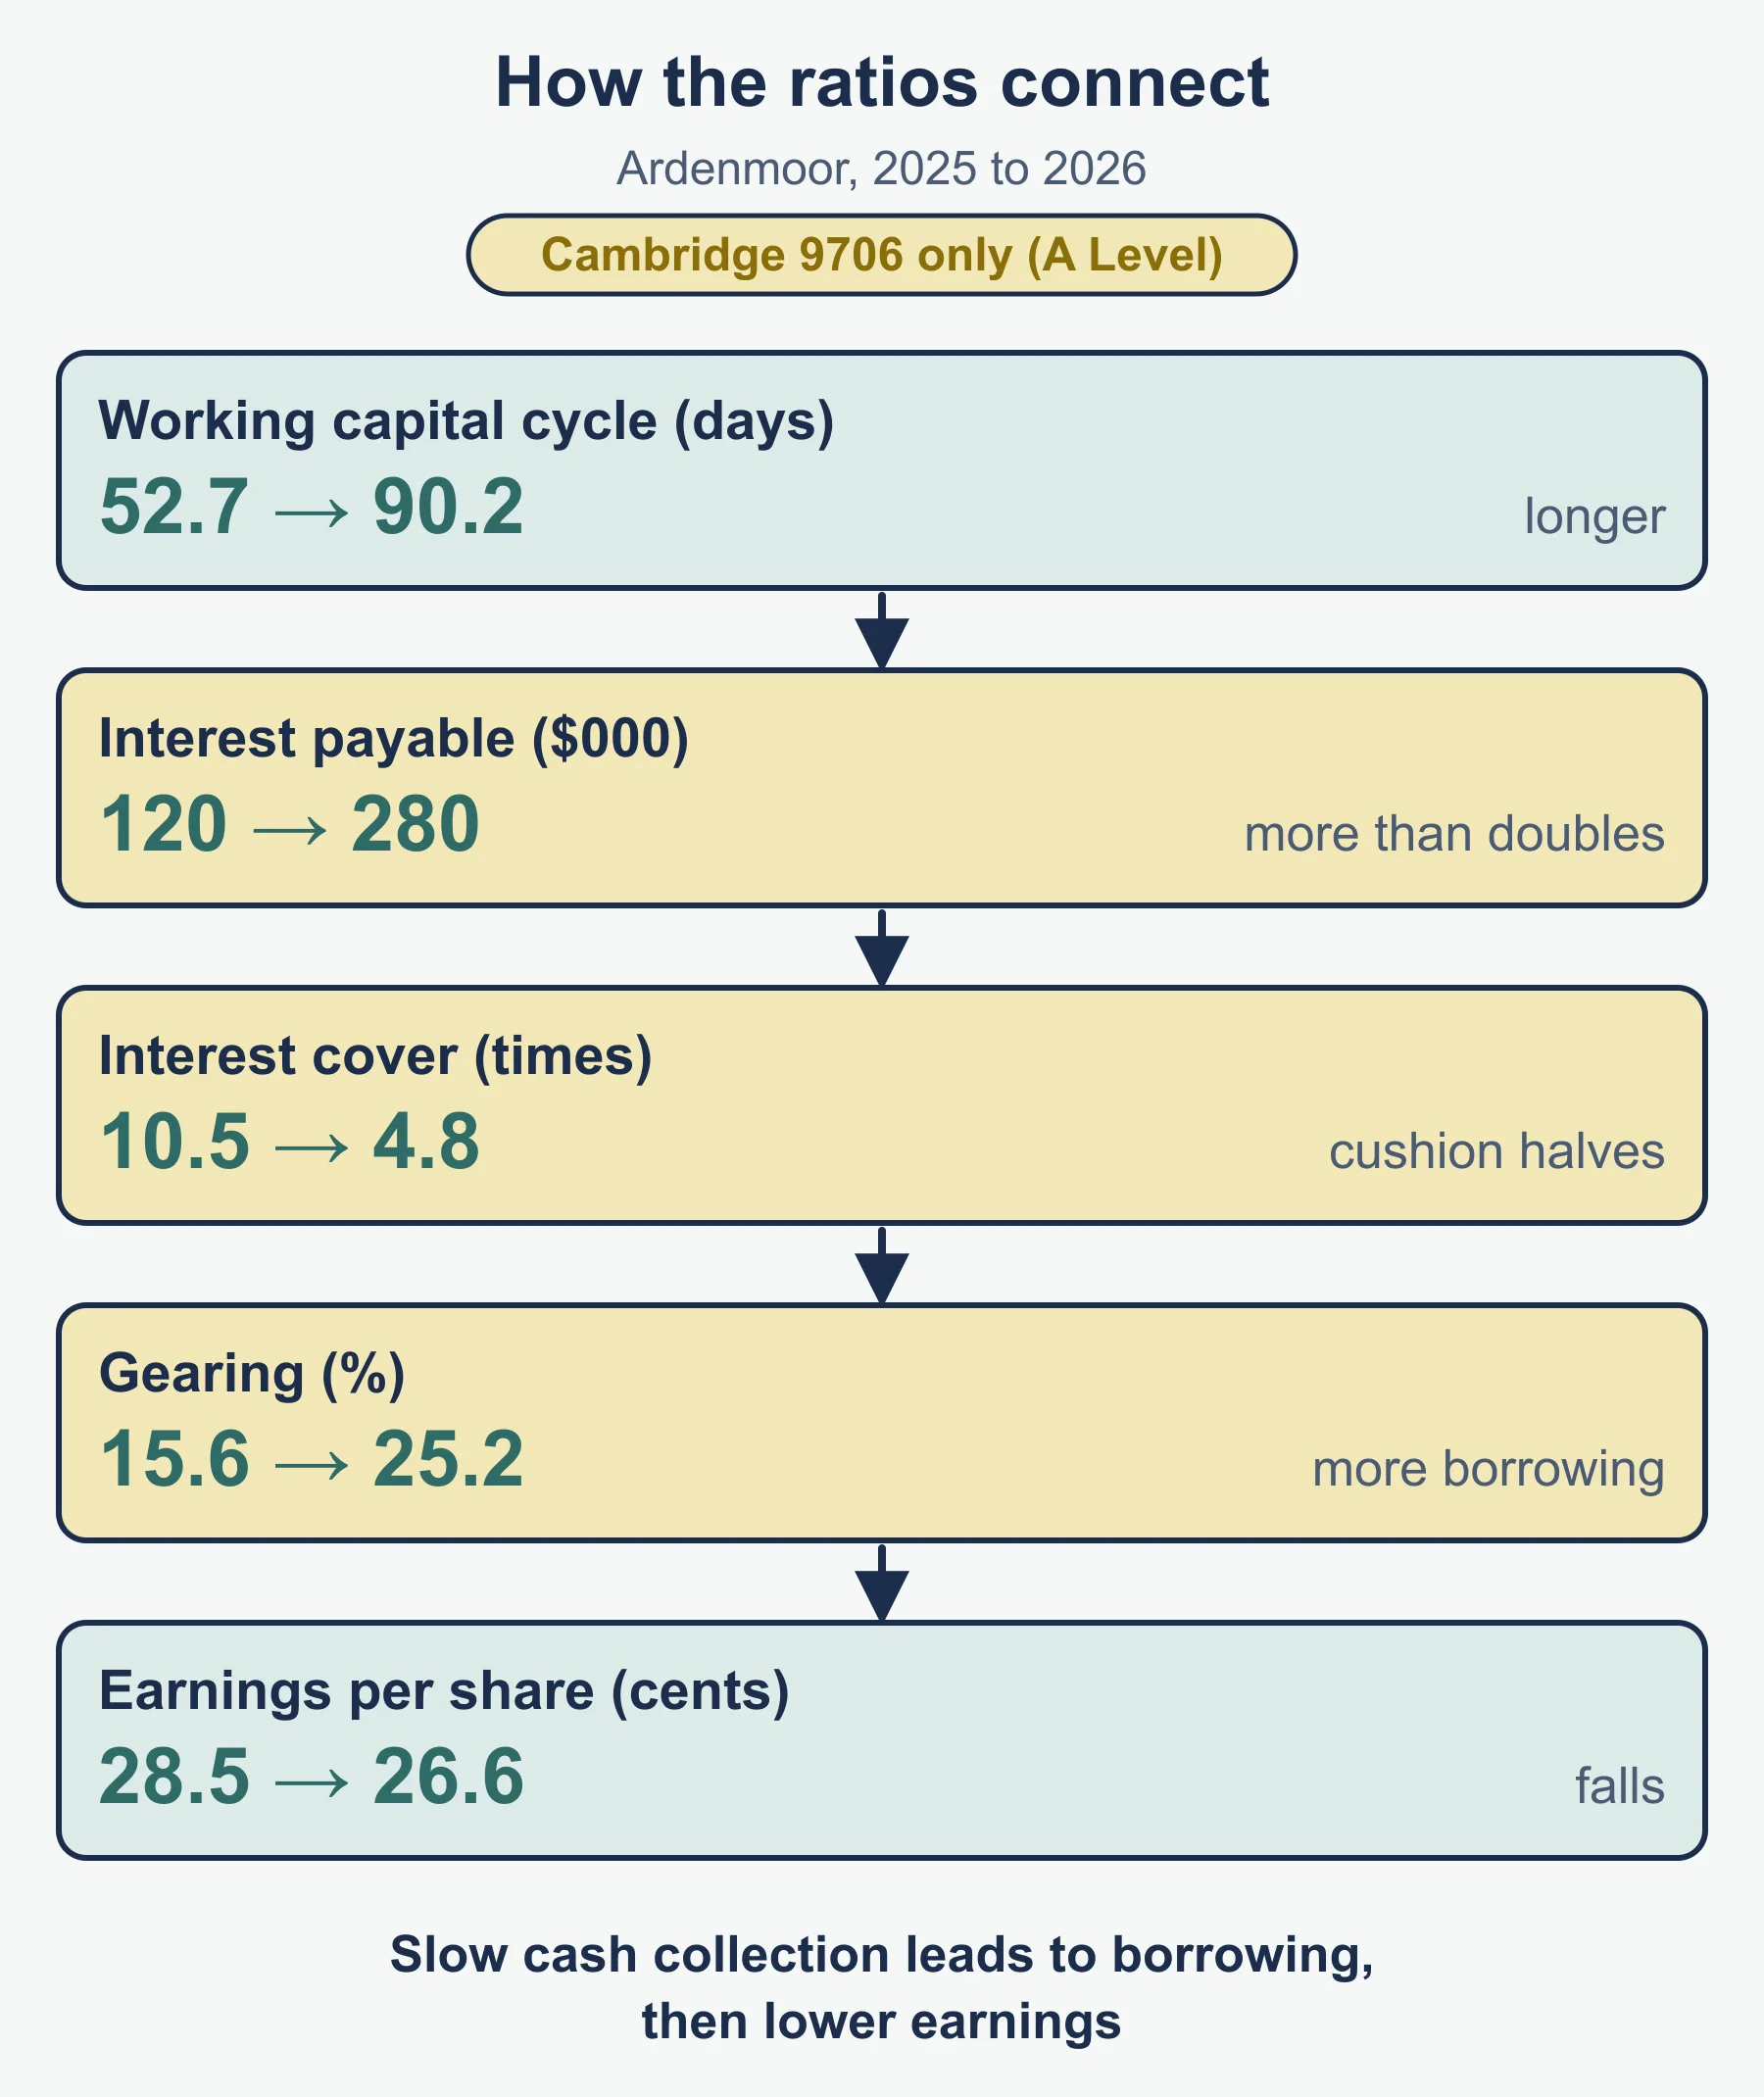
| New loan notes issued | Gearing up, interest payable up, cover down |
| Profit falls but dividend is held | Dividend cover falls, so the dividend is less safe |
| Share price falls, dividend steady | Yield rises, P/E falls |
How ratios interrelate: a longer cycle leads to more borrowing, which raises interest and lowers interest cover and earnings per share. Higher gearing makes earnings per share more sensitive to changes in profit from operations. Dividend cover equals earnings per share divided by dividend per share when there are only ordinary shares.
What high and low figures suggest
| Ratio | Higher figure | Lower figure |
|---|---|---|
| Working capital cycle | Cash tied up longer, more finance needed | Cash recovered faster, but check for late payment of suppliers |
| Net working assets to revenue | Heavy working investment for each dollar of sales | Lean working investment, possibly tight stock |
| Interest cover | Comfortable safety margin for lenders | Profit barely covers interest, risky |
| Gearing | More borrowing and more fixed commitments | More owner finance, safer but returns may be lower |
| Earnings per share | More profit for each share | Less profit for each share |
| Price/earnings | Market expects growth or low risk | Market doubts future earnings |
| Dividend yield | Larger return on today’s price | Smaller cash return, growth may be expected |
| Dividend cover | Dividend is safe, more profit retained | Dividend may not be sustained |
The syllabus says an incorrect formula is not credited, although the figure is credited as your own when used in following calculations, so learn the formulae before practising judgement.
Stakeholders and what each looks at
| Stakeholder | Ratios that matter most |
|---|---|
| Investor or shareholder | Earnings per share, P/E, dividend per share, yield, cover |
| Lender | Interest cover, gearing, working capital cycle |
| Supplier | Payables days, cycle, interest cover |
| Manager | Cycle, net working assets to revenue, gearing |
Recommendation template
Name the user, state the recommendation, give one reason for and one against, quote at least two ratios, then reach a justified decision. The syllabus asks for a balance of reasons, so a one-sided answer is incomplete.
Measures to improve
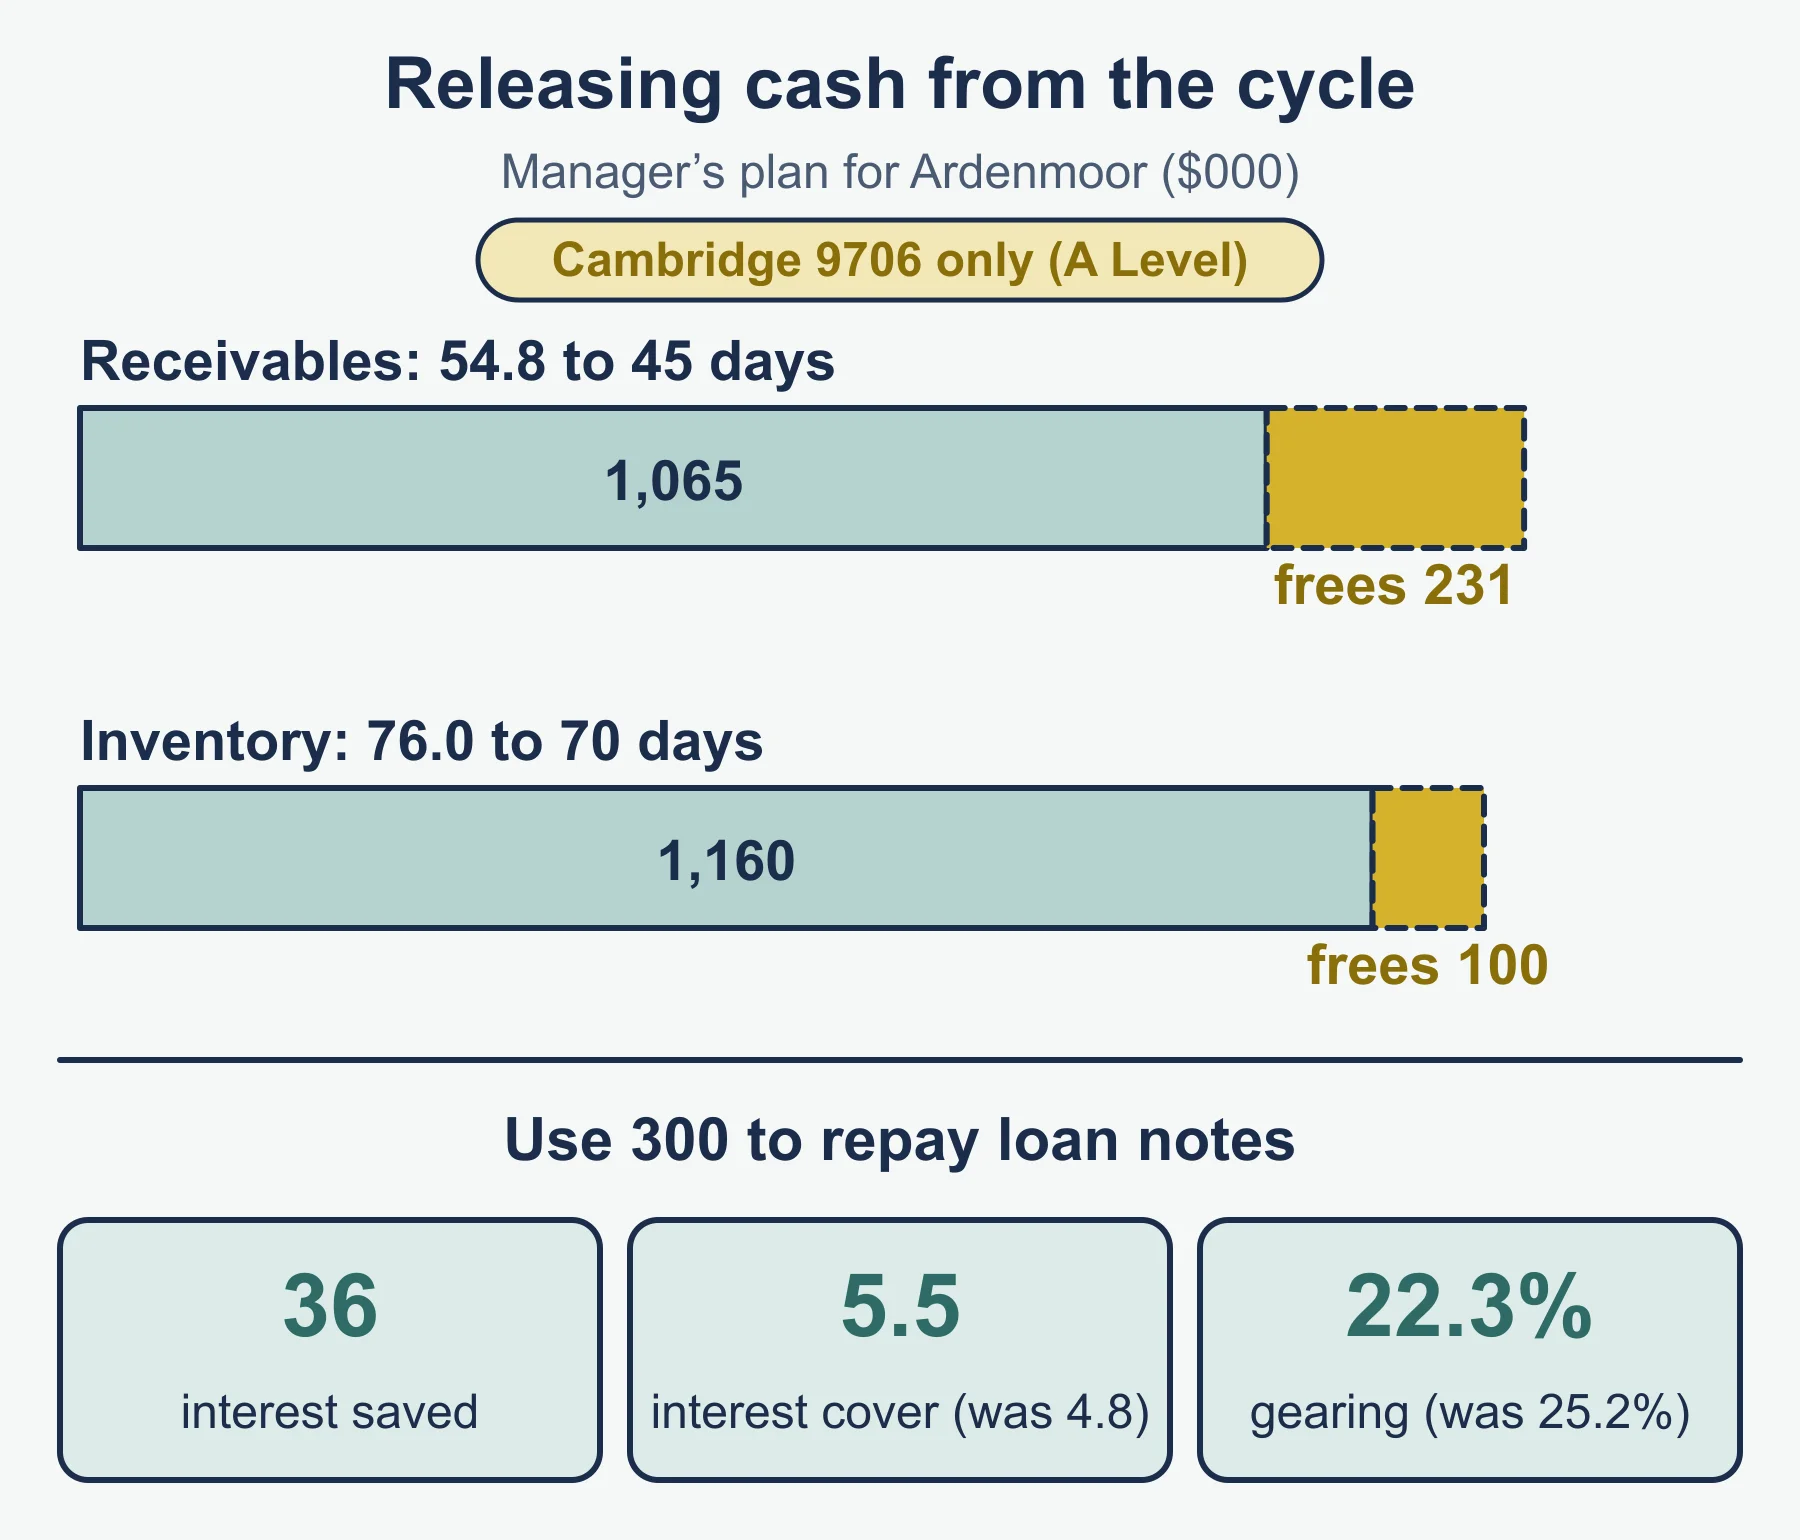
- Shorten the cycle: chase receivables, offer a prompt-payment discount, cut slow-moving inventory, negotiate longer credit from suppliers.
- Improve interest cover: lift profit from operations, repay or refinance expensive debt.
- Lower gearing: issue shares, retain profit, repay loan notes.
- Support the share price and dividend: raise earnings per share, keep a comfortable dividend cover.
Quick self-test
- Trade receivables 270 and credit sales 2,190. Find receivables days.
- Inventory days 58, receivables days 42, payables days 61. Find the working capital cycle.
- Inventories 410, trade receivables 250, trade payables 190, revenue 3,200. Find net working assets to revenue to 1 decimal place.
- Profit from operations 840, interest payable 210. Find interest cover.
- Non-current liabilities 600, issued ordinary share capital 1,000, reserves 1,400. Find gearing.
- Profit for the year 450 and 1,800 thousand ordinary shares. Find earnings per share in cents.
- Market price 3.50 dollars and earnings per share 25 cents. Find price/earnings.
- Interim dividend 30, final dividend proposed 60, 1,800 thousand shares. Find dividend per share in cents.
- Dividend per share 5 cents, market price 1.25 dollars. Find dividend yield as a decimal.
- Profit available to pay ordinary dividend 450, annual ordinary dividend 90. Find dividend cover.
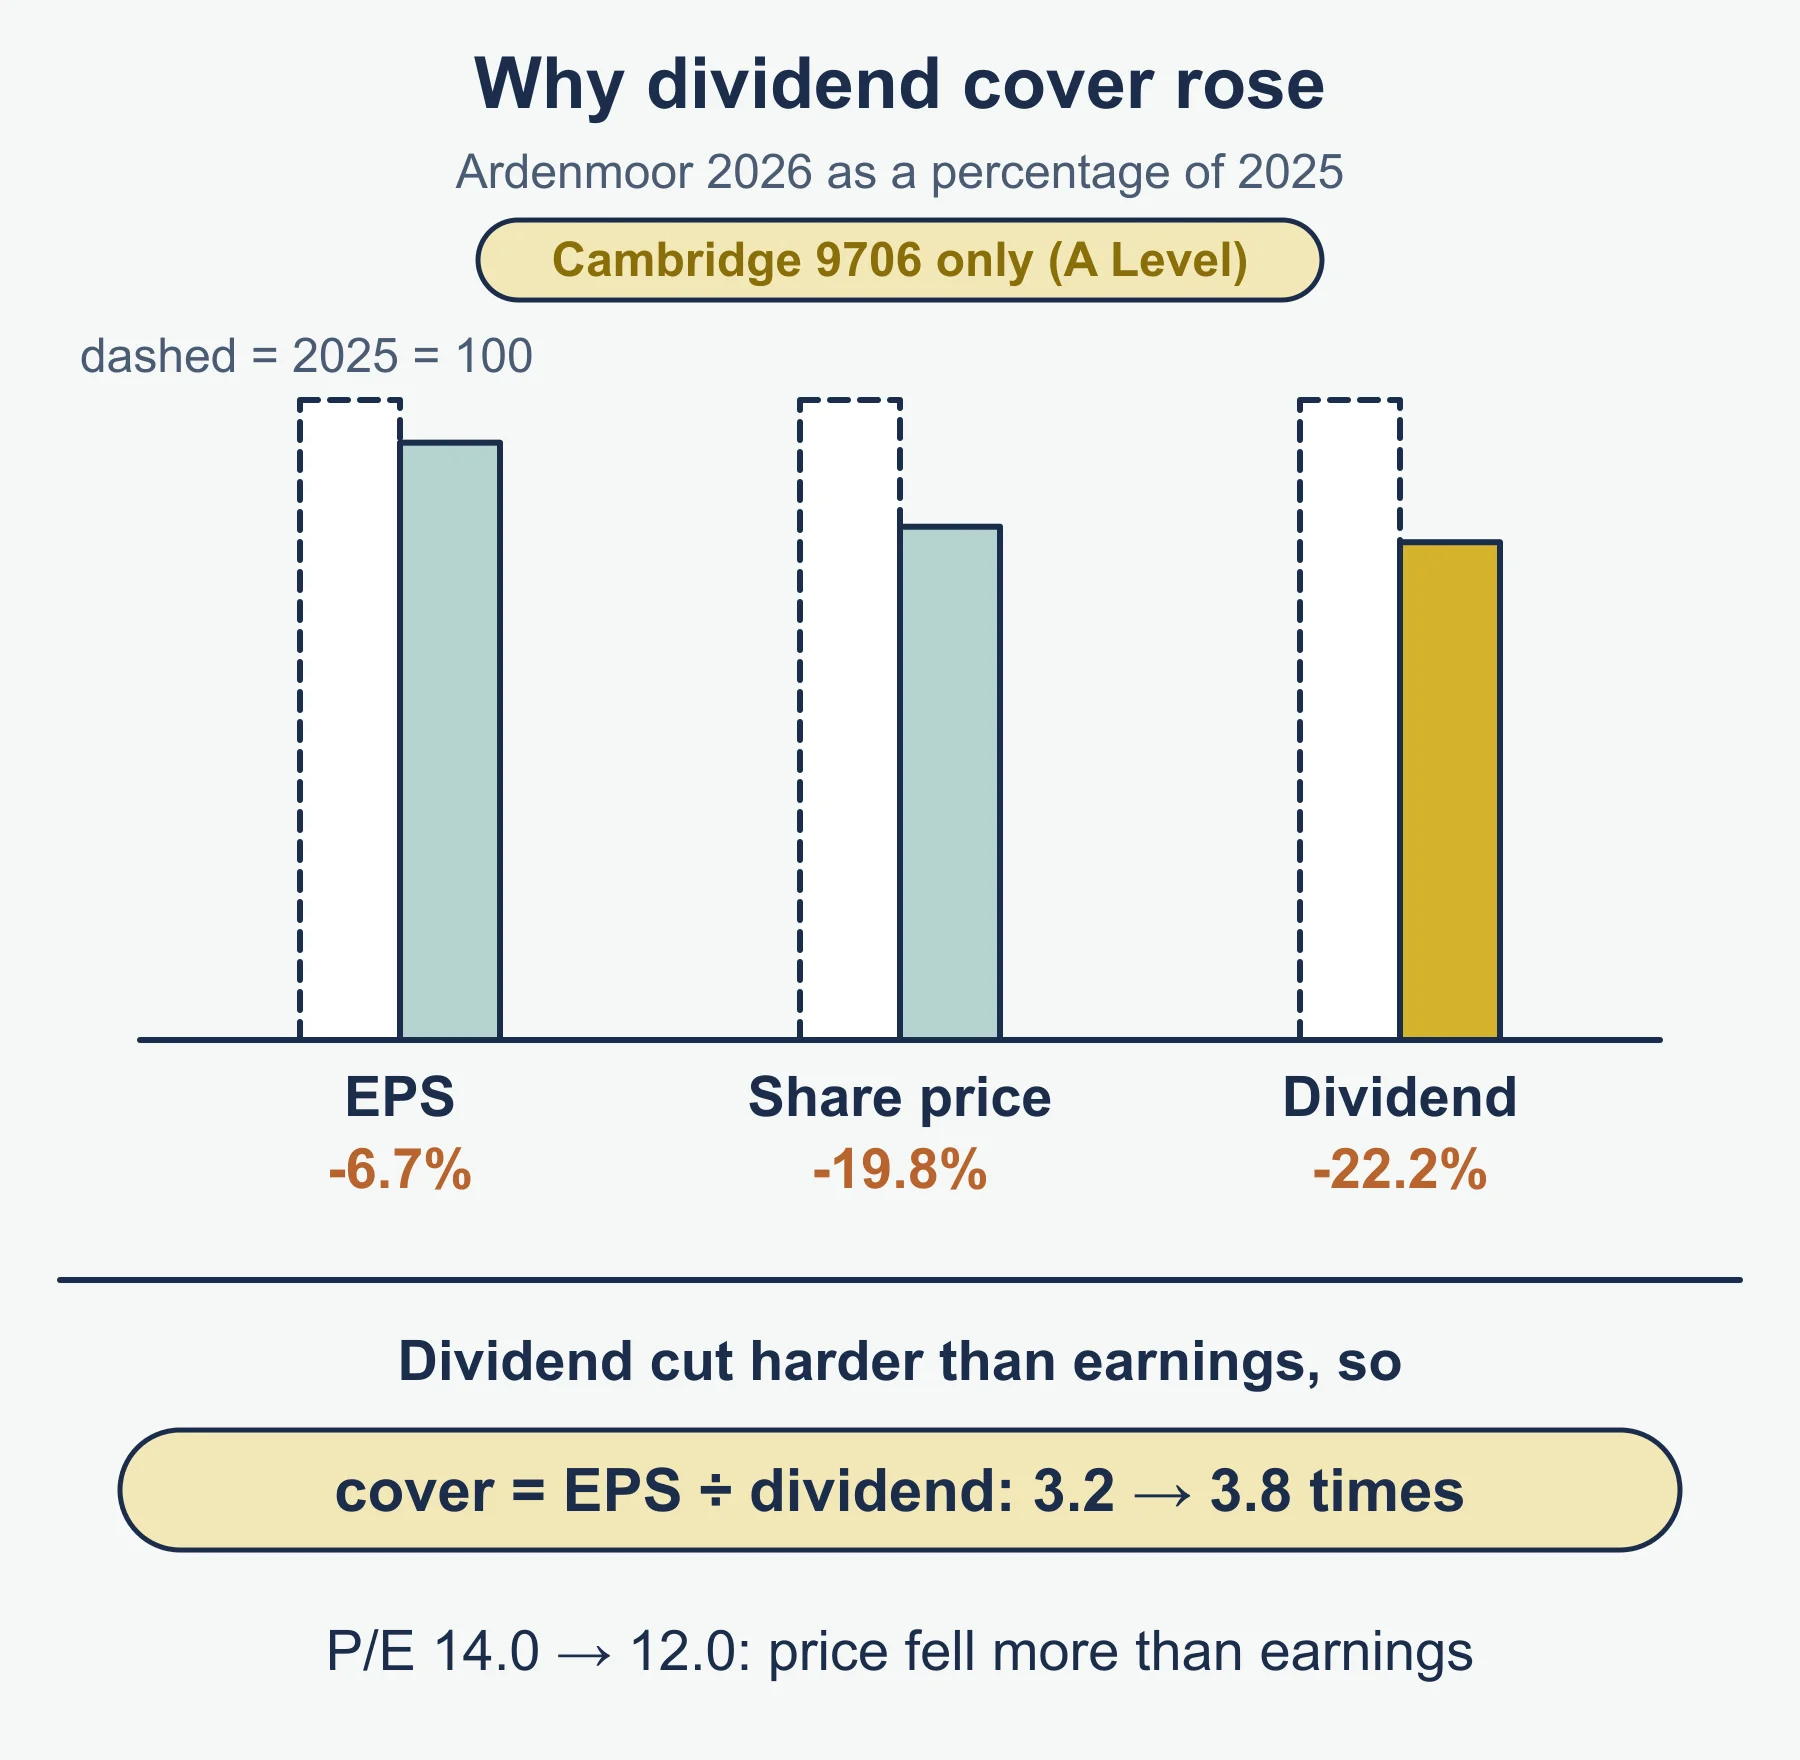
- Earnings fall 10% and the dividend falls 25%. Does dividend cover rise or fall?
Answers
- 270 ÷ 2,190 × 365 = 45.0 days.
- 42 + 58 − 61 = 39 days.
- (410 + 250 − 190) = 470; 470 ÷ 3,200 × 100 = 14.7%.
- 840 ÷ 210 = 4.0 times.
- 600 ÷ (1,000 + 1,400 + 600) × 100 = 20.0%.
- 450 ÷ 1,800 = 0.25 dollars = 25.0 cents.
- 3.50 ÷ 0.25 = 14.0.
- 90 ÷ 1,800 = 0.05 dollars = 5.0 cents.
- 0.05 ÷ 1.25 = 0.04 (4%).
- 450 ÷ 90 = 5.0 times.
- Cover rises, because the dividend fell by more than earnings. For example, from 5.0 to 405 ÷ 67.5 = 6.0.
Where marks are usually lost
- Using revenue instead of credit sales or credit purchases in the days ratios.
- Subtracting the wrong item in the working capital cycle.
- Using profit for the year, not profit from operations, for interest cover.
- Leaving non-current liabilities out of the gearing denominator.
- Using only the final dividend for dividend per share.
- Mixing thousands of shares with whole-dollar profit.
- Quoting ratios without comment, or commenting without naming a stakeholder.
- Recommending without a reason against, or ignoring what else the data shows.
Frequently asked questions
How do you calculate dividend per share? Dividend per share = annual ordinary dividend ÷ number of issued ordinary shares, where the annual dividend is the interim plus the final dividend. Using only the final dividend is a common mistake.
Which section of Cambridge 9706 covers A Level ratio analysis? Section 3.5 Analysis and communication of accounting information (A Level) covers the working capital cycle, gearing, interest cover and the investor ratios: earnings per share, price/earnings, dividend per share, dividend yield and dividend cover.
How do gearing and interest cover move together? New borrowing raises gearing and, unless operating profit rises enough, adds interest that lowers interest cover, so the two usually move in opposite directions as debt increases.
Why must I name a stakeholder when commenting on ratios? Whether a change is good or bad depends on who is being advised, such as a shareholder, lender or manager. Quoting ratios without comment, or commenting without naming a stakeholder, loses marks.
Official syllabus
Cambridge International AS & A Level Accounting 9706 syllabus for 2026, 2027 and 2028, published by Cambridge University Press & Assessment (Cambridge International Education): section 3.5 Analysis and communication of accounting information, and the appendix to section 3.
Get free revision emails (optional)
Occasional emails with practice questions, worked explanations and links to free resources for the qualification and subjects you choose. No spam, and you can unsubscribe from any email. The free tools on this site never need an email.
Related resources
-
Study guides
A Level Accounting: Accounting for Non-Current Assets (Cambridge 9706)
Capital versus revenue spending, why assets depreciate depreciation methods, cost and revaluation models and disposals, for Cambridge 9706 Accounting topic 1.3.
Accounting · Cambridge · AS Level
Read guide -
Study guides
A Level Accounting: Analysis and communication of accounting information (AS) (Cambridge 9706)
Stakeholder information needs, profitability, liquidity and efficiency ratios, evaluation, improvements and limitations for Cambridge AS Accounting 9706.
Accounting · Cambridge · AS Level
Read guide -
Practice questions
A Level Accounting: Analysis and communication (AS) (Cambridge 9706) – Practice Questions
Original questions with worked answers on stakeholders, ratio calculation, evaluation, improvements and limitations for Cambridge AS Accounting 9706.
Accounting · Cambridge · AS Level
Try questions
Related articles
-
teaching
A Level tuition in Dubai: Cambridge or Pearson Edexcel International A Level?
Schools in Dubai and Abu Dhabi teach either Cambridge International AS & A Level or Pearson Edexcel International A Level. How the two are structured, why it matters for tuition, and how online classes from Lahore work.
9 October 2026
-
curriculum guides
Choosing subjects at IGCSE and A Level
How subject choices at 14 and 16 affect university options later, and how to keep pathways open without overloading a timetable.
28 July 2026
Studying this with a teacher
Working through Accounting A LEVEL?
This page is free and stays free. If you would rather be taught it, Marlbridge runs Accounting classes one-to-one and in small groups of up to 15, online in your own time zone. The first trial class is free. WhatsApp replies within an hour (8am–11pm Pakistan time, every day); email the same day.
Cambridge Accounting teachers at Marlbridge