
Study Guides
Edexcel GCSE Business: Business operations and managing stock (1BS0)
Study guide to production processes, technology, bar gate stock graphs, just in time and working with suppliers, for Pearson Edexcel GCSE Business.
- Subject
- Business
- Level
- GCSE
- Topic
- Making operational decisions
- Author
- Marlbridge Academic Team
- Updated
- Reviewed by
- Asif Iqbal (what this means)
Aligned to Pearson Edexcel GCSE Business (1BS0), Issue 2, July 2022. Official specification .
Syllabus page (what it covers and how it is assessed): Pearson Edexcel GCSE Business.
Syllabus points this page covers
1BS0
- 2.3 Making operational decisions (whole topic)
- 2.3.1 Business operations
- 2.3.2 Managing stock and working with suppliers
Found an error? Report a correction.
Want a teacher for this? Marlbridge teaches Business online. Request a free trial class.
This guide follows the Pearson Edexcel Level 1/Level 2 GCSE (9-1) in Business (1BS0) specification, Issue 2, July 2022. It covers Theme 2, Topic 2.3 Making operational decisions, content items 2.3.1 Business operations and 2.3.2 Managing stock (working with suppliers). The specification says formulae are listed in Appendix 3 and are not provided in the examinations. Productivity and unit cost are not in that list, so the forms used below are the standard forms, and you should learn them.
Course links: the Business hub, the printable checklist and the free diagnostics. Companion pages: the revision notes and the practice questions.
What the specification asks for
| Item | You must be able to | Section |
|---|---|---|
| 2.3.1 | Explain that operations exist to produce goods and to provide services | 1 |
| 2.3.1 | Describe job, batch and flow production | 2 |
| 2.3.1 | Explain how each process affects productivity, costs and competitive prices | 3 |
| 2.3.1 | Explain how technology affects production, balancing cost, productivity, quality and flexibility | 4 |
| 2.3.2 | Interpret bar gate stock graphs | 5 |
| 2.3.2 | Explain the use of just in time (JIT) stock control | 6 |
| 2.3.2 | Explain the role of procurement and relationships with suppliers: quality, delivery (cost, speed, reliability), availability, cost, trust | 7 |
| 2.3.2 | Explain the impact of logistics and supply decisions on costs, reputation and customer satisfaction | 8 |
The command-word table in Appendix 1 sets the depth. “Explain” is a statement of fact with two expansion points and no context. “Analyse” is an extended answer placed in the context the question gives. “Justify” means using the information provided to recommend one of two options. “Evaluate” means reaching a supported conclusion about a business situation.
1. The purpose of business operations
Operations is the part of a business that turns inputs into what customers buy. The specification gives two purposes:
- To produce goods. Physical products such as furniture, bread or phone cases.
- To provide services. Something done for a customer, such as a haircut, a repair or a delivery.
A goods business can make products ahead of demand and keep them in stock. A service is delivered when the customer asks, so it cannot be stored, which makes timing and staffing the main decisions. Many businesses do both: a garage sells tyres (goods) and fits them (a service).
2. Production processes
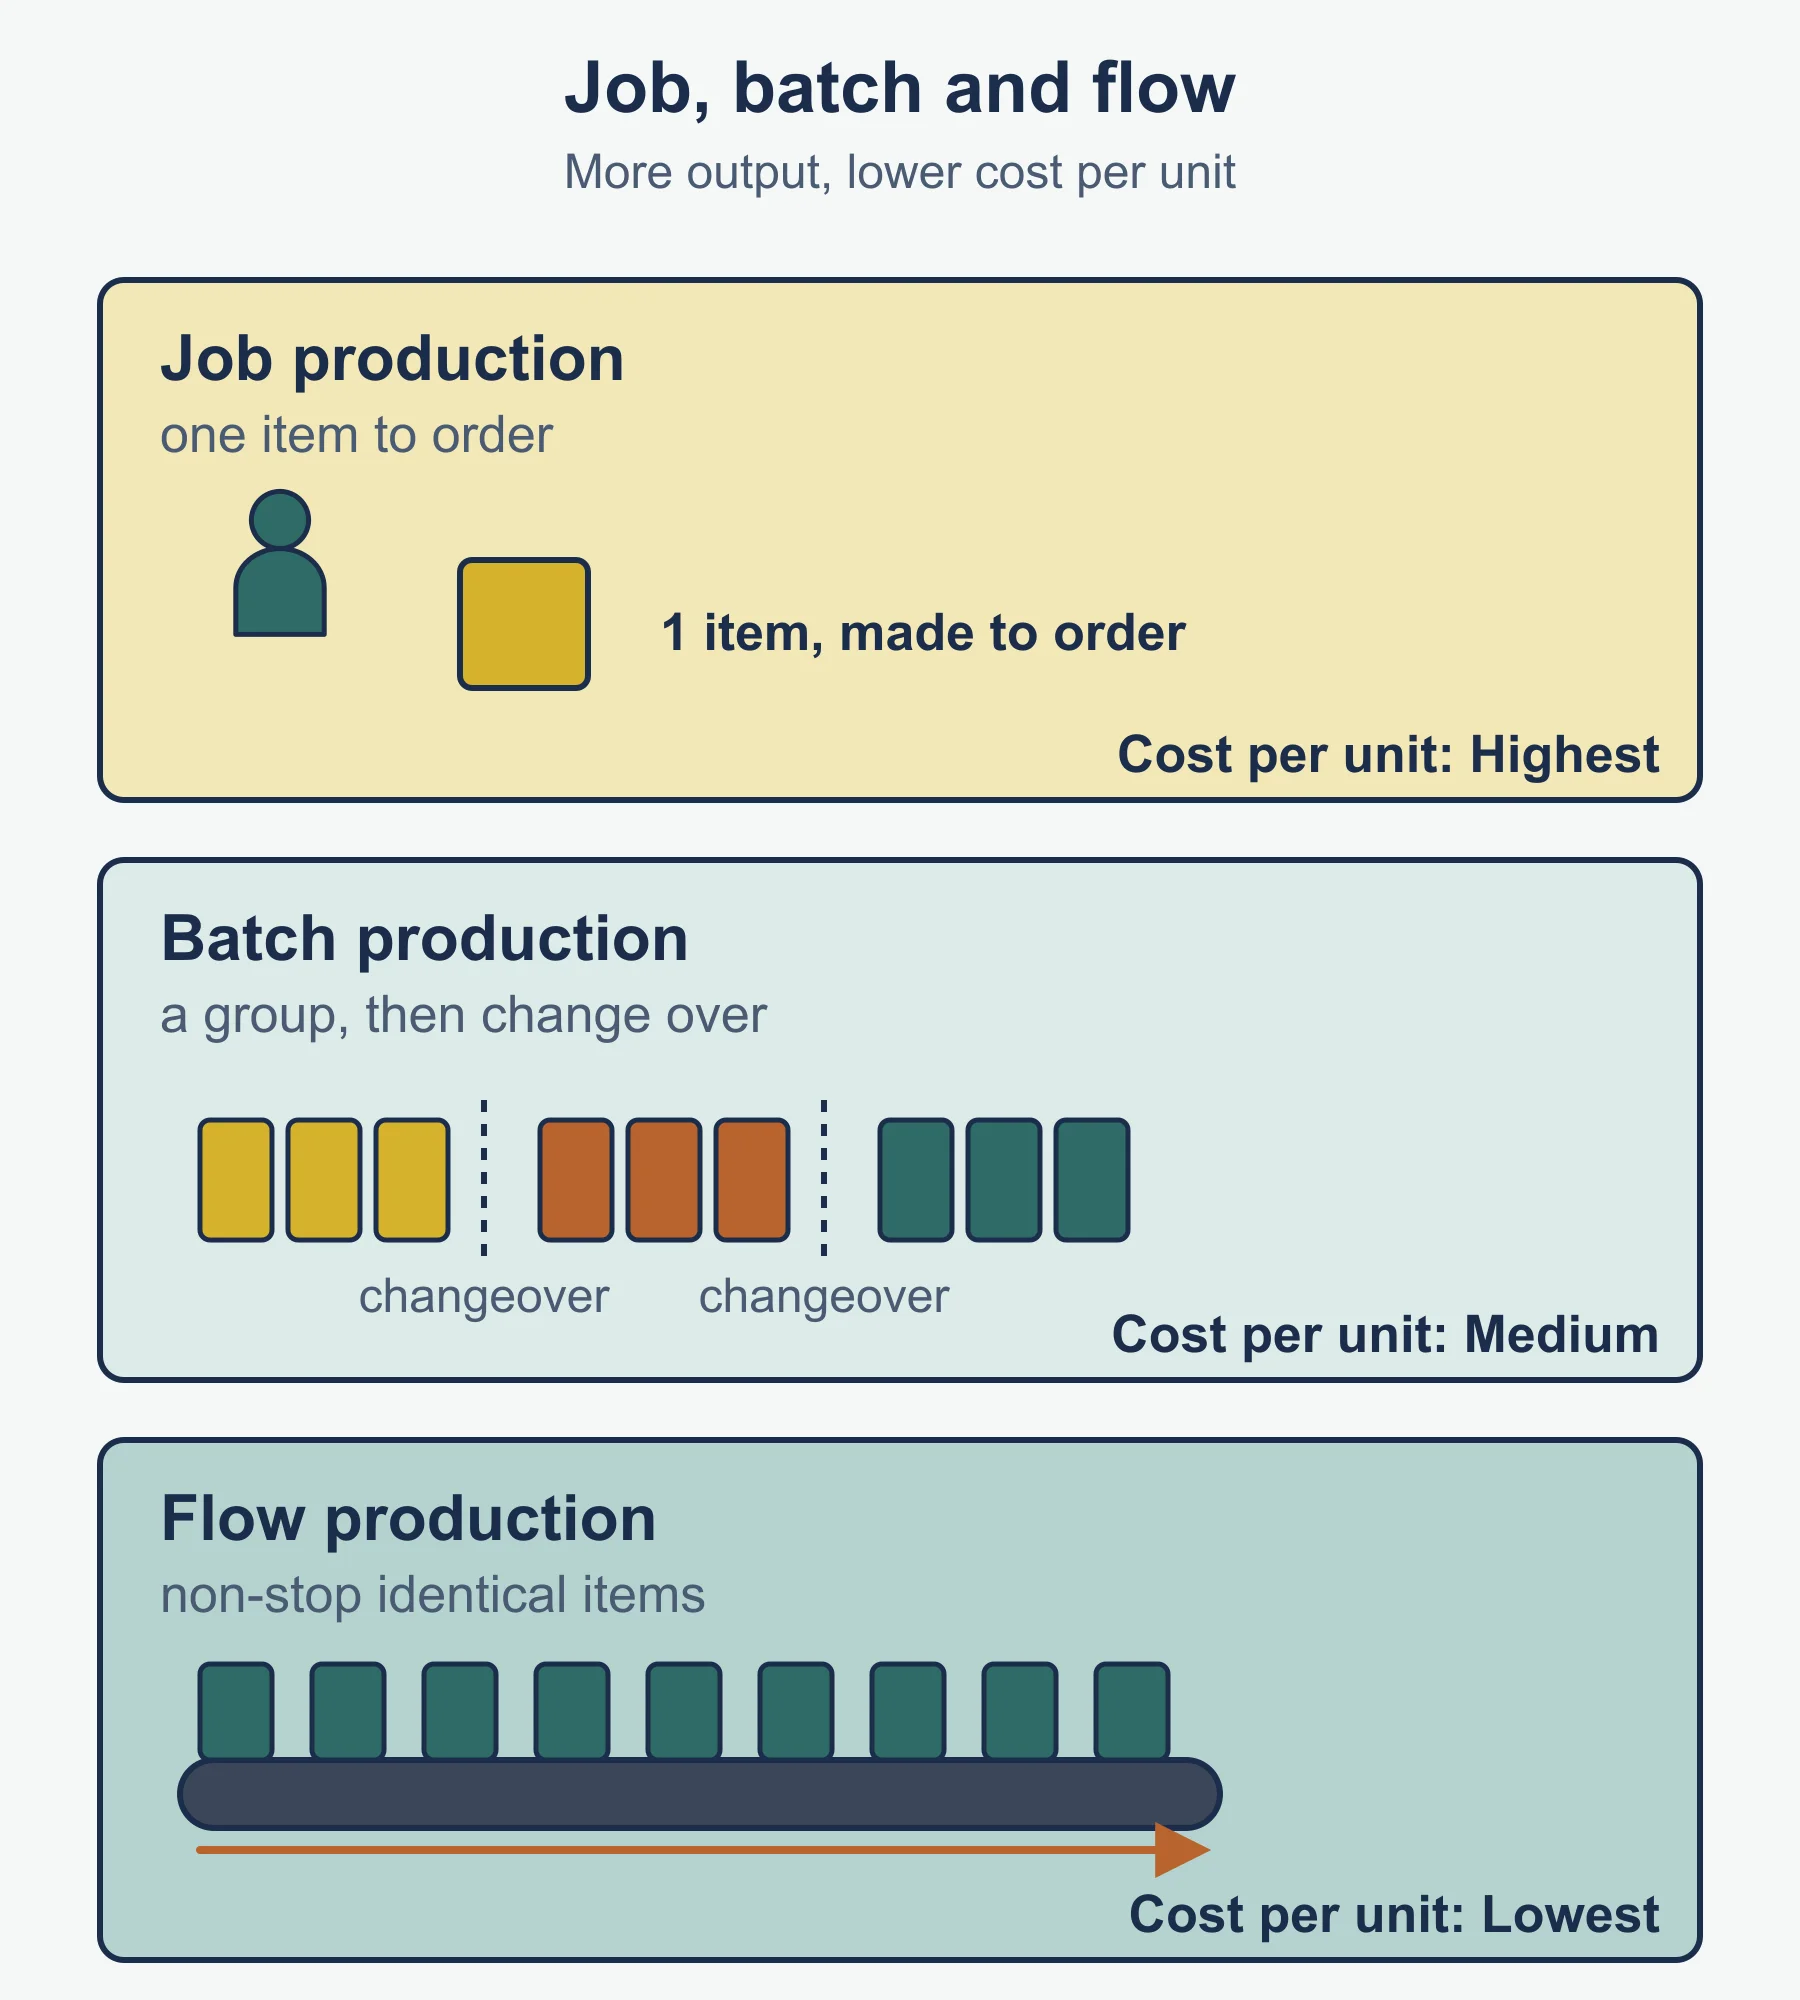
The specification names three types of production process.
| Process | What happens | Typical example |
|---|---|---|
| Job | One item made to a customer’s own specification | A hand-built staircase |
| Batch | A group of identical items made together, then the equipment is changed for the next group | A bakery making 240 rolls, then a batch of loaves |
| Flow | Items move continuously along a line, usually all day | A bottling line |
Services can resemble these too. A wedding photographer works rather like job production because each booking is personal. A busy dental practice runs similar appointments one after another, which is closer to batch work.
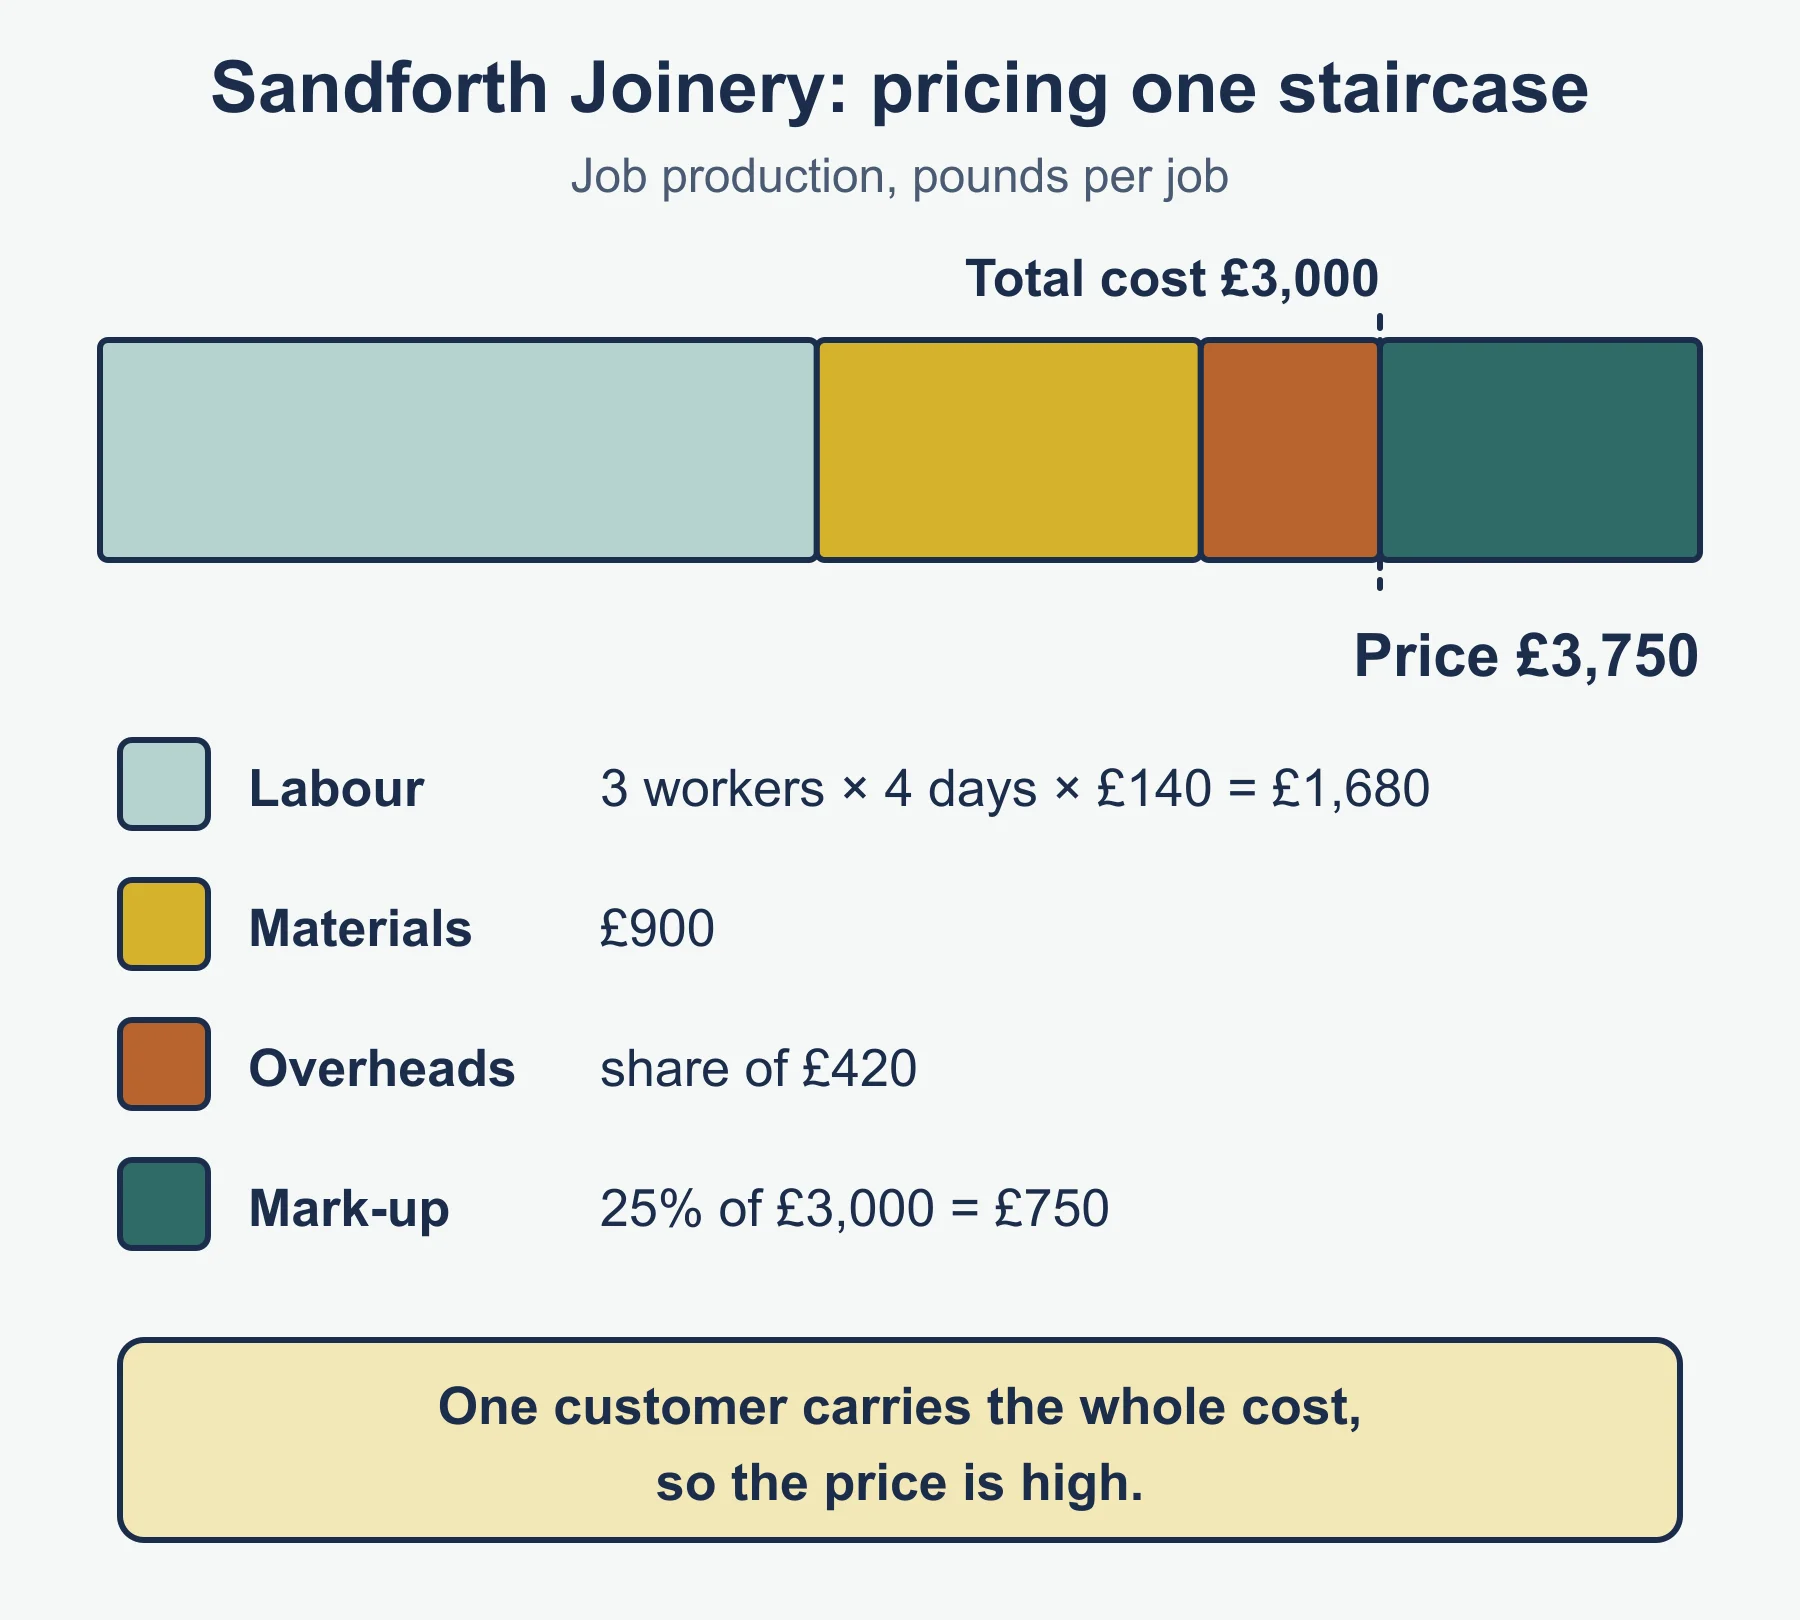
Worked example: Sandforth Joinery (job)
A staircase takes 3 workers 4 days each, so 12 worker-days. Labour is paid £140 a day. Materials cost £900 and a share of overheads is £420.
Labour = 12 × 140 = £1,680. Total cost = 1,680 + 900 + 420 = £3,000.
The owner adds 25% to the cost: 3,000 × 1.25 = £3,750.
The price is high because one customer carries the whole cost, and that customer gets exactly what was asked for.
Worked example: Hallam Bakehouse (batch)
Each batch is 240 rolls and the ingredients for one batch cost £48. Ingredients per roll = 48 ÷ 240 = £0.20. Three batches a day give 720 rolls. Between batches the staff clean and reset the equipment, which is time when nothing is produced.
3. How the process affects productivity, costs and prices
The specification asks about the impact on keeping productivity up, keeping costs down and allowing competitive prices.
Productivity is output per unit of input, usually output per worker in a given time. This is the standard form (output ÷ number of workers). Unit cost is total cost ÷ number of units produced, also the standard form.
| Process | Productivity | Unit costs | Price |
|---|---|---|---|
| Job | Low per worker, as skilled work takes long | High | High, justified by the personal product |
| Batch | Moderate. Changeovers cost time | Medium | Moderate, can compete on a range of products |
| Flow | High. Little waiting | Low, if sales are high enough to fill the line | Can be low and competitive |
Flow lines cost a lot to install and run. Their unit cost only falls if the business sells enough to keep the line busy, so a high fixed cost spread over few units makes the unit cost rise again. Flow also lacks flexibility: changing the product can mean stopping the line, and a breakdown at one stage halts everything.
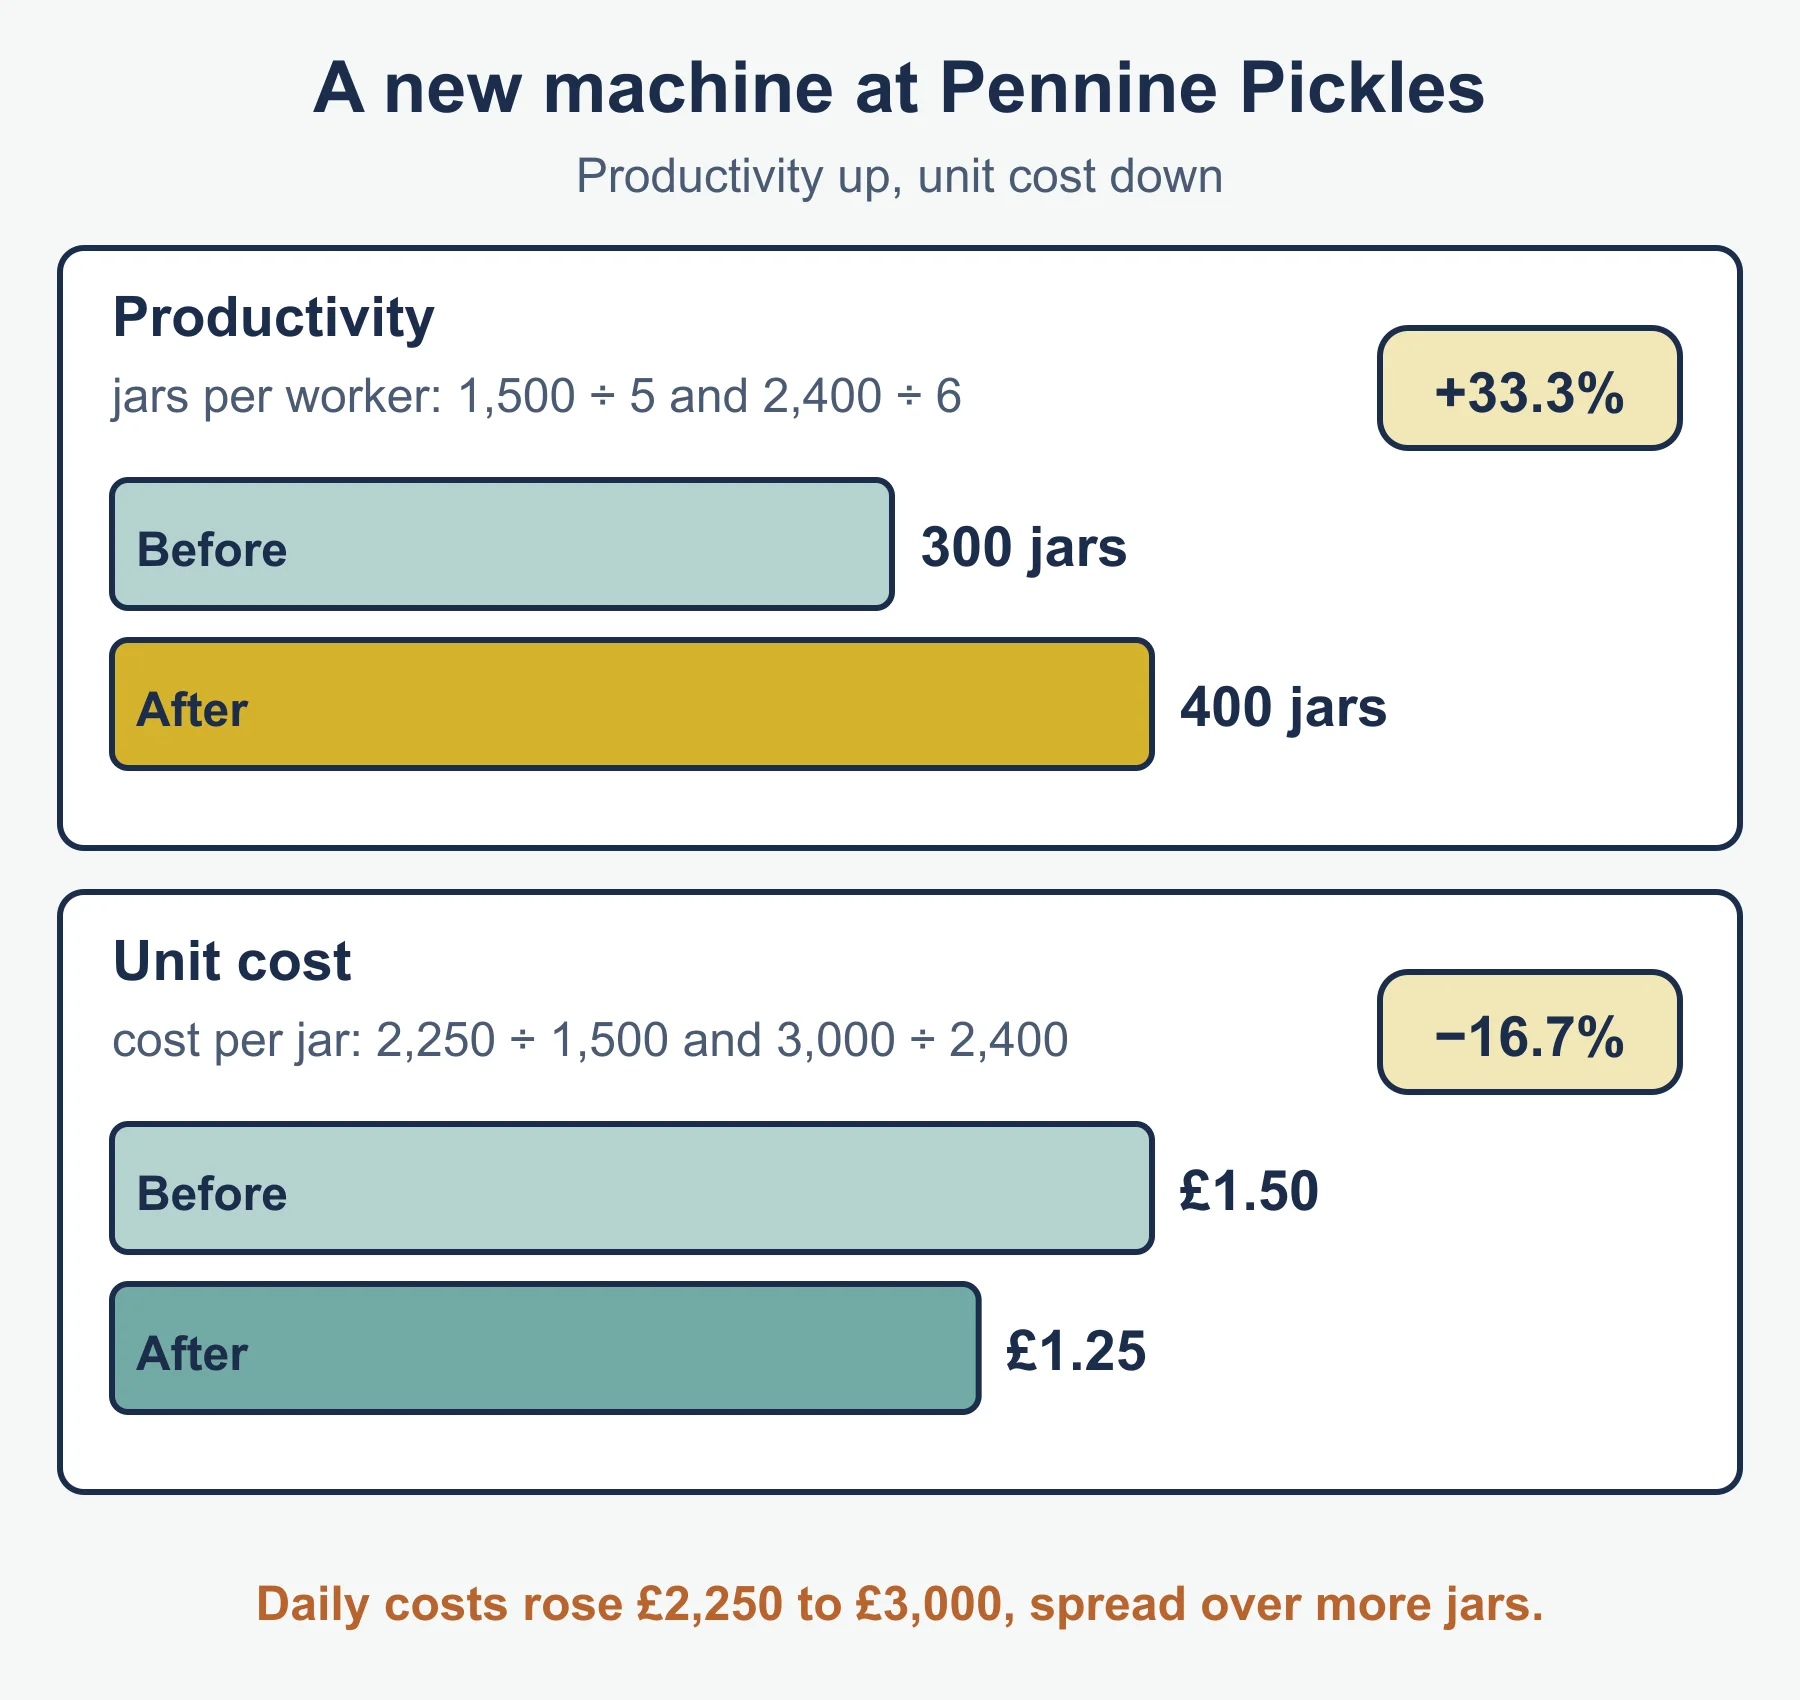
Worked example: Pennine Pickles
Before a new jar-filling machine, 5 staff fill 1,500 jars a day. After, 6 staff fill 2,400 jars.
Productivity before = 1,500 ÷ 5 = 300 jars per worker. After = 2,400 ÷ 6 = 400 jars per worker.
Percentage change = (400 − 300) ÷ 300 × 100 = 33.3% (to 1 decimal place).
Daily costs rise from £2,250 to £3,000. Unit cost before = 2,250 ÷ 1,500 = £1.50. After = 3,000 ÷ 2,400 = £1.25. That is a fall of 25p, or 16.7%.
Total costs rose, but they are spread over many more jars, so the owner could cut the price and still earn more per jar.
4. The impact of technology on production
Technology here includes automated machinery, robots, computer-controlled equipment and software that designs or schedules work. The specification asks you to balance four things.
| Factor | How technology can help | How it can hurt |
|---|---|---|
| Cost | Lower labour cost per unit, less waste | Buying and maintaining machines is expensive; staff may need training |
| Productivity | More output per worker and per hour | Breakdowns or software faults stop output |
| Quality | Consistent results, fewer human errors | Machines repeat a fault until someone spots it |
| Flexibility | Programmable machines can switch product quickly | Some machines are set for one task and are slow to change |
“Balancing” matters. A small business with uncertain sales may find that a machine adds fixed cost and removes flexibility, while a large producer with steady demand gains a lot. Answers that name the factors but never weigh them against the business in the question stay descriptive.
5. Bar gate stock graphs
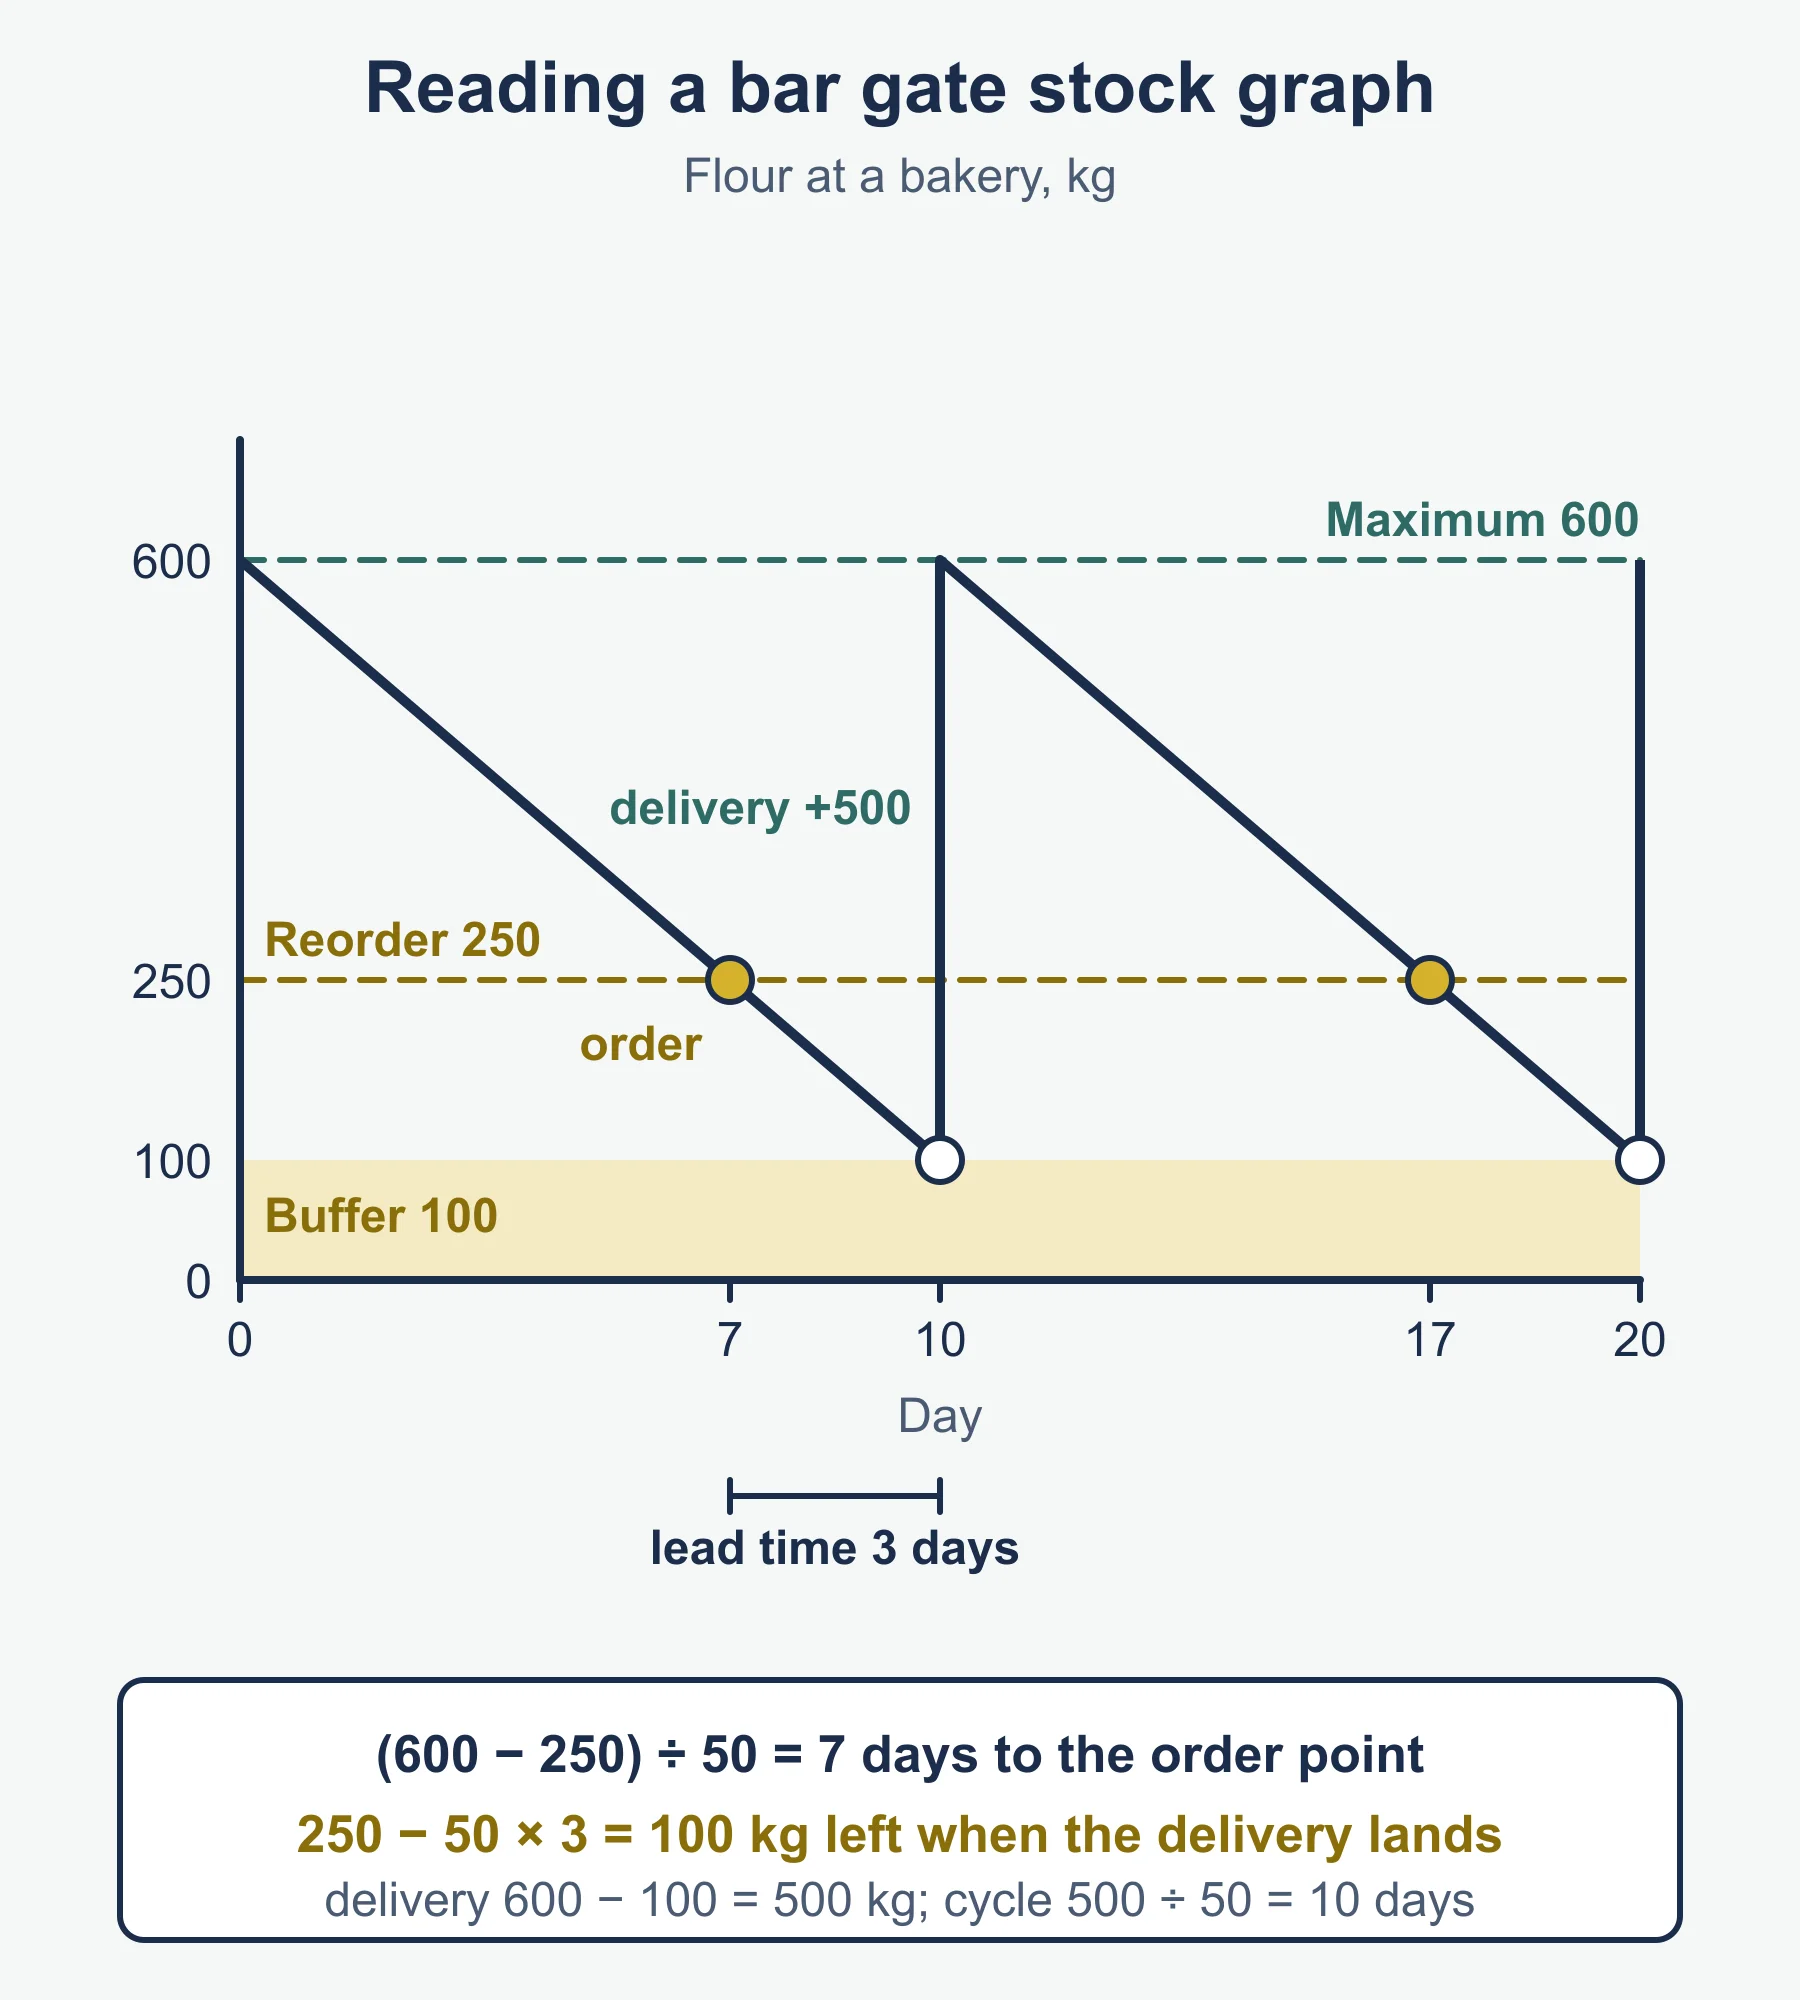
A bar gate stock graph shows the quantity of one item in stock over time. Time runs along the bottom and stock along the side. As stock is used, the line slopes down. When a delivery arrives, the line jumps straight up, which gives the shape of a gate. The specification asks you to interpret the graph, so practise reading the figures from it.
Standard terms (these are the usual names, not wording taken from the specification):
- Maximum stock level. The highest point after a delivery.
- Reorder level. The stock level at which a new order is placed.
- Lead time. The wait from placing an order until the goods arrive.
- Buffer stock. A minimum quantity kept as protection against late delivery or a sudden rise in use.
Worked example: flour at a bakery
Maximum stock 600 kg. Reorder level 250 kg. Use 50 kg a day. Lead time 3 days.
- Days from full to the reorder level = (600 − 250) ÷ 50 = 7 days.
- Use during the lead time = 50 × 3 = 150 kg. Stock when the delivery arrives = 250 − 150 = 100 kg. This is the buffer.
- Delivery size = 600 − 100 = 500 kg.
- One full cycle = 500 ÷ 50 = 10 days.
| Day | 0 | 7 | 10 | 17 | 20 |
|---|---|---|---|---|---|
| Stock (kg) | 600 | 250 (order) | 100 (delivery, jump to 600) | 250 (order) | 100 (delivery, jump to 600) |
Reading a graph is the same task. Find the top and bottom of the gate, read the order point, and compare the steepness of the line: a steeper fall means faster use.
6. Just in time (JIT) stock control
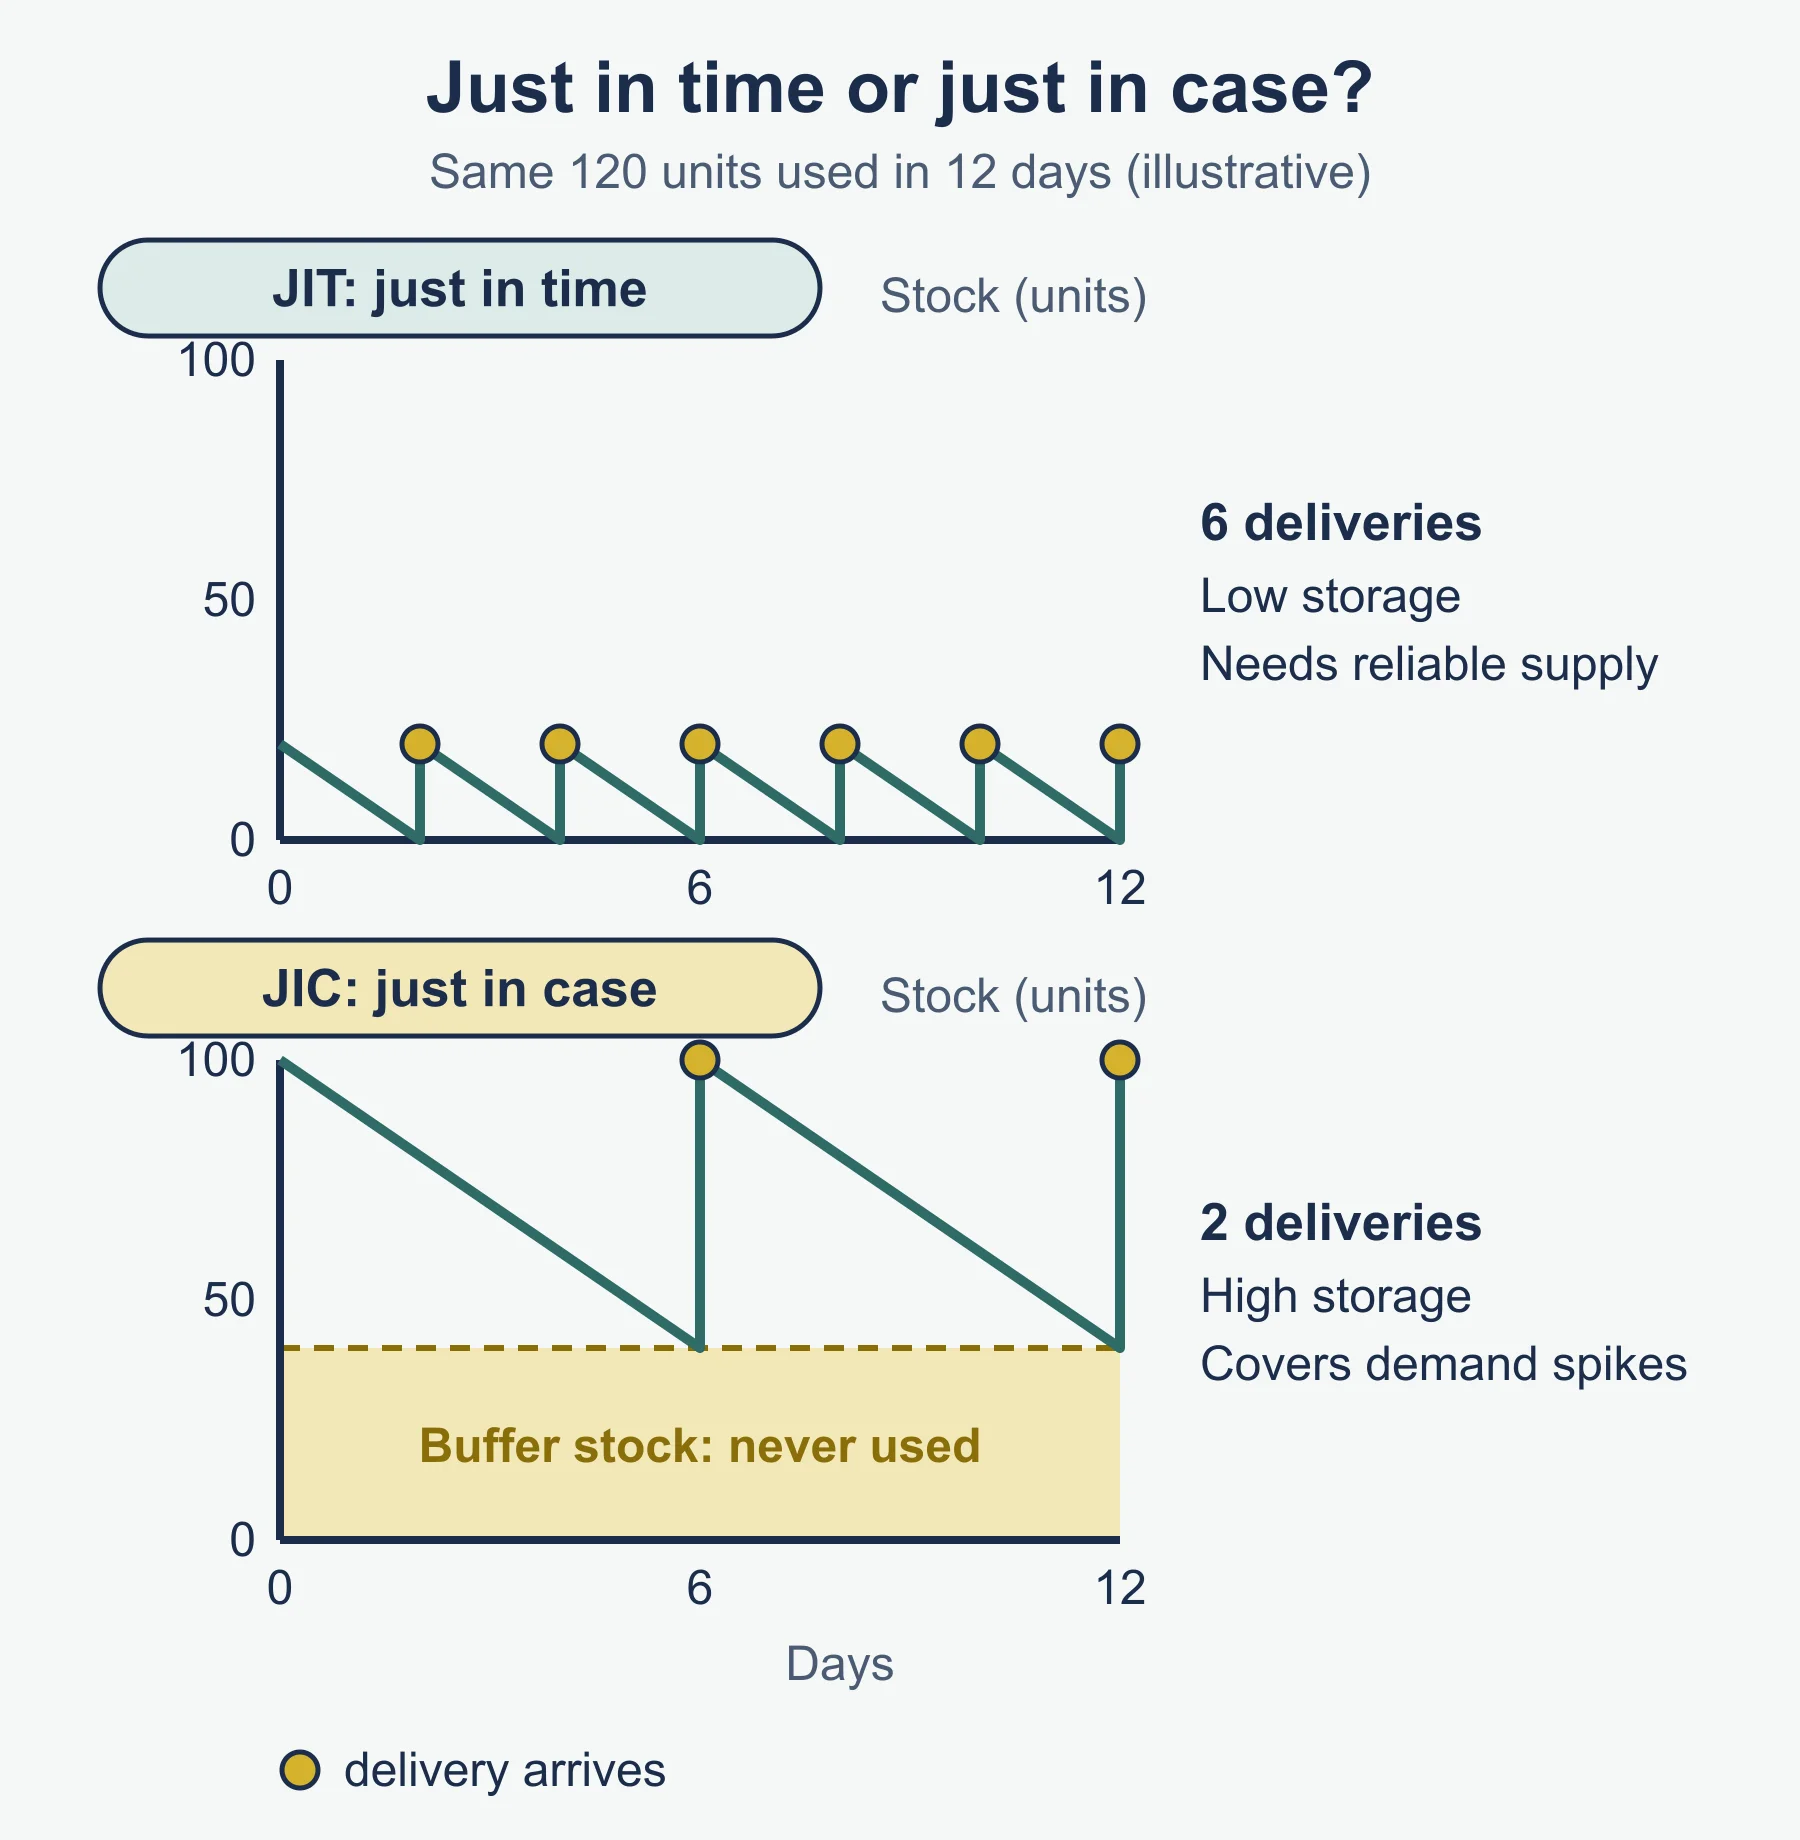
JIT means materials and parts arrive only when they are needed for production, so the business holds very little stock. It is a different approach from a bar gate system, where a buffer is held on purpose.
Advantages. Less money tied up in stock, lower storage and insurance costs, less waste from items that go out of date or become damaged, and less warehouse space.
Disadvantages. There is little protection against late or wrong deliveries. Production can stop. The business may need more frequent orders, and small orders may cost more per unit. It depends on reliable suppliers.
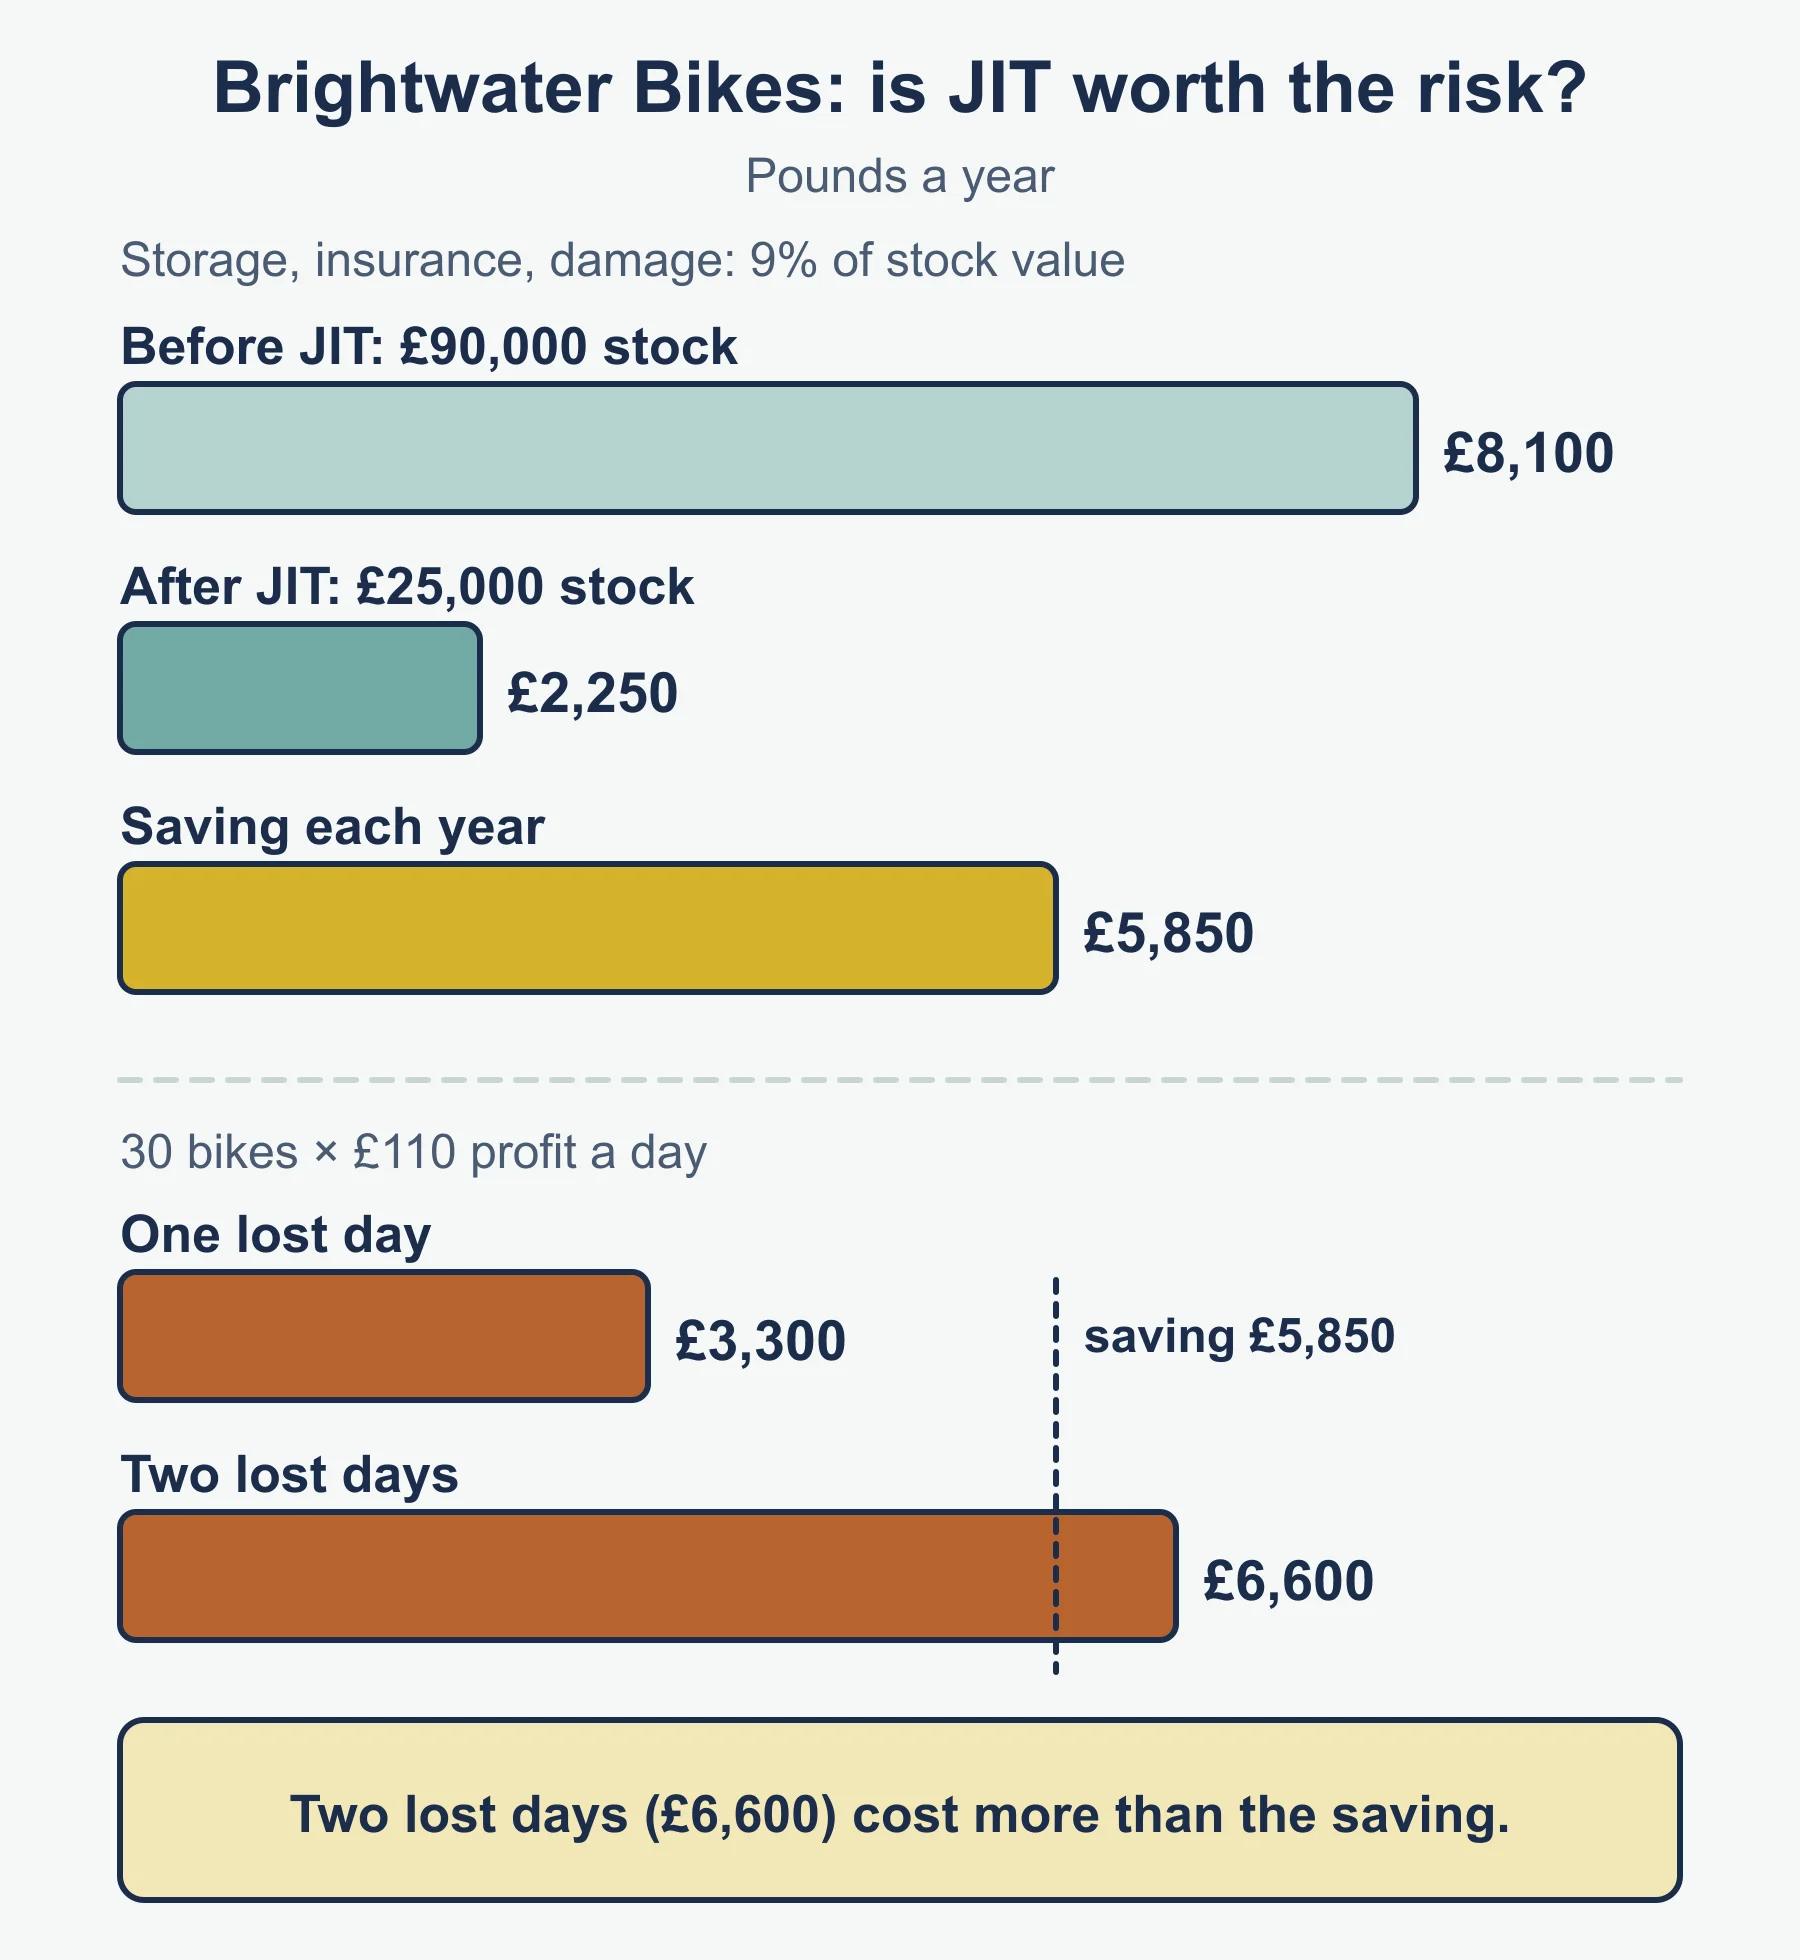
Worked example: Brightwater Bikes
Average component stock is £90,000. Storage, insurance and damage add up to 9% a year of stock value. Moving to JIT cuts average stock to £25,000.
Before = 90,000 × 0.09 = £8,100. After = 25,000 × 0.09 = £2,250. Saving = £5,850 a year.
But the factory builds 30 bikes a day and each earns £110 profit. One lost day = 30 × 110 = £3,300. Two lost days would cost £6,600, which is more than the whole saving of £5,850.
7. The role of procurement and relationships with suppliers
Procurement is the buying of the goods and services a business needs from suppliers. The specification lists what makes a supplier relationship work:
- Quality. Poor materials lead to poor products.
- Delivery: cost, speed, reliability. The delivery charge, how soon the goods arrive, and whether they arrive when promised.
- Availability. Whether the supplier has the item when needed.
- Cost. The price paid.
- Trust. Belief that the supplier will keep promises and be honest.
The cheapest supplier is not always the best. Compare on total cost including delivery and the cost of problems.
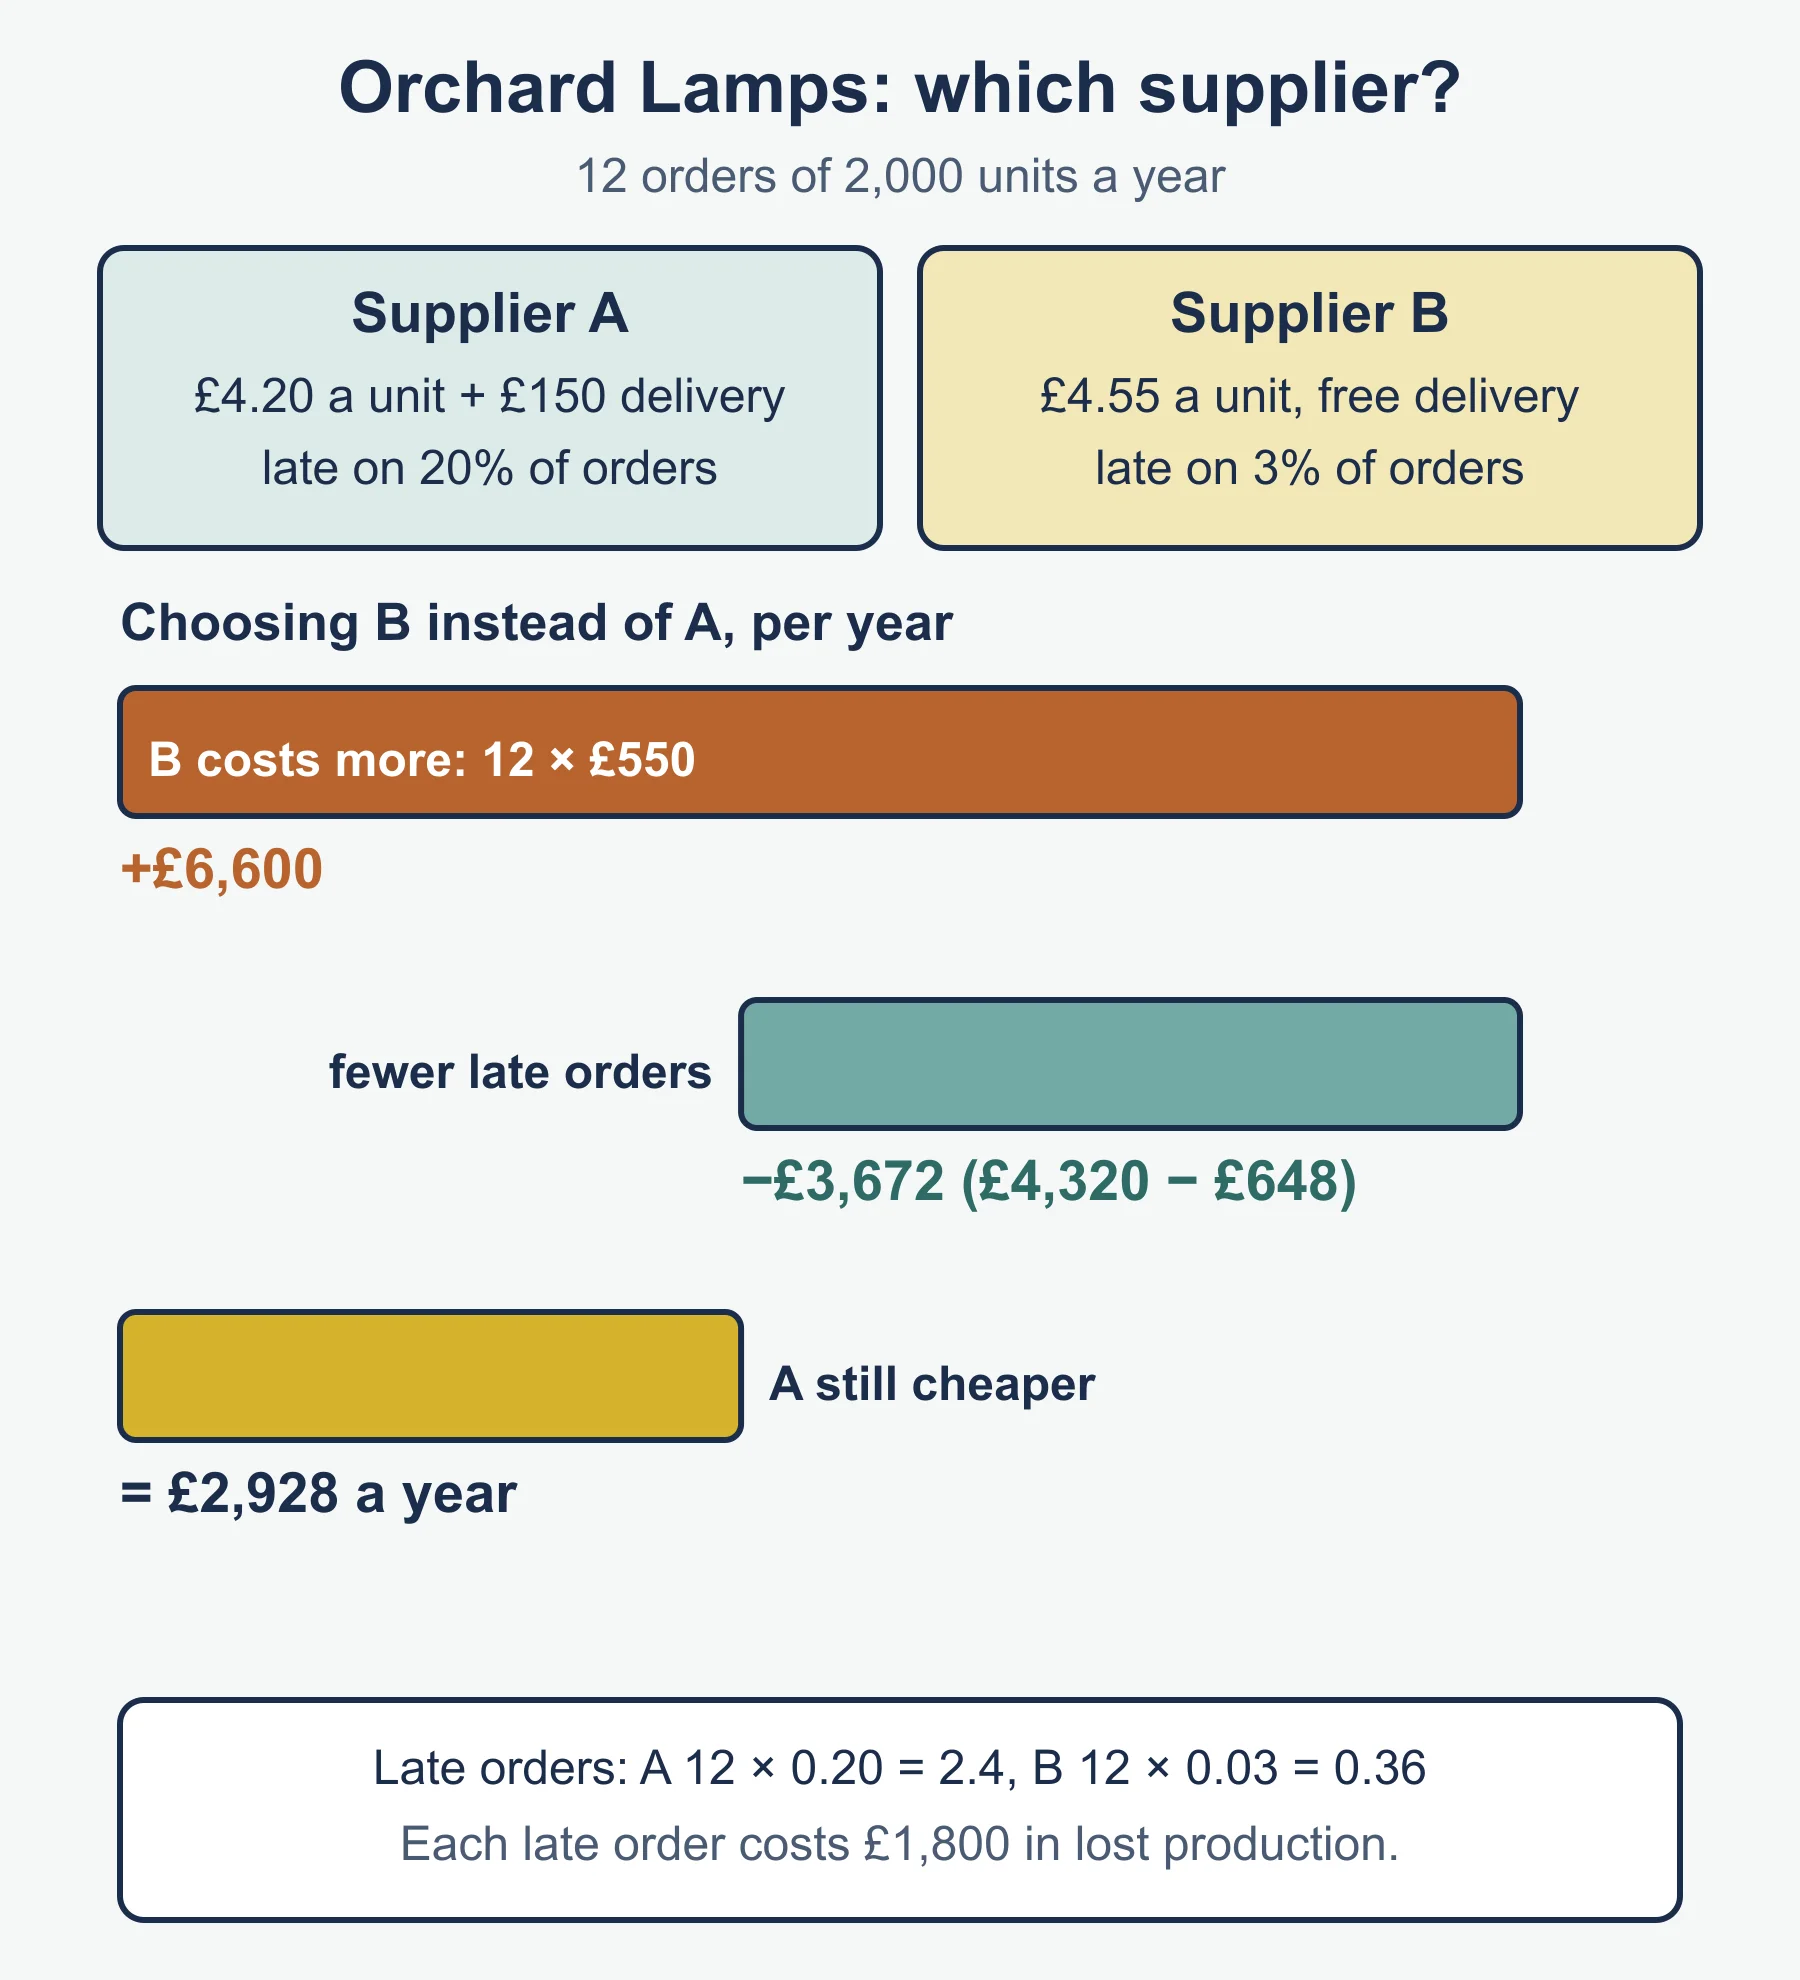
Worked example: Orchard Lamps
An order is 2,000 units. Supplier A charges £4.20 a unit plus £150 delivery, and is late on 20% of 12 yearly orders. Supplier B charges £4.55 a unit with free delivery and is late on 3%. A late order costs £1,800 in lost production.
A = 2,000 × 4.20 + 150 = £8,550. B = 2,000 × 4.55 = £9,100. B costs £550 more per order, or £6,600 over 12.
Late orders: A = 12 × 0.20 = 2.4, costing £4,320. B = 12 × 0.03 = 0.36, costing £648. B saves £3,672.
Net, A is still £2,928 cheaper a year on these figures. Trust, quality and reputation could change the choice, and a good answer says so rather than stopping at the calculation.
8. Logistics and supply decisions
Logistics covers moving and storing goods, from supplier to the business and from the business to the customer. Supply decisions include which supplier to use, how often to order and how much to hold. The specification asks for the impact on three things.
- Costs. Transport, storage and the price of materials. Frequent small orders can raise delivery costs, while large orders raise storage costs.
- Reputation. Late, damaged or incorrect orders spread through reviews and word of mouth. Reliable delivery builds a name.
- Customer satisfaction. Customers want the right item, in good condition, when promised. Stock-outs and delays lead to complaints and lost repeat custom.
These links connect the topic. A supplier delay can lead to a stock-out, then a late customer order, then a poor review.
Common errors
- Describing flow production as “better” in every case. It is only cheaper per unit when sales fill the line.
- Mixing up productivity (output per worker) with total output.
- Forgetting that buffer stock is the level at the moment of delivery, not at the reorder point.
- Writing that JIT removes all risk or all cost.
- Choosing the cheapest supplier on price alone.
- Giving technology advantages with no balancing disadvantage.
Next steps
Test yourself with the practice questions, then recap using the revision notes. The free diagnostics show where to focus.
Frequently asked questions
How do you calculate productivity in GCSE Business? Productivity is output per worker, found by dividing output by the number of workers. If 5 staff fill 1,500 jars a day, productivity is 300 jars per worker.
Is flow production always cheaper than batch production? No. Flow lines cost a lot to install and run, so unit costs only fall if the business sells enough to keep the line busy. Flow also lacks flexibility, as changing the product can mean stopping the line.
How does technology affect production in Edexcel GCSE Business? The 1BS0 specification asks you to balance cost, productivity, quality and flexibility. Technology can raise output and give consistent quality, but machines are expensive to buy and maintain and breakdowns can stop production.
How do logistics decisions affect a business? Logistics affects costs (transport and storage), reputation (late or damaged orders spread through reviews) and customer satisfaction (customers want the right item on time). A supplier delay can lead to a stock-out, a late customer order and then a poor review.
Official syllabus
Pearson Edexcel Level 1/Level 2 GCSE (9-1) in Business (1BS0), Specification, Issue 2, July 2022, published by Pearson Education Limited. Theme 2, Topic 2.3 Making operational decisions, items 2.3.1 Business operations and 2.3.2 Managing stock (working with suppliers).
Get free revision emails (optional)
Occasional emails with practice questions, worked explanations and links to free resources for the qualification and subjects you choose. No spam, and you can unsubscribe from any email. The free tools on this site never need an email.
Related resources
-
Practice questions
Edexcel GCSE Business: Business operations and managing stock (1BS0) – Practice Questions
Twelve original questions with worked answers on production processes, technology, stock graphs, JIT and suppliers for Edexcel GCSE Business.
Business · Pearson Edexcel · GCSE
Try questions -
Revision notes
Edexcel GCSE Business: Business operations and managing stock (1BS0) – Revision Notes
Condensed revision notes on job, batch and flow production, technology, bar gate stock graphs, JIT and suppliers for Edexcel GCSE Business.
Business · Pearson Edexcel · GCSE
Revise topic -
Study guides
Edexcel GCSE Business: Quality and the sales process (1BS0)
Study guide to quality control, quality assurance, costs, competitive advantage, the sales process and customer service for Edexcel GCSE Business.
Business · Pearson Edexcel · GCSE
Read guide
Related articles
-
teaching
A Level tuition in Dubai: Cambridge or Pearson Edexcel International A Level?
Schools in Dubai and Abu Dhabi teach either Cambridge International AS & A Level or Pearson Edexcel International A Level. How the two are structured, why it matters for tuition, and how online classes from Lahore work.
9 October 2026
-
curriculum guides
Choosing subjects at IGCSE and A Level
How subject choices at 14 and 16 affect university options later, and how to keep pathways open without overloading a timetable.
28 July 2026
Studying this with a teacher
Working through Business GCSE?
This page is free and stays free. If you would rather be taught it, Marlbridge runs Business classes one-to-one and in small groups of up to 15, online in your own time zone. The first trial class is free. WhatsApp replies within an hour (8am–11pm Pakistan time, every day); email the same day.
Pearson Edexcel Business teachers at Marlbridge

