
Revision Notes
Edexcel GCSE Business: Spotting a business opportunity and customer needs (1BS0) – Revision Notes
Condensed revision notes on customer needs, market research, segmentation, market mapping and competitors for Edexcel GCSE Business 1BS0 Topic 1.2.
- Subject
- Business
- Level
- GCSE
- Topic
- Spotting a business opportunity
- Author
- Marlbridge Academic Team
- Updated
- Reviewed by
- Asif Iqbal (what this means)
Aligned to Pearson Edexcel GCSE Business (1BS0), Issue 2, July 2022. Official specification .
Syllabus page (what it covers and how it is assessed): Pearson Edexcel GCSE Business.
Syllabus points this page covers
1BS0
- 1.2 Spotting a business opportunity (whole topic)
- 1.2.1 Customer needs
- 1.2.2 Market research
- 1.2.3 Market segmentation
- 1.2.4 The competitive environment
Found an error? Report a correction.
Want a teacher for this? Marlbridge teaches Business online. Request a free trial class.
These notes condense Theme 1, Topic 1.2 Spotting a business opportunity (items 1.2.1 to 1.2.4) of the Pearson Edexcel Level 1/Level 2 GCSE (9-1) in Business (1BS0) specification, Issue 2, July 2022. For full explanations and worked examples read the study guide. Formulae are listed in Appendix 3 of the specification and are not provided in the examinations, so learn the ones you need.
Course links: the Business hub, the printable checklist and the free diagnostics. Then use the practice questions.
Key terms
| Term | Meaning |
|---|---|
| Customer needs | What customers want from a purchase: price, quality, choice, convenience |
| Market research | Gathering and studying information on customers, rivals and the market |
| Primary research | New, first-hand information collected for the business’s own purpose |
| Secondary research | Existing information collected by someone else |
| Quantitative data | Data in number form: counts, percentages, prices |
| Qualitative data | Descriptive data, such as opinions, feelings and reasons |
| Reliable data | Data the business can trust to reflect the market |
| Market segmentation | Dividing a market into groups of customers with shared characteristics |
| Market mapping | Plotting businesses on two axes to see the competition and any gap |
| Gap in the market | A customer need that no business meets well |
| Market share | Its sales shown as a share (%) of everything sold in the market |
1.2.1 Customer needs
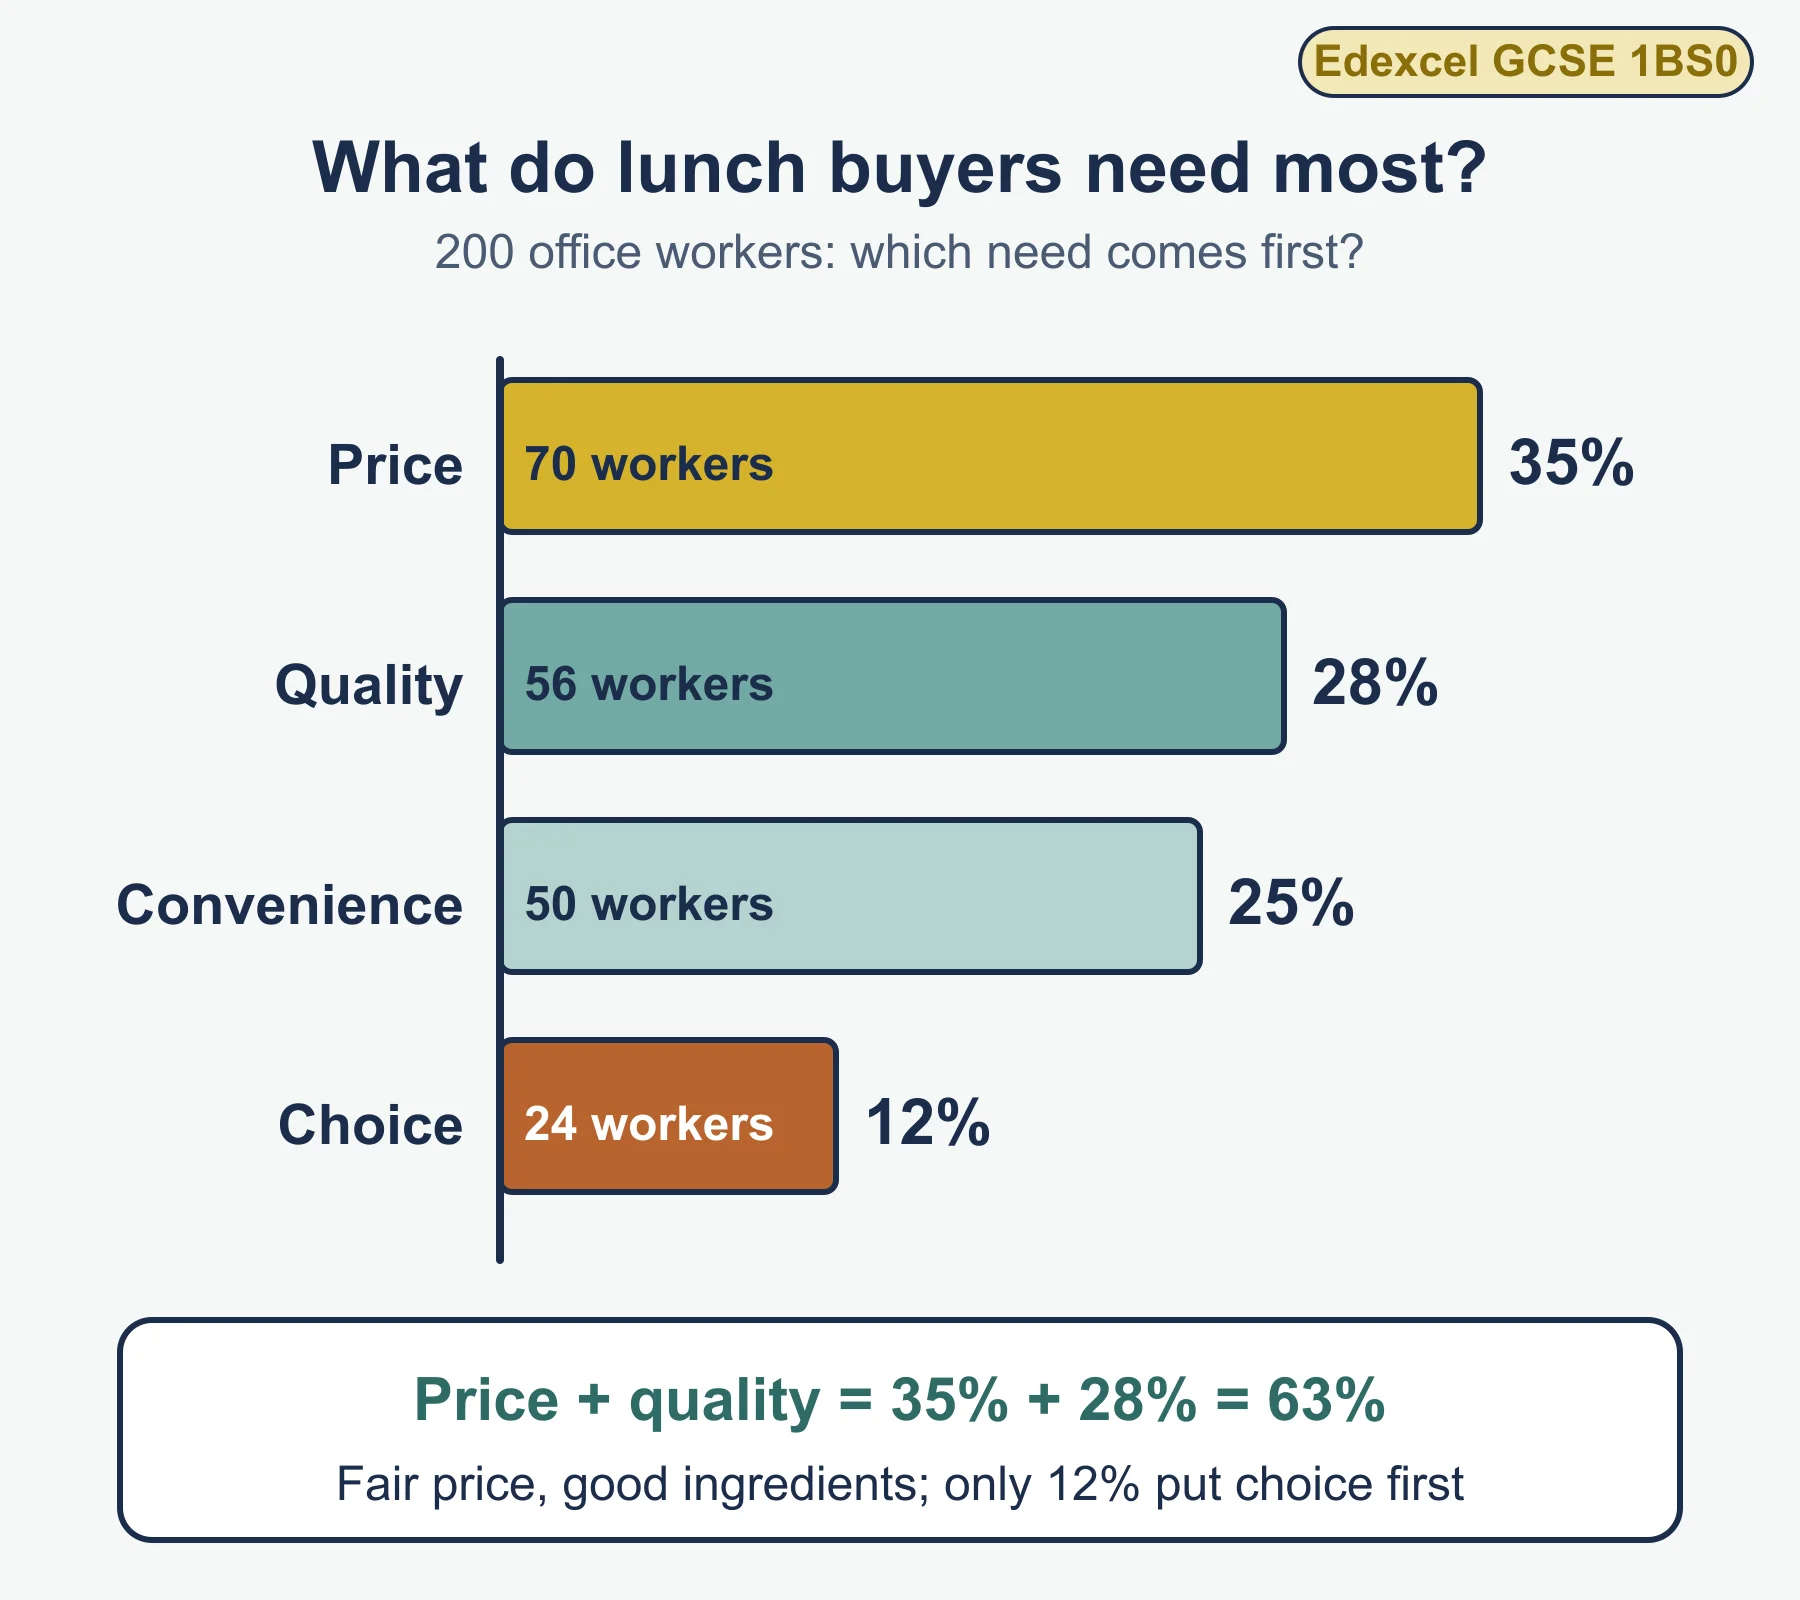
The four needs named in the specification:
| Need | What the customer wants | Business response (example) |
|---|---|---|
| Price | A fair amount to pay | Value ranges, discounts |
| Quality | A product that works and lasts | Better materials, checks |
| Choice | A range to pick from | More flavours, sizes or styles |
| Convenience | Easy, quick buying | Late opening, delivery, online ordering |
Why identify and understand customers (two reasons from the specification):
- Generating sales: offering what customers want means more of them buy.
- Business survival: a small business cannot afford to make something nobody needs.
Method for a context question: name the need, say who has it (use the customer in the stem), then link it to a sales or survival outcome.
1.2.2 Market research
Purposes (four)
- Identify and understand customer needs.
- Identify gaps in the market.
- Reduce risk (not remove it).
- Inform business decisions.
Methods
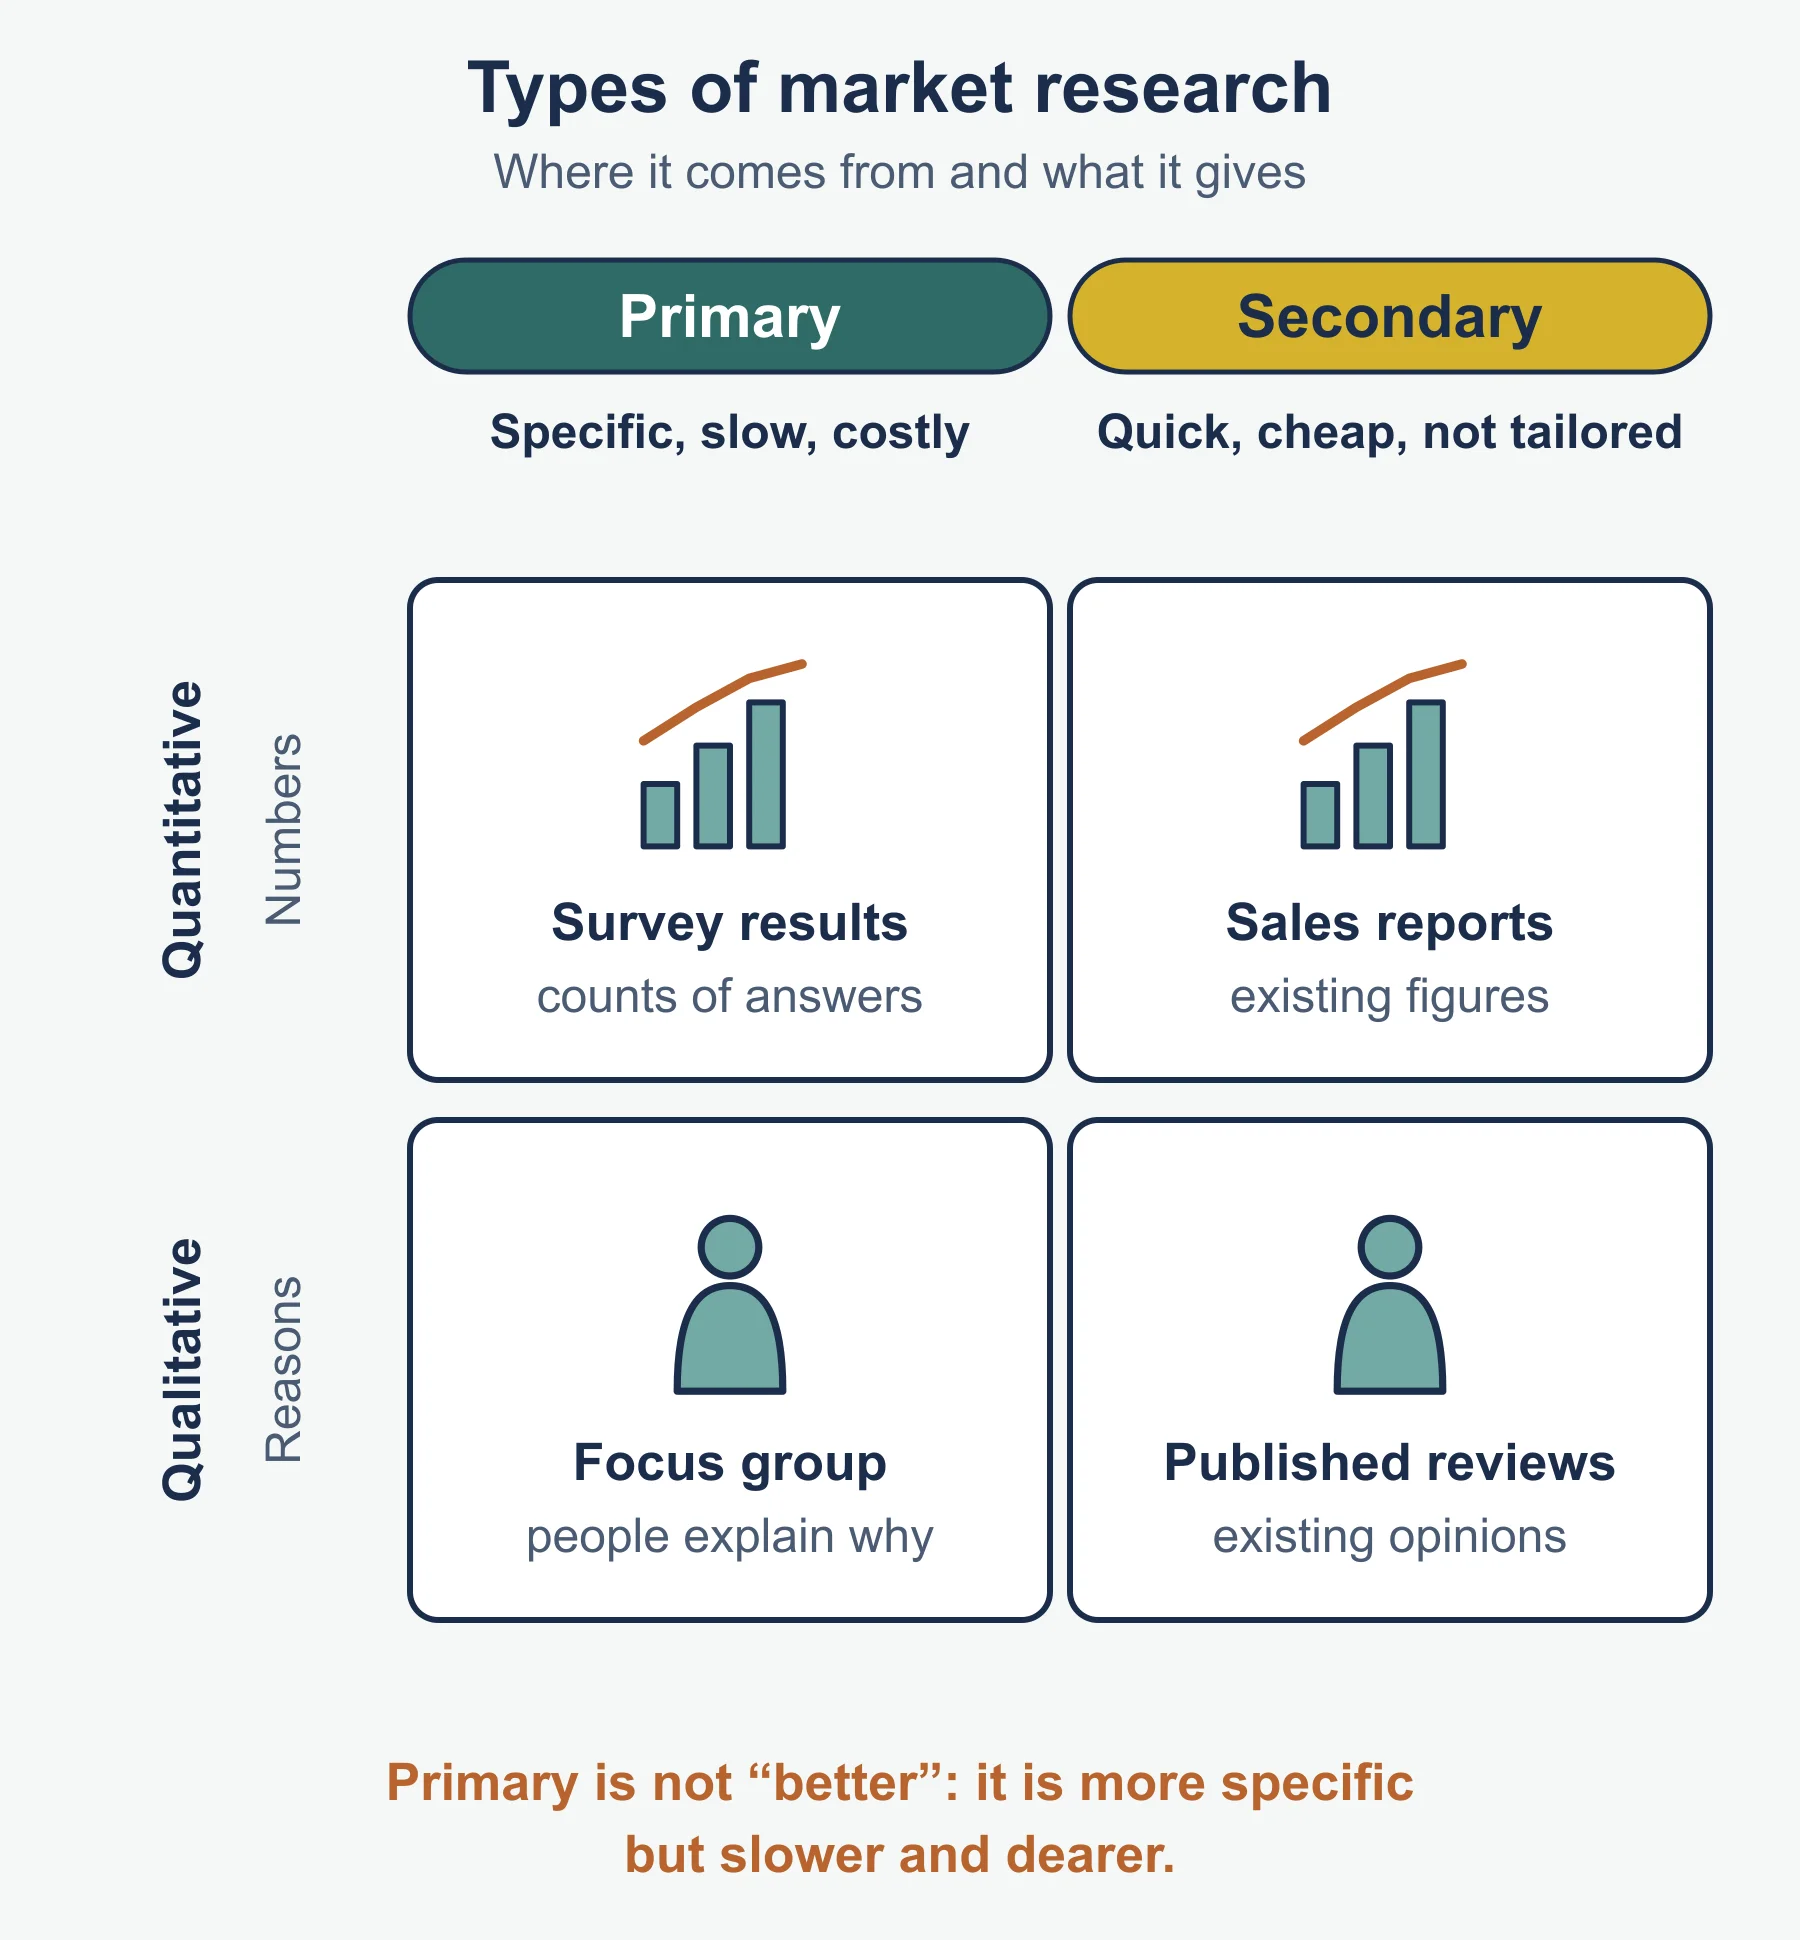
| Type | Methods in the specification | Main strength | Main weakness |
|---|---|---|---|
| Primary | Survey | Reaches many people | Time and cost |
| Primary | Questionnaire | Same questions for all | Poor wording, low returns |
| Primary | Focus group | Detailed reasons | Small group, can be swayed |
| Primary | Observation | Real behaviour | Does not show why |
| Secondary | Internet | Fast, cheap | Source may be weak |
| Secondary | Market reports | Wide market view | May cost money, may be general |
| Secondary | Government reports | Trusted, large scale | May be out of date or not local |
Primary versus secondary at a glance: primary is tailored to your question but takes more time and money; secondary costs less and is faster but was gathered for a different reason.
Quantitative versus qualitative data
| Quantitative | Qualitative | |
|---|---|---|
| Form | Numbers | Words and opinions |
| Shows | How many, how much | Why, how people feel |
| Example | 42% would buy | “The packaging feels cheap” |
| Weakness | Can miss the reason | Harder to measure and compare |
Social media
- Helps: cheap and quick; polls, comments and reviews; reaches people who would not answer a street survey.
- Limits: followers already like the business; anyone can vote; replies may not match the target market.
Reliability: five checks
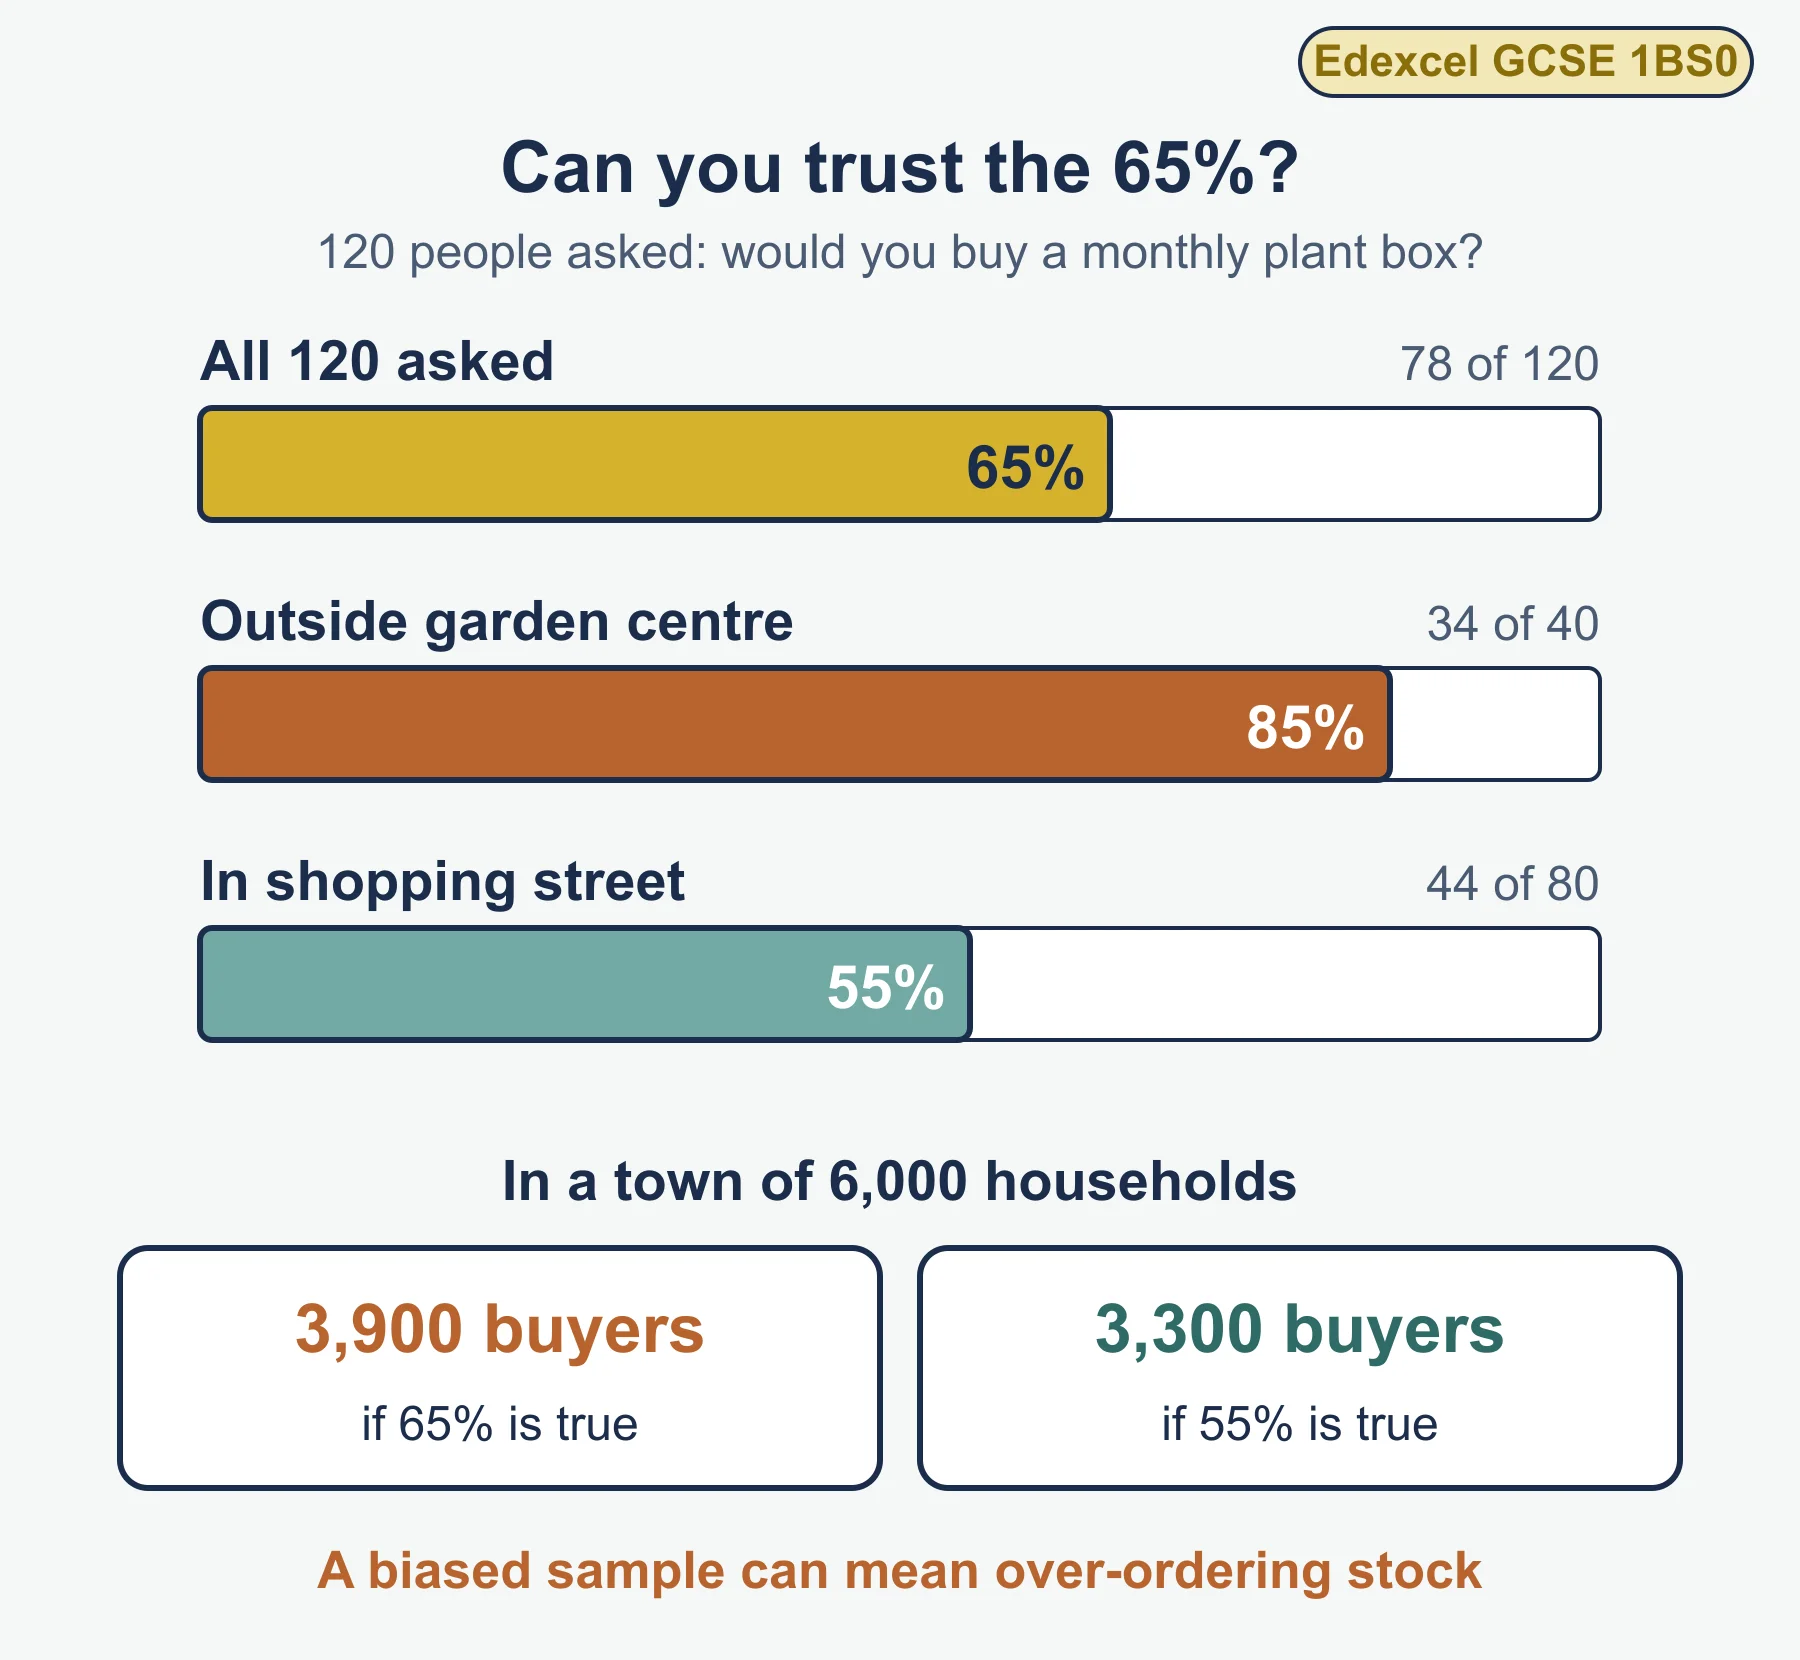
- Sample size is large enough.
- The sample is representative of the target market.
- Questions are not leading.
- Data is up to date.
- The source is trustworthy.
1.2.3 Market segmentation and market mapping
Bases for segmentation
| Basis | Example segment |
|---|---|
| Location | Residents within three miles of the shop |
| Demographics | Families with young children |
| Lifestyle | Keen runners |
| Income | Higher earners |
| Age | Teenagers aged 13 to 17 |
Why segment? To aim the product, price and promotion at the group most likely to buy, instead of spending on everyone.
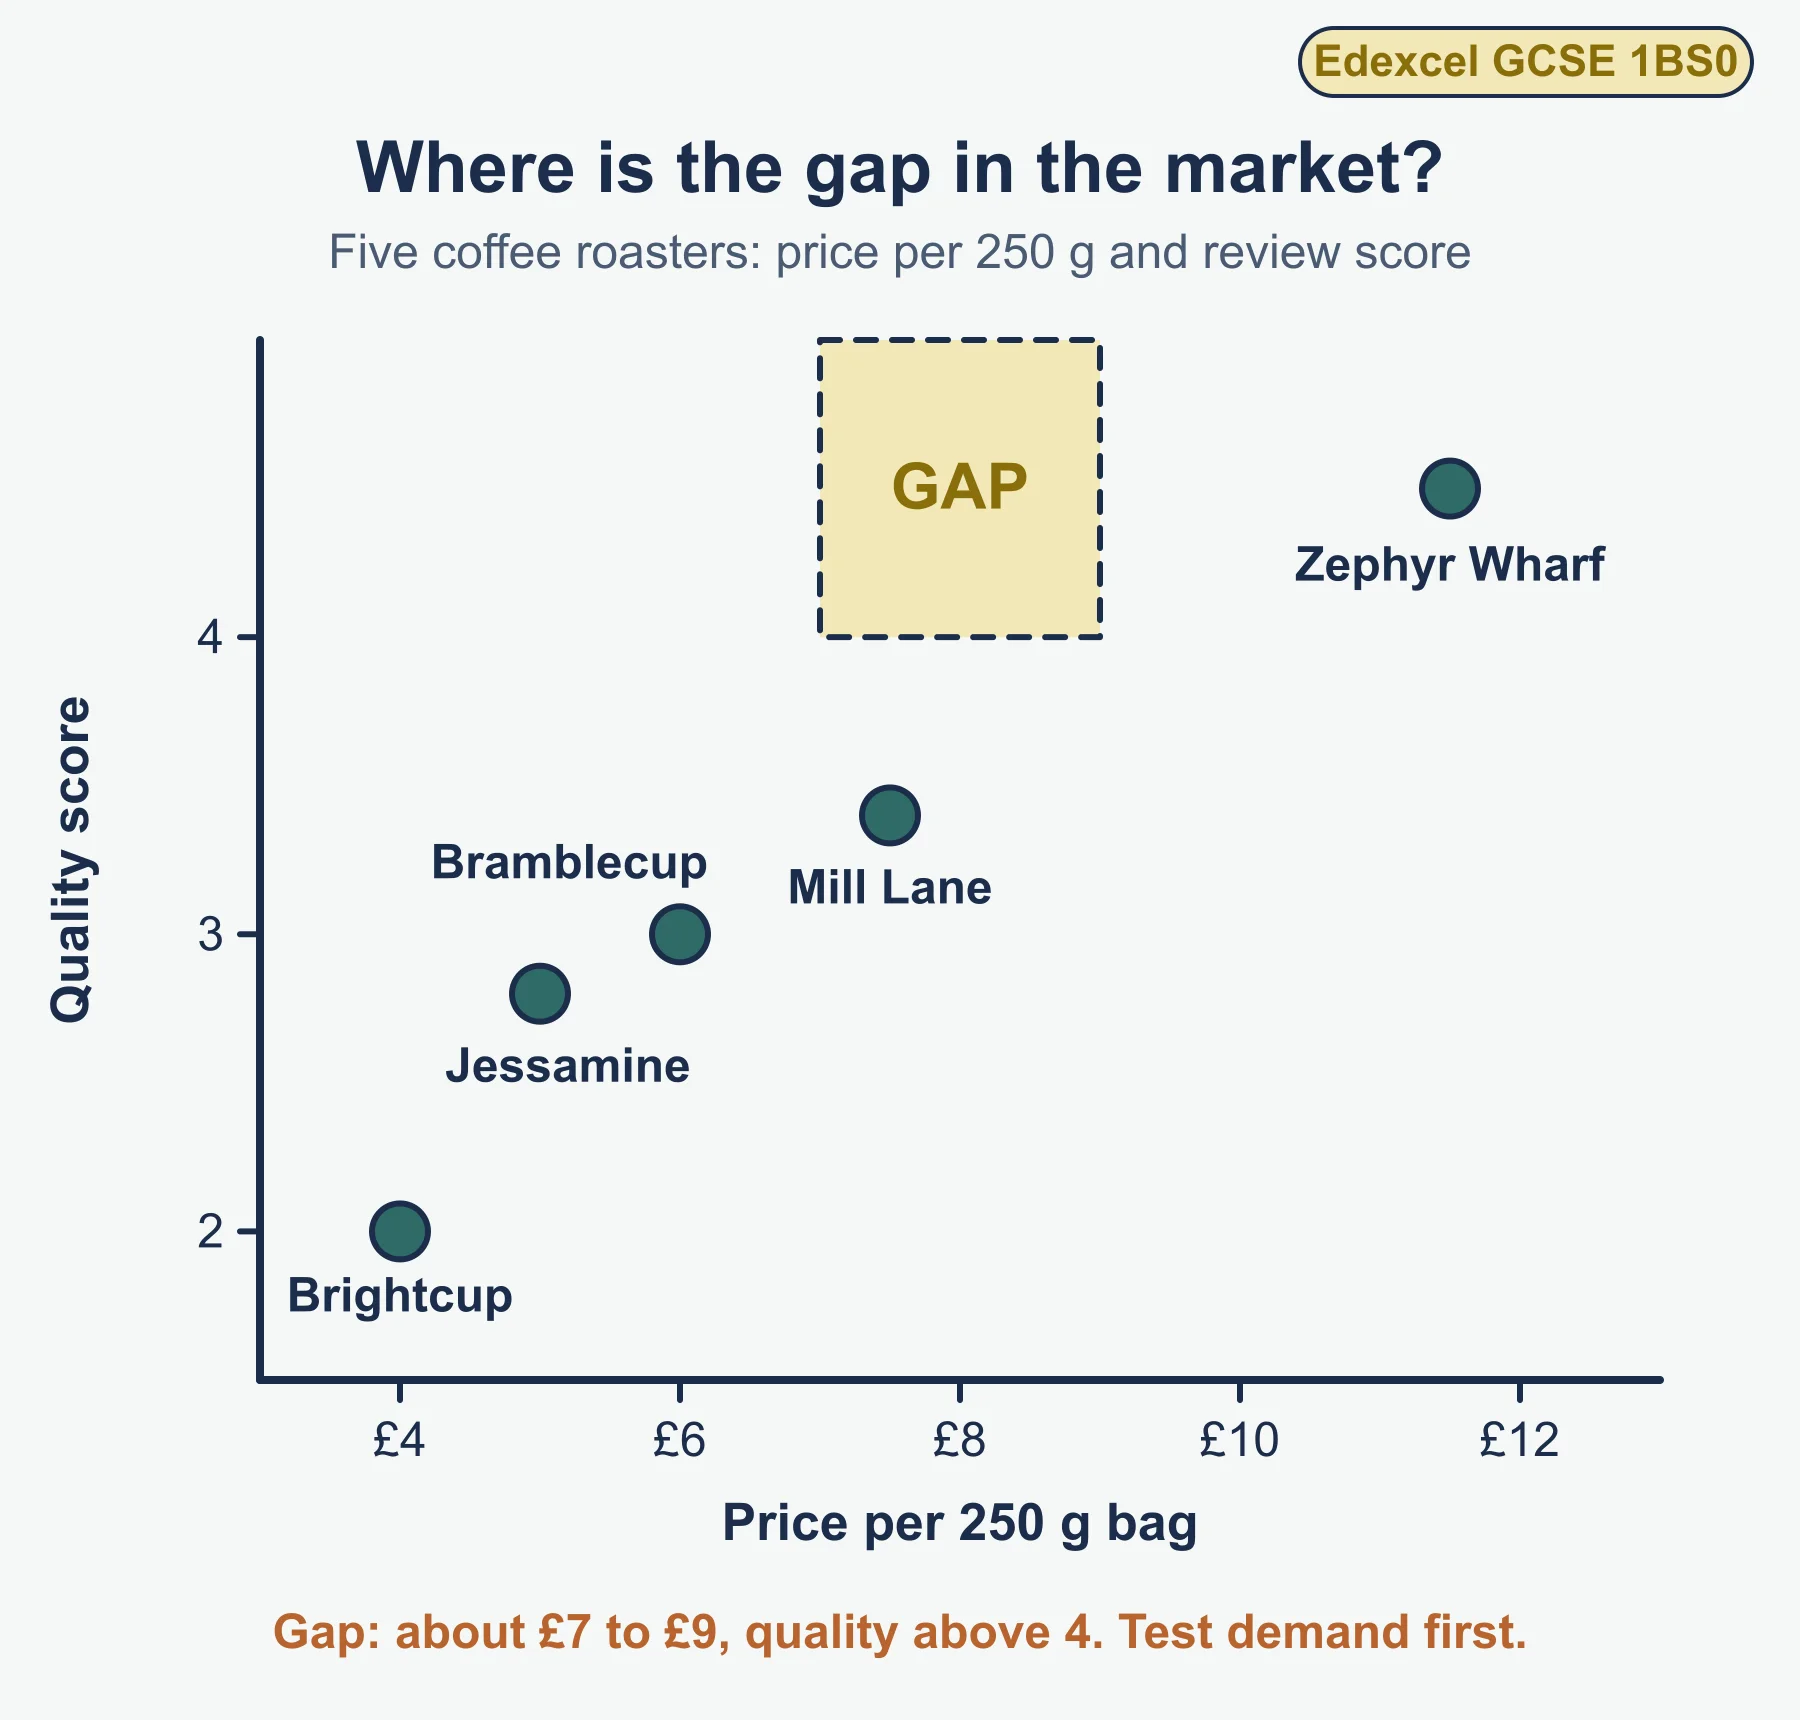
Market mapping in steps
- Choose two axes that matter to customers, often price and quality.
- Plot each competitor.
- Look for empty areas: these may be gaps.
- Look at crowded areas: this is where the competition is strongest.
- Test the gap with primary research before acting. An empty area may mean no demand.
Small ASCII example of a map with a gap in the top middle:
Quality high |  Rival C                      Rival D
             |            (gap)
             |  Rival A      Rival B
Quality low  +-------------------------------------
                low price            high price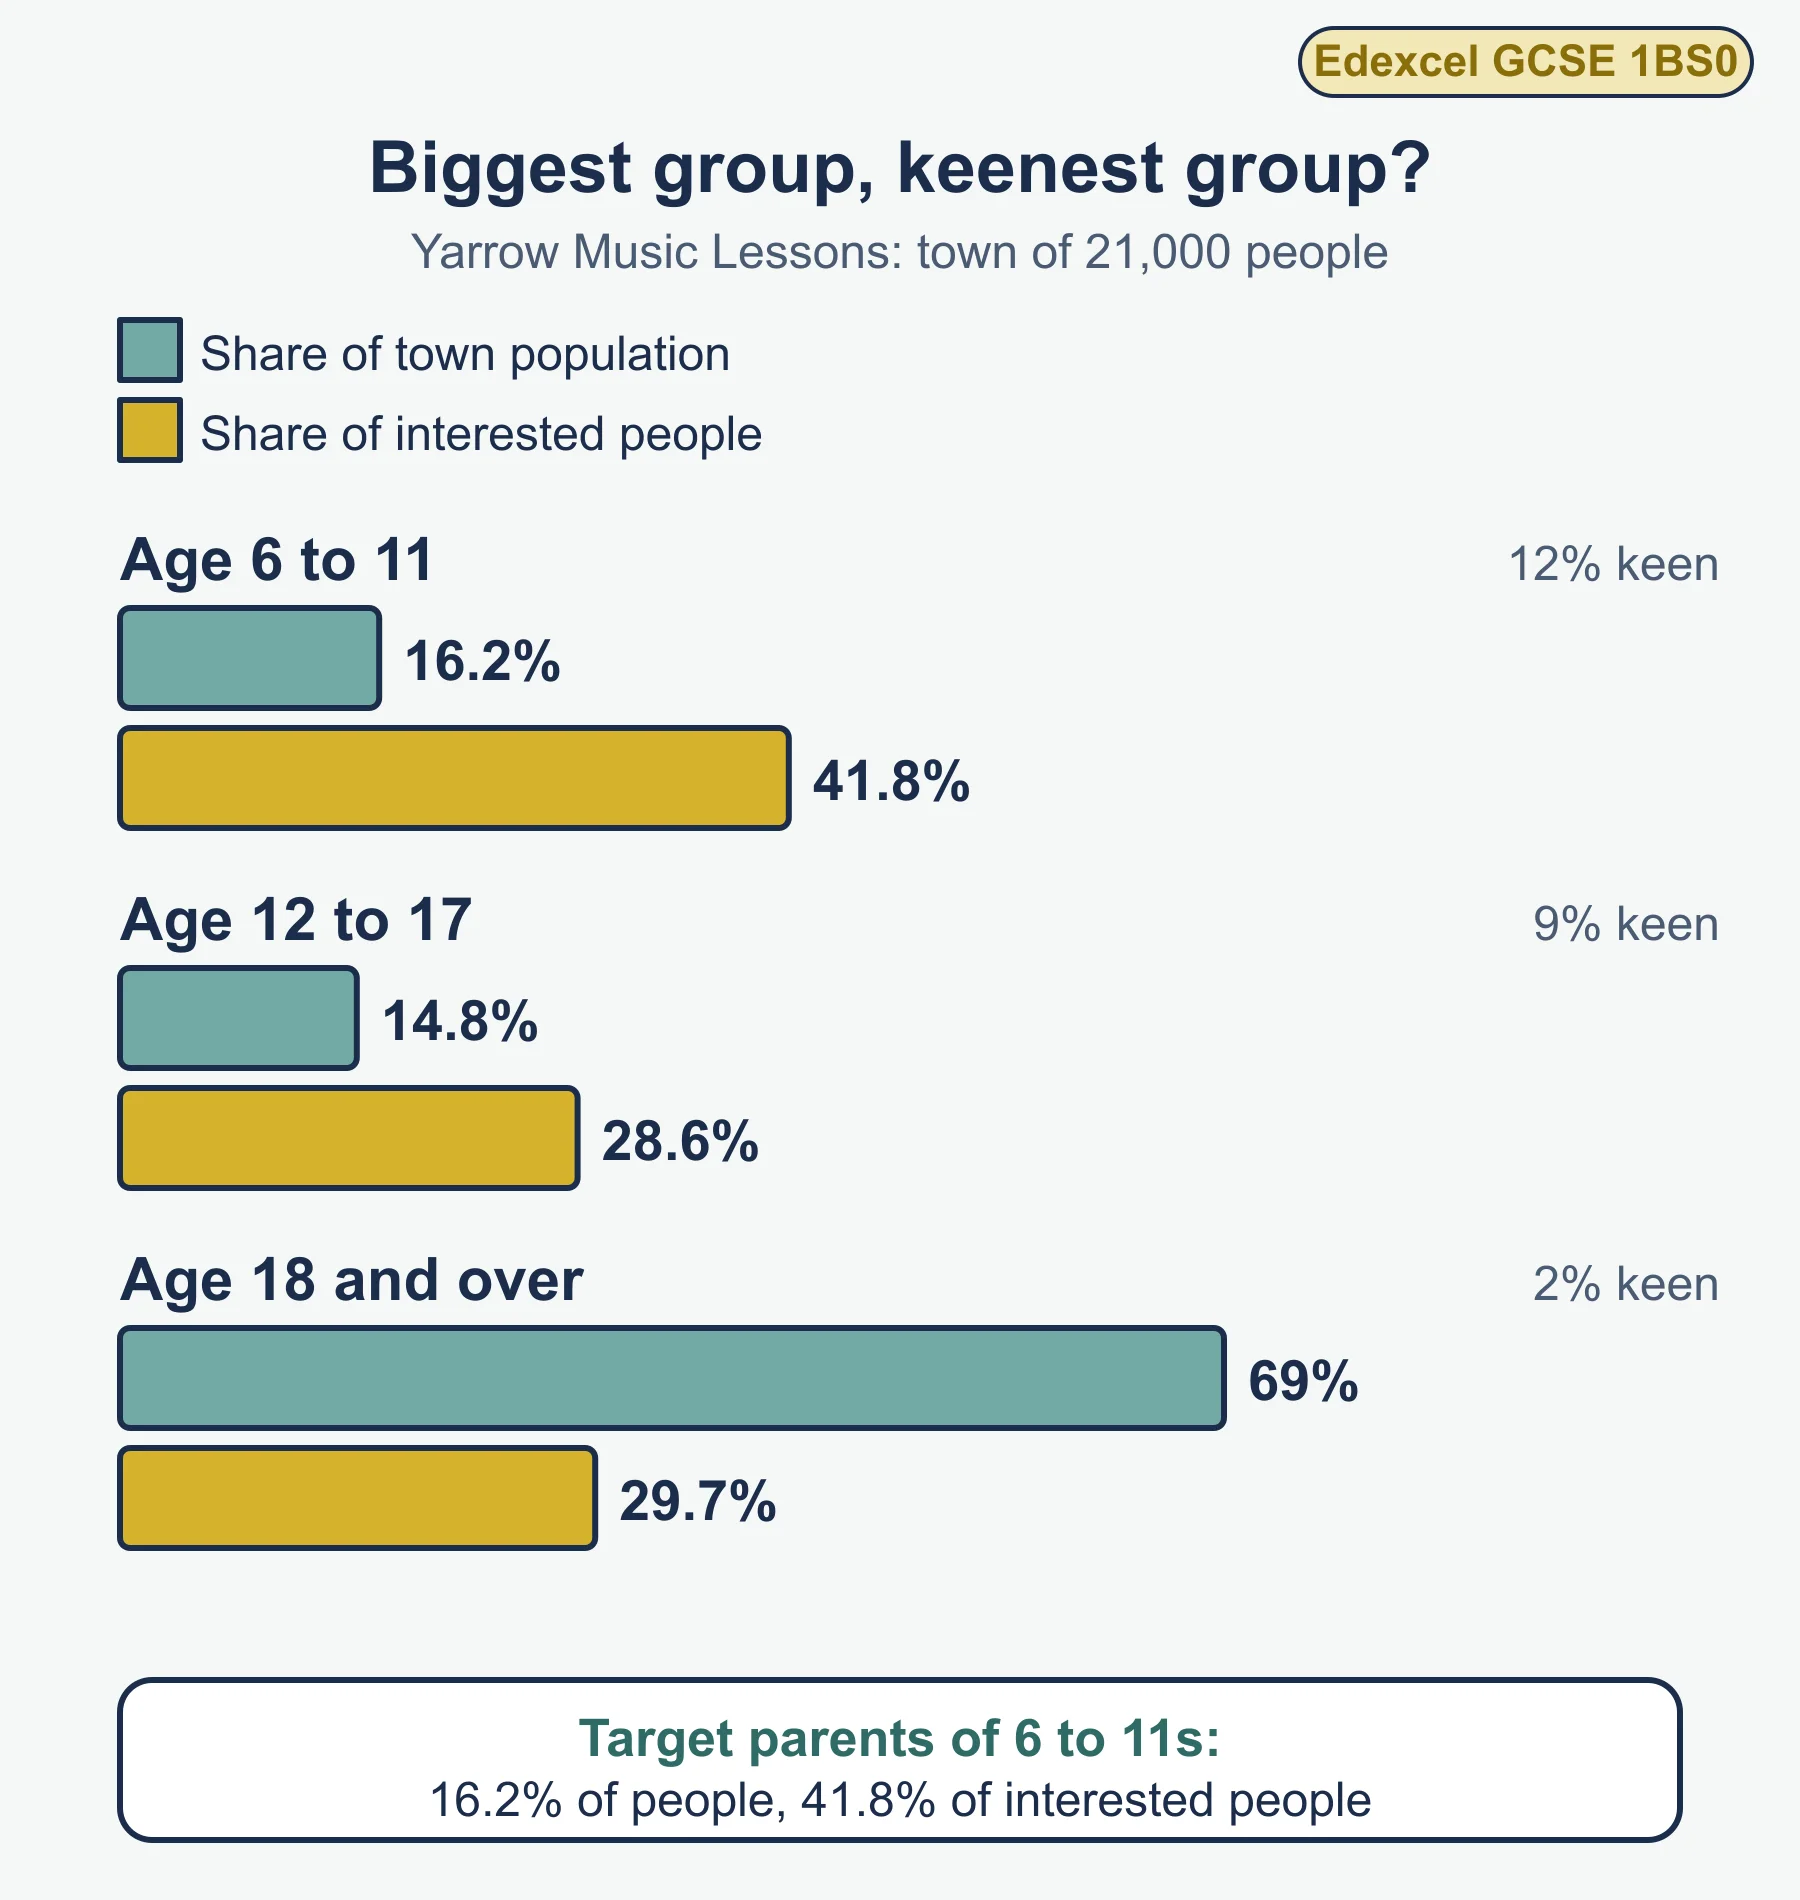
1.2.4 The competitive environment
Five factors for judging competitors
| Factor | Strength looks like | Weakness looks like |
|---|---|---|
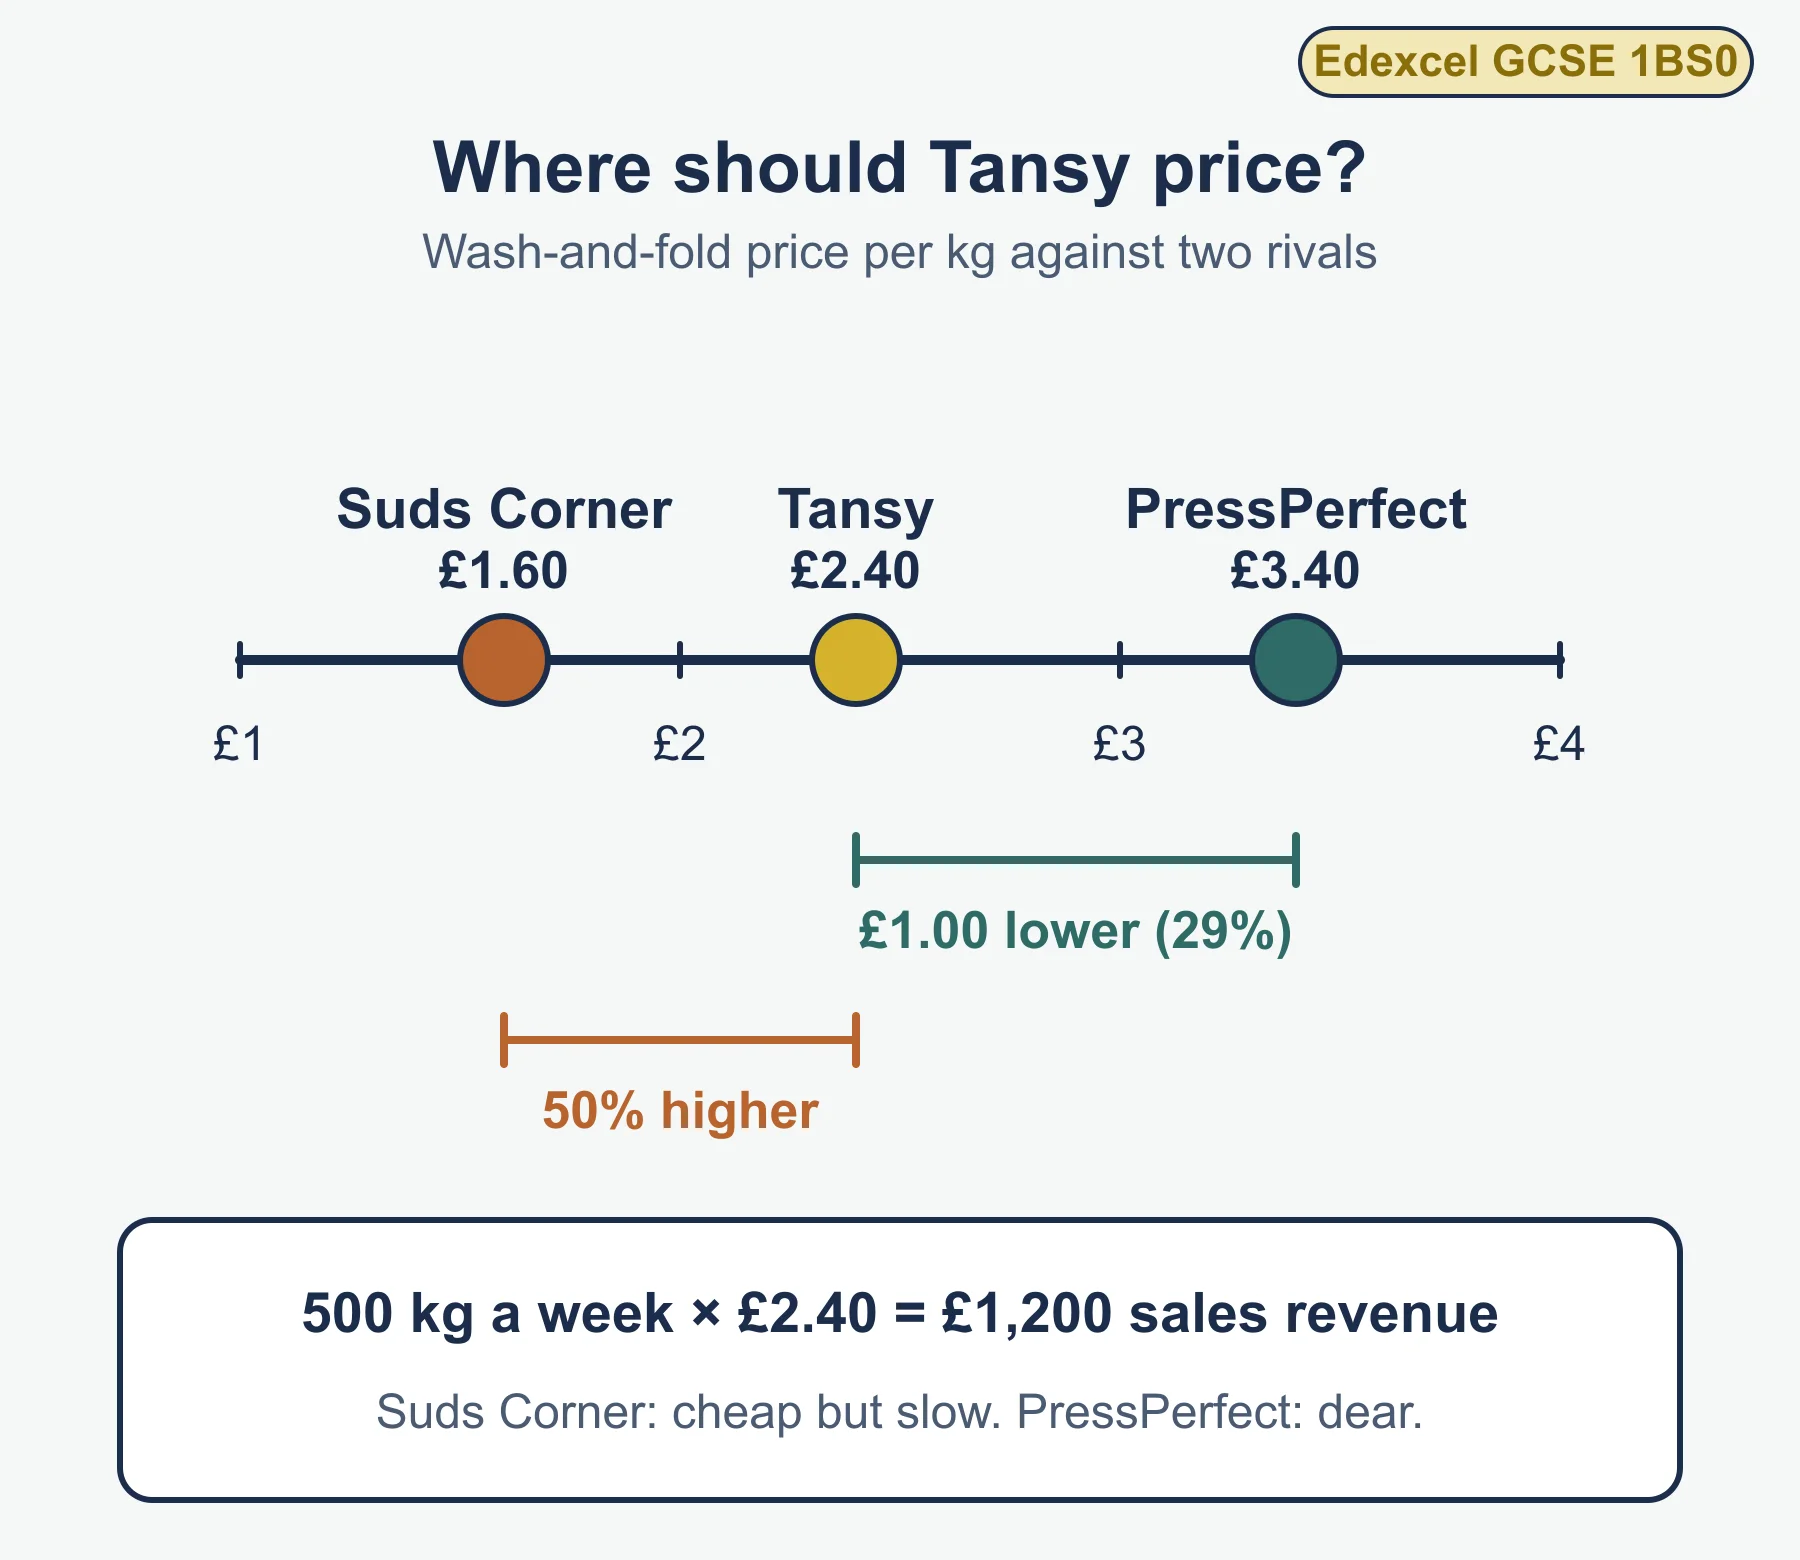
| Price | Lowest in the market, or good value | Dearer than similar rivals |
| Quality | Strong reviews | Complaints about faults |
| Location | Close to customers, or good online reach | Hard to reach |
| Product range | Wide choice | Narrow choice |
| Customer service | Helpful, reliable | Slow, unfriendly |
How competition affects decisions
- Price: match, undercut or stay above rivals.
- Quality and service: improve if rivals are better.
- Range: widen to fill a gap, or specialise.
- Location: pick a site near or away from rivals.
- Promotion: highlight what makes the business different.
Calculations you may need
| Skill | Formula (standard form) | Example |
|---|---|---|
| Percentage | part ÷ whole × 100 | 36 of 90 = 40% |
| Mean (average) | total ÷ number of values | five scores totalling 20.0 give 4.0 |
| Percentage change | change ÷ original × 100 | 960 to 1,200 is +25% |
| Market share | business sales ÷ total market sales × 100 | £21,000 of £140,000 = 15% |
The formula for market share is given here in its standard form; it is not one of those listed in Appendix 3 of the specification. Always show working for a Calculate question, because the specification says workings should be given.
Command words to know
| Command word | What the specification says it requires |
|---|---|
| Define | Give the meaning of a term from the content |
| State | A one-sentence answer picked from information given in the question |
| Identify | Select the correct answer from a graph or table |
| Calculate | Use mathematical skills on the data; give workings |
| Outline | Two linked points, placed in the context |
| Explain | One fact plus two developing points; no context |
| Analyse | Extended answer, with expansion, placed in context |
| Justify | Extended answer recommending one of two options, using the information provided |
| Evaluate | Extended answer using specification content to reach a conclusion that is backed up |
Quick self-test
- Define market research.
- Name the four customer needs listed in the specification.
- In a survey of 90 customers, 36 chose convenience as their main need. What percentage is that?
- Give two examples of primary research and two of secondary research.
- Is the comment “the box felt flimsy” qualitative or quantitative? Explain in one sentence.
- Five rival shops have review scores of 3.2, 4.5, 3.8, 4.1 and 4.4. Calculate the mean score.
- A business has sales of £21,000 in a market worth £140,000. Calculate its market share.
- Give two checks on whether research data is reliable.
- Name the five bases for market segmentation in the specification.
- A rival’s weekly sales rose from 960 units to 1,200 units. Calculate the percentage increase.
- Name the five factors you can use to compare competitors.
- A questionnaire is sent to 60 customers and 9 reply. What percentage replied, and why might this matter for reliability?
Answers
- Gathering and studying information on customers, rivals and the market.
- Price, quality, choice, convenience.
- 36 ÷ 90 × 100 = 40%.
- Primary: any two of survey, questionnaire, focus group, observation. Secondary: any two of internet, market reports, government reports.
- Qualitative, because it is a description of an opinion, not a number.
- Total = 3.2 + 4.5 + 3.8 + 4.1 + 4.4 = 20.0; 20.0 ÷ 5 = 4.0.
- 21,000 ÷ 140,000 × 100 = 15%.
- Any two of: large enough sample, representative sample, no leading questions, up-to-date data, trusted source.
- Location, demographics, lifestyle, income, age.
- (1,200 - 960) ÷ 960 × 100 = 25%.
- Price, quality, location, product range, customer service.
- 9 ÷ 60 × 100 = 15%. A low reply rate means the replies may come from a small, unusual group who do not represent all customers.
Where marks are usually lost
- Learning a definition but leaving it unapplied to the business named in the question.
- Writing “it is cheaper” for secondary research with no second point, when an Explain answer is likely to need a statement plus two expansion points.
- Saying primary research is “better” without saying what it is better for.
- Confusing qualitative with quantitative: a rating out of five is a number, a comment is not.
- Leaving out working in a Calculate question, or forgetting the percentage sign or the pound sign.
- Naming a gap in a market map without saying whether customers would buy.
- Describing a rival’s strength with no factor named, such as “they are good”.
- Giving a Justify answer that picks no option, or an Evaluate answer with no conclusion.
Frequently asked questions
What are the four customer needs in Edexcel GCSE Business? The 1BS0 specification names price, quality, choice and convenience. Identifying them matters because it helps a business generate sales and survive.
What is the difference between primary and secondary research? Primary research is new information collected first-hand, through surveys, questionnaires, focus groups or observation. Secondary research uses existing information such as the internet, market reports and government reports, which is cheaper and faster but may be dated.
What is the difference between qualitative and quantitative data? Quantitative data is in number form, such as counts, percentages and ratings, and is easy to compare. Qualitative data is descriptive, such as opinions and reasons, and explains the numbers but is harder to measure.
Does market research remove risk? No. Market research reduces risk by showing demand before money is spent, but it cannot remove risk altogether.
Official syllabus
Pearson Edexcel Level 1/Level 2 GCSE (9-1) in Business (1BS0), Specification, Issue 2, July 2022, published by Pearson Education Limited. Theme 1: Investigating small business, Topic 1.2 Spotting a business opportunity, items 1.2.1 to 1.2.4.
Get free revision emails (optional)
Occasional emails with practice questions, worked explanations and links to free resources for the qualification and subjects you choose. No spam, and you can unsubscribe from any email. The free tools on this site never need an email.
Related resources
-
Study guides
Edexcel GCSE Business: Spotting a business opportunity and customer needs (1BS0)
Study guide to customer needs, market research, market segmentation, market mapping and competitors for Pearson Edexcel GCSE Business 1BS0 topic 1.2.
Business · Pearson Edexcel · GCSE
Read guide -
Practice questions
Edexcel GCSE Business: Spotting a business opportunity and customer needs (1BS0) – Practice Questions
Original practice questions with worked answers on customer needs, market research, segmentation and competitors for Edexcel GCSE Business 1BS0 Topic 1.2.
Business · Pearson Edexcel · GCSE
Try questions -
Study guides
Edexcel GCSE Business: Stakeholders and technology (1BS0)
Study guide to business stakeholders, conflicts between them, and technology's effect on sales, costs and the marketing mix, for Edexcel GCSE Business.
Business · Pearson Edexcel · GCSE
Read guide
Related articles
-
teaching
A Level tuition in Dubai: Cambridge or Pearson Edexcel International A Level?
Schools in Dubai and Abu Dhabi teach either Cambridge International AS & A Level or Pearson Edexcel International A Level. How the two are structured, why it matters for tuition, and how online classes from Lahore work.
9 October 2026
-
curriculum guides
Choosing subjects at IGCSE and A Level
How subject choices at 14 and 16 affect university options later, and how to keep pathways open without overloading a timetable.
28 July 2026
Studying this with a teacher
Working through Business GCSE?
This page is free and stays free. If you would rather be taught it, Marlbridge runs Business classes one-to-one and in small groups of up to 15, online in your own time zone. The first trial class is free. WhatsApp replies within an hour (8am–11pm Pakistan time, every day); email the same day.
Pearson Edexcel Business teachers at Marlbridge

