
Study Guides
Edexcel GCSE Business: Spotting a business opportunity and customer needs (1BS0)
Study guide to customer needs, market research, market segmentation, market mapping and competitors for Pearson Edexcel GCSE Business 1BS0 topic 1.2.
- Subject
- Business
- Level
- GCSE
- Topic
- Spotting a business opportunity
- Author
- Marlbridge Academic Team
- Updated
- Reviewed by
- Asif Iqbal (what this means)
Aligned to Pearson Edexcel GCSE Business (1BS0), Issue 2, July 2022. Official specification .
Syllabus page (what it covers and how it is assessed): Pearson Edexcel GCSE Business.
Syllabus points this page covers
1BS0
- 1.2 Spotting a business opportunity (whole topic)
- 1.2.1 Customer needs
- 1.2.2 Market research
- 1.2.3 Market segmentation
- 1.2.4 The competitive environment
Found an error? Report a correction.
Want a teacher for this? Marlbridge teaches Business online. Request a free trial class.
This guide follows the Pearson Edexcel Level 1/Level 2 GCSE (9-1) in Business (1BS0) specification, Issue 2, July 2022. It covers Theme 1, Topic 1.2 Spotting a business opportunity, content items 1.2.1 to 1.2.4: customer needs, market research, market segmentation and the competitive environment. Formulae are listed in Appendix 3 of the specification and are not provided in the examinations, and calculators may be used. Every business below is invented.
Course links: the Business hub, the printable checklist and the free diagnostics. Companion pages: the revision notes and the practice questions.
What Topic 1.2 asks you to do
| Item | You must be able to | Part of this guide |
|---|---|---|
| 1.2.1 | Describe customer needs (price, quality, choice, convenience) and explain why identifying them matters (generating sales, business survival) | Part 1 |
| 1.2.2 | Explain the purposes of market research, compare primary and secondary methods, and use qualitative and quantitative data, social media and reliability | Part 2 |
| 1.2.3 | Segment a market by location, demographics, lifestyle, income and age, and use market mapping to find a gap and the competition | Part 3 |
| 1.2.4 | Judge competitors on price, quality, location, product range and customer service, and show how competition affects decisions | Part 4 |
The quantitative skills in Appendix 2 include percentages, averages, marketing data including market research data, and market data such as market share. Expect to meet them in this topic.
Part 1: customer needs (1.2.1)
A customer need is something a customer wants from a purchase. The specification names four:
- Price: customers want to pay an amount they see as fair for what they get. For some, the lowest price wins. For others, a higher price is acceptable.
- Quality: customers want a product or service that works well, lasts and meets the standard they expect.
- Choice: customers want a range of products, sizes, flavours or styles to pick from.
- Convenience: customers want the purchase to be quick and easy, for example a nearby shop, late opening, home delivery or simple online ordering.
Why identifying and understanding customers matters
The specification gives two reasons.
- Generating sales. A business that knows what its customers need can offer it, so more of them buy. Sales revenue rises because the product fits the need rather than being a guess.
- Business survival. A new or small business has little money to waste. If it makes something nobody needs, sales stay below costs and the business may close. If it meets a need better than rivals, it can keep customers and keep trading.
Worked example 1: Larkspur Lunch Box
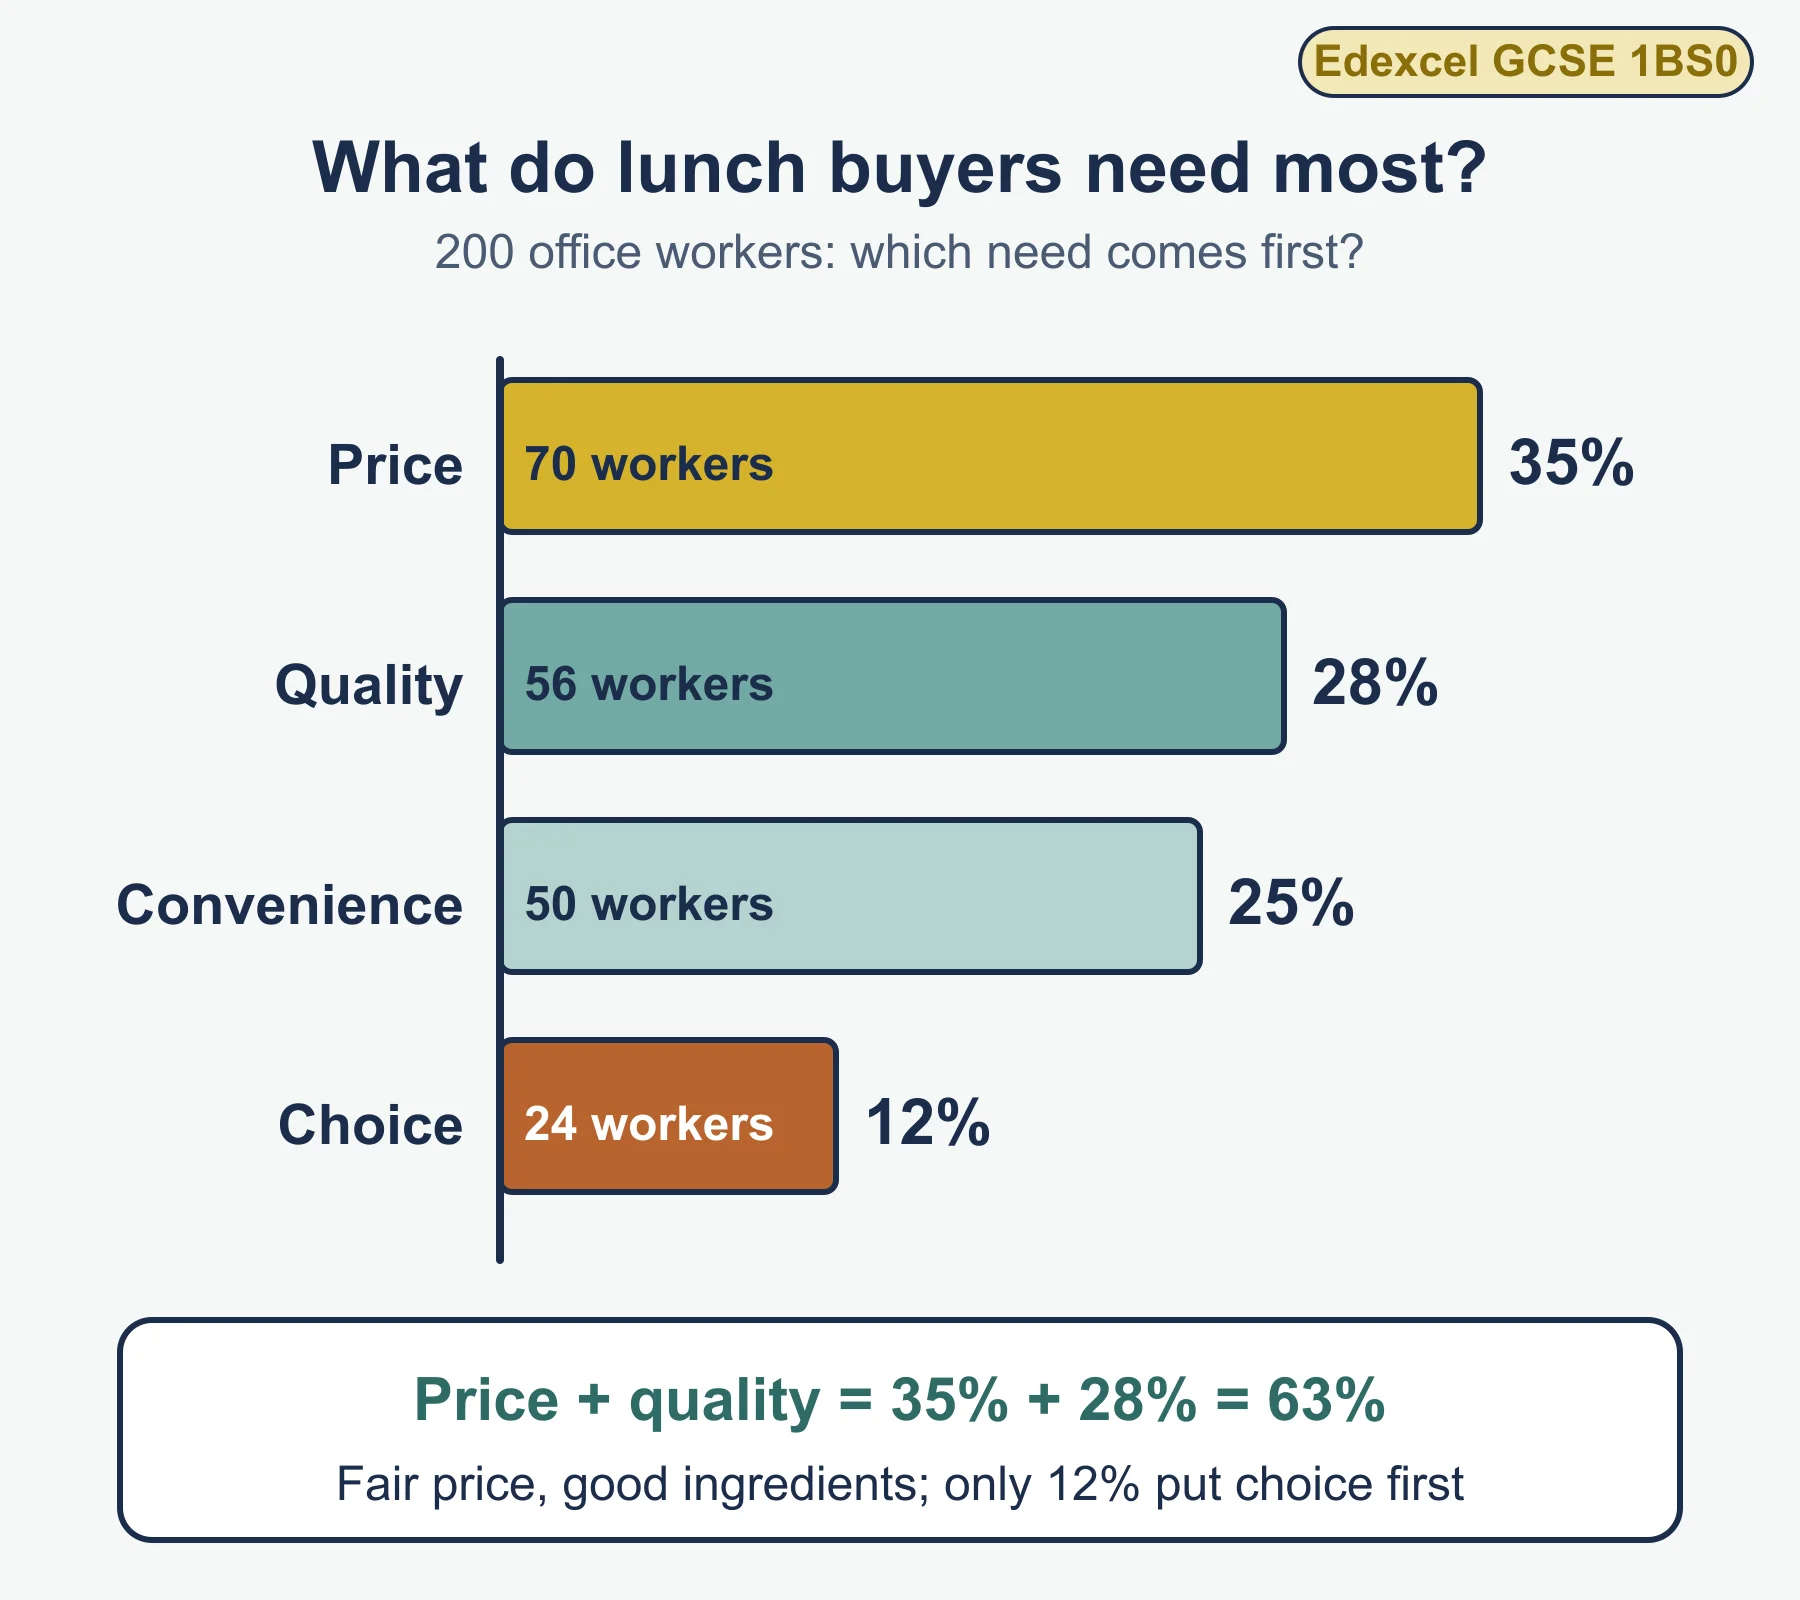
Larkspur Lunch Box plans a takeaway lunch counter beside an office park. The owner asks 200 office workers which one need matters most when buying lunch.
| Need | Workers | Share of 200 |
|---|---|---|
| Price | 70 | 35% |
| Quality | 56 | 28% |
| Choice | 24 | 12% |
| Convenience | 50 | 25% |
Check: 70 + 56 + 24 + 50 = 200, so the shares add to 100%. Each share is workers ÷ 200 × 100.
Price and quality together account for 63% of answers. The owner could set a fair price, buy good ingredients and keep the menu short, because only 12% rank choice first. Convenience is a quarter of answers, so quick service matters.
Part 2: market research (1.2.2)
Market research means gathering and studying information on customers, rivals and the market.
Purposes
Market research has four purposes in the specification:
- To identify and understand customer needs, as in Larkspur’s survey.
- To identify gaps in the market: customer needs that no business meets well.
- To reduce risk: knowing demand before spending money lowers the chance of failure. It does not remove risk.
- To inform business decisions: price, product design, location and promotion can rest on evidence.
Methods
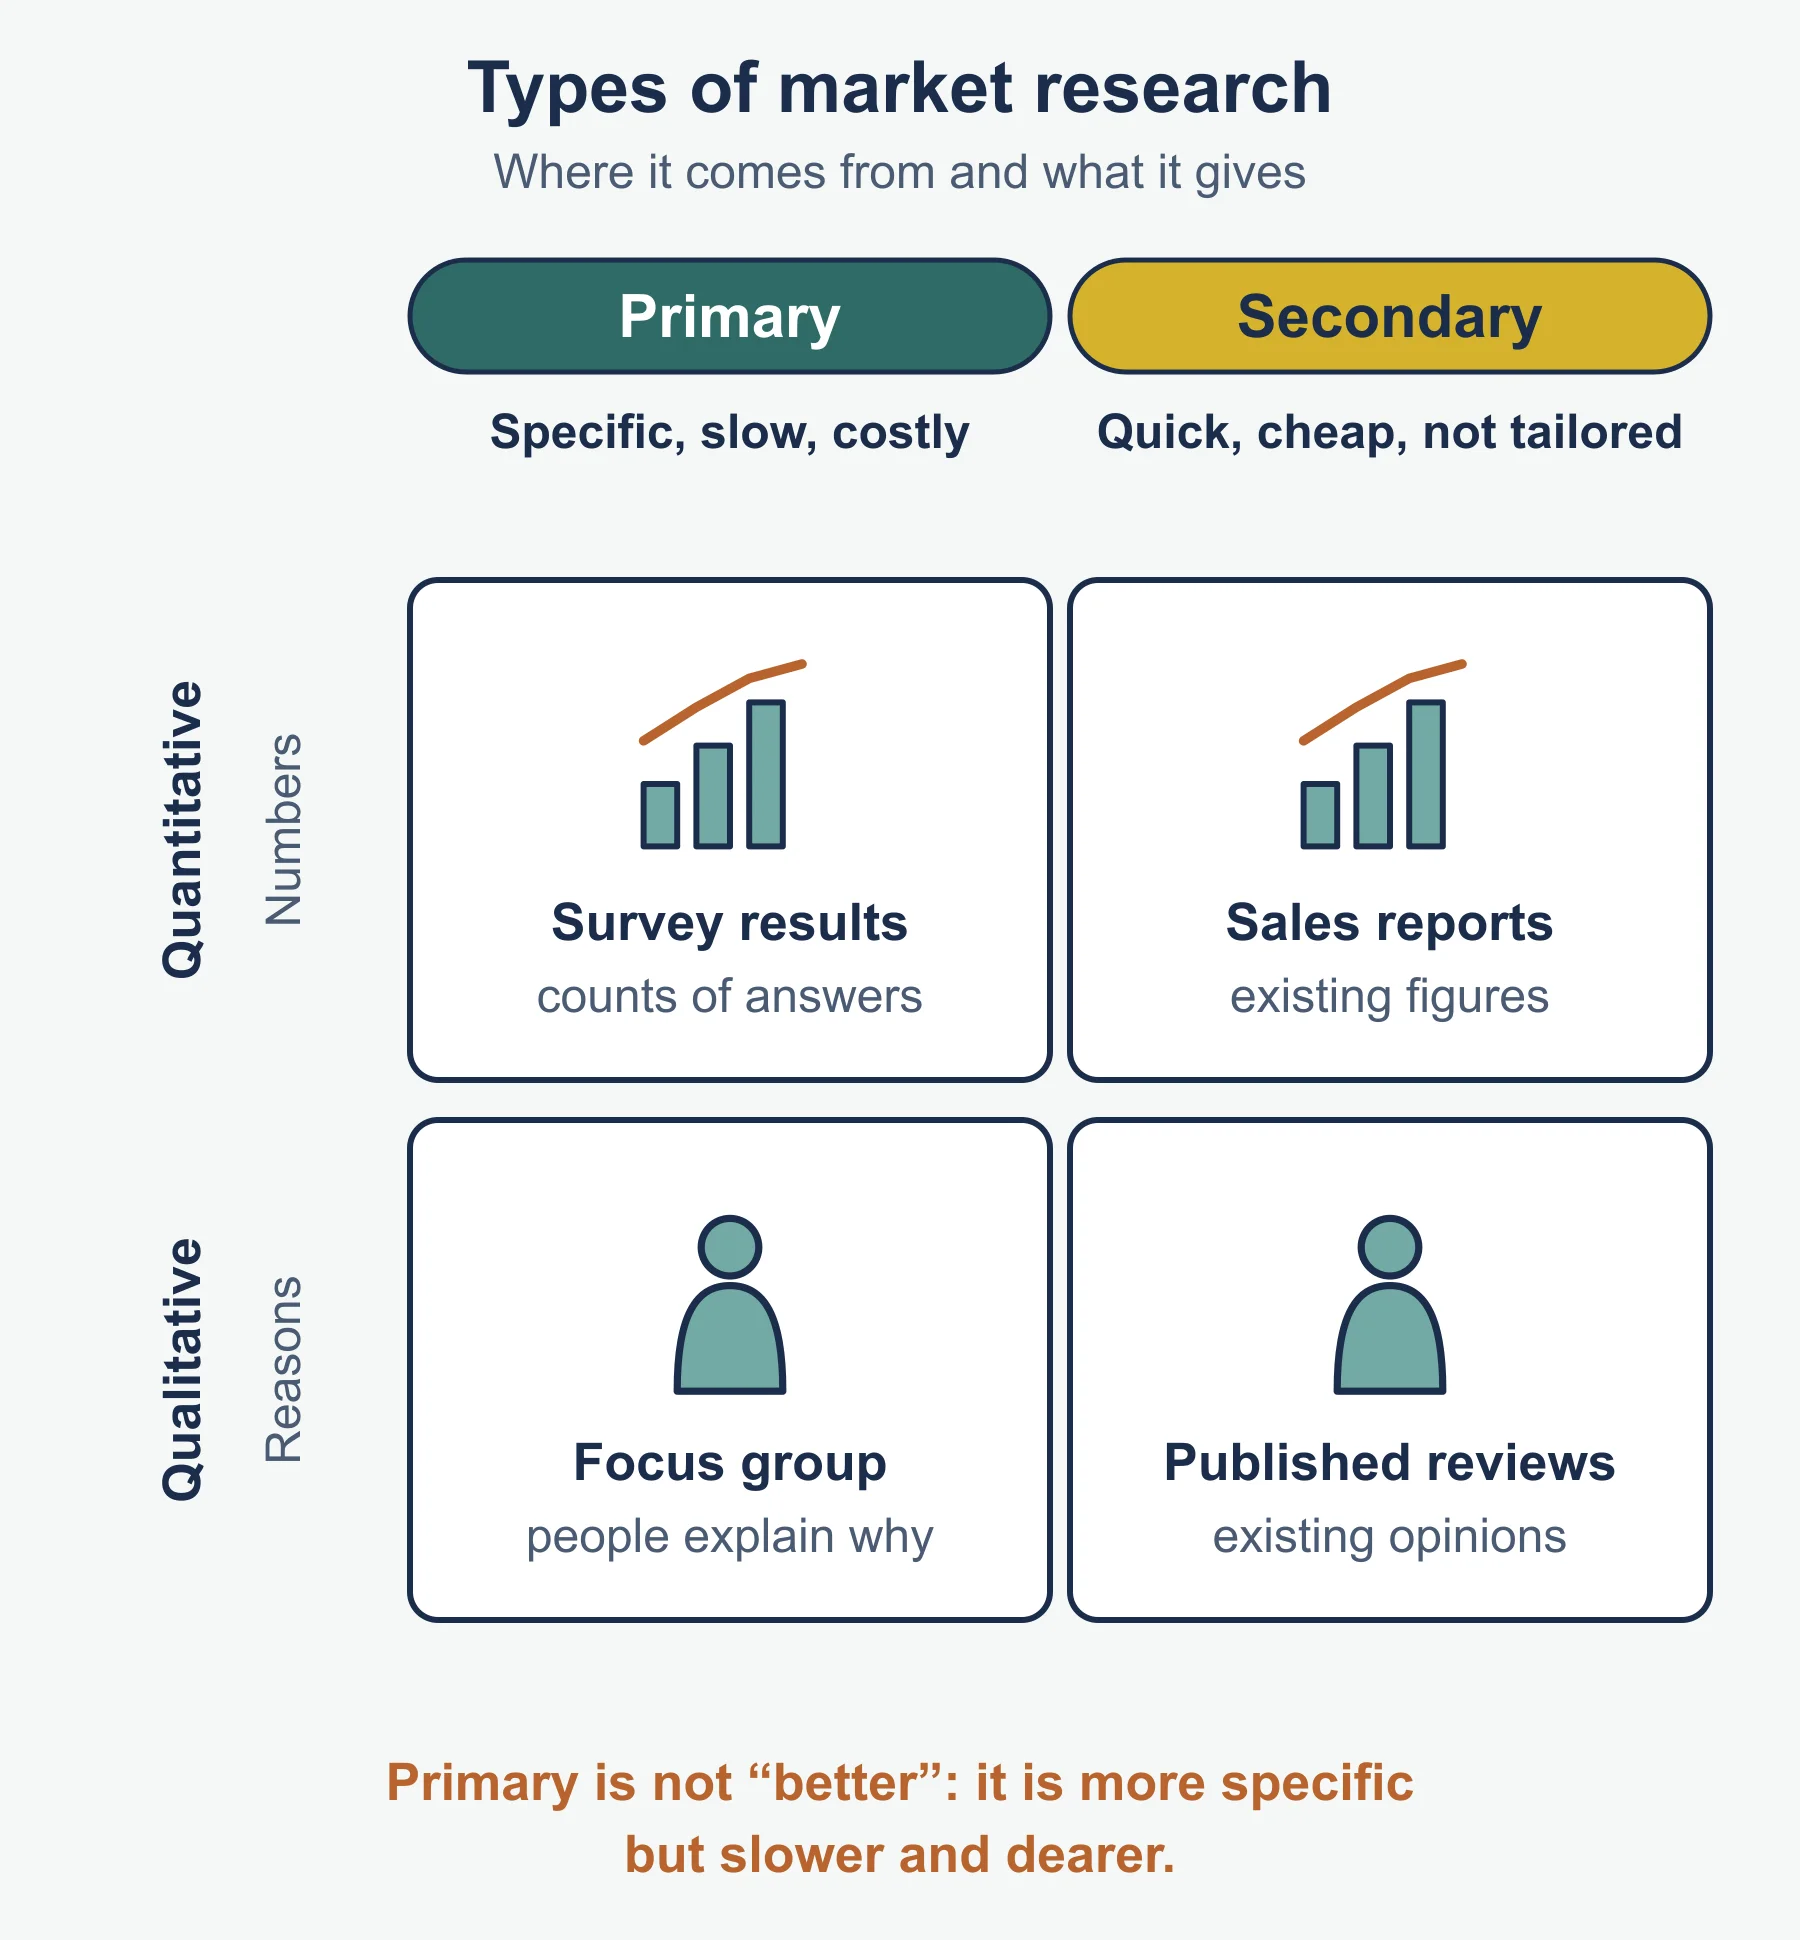
Primary research is new information collected first-hand for the business’s own purpose. The specification lists four methods:
| Method | What it is | Strength | Weakness |
|---|---|---|---|
| Survey | Questions asked of a sample of people | Can reach many people and give numbers | Takes time and costs money |
| Questionnaire | A written set of questions that people complete | Same questions for everyone, easy to compare | Poor wording gives poor answers; people may not return it |
| Focus group | A few people talk through a product under a facilitator | Gives detailed opinions and reasons | Small group; one loud person can sway the rest |
| Observation | Watching what customers actually do | Shows real behaviour, not what people say | Does not explain why they act that way |
Secondary research draws on existing information gathered earlier by another organisation. The specification lists the internet, market reports and government reports. It is usually faster and costs less, but it may be dated or may not cover your local area.
A small business often uses both: a government report on local households, then its own survey on how many would buy.
Qualitative and quantitative data
Quantitative data is in number form: counts, percentages, prices, ratings. It is easy to total and compare.
Qualitative data is descriptive: opinions, feelings and reasons, such as a focus group saying why a design looks cheap. It explains the numbers but is harder to measure.
A survey with a tick-box question gives quantitative data. The same survey with a comment box gives qualitative data.
The role of social media
Social media gives a low-cost, fast route to customer opinion. A business can post a poll, ask followers to choose between designs, read comments and reviews, and see which posts get the most reaction. It can reach people who would never fill in a street questionnaire.
Followers already like the business, so they may not represent the whole market, and anyone can vote, including people who would never buy.
Reliability of research data
Data is reliable when the business can trust it to reflect the market. Check these points.
- Sample size: a very small sample may not show the true picture.
- Representative sample: the people asked should match the target market in age, location and income.
- Bias: leading questions (“Don’t you agree our cakes are great?”) or asking in a place that favours one answer distort results.
- Age of the data: old secondary data may no longer describe the market.
- Source: a trusted source is more dependable than an unnamed website.
Worked example 2: Wagtail Plant Studio
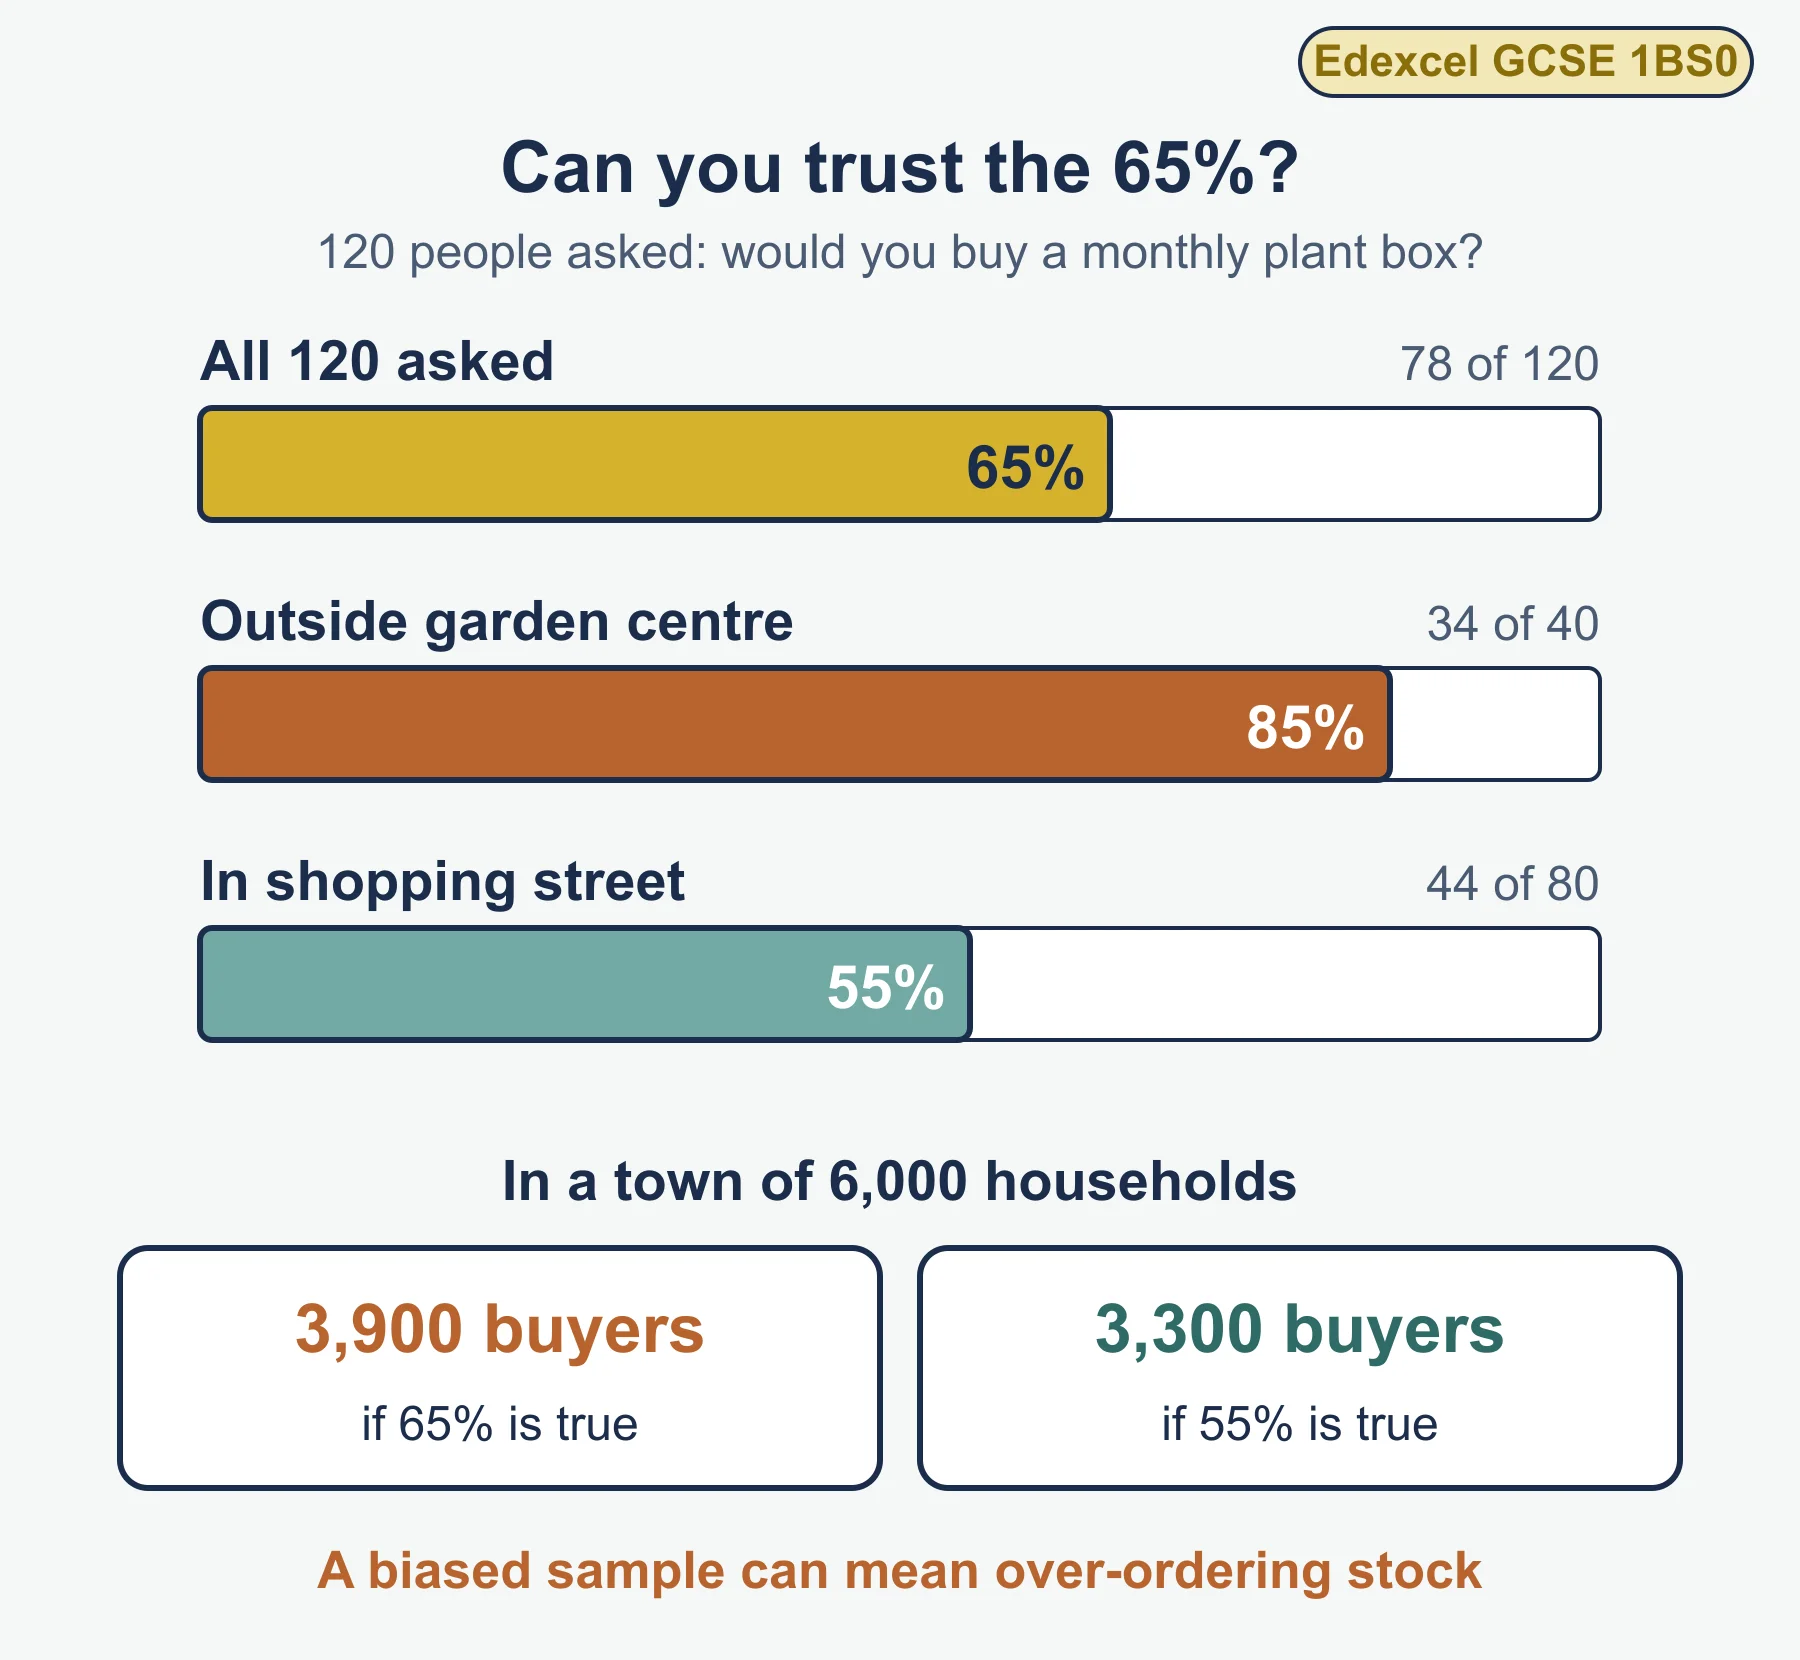
Wagtail Plant Studio wants to sell houseplant subscription boxes. It asks 120 people, “Would you buy a monthly houseplant box?” and 78 say yes.
Percentage saying yes = 78 ÷ 120 × 100 = 65%.
The owner then notices that 40 of the 120 were asked outside a garden centre. Of these, 34 said yes. The other 80 were asked in a shopping street and 44 said yes.
- Garden centre group: 34 ÷ 40 × 100 = 85%.
- Shopping street group: 44 ÷ 80 × 100 = 55%.
Garden centre visitors already like plants, so that group is more likely to say yes. The 65% headline figure is probably too high for the whole town. If 6,000 households are in the area, 65% suggests 3,900 buyers, while 55% suggests 3,300. A biased sample could lead to over-ordering stock and wasted money.
Part 3: market segmentation and market mapping (1.2.3)
A market is all the customers who might buy a type of product. Market segmentation divides it into groups with shared characteristics so the business can aim its product, price and promotion at the group it serves best. This is called targeting. Five bases for identifying segments appear in the specification.
| Basis | What it groups by | Example |
|---|---|---|
| Location | Where people live or work | A bakery targets a town, not the whole country |
| Demographics | Population characteristics such as gender, family size or occupation | Baby products aimed at new parents |
| Lifestyle | How people live and spend their time | Camping gear for people who enjoy the outdoors |
| Income | How much people earn | Premium watches for high earners, budget lines for others |
| Age | Which age group | Games aimed at under-12s |
Segments often overlap, for example “families with young children within five miles”.
Worked example 3: Yarrow Music Lessons
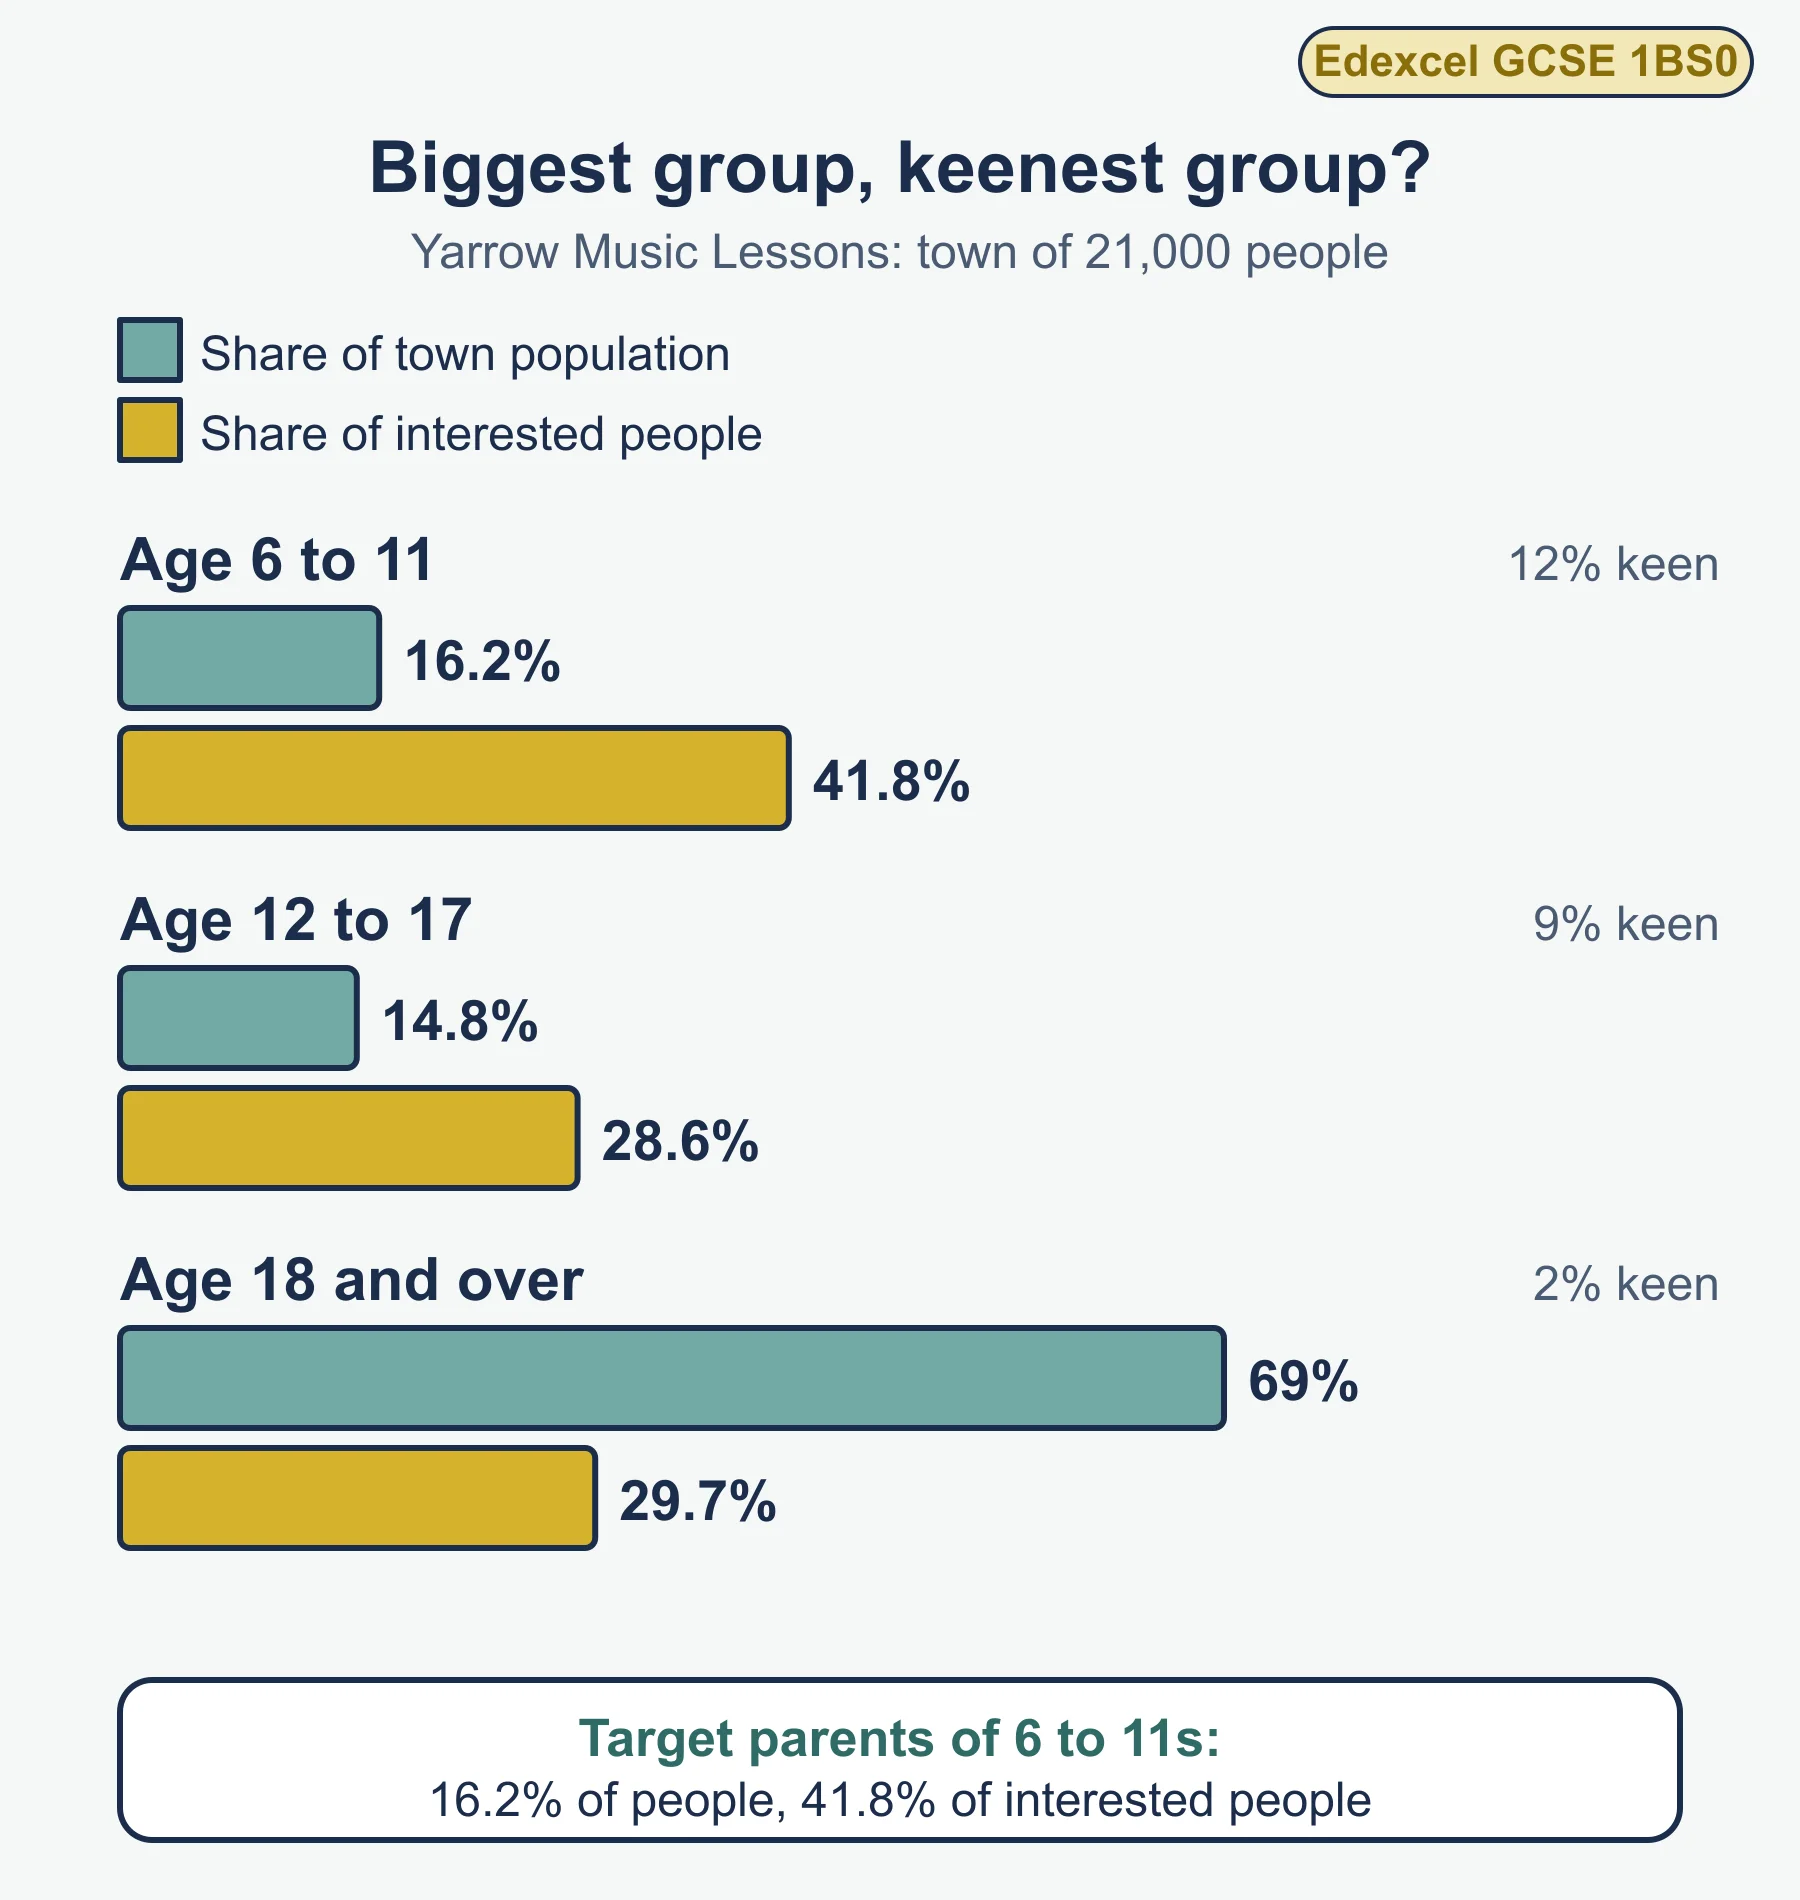
Yarrow Music Lessons plans to offer lessons in a town of 21,000 people. A survey estimates the share of each age segment interested in lessons.
| Age segment | People | Interested | Interested people |
|---|---|---|---|
| 6 to 11 | 3,400 | 12% | 408 |
| 12 to 17 | 3,100 | 9% | 279 |
| 18 and over | 14,500 | 2% | 290 |
Total interested = 408 + 279 + 290 = 977. The 6 to 11 segment is only 16.2% of the population (3,400 ÷ 21,000), yet it provides 41.8% of interested people (408 ÷ 977). Yarrow should target parents of younger children, because the adult segment is the largest group but the least keen.
Market mapping
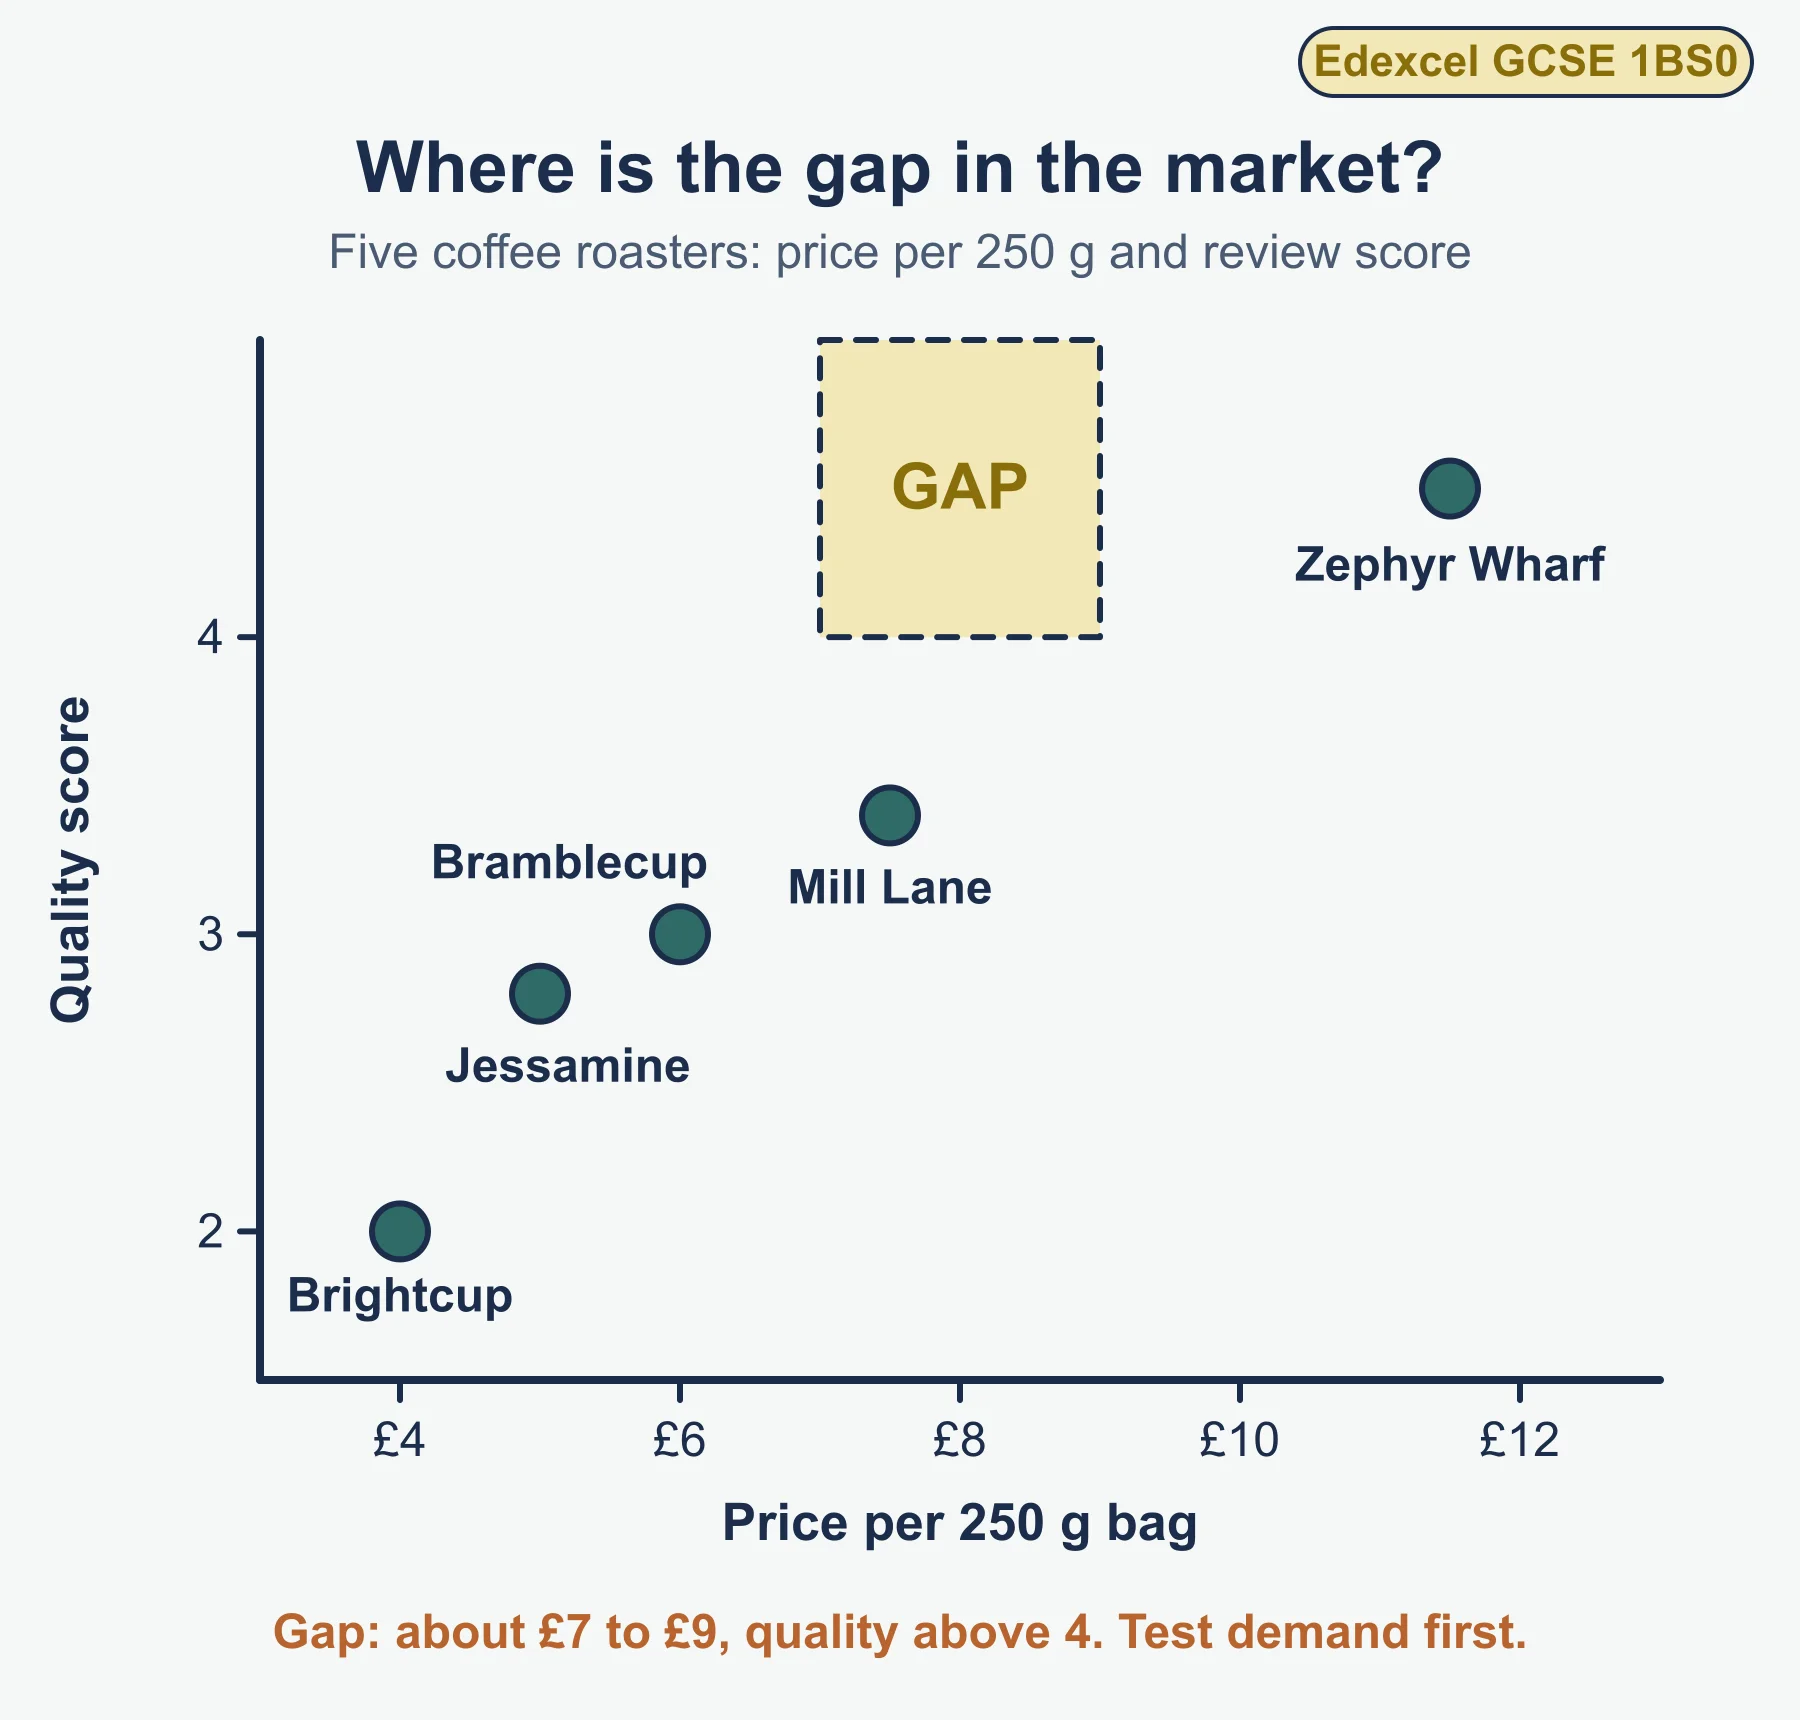
Market mapping plots existing businesses on a diagram with two axes, usually price and quality. It helps a business to:
- see the competition: who is close to its planned product;
- find a gap in the market: an empty area where customers have a need that nobody meets.
Worked example 4: coffee roasters
A new roaster studies five rivals in its area. Price is per 250 g bag and quality is an average review score out of 5.
| Competitor | Price (£) | Quality score |
|---|---|---|
| Brightcup | 4.00 | 2.0 |
| Jessamine | 5.00 | 2.8 |
| Bramblecup | 6.00 | 3.0 |
| Mill Lane | 7.50 | 3.4 |
| Zephyr Wharf | 11.50 | 4.5 |
Plotted with price across and quality up, the businesses form a rising line from low price and low quality to high price and high quality.
Quality  high |                         Zephyr Wharf
              |
              |            (gap)
              |                  Mill Lane
         low  | Brightcup Jessamine Bramblecup
              +---------------------------
                low price           high price
The gap is a good-quality coffee at a mid price, around £7 to £9, with a quality score above 4. The mean price of the five rivals is £34.00 ÷ 5 = £6.80. A roaster pricing at £8.50 would sit above most but below the premium rival. The owner must still test with primary research whether enough customers want that product, because a gap may exist simply because there is no demand.
Part 4: the competitive environment (1.2.4)
Competitors are businesses selling similar products to the same customers. The specification asks you to assess their strengths and weaknesses on five factors.
| Factor | Questions to ask |
|---|---|
| Price | Are they cheaper or dearer? Do they run offers? |
| Quality | How good are their products or reviews? |
| Location | Are they close to customers? Do they sell online? |
| Product range | How wide is their choice? |
| Customer service | Are staff helpful, delivery reliable and complaints handled well? |
Worked example 5: Tansy Laundry
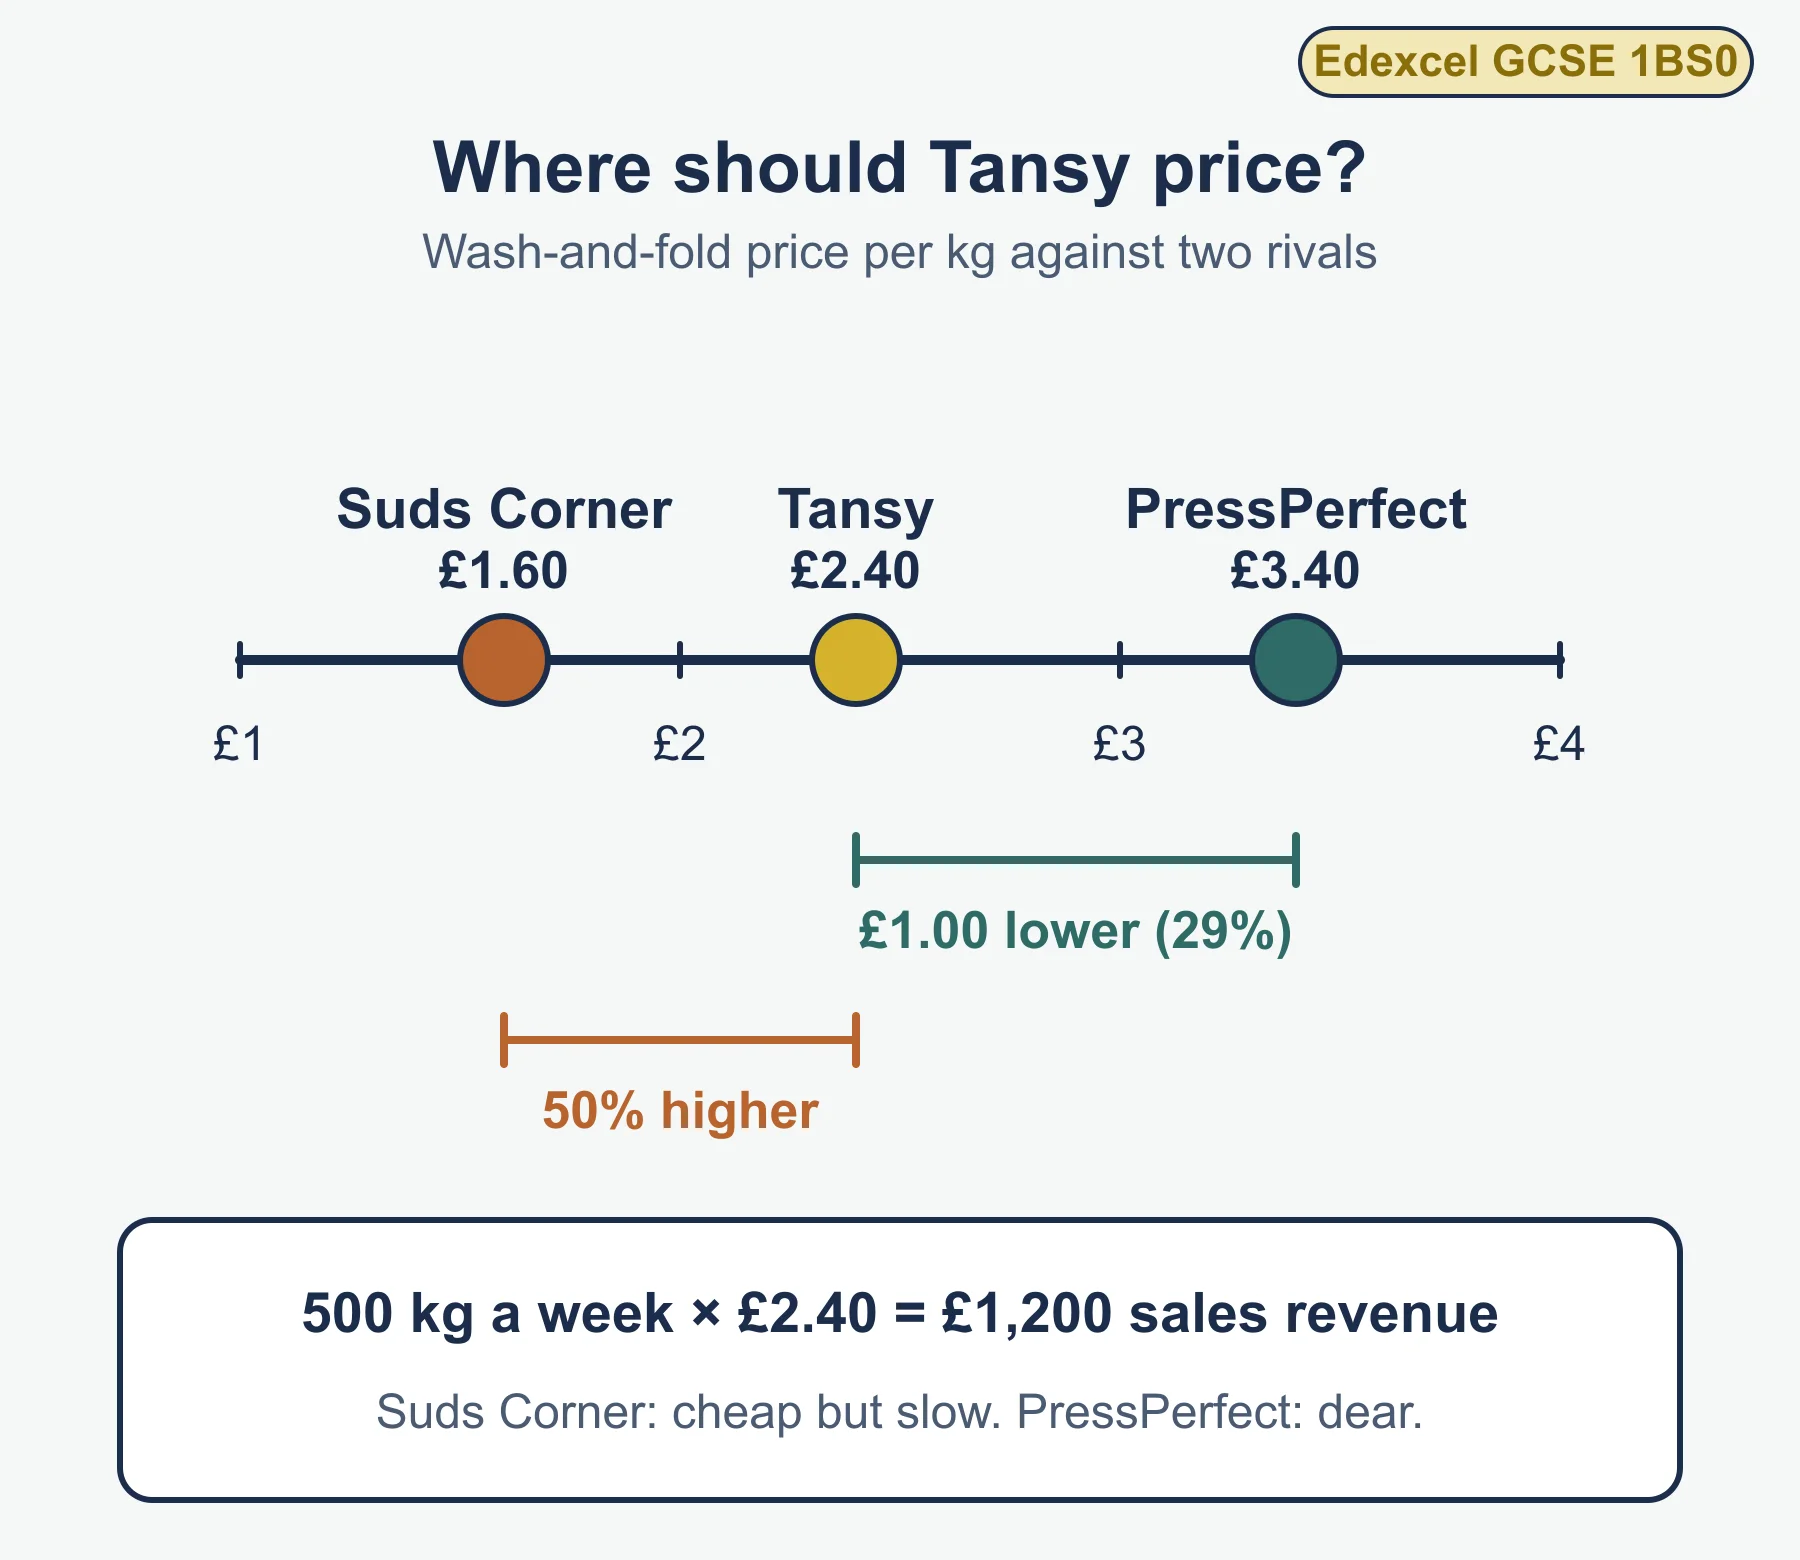
Tansy Laundry plans a wash-and-fold service. Two rivals serve the town.
| Factor | Suds Corner | PressPerfect |
|---|---|---|
| Price per kg | £1.60 | £3.40 |
| Quality | Average | Very high |
| Location | Two miles out of town | Town centre |
| Product range | Washing only | Washing, ironing, repairs |
| Customer service | Slow, many complaints | Friendly, pickup service |
Suds Corner is strong on price and weak on service. PressPerfect is strong on quality, location and range but expensive. Tansy could price at £2.40 per kg: £1.00 below PressPerfect (29% lower) and 50% above Suds Corner. It would promise quick turnaround, exploiting Suds Corner’s slow service. At 500 kg a week, sales revenue would be £1,200.
The impact of competition on decisions
Competition shapes decisions. A business may:
- change its price to match, undercut or sit above rivals;
- improve quality or service if rivals are better;
- widen or narrow its range to fill a gap or avoid direct competition;
- choose a location away from, or among, rivals;
- change promotion to stress what makes it different.
Strong competition can reduce sales and force lower prices. Weak competition gives more freedom but may mean a small market.
Common errors
- Listing price, quality, choice and convenience without saying which one the business in the question needs most.
- Saying market research removes risk. It reduces risk.
- Treating many replies as reliable when everyone asked was alike.
- Saying qualitative data is “wrong” because it has no numbers. It explains reasons.
- Reading a market map as proof of demand. A gap needs testing.
Frequently asked questions
What is market segmentation? Market segmentation divides a market into groups of customers with shared characteristics so a business can aim its product, price and promotion at them. The Edexcel GCSE Business (1BS0) specification lists location, demographics, lifestyle, income and age.
What is a market map used for? A market map plots existing businesses on two axes, usually price and quality, to show the competition and find a gap in the market. A gap is not proof of demand, so it still needs testing.
How can social media be used for market research? A business can post polls, ask followers to choose between designs and read comments and reviews quickly and cheaply. Followers already like the business, so they may not represent the whole market.
How does competition affect a business’s decisions? A business may change its price, improve quality or service, widen or narrow its range, choose a location away from or among rivals, or change its promotion to stress what makes it different.
Official syllabus
Pearson Edexcel Level 1/Level 2 GCSE (9-1) in Business (1BS0), Specification, Issue 2, July 2022, published by Pearson Education Limited. Theme 1: Investigating small business, Topic 1.2 Spotting a business opportunity, items 1.2.1 to 1.2.4.
Get free revision emails (optional)
Occasional emails with practice questions, worked explanations and links to free resources for the qualification and subjects you choose. No spam, and you can unsubscribe from any email. The free tools on this site never need an email.
Related resources
-
Practice questions
Edexcel GCSE Business: Spotting a business opportunity and customer needs (1BS0) – Practice Questions
Original practice questions with worked answers on customer needs, market research, segmentation and competitors for Edexcel GCSE Business 1BS0 Topic 1.2.
Business · Pearson Edexcel · GCSE
Try questions -
Revision notes
Edexcel GCSE Business: Spotting a business opportunity and customer needs (1BS0) – Revision Notes
Condensed revision notes on customer needs, market research, segmentation, market mapping and competitors for Edexcel GCSE Business 1BS0 Topic 1.2.
Business · Pearson Edexcel · GCSE
Revise topic -
Study guides
Edexcel GCSE Business: Stakeholders and technology (1BS0)
Study guide to business stakeholders, conflicts between them, and technology's effect on sales, costs and the marketing mix, for Edexcel GCSE Business.
Business · Pearson Edexcel · GCSE
Read guide
Related articles
-
teaching
A Level tuition in Dubai: Cambridge or Pearson Edexcel International A Level?
Schools in Dubai and Abu Dhabi teach either Cambridge International AS & A Level or Pearson Edexcel International A Level. How the two are structured, why it matters for tuition, and how online classes from Lahore work.
9 October 2026
-
curriculum guides
Choosing subjects at IGCSE and A Level
How subject choices at 14 and 16 affect university options later, and how to keep pathways open without overloading a timetable.
28 July 2026
Studying this with a teacher
Working through Business GCSE?
This page is free and stays free. If you would rather be taught it, Marlbridge runs Business classes one-to-one and in small groups of up to 15, online in your own time zone. The first trial class is free. WhatsApp replies within an hour (8am–11pm Pakistan time, every day); email the same day.
Pearson Edexcel Business teachers at Marlbridge

