
Study Guides
Edexcel International A Level Business: Financial planning and Managing finance (YBS11)
Full study guide to Financial planning (2.3.2) and Managing finance (2.3.3) in Edexcel International A Level Business Unit 2, with worked examples.
- Subject
- Business
- Level
- AS LEVEL
- Topic
- Managing business activities
- Author
- Marlbridge Academic Team
- Updated
- Reviewed by
- Salman Ahmad (what this means)
Aligned to Pearson Edexcel A Level Business (YBS11), Issue 1, September 2017. Official specification .
Syllabus page (what it covers and how it is assessed): Pearson Edexcel A Level Business.
Syllabus points this page covers
YBS11 (AS Level)
- 2.3.2 Financial planning
- 2.3.3 Managing finance
Found an error? Report a correction.
Need help with this topic? Request a free trial class for A Level Business (YBS11).
This guide teaches sections 2.3.2 Financial planning and 2.3.3 Managing finance of Unit 2 Managing business activities in the Pearson Edexcel International Advanced Subsidiary/Advanced Level in Business specification (YBS11), Issue 1, September 2017. The Unit 2 paper is 2 hours and 80 marks, built on sources, and the specification says calculators may be used and that the accounting ratios will not be supplied. All sums of money below are in dollars and every business is invented.
Use it with the revision notes and the practice questions. For the whole unit see the Unit 2 study guide, the Unit 2 revision notes and the Unit 2 practice questions. Course hub: Edexcel A Level Business. Checklist: printable checklist. Not sure where you stand? Try the free diagnostics.
What the two sections cover
| Section | Content points |
|---|---|
| 2.3.2 Financial planning | Sales, revenue and costs; sales forecasting; break-even; cash flow; budgets |
| 2.3.3 Managing finance | Profit; liquidity; business failure |
1. Sales, revenue and costs
Sales volume is the number of units sold. Sales revenue = selling price × sales volume.
Fixed costs do not change with output in the short run (rent, insurance). Variable costs change with output (materials). Total costs = fixed costs + total variable costs. Average cost = total costs ÷ output.
Worked example: Oxmoor Candles. Selling price 8.50, variable cost 3.50 a candle, fixed costs 9,000 a month.
At 3,000 candles:
Sales revenue  = 8.50 x 3,000 = 25,500
Variable costs = 3.50 x 3,000 = 10,500
Total costs    = 9,000 + 10,500 = 19,500
Average cost   = 19,500 / 3,000 = 6.50

At 4,000 candles:
Total costs  = 9,000 + 14,000 = 23,000
Average cost = 23,000 / 4,000 = 5.75
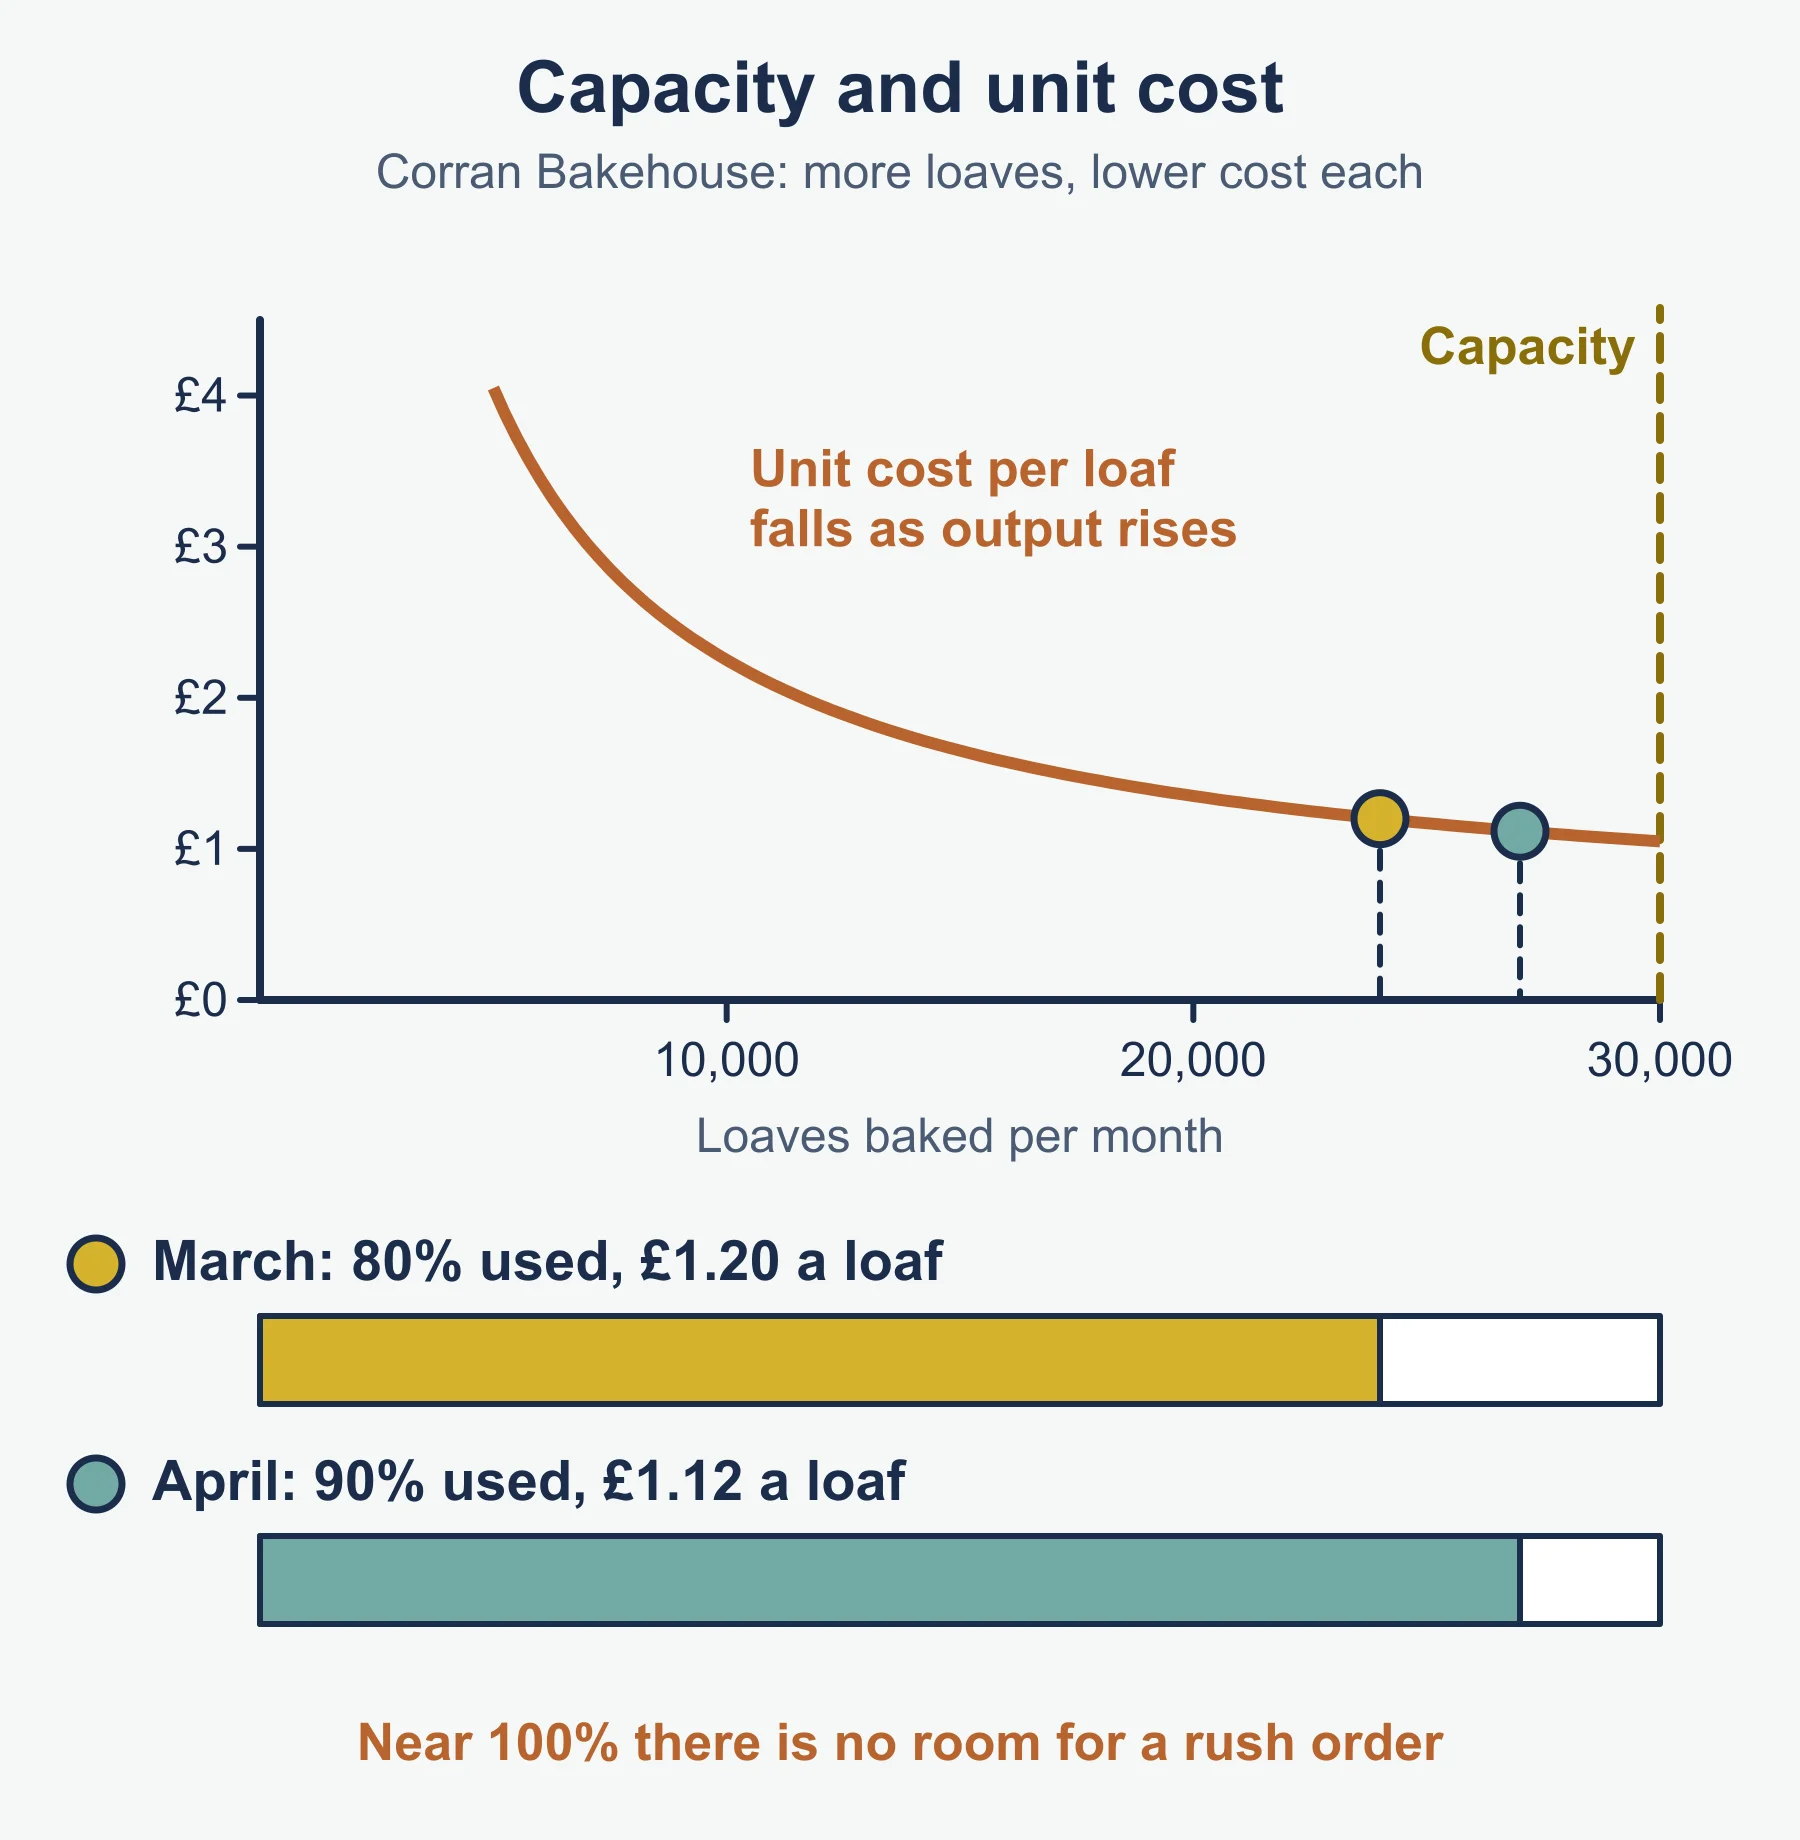
Average cost falls as output rises because the same fixed costs are spread over more units.
Ways of improving sales volumes and sales revenues include: better promotion; improving the product; widening distribution (online sales, new outlets); and changing price. A price cut may lift volume but lowers revenue per unit, so total sales revenue can rise or fall. A price rise does the reverse. Judge each in context.
2. Sales forecasting
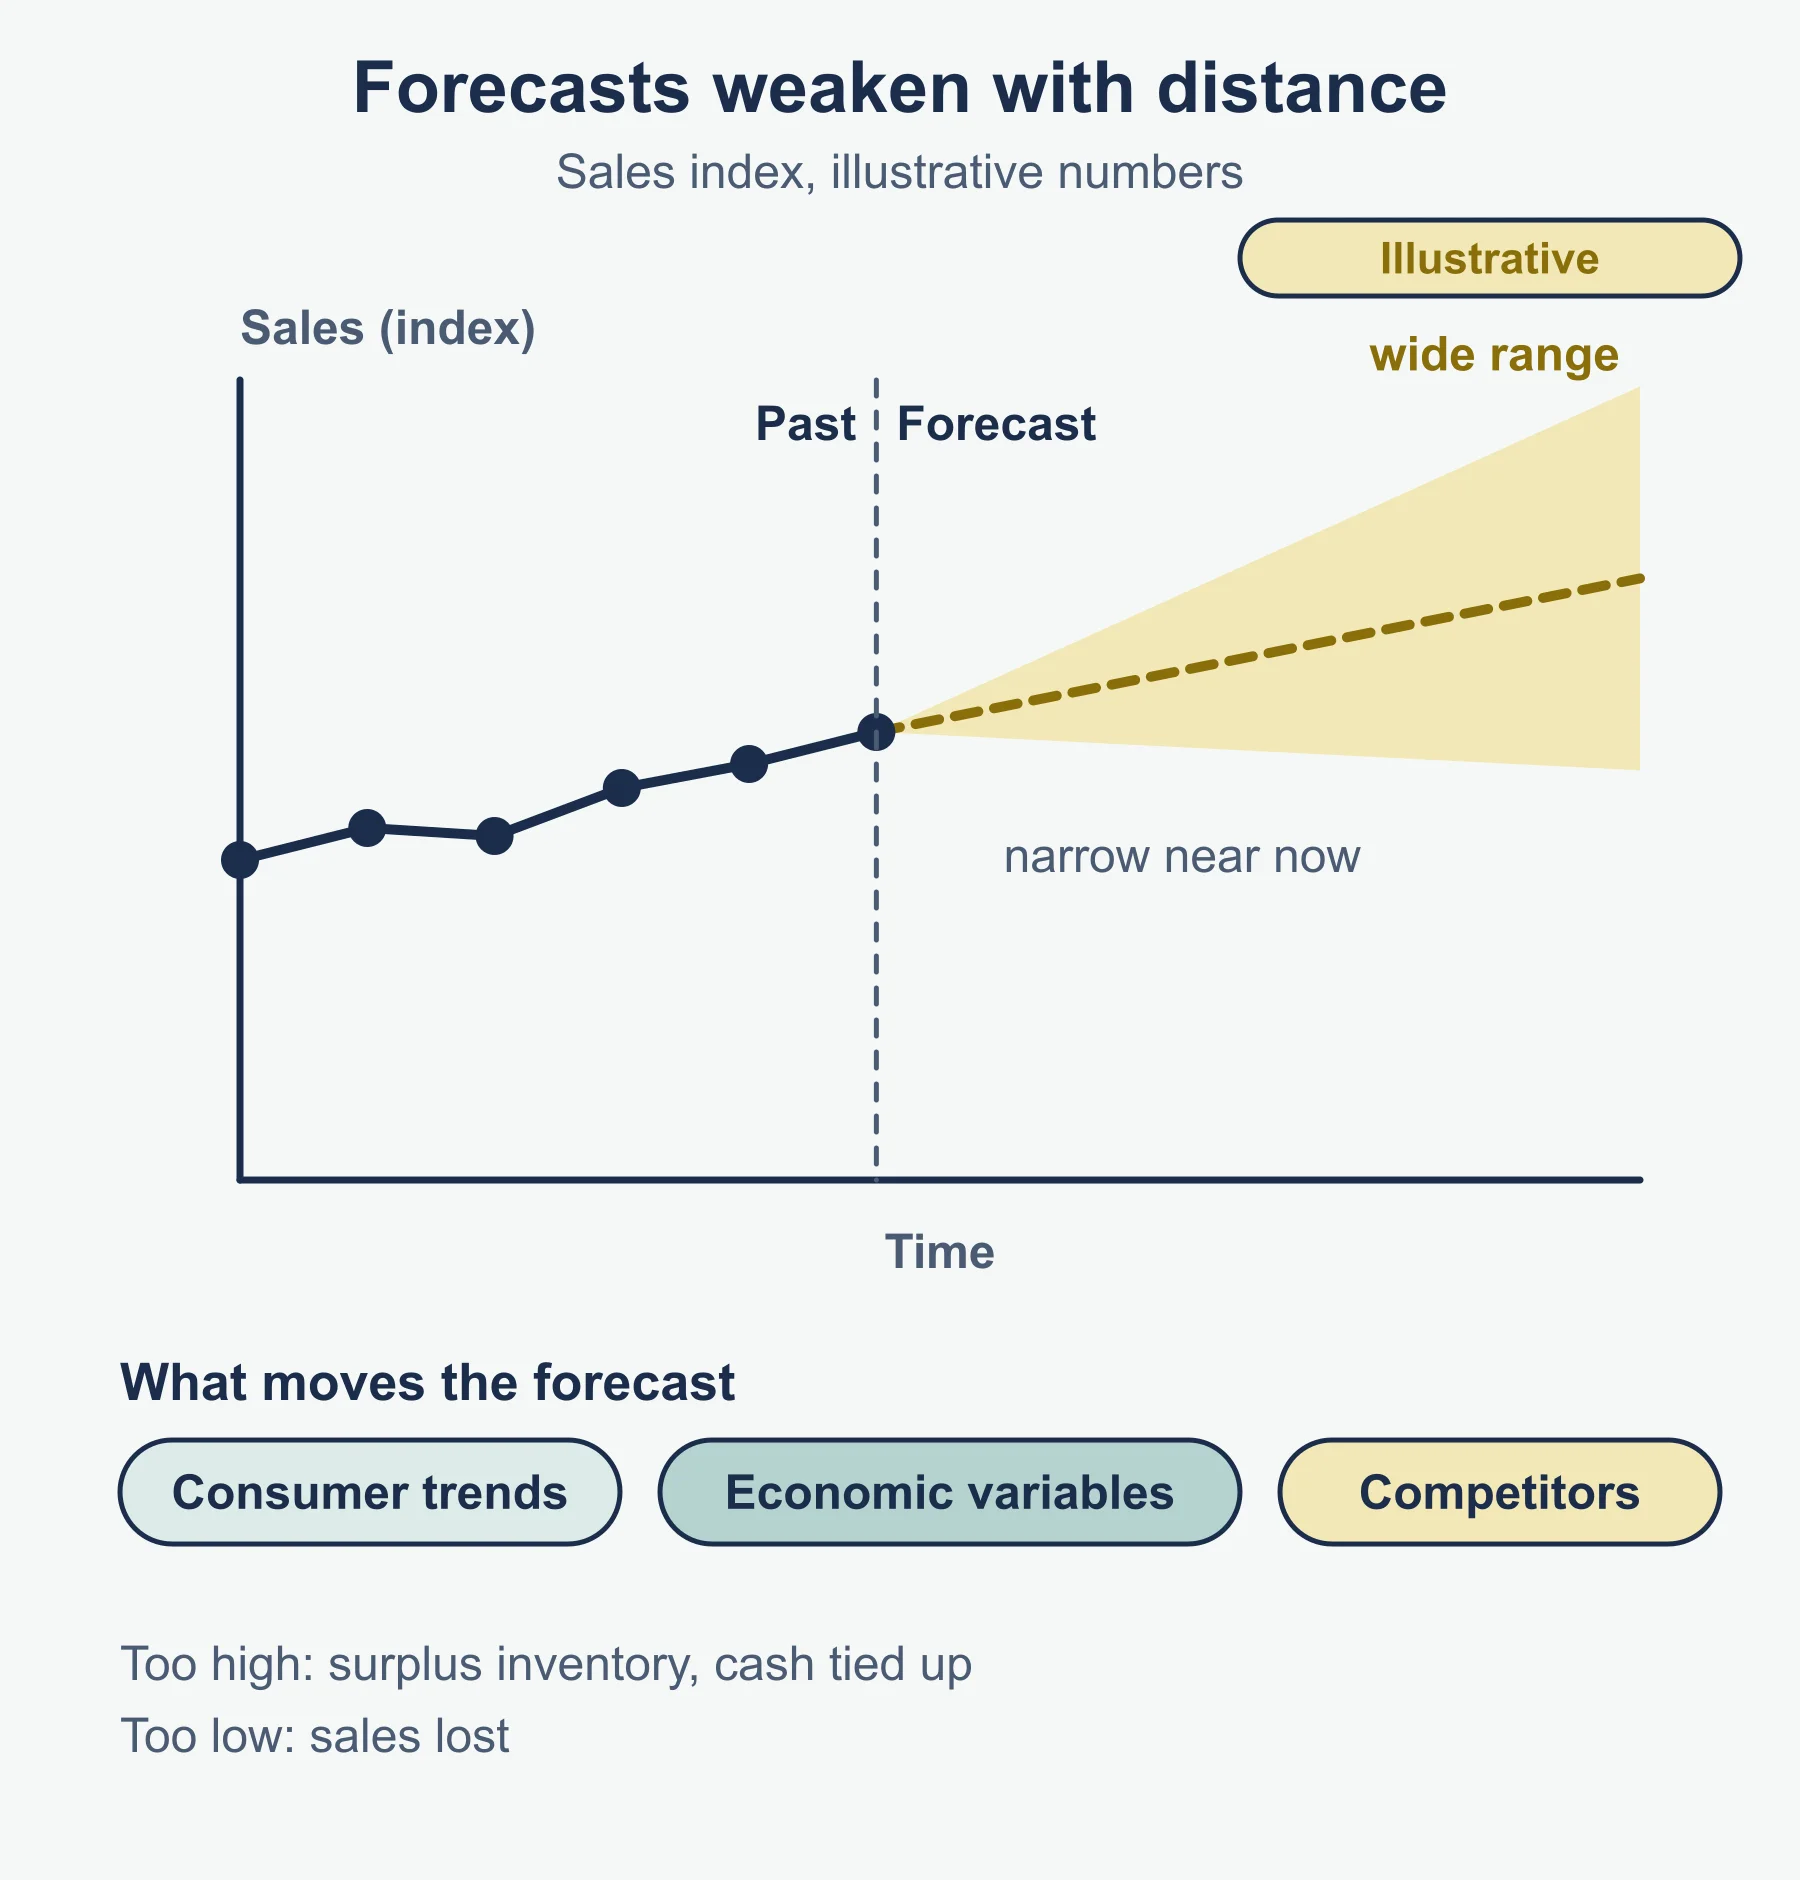
A sales forecast is an estimate of future sales. Purposes: it sets the base for the budget and cash-flow forecast, guides production and inventory, helps decide staffing, and supports a loan request.
Factors affecting forecasts
- Consumer trends: changing tastes, fashions and habits.
- Economic variables: income levels, interest rates, exchange rates, unemployment.
- Actions of competitors: price cuts, launches, promotions.
Difficulties: the future is uncertain; a new business has no sales history; trends change quickly; and competitors react unpredictably. The further ahead the forecast, the weaker it is. An overestimate leaves the business with surplus inventory and cash tied up; an underestimate loses sales.
3. Break-even
Contribution (per unit) = selling price − variable cost per unit. Each unit sold contributes this amount towards fixed costs, then profit.
Break-even point is where total fixed costs + total variable costs = total revenue, so profit is zero. Using contribution:
Break-even output = total fixed costs / contribution per unit
Margin of safety  = actual (or budgeted) output - break-even output
The margin of safety is how far sales can fall before losses begin. Many texts also give it as a percentage of actual output; that is the standard form, not given in the specification.
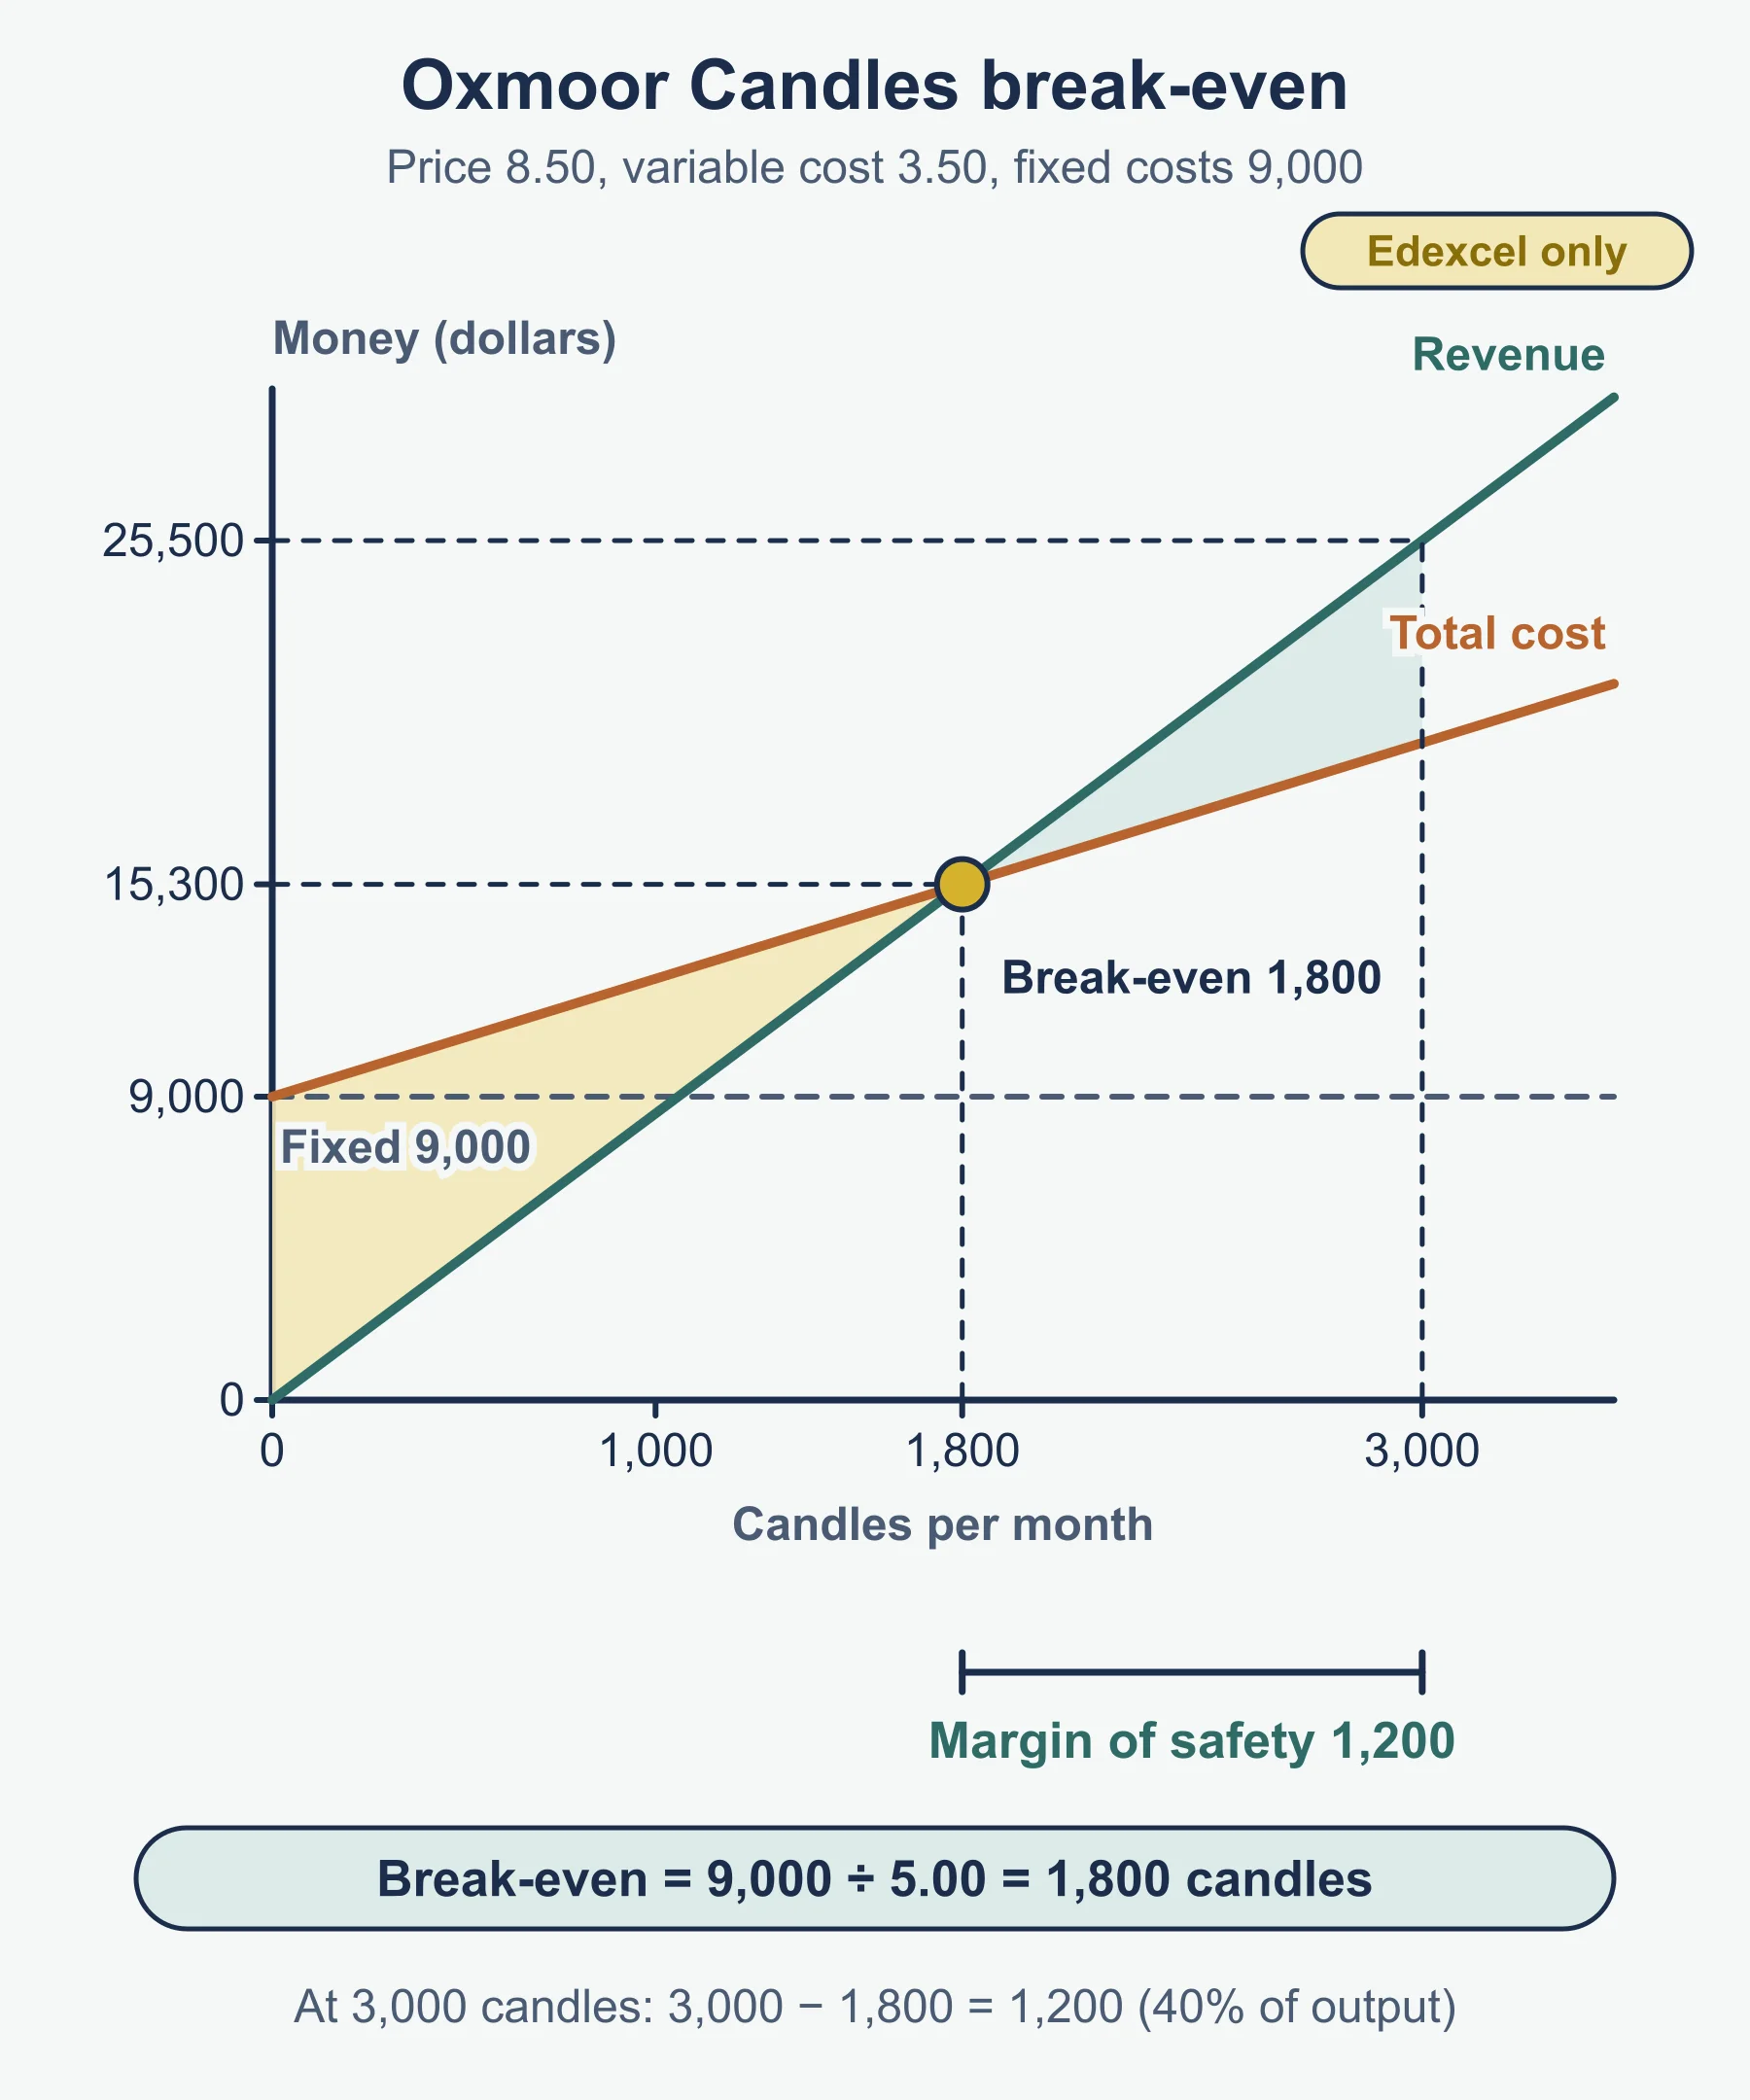
Oxmoor Candles again. Contribution = 8.50 − 3.50 = 5.00. Break-even = 9,000 ÷ 5.00 = 1,800 candles. At 3,000 candles the margin of safety is 3,000 − 1,800 = 1,200 candles (40% of actual output).
Check: at 1,800 candles, revenue = 15,300 and total costs = 9,000 + 6,300 = 15,300.
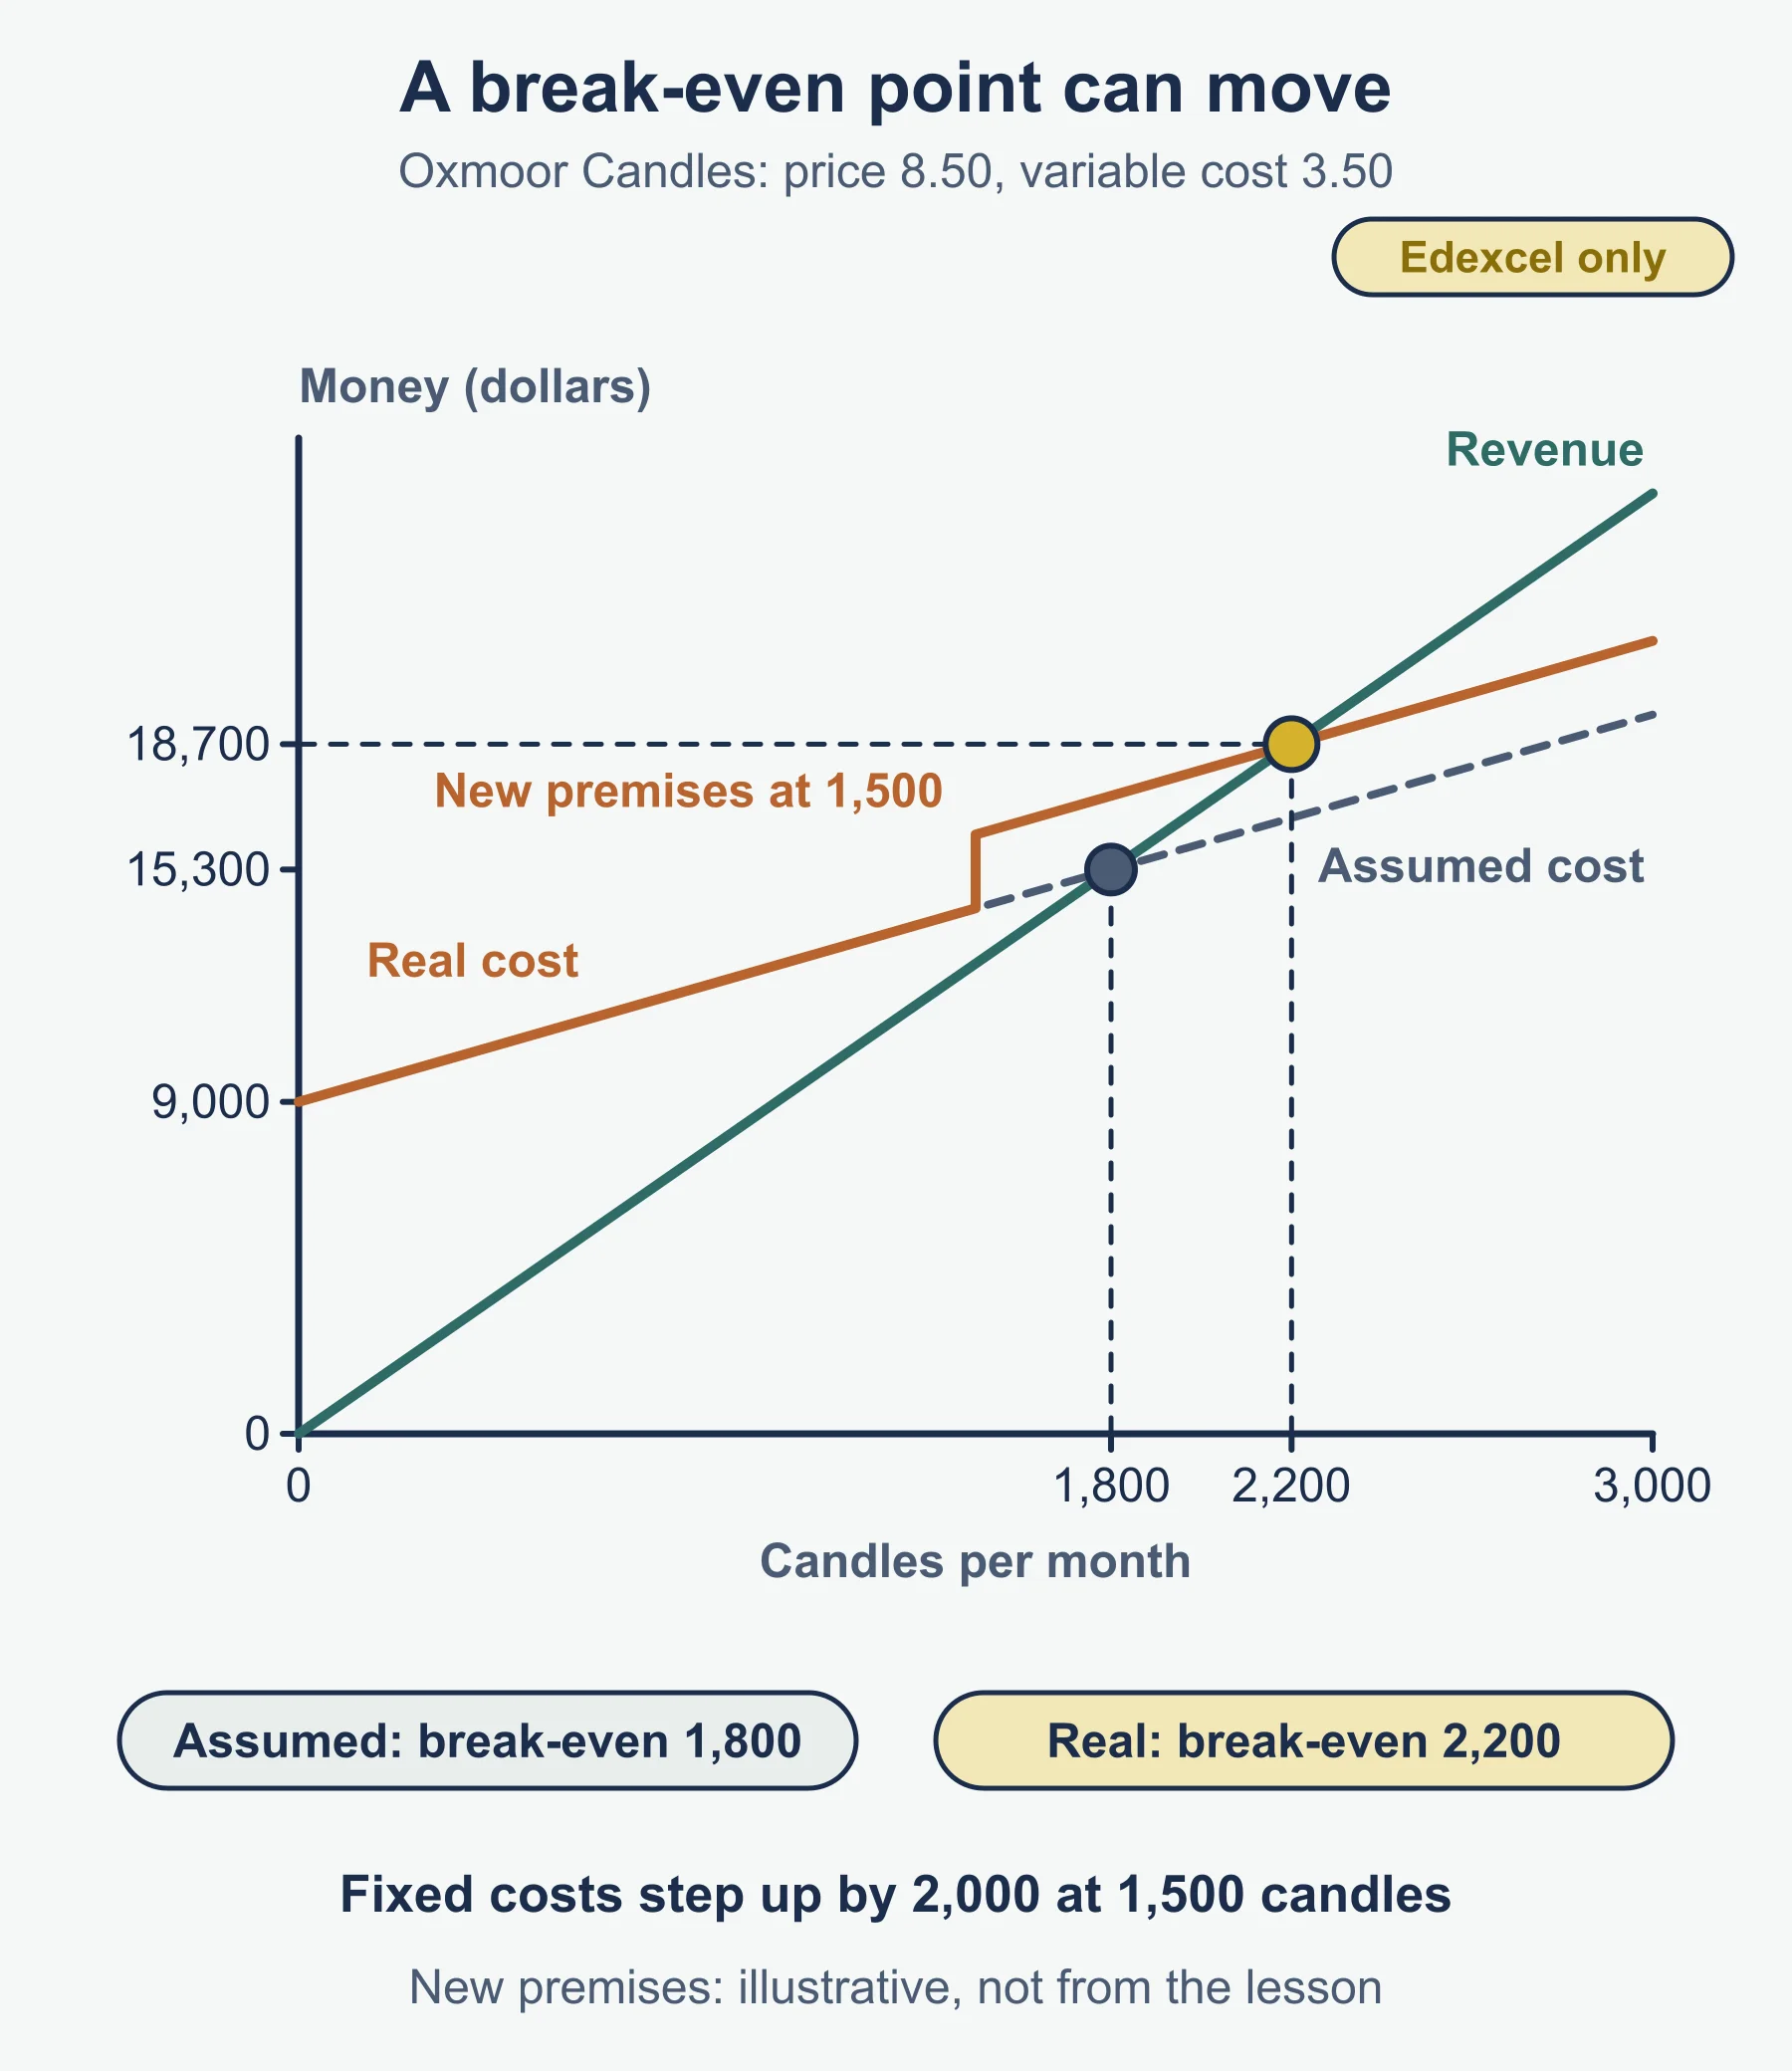
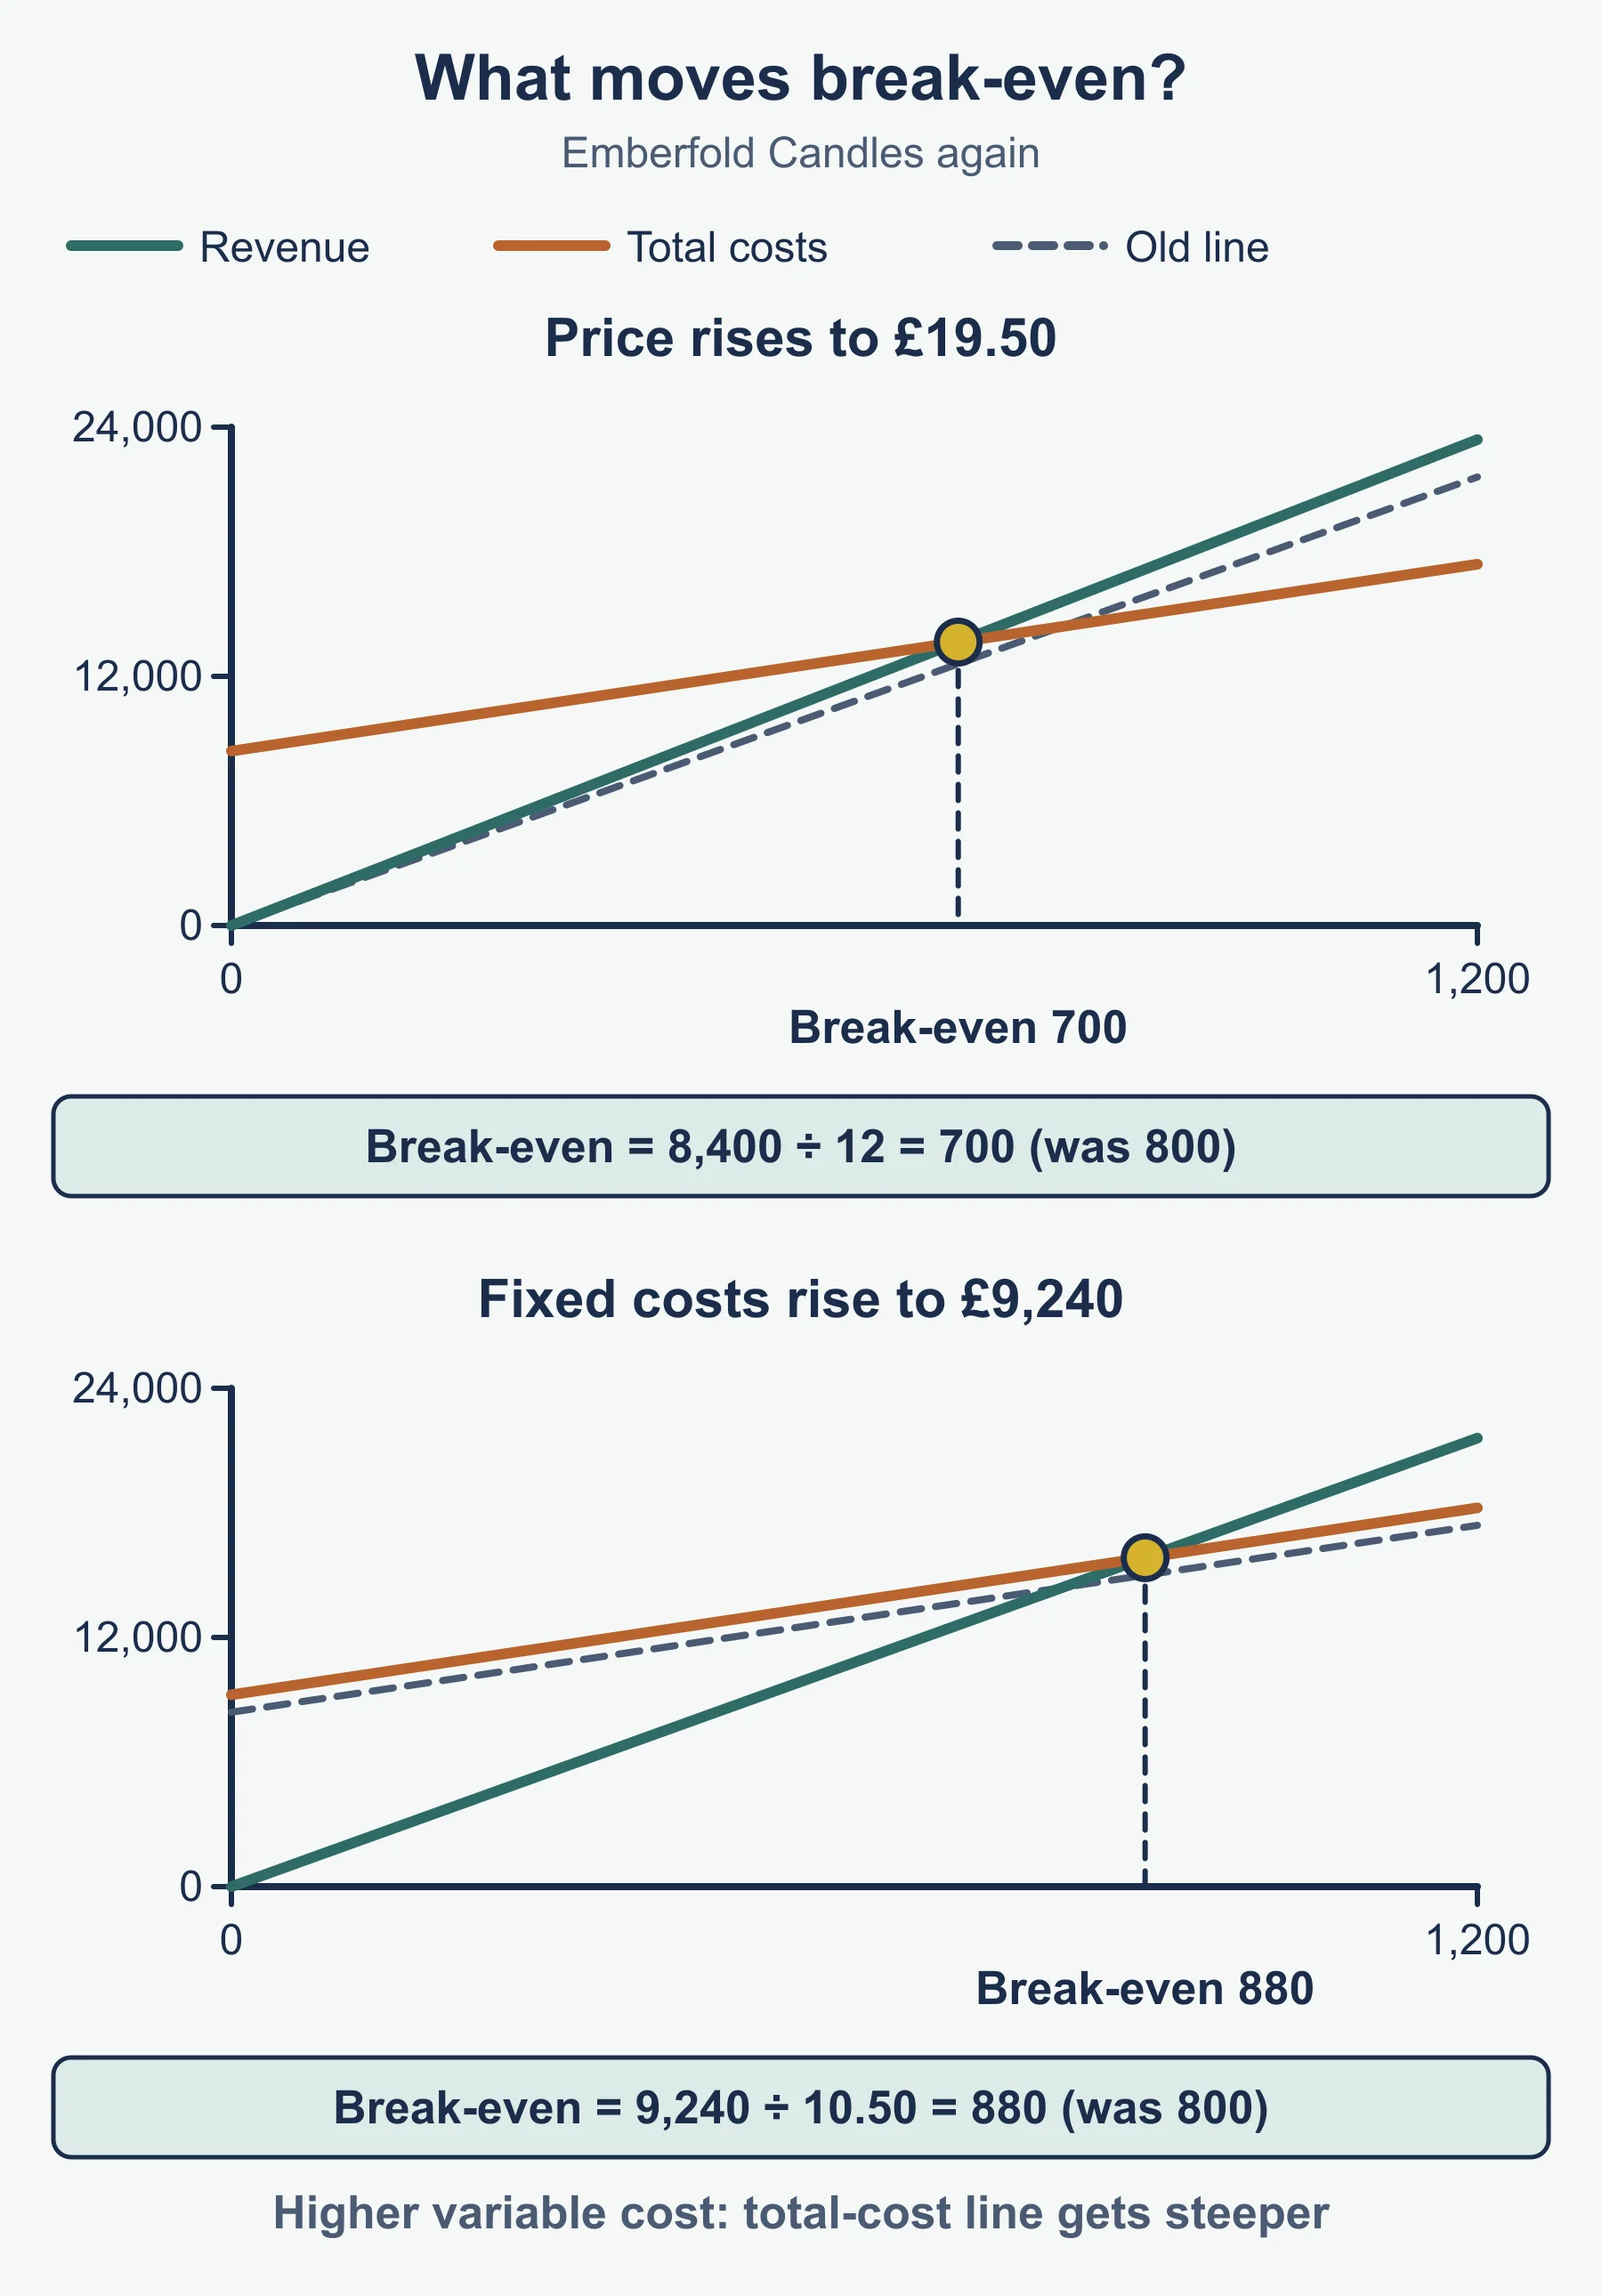
A price rise to 9.50 lifts contribution to 6.00 and cuts break-even to 9,000 ÷ 6.00 = 1,500 candles. If fixed costs rise to 10,500, break-even rises to 2,100 candles.
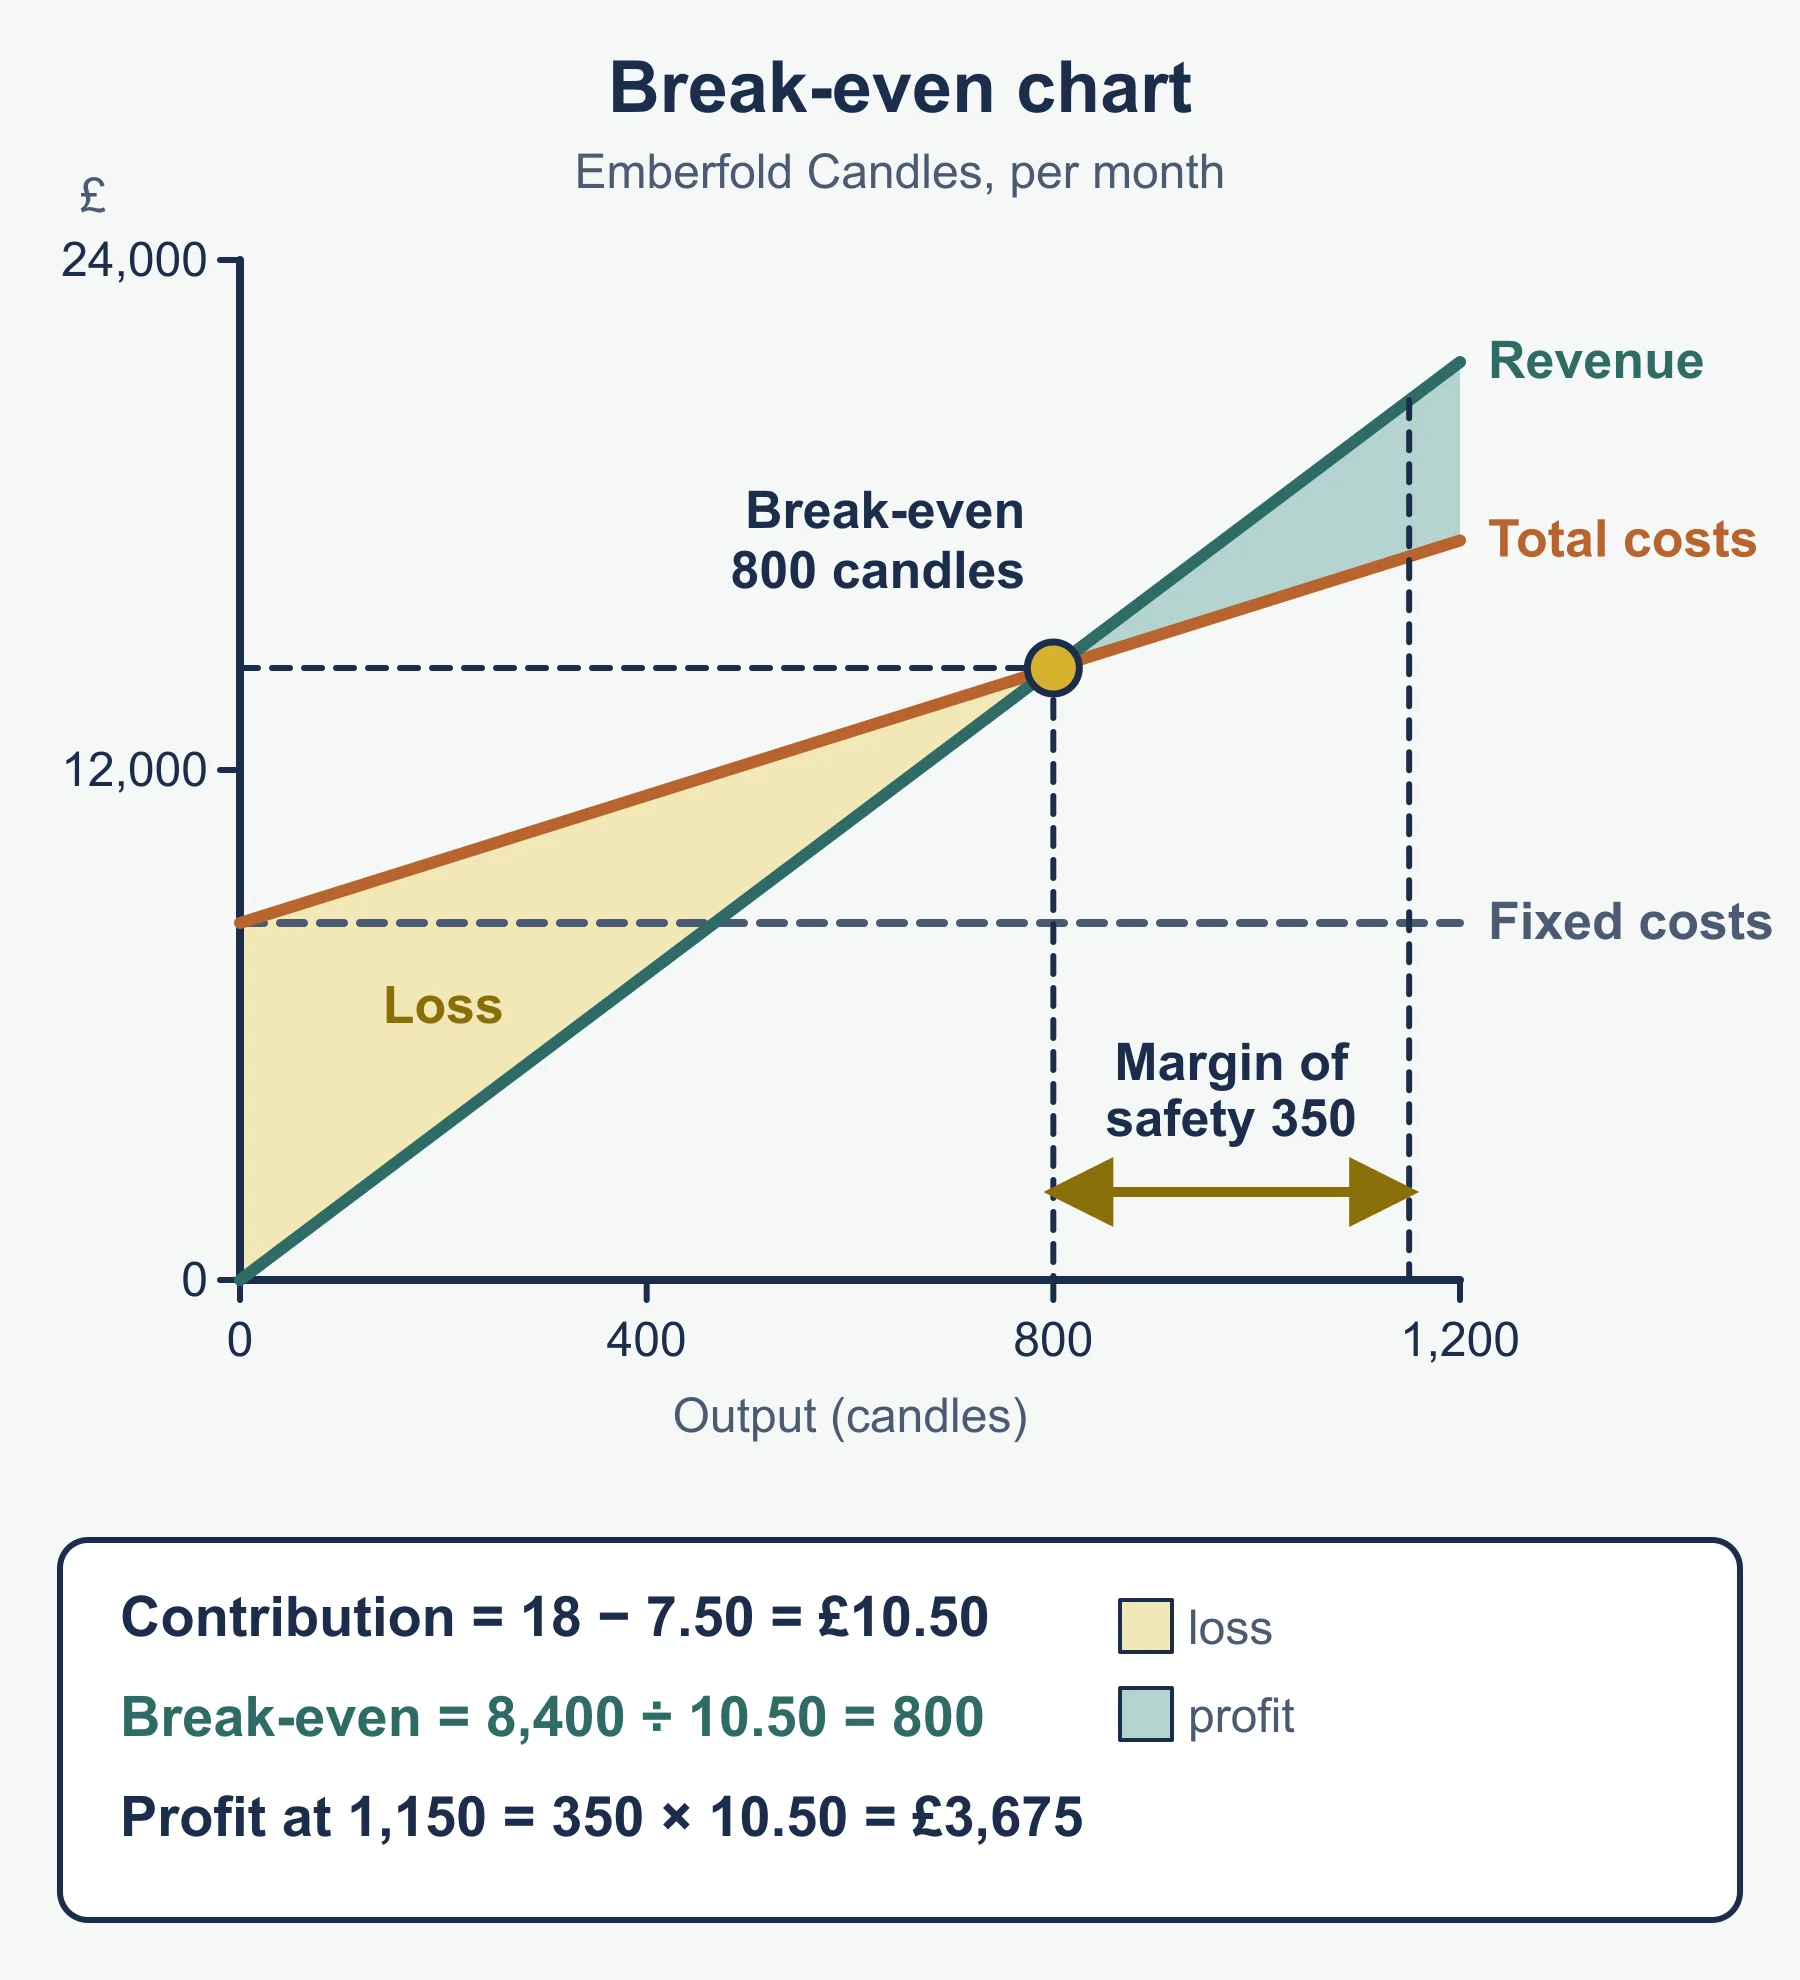
Interpreting a break-even chart. The chart has output on the horizontal axis and money on the vertical axis.
Line               Starts at          Slope
Fixed costs        9,000 at 0 units   flat
Total costs        9,000 at 0 units   rises by 3.50 a unit
Sales revenue      0 at 0 units       rises by 8.50 a unit
Where the revenue line crosses the total cost line is break-even (1,800 candles). Below it the gap between the lines is a loss; above it the gap is profit. The margin of safety is the horizontal distance from break-even to current output. A steeper revenue line means a higher price; a higher total cost line means higher fixed or variable costs.
Limitations of break-even analysis: it assumes all output is sold, a constant selling price and constant variable cost per unit (no bulk discounts), and fixed costs that stay fixed; it suits a single product; it depends on forecasts and costs that may be wrong; and it ignores cash timing and competitors’ reactions.
4. Cash flow
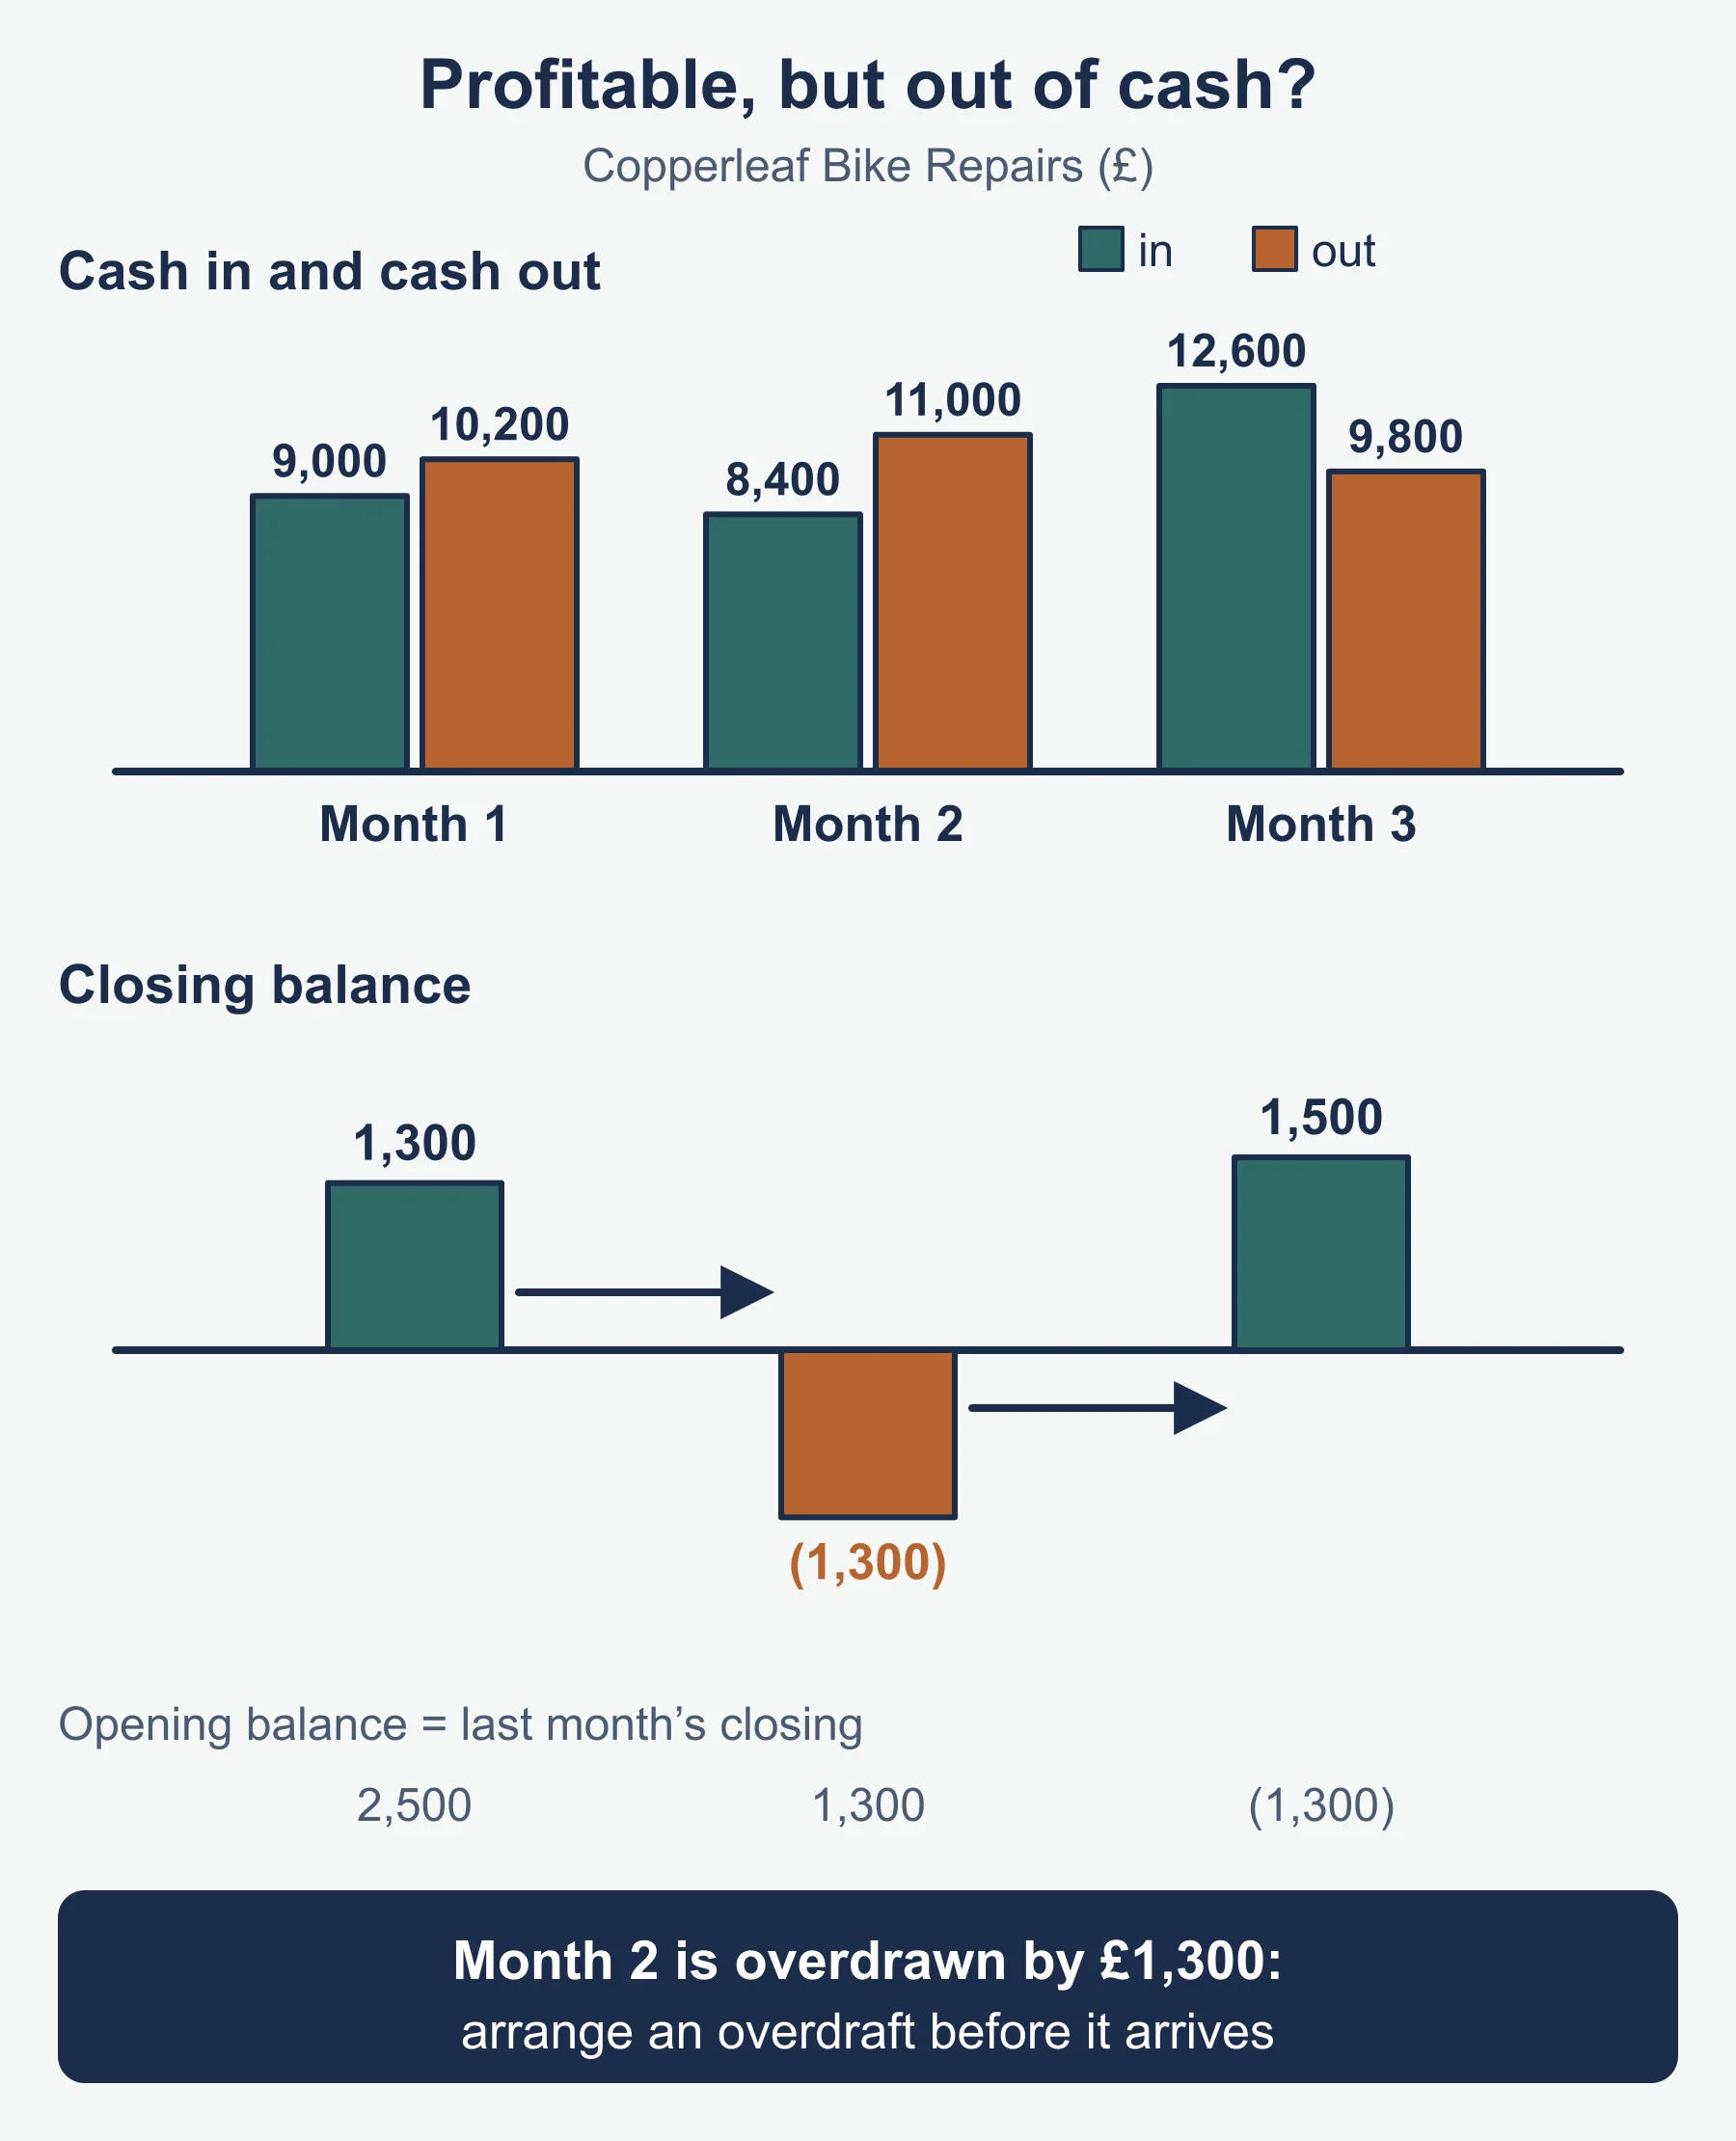
A cash-flow forecast shows expected cash inflows and outflows, month by month, and the resulting balance.
Net cash flow   = cash inflows - cash outflows
Closing balance = opening balance + net cash flow
The closing balance becomes next month’s opening balance.
Worked example: Marsden Cycle Works. Opening balance 3,000.
| Month | Opening | Inflows | Outflows | Net | Closing |
|---|---|---|---|---|---|
| 1 | 3,000 | 14,000 | 15,500 | −1,500 | 1,500 |
| 2 | 1,500 | 12,000 | 16,000 | −4,000 | −2,500 |
| 3 | −2,500 | 18,000 | 17,000 | 1,000 | −1,500 |
| 4 | −1,500 | 20,000 | 16,500 | 3,500 | 2,000 |
Interpretation: the balance is negative in months 2 and 3, so Marsden needs an overdraft or another short-term source of finance for those months. By month 4 it recovers. Inflows total 64,000 and outflows 65,000, so the four months are a net outflow of 1,000.
Use: it warns of shortages in advance, supports loan or overdraft requests, and helps time purchases. Limitations: it rests on forecast sales (see section 2); late-paying customers or unexpected costs upset it; it must be updated; and a positive balance does not prove profit.
5. Budgets
A budget is a financial plan for a future period, set for a department or the whole business. Purposes: to set targets, control spending, allocate resources, coordinate departments, motivate managers and allow later comparison with actual results.
Types of budget
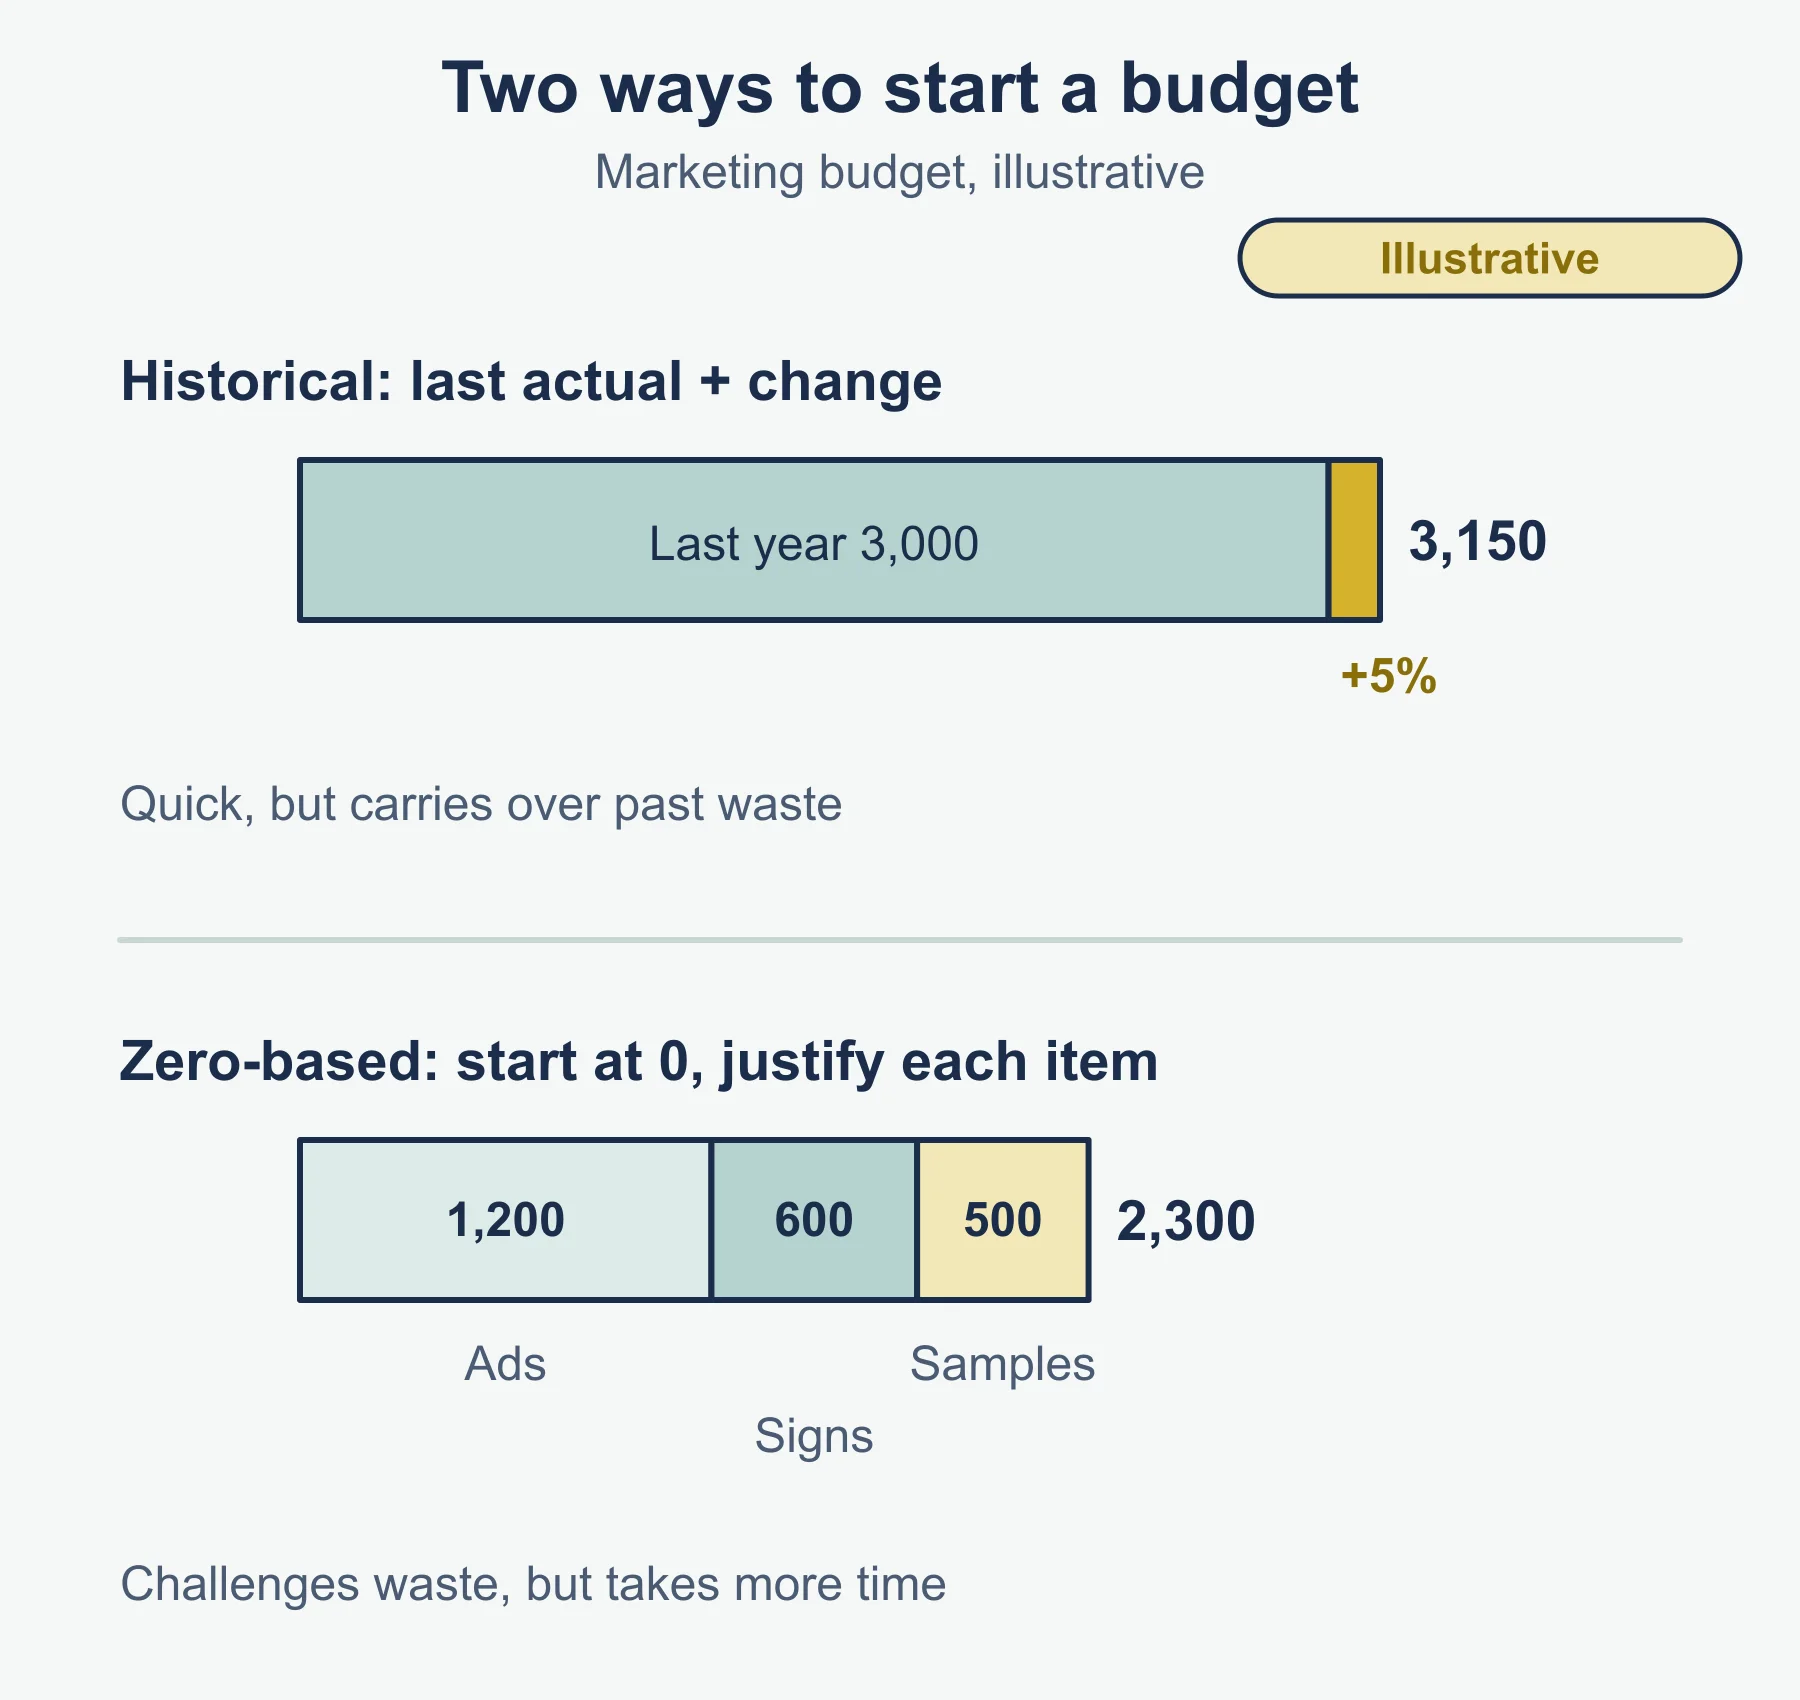
- Based on historical figures: this period’s budget starts from last period’s actual figures, adjusted for expected changes. It is quick, but carries over past inefficiency.
- Zero based: every budget starts at zero and each item of spending must be justified. It challenges waste but takes more time.
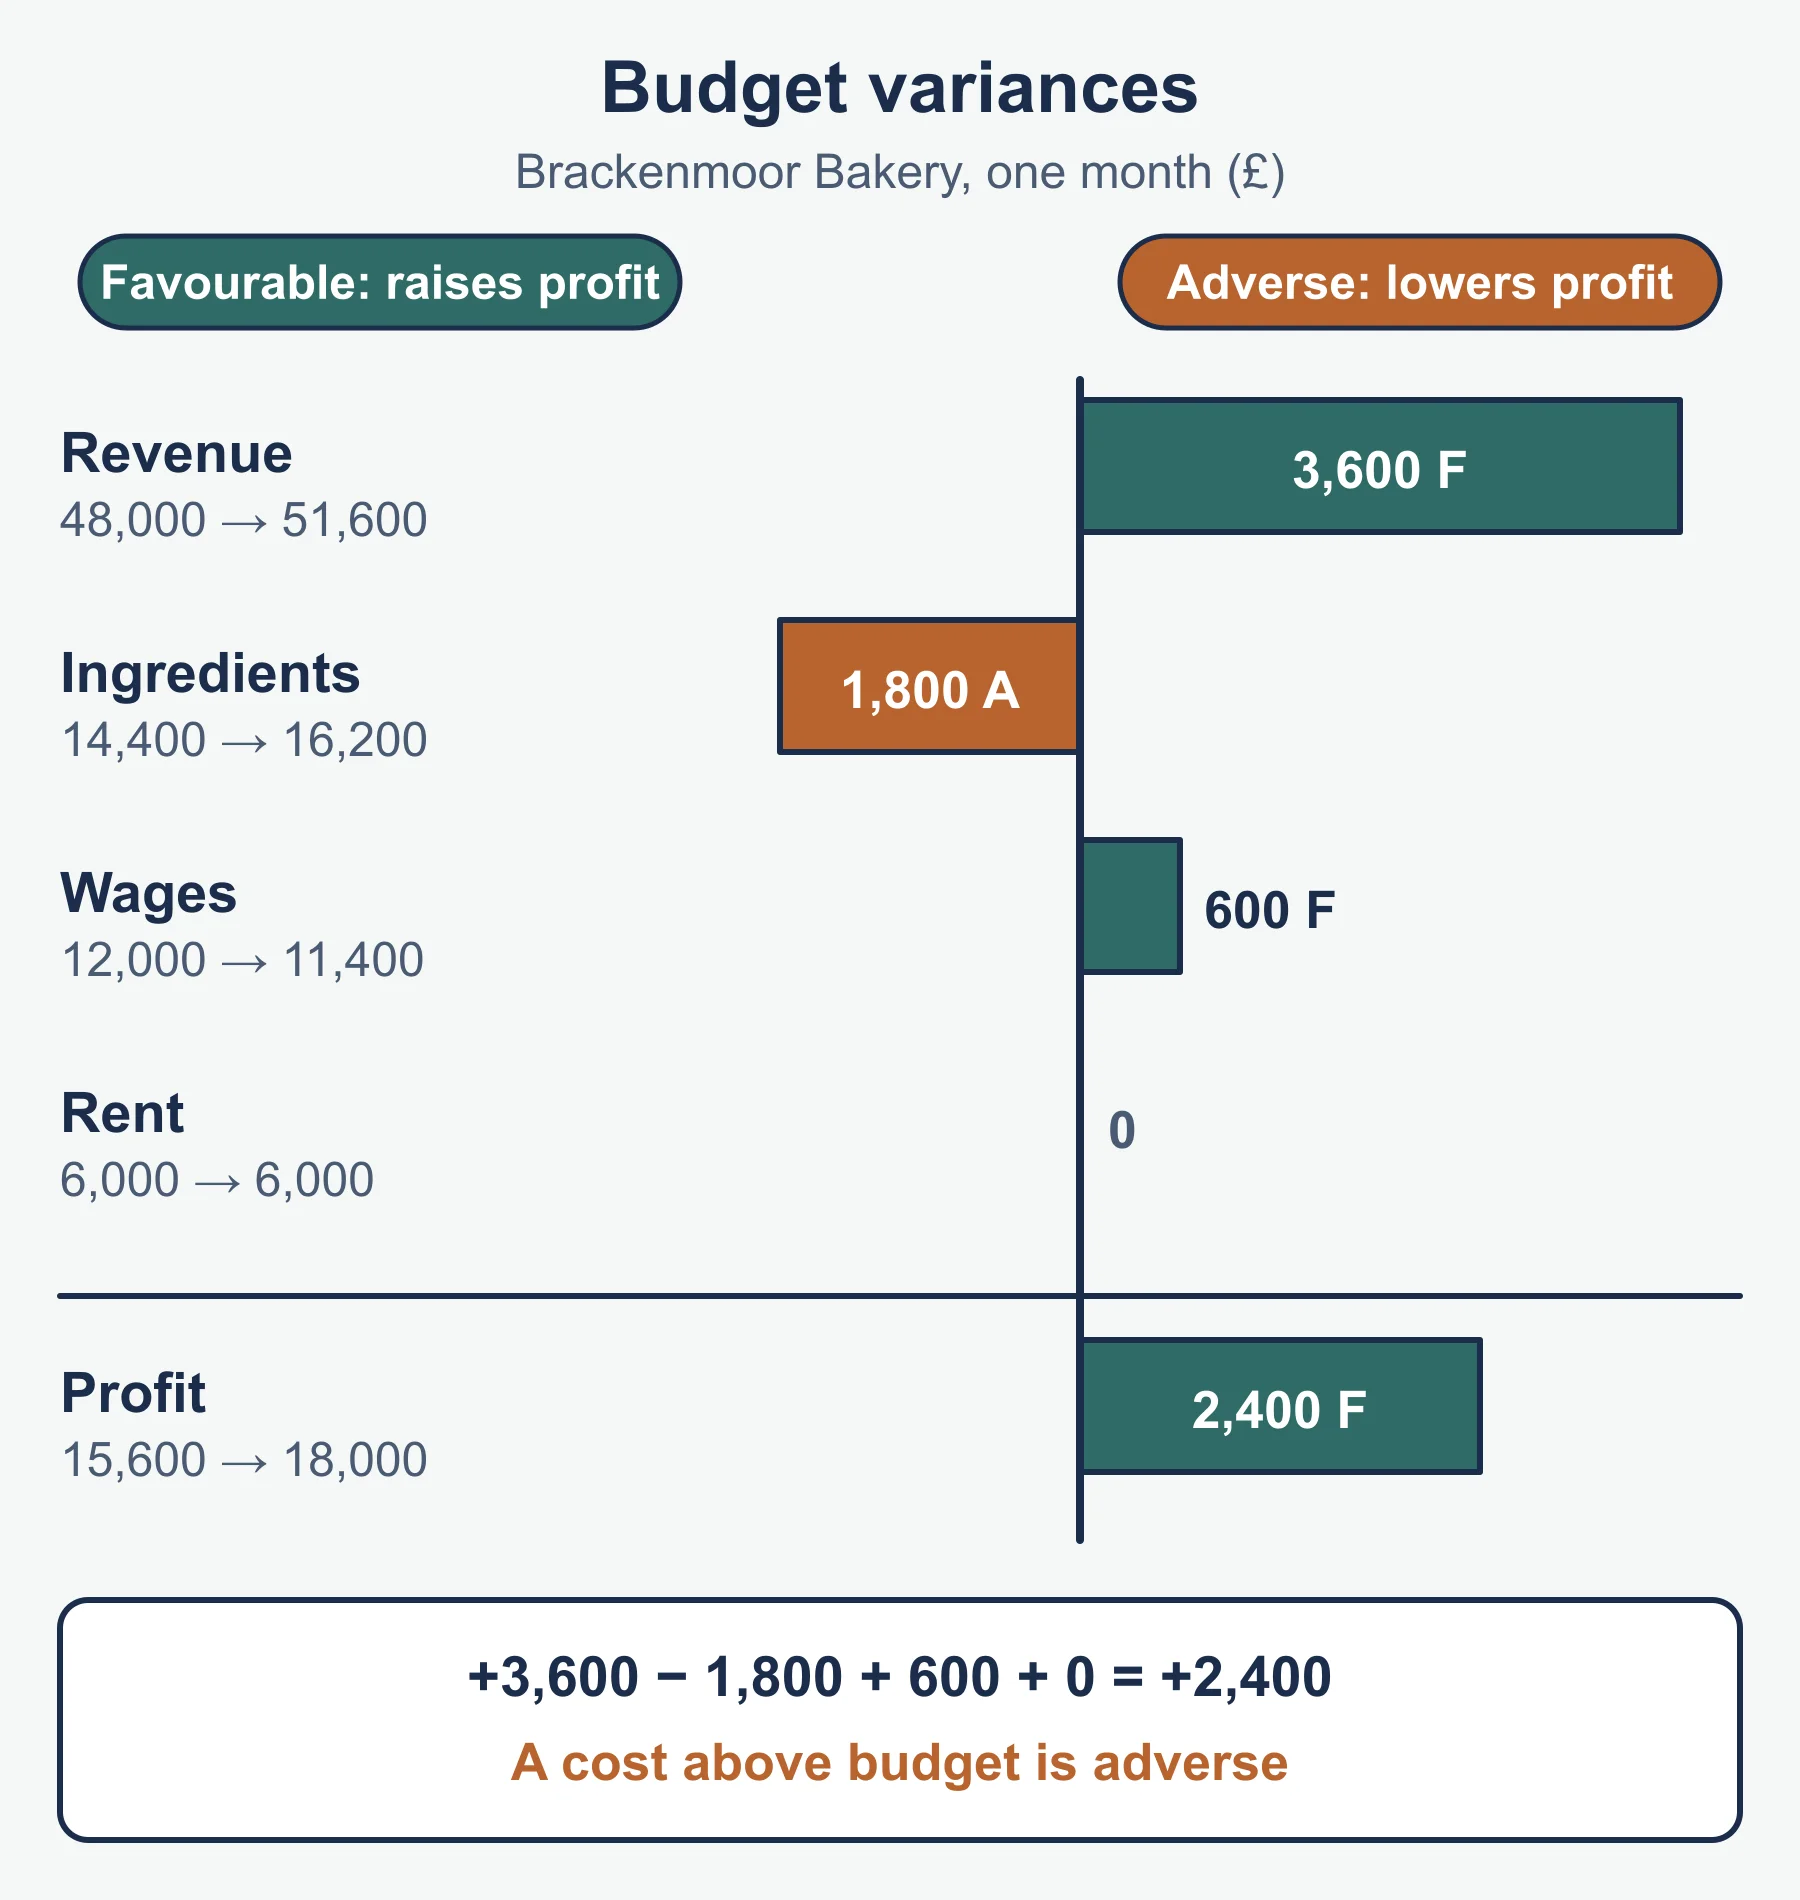
Variance analysis compares budgeted and actual figures. Variance = actual − budget. A favourable variance raises profit (higher revenue or lower cost); an adverse variance lowers it.
Worked example: Ashgrove Bakehouse, one month.
| Item | Budget | Actual | Variance |
|---|---|---|---|
| Sales revenue | 40,000 | 36,500 | −3,500 adverse |
| Materials | 14,000 | 15,400 | +1,400 adverse |
| Wages | 9,000 | 8,700 | −300 favourable |
| Marketing | 3,000 | 3,000 | 0 |
| Profit | 14,000 | 9,400 | −4,600 adverse |
The profit variance equals −3,500 − 1,400 + 300 = −4,600. Revenue fell 8.75% below budget and materials ran 10% over, so investigate both.
Difficulties of budgeting: budgets rely on forecasts; they take time; managers may bid for padded budgets; fixed budgets are slow to change when conditions shift; and missing a target can demotivate staff.
6. Profit
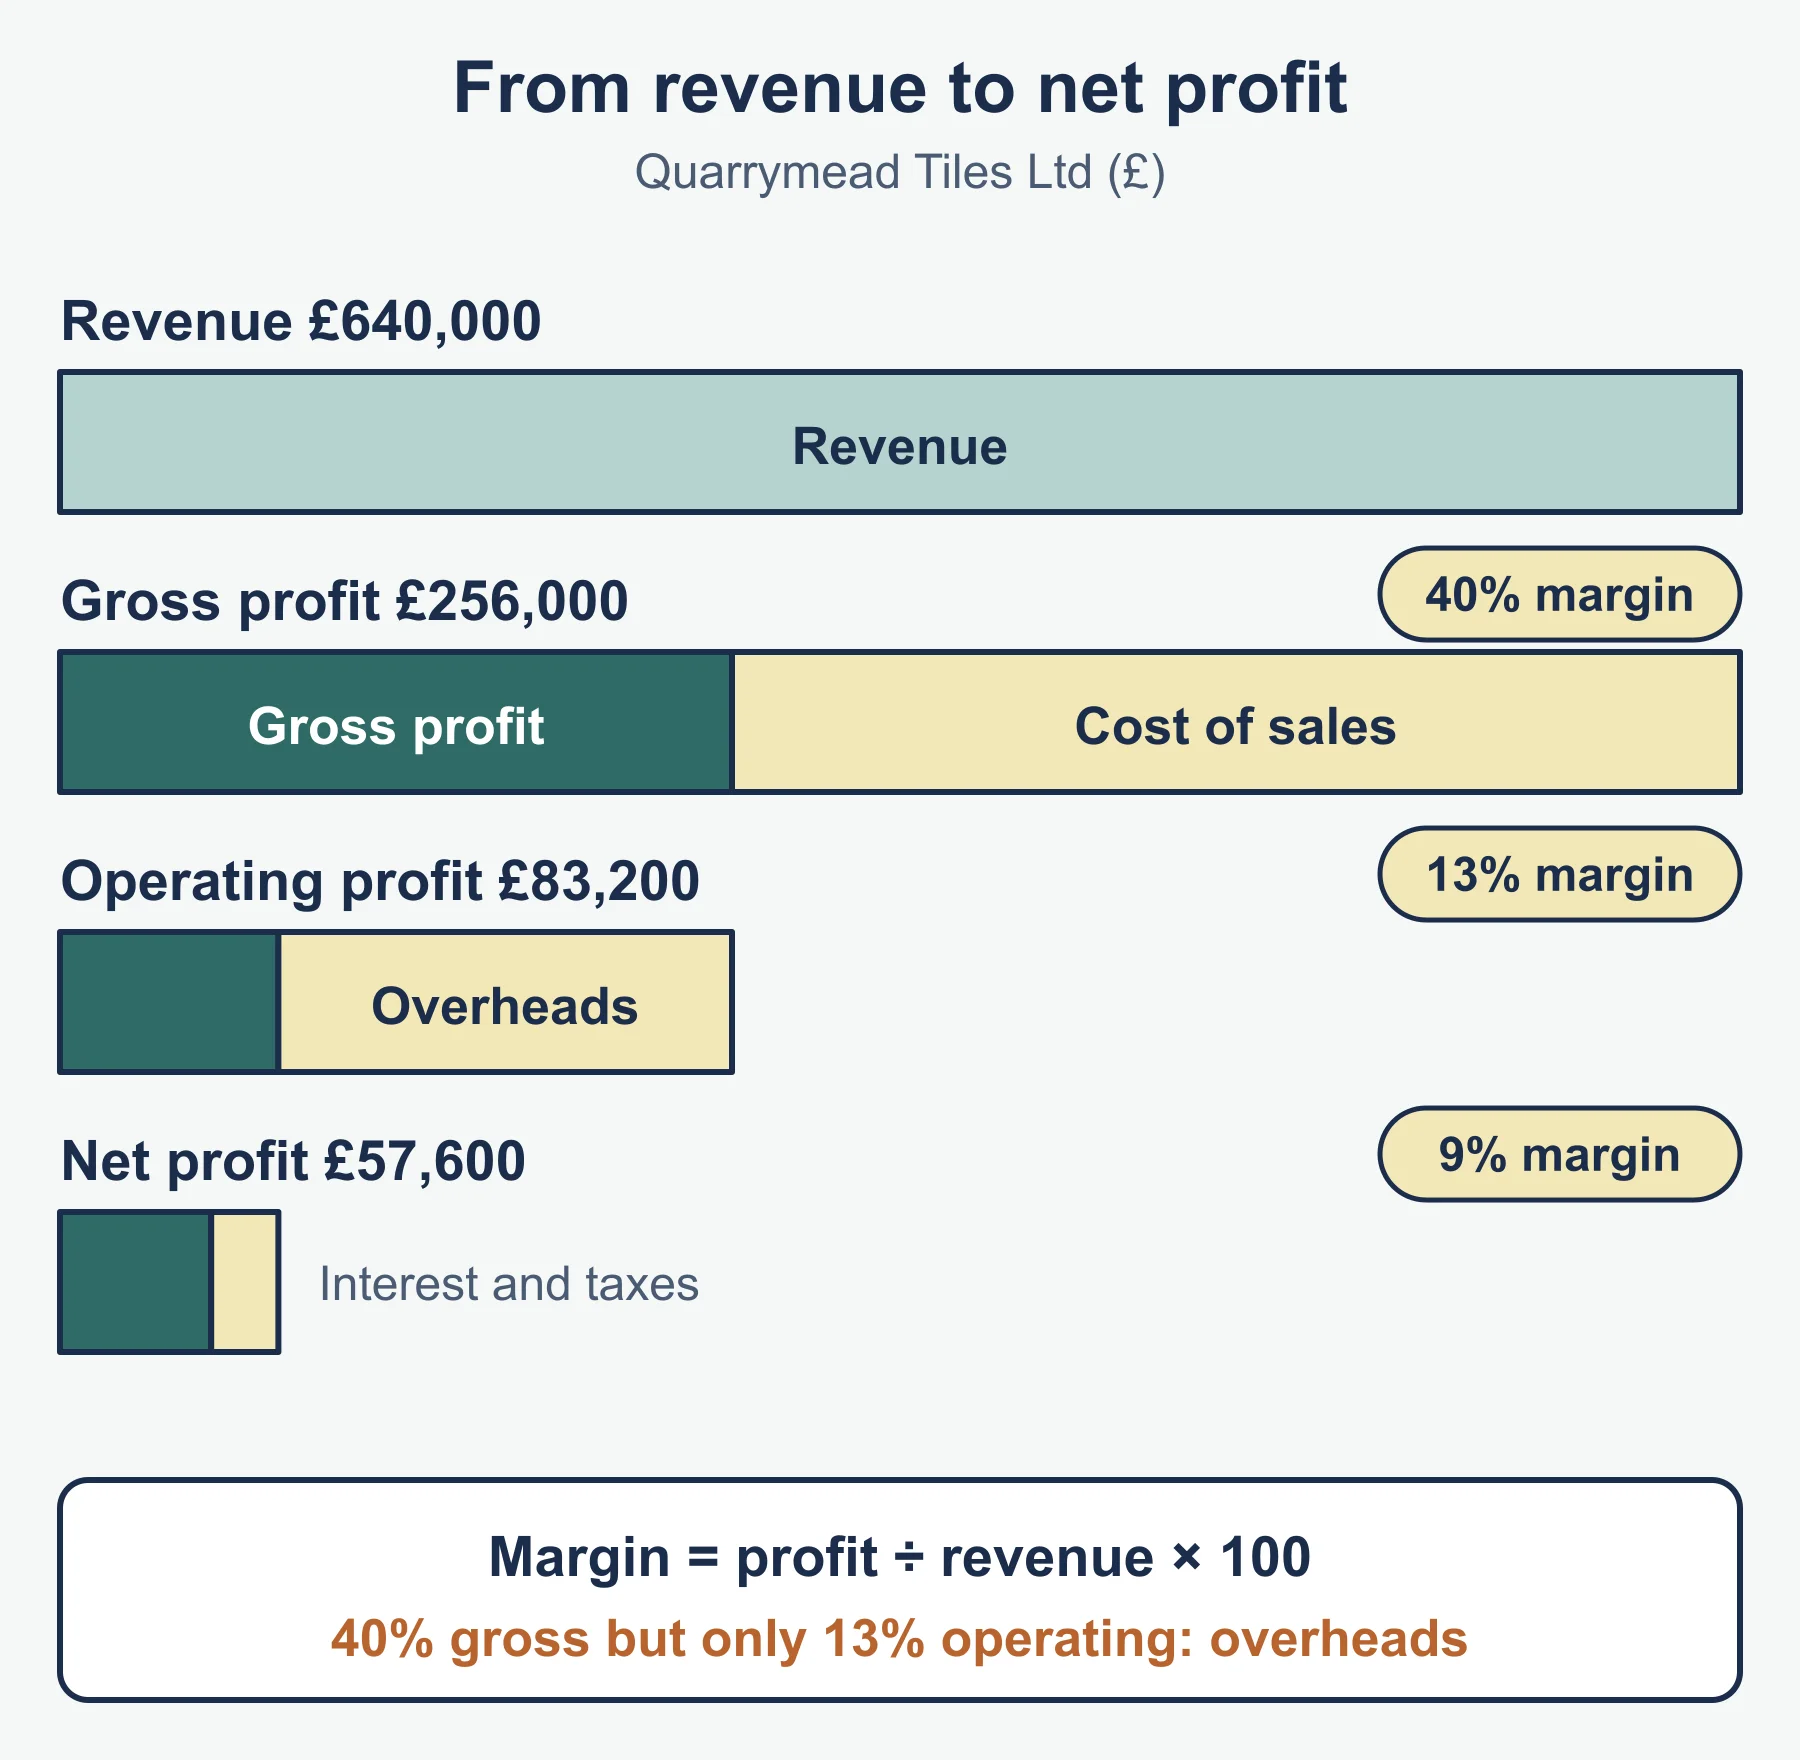
The statement of comprehensive income (profit and loss account) in the specification’s layout:
revenue
- cost of sales          = gross profit
- other operating expenses = operating profit
- interest               = profit for the year (net profit)
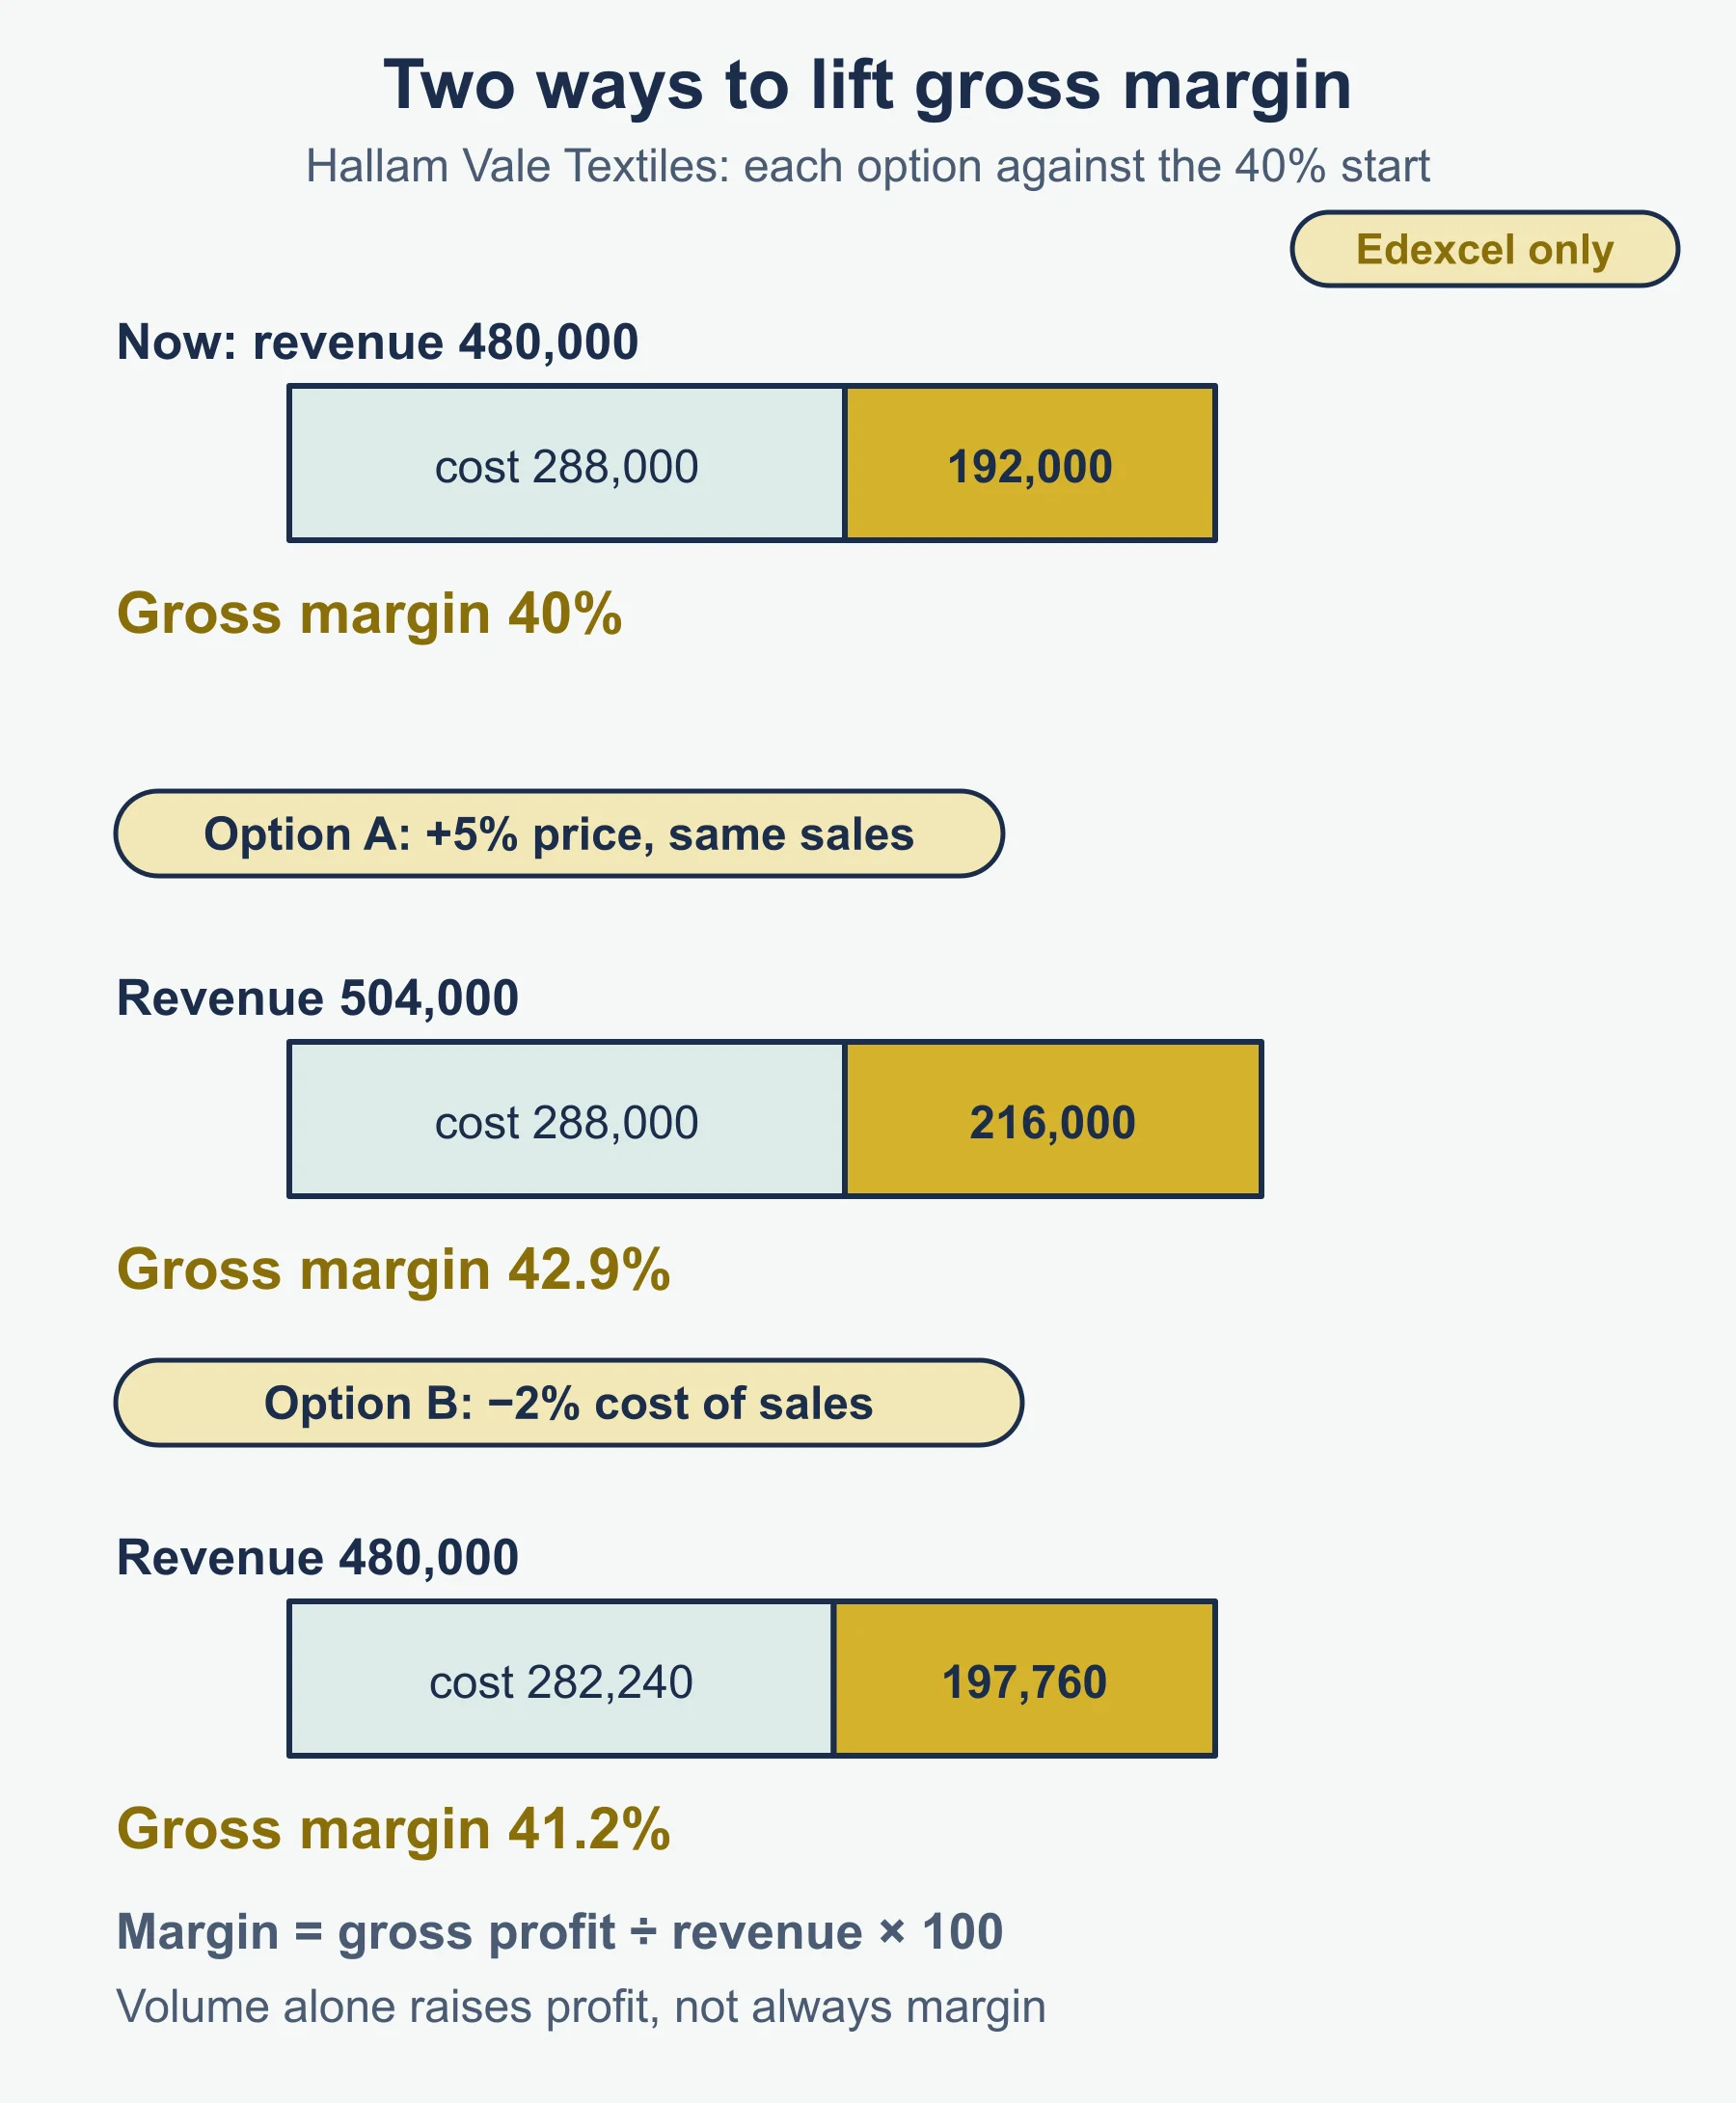
Worked example: Hallam Vale Textiles. Revenue 480,000; cost of sales 288,000; other operating expenses 138,000; interest 9,000.
Gross profit            = 480,000 - 288,000 = 192,000
Operating profit        = 192,000 - 138,000 =  54,000
Profit for the year     =  54,000 -   9,000 =  45,000

Gross profit margin     = 192,000 / 480,000 x 100 = 40%
Operating profit margin =  54,000 / 480,000 x 100 = 11.25%
Profit for the year margin = 45,000 / 480,000 x 100 = 9.4%
Each margin is the profit measure ÷ revenue × 100. Compare margins with earlier years and rivals.
Ways to increase profits: raise revenue (price, volume) or cut costs. Ways to improve profitability (margins): a 5% price rise with volume held lifts revenue to 504,000 and gross profit margin from 40% to 42.9% in this example; negotiating cheaper materials (a 2% fall in cost of sales raises gross profit to 197,760); cutting other operating expenses; and cutting interest by repaying debt. Raising volume alone raises profit but not necessarily the margins.
7. Liquidity
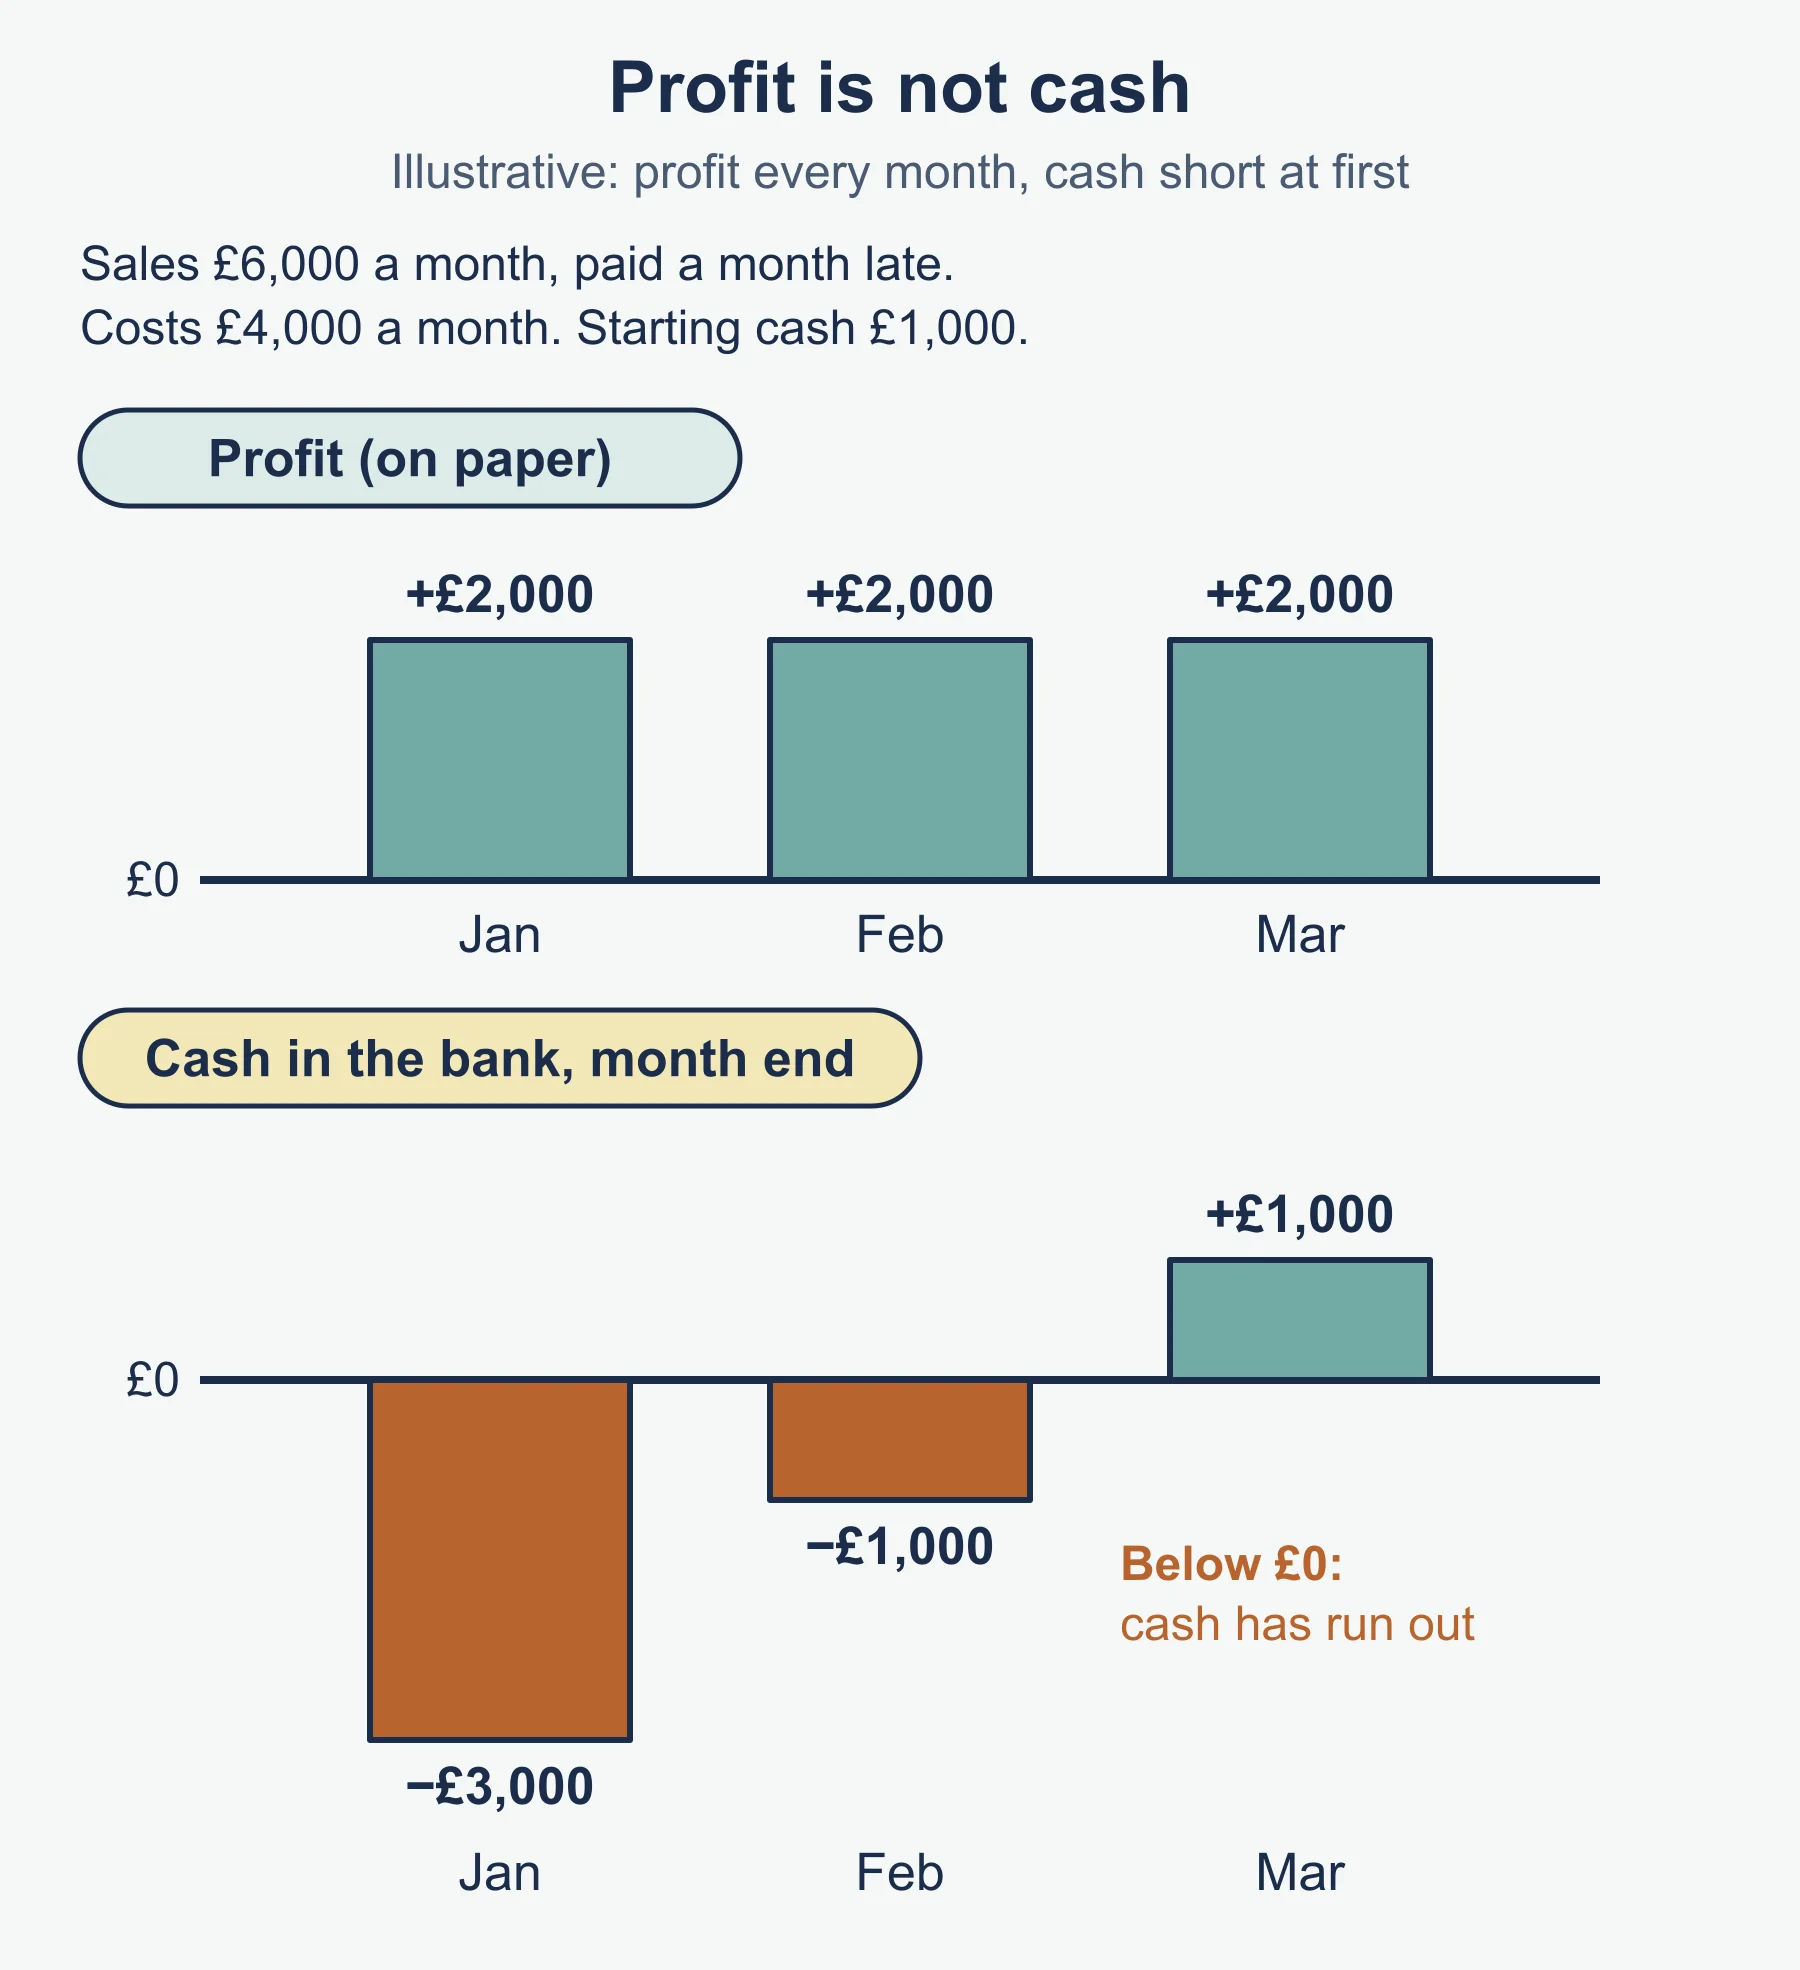
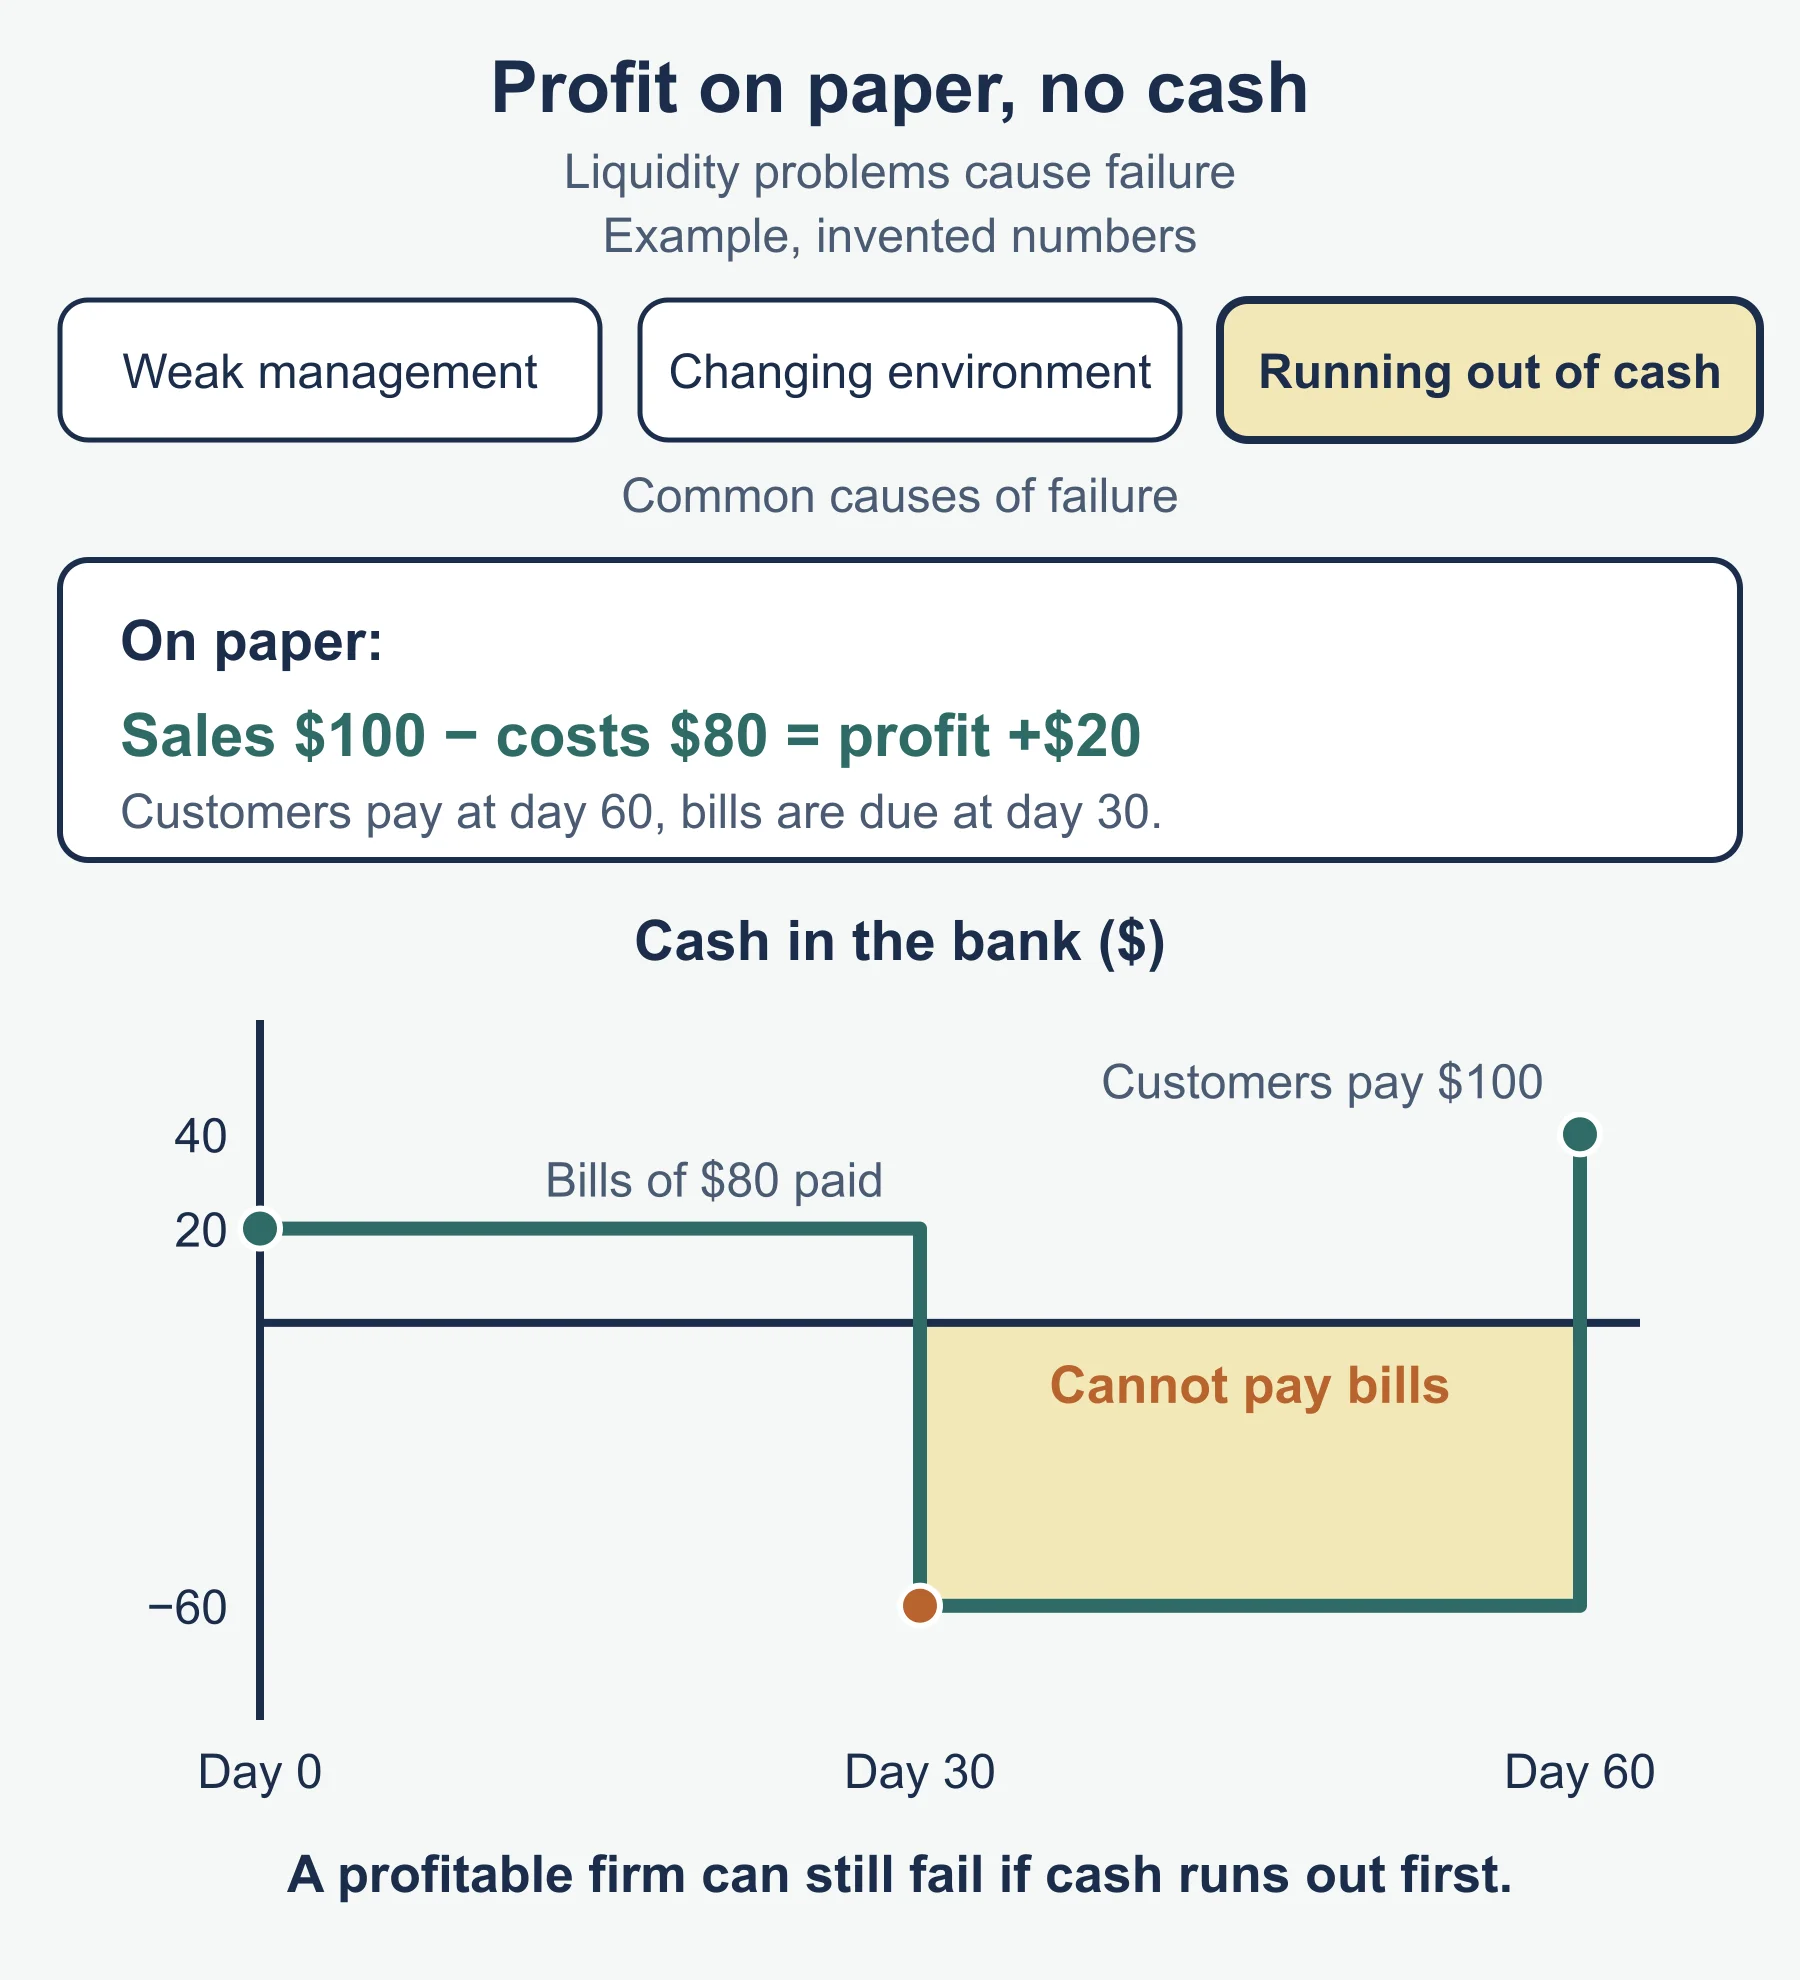
Profit is not cash. Profit is revenue minus costs over a period, counted when earned or incurred. Cash is money actually received and paid. A credit sale of 12,000 at a cost of 7,500 adds 4,500 to profit now, but no cash arrives until the customer pays.
The statement of financial position (balance sheet) lists non-current assets, current assets (inventory, trade receivables, cash), current liabilities (trade payables, overdraft) and non-current liabilities.
Current ratio   = current assets / current liabilities
Acid test ratio = (current assets - inventory) / current liabilities
Working capital = current assets - current liabilities
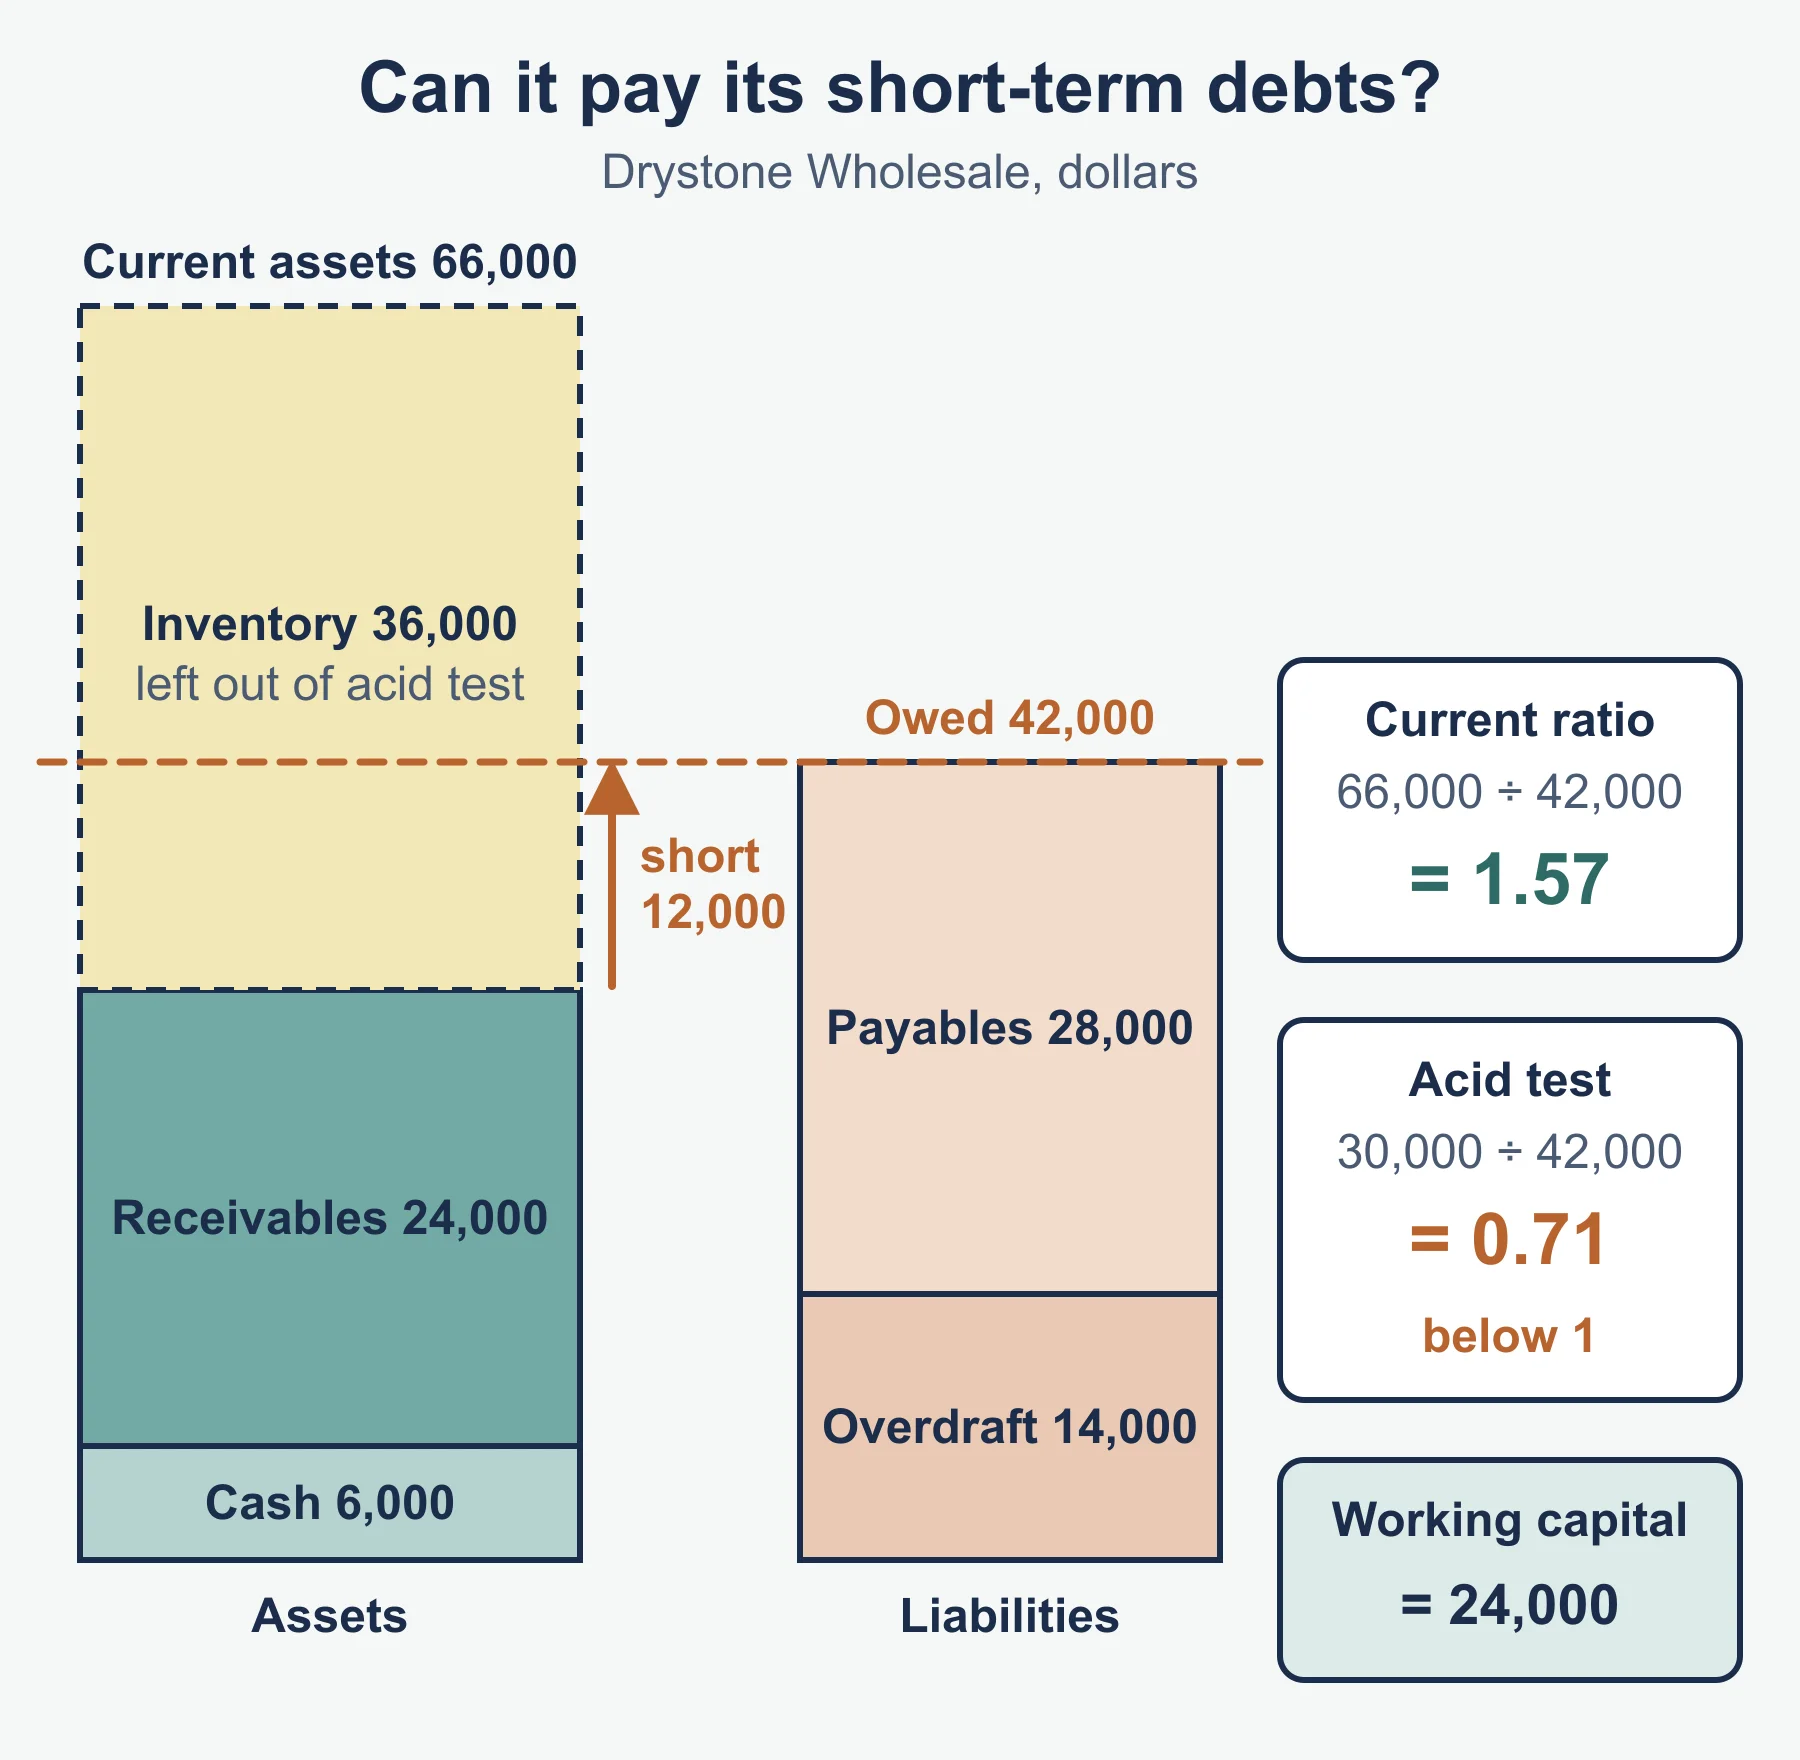
Worked example: Drystone Wholesale. Inventory 36,000; trade receivables 24,000; cash 6,000; trade payables 28,000; overdraft 14,000.
Current assets      = 66,000   Current liabilities = 42,000
Current ratio       = 66,000 / 42,000 = 1.57
Acid test ratio     = 30,000 / 42,000 = 0.71
Working capital     = 24,000
The acid test is below 1: without selling inventory, Drystone cannot cover all its short-term debts.
Ways to improve liquidity
- Assets: sell surplus non-current assets for cash.
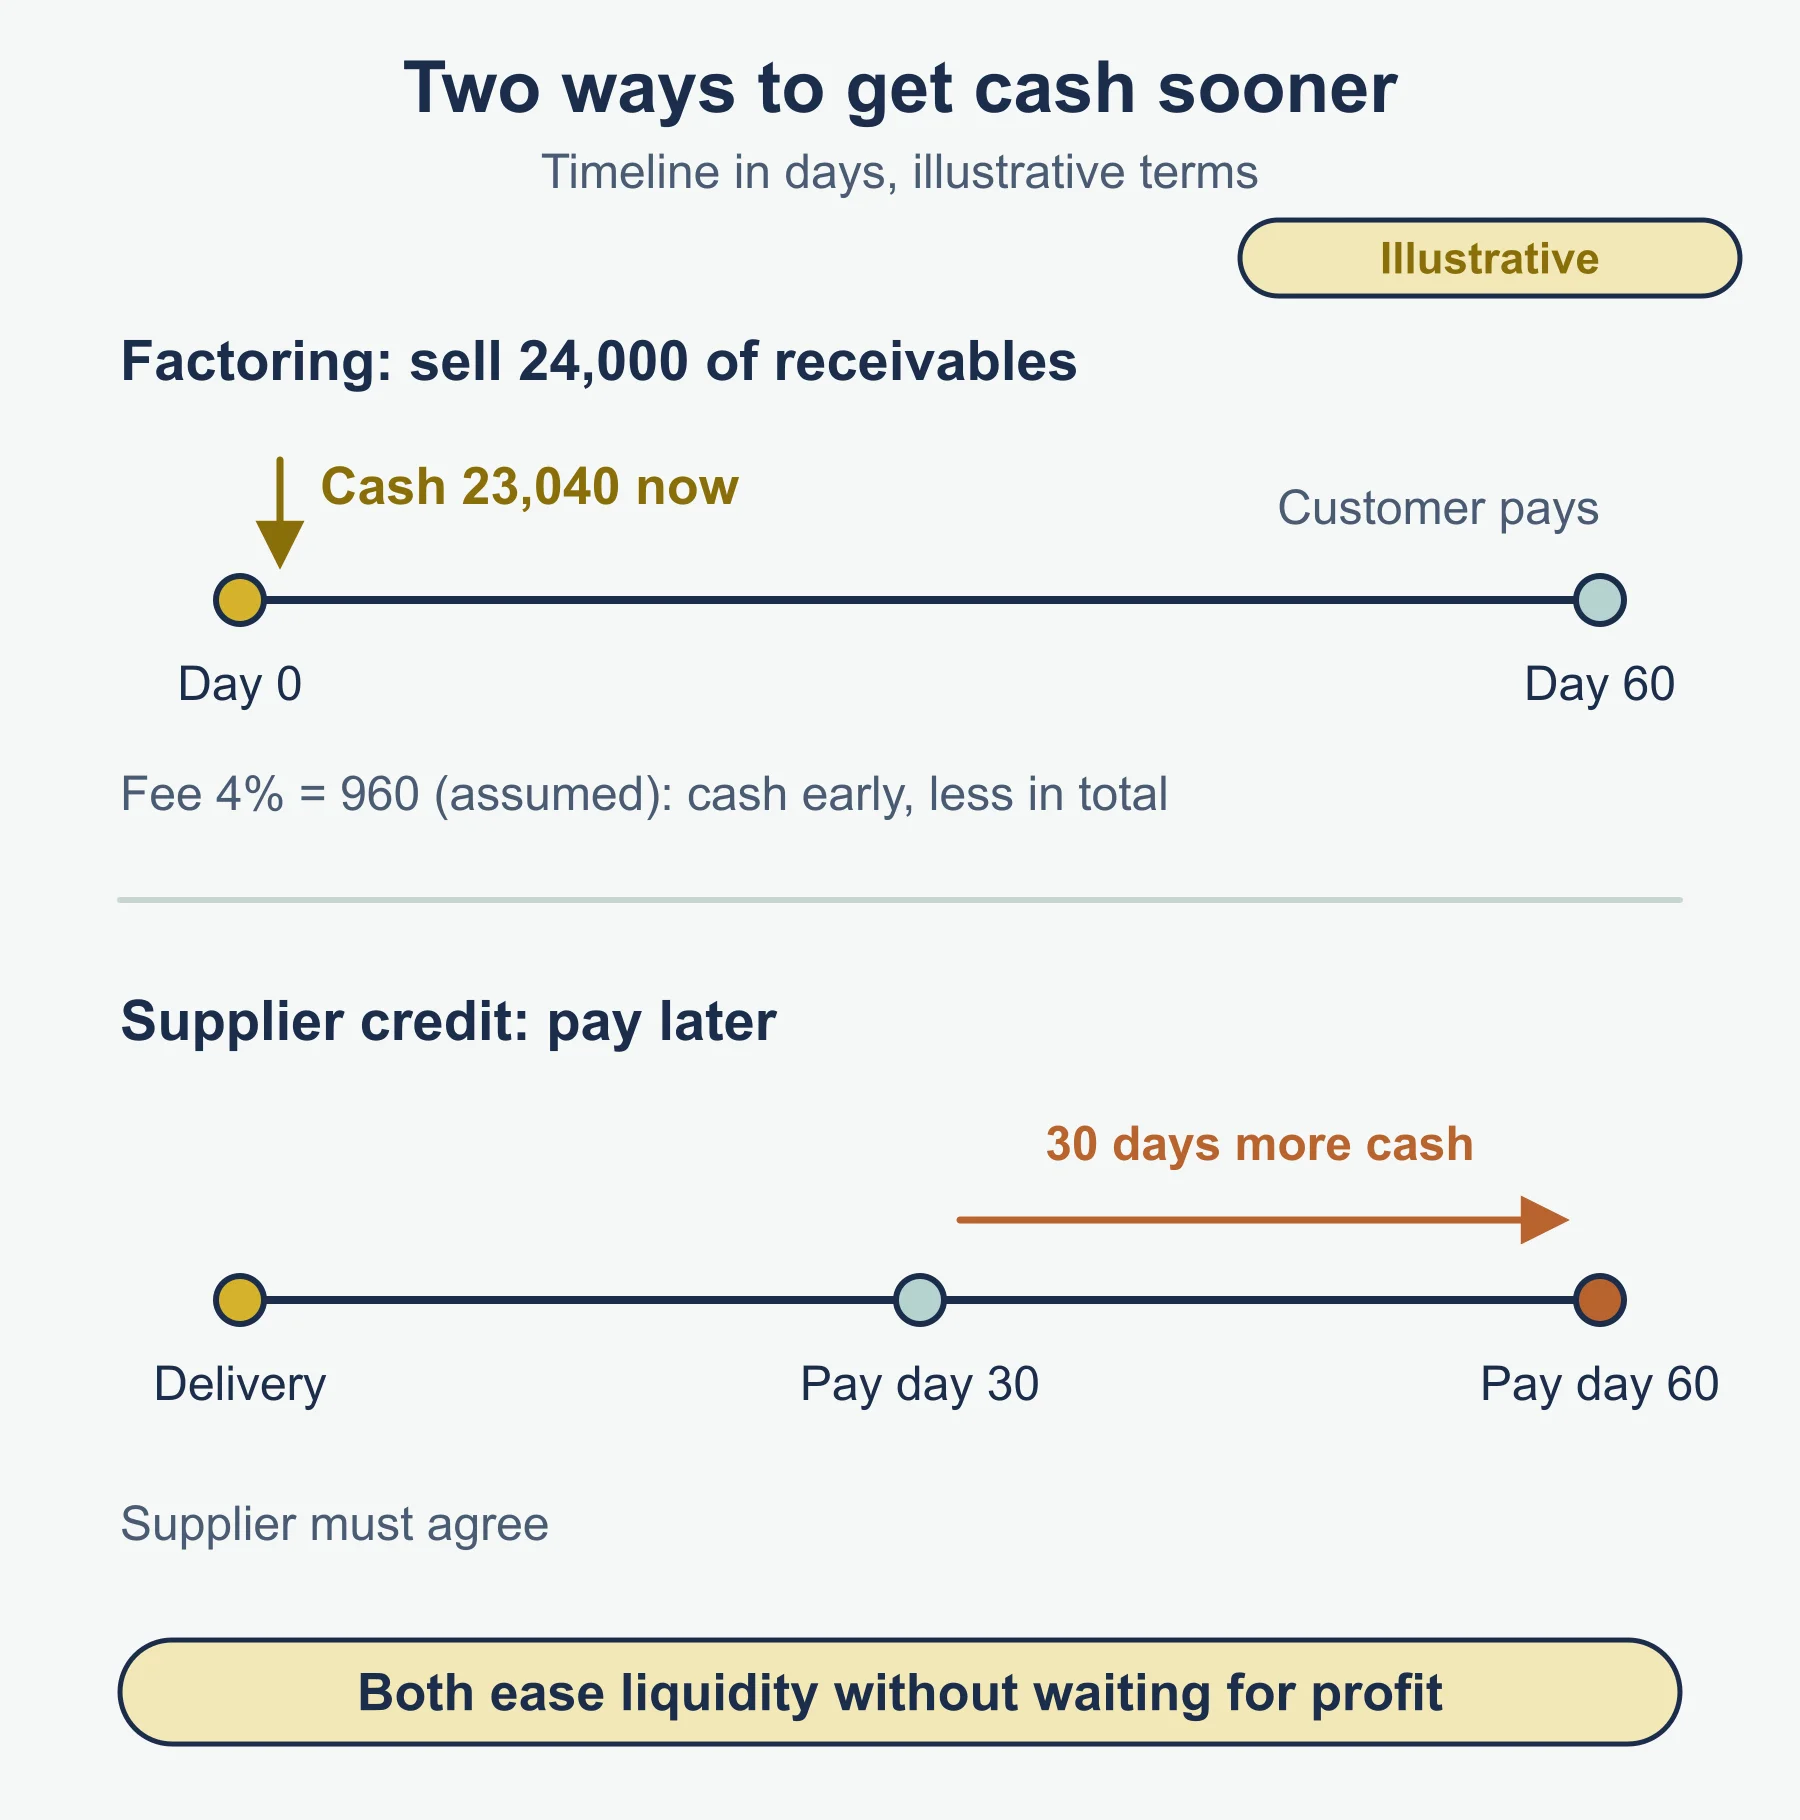
- Supplier credit terms: negotiate longer payment periods so cash leaves later.
- Factoring: sell trade receivables to a finance firm for immediate cash, at a fee.
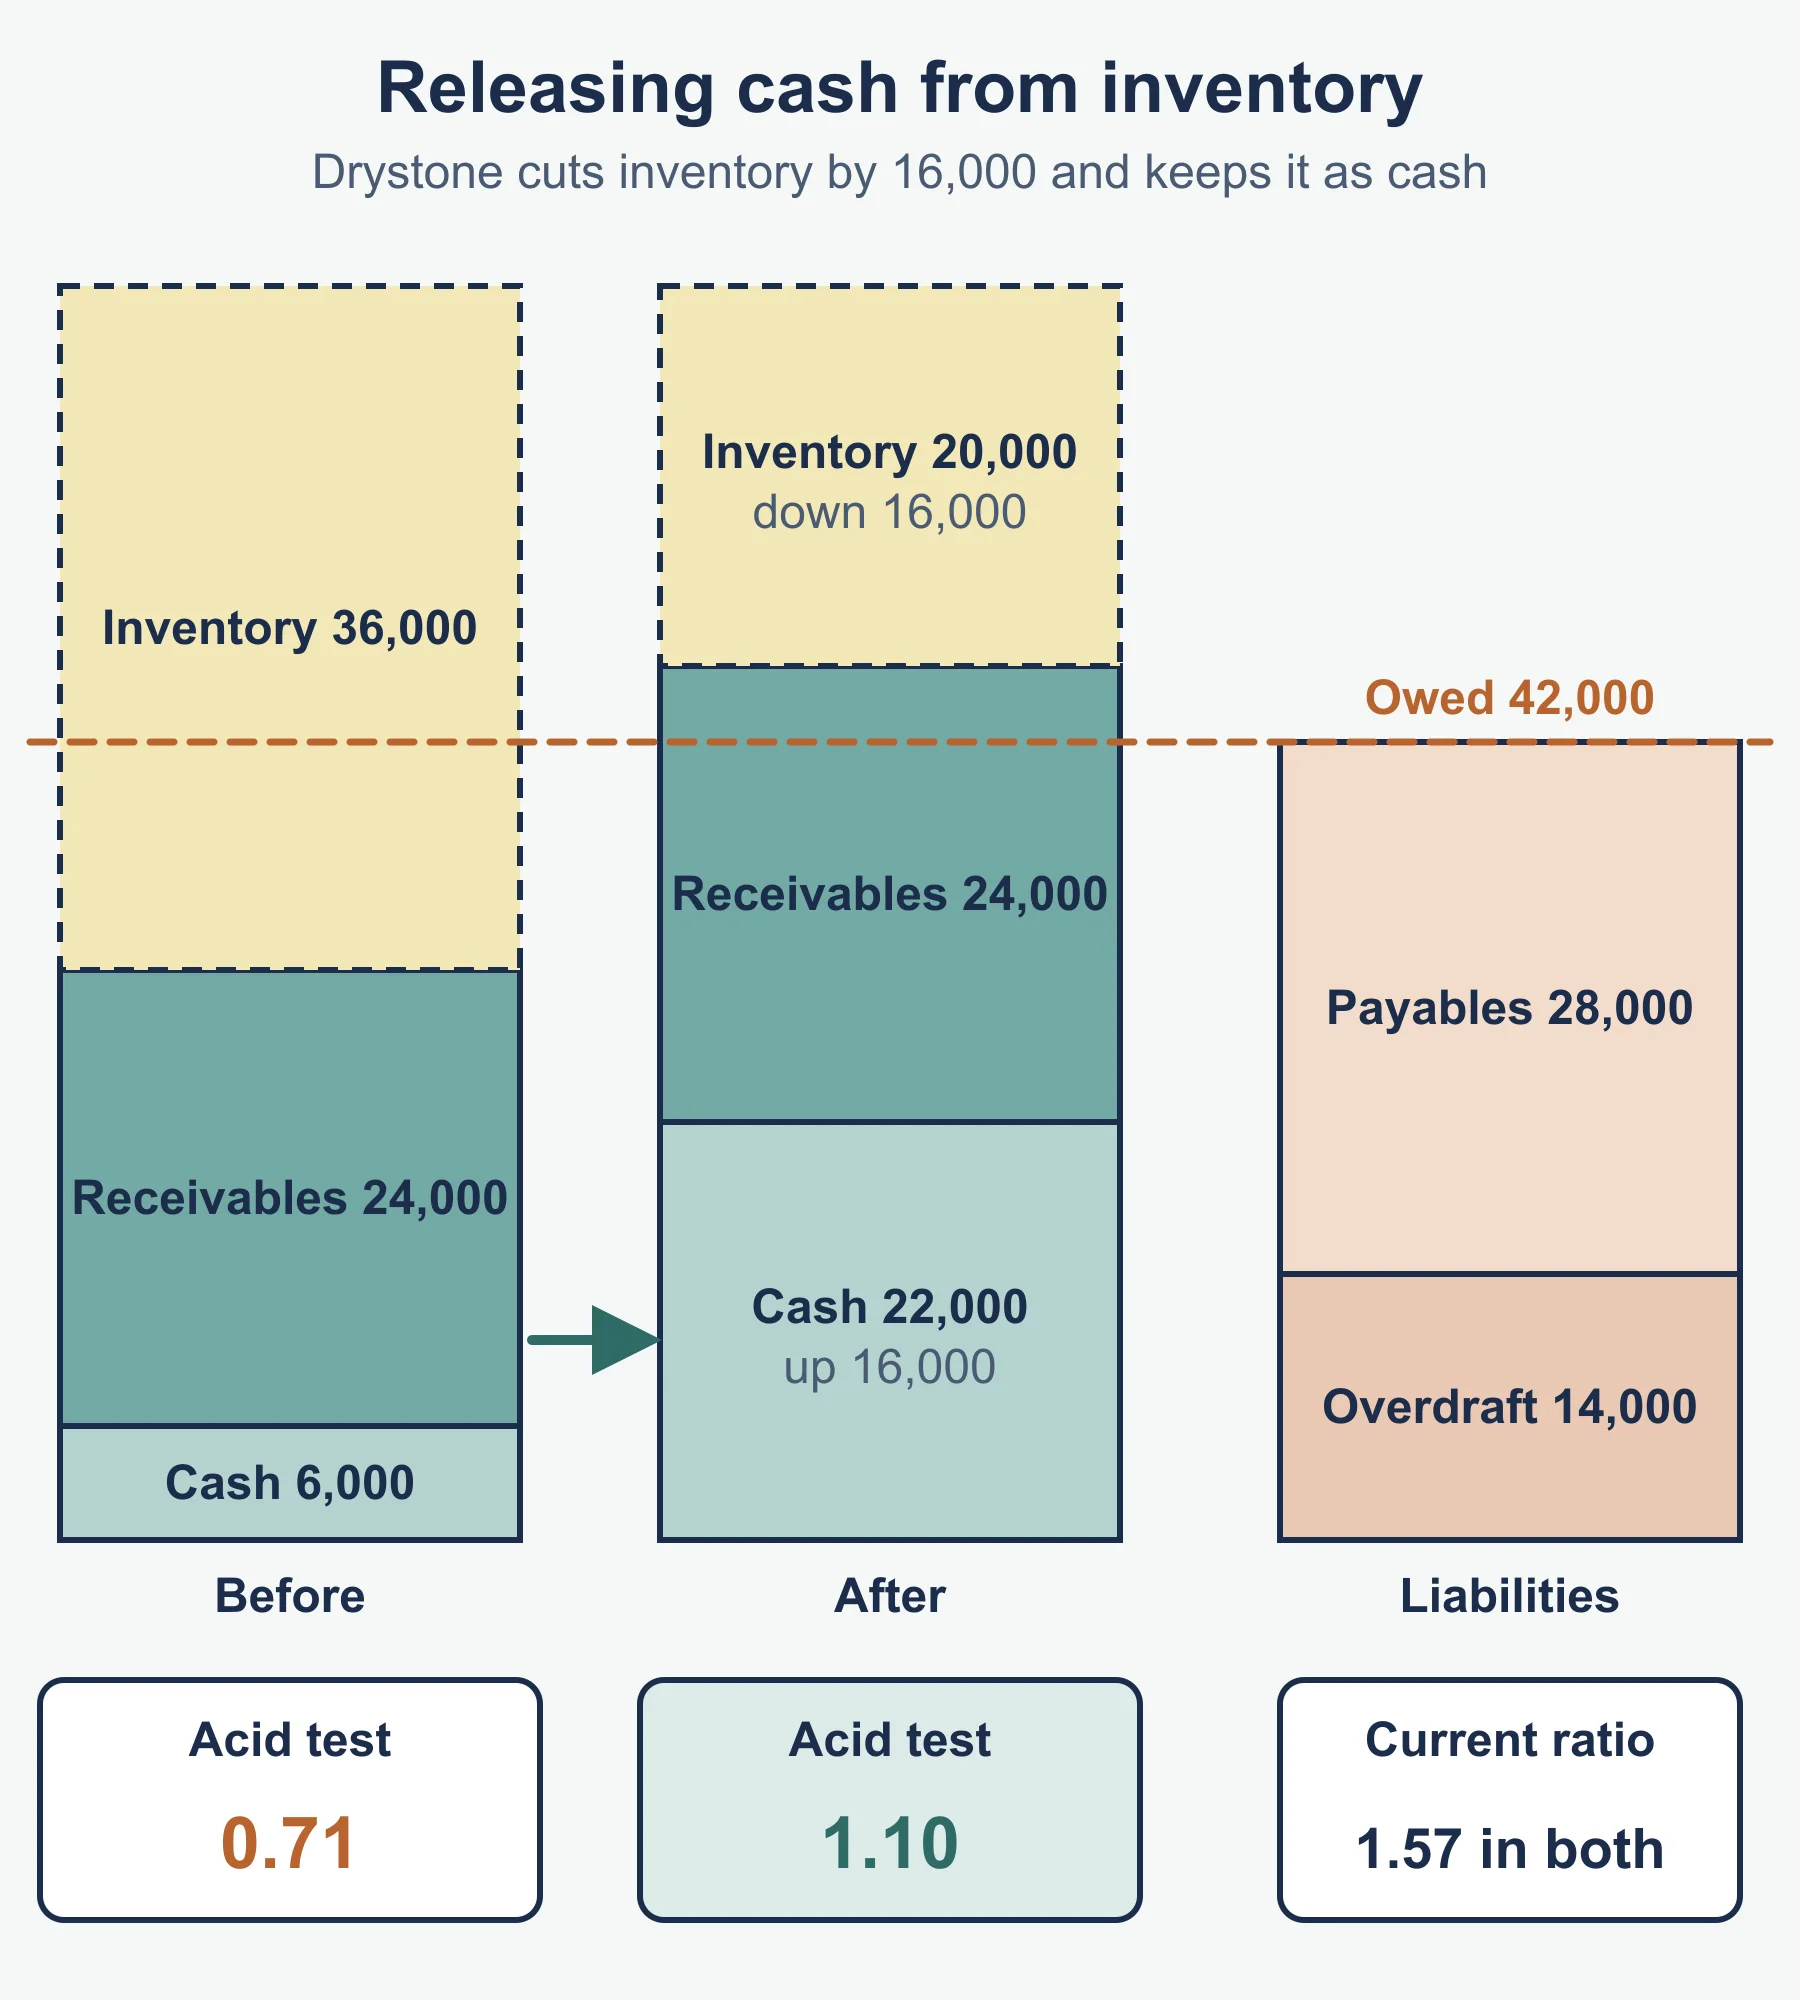
- Inventory (just in time): hold less inventory, releasing cash. If Drystone cut inventory to 20,000 and held the 16,000 as cash, the current ratio stays at 1.57 but the acid test rises to 46,000 ÷ 42,000 = 1.10.
Working capital is the money available for day-to-day running. Cash matters because wages, suppliers and tax must be paid on time. Too little risks failure; too much idle cash earns nothing.
8. Business failure
Internal causes: poor management of cash flow; overestimation of sales; overtrading (expanding output faster than the cash to fund it); poor inventory control; poor marketing; poor quality.
External causes: market conditions; competition; the economy; exchange rates; interest rates; government regulations; supplier problems; natural phenomena.
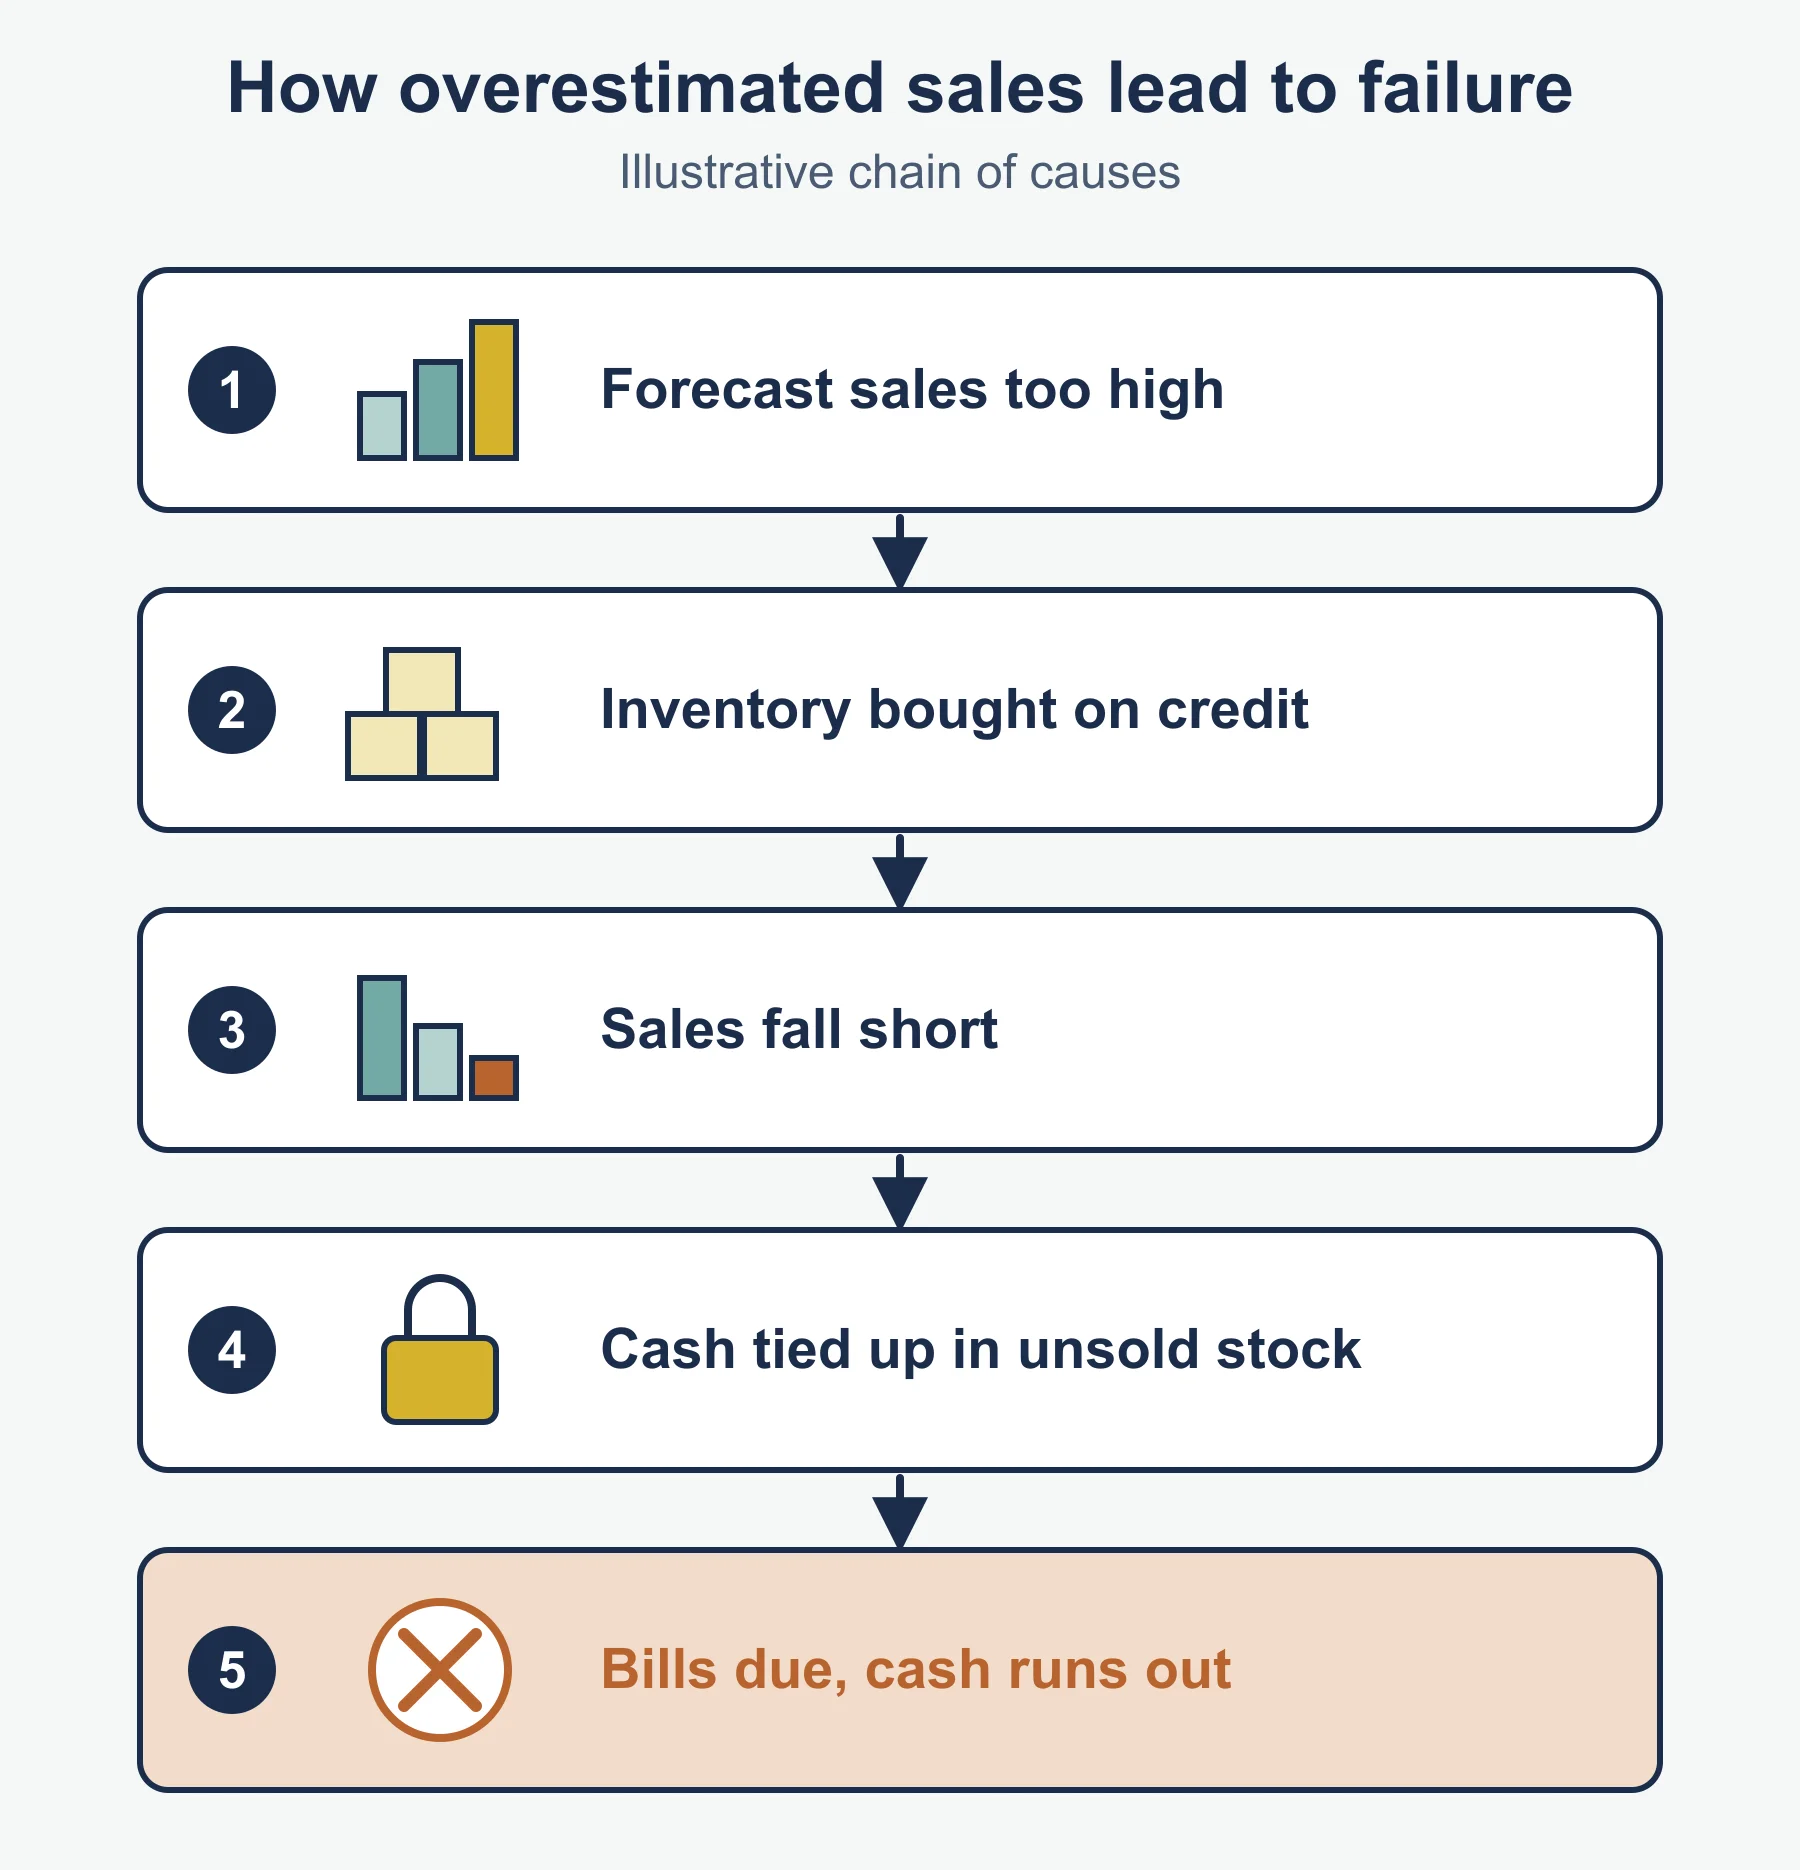
Link causes to figures: a business that overestimated sales may hold unsold inventory, pay for it on credit and run out of cash.
Common errors
- Dividing fixed costs by selling price rather than contribution.
- Giving break-even in money when units are asked for, and the reverse.
- Calling a negative closing balance a loss; it is a cash shortfall.
- Writing variances without the words favourable or adverse.
- Forgetting to remove inventory in the acid test.
- Saying a high current ratio is always good; idle cash and slow-moving inventory can inflate it.
- Listing causes of failure without linking them to the business in the source.
Frequently asked questions
Why is profit not the same as cash? Profit is revenue minus costs over a period, counted when earned or incurred, while cash is money actually received and paid. A credit sale adds to profit straight away but brings no cash until the customer pays.
What are the limitations of break-even analysis? It assumes all output is sold, the selling price and variable cost per unit stay constant, and fixed costs stay fixed. It suits a single product better than a business selling many.
How can a business improve its liquidity? It can sell surplus non-current assets, negotiate longer supplier credit terms so cash leaves later, or use factoring, selling trade receivables to a finance firm for immediate cash at a fee.
Is a high current ratio always good? No. Idle cash and slow-moving inventory can inflate the current ratio, and too much idle cash earns nothing for the business.
Official syllabus
Pearson Edexcel International Advanced Subsidiary/Advanced Level in Business specification (YBS11), Issue 1, September 2017, Unit 2, sections 2.3.2 and 2.3.3 and Appendices 8 and 9, published by Pearson Education Limited.
Get free revision emails (optional)
Occasional emails with practice questions, worked explanations and links to free resources for the qualification and subjects you choose. No spam, and you can unsubscribe from any email. The free tools on this site never need an email.
Related resources
-
Practice questions
Edexcel International A Level Business: Financial planning and Managing finance (YBS11) – Practice Questions
Original practice questions with worked answers on break-even, cash flow, budgets, profit, liquidity and failure for Edexcel IAL Business Unit 2.
Business · Pearson Edexcel · AS Level
Try questions -
Revision notes
Edexcel International A Level Business: Financial planning and Managing finance (YBS11) – Revision Notes
Condensed revision notes for Financial planning (2.3.2) and Managing finance (2.3.3) in Edexcel International A Level Business Unit 2, with a self-test.
Business · Pearson Edexcel · AS Level
Revise topic -
Study guides
Edexcel International A Level Business: Planning a business and raising finance (YBS11)
Study guide to business plans, internal and external finance, forms of business and liability for Edexcel International A Level Business, section 2.3.1.
Business · Pearson Edexcel · AS Level
Read guide
Related articles
-
teaching
A Level tuition in Dubai: Cambridge or Pearson Edexcel International A Level?
Schools in Dubai and Abu Dhabi teach either Cambridge International AS & A Level or Pearson Edexcel International A Level. How the two are structured, why it matters for tuition, and how online classes from Lahore work.
9 October 2026
-
curriculum guides
Choosing subjects at IGCSE and A Level
How subject choices at 14 and 16 affect university options later, and how to keep pathways open without overloading a timetable.
28 July 2026
Studying this with a teacher
Working through Business AS LEVEL?
This page is free and stays free. If you would rather be taught it, Marlbridge runs Business classes one-to-one and in small groups of up to 15, online in your own time zone. The first trial class is free. WhatsApp replies within an hour (8am–11pm Pakistan time, every day); email the same day.
Pearson Edexcel Business teachers at Marlbridge

