
Study Guides
Edexcel IGCSE Business: Economies and diseconomies of scale, and production (4BS1)
Study guide to Edexcel IGCSE Business 5.1 and 5.2: economies and diseconomies of scale, production types, productivity, lean production, robotics.
- Subject
- Business
- Level
- IGCSE
- Topic
- Business operations
- Author
- Marlbridge Academic Team
- Updated
- Reviewed by
- Asif Iqbal (what this means)
Aligned to Pearson Edexcel IGCSE Business (4BS1), Issue 2, February 2026. Official specification .
Syllabus page (what it covers and how it is assessed): Pearson Edexcel IGCSE Business.
Syllabus points this page covers
4BS1
- 5 Business operations (whole topic)
- 5.1 Economies and diseconomies of scale
- 5.2 Production
Found an error? Report a correction.
Want a teacher for this? Marlbridge teaches Business online. Request a free trial class.
This guide follows the Pearson Edexcel International GCSE in Business (4BS1) specification, Issue 2, February 2026. It covers Topic 5, Business operations, sections 5.1 Economies and diseconomies of scale and 5.2 Production, including every numbered point under each. The specification has two written papers, each 1 hour 30 minutes and 80 marks. Paper 1 uses a small business (up to 49 employees) and Paper 2 a large business (more than 250 employees). Both can draw on the whole content, so expect these ideas in either paper, and calculators may be used.
Course links: the Edexcel IGCSE Business hub, the printable checklist and the free diagnostics. Companion pages: the revision notes and the practice questions.
What the specification asks for
| Point | You must be able to | Where here |
|---|---|---|
| 5.1.1 | Explain internal economies of scale (falling average total costs as output increases) and external economies (falling average total costs due to external factors) | Section 1 |
| 5.1.2 | Explain diseconomies of scale and the limits of growth | Section 2 |
| 5.2.1 | Describe job, batch and flow production; labour and capital intensive production; the impact of different types of production; calculate productivity and explain the impact of improvements | Sections 3 to 5 |
| 5.2.2 | Explain just-in-time (JIT), Kaizen and the importance of using resources effectively | Section 6 |
| 5.2.3 | Explain the use of robotics and the balance of cost, productivity, quality and flexibility | Section 7 |
The specification does not name particular kinds of economy (such as buying or technical economies), so the examples below are illustrations. Your answers should always link back to average total cost.
1. Economies of scale (5.1.1)
Average total cost (average cost per unit) is total cost divided by output. When a business grows and average total cost falls, it has gained economies of scale.
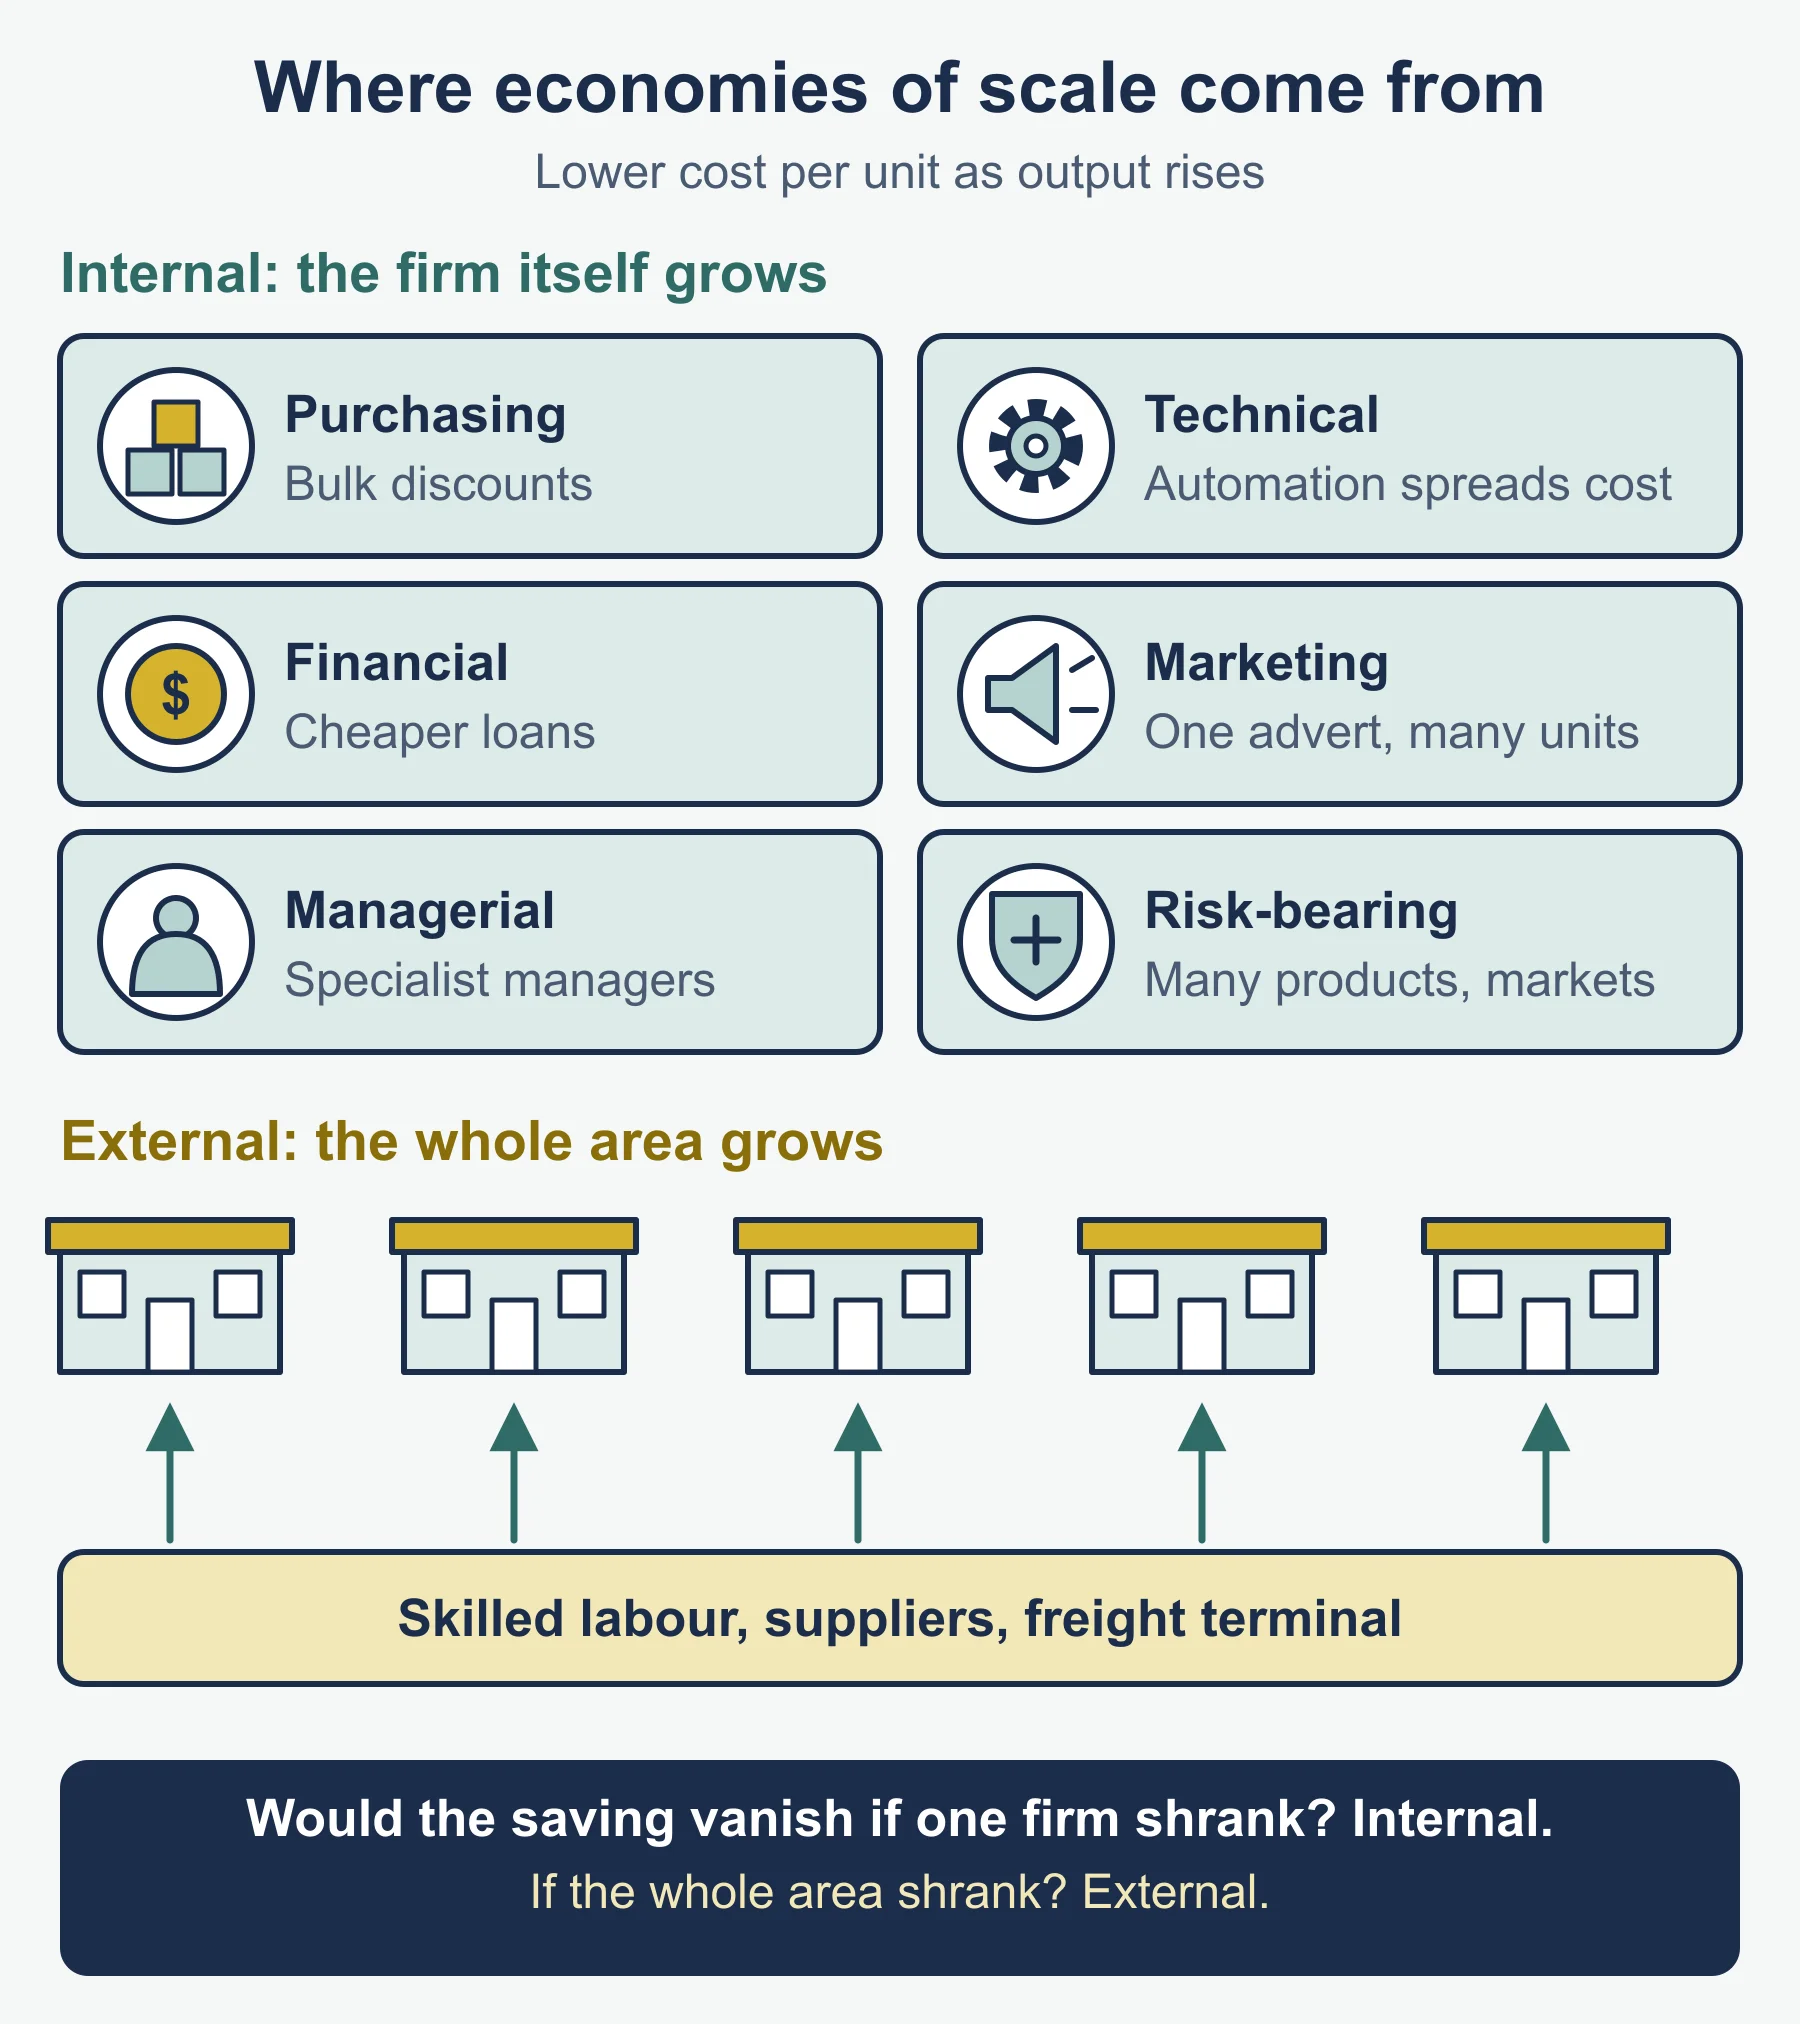
- Internal economies come from the business’s own growth. Average total costs fall as output increases, because fixed costs such as rent are spread over more units or because bigger orders and better machines cut the cost of each unit.
- External economies are falling average total costs due to external factors, outside the control of one firm. Typical sources are a skilled labour pool in the area, a specialist supplier setting up nearby, or better local transport links. Every firm in the area can gain, not only the biggest.
Worked example: reading an average cost table
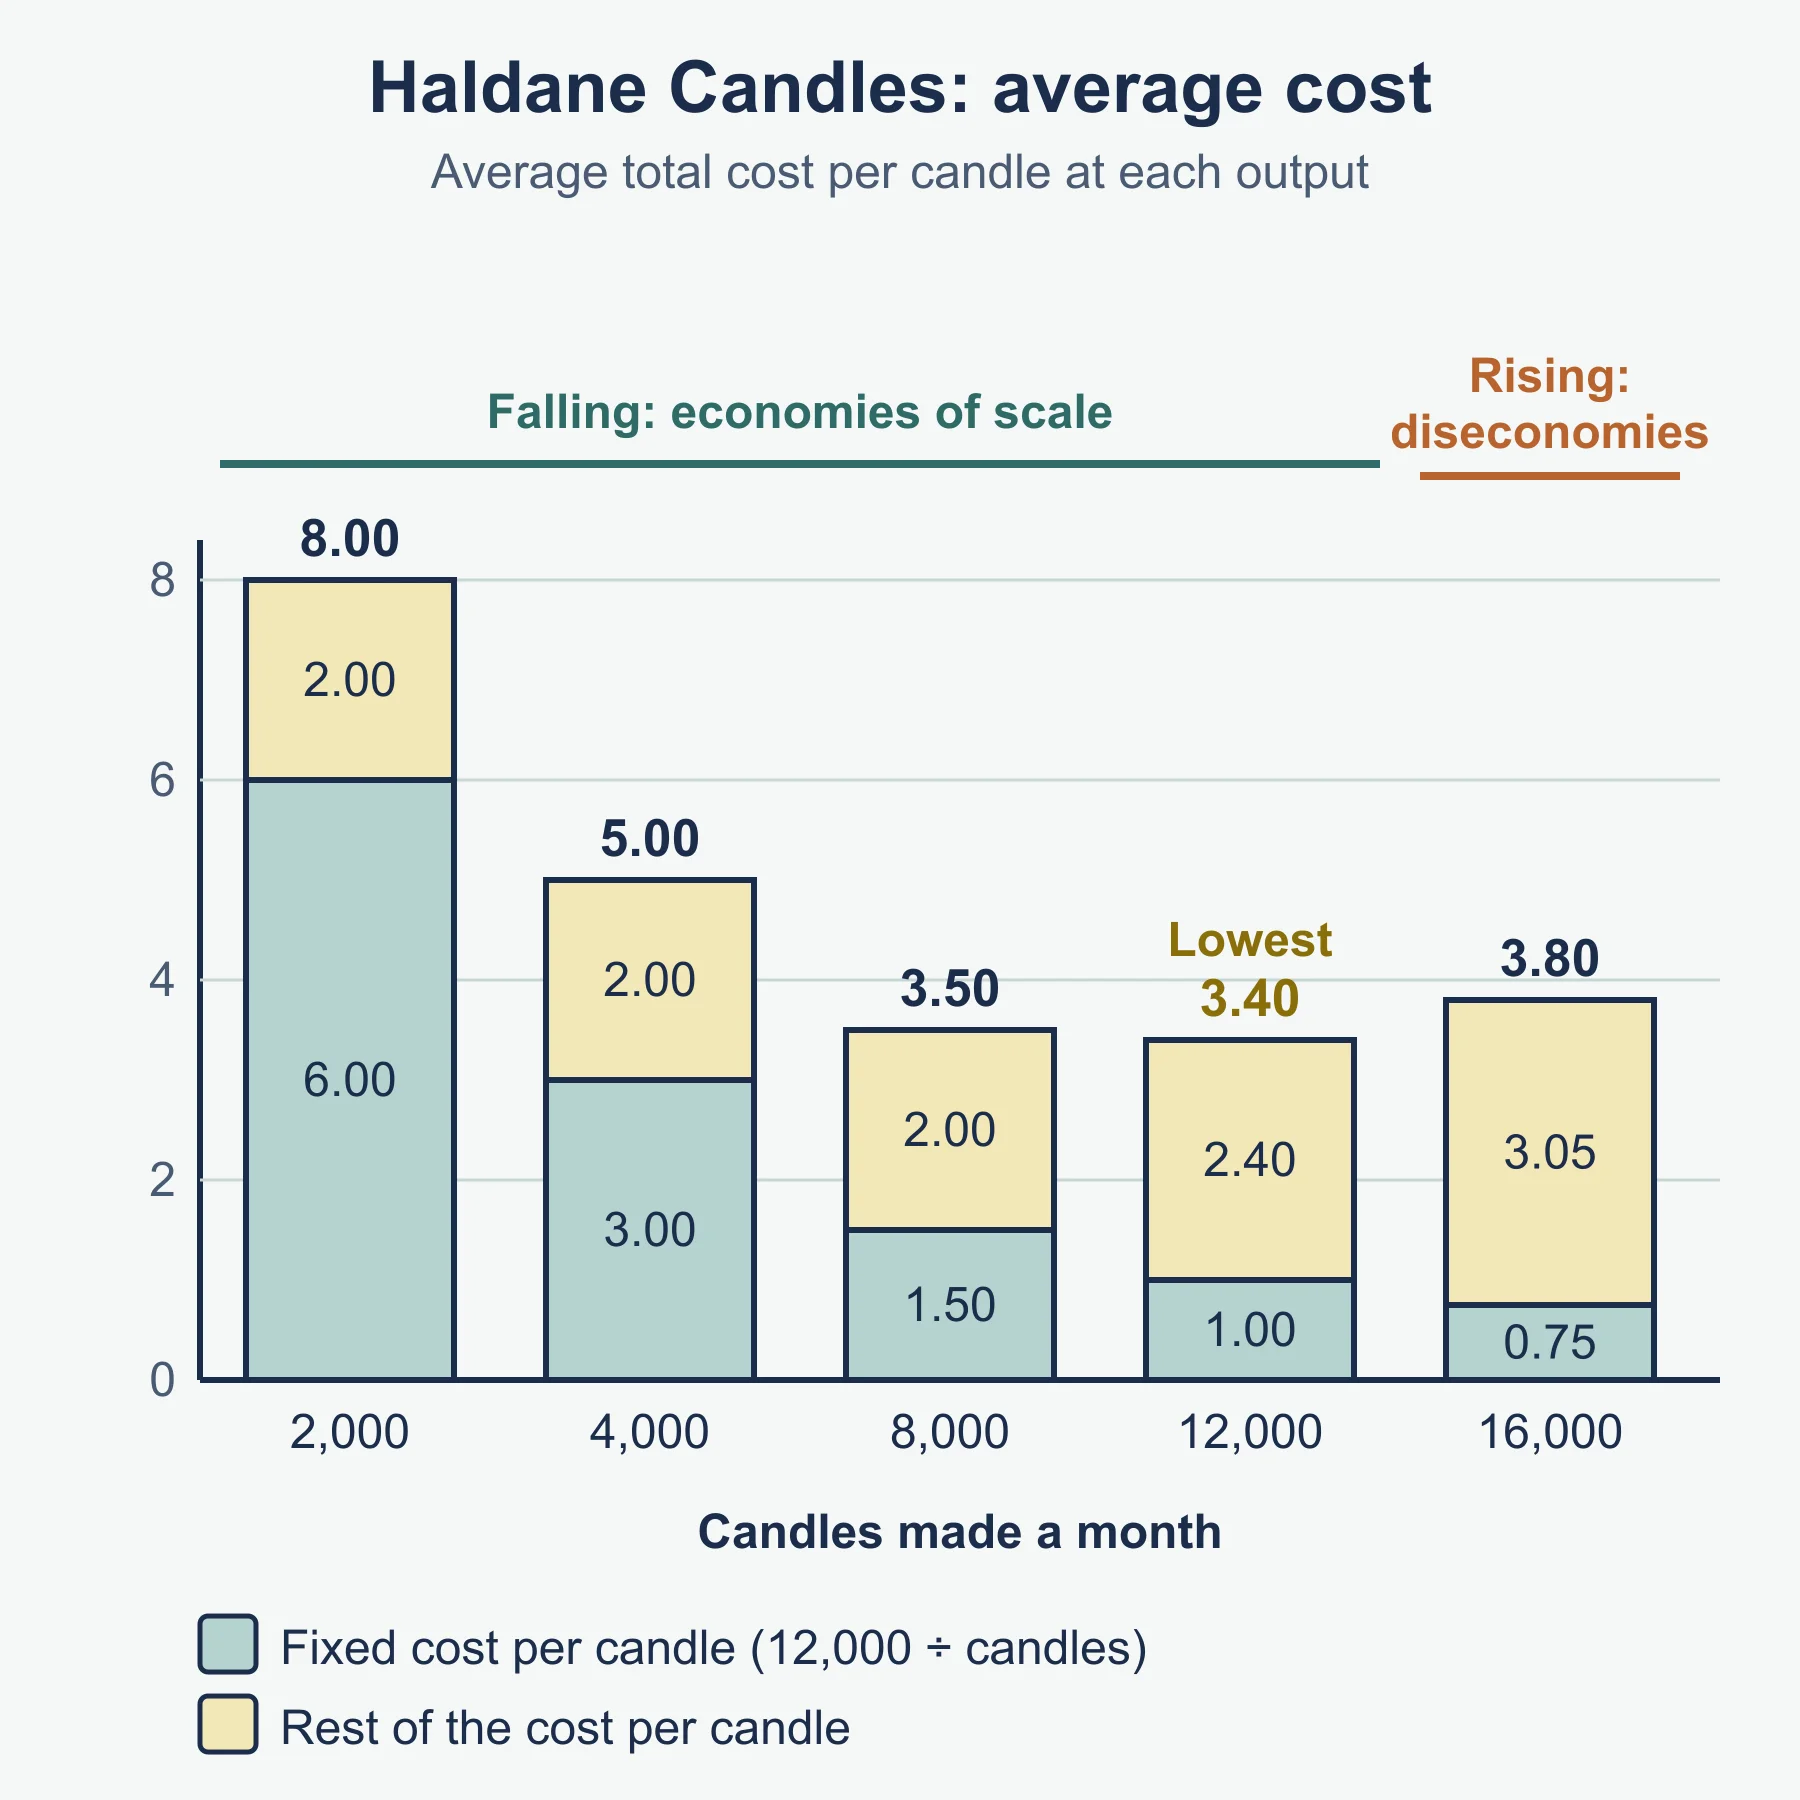
Haldane Candles has fixed costs of 12,000 a month. Its total costs at different monthly outputs are below.
| Output (candles) | Total cost | Average total cost |
|---|---|---|
| 2,000 | 16,000 | 8.00 |
| 4,000 | 20,000 | 5.00 |
| 8,000 | 28,000 | 3.50 |
| 12,000 | 40,800 | 3.40 |
| 16,000 | 60,800 | 3.80 |
Method: divide total cost by output each time. At 2,000 candles, 16,000 ÷ 2,000 = 8.00. At 8,000, 28,000 ÷ 8,000 = 3.50. The average falls to 3.40 at 12,000, so internal economies of scale are still operating up to that point. Most of the early fall is fixed cost being spread: 12,000 ÷ 2,000 = 6.00 per candle, but 12,000 ÷ 4,000 = 3.00.
Worked example: an external economy
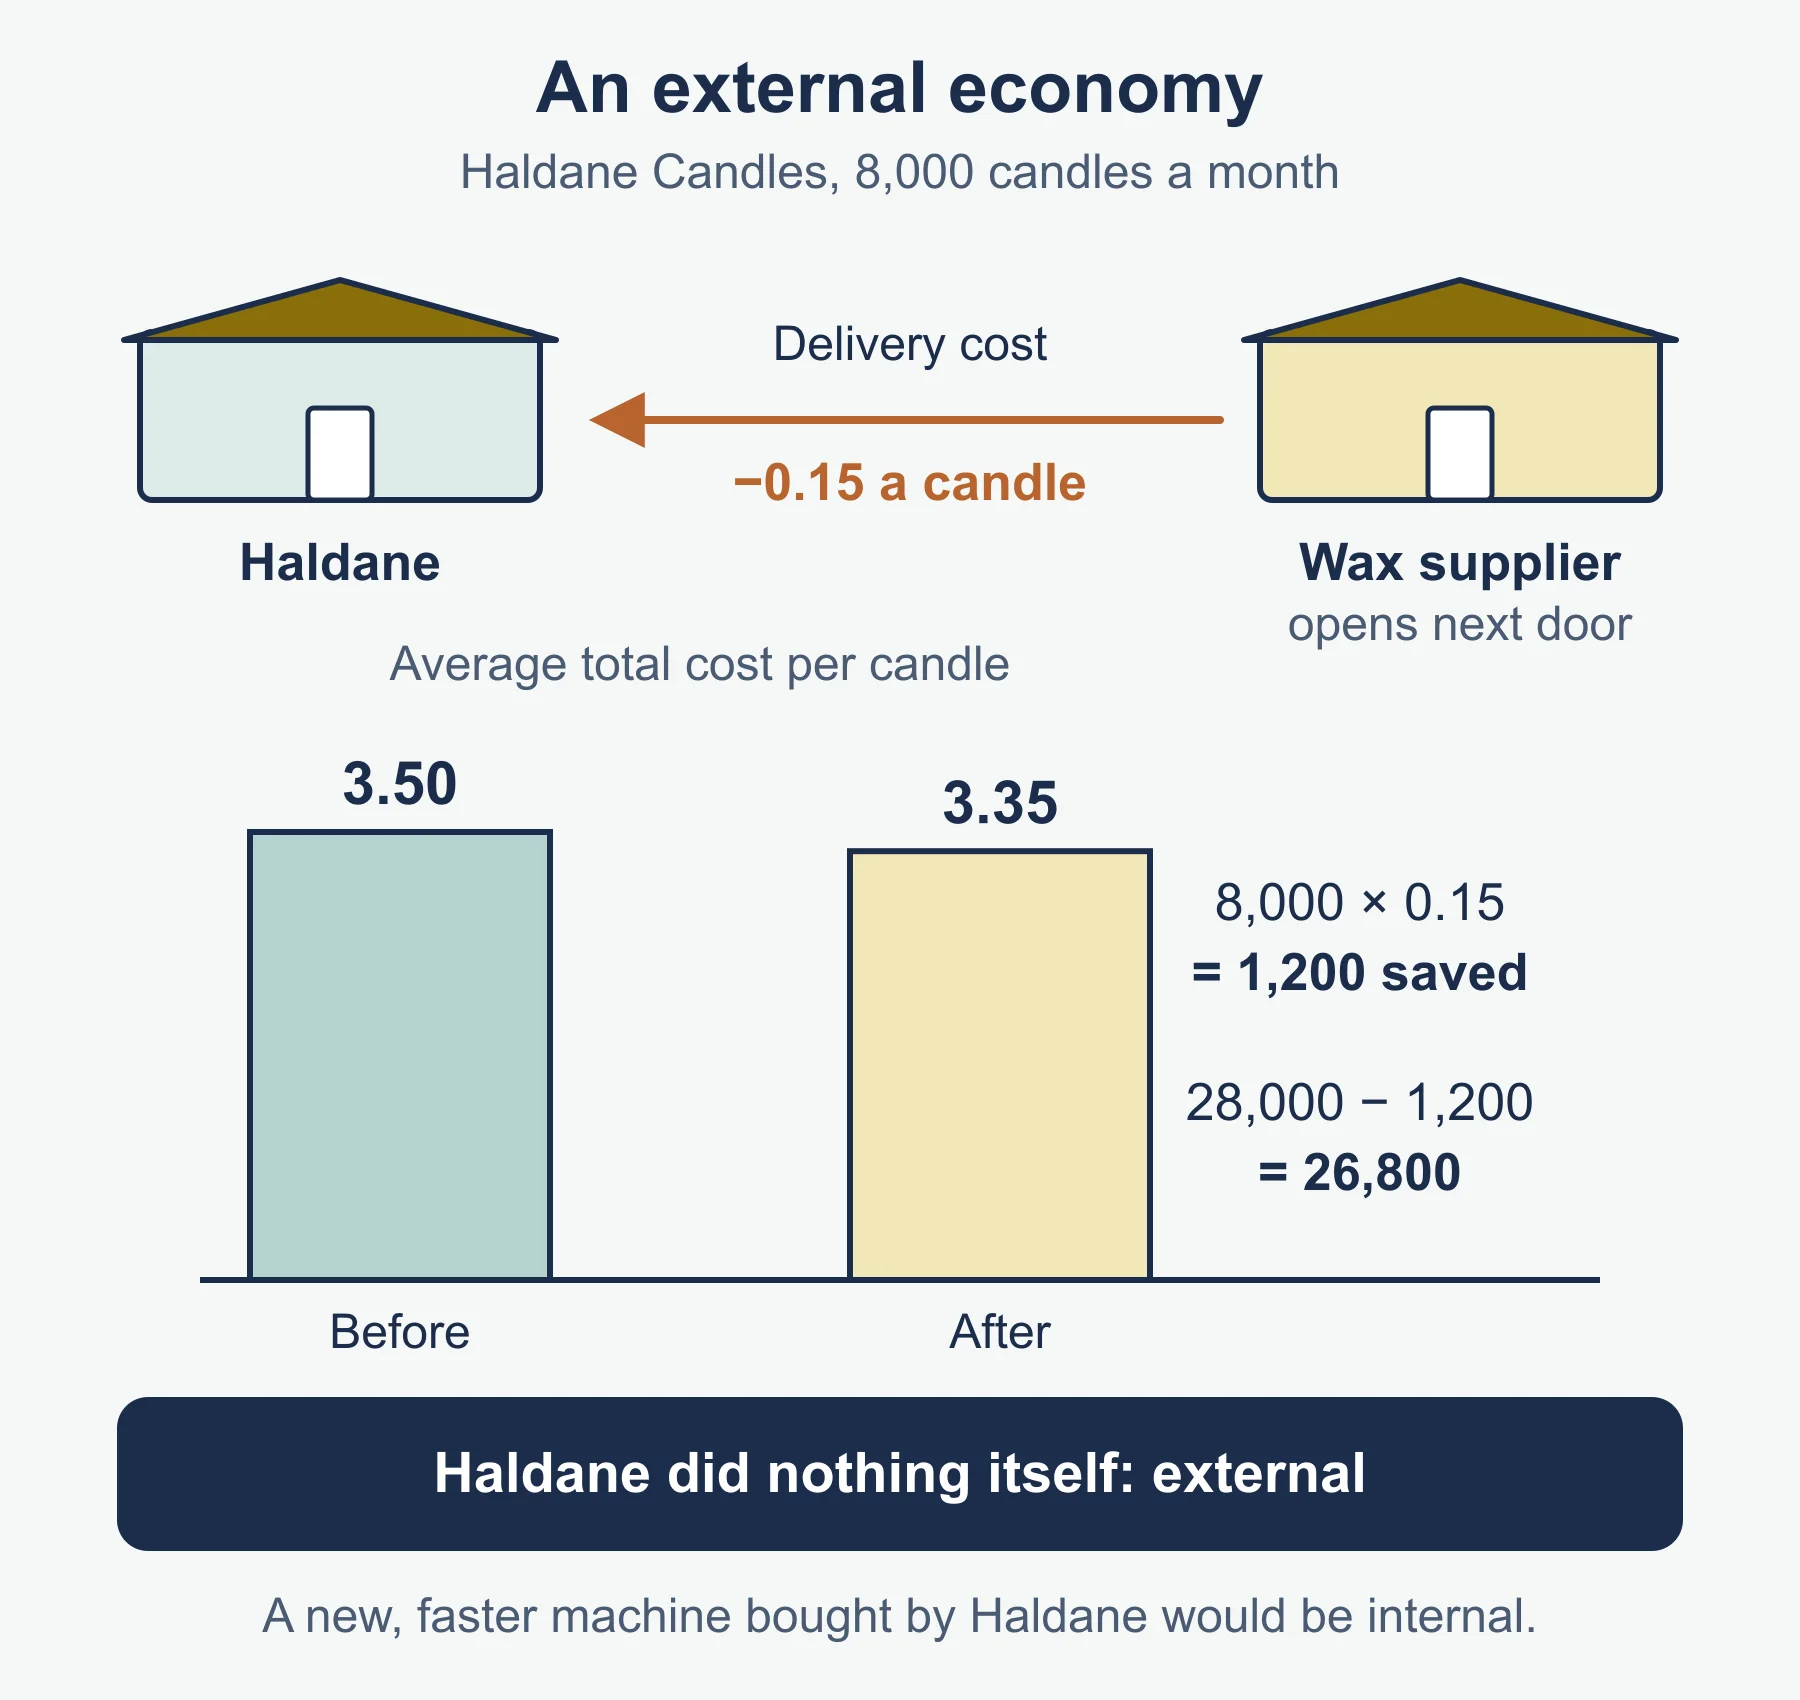
A specialist wax supplier opens a depot next door. Haldane’s delivery cost falls by 0.15 per candle. At 8,000 candles that saves 8,000 × 0.15 = 1,200, so total cost becomes 28,000 − 1,200 = 26,800 and average total cost becomes 26,800 ÷ 8,000 = 3.35, down from 3.50. Haldane did nothing itself, so this is external. Compare a new, faster moulding machine that Haldane buys: that would be internal.
2. Diseconomies of scale and limits of growth (5.1.2)
Diseconomies of scale are the opposite: average total cost rises as output rises. In the Haldane table, average cost goes from 3.40 at 12,000 candles to 3.80 at 16,000. The rise of 0.40 is the sign. Diseconomies set a limit to profitable growth, which is why the specification links them to the limits of growth.
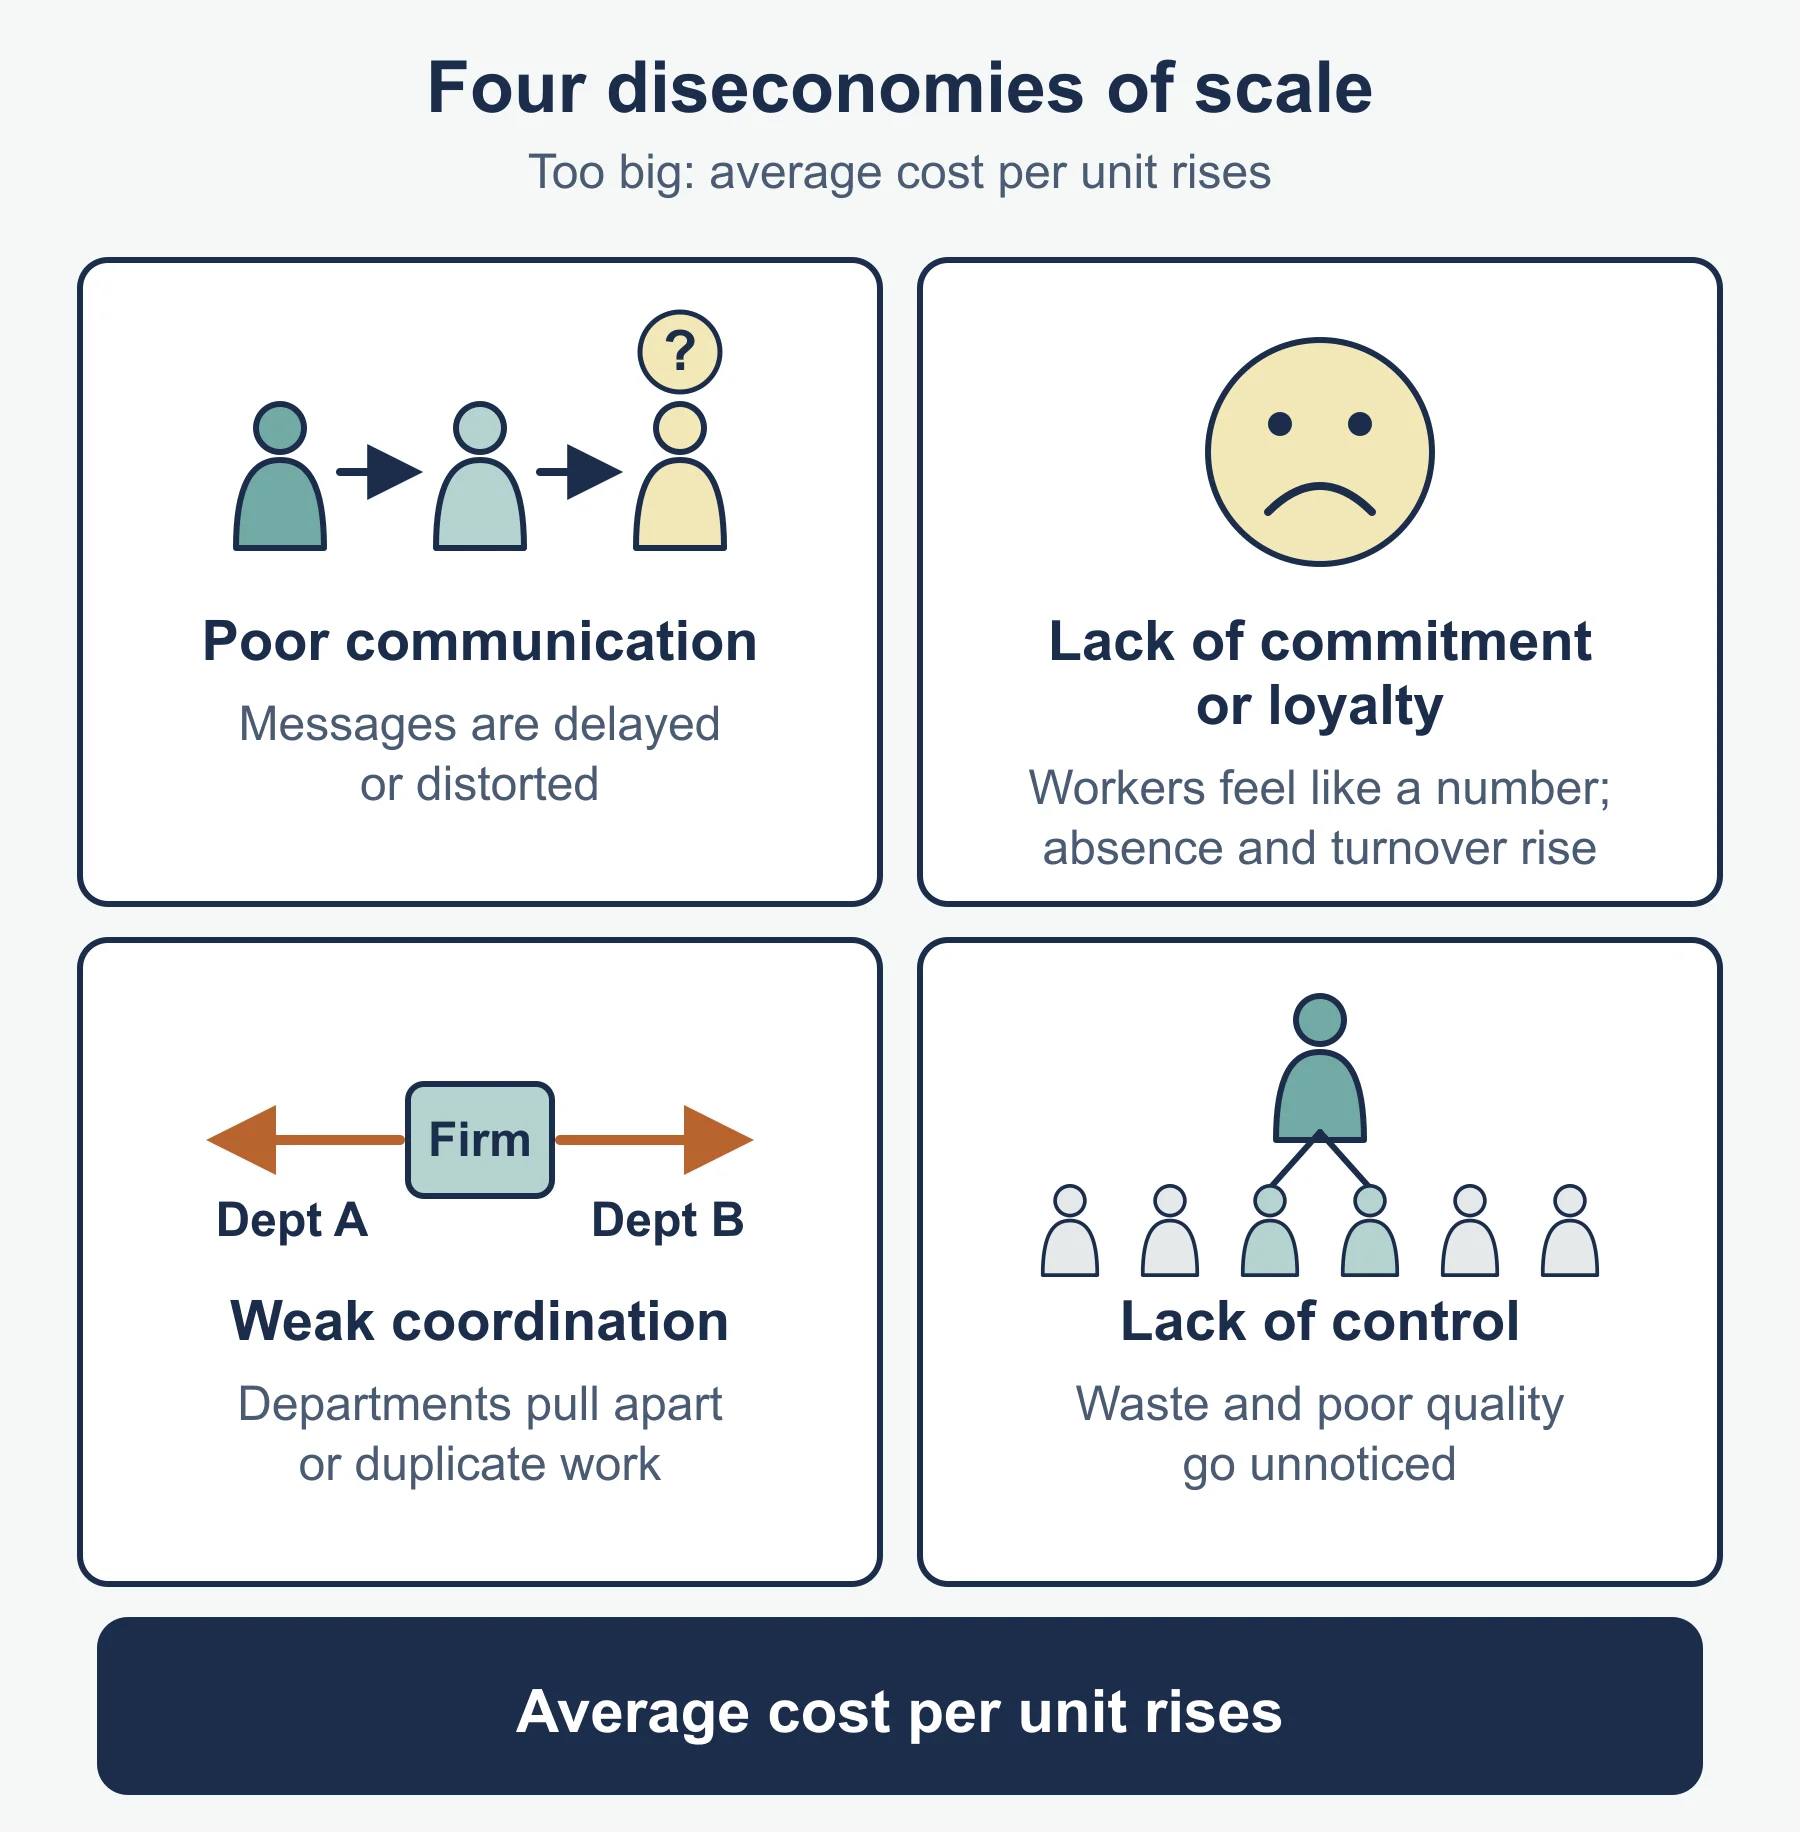
Reasons a large business can find that unit costs start to rise:
- Communication problems. More layers of managers mean slower, less accurate messages, and mistakes are repeated.
- Co-ordination and control. Managing many sites, departments or products is harder, so waste and duplication creep in.
- Weaker motivation. Workers in a big firm may feel unimportant, so absence, errors and staff turnover can rise.
- Capacity pressure. Pushing machines and premises past their best level means overtime payments, breakdowns and rented extra space.
Growth is also limited by things outside costs, such as the size of the market, finance available and the owner’s wish to stay in control. Say clearly which limit applies in the case you are given.
Common slip: calling any cost increase a diseconomy. If a cost rises because the price of materials rises, that is not a diseconomy of scale. It is a diseconomy only when average total cost rises because output (the scale) has risen.
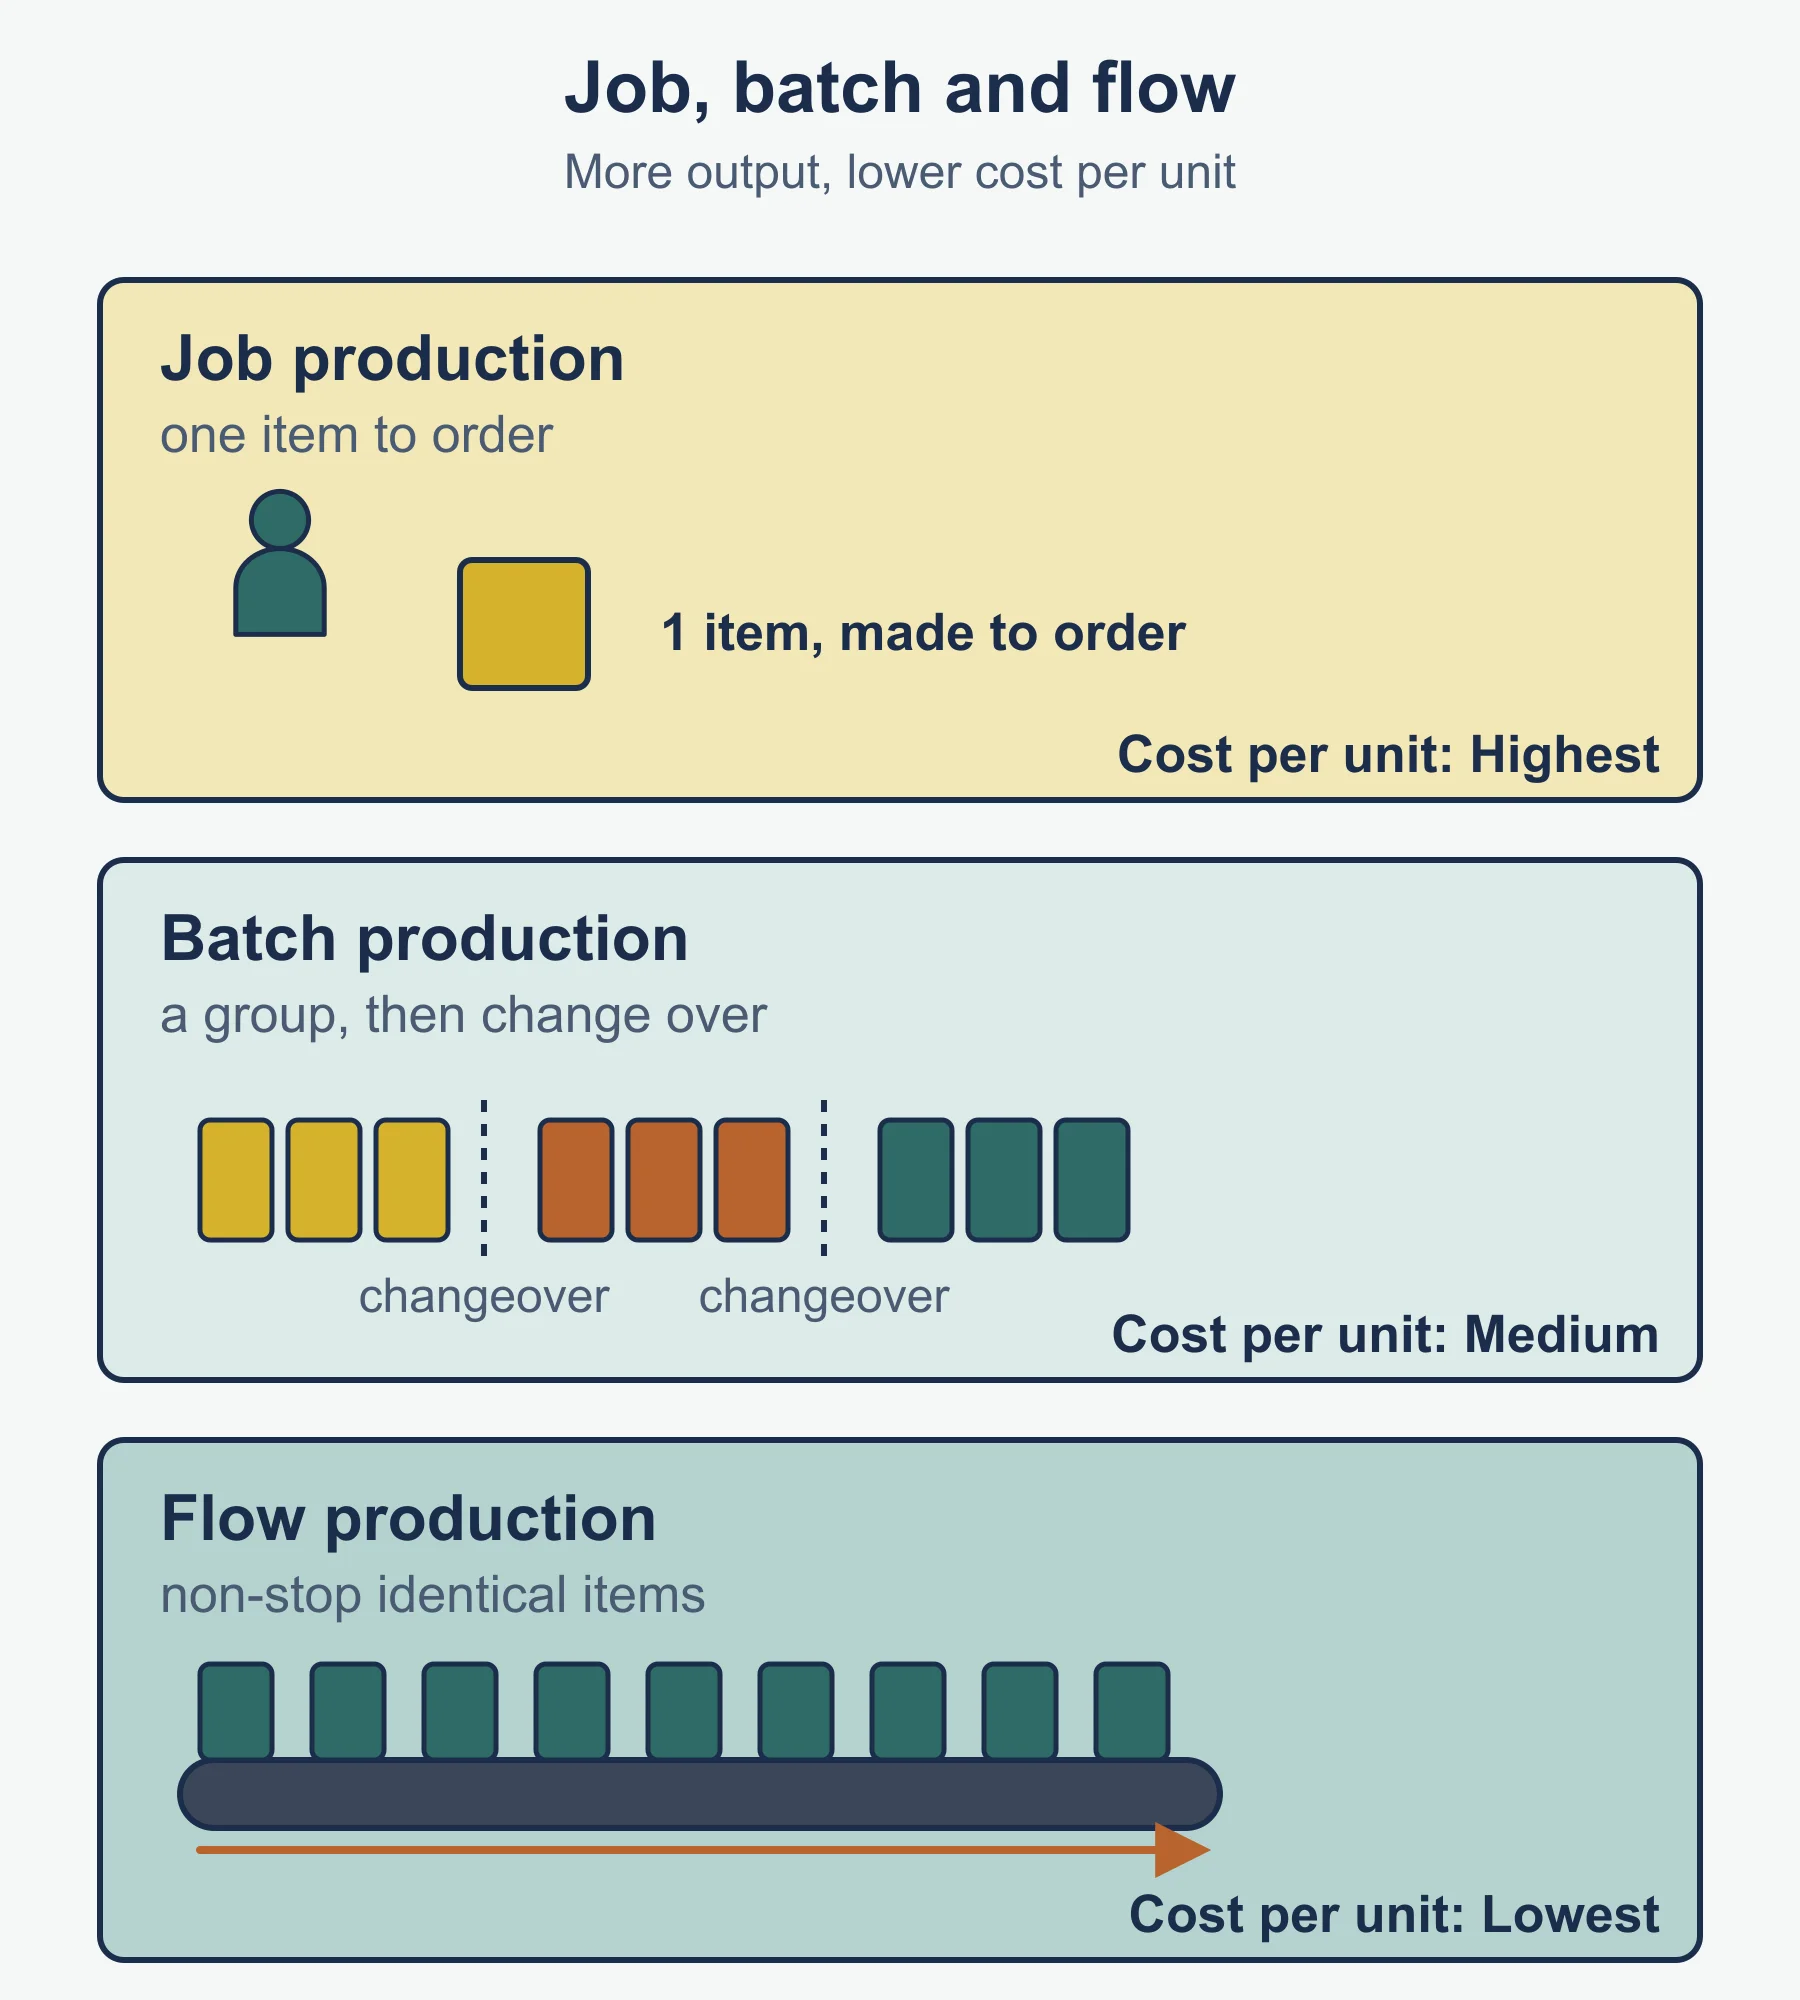
3. Types of production process (5.2.1)
| Process | What is made | Typical features |
|---|---|---|
| Job | One item at a time to a customer’s order | Skilled workers, high price, very flexible, slow |
| Batch | A group of identical items, then the equipment is changed for the next group | Some variety, some cost saving, stops between batches |
| Flow | Continuous production of standardised items, often on an assembly line | Large output, low unit cost, inflexible, high set-up cost |
Invented examples: Corrigan Joinery builds a single fitted wardrobe to a customer’s measurements (job). Sellars Bakery bakes 300 rolls of one recipe, cleans down and then bakes 300 of the next (batch). Penhallow Water runs a bottling line that fills and caps bottles all day with little stopping (flow).
The impact of different types of production
Judge each type against the same questions: unit cost, flexibility, quality, speed and effect on workers.
- Job. Unit cost is high and each item takes longer. It suits customers who want something individual and will pay for it, and the work can be rewarding for skilled workers. Quality can be very high but depends on the individual.
- Batch. Unit cost is lower than job because equipment and ingredients are bought in larger amounts. The business can switch products, but time is lost changing between batches and stock builds up.
- Flow. Unit cost is lowest at high output, so a business can lower its price. Capital cost is high and a fault can stop the whole line. It cannot easily change the product, and repetitive tasks can reduce motivation.
The best choice depends on demand. A business that sells very few units of many different products would struggle to justify flow production.
4. Labour and capital intensive production (5.2.1)
- Labour intensive production uses a high proportion of workers compared with machinery, so labour is the largest part of total costs. A hand-finished leather workshop is an example.
- Capital intensive production uses a high proportion of machinery and technology compared with workers, so spending on capital is the larger part of costs. An automated canning line is an example.
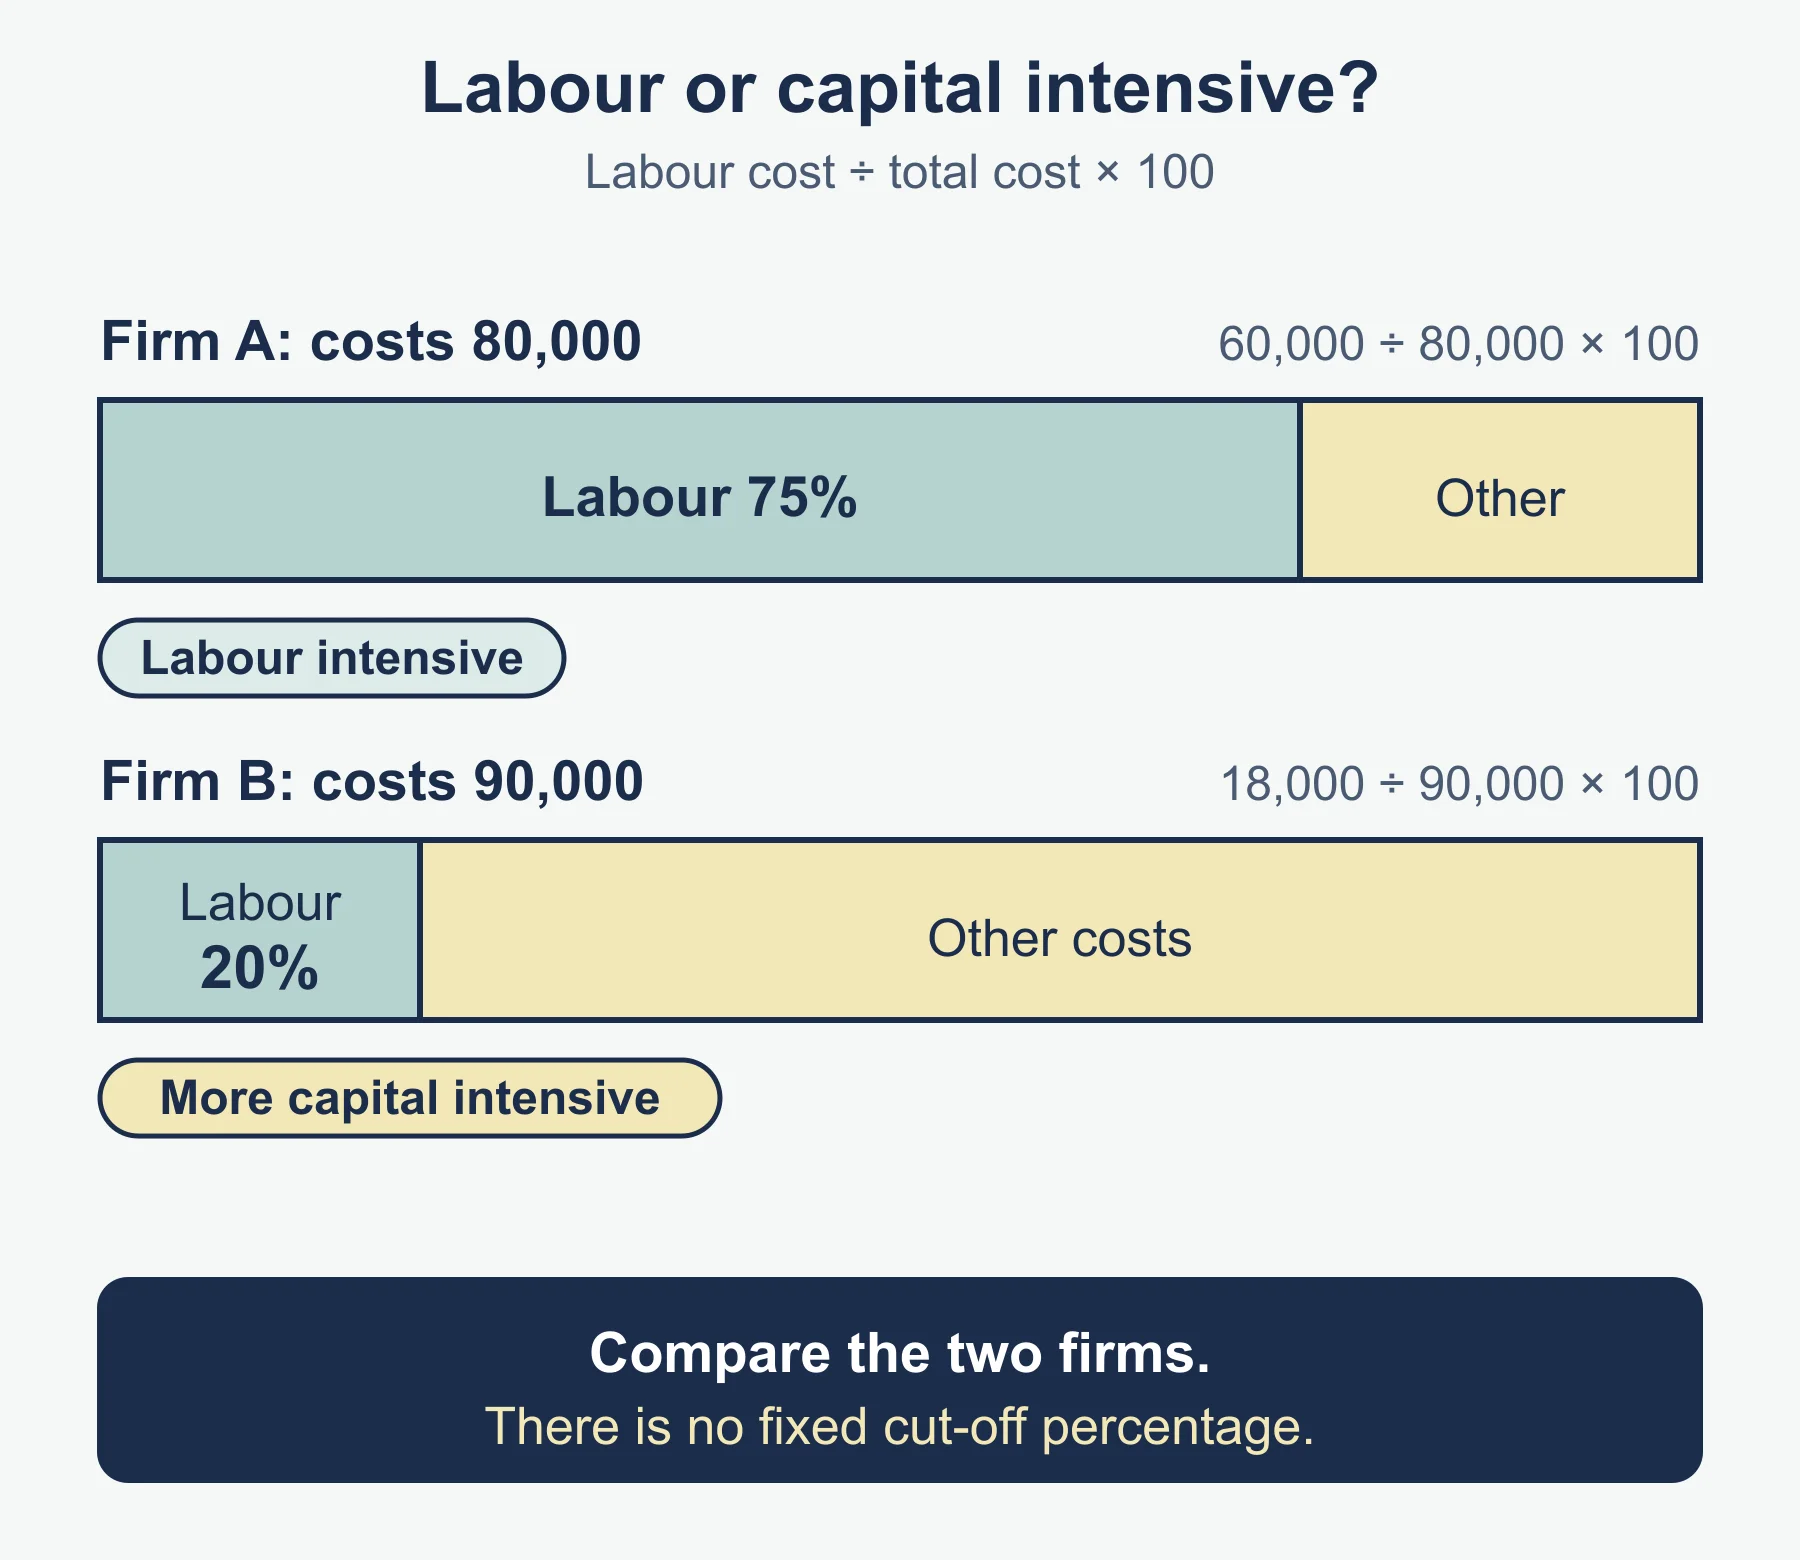
The specification gives no formula for capital or labour intensity, so a simple test, in standard form rather than the board’s own wording, is the share of labour cost in total cost: labour cost ÷ total cost × 100. Using invented figures, Firm A has labour costs of 60,000 out of total costs of 80,000: 60,000 ÷ 80,000 × 100 = 75%, so it is labour intensive. Firm B has labour costs of 18,000 out of 90,000: 18,000 ÷ 90,000 × 100 = 20%, so it is more capital intensive. The specification gives no cut-off percentage, so compare the two sides rather than quoting a fixed rule.
Impact: labour intensive firms are flexible and can offer personal service, but wages rise over time and output per worker is limited. Capital intensive firms can produce large volumes at low unit cost, but they need finance up front and have high fixed costs, so they are exposed if demand falls.
5. Productivity (5.2.1)
The specification does not print a formula, so use the standard form:
productivity = output ÷ number of inputs (for labour productivity, output ÷ number of workers)
State the time period (per week, per hour) and the unit (garments per worker).
Worked example
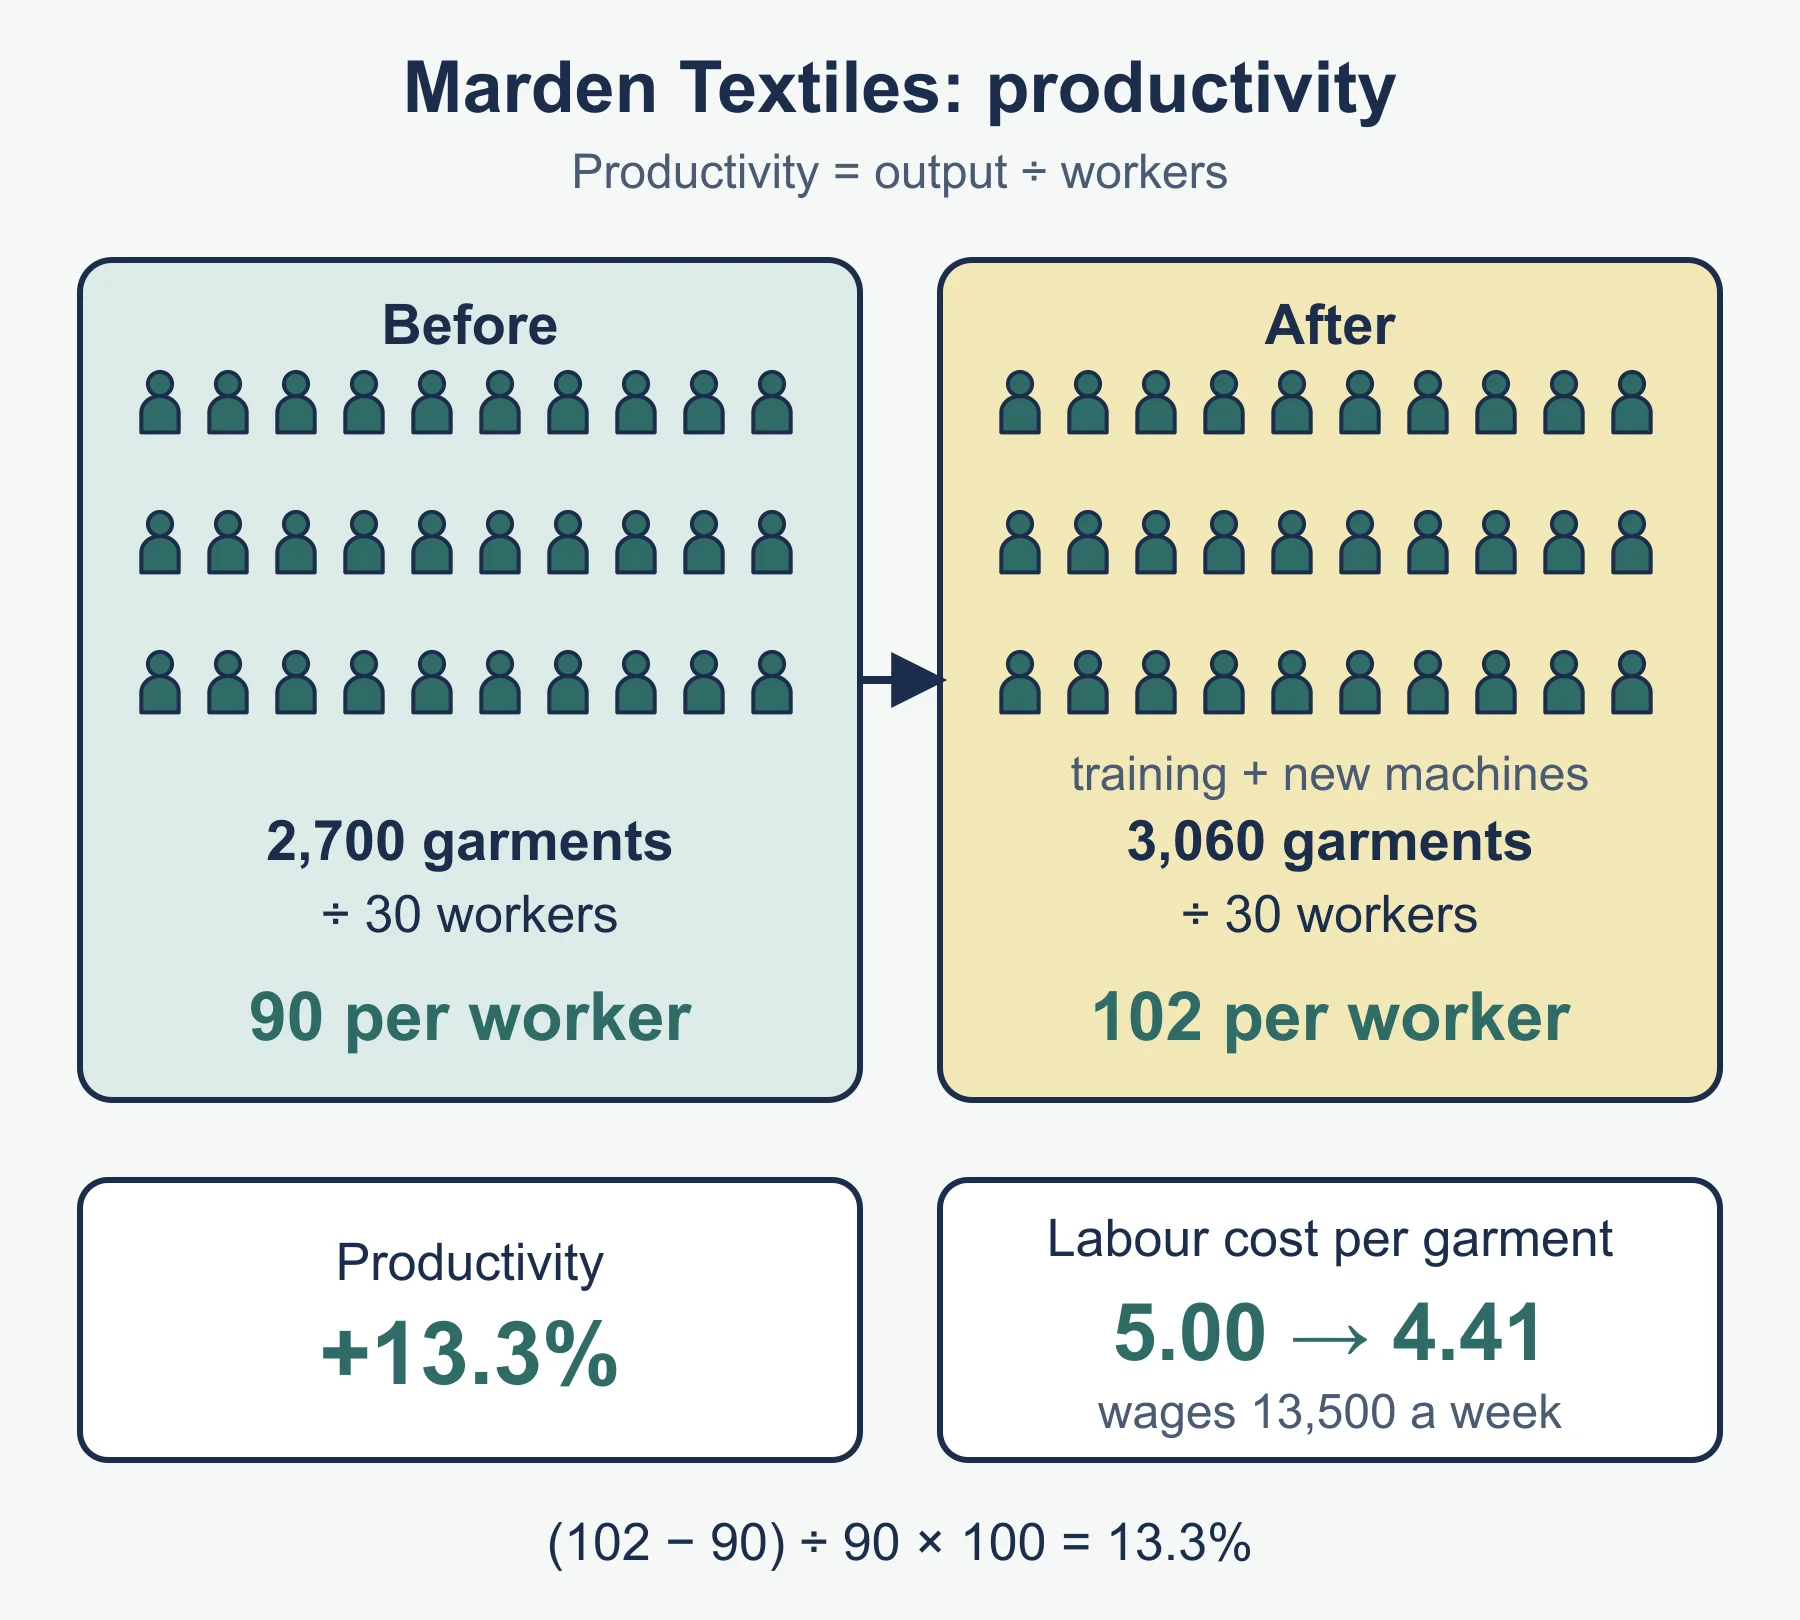
Marden Textiles has 30 workers and makes 2,700 garments a week.
- Productivity before: 2,700 ÷ 30 = 90 garments per worker.
- After training and new sewing machines, the same 30 workers make 3,060 garments: 3,060 ÷ 30 = 102 per worker.
- Percentage change: (102 − 90) ÷ 90 × 100 = 13.3% (to 1 decimal place).
- Impact on cost: each worker is paid 450 a week, so weekly wages are 30 × 450 = 13,500. Labour cost per garment falls from 13,500 ÷ 2,700 = 5.00 to 13,500 ÷ 3,060 = 4.41.
Improving productivity therefore cuts unit costs, which can raise profit or allow lower prices, and gives more output without more staff. If it came from pushing workers harder, it may reduce morale and quality.
6. Lean production (5.2.2)
Lean production aims to produce what customers want with as little waste of time, materials and money as possible.
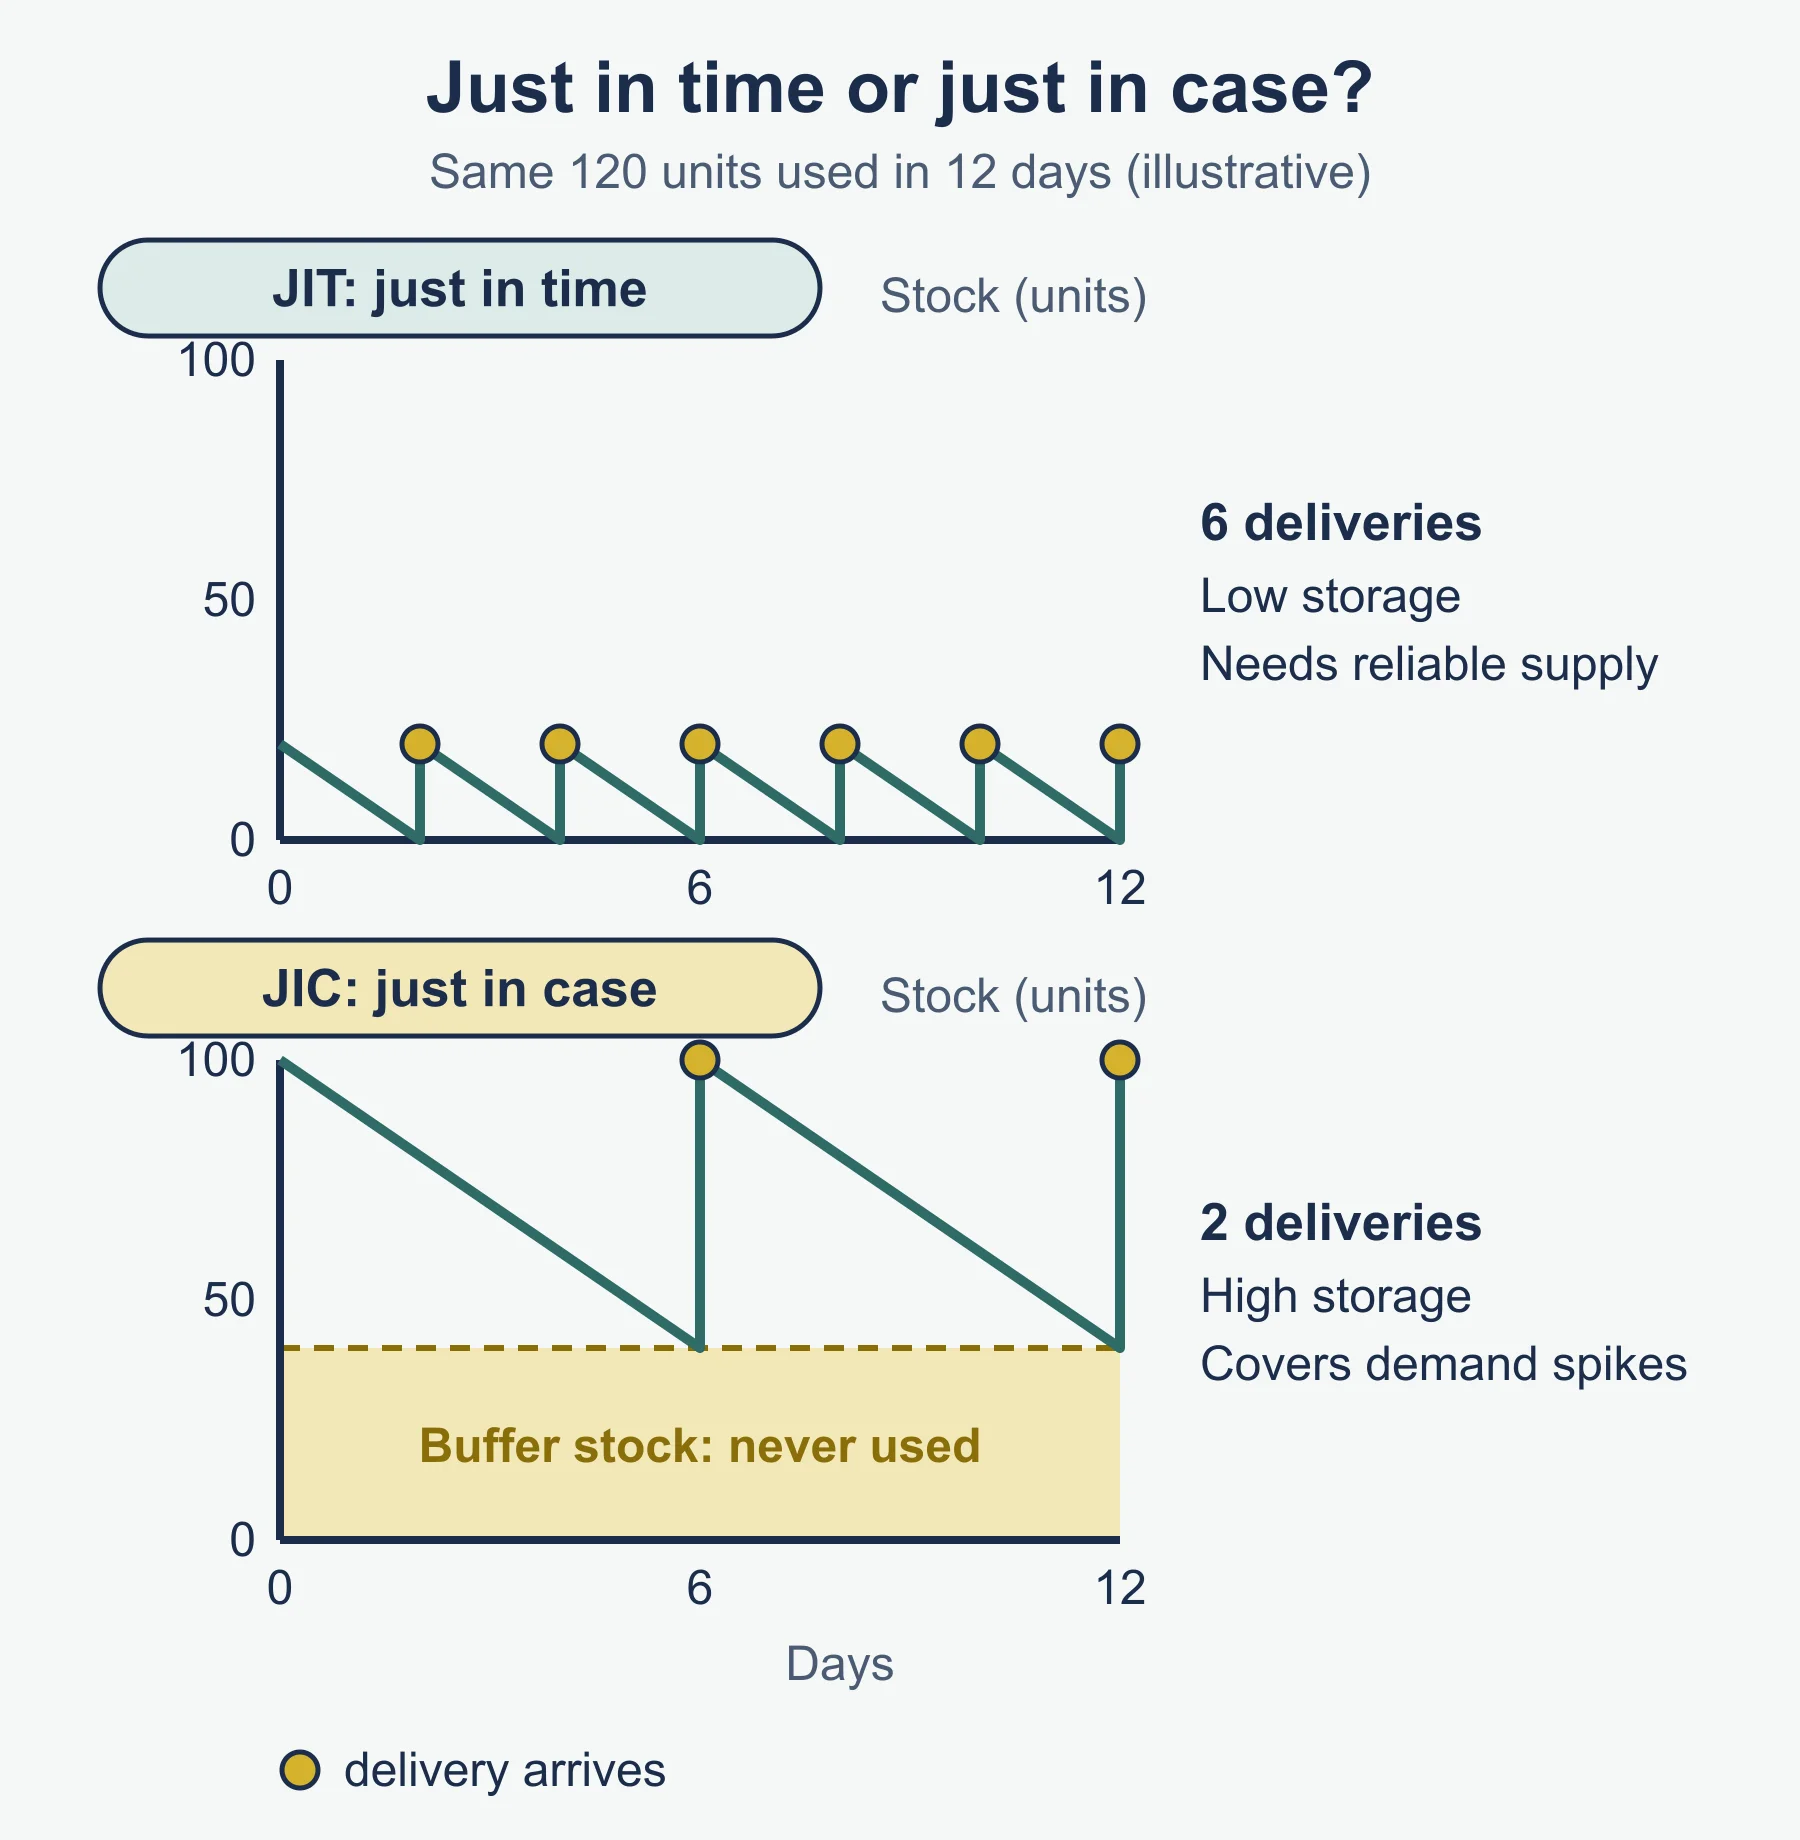
- Just-in-time (JIT): materials arrive from suppliers only when they are needed in production, and finished goods go out quickly. Benefits: little money tied up in stock, lower storage costs, less waste from damaged or out-of-date stock. Risks: one late delivery can stop production, there is little spare stock if demand jumps, and it needs reliable suppliers and good planning.
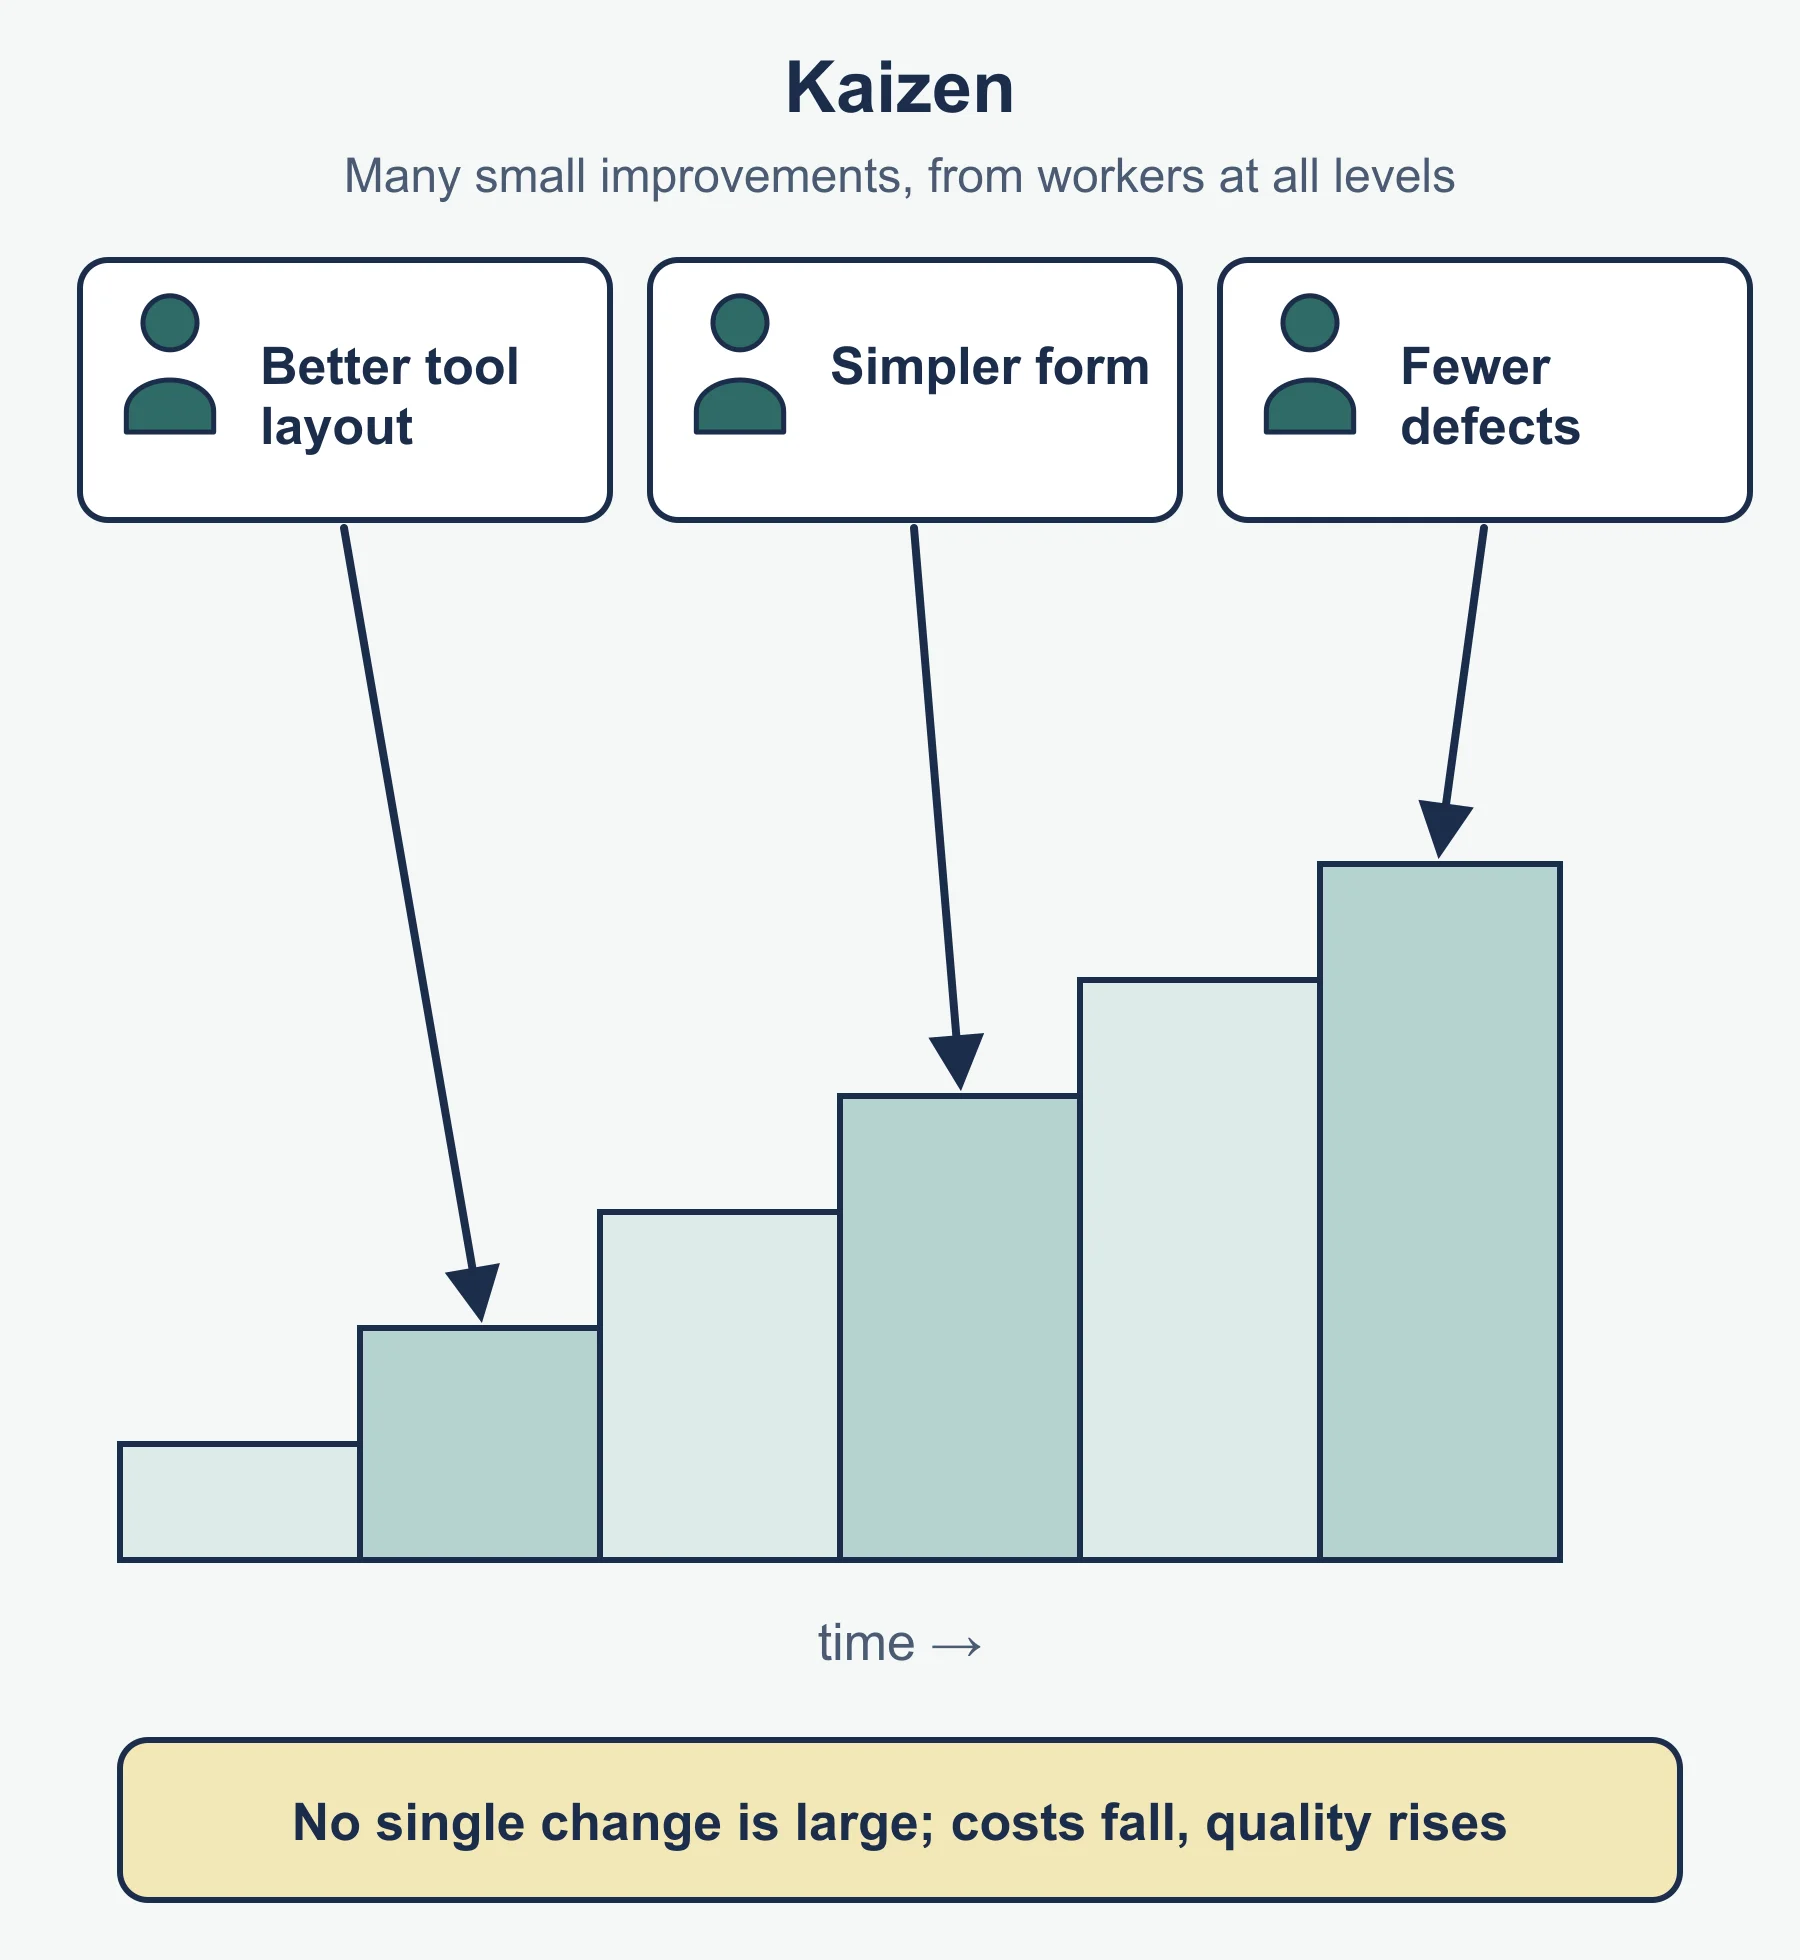
- Kaizen: continuous improvement. Everyone, including shop-floor workers, makes many small, regular suggestions to improve how work is done. Benefits: lower waste, better quality, involved and motivated workers. Risks: gains from each change are small, and it needs time for meetings and training and a management team that listens.
- The importance of using resources effectively: resources are limited and cost money, so wasting materials, time, energy or space raises unit costs. Using them well lets a business keep prices low, protect profit and be more environmentally friendly, which supports its competitive position.
7. Technology and robotics (5.2.3)
Robotics means machines that perform tasks automatically, such as welding, packing or moving parts. They make the business more capital intensive.
Balance four things:
| Factor | Robotics can help | Robotics can hurt |
|---|---|---|
| Cost | Lower labour cost per unit | High purchase, installation and maintenance cost |
| Productivity | More output per worker, 24-hour running | Breakdowns stop output |
| Quality | Consistent, fewer errors | Poor programming repeats a fault many times |
| Flexibility | Reprogramming can switch tasks | Less flexible than people for custom work |
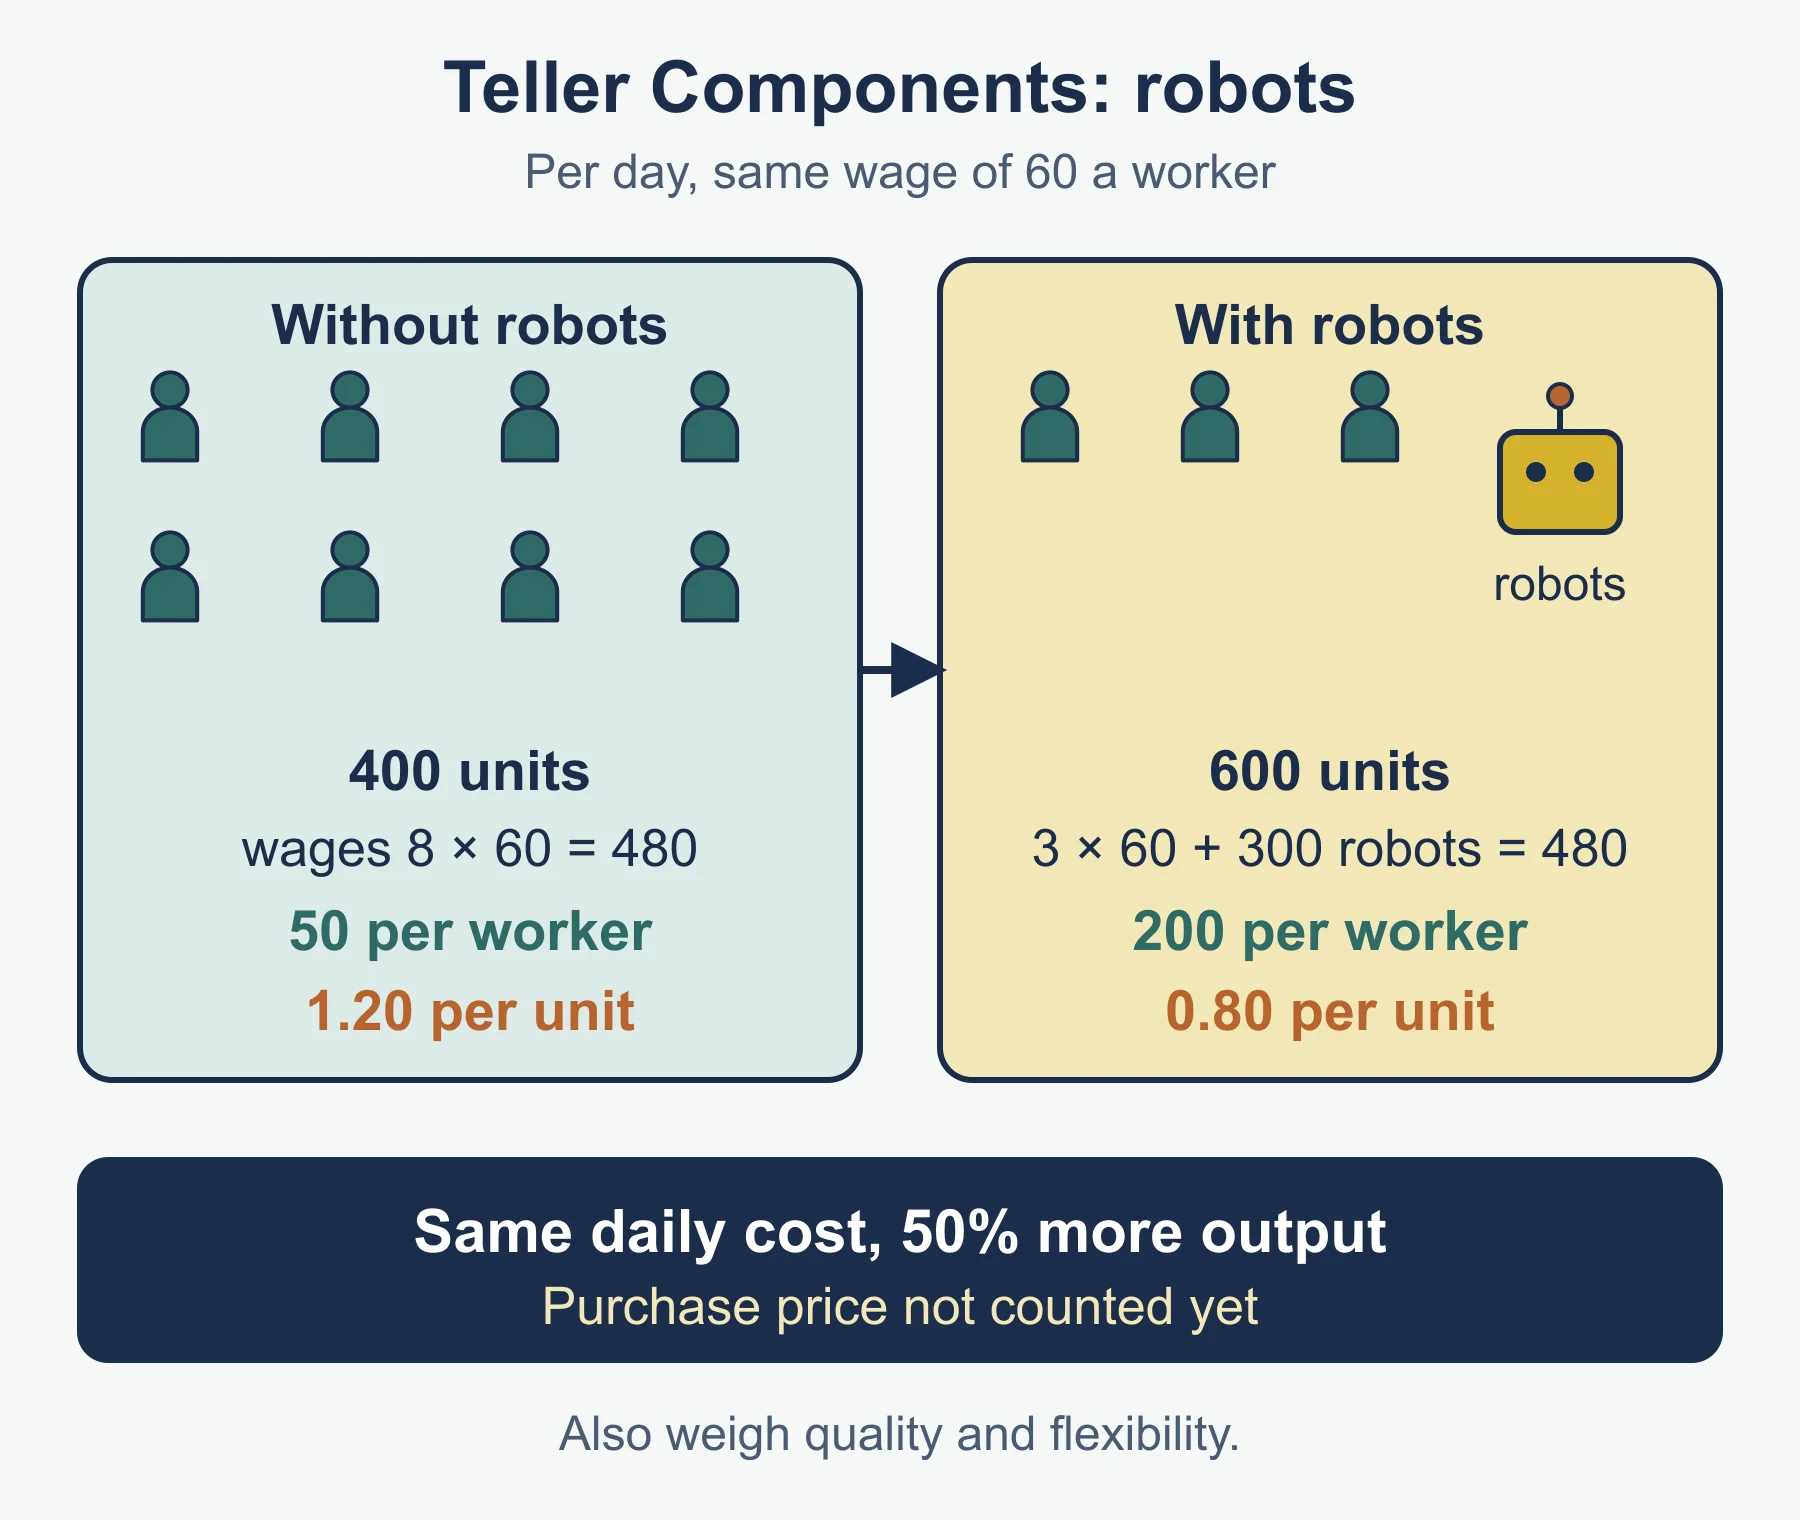
Worked example: Teller Components has 8 workers making 400 units a day, so productivity is 400 ÷ 8 = 50 units per worker. Daily wages are 8 × 60 = 480, which is 480 ÷ 400 = 1.20 per unit. With robots, 3 workers make 600 units and the robots cost 300 a day to run. Productivity is 600 ÷ 3 = 200 per worker. Daily cost is 3 × 60 + 300 = 480, which is 480 ÷ 600 = 0.80 per unit. This ignores the purchase price, so a full judgement must include it, along with quality and flexibility.
Common errors
- Describing a diseconomy as any rise in cost; it must be average total cost rising with output.
- Confusing internal economies (from the firm’s own growth) with external ones (from outside factors).
- Writing “job production is cheap”; it is usually the highest unit cost.
- Dividing productivity by cost instead of by workers or another input.
- Calling JIT “no stock at all” without noting the risk of supplier delay.
- Giving only advantages of robotics when asked to weigh factors.
Frequently asked questions
What is the difference between labour intensive and capital intensive production? Labour intensive production uses a high proportion of workers compared with machinery, so labour is the largest part of costs. Capital intensive production uses a high proportion of machinery and technology compared with workers.
What are the limits to business growth? Besides diseconomies of scale, growth can be limited by the size of the market, the finance available and the owner’s wish to stay in control.
Why does improving productivity matter? Higher productivity cuts unit costs, which can raise profit or allow lower prices, and gives more output without more staff. If it comes from pushing workers harder, morale may suffer.
Is job production cheap? No. Job production usually has the highest unit cost because skilled workers make one item at a time to a customer’s order, but it is very flexible and can give very high quality.
Official syllabus
Pearson Edexcel International GCSE in Business (4BS1), Specification, Issue 2, February 2026, published by Pearson Education Limited. Topic 5: Business operations, sections 5.1 Economies and diseconomies of scale (5.1.1 and 5.1.2) and 5.2 Production (5.2.1, 5.2.2 and 5.2.3).
Get free revision emails (optional)
Occasional emails with practice questions, worked explanations and links to free resources for the qualification and subjects you choose. No spam, and you can unsubscribe from any email. The free tools on this site never need an email.
Related resources
-
Practice questions
Edexcel IGCSE Business: Economies and diseconomies of scale, and production (4BS1) – Practice Questions
Original Edexcel IGCSE Business practice questions with worked answers on scale, production types, productivity, lean production and robotics.
Business · Pearson Edexcel · IGCSE
Try questions -
Revision notes
Edexcel IGCSE Business: Economies and diseconomies of scale, and production (4BS1) – Revision Notes
Condensed Edexcel IGCSE Business revision notes on scale, production types, productivity, JIT, Kaizen and robotics, with a self-test and common errors.
Business · Pearson Edexcel · IGCSE
Revise topic -
Study guides
Edexcel IGCSE Business: Factors of production and quality (4BS1)
Study guide to factors of production, capital and labour intensity, quality control and TQM for Edexcel IGCSE Business (4BS1), with worked examples.
Business · Pearson Edexcel · IGCSE
Read guide
Related articles
-
teaching
A Level tuition in Dubai: Cambridge or Pearson Edexcel International A Level?
Schools in Dubai and Abu Dhabi teach either Cambridge International AS & A Level or Pearson Edexcel International A Level. How the two are structured, why it matters for tuition, and how online classes from Lahore work.
9 October 2026
-
curriculum guides
Choosing subjects at IGCSE and A Level
How subject choices at 14 and 16 affect university options later, and how to keep pathways open without overloading a timetable.
28 July 2026
Studying this with a teacher
Working through Business IGCSE?
This page is free and stays free. If you would rather be taught it, Marlbridge runs Business classes one-to-one and in small groups of up to 15, online in your own time zone. The first trial class is free. WhatsApp replies within an hour (8am–11pm Pakistan time, every day); email the same day.
Pearson Edexcel Business teachers at Marlbridge

