
Study Guides
Edexcel IGCSE Business: Market research and the market (4BS1)
Study guide to market research methods, data and the market for Edexcel International GCSE Business, with worked examples and common errors.
- Subject
- Business
- Level
- IGCSE
- Topic
- Marketing
- Author
- Marlbridge Academic Team
- Updated
- Reviewed by
- Asif Iqbal (what this means)
Aligned to Pearson Edexcel IGCSE Business (4BS1), Issue 2, February 2026. Official specification .
Syllabus page (what it covers and how it is assessed): Pearson Edexcel IGCSE Business.
Syllabus points this page covers
4BS1
- 4 Marketing (whole topic)
- 4.1 Market research
- 4.2 The market
Found an error? Report a correction.
Want a teacher for this? Marlbridge teaches Business online. Request a free trial class.
This guide follows the Pearson Edexcel International GCSE in Business (4BS1) specification, Issue 2, February 2026. It covers Topic 4, Marketing: section 4.1 Market research (4.1.1 to 4.1.3) and section 4.2 The market (4.2.1 to 4.2.3). The marketing mix is section 4.3 and is not covered here. Paper 1 uses a small business (up to 49 employees) and Paper 2 a large business (more than 250 employees). Both papers can draw on the whole content.
Course links: the Edexcel IGCSE Business hub, the printable checklist and the free diagnostics. Companion pages: the revision notes and the practice questions.
What the specification asks for
| Point | You must be able to | Where in this guide |
|---|---|---|
| 4.1.1 | Explain the purpose of market research | Section 1 |
| 4.1.2 | Describe primary methods (survey, questionnaire, focus group, observation, test marketing) and secondary methods (internet, market reports, government reports) | Section 2 |
| 4.1.3 | Use qualitative and quantitative data; explain the role of social media; judge the reliability of data | Section 3 |
| 4.2.1 | Explain why marketing matters: customer needs, relationships, loyalty, market and product orientation, market share and analysis, niche and mass marketing | Sections 4 and 5 |
| 4.2.2 | Explain how a business responds to changing customer needs, changing spending patterns and increased competition | Section 6 |
| 4.2.3 | Explain how businesses use market segmentation (location, demographics, lifestyle, income, age) | Section 7 |
The strengths and weaknesses of each method, the orientation comparison and the definitions below are standard teaching, not specification text. All businesses named below are invented, and amounts are in dollars.
1. The purpose of market research (4.1.1)
Market research is the collection and analysis of information about customers, competitors and the market. The specification lists four purposes.
- To identify and understand customer needs. What do people want, how much will they pay, where and how do they like to buy?
- To identify gaps in the market. A gap is a want that no existing product meets well. A bakery that finds nobody nearby sells gluten-free bread has found one.
- To reduce risk. Launching a product is expensive. Research does not remove the risk, but it replaces guesses with evidence.
- To inform business decisions. Price, product design, where to open and how much stock to order are all easier to justify with evidence.
In an answer, link the purpose to the scenario: “Harlow Bakes would buy a second oven before knowing whether customers want sourdough, so research lowers the chance of a costly mistake.”
2. Methods of market research (4.1.2)
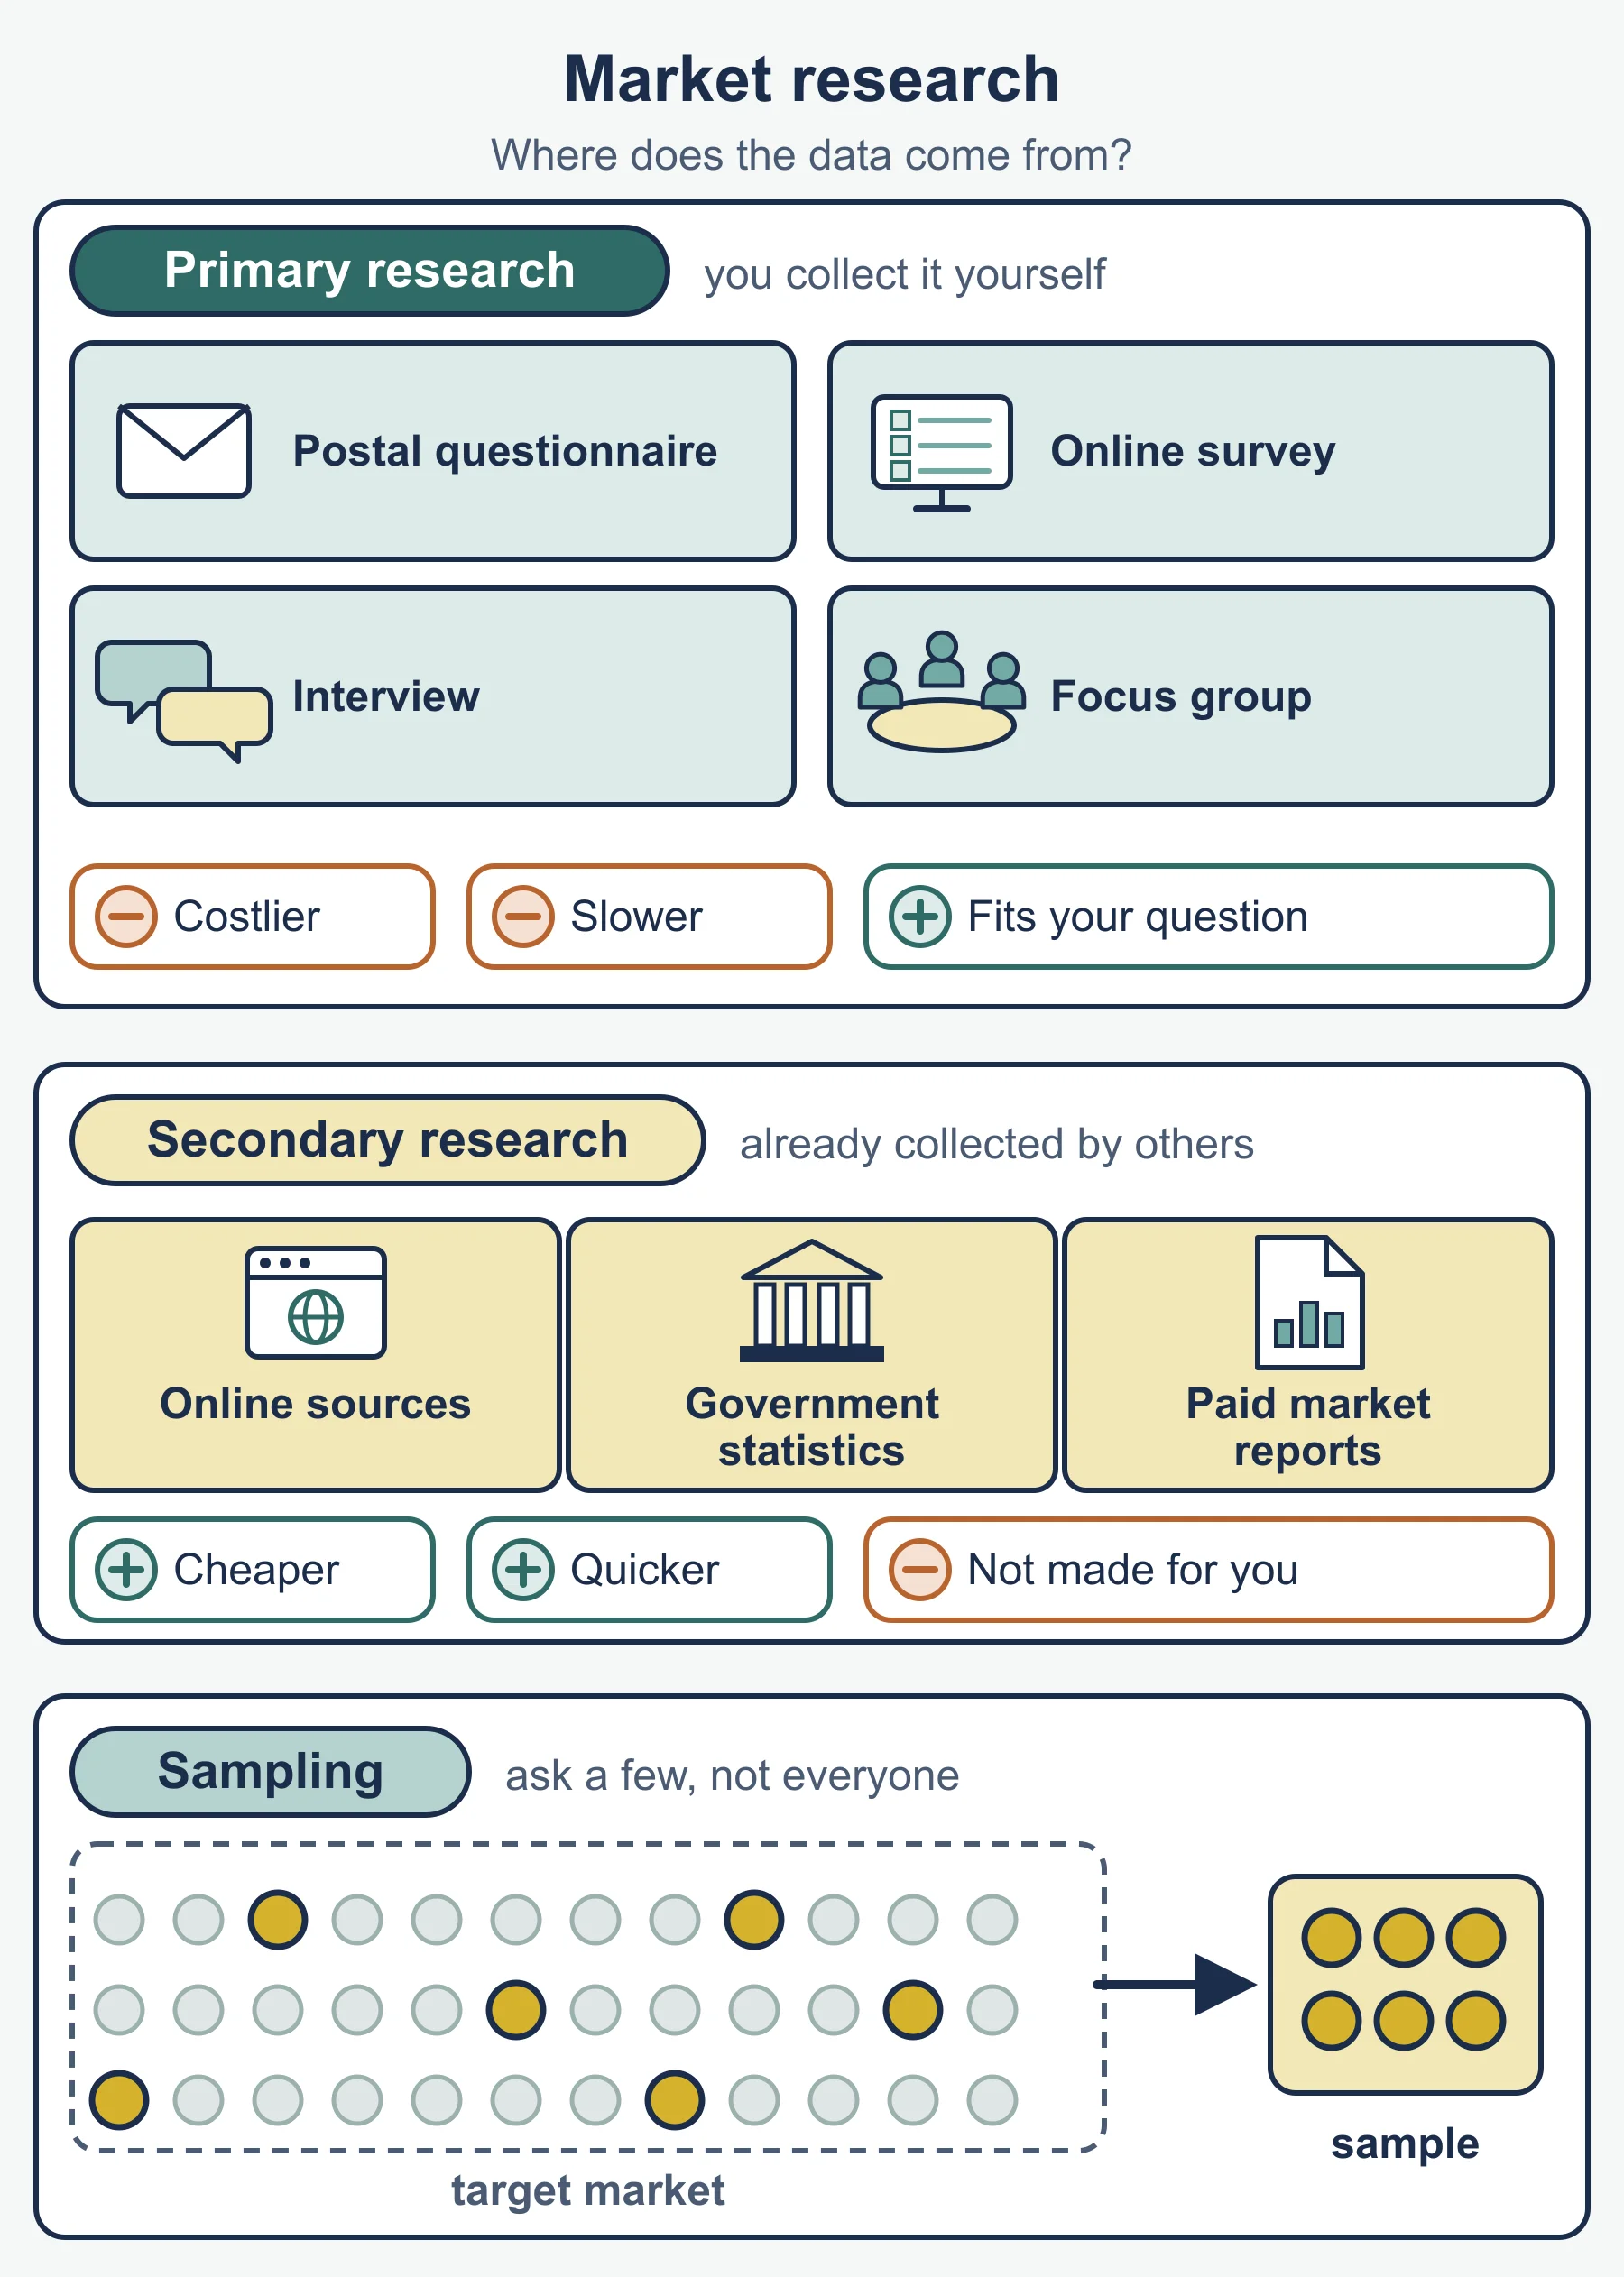
Primary research is collected first-hand for the business’s own purpose. Secondary research uses information that already exists, collected by someone else.
Primary methods
| Method | What it is | Strength | Weakness |
|---|---|---|---|
| Survey | Questions put to a sample of people, in person, by phone or online | Reaches many people; results can be counted | Takes time and money; some people give careless answers |
| Questionnaire | A written set of questions that respondents complete themselves | Cheap; the same questions go to everyone | Low response rate; cannot ask follow-up questions |
| Focus group | A small group discussing a product with a leader | Explains why people think as they do | Small sample; strong voices can dominate |
| Observation | Watching what customers actually do, such as which shelf they walk to | Shows real behaviour, not claimed behaviour | Cannot show why they acted that way |
| Test marketing | Selling the product in a limited area or period before a full launch | Tests real buying with real money | Slow, and competitors can see the product early |
In standard usage, a survey is the whole exercise of asking a sample and a questionnaire is the written list of questions used in it. The specification lists both without defining them.
Secondary methods
- Internet: competitor websites, review sites, news and search trends. Quick and often free, but quality varies.
- Market reports: published analyses of an industry, usually produced by research firms. Detailed, but may be expensive and not about your exact customers.
- Government reports: official statistics, for example on population, incomes or spending. Usually trustworthy and wide in scope, but may be out of date or too general.
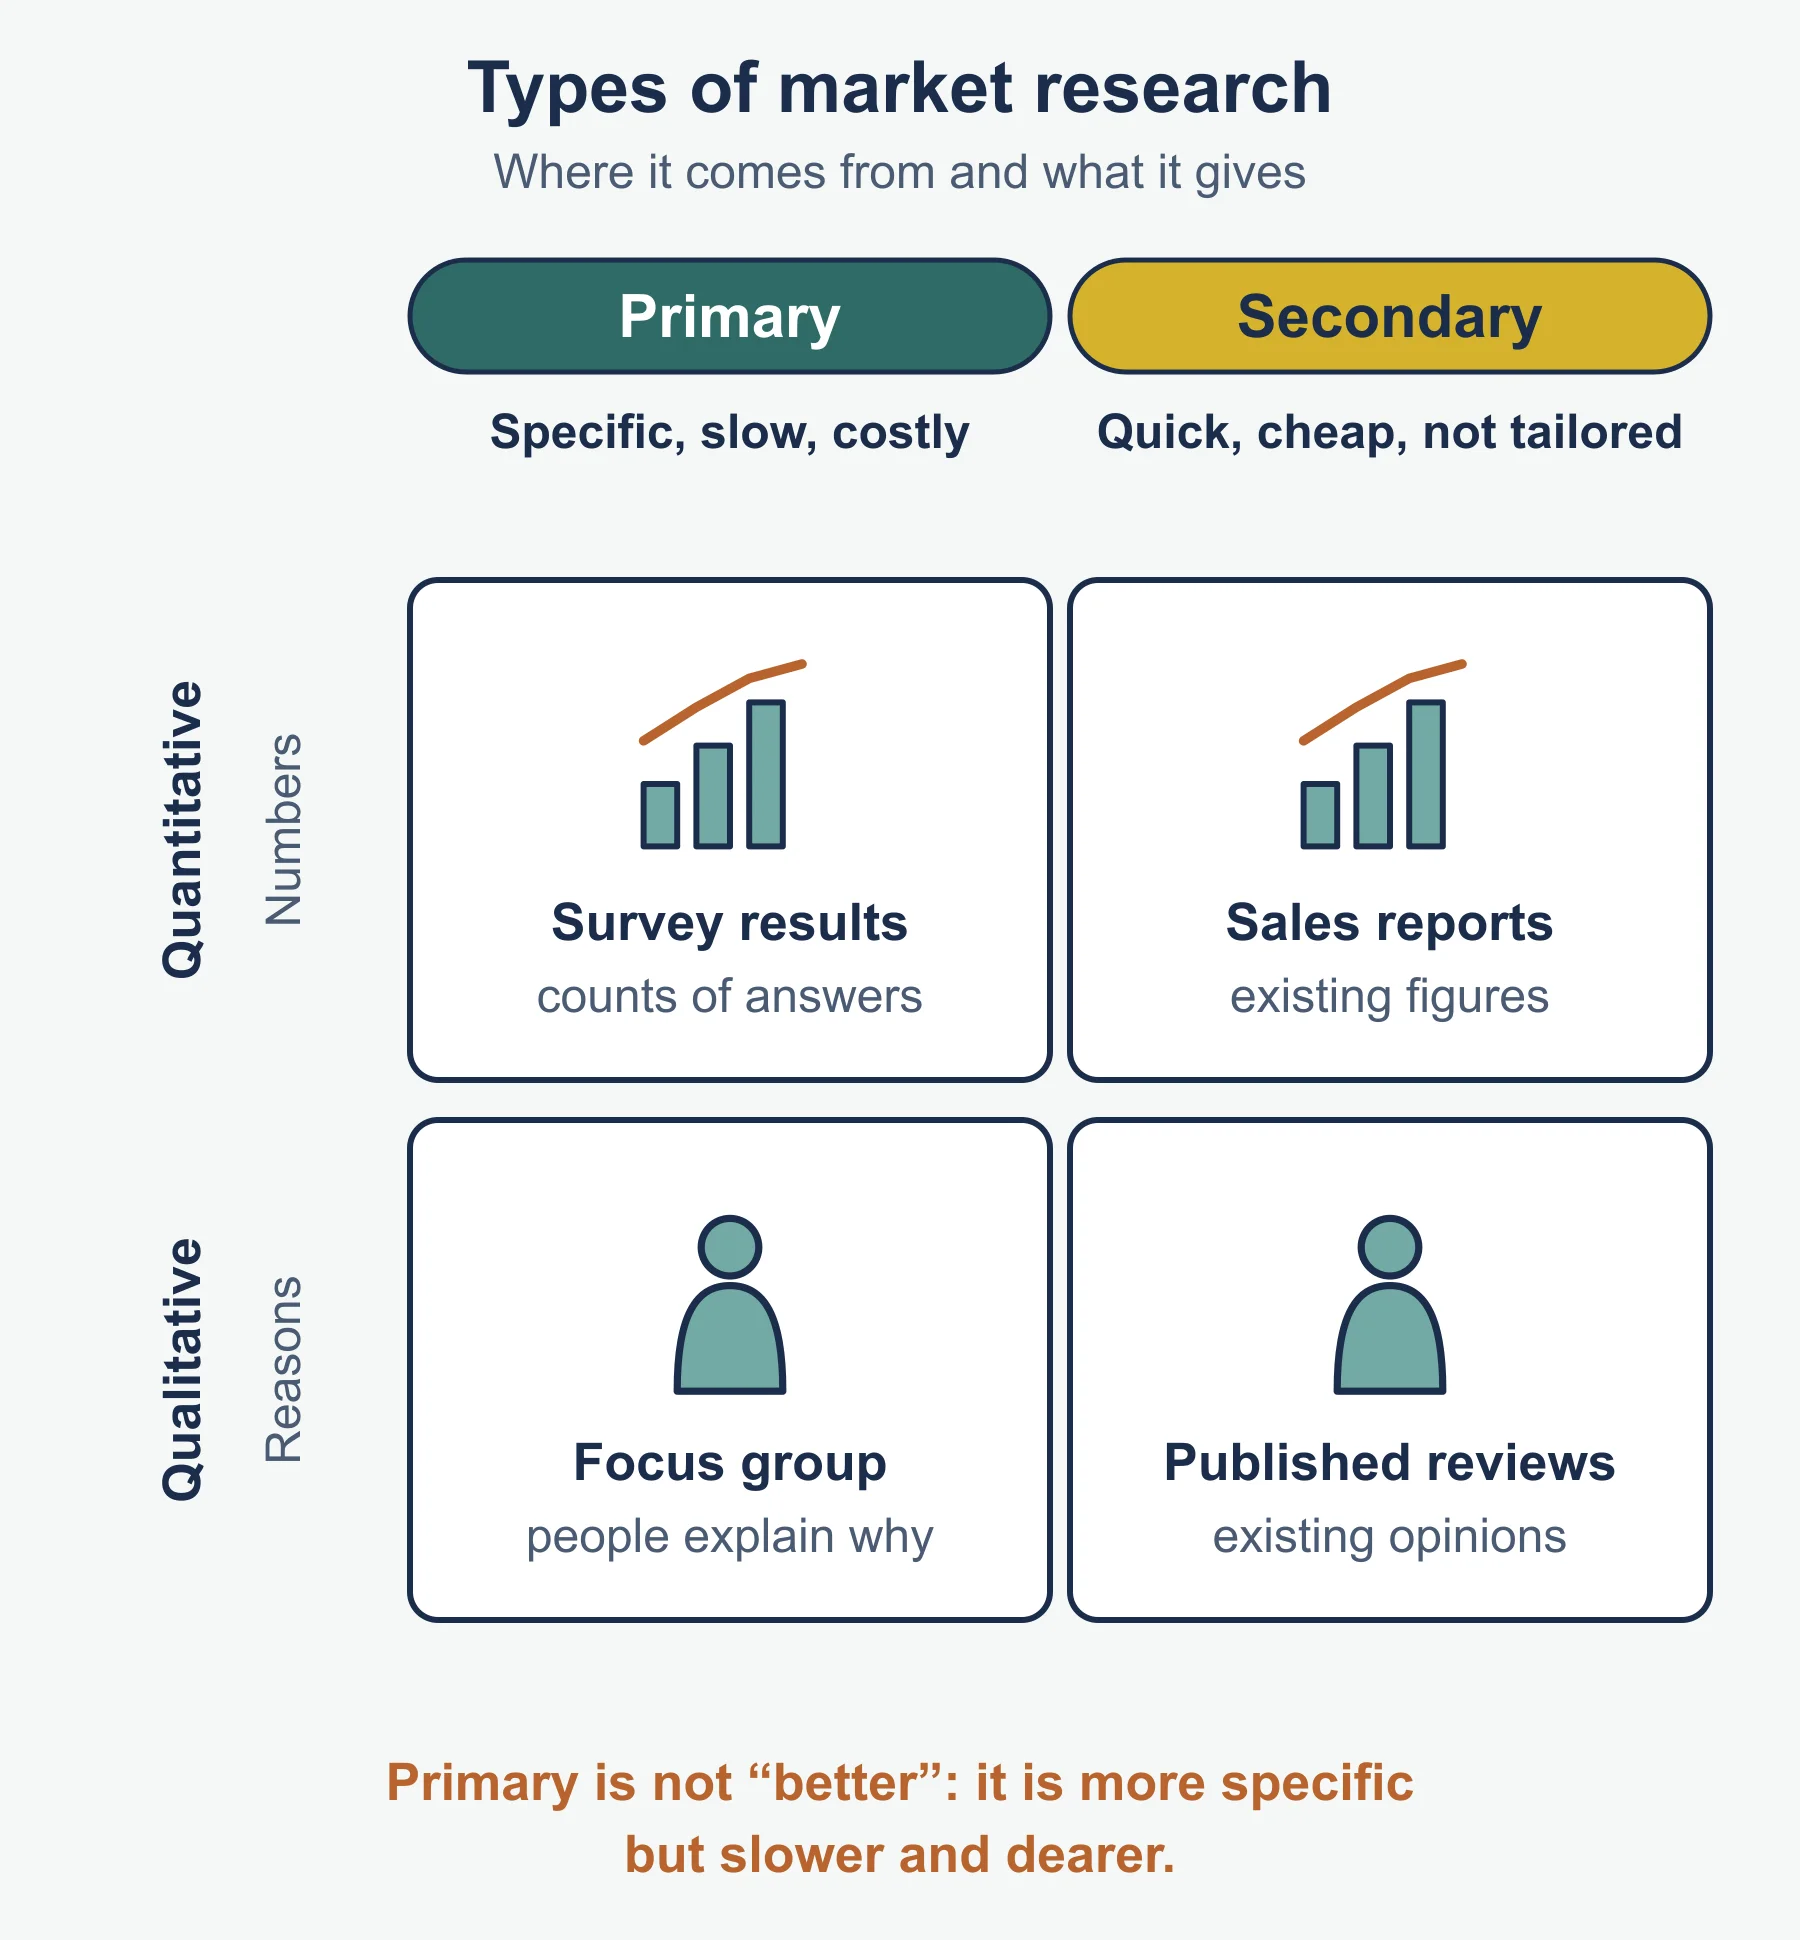
Primary or secondary? Primary data fits the exact question and is not shared with rivals, but costs more and takes longer. Secondary data is cheaper and faster, but was collected for another purpose.
Worked example 1: choosing a method
Harlow Bakes, a small business with 12 employees, is thinking of selling fresh sourdough. The owner has little money and wants an answer in a fortnight. Recommend a method.
- Identify what must be found out: will local people buy sourdough, and at what price?
- Weigh the options. Test marketing costs ingredients and time. A focus group gives opinions from perhaps eight people. A short questionnaire left on the counter is cheap and reaches regular customers.
- Judgement: use a short questionnaire first, because the budget is small and the deadline is short. Try a limited test sale only if replies show enough interest.
3. Using data (4.1.3)
Qualitative and quantitative data
Quantitative data is numerical and can be counted or measured: how many people would buy, average spend, a percentage. Qualitative data is descriptive and records opinions, feelings and reasons, such as “the packaging looks cheap”.
Quantitative data shows how many and how much. Qualitative data shows why. A focus group usually produces qualitative data. A questionnaire with tick-box answers produces quantitative data, and one with open boxes also produces qualitative data.
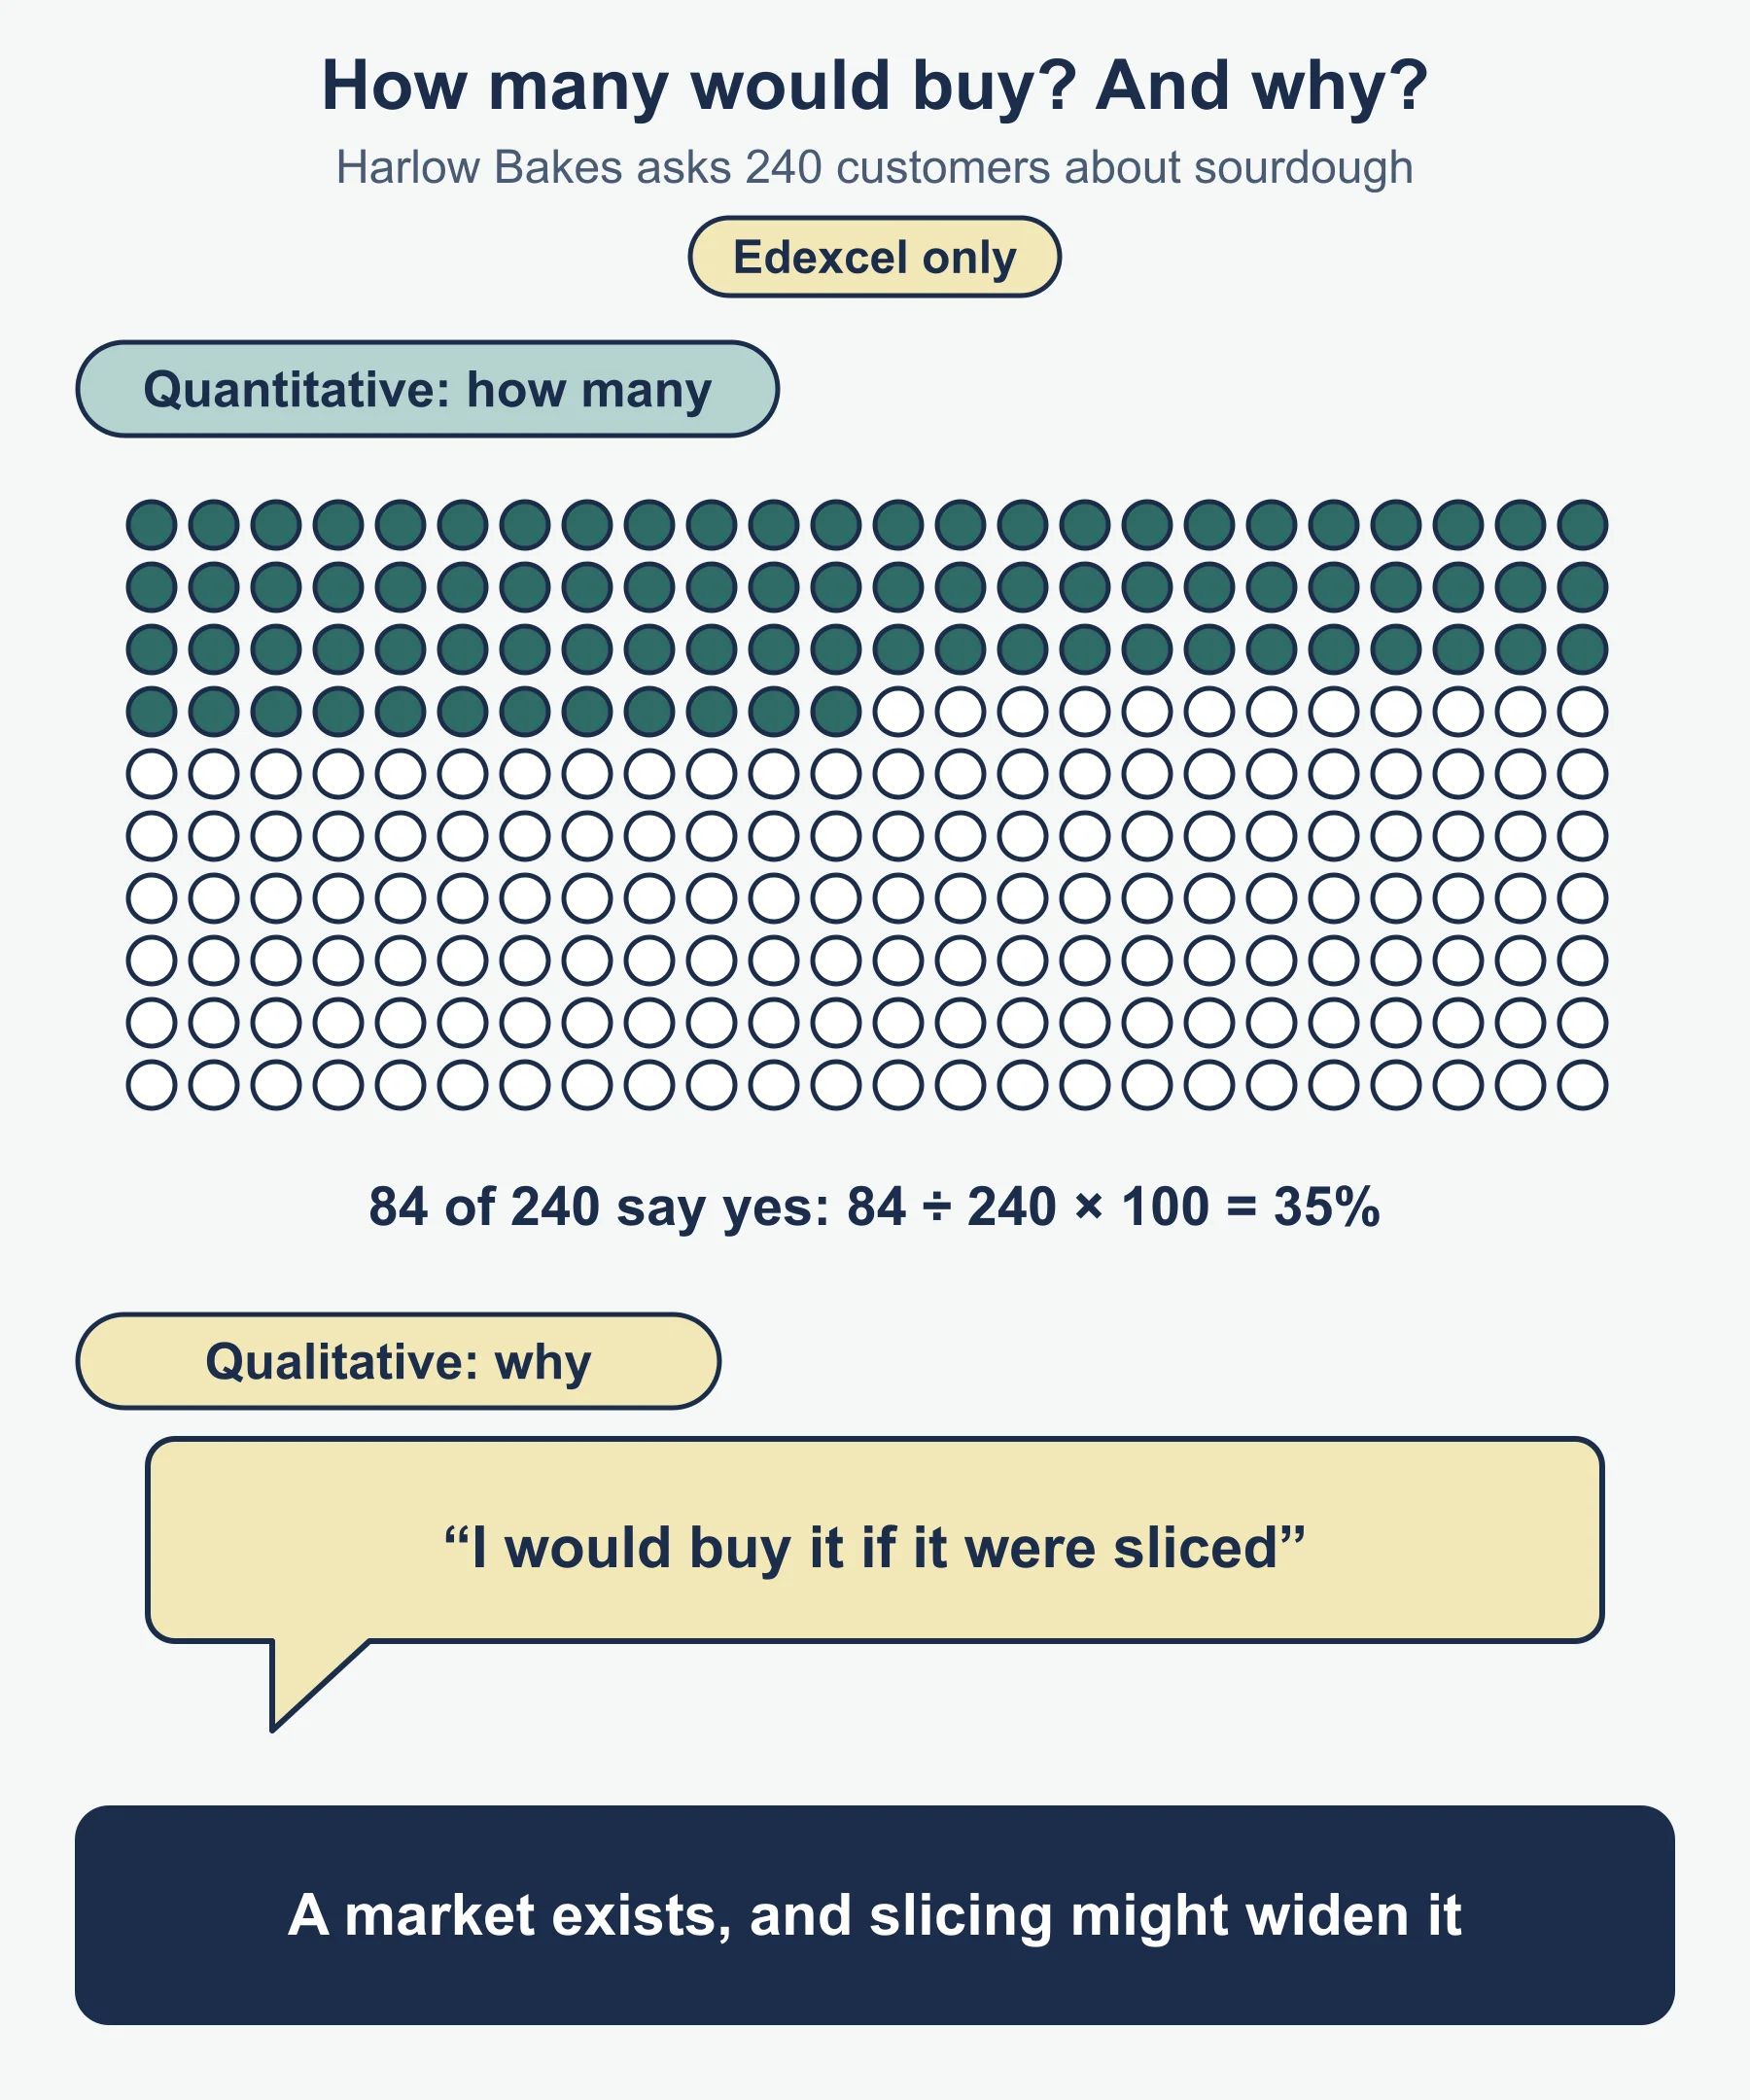
Worked example 2. Harlow Bakes asks 240 customers whether they would buy sourdough weekly. 84 say yes.
Percentage yes = 84 / 240 x 100 = 35%35% is quantitative. A customer comment, “I would buy it if it were sliced”, is qualitative. The two together suggest a market that exists and a feature that might widen it.
The role of social media
Social media can provide market research data cheaply and quickly. A business can run a poll, read comments and reviews, see which posts get most reactions, and see what customers say about competitors. Strengths: low cost, fast results and direct contact with customers. Weaknesses: respondents may not represent all customers, and some accounts may not be real customers.
Reliability of data
Data is reliable when it can be trusted to give a true picture, so that repeating the research would give much the same result. Questions to ask about any data:
- Sample size: are enough people included? Ten people tell you little about a city.
- Representative sample: do the people questioned match the target market in age, income and location?
- Bias: were the questions leading, such as “Don’t you agree our bread is excellent?” Were respondents only the business’s friends?
- Age of data: is it recent? Spending patterns change.
- Source: who collected it, and do they gain from a particular result?
Unreliable data can lead to a wrong decision, such as stocking an unwanted product, which defeats the purpose of reducing risk.
4. Why marketing matters (4.2.1, part 1)
In standard teaching, marketing is how a business identifies, anticipates and satisfies customer needs profitably. The specification names these three reasons it matters.
- Satisfying customer needs: a business that provides what customers want sells more and receives fewer returns.
- Building customer relationships: friendly service, replies to complaints and personal offers make customers feel valued.
- Keeping customer loyalty: repeat customers cost less to serve than winning new ones, and they recommend the business to others.
Market orientation and product orientation
| Market orientation | Product orientation | |
|---|---|---|
| Starting point | What customers want, found through research | What the business can make or already makes |
| Role of research | Central | Limited |
| Risk | Research costs money and customer wants change | Product may not match demand |
| Fits | Competitive markets with changing tastes | A genuinely new product, or one where the maker’s skill is the selling point |
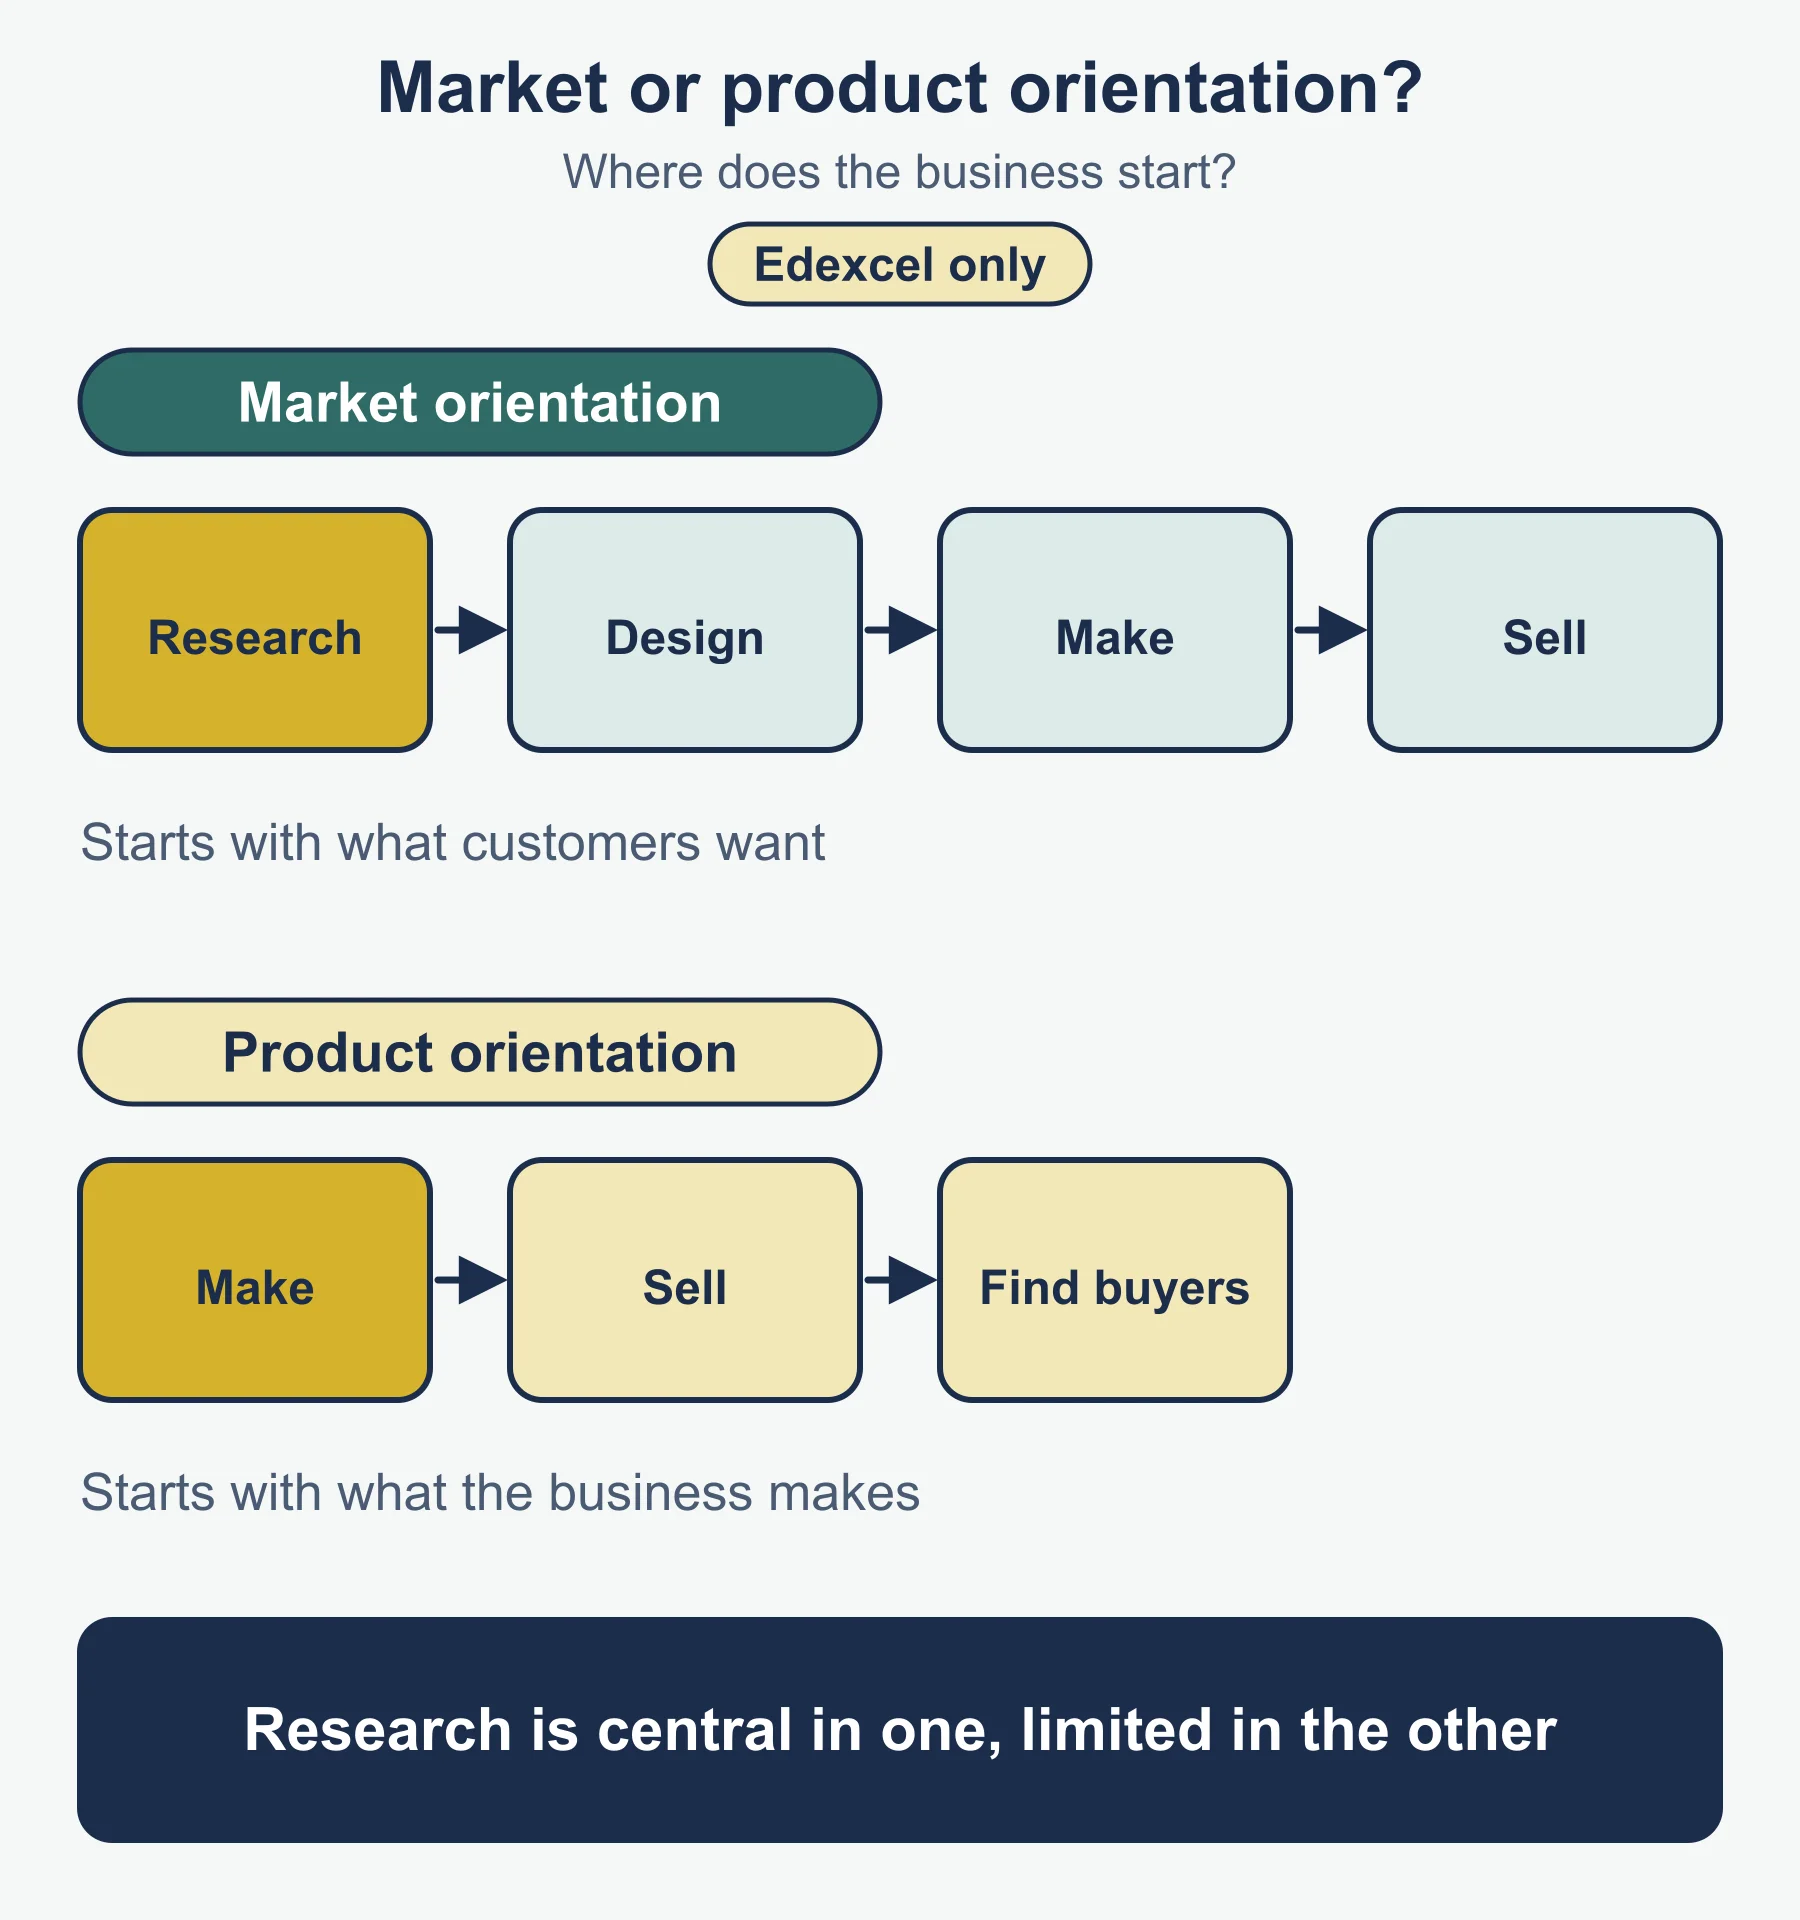
The table is standard teaching. A market-oriented business designs its offer around research results; a product-oriented business makes the product first and then looks for buyers.
5. Market share, analysis, niche and mass marketing (4.2.1, part 2)
Market share and market analysis
Market share is the proportion of total market sales that one business makes. The specification names market share but gives no formula, so this is the standard form:
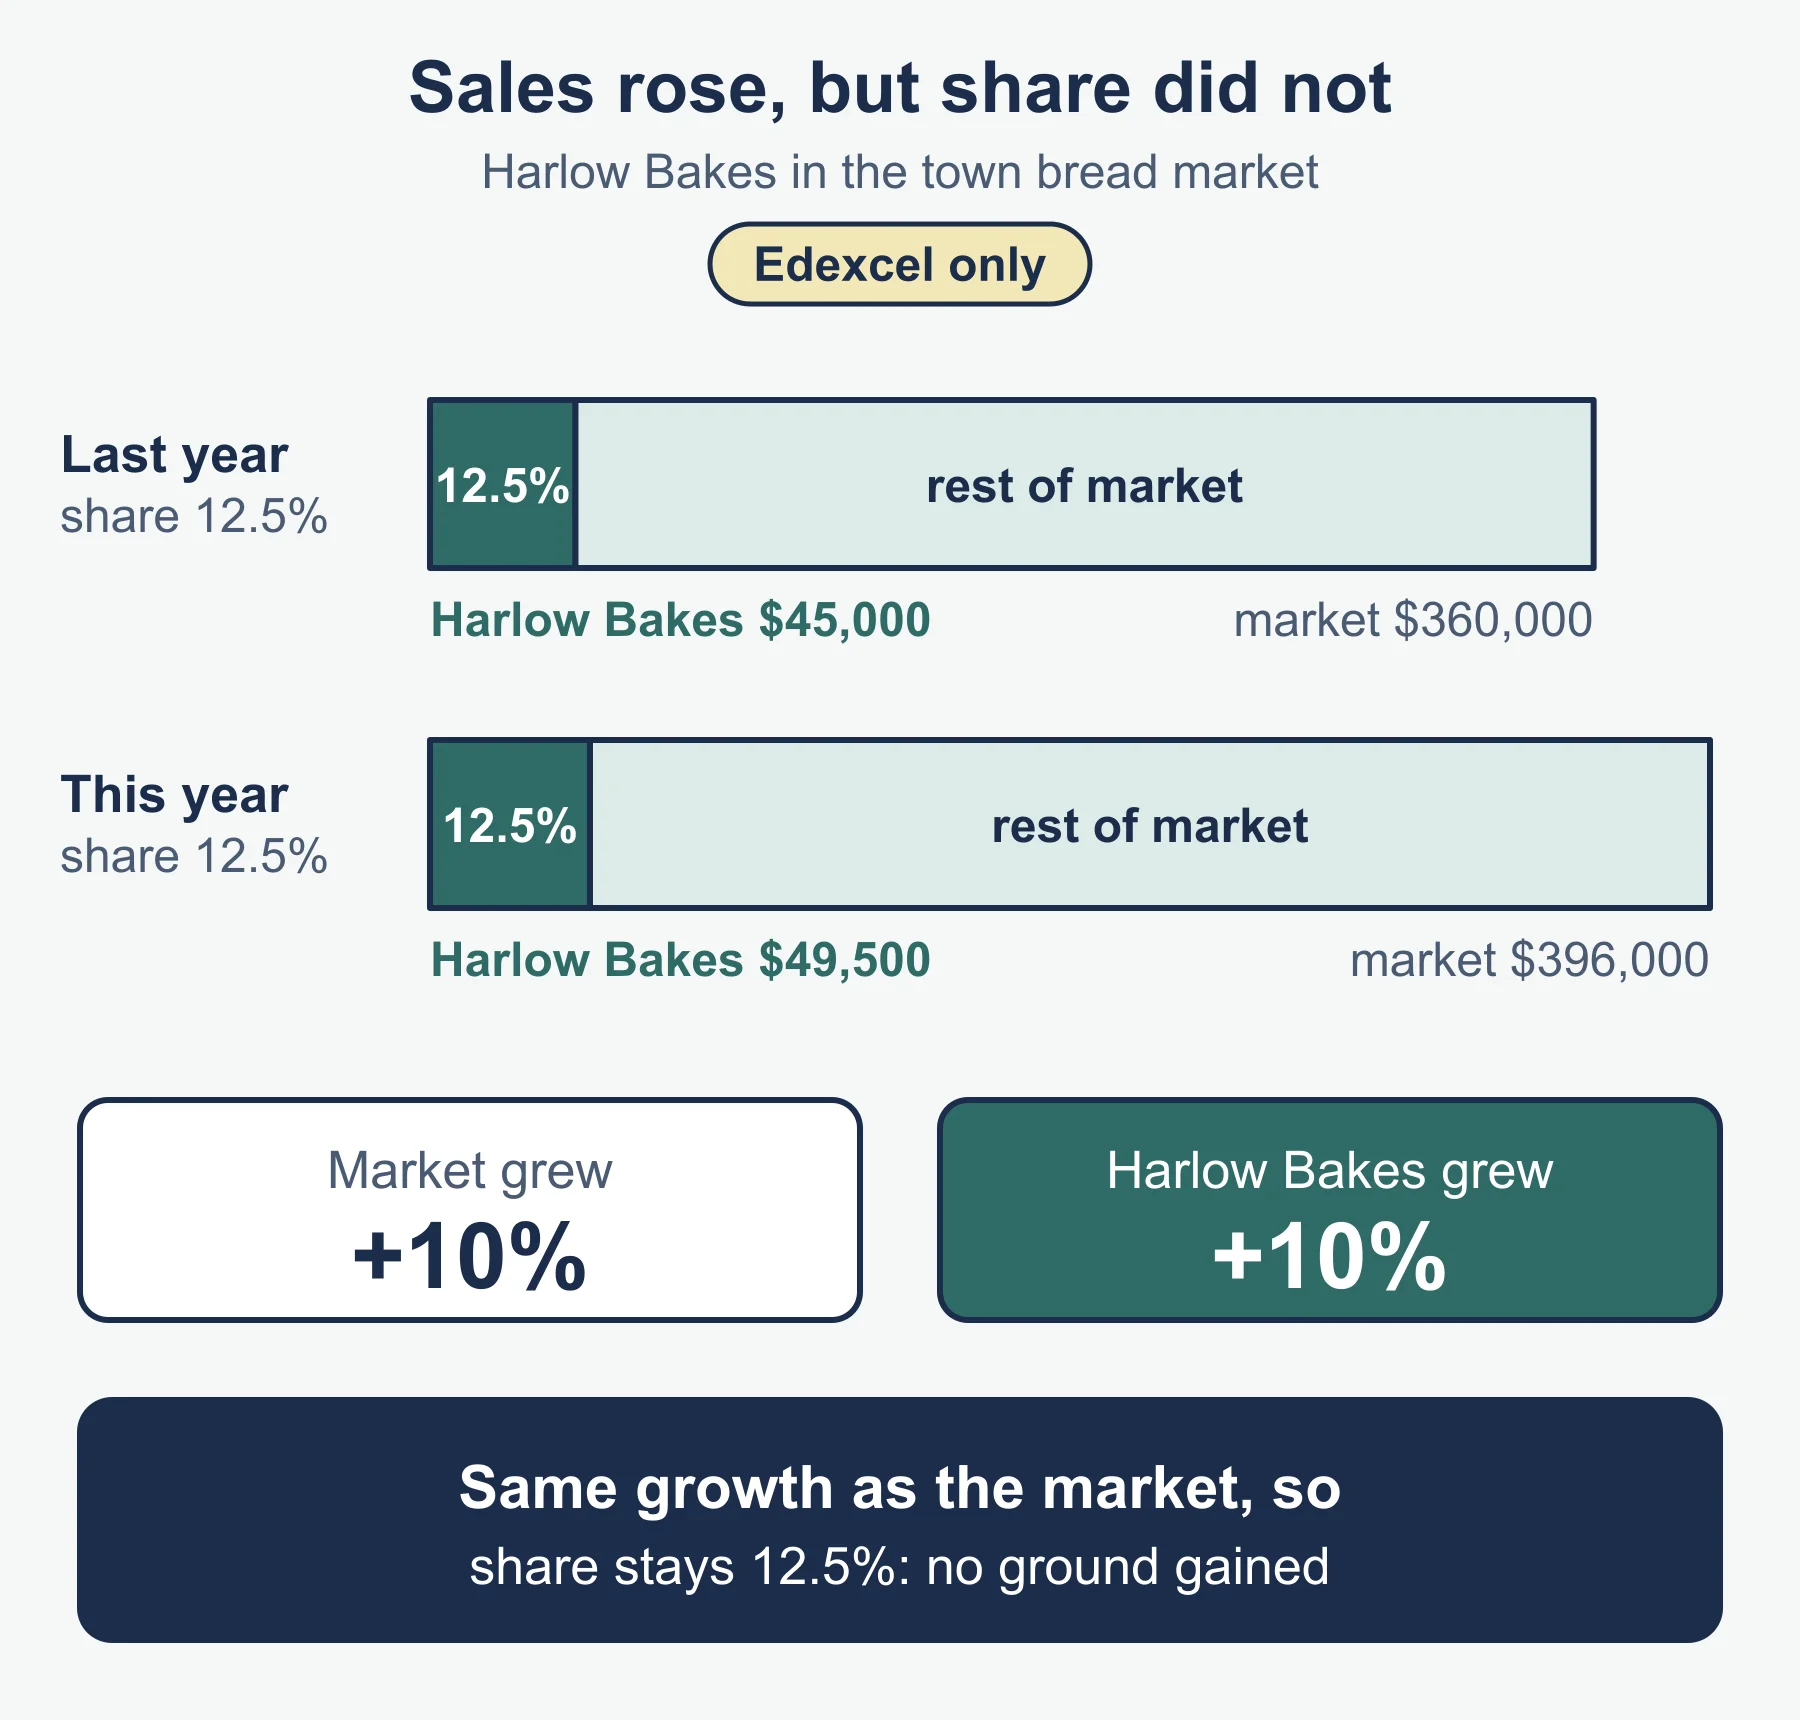
Market share (%) = (business sales / total market sales) x 100Worked example 3. Total sales of bread in a town last year were 360,000. Harlow Bakes sold 45,000 of it.
Market share = 45,000 / 360,000 x 100 = 12.5%This year the town market grows 10% to 396,000, and Harlow Bakes grows its sales 10% to 49,500.
New market share = 49,500 / 396,000 x 100 = 12.5%Sales rose, yet share is unchanged: the business only kept pace with the market. A fair judgement is that the business has not gained ground on competitors.
Market analysis means studying the market’s size, growth, the share of each competitor and customer trends. A business uses it to decide whether to enter, expand or leave a market, and to set targets such as raising share by two percentage points.
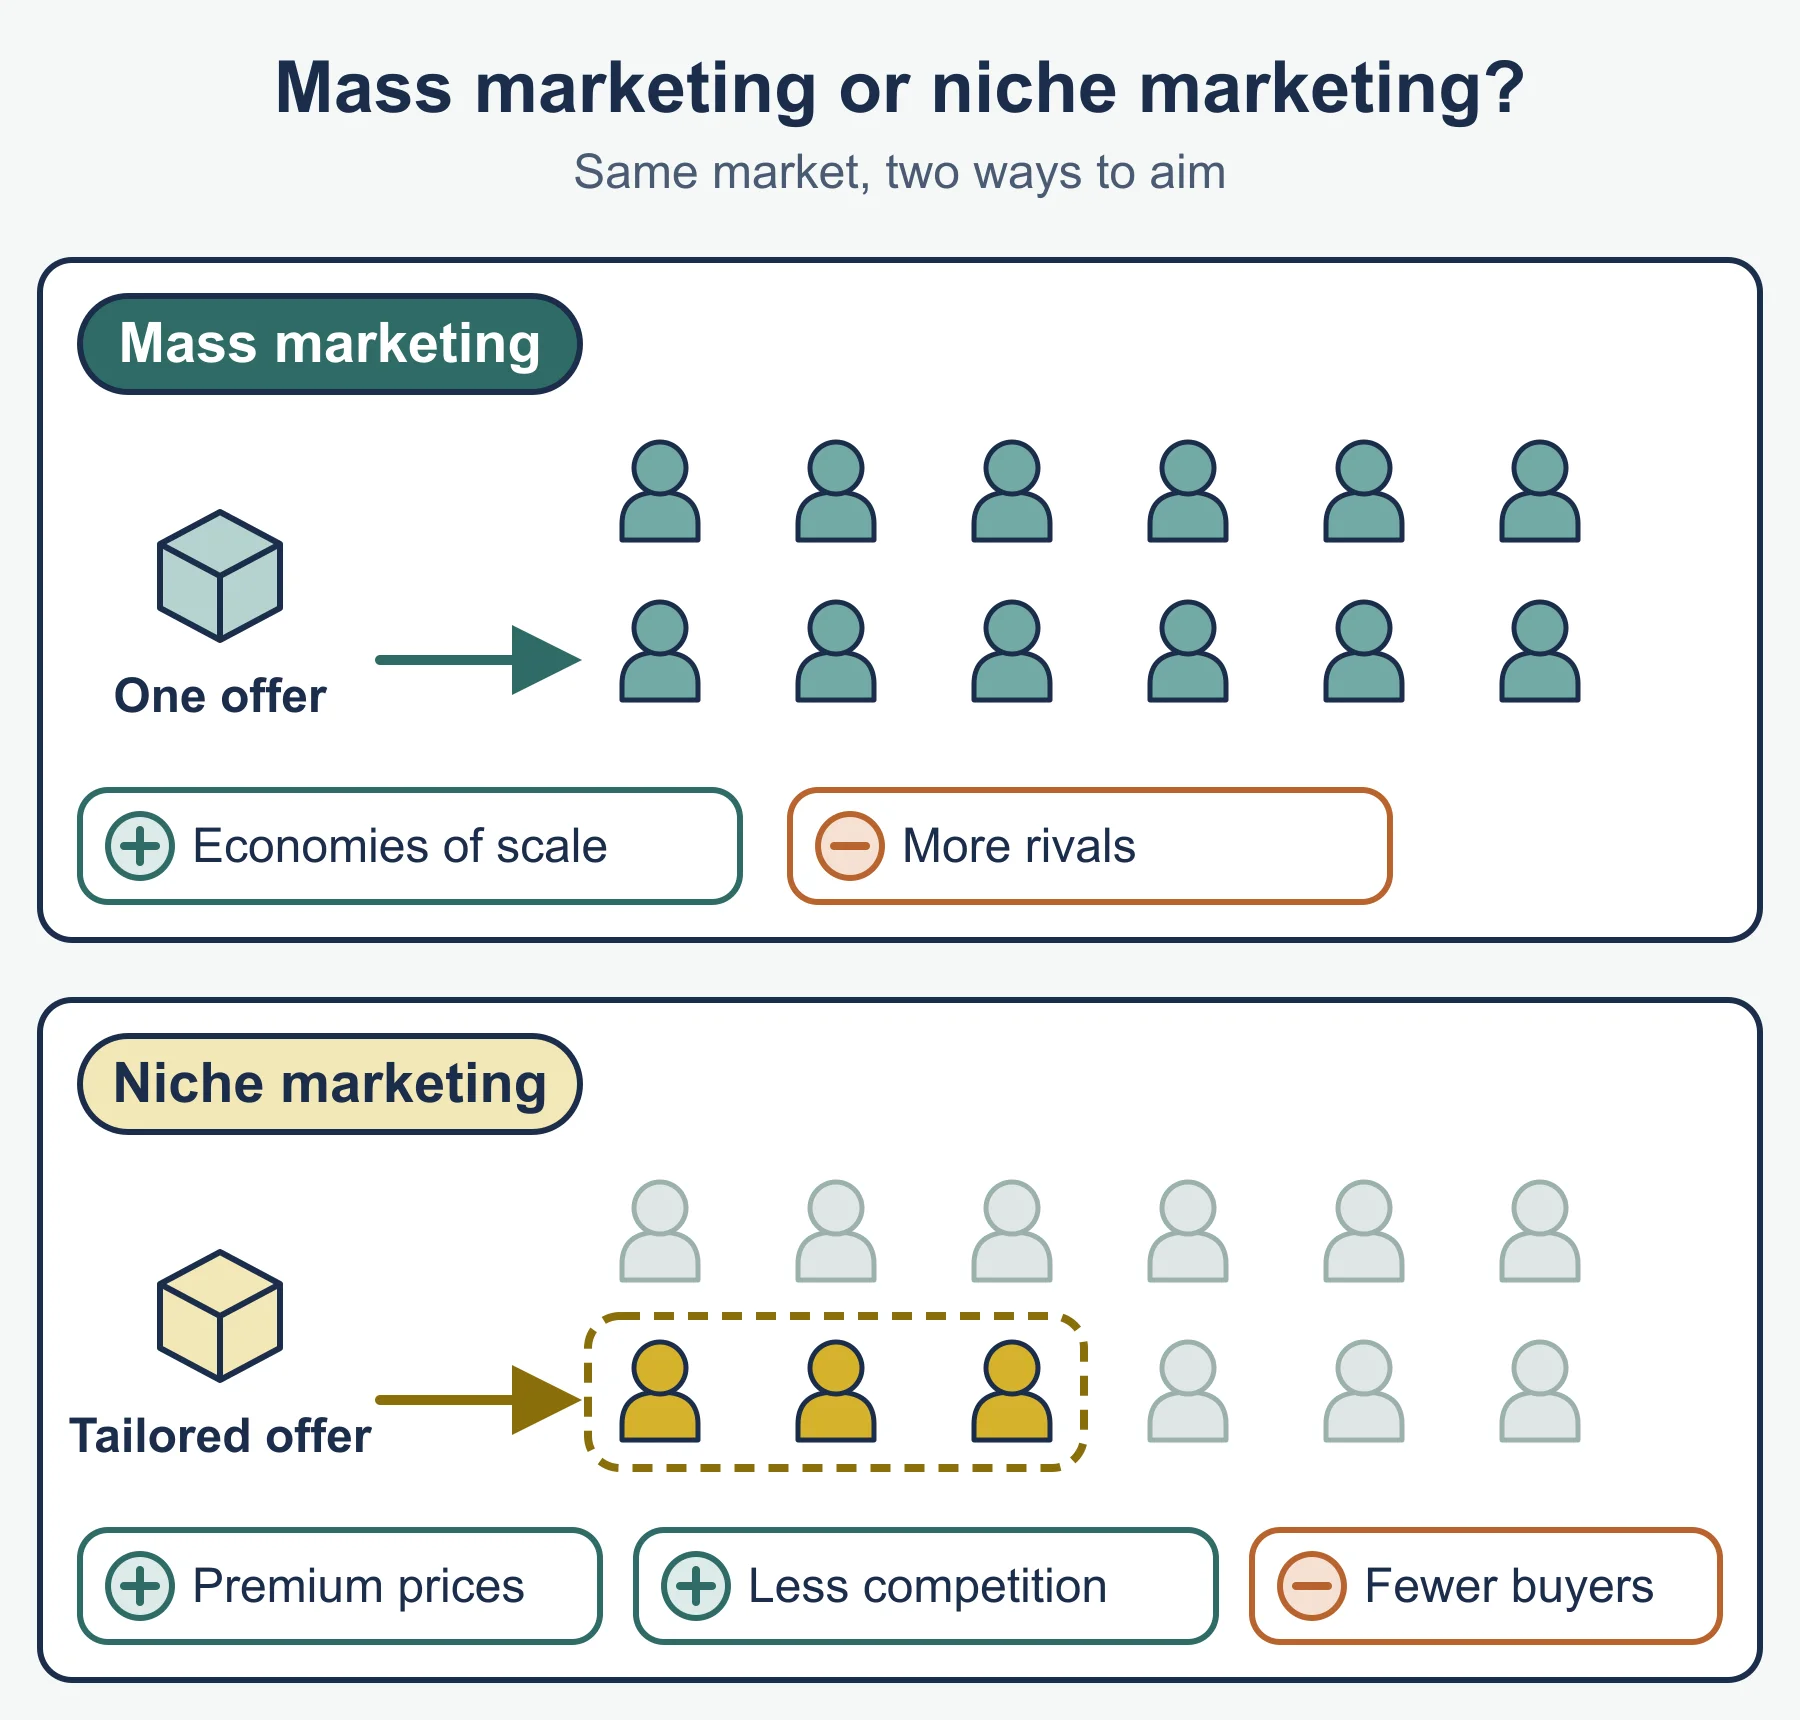
Niche and mass marketing
| Niche marketing | Mass marketing | |
|---|---|---|
| Target | A small, specialised part of the market | The whole market, or most of it |
| Typical product | Specialist, often higher price | Standard, often lower price |
| Advantages | Less competition; loyal customers; premium prices possible | Large sales volume; economies of scale |
| Disadvantages | Limited customer base; harmed if the niche shrinks | Strong competition; lower margins |
A shop selling handmade vegan cakes is niche. A supermarket chain selling bread to all shoppers is mass.
6. Responding to changes in the market (4.2.2)
Markets change. The specification names three causes.
- Changing customer needs. Tastes, technology and attitudes move. A business should keep researching, adapt products and drop what no longer sells. Response: add healthier recipes after research shows demand.
- Changing customer or consumer spending patterns. If incomes fall, people buy cheaper items or fewer of them. If they shift to online shopping, shops lose footfall. Response: introduce value ranges, change prices, add a delivery service.
- Increased competition. A new rival can take customers and share. Response: improve quality or service, change prices, promote more strongly or find a niche.
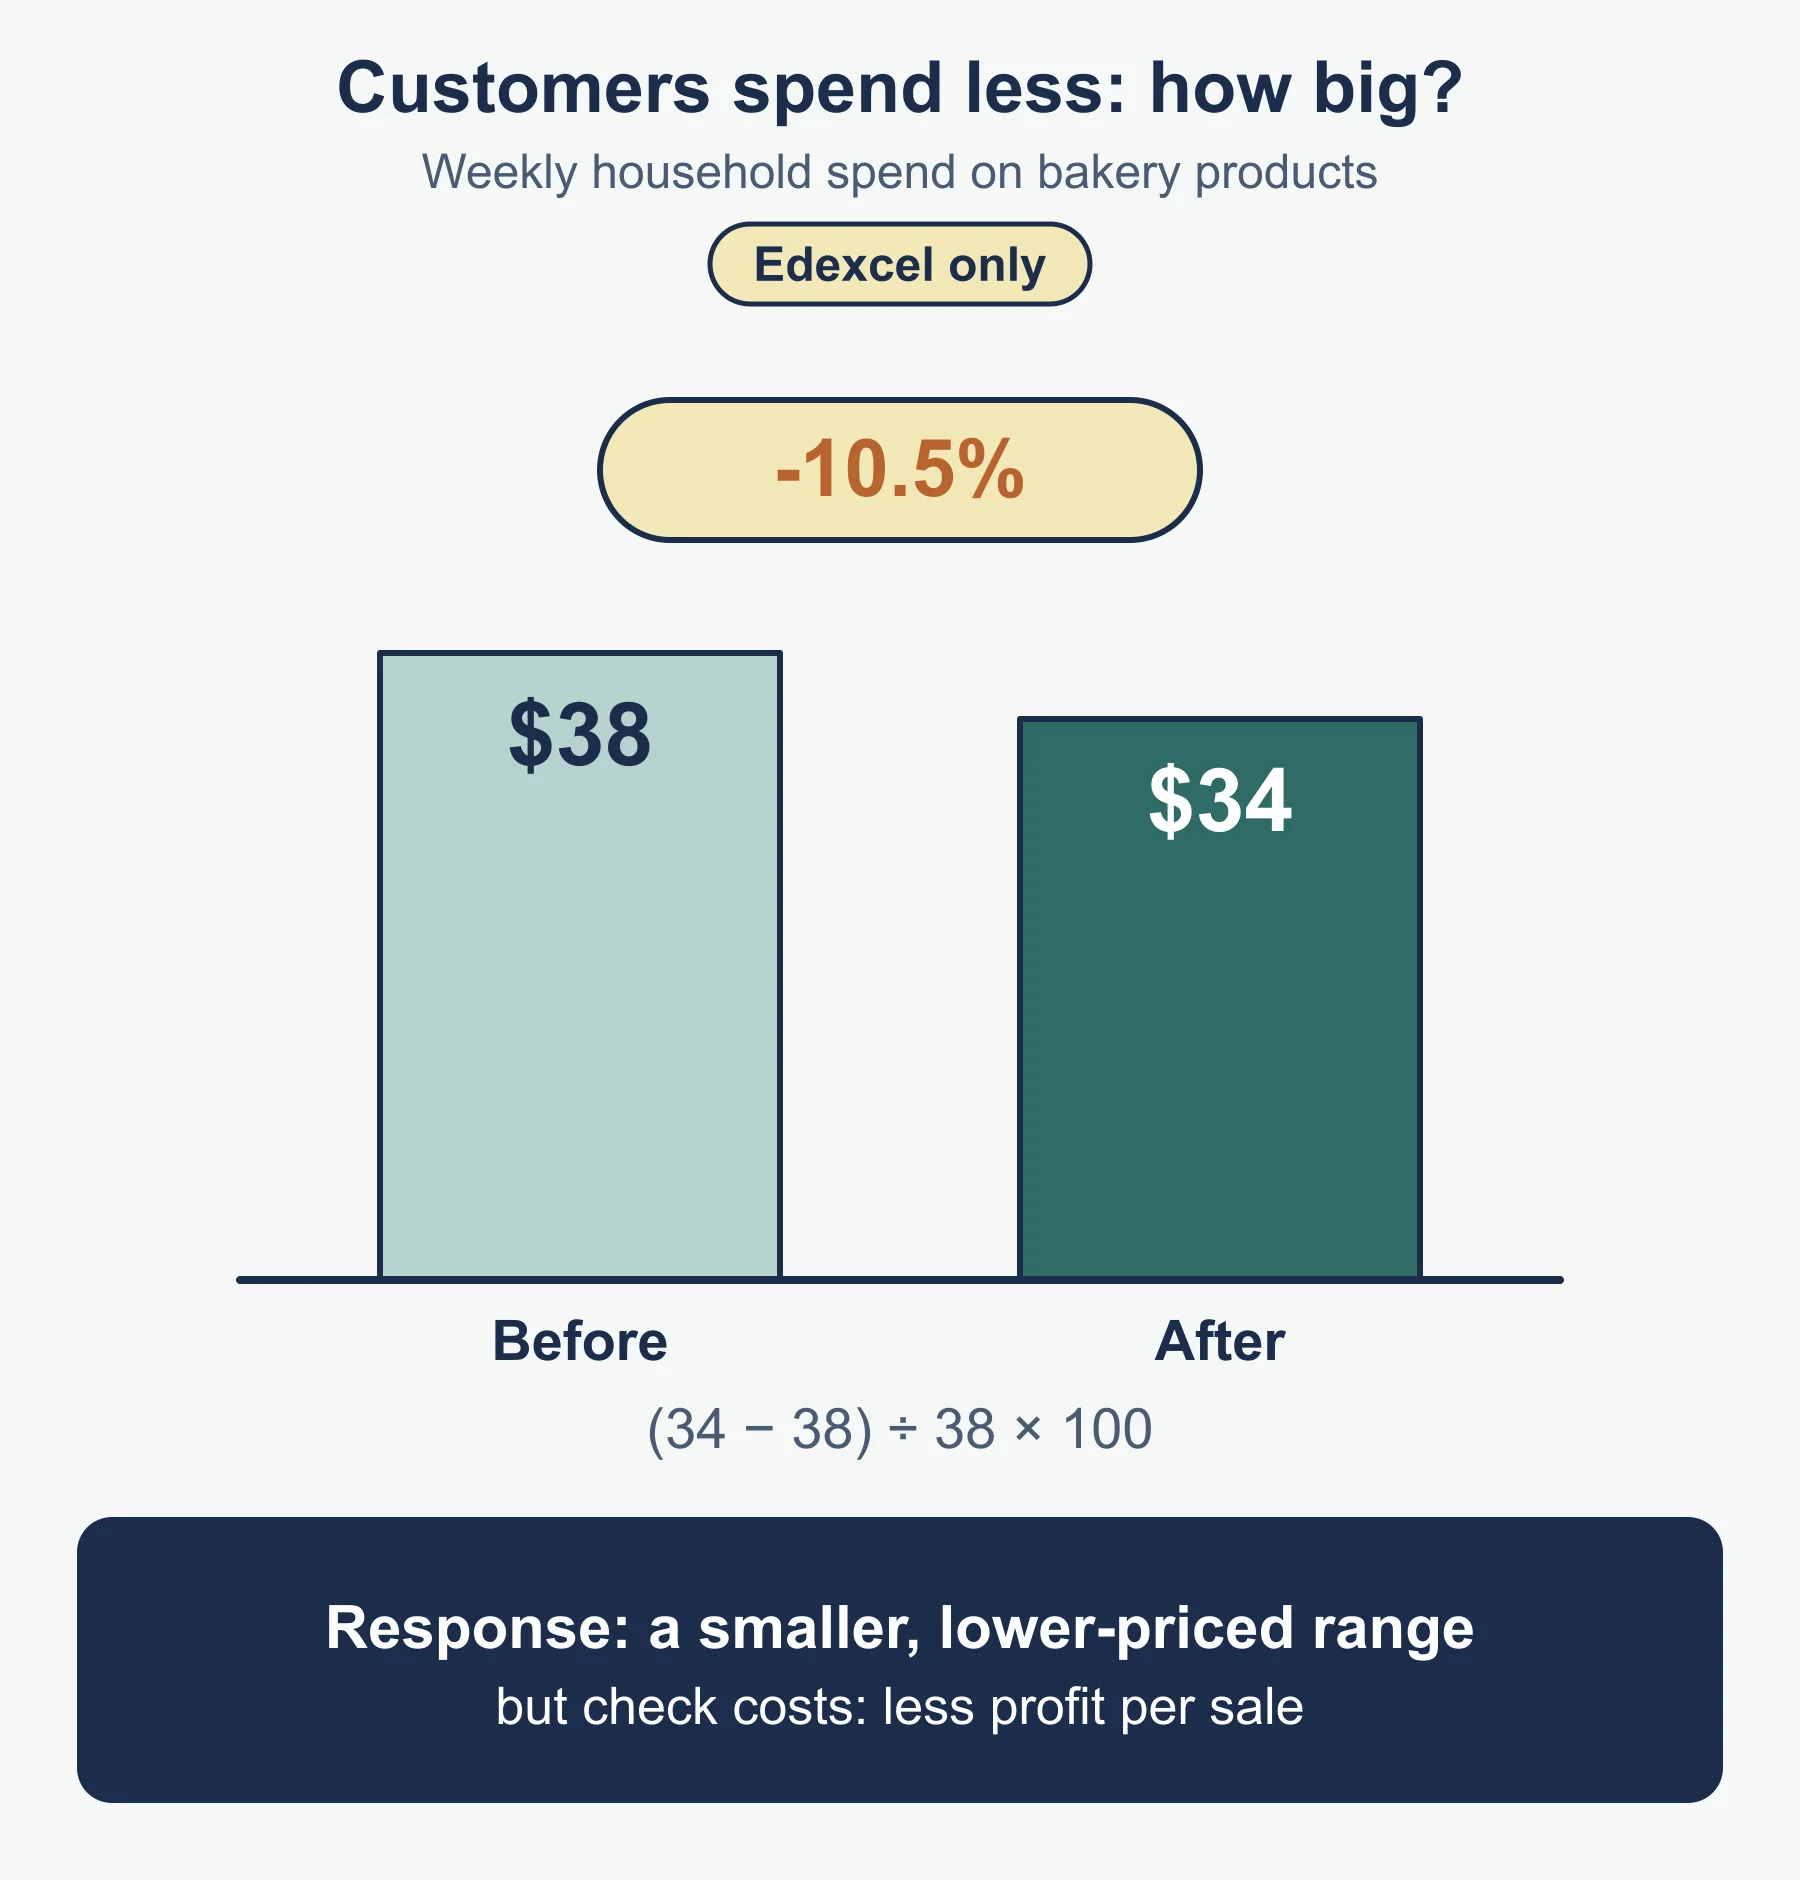
Worked example 4. Weekly spending on bakery products by a typical household in Harlow falls from 38 to 34. Percentage change:
(34 - 38) / 38 x 100 = -10.5% (to 1 d.p.)A drop of about 10.5% would worry Harlow Bakes. A response is a small, lower-priced range. A drawback is lower profit on each sale, so the owner must check costs first.
7. Market segmentation (4.2.3)
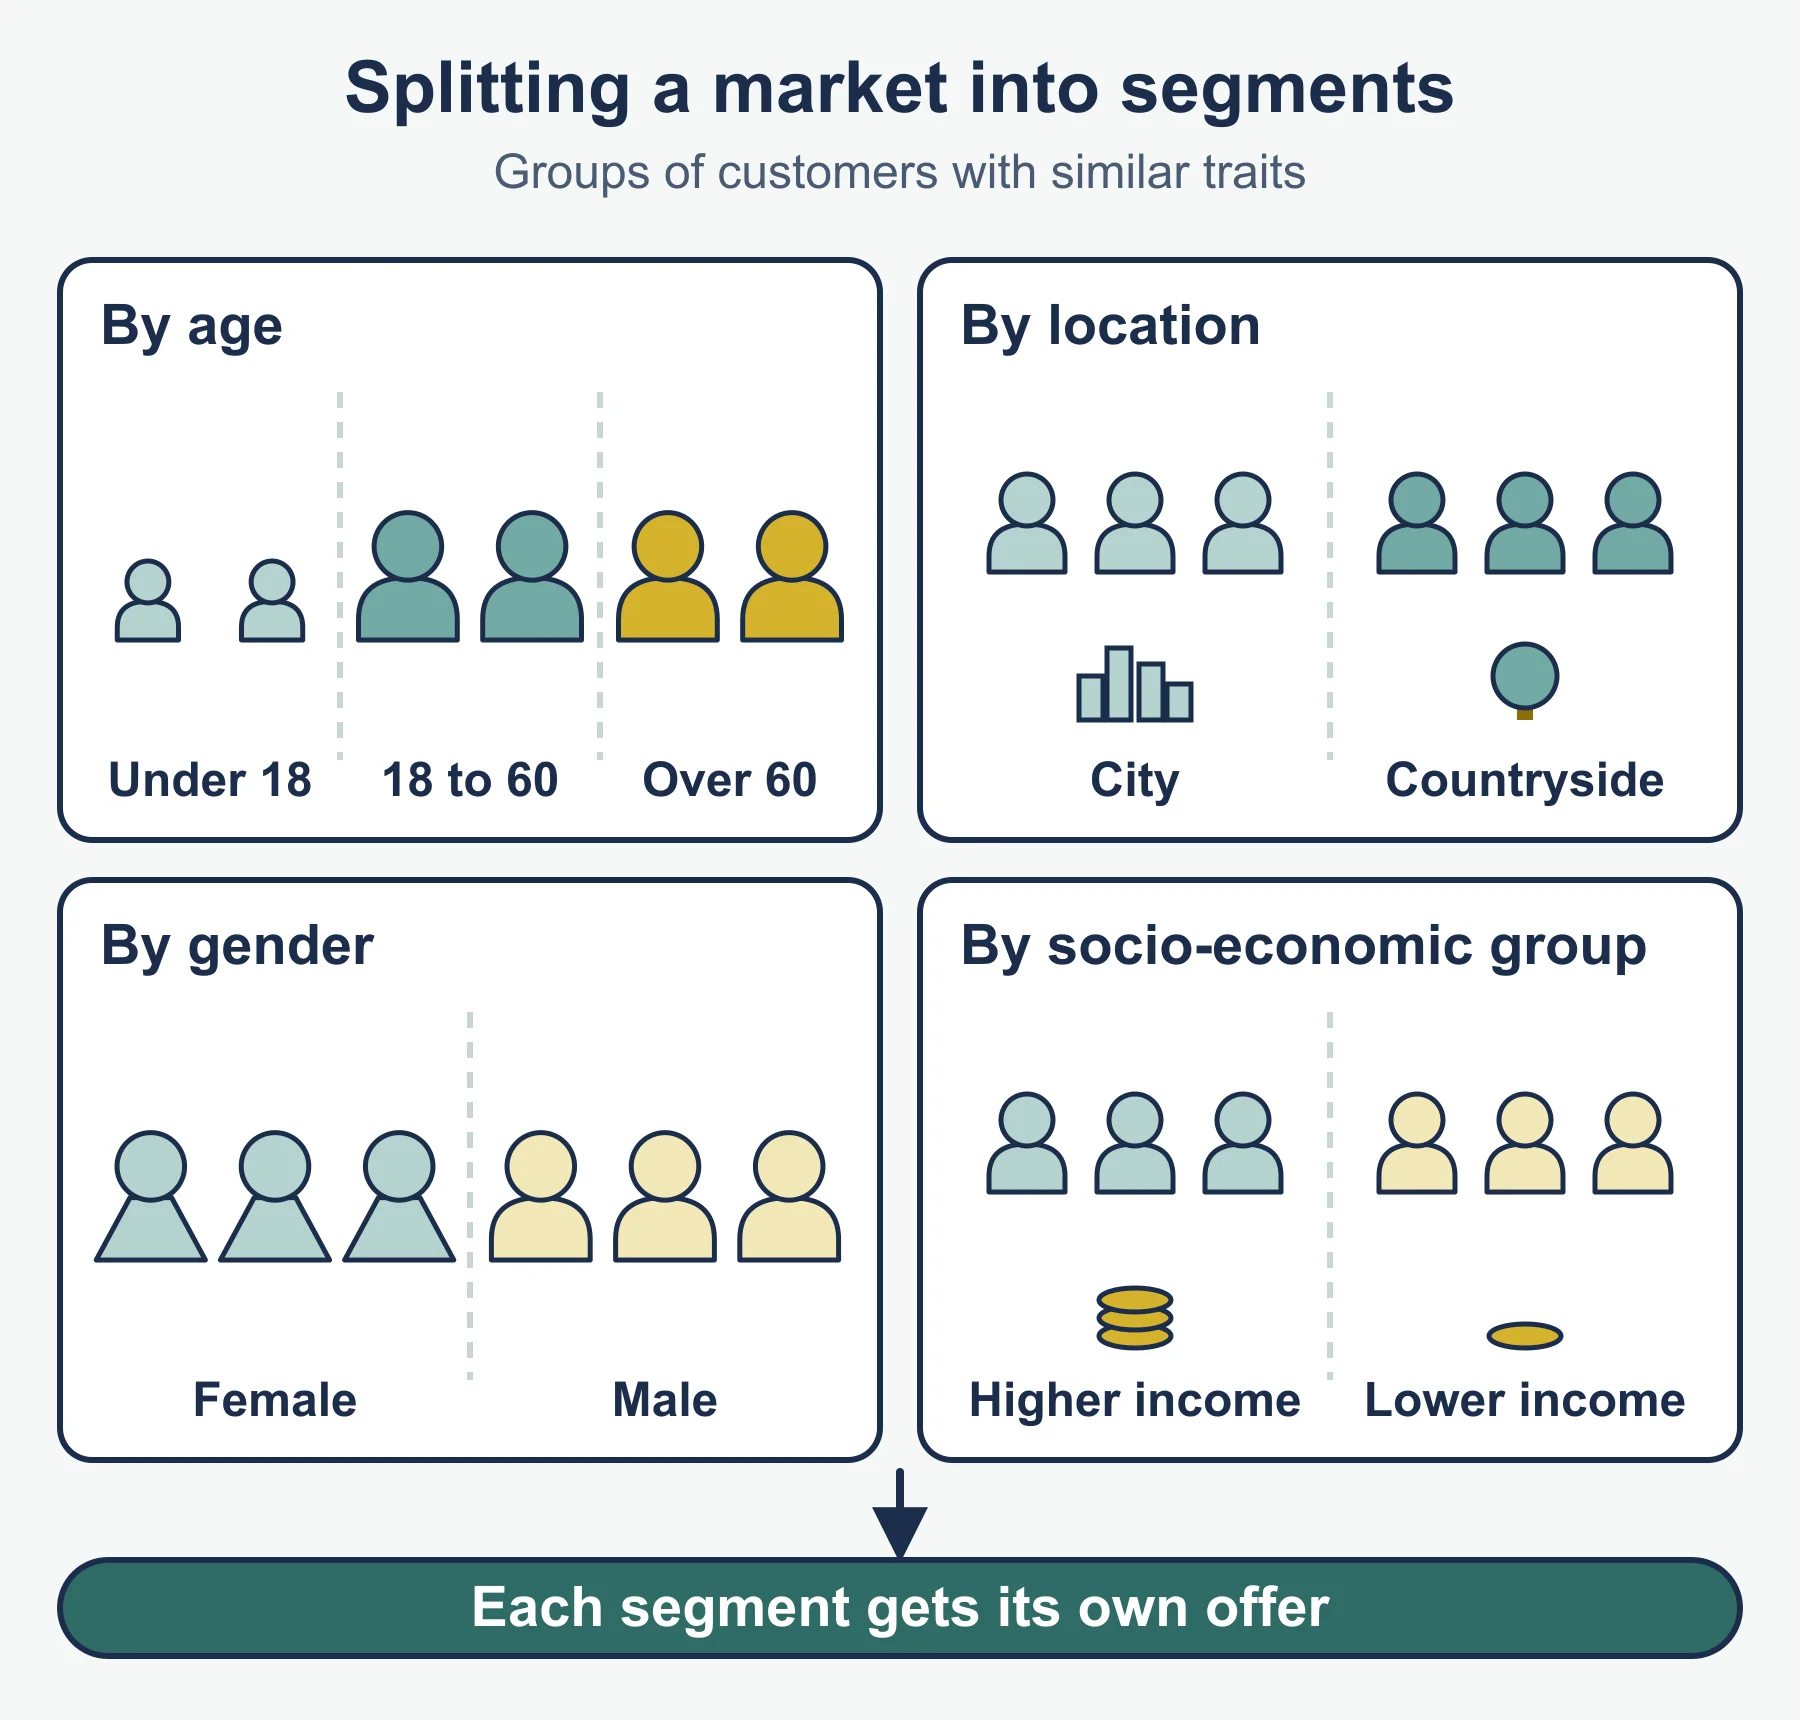
A market segment is a group of customers who share characteristics. Market segmentation is dividing a market into such groups so that a business can target the product, price and promotion at the groups most likely to buy. The specification lists five ways to identify segments.
| Basis | Meaning | Example |
|---|---|---|
| Location | Where people live or work | A city-centre cafe targets office workers |
| Demographics | Features of the population such as gender, family size or occupation | A toy maker targets parents of young children |
| Lifestyle | How people live and what they value | A sports brand targets people who exercise regularly |
| Income | How much customers earn | A luxury chocolate maker targets high earners |
| Age | The age group of customers | A phone with large buttons targets older adults |
Segmentation helps a business aim its marketing money well. Disadvantages: research costs, and ignoring other segments may lose sales.
Common errors
- Describing a focus group as quantitative. It mostly gives qualitative views.
- Calling data from a government report primary. The business did not collect it.
- Treating higher sales as a higher market share. Check the total market.
- Writing that segmentation “makes more profit” without explaining how targeting reduces wasted spending.
Next steps
Try the practice questions, use the revision notes to recall the lists, and find your gaps with the diagnostics.
Frequently asked questions
What is the difference between market orientation and product orientation? A market-oriented business starts from what customers want, found through research, and designs its offer around the results. A product-oriented business starts from what it can make and then looks for buyers.
What is test marketing? Test marketing means selling a product in a limited area or for a limited period before a full launch. It tests real buying with real money, but it is slow and competitors can see the product early.
What is market segmentation? Market segmentation is dividing a market into groups of customers who share characteristics so a business can target its product, price and promotion. The 4BS1 specification lists location, demographics, lifestyle, income and age.
How can a business respond to increased competition? It can improve quality or service, change prices, promote more strongly or find a niche. Each response has a drawback, such as lower profit per sale after a price cut.
Official syllabus
Pearson Edexcel International GCSE in Business (4BS1), Specification, Issue 2, February 2026, published by Pearson Education Limited. Topic 4: Marketing, sections 4.1 Market research and 4.2 The market, points 4.1.1 to 4.2.3.
Get free revision emails (optional)
Occasional emails with practice questions, worked explanations and links to free resources for the qualification and subjects you choose. No spam, and you can unsubscribe from any email. The free tools on this site never need an email.
Related resources
-
Practice questions
Edexcel IGCSE Business: Market research and the market (4BS1) – Practice Questions
Original practice questions with worked answers on market research, market share and segmentation for Edexcel International GCSE Business.
Business · Pearson Edexcel · IGCSE
Try questions -
Revision notes
Edexcel IGCSE Business: Market research and the market (4BS1) – Revision Notes
Condensed revision notes on market research, data, market share, segmentation and market change for Edexcel International GCSE Business.
Business · Pearson Edexcel · IGCSE
Revise topic -
Study guides
Edexcel IGCSE Business: The marketing mix (4BS1)
Study guide to product, price, place and promotion for Edexcel IGCSE Business (4BS1), section 4.3, with worked examples on pricing and the Boston matrix.
Business · Pearson Edexcel · IGCSE
Read guide
Related articles
-
teaching
A Level tuition in Dubai: Cambridge or Pearson Edexcel International A Level?
Schools in Dubai and Abu Dhabi teach either Cambridge International AS & A Level or Pearson Edexcel International A Level. How the two are structured, why it matters for tuition, and how online classes from Lahore work.
9 October 2026
-
curriculum guides
Choosing subjects at IGCSE and A Level
How subject choices at 14 and 16 affect university options later, and how to keep pathways open without overloading a timetable.
28 July 2026
Studying this with a teacher
Working through Business IGCSE?
This page is free and stays free. If you would rather be taught it, Marlbridge runs Business classes one-to-one and in small groups of up to 15, online in your own time zone. The first trial class is free. WhatsApp replies within an hour (8am–11pm Pakistan time, every day); email the same day.
Pearson Edexcel Business teachers at Marlbridge

