
Study Guides
IB DP Business Management: Introduction to marketing and Marketing planning
Study guide to IB DP Business Management 4.1 and 4.2: orientation, market share and growth, segmentation, targeting, positioning and USPs.
- Subject
- Business
- Level
- IB
- Topic
- Unit 4: Marketing
- Author
- Marlbridge Academic Team
- Updated
- Reviewed by
- Salman Ahmad (what this means)
Aligned to International Baccalaureate IB Diploma Programme Business (DP Business Management), First assessment 2024. Official specification .
Syllabus page (what it covers and how it is assessed): IB Diploma Programme Business.
Syllabus points this page covers
DP Business Management
- 4.1 Introduction to marketing
- 4.2 Marketing planning
Found an error? Report a correction.
Need help with this topic? Request a free trial class for IB Diploma Programme Business (DP Business Management).
This guide covers sections 4.1 Introduction to marketing and 4.2 Marketing planning of the IB Business management guide, first assessment 2024. Everything is SL and HL, except one point in 4.1 that the guide marks as HL only; it is labelled below. For the wider unit, see the Unit 4 overview. Course hub: IB DP Business Management. Tick-list: printable checklist. Companion pages: revision notes and practice questions. To find weak spots first, try the free 10-minute diagnostics.
What you must be able to do
| Section | Content point in the guide | Level |
|---|---|---|
| 4.1 | Market orientation versus product orientation | SL and HL |
| 4.1 | Market share | SL and HL |
| 4.1 | Market growth | SL and HL |
| 4.1 | The importance of market share and market leadership | HL only |
| 4.2 | The role of marketing planning | SL and HL |
| 4.2 | Segmentation, targeting (target market) and positioning (position maps) | SL and HL |
| 4.2 | The difference between niche market and mass market | SL and HL |
| 4.2 | The importance of having a unique selling point/proposition (USP) | SL and HL |
| 4.2 | How organizations can differentiate themselves and their products from competitors | SL and HL |
The guide tags market share and market growth with AO2 and AO4, so expect to calculate and then interpret. The guide also lists tools it suggests integrating with Unit 4, including SWOT analysis, STEEPLE analysis, the Ansoff matrix and the Boston Consulting Group (BCG) matrix. They are not separate content points here, but they fit marketing planning naturally and are mentioned where they help.
4.1 Introduction to marketing
Market orientation versus product orientation
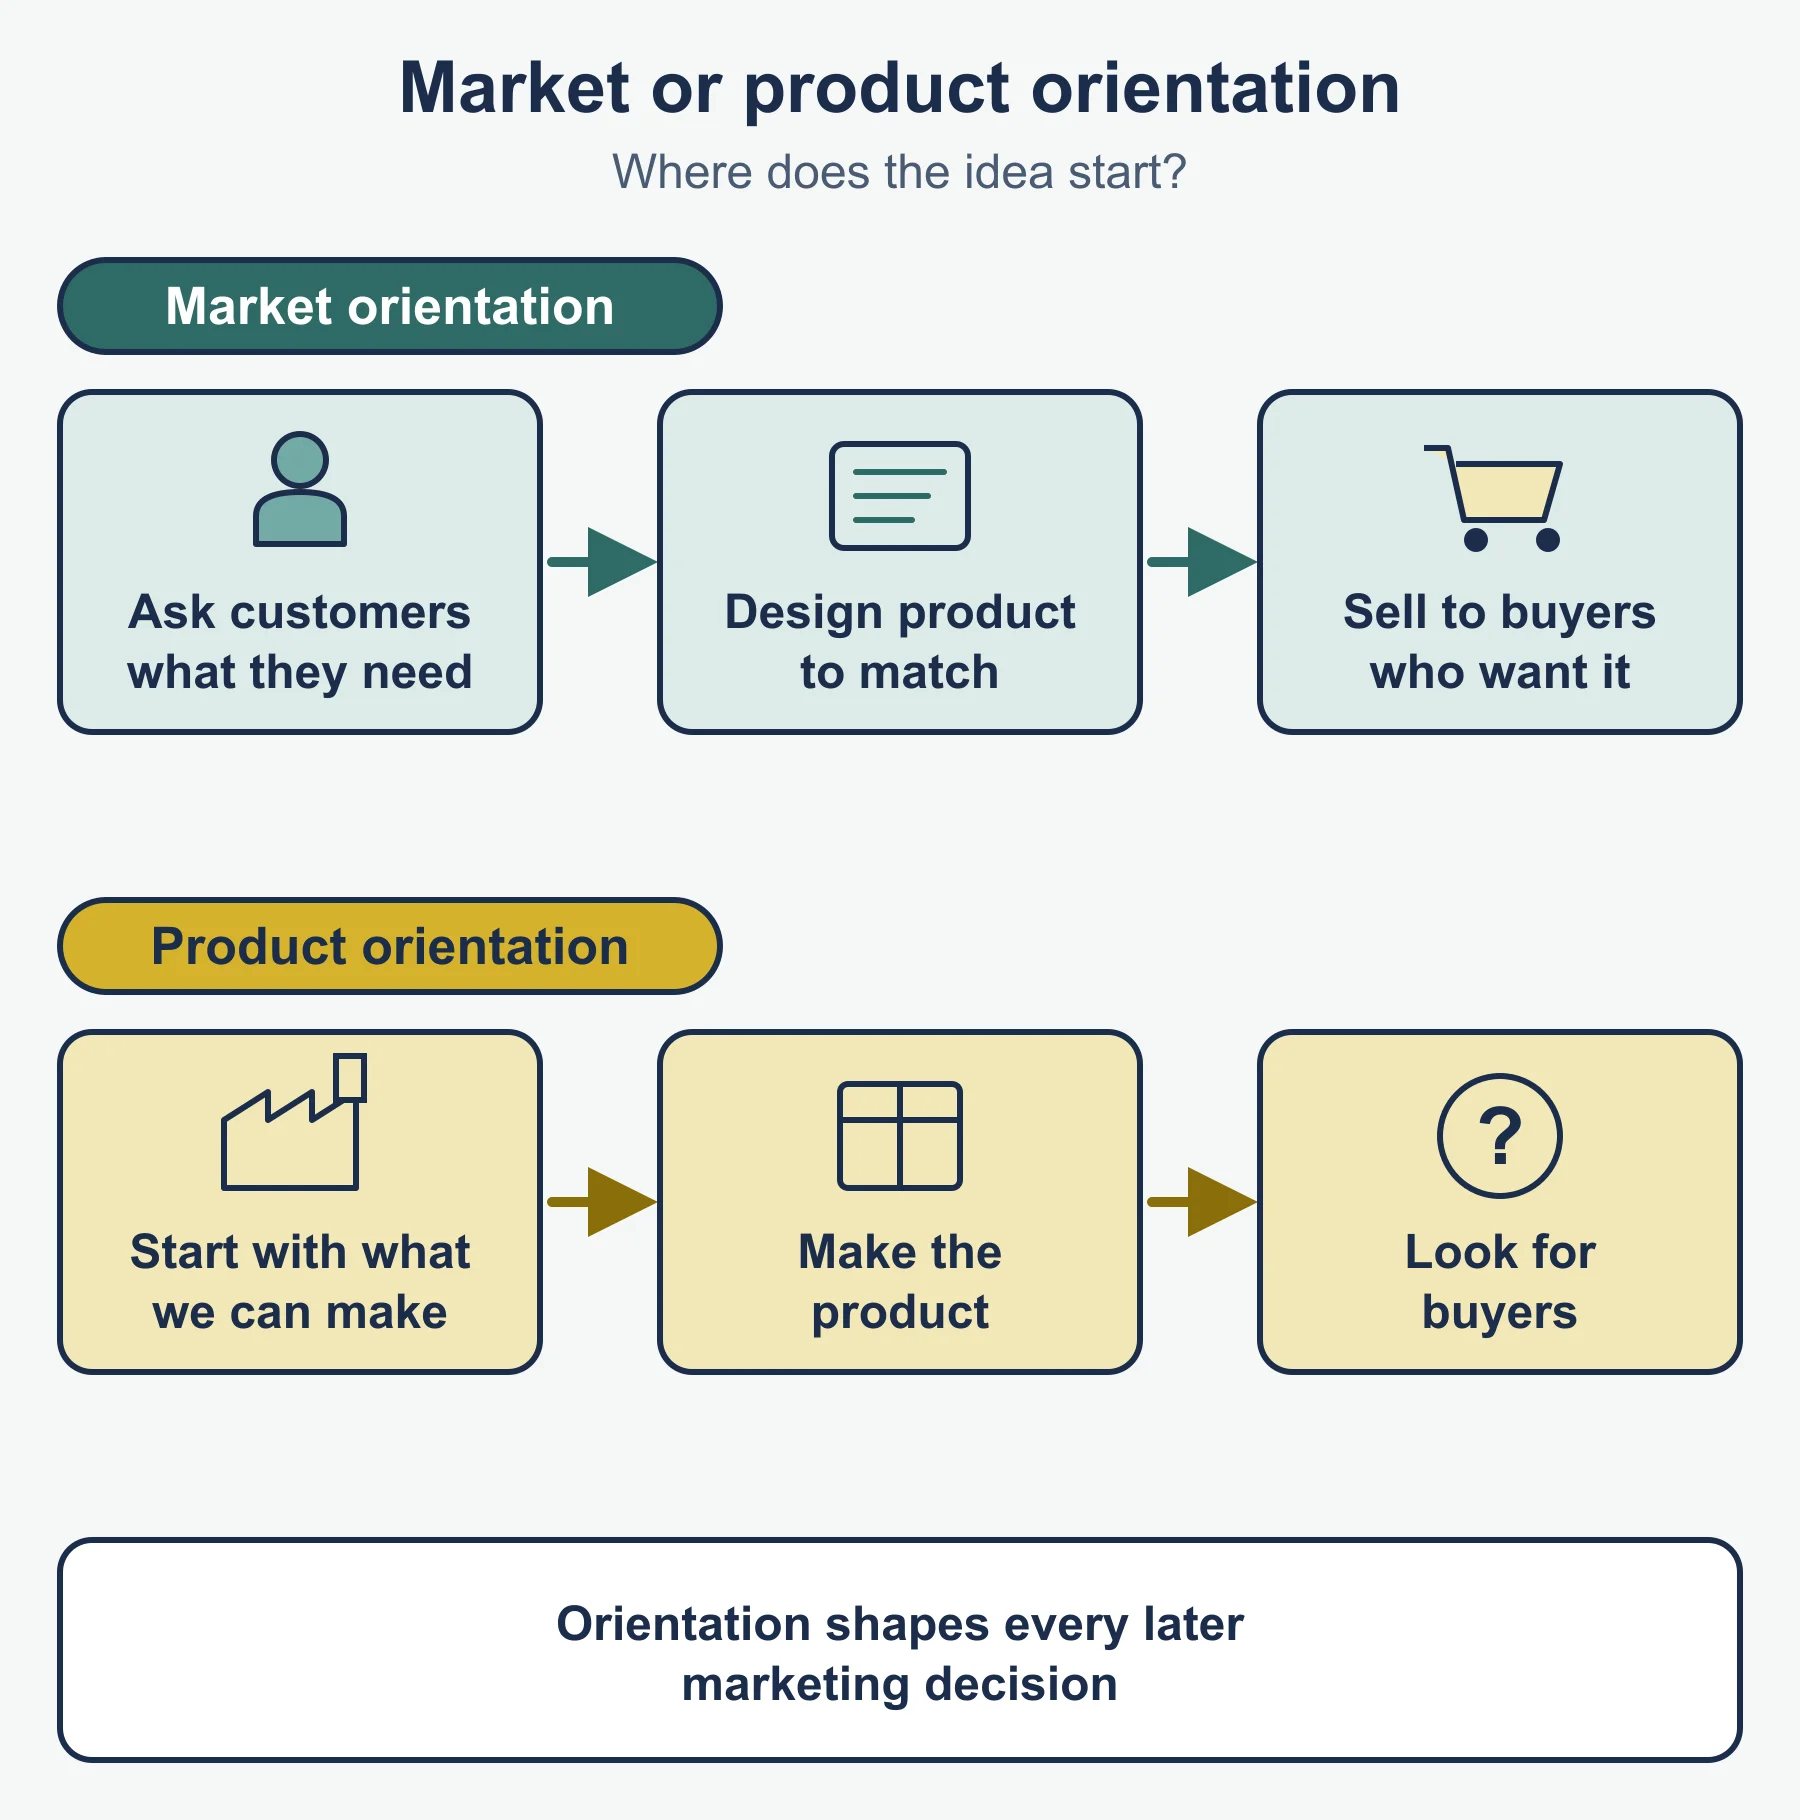
A market-oriented business begins with the customer. It finds out what people want, then designs, prices and promotes something to match. A product-oriented business begins with the thing it is good at making. It perfects the item and then looks for people to buy it.
Neither is wrong in every case. Market orientation lowers the risk of making something nobody wants, but research costs money and customers cannot always describe a need they have never met. Product orientation can produce a breakthrough, but it leaves the business guessing about demand.
Worked example: Aldersley Oat Drinks. Aldersley’s founder, a food scientist, spends two years perfecting a smooth, low-sugar oat drink. Only after production starts does she ask retailers whether they will stock it. Retailers say shoppers in their stores want larger, cheaper cartons.
Step 1  Where did the idea start?   With the founder's recipe, not with buyers.
Step 2  When was demand checked?    After production began.
Step 3  Conclusion                  Product orientation.
Step 4  Consequence                 Price, pack size and promotion must now be
                                    adjusted to fit demand that was not tested.
A stronger answer also offers a way forward: Aldersley could run a short taste panel and price test with shoppers, then change pack size before a full launch. That moves it toward market orientation.
Market share
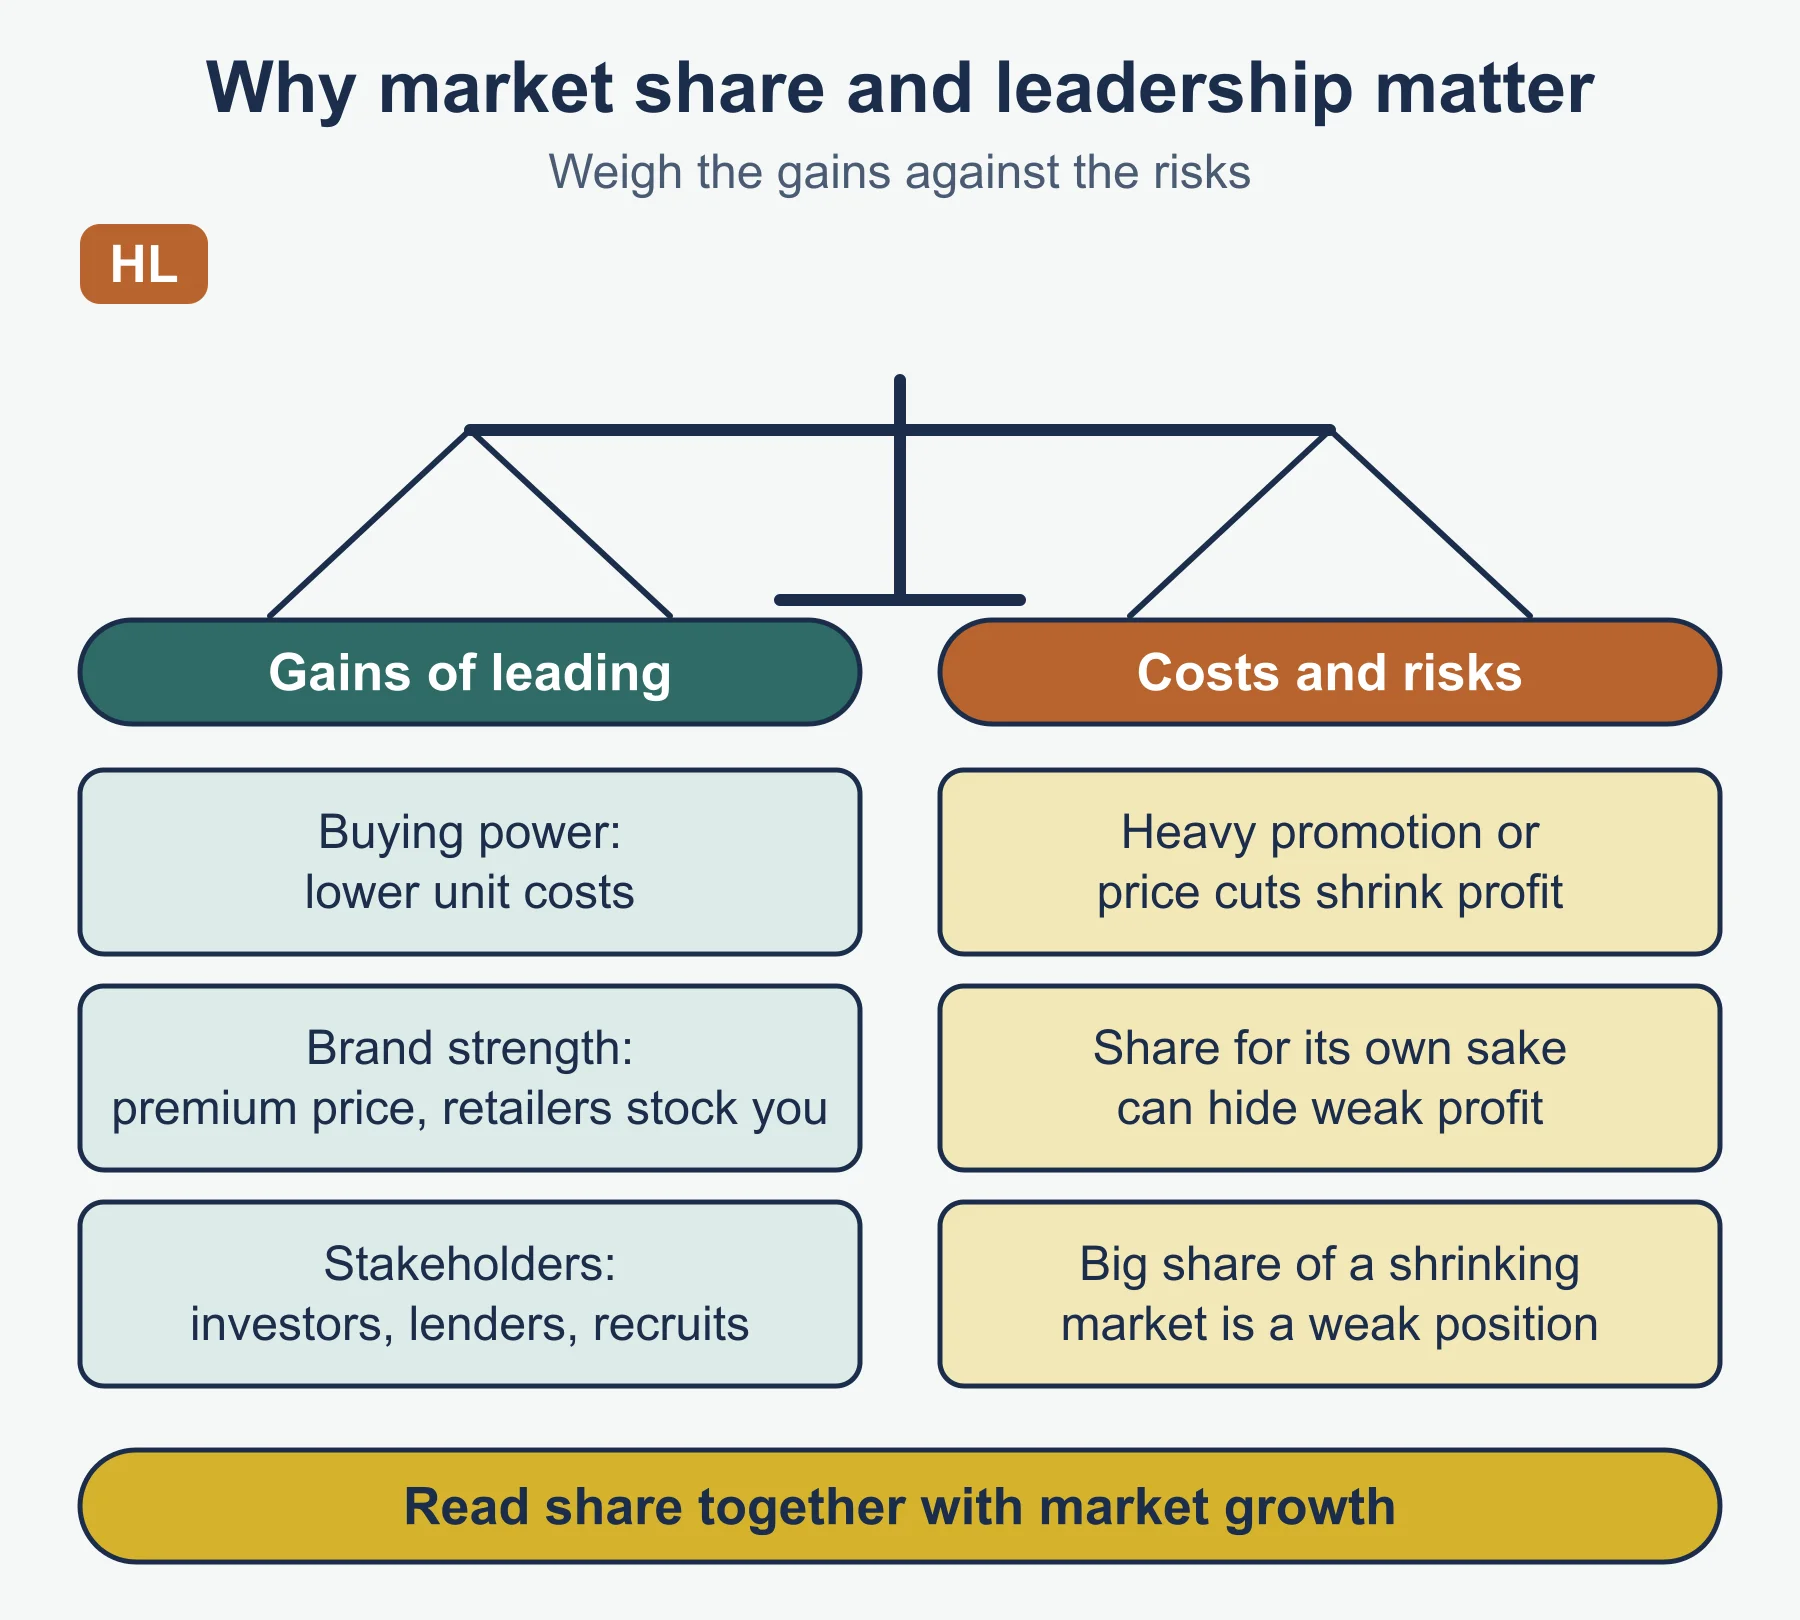
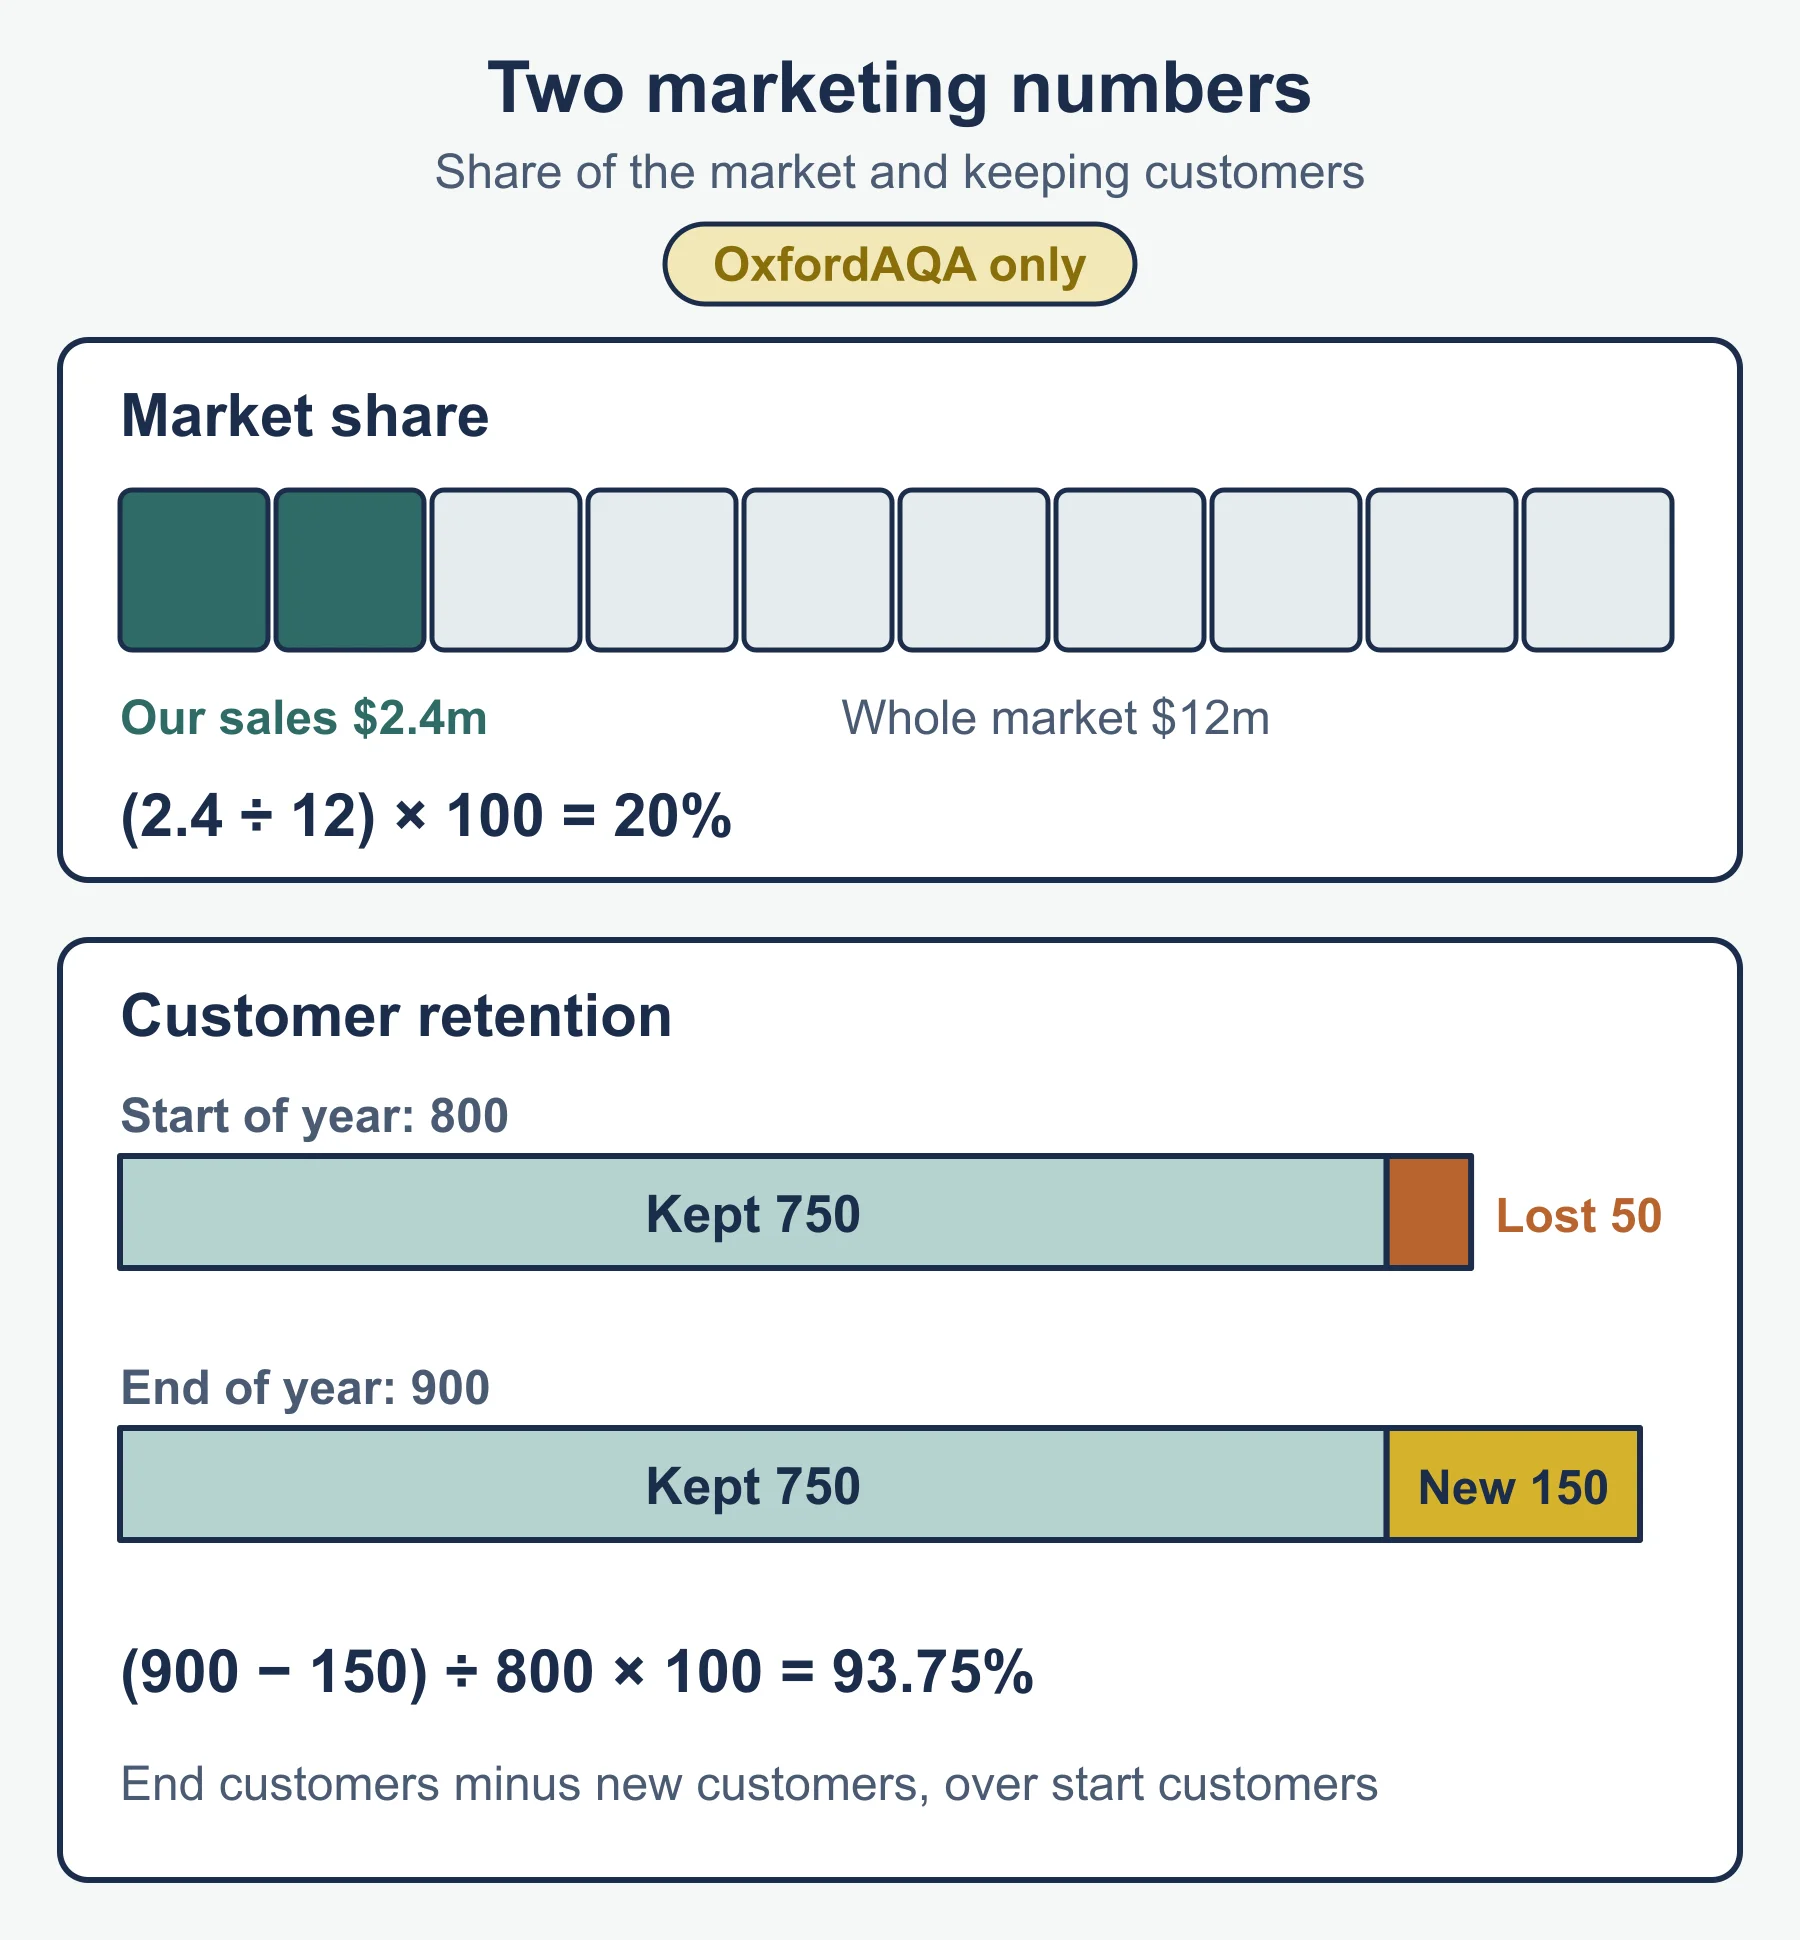
Market share is the proportion of total sales in a market that one business wins. The guide lists it without a formula, so this is the standard form:
market share (%) = (business's sales revenue / total sales revenue of the market) x 100Use the same measure (revenue or units) and the same time period on the top and bottom.
Market growth
Market growth is the percentage change in the total size of the market between two periods. Again, this is the standard form:
market growth (%) = (market sales this period - market sales last period) / market sales last period x 100Market growth describes the market, not your business. A business can grow faster or slower than its market, and the gap between the two decides whether its share rises or falls.
Worked example: Lunthorpe Tea Merchants. Total sales in the loose-leaf tea market were USD 48.0 million in Year 1 and USD 51.84 million in Year 2. Lunthorpe’s sales were USD 4.8 million and USD 5.7 million. A rival, Greywick Teas, sold USD 12.0 million and USD 12.5 million.
Market growth     = (51.84 - 48.0) / 48.0 x 100              = 8.0%
Lunthorpe share Y1 = 4.8 / 48.0 x 100                         = 10.0%
Lunthorpe share Y2 = 5.7 / 51.84 x 100                        = 11.0% (3 s.f.)
Lunthorpe sales growth = (5.7 - 4.8) / 4.8 x 100              = 18.75%
Greywick share Y1  = 12.0 / 48.0 x 100                        = 25.0%
Greywick share Y2  = 12.5 / 51.84 x 100                       = 24.1% (3 s.f.)
Interpretation: Lunthorpe’s sales grew by 18.75%, more than double the market’s 8.0%, so its share rose by about one percentage point. Greywick’s sales also rose, but by only about 4.2%, which is below market growth, so its share slipped even though it sold more. Rising sales do not guarantee a rising share. Say “percentage points” when you compare two shares.
When a question says “comment”, follow the calculation with a judgment: Lunthorpe is gaining ground, but it is still far behind the leader, so the number alone does not prove it is winning the market.
The importance of market share and market leadership (HL only)
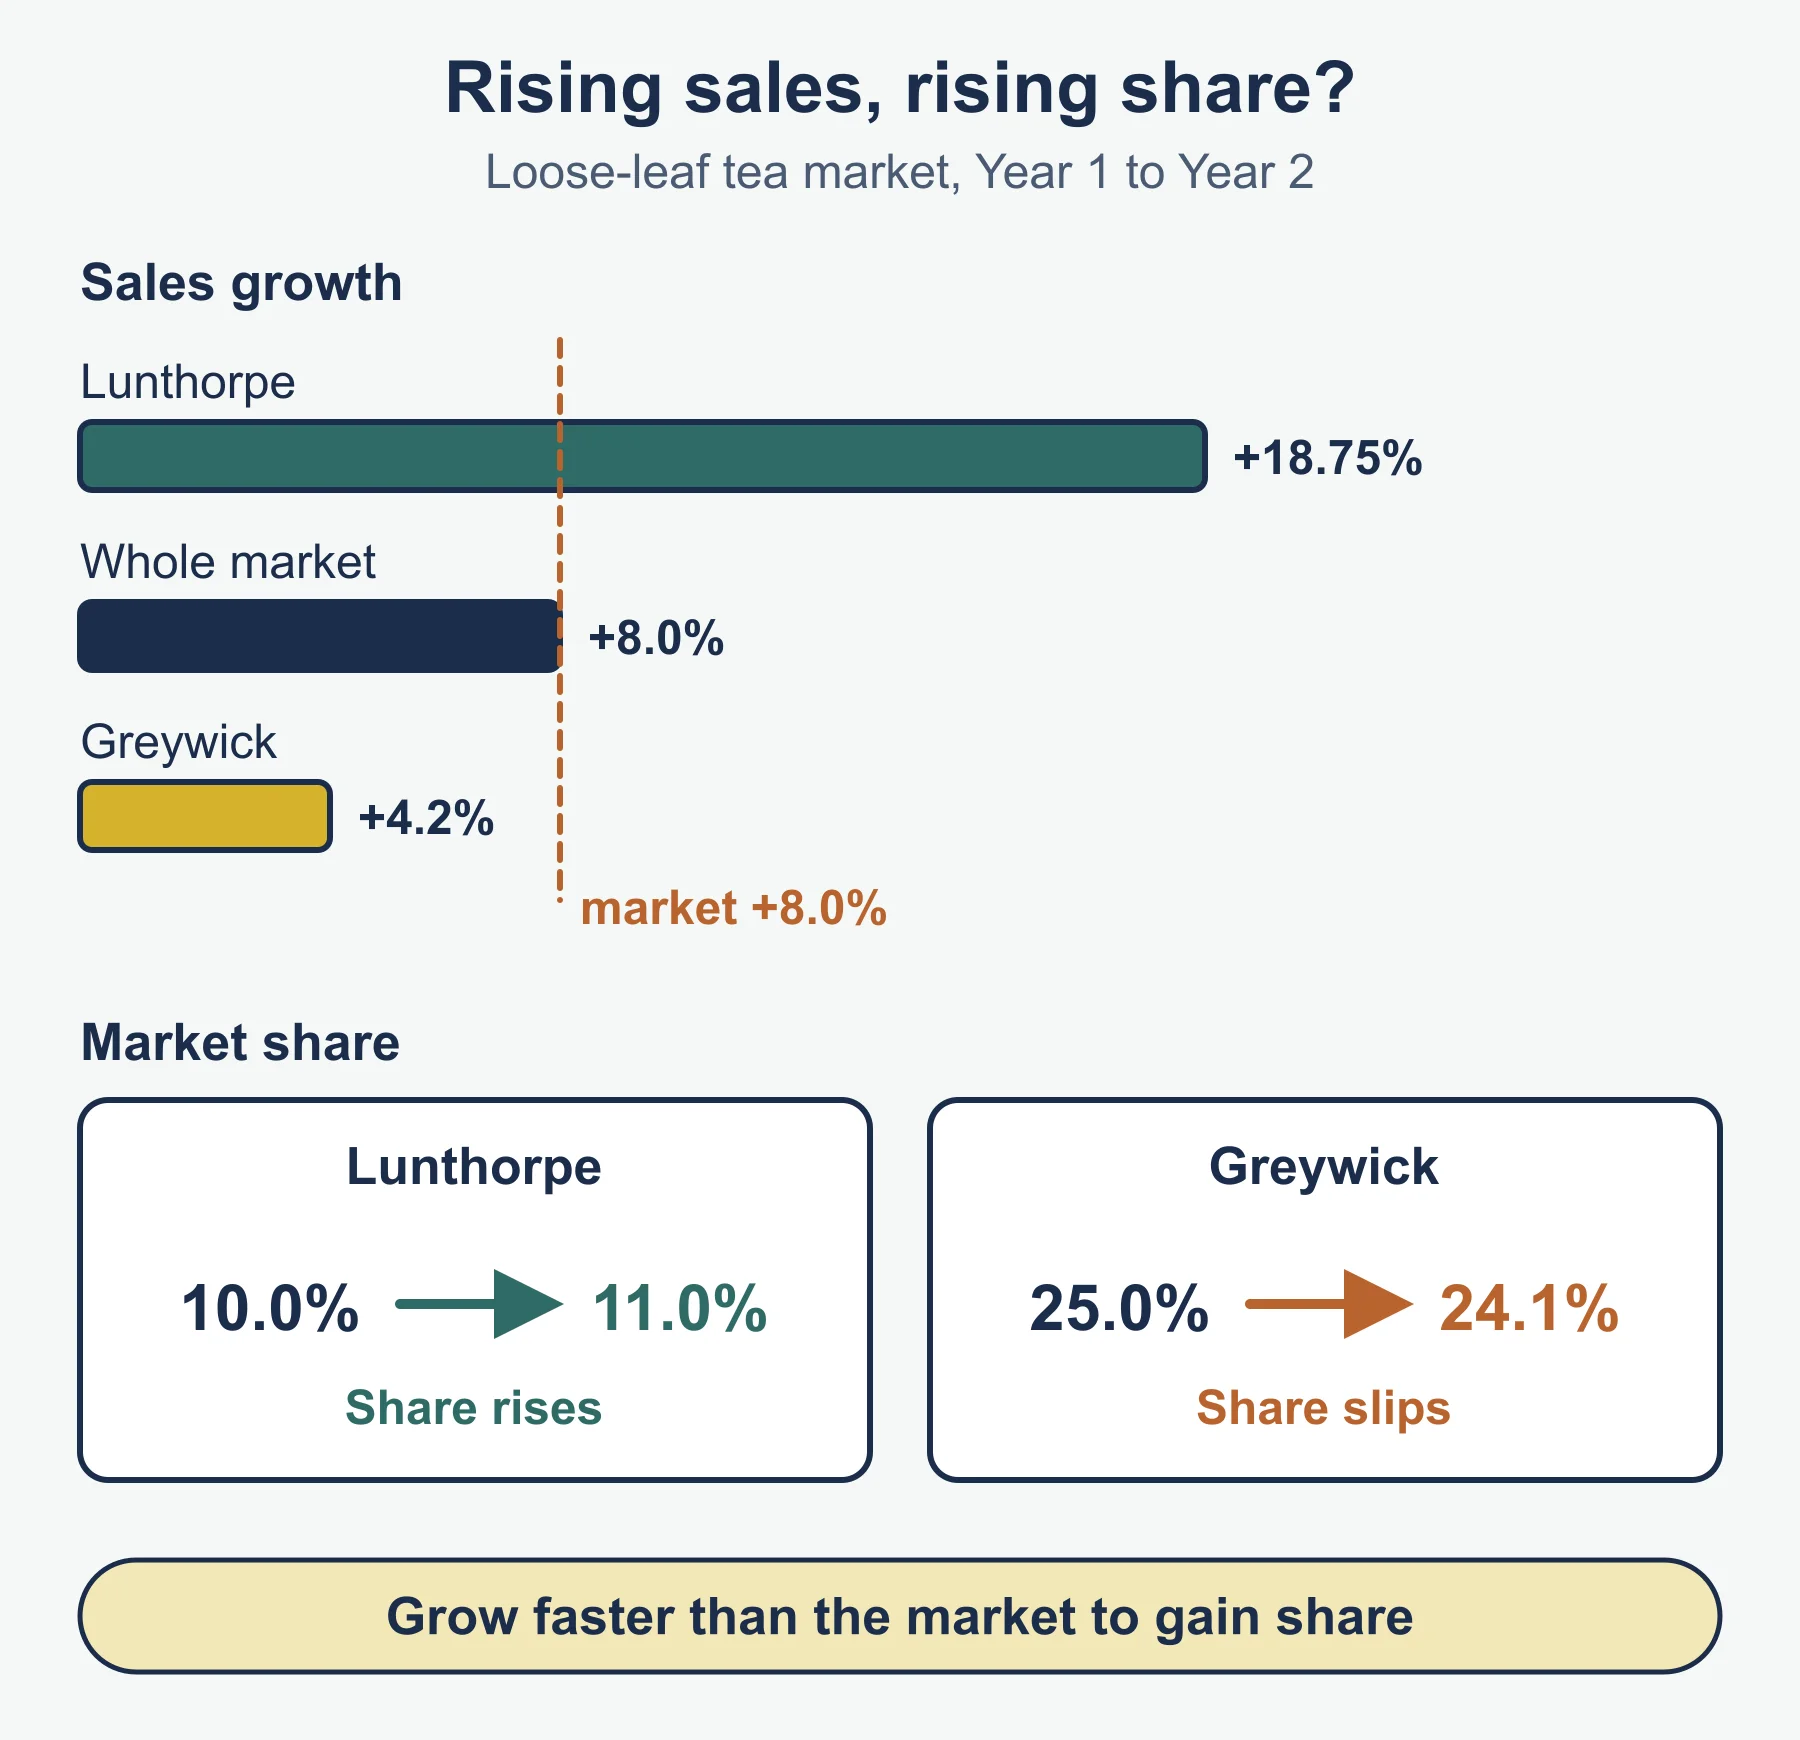
The market leader is the business with the largest share of its market. The guide asks HL candidates to judge why share and leadership matter. Points to weigh:
- Buying power and costs. A large share means large volumes, which can bring lower unit costs and better terms from suppliers.
- Pricing and brand strength. Leaders are often seen as the safe choice, which can support a premium price and make retailers keen to stock them.
- Confidence of stakeholders. Investors, lenders and talented recruits may favor an established leader.
- Costs and risks. Winning share can mean heavy spending on promotion or price cuts that shrink profit. Chasing share for its own sake can hide weak profitability. A big share of a market that is shrinking is a weaker position than a small share of a growing one, which is why share and growth are best read together.
To make this an evaluation, finish with a verdict that depends on the situation: share matters most where costs fall steeply with volume, and least where customers buy on individual taste.
4.2 Marketing planning
The role of marketing planning
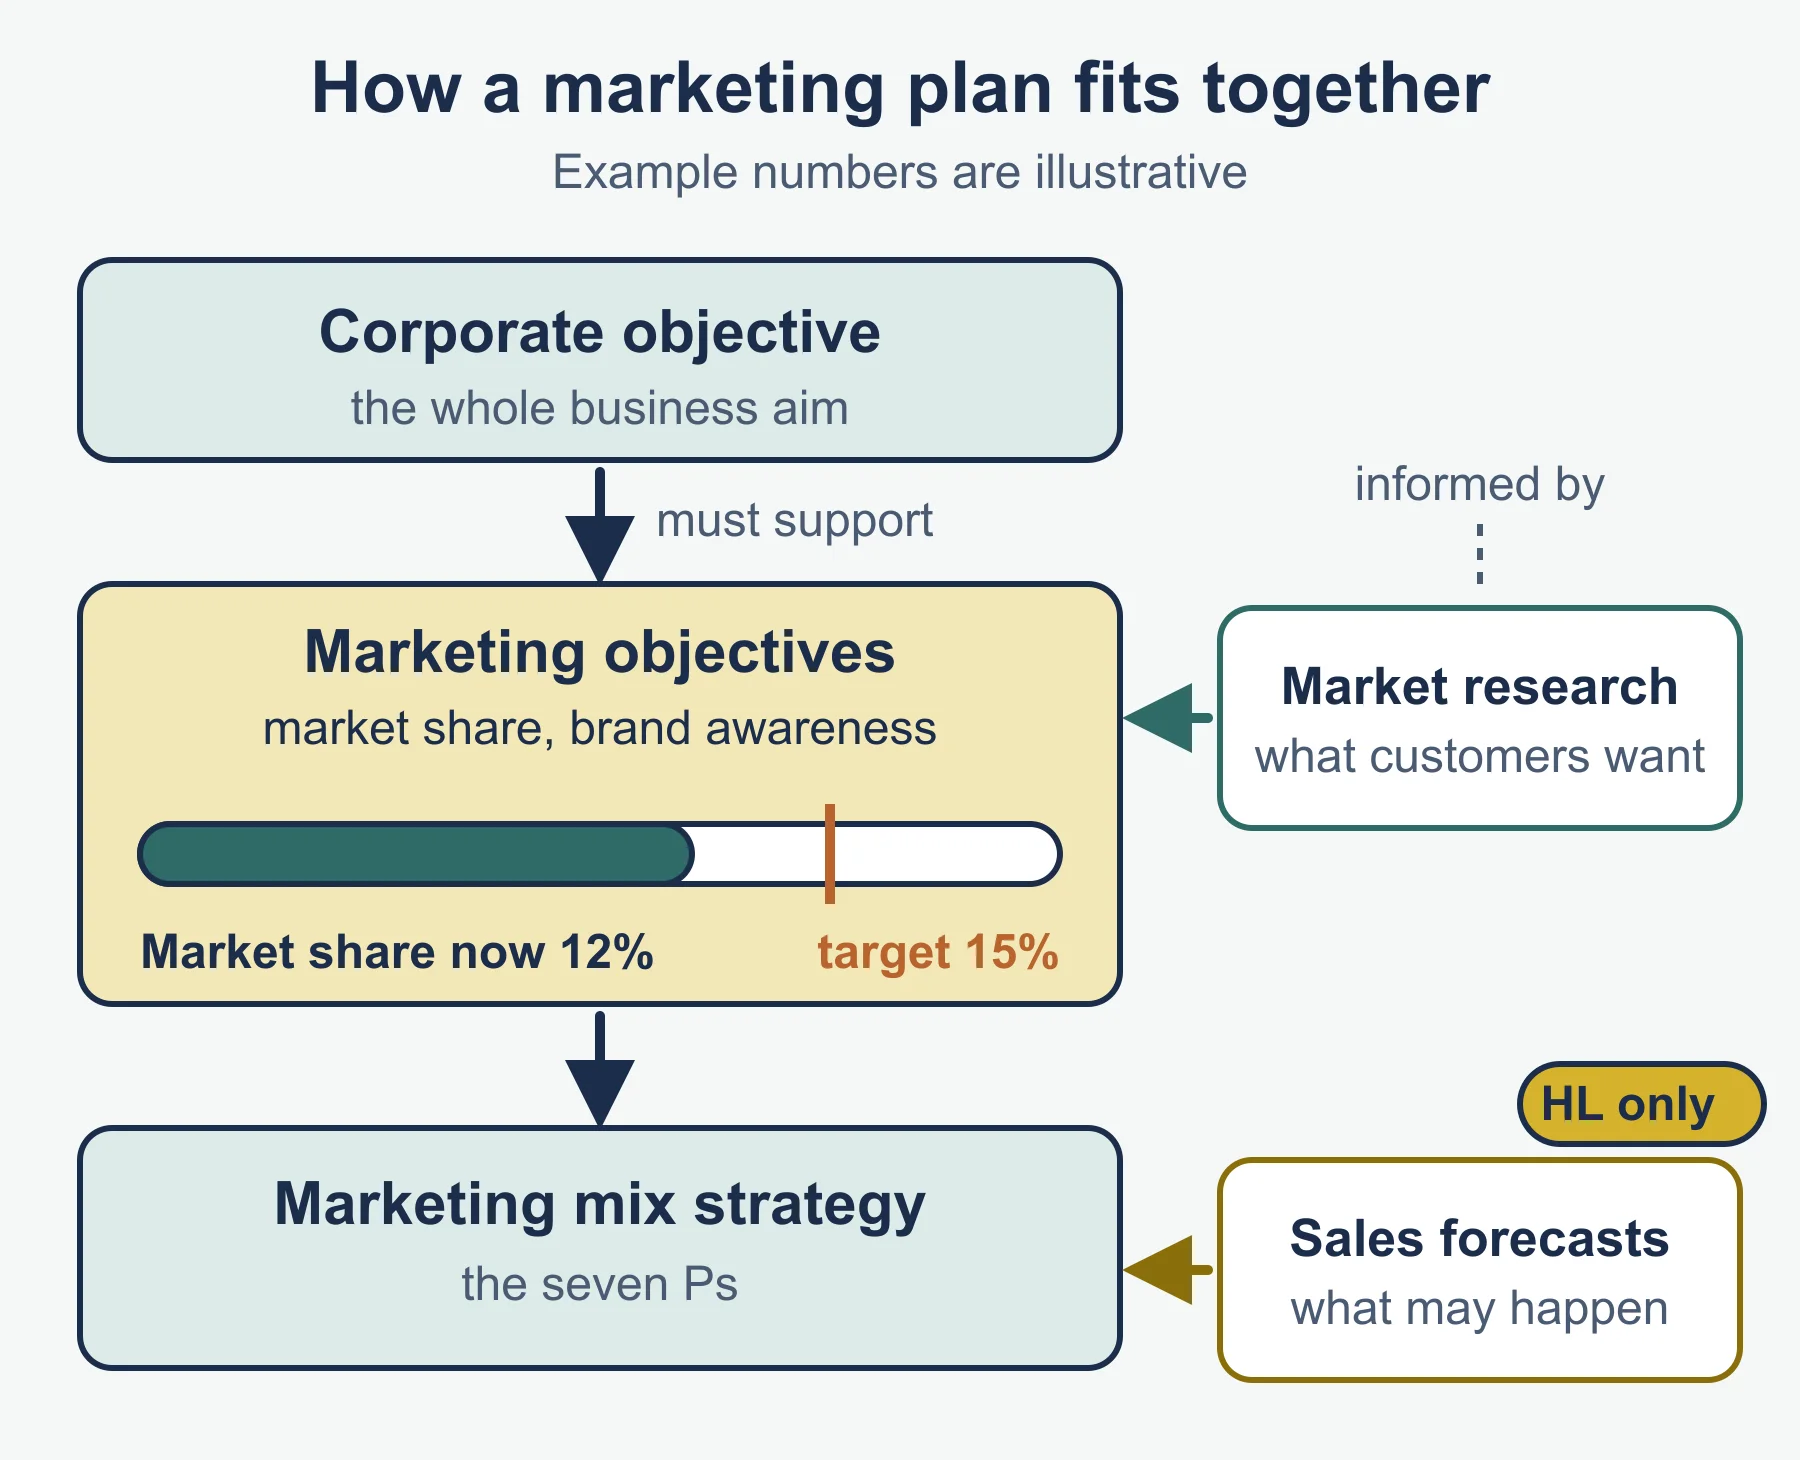
A marketing plan turns the business’s overall objectives into specific marketing aims and actions. It usually states who the customers are, what the business wants to achieve (such as a target share or sales level), how it will compete, who is responsible, and when and with what budget. Planning gives marketing a direction, helps managers allocate scarce money, makes results easier to measure against targets, and keeps marketing consistent with other departments. The weakness is that plans rest on assumptions: a plan written before a rival launches a cheaper product may need rapid revision. A SWOT or STEEPLE analysis is a sensible input because it records the strengths, weaknesses and external changes the plan has to respond to.
Segmentation, targeting and positioning
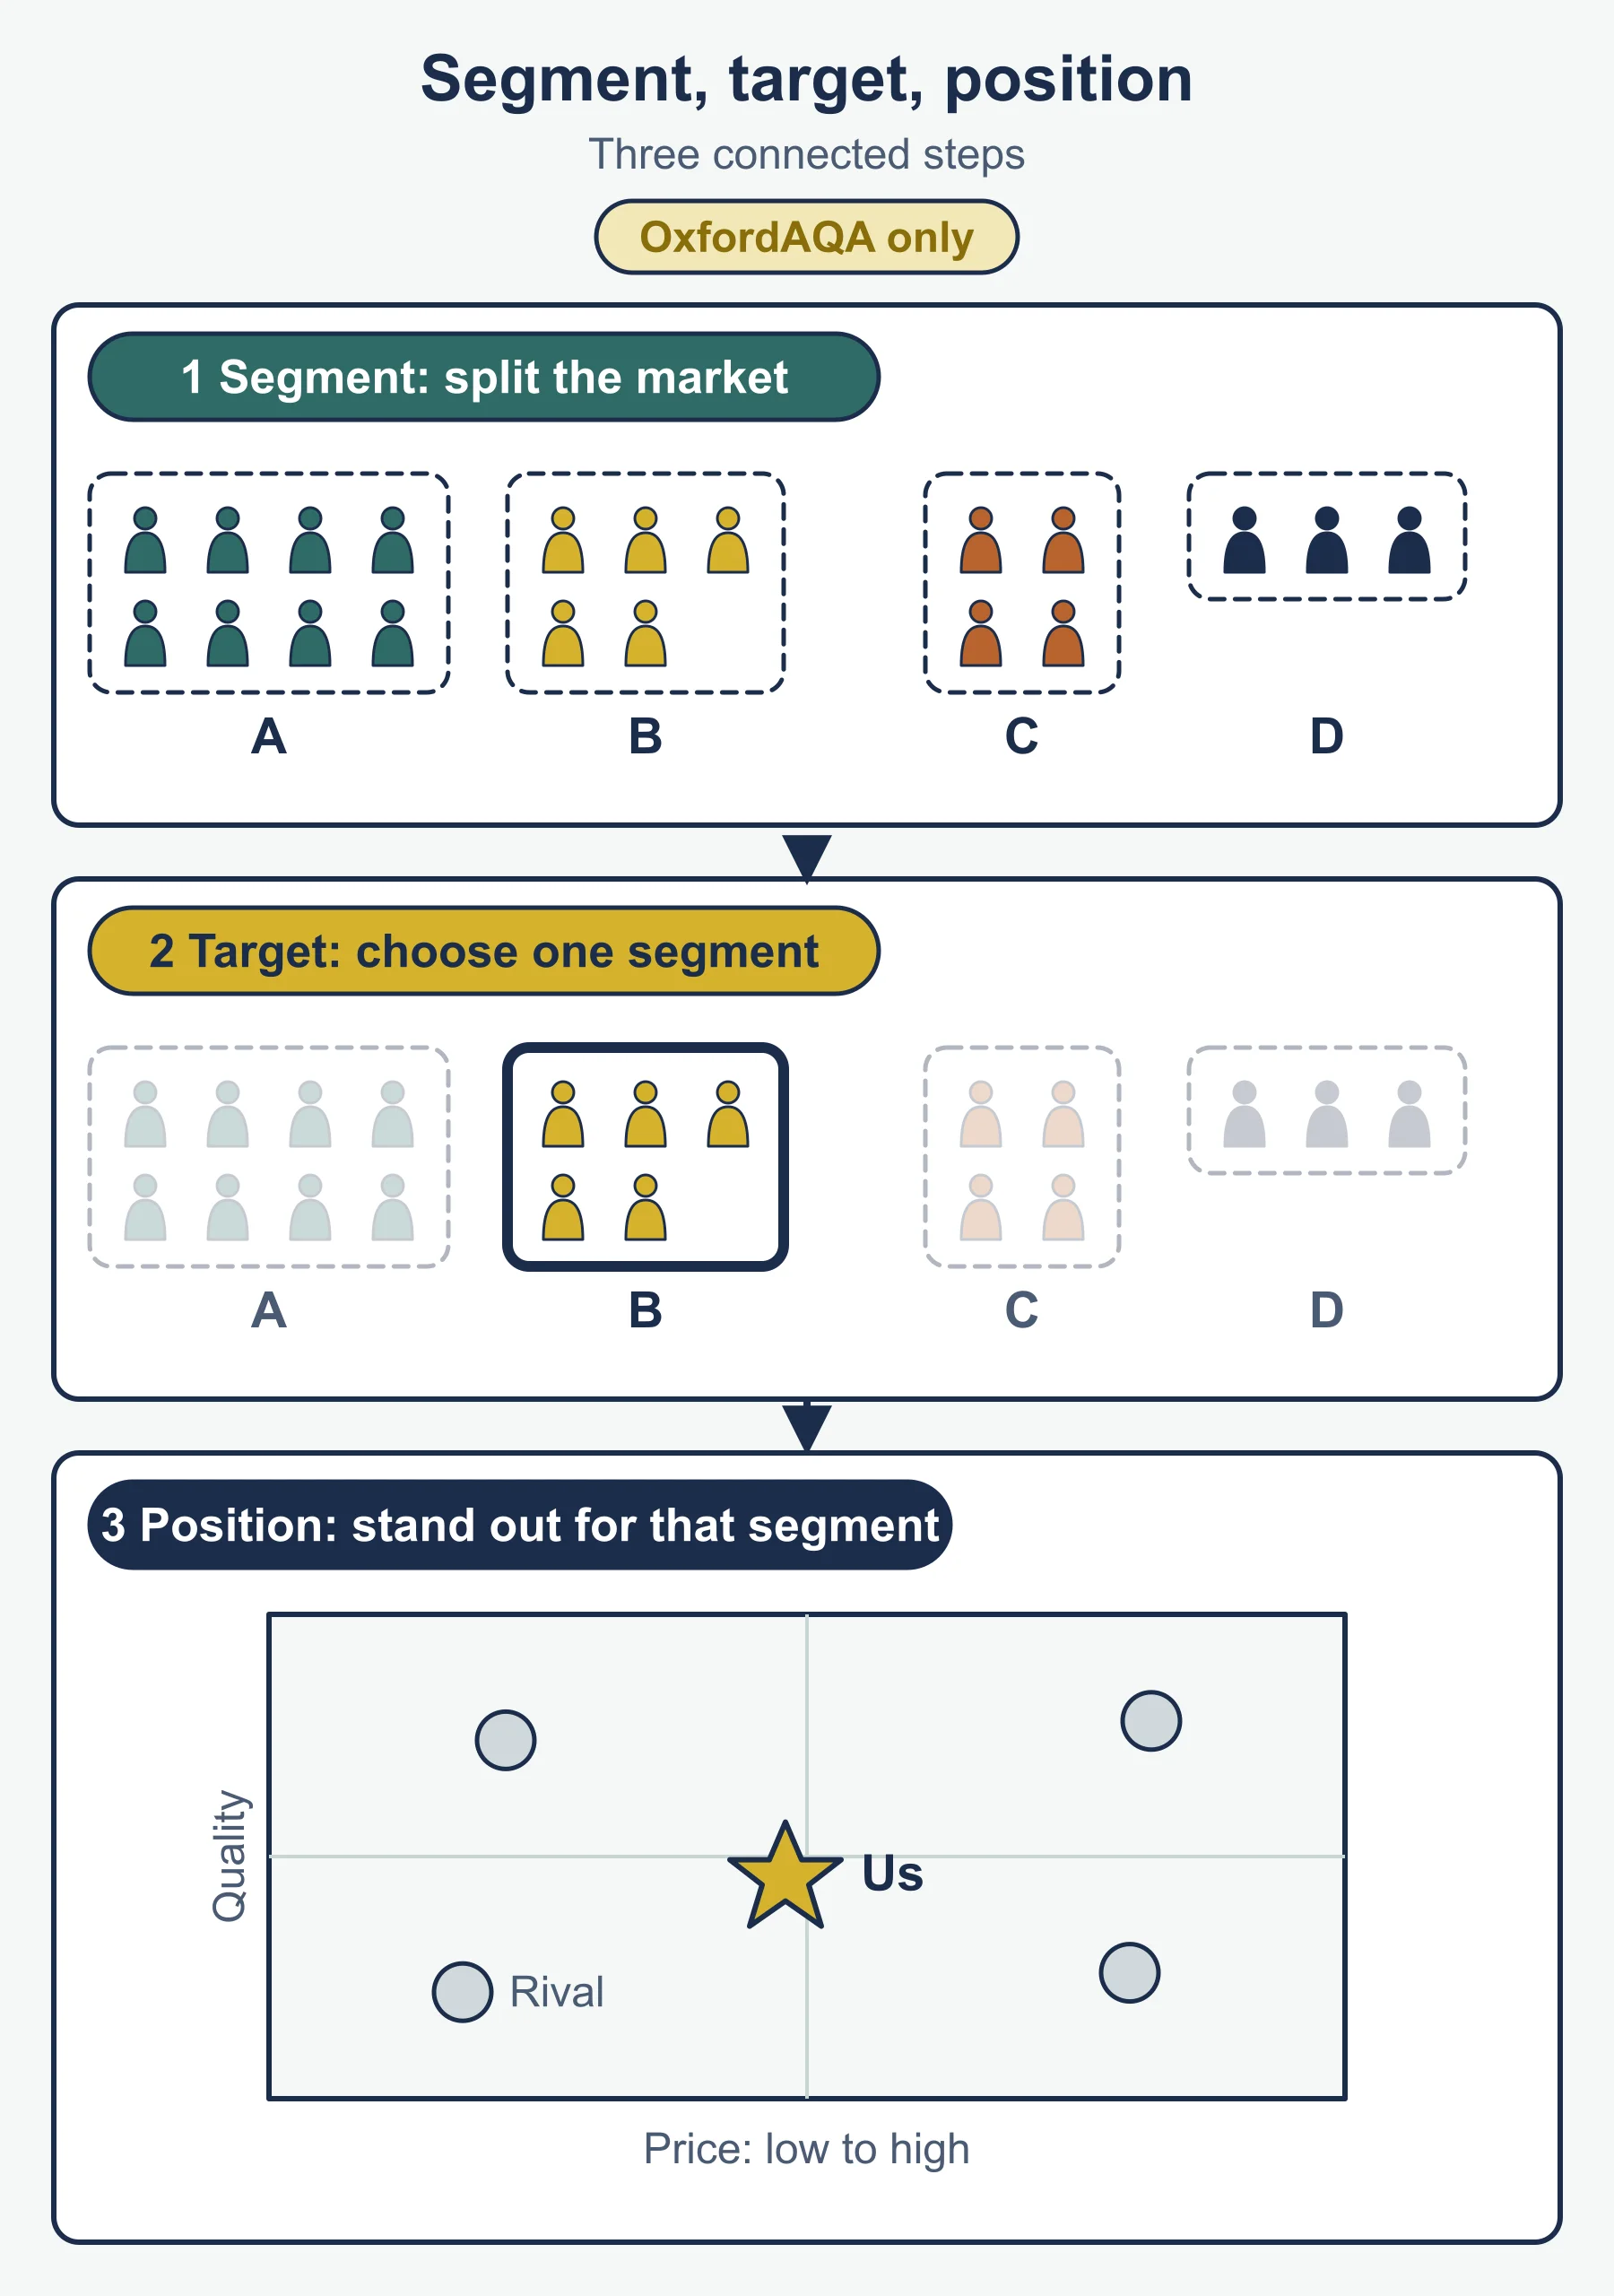
These three steps usually run in order.
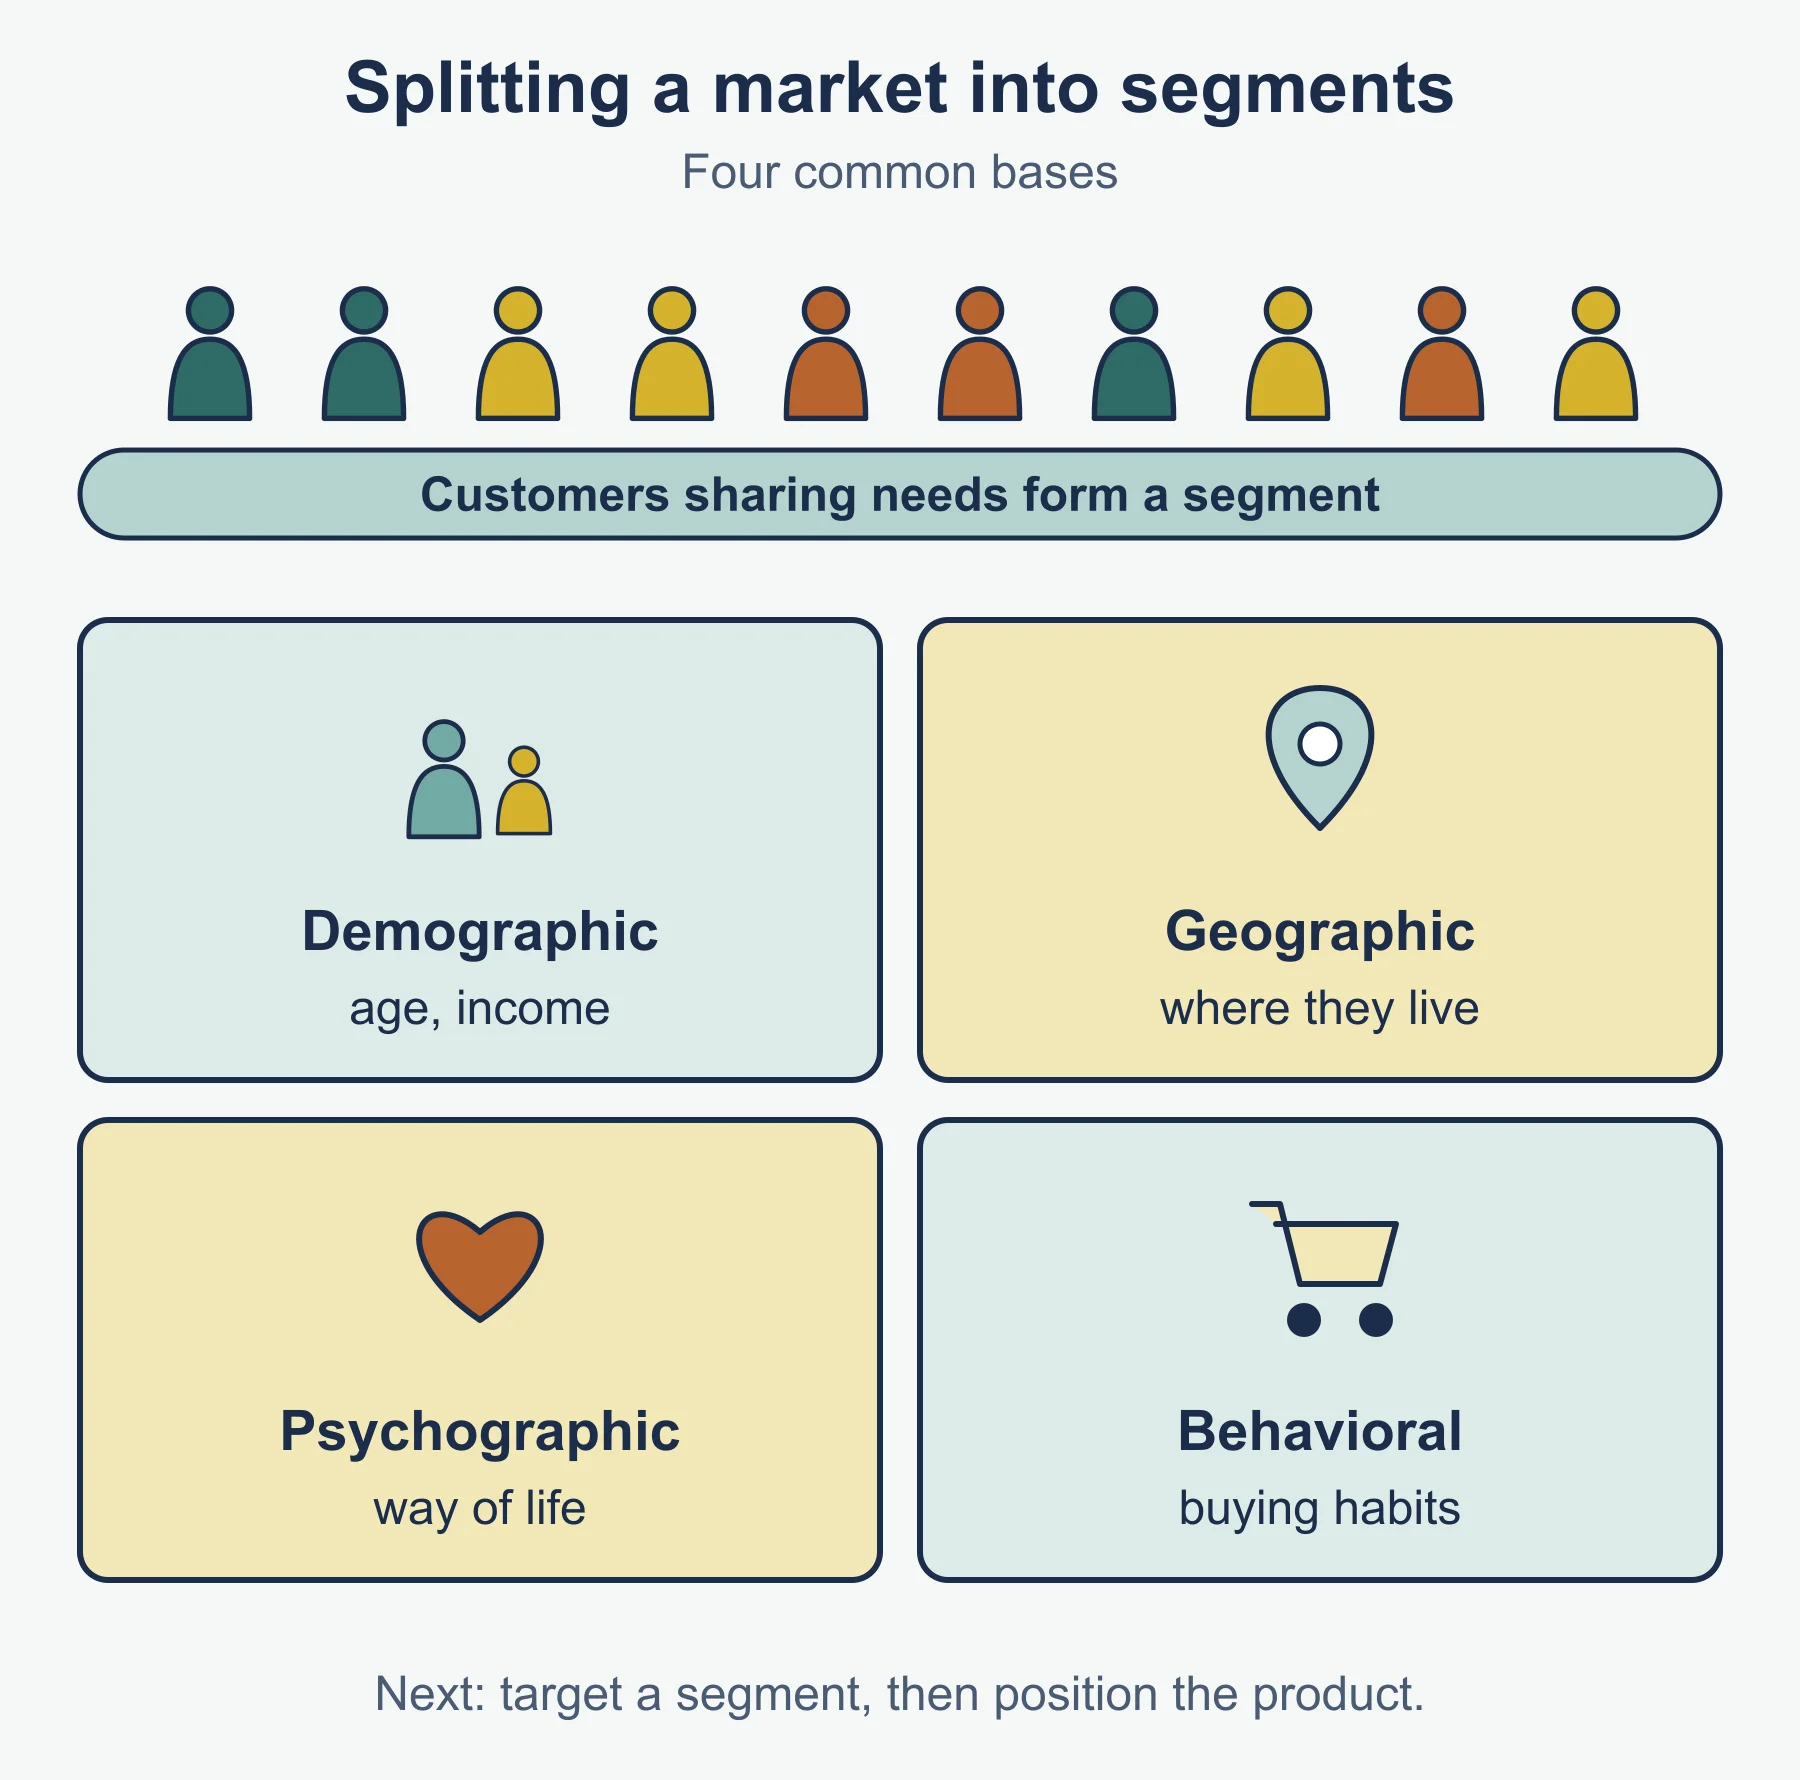
- Segmentation divides a market into groups of customers who share needs or characteristics. Common bases are age and income (demographic), place (geographic), way of life (psychographic) and buying habits (behavioral).
- Targeting chooses which segment or segments the business will serve: the target market.
- Positioning decides how customers should see the product compared with rivals. A position map plots brands on two axes, such as price and quality, so the business can see crowded areas and gaps.
Worked example: Cadwallow Cycles. Cadwallow studies three segments of the adult bicycle market in one country.
| Segment | Buyers per year | Average spend (USD) | Segment value (USD million) |
|---|---|---|---|
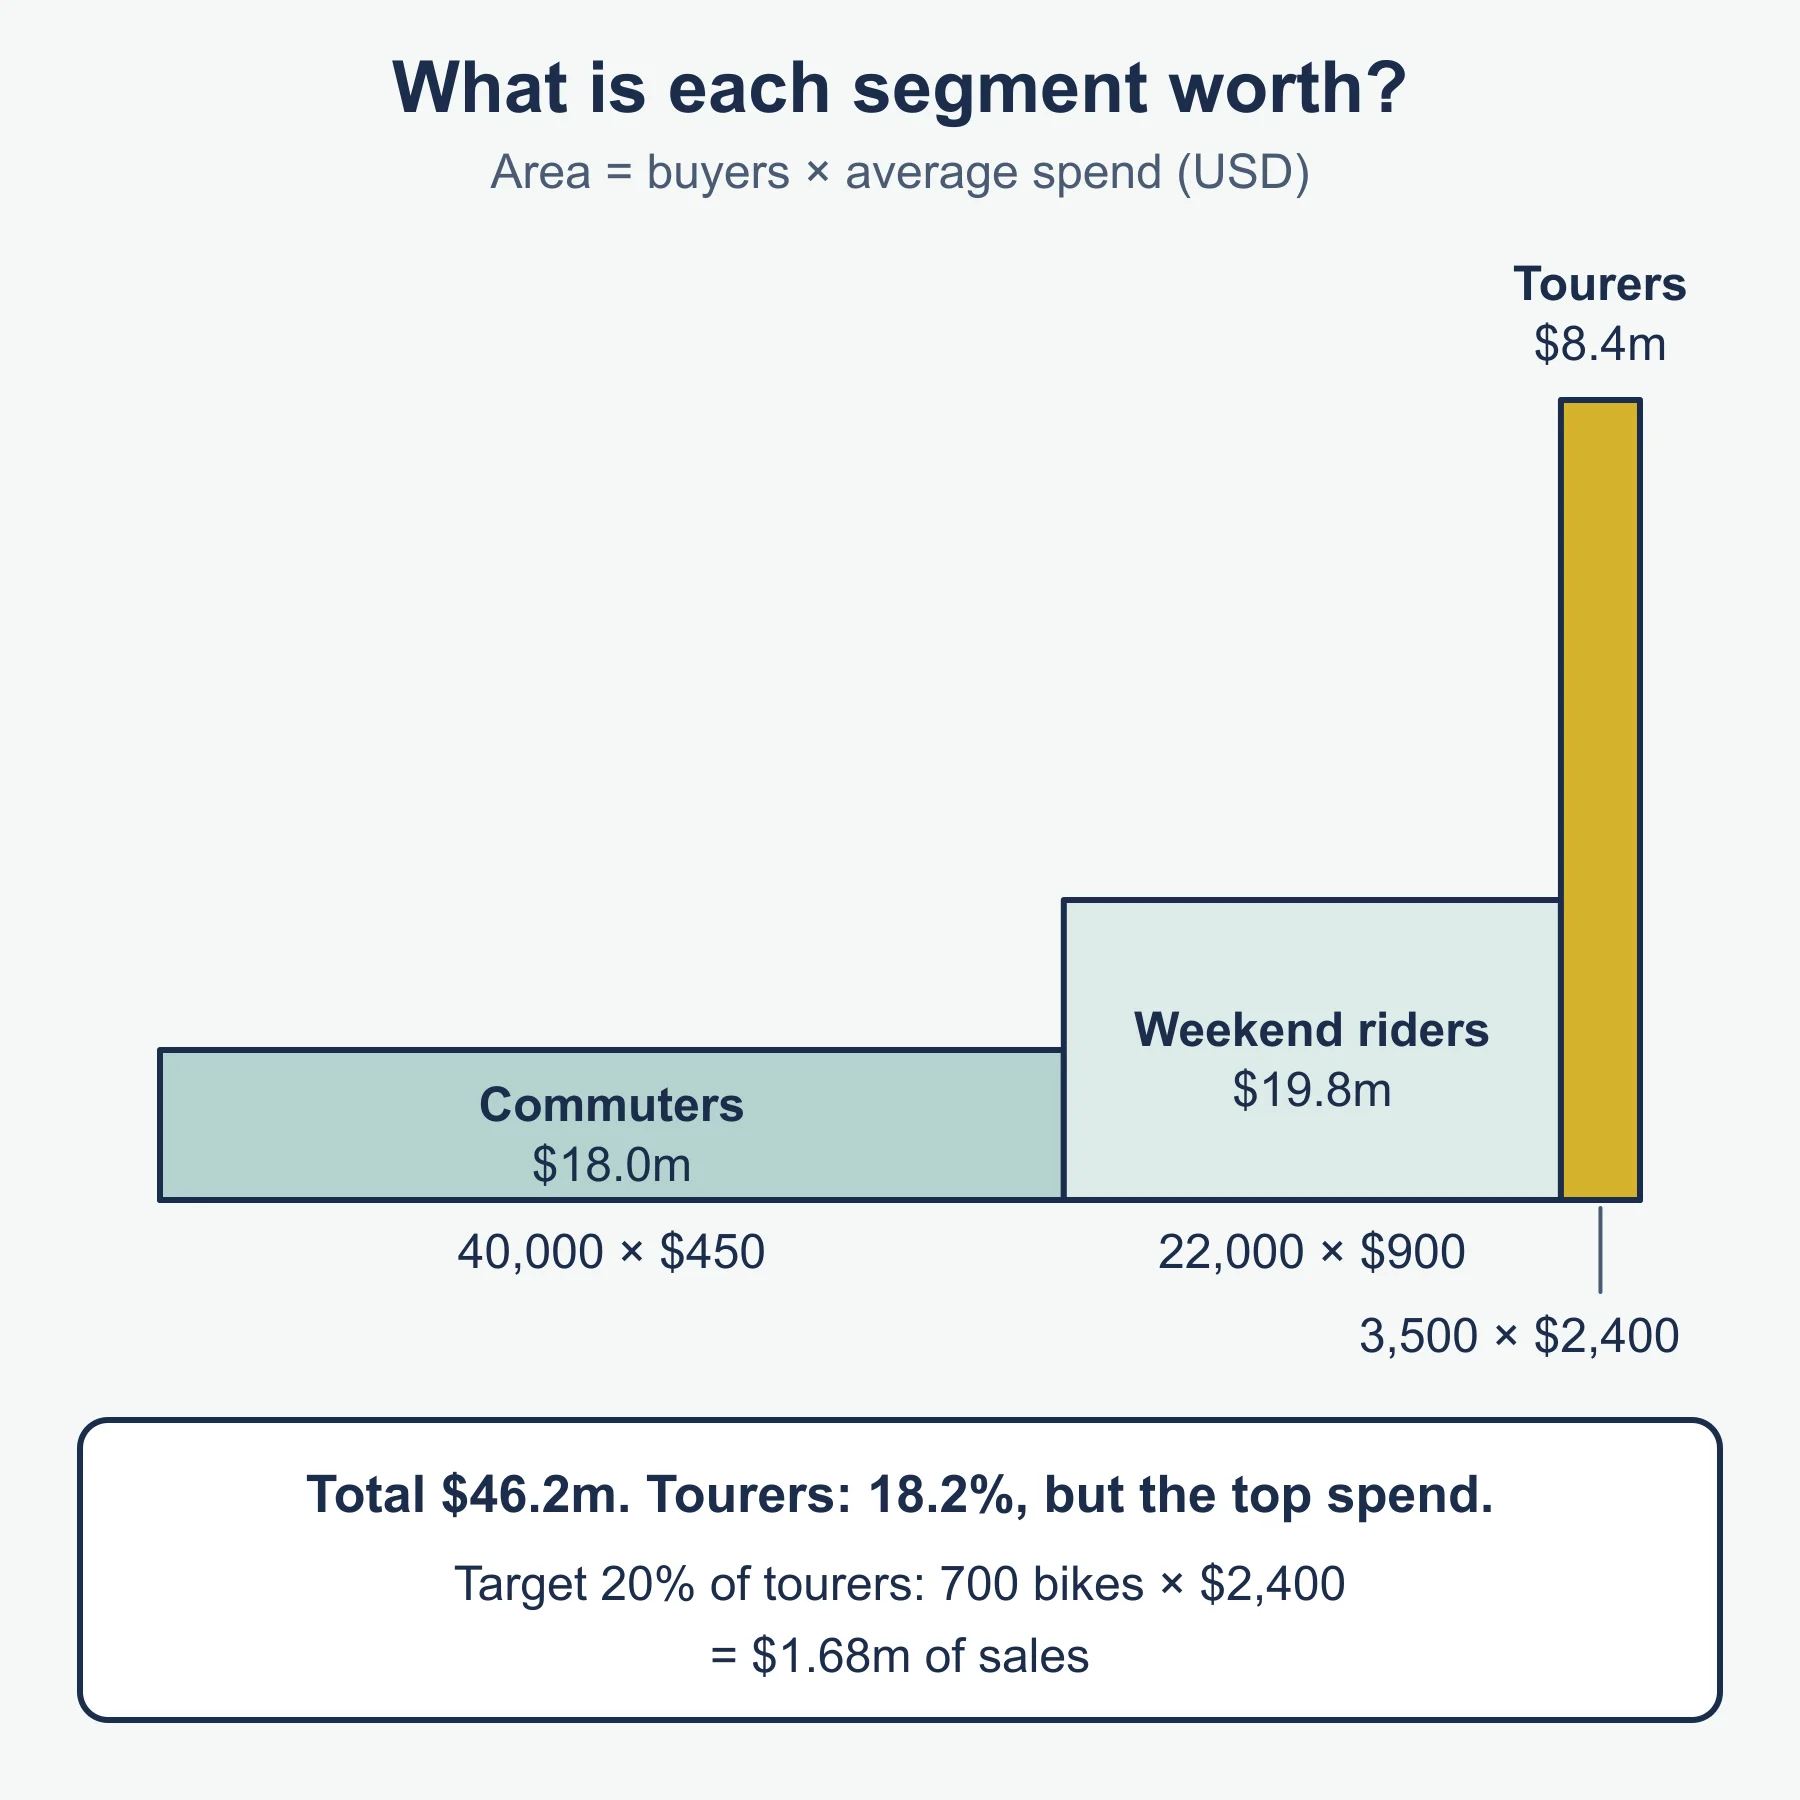
| Commuters | 40,000 | 450 | 18.0 |
| Weekend riders | 22,000 | 900 | 19.8 |
| Long-distance tourers | 3,500 | 2,400 | 8.4 |
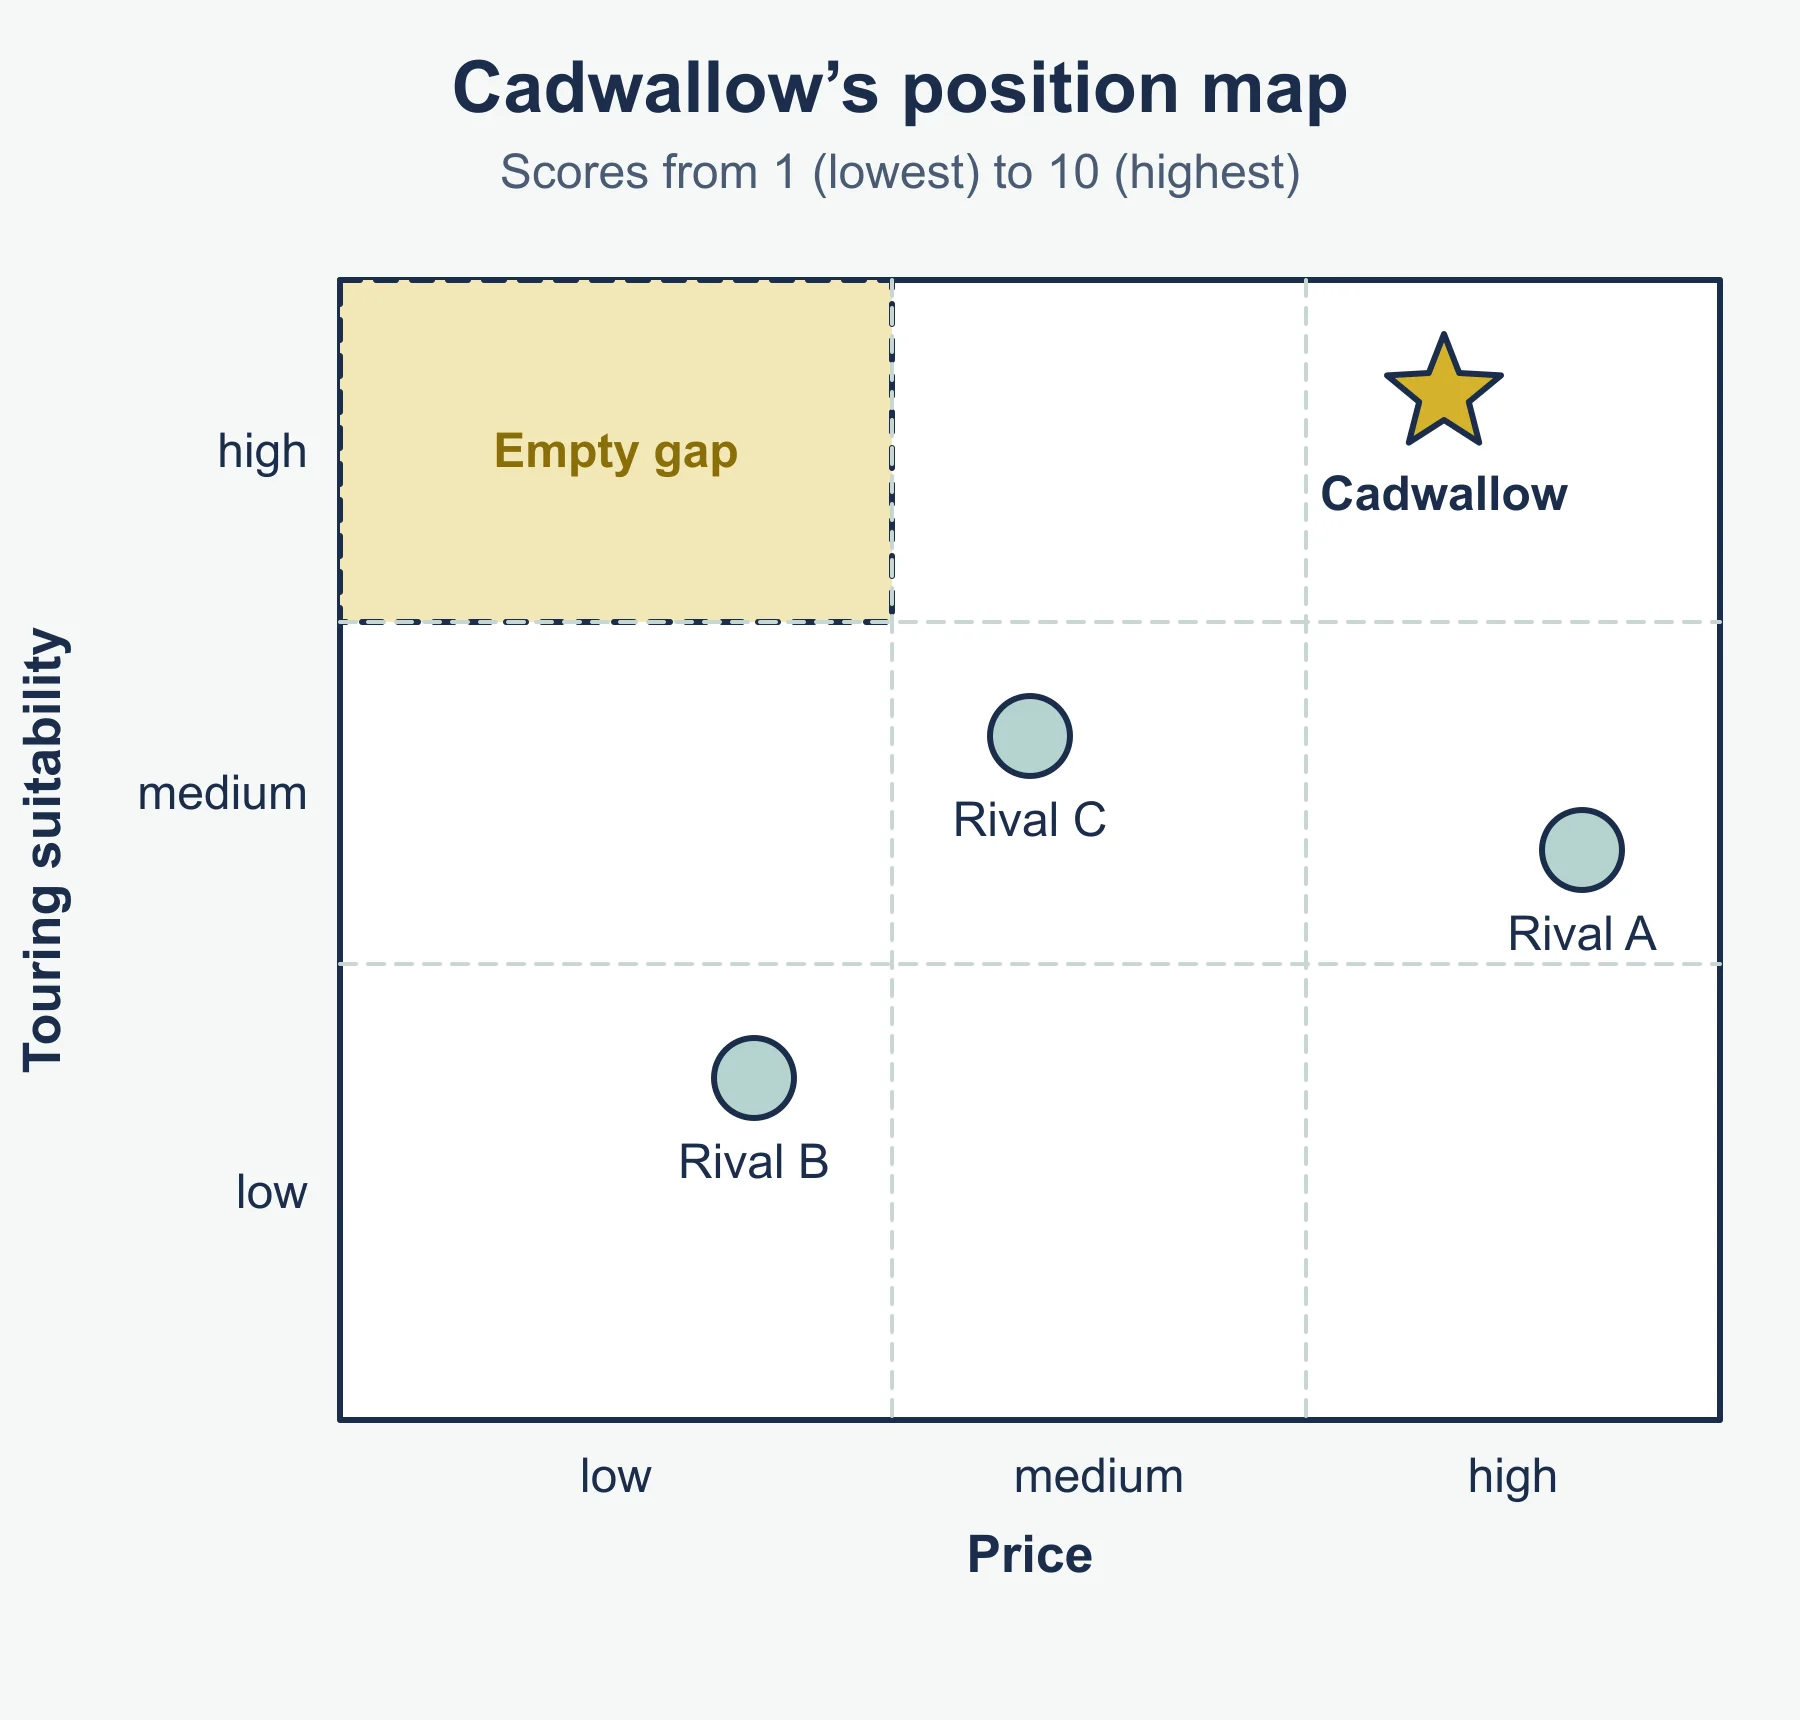
The total across the three segments is USD 46.2 million, so tourers are about 18.2% of it. Cadwallow chooses tourers and aims for a 20% share of that segment: 20% of 3,500 buyers is 700 bicycles, or USD 1.68 million of sales. It then maps four brands, scoring price and suitability for touring from 1 (lowest) to 10 (highest).
| Brand | Price (1-10) | Touring suitability (1-10) |
|---|---|---|
| Cadwallow | 8 | 9 |
| Rival A | 9 | 5 |
| Rival B | 3 | 3 |
| Rival C | 5 | 6 |
Touring suitability
high    |  empty gap       |                  |  CADWALLOW       |
medium  |                  |  Rival C         |  Rival A         |
low     |  Rival B         |                  |                  |
          low price          medium price       high price
Reading the map: Cadwallow is positioned as a premium touring specialist. The empty top-left cell (a low-priced tourer) is a gap, but the map cannot say whether enough customers would pay for it. Further research would be needed before moving into it.
Niche market and mass market
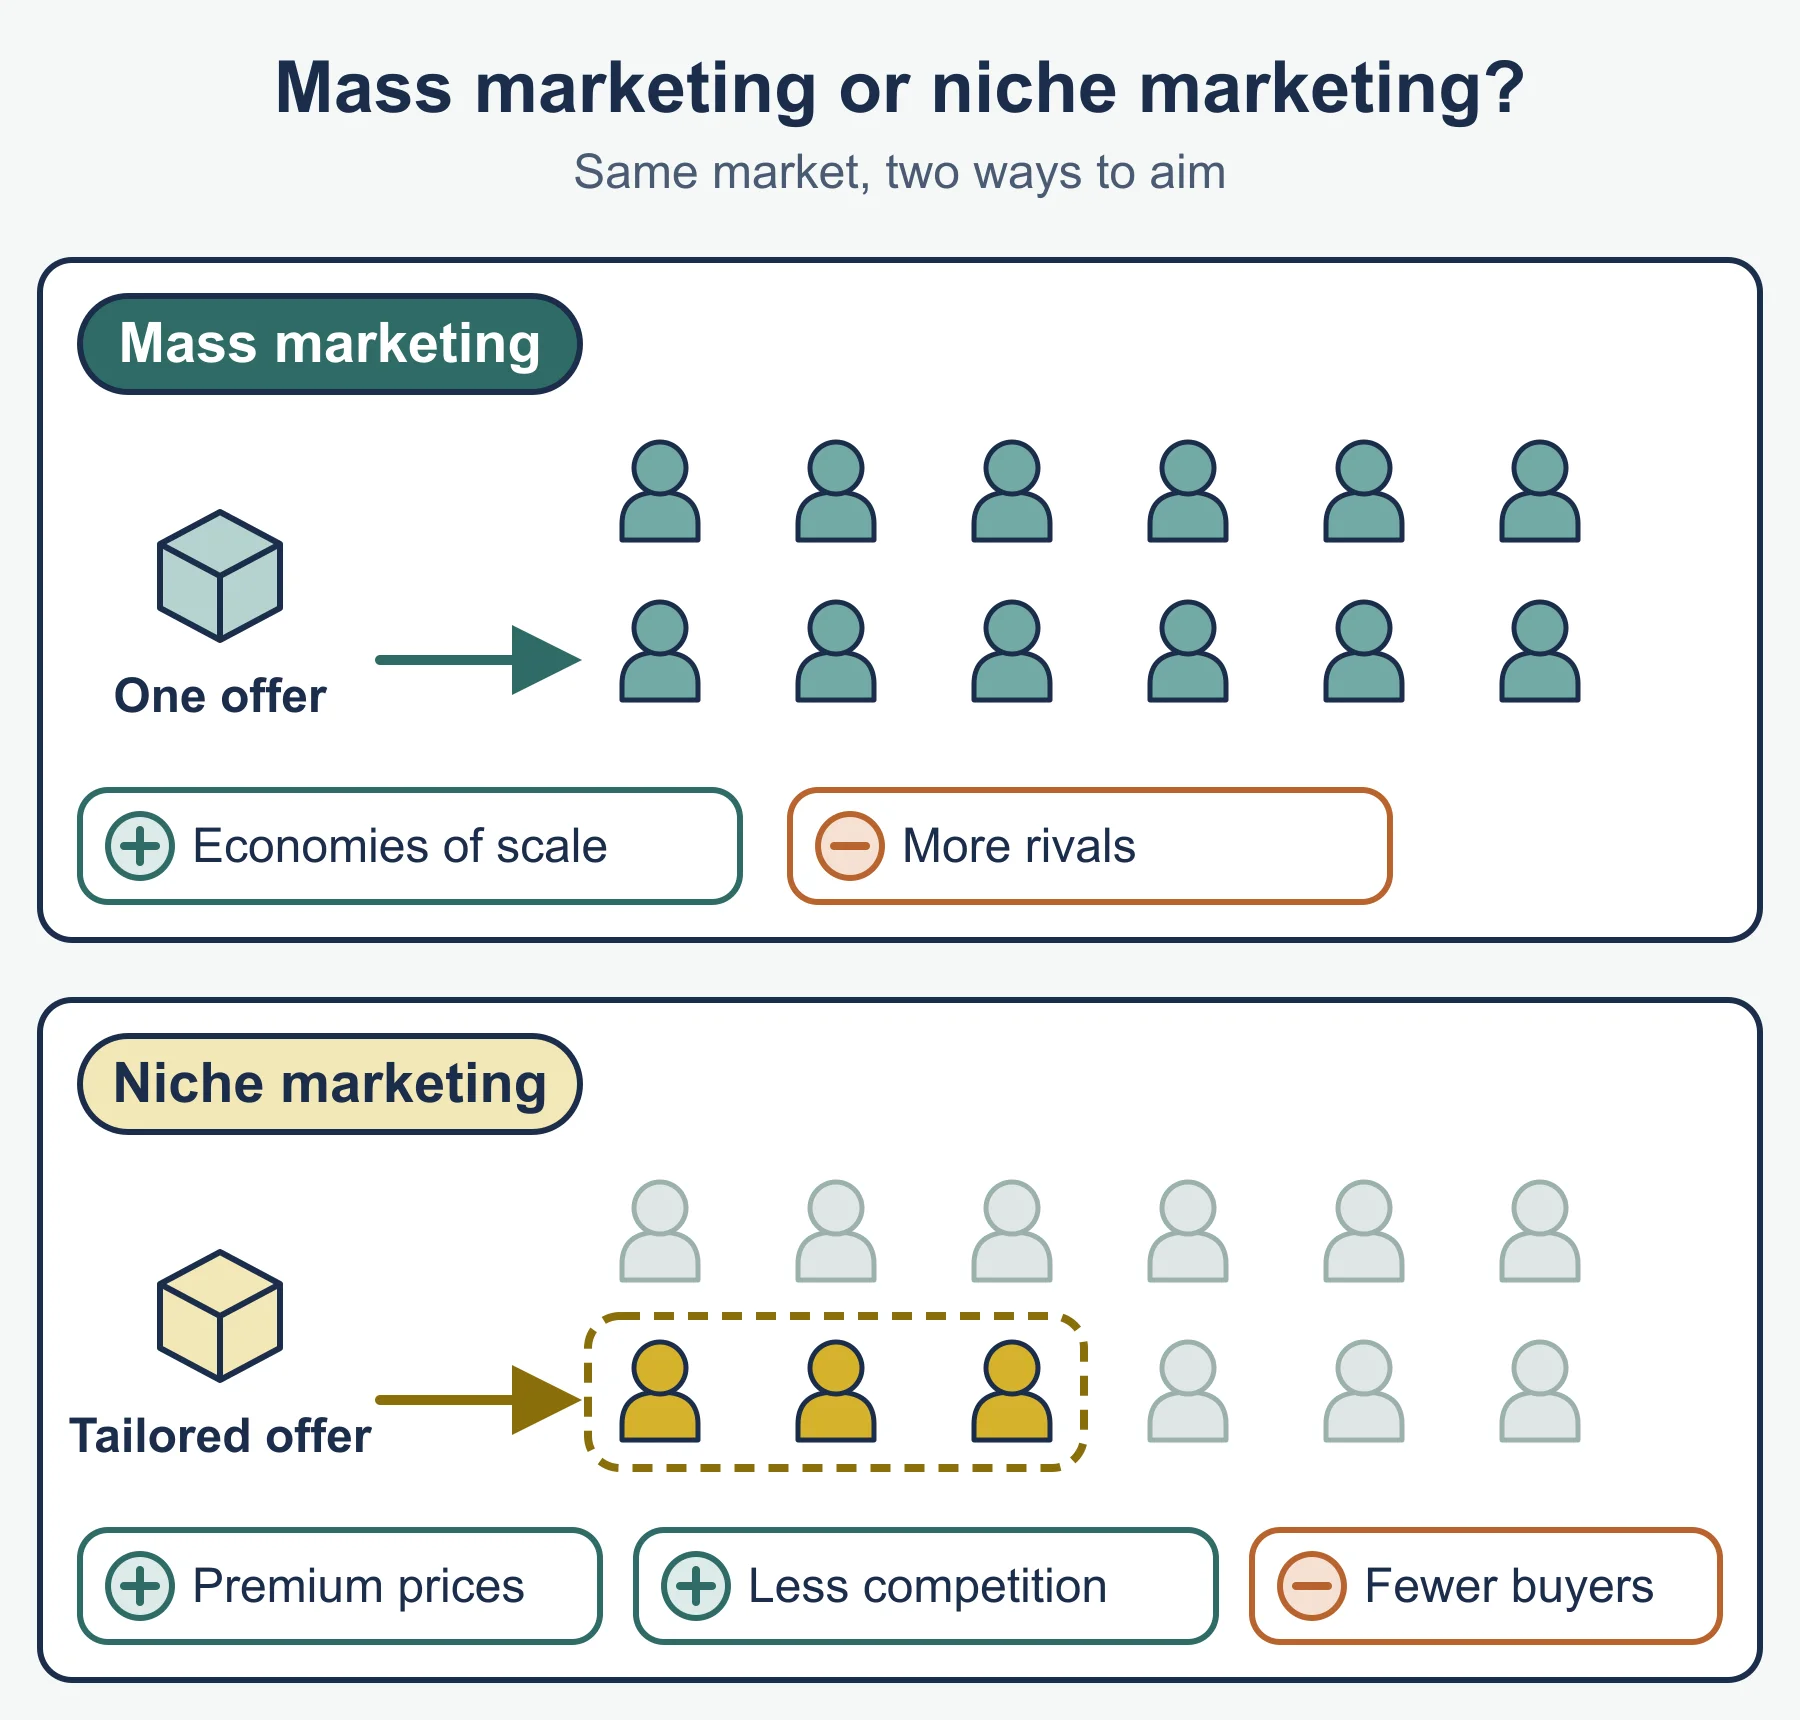
A niche market is a small, specialized segment with distinct needs. A mass market is a large market of customers with broadly similar needs, served with a standard offer.
| Niche market | Mass market | |
|---|---|---|
| Customers | Few, with specific needs | Many, with common needs |
| Competition | Often less, but a big rival can enter | Usually intense |
| Price | Often higher, since customers value the fit | Often lower, driven by volume |
| Risk | Dependence on a small customer base | Low margins; hard to stand out |
In the Cadwallow case, the niche has the smallest value but the highest spend per buyer, which is why a specialist can profit there.
The importance of a USP
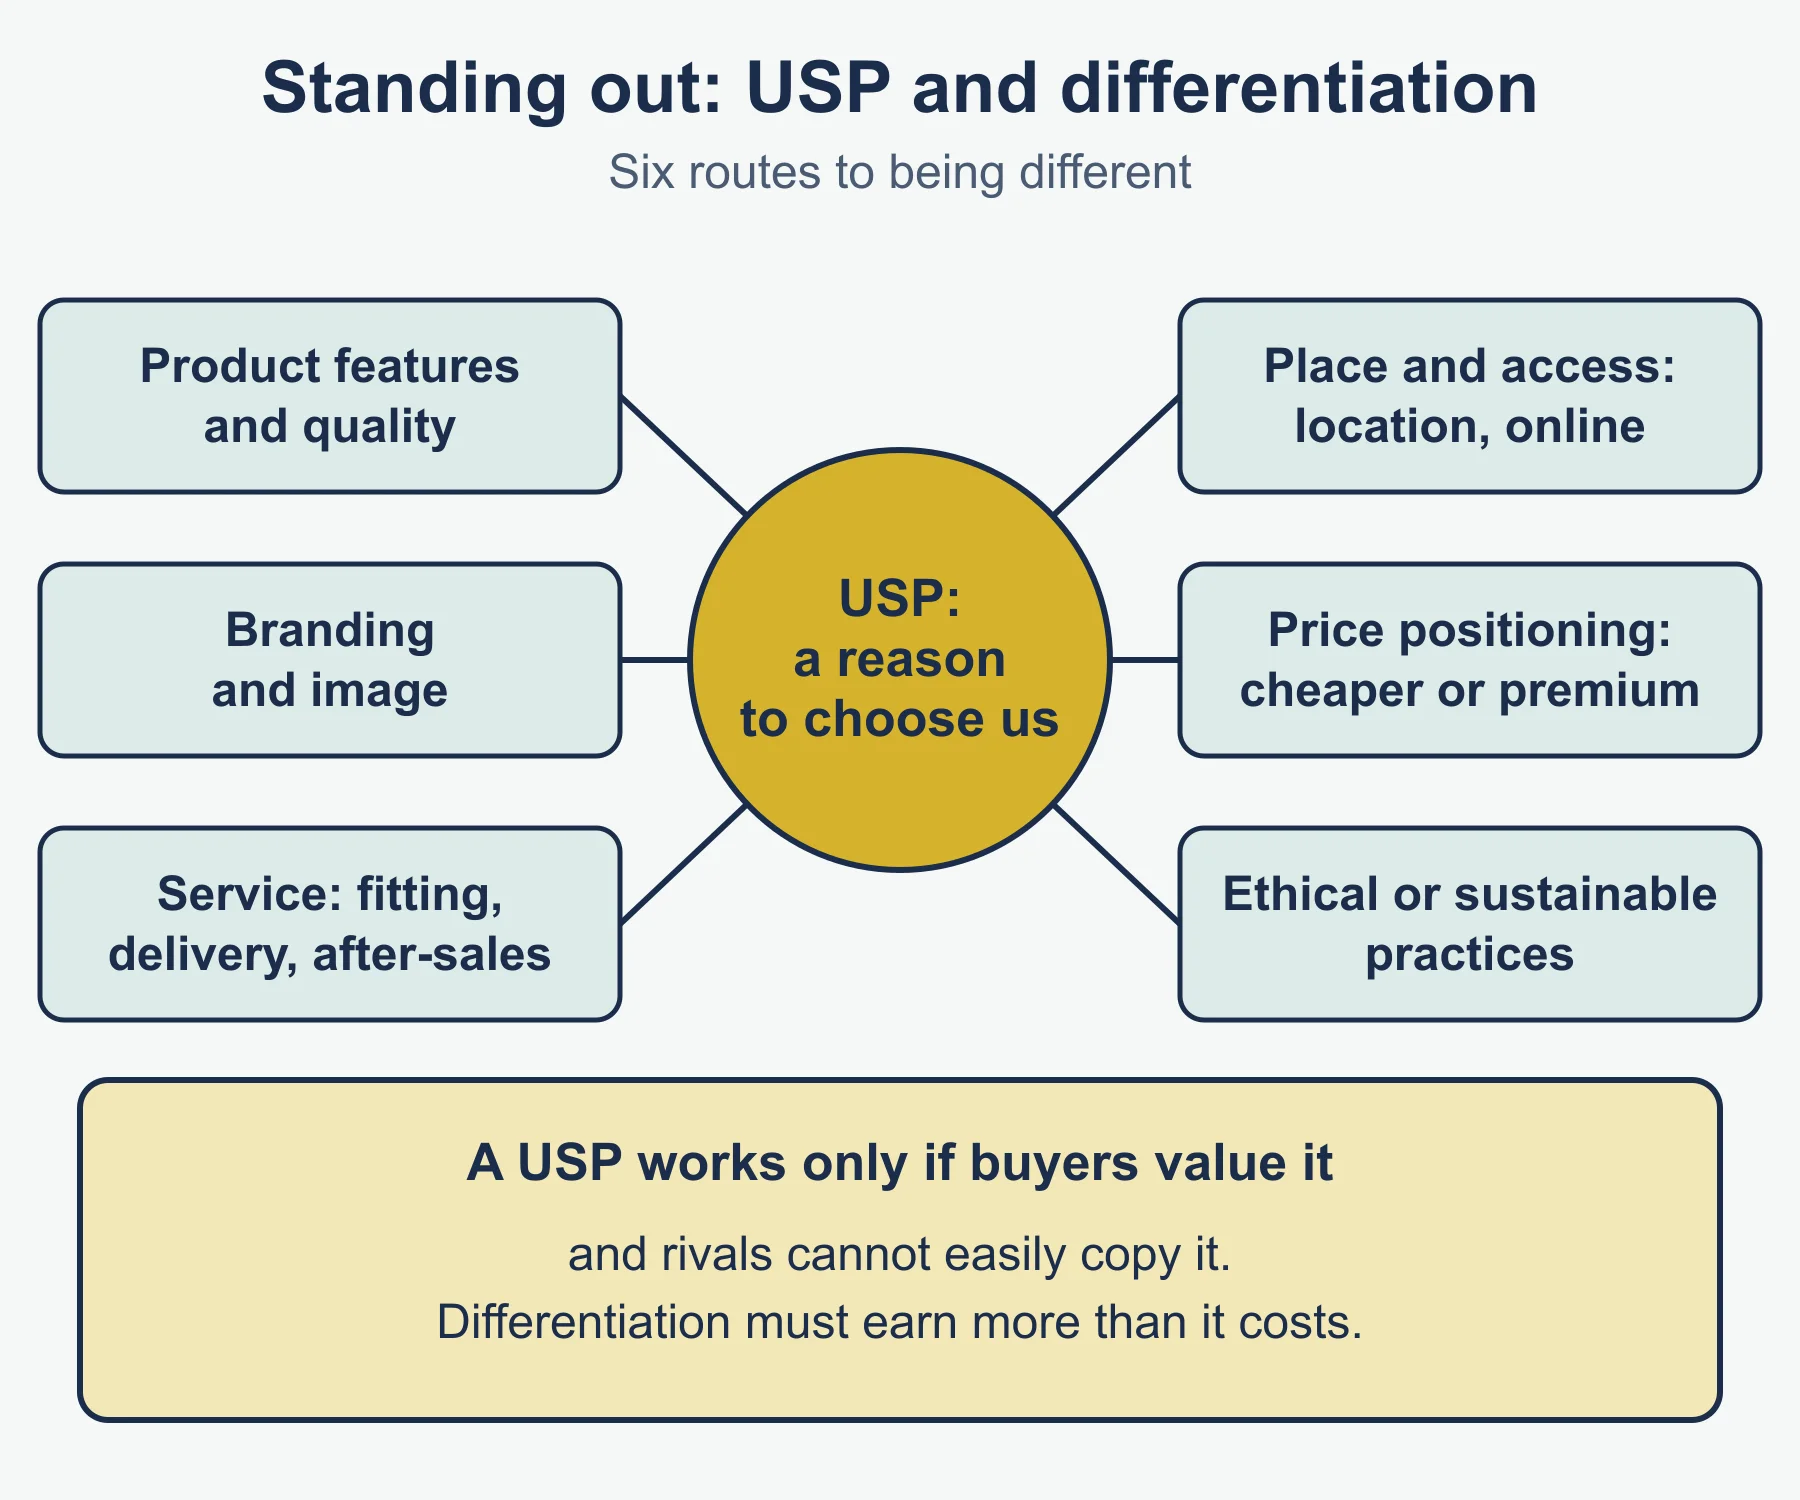
A unique selling point/proposition (USP) is the feature or benefit that sets a product apart in a way customers care about. It matters because it gives customers a reason to choose this brand, can support a higher price, simplifies advertising to one clear message, and makes the product harder to copy if it rests on something rivals cannot match. A USP is weakened when it is easy to imitate or when buyers do not value it. Cadwallow’s USP might be frames sized and tested for loaded touring.
How organizations differentiate themselves
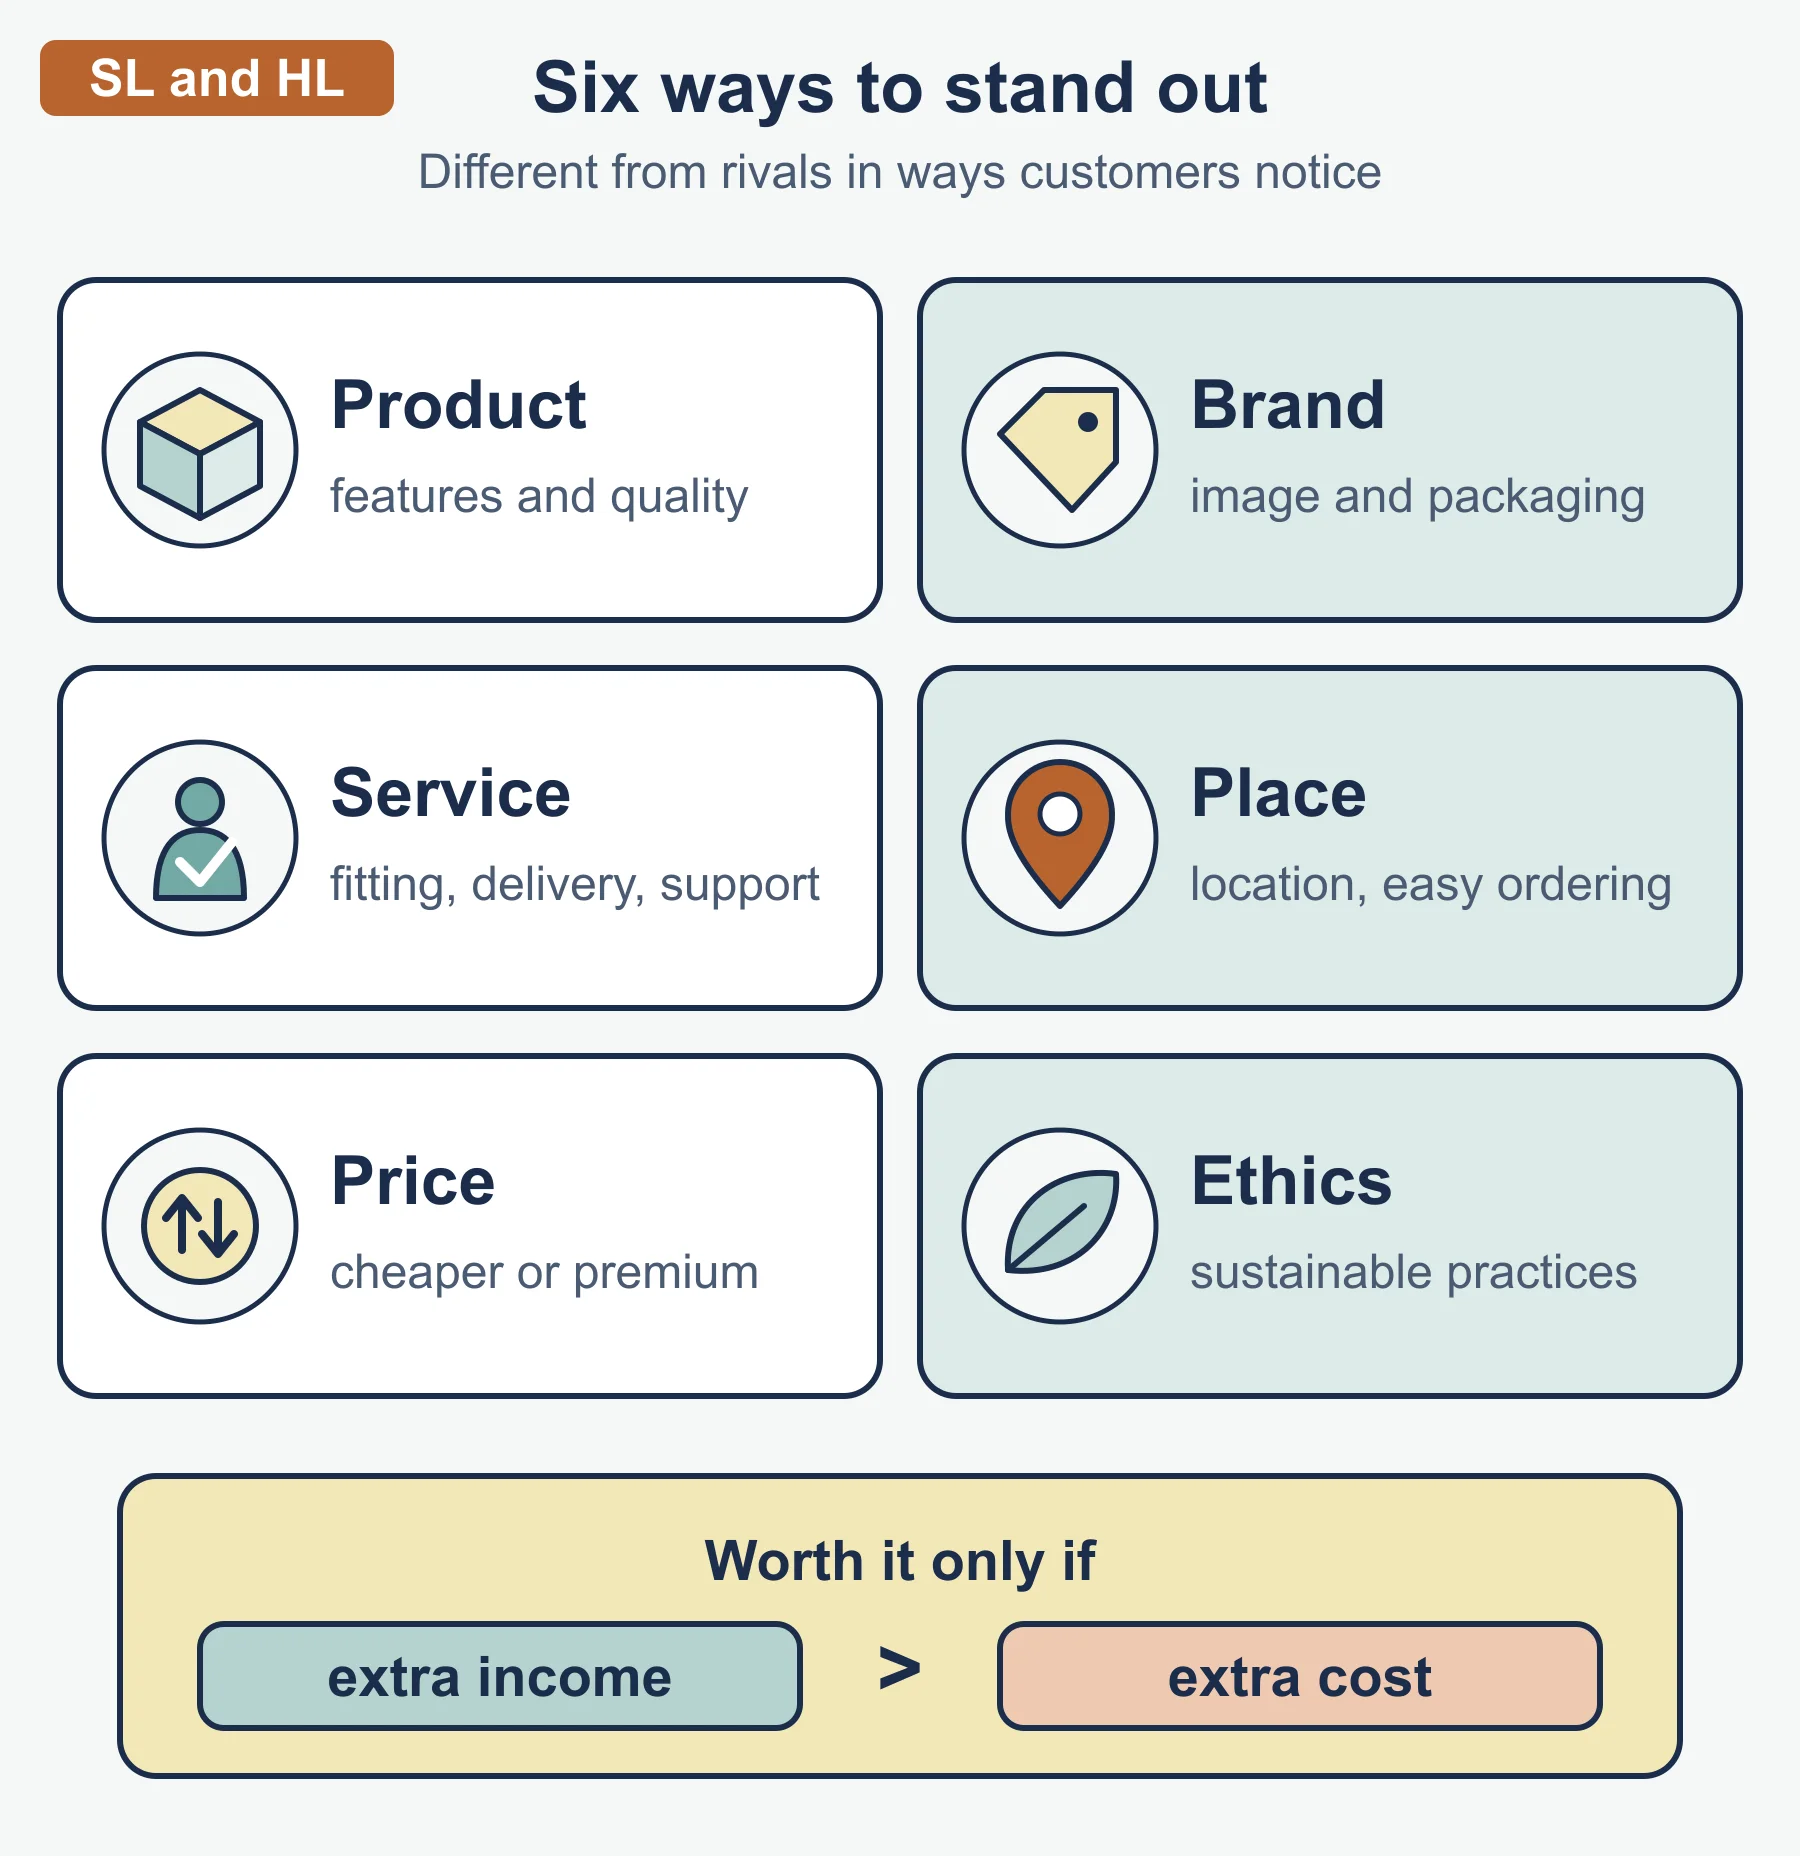
Differentiation means making an offer different from rivals’ in ways customers notice. Routes include:
- Product features and quality, such as design, materials or a longer guarantee.
- Branding and image, including packaging and the values the brand stands for.
- Service, such as fitting, delivery or after-sales support.
- Place and access, such as unusual locations or convenient online ordering.
- Price positioning, either clearly cheaper or clearly premium.
- Ethical or sustainable practices, if the target market values them.
Differentiation has a cost, and it only pays if the extra price or extra sales exceed it. Link the method to the target market: a service advantage helps little with customers who buy purely on price.
Common errors
- Defining market orientation as “selling to customers”. Every business does that; the difference is where decisions start.
- Calculating share with the wrong total, for example dividing by last year’s market size.
- Treating market growth and business growth as the same thing.
- Describing segmentation without saying which segment is chosen and why.
- Naming a USP that is only a general claim such as “good quality”.
- In HL answers, praising market leadership without a limitation or a verdict.
Next steps
Test yourself with the practice questions, then condense with the revision notes.
Frequently asked questions
What is the difference between market orientation and product orientation? A market-oriented business starts with customer needs found through research and then designs, prices and promotes to match. A product-oriented business starts with what it can make and looks for buyers afterwards, which can lead to innovation but risks weak demand.
What is the difference between a niche market and a mass market? A niche market is a small, specialized segment with distinct needs and often less competition, though a big rival can enter. A mass market is a large market of customers with common needs where competition is usually intense.
Why does market leadership matter in IB Business Management? At HL, you judge why market share and leadership matter: a large share can bring buying power, lower unit costs, brand strength and stakeholder confidence. Winning and defending share can also be costly and shrink profit, so a verdict depends on the situation.
What is the role of marketing planning? A marketing plan turns the business’s overall objectives into specific marketing aims and actions, with measurable targets and a budget, and lets managers compare results with the plan. It relies on assumptions and forecasts, so it needs review as conditions change.
Official syllabus
International Baccalaureate Organization, Business management guide, first assessment 2024, sections 4.1 and 4.2.
Get free revision emails (optional)
Occasional emails with practice questions, worked explanations and links to free resources for the qualification and subjects you choose. No spam, and you can unsubscribe from any email. The free tools on this site never need an email.
Related resources
-
Practice questions
IB DP Business Management: Introduction to marketing and Marketing planning – Practice Questions
Original IB DP Business Management practice questions with worked answers on 4.1 and 4.2: share, growth, segmentation, positioning and USPs.
Business · International Baccalaureate · IB
Try questions -
Revision notes
IB DP Business Management: Introduction to marketing and Marketing planning – Revision Notes
Condensed IB DP Business Management revision notes for 4.1 and 4.2: share and growth formulas, STP, niche versus mass, USP and differentiation.
Business · International Baccalaureate · IB
Revise topic -
Study guides
IB DP Business Management: Market research
Study guide to market research for IB DP Business Management section 4.4: why and how, primary and secondary methods, qualitative data, sampling.
Business · International Baccalaureate · IB
Read guide
Related articles
-
teaching
A Level tuition in Dubai: Cambridge or Pearson Edexcel International A Level?
Schools in Dubai and Abu Dhabi teach either Cambridge International AS & A Level or Pearson Edexcel International A Level. How the two are structured, why it matters for tuition, and how online classes from Lahore work.
9 October 2026
-
curriculum guides
Choosing subjects at IGCSE and A Level
How subject choices at 14 and 16 affect university options later, and how to keep pathways open without overloading a timetable.
28 July 2026
Studying this with a teacher
Working through Business IB?
This page is free and stays free. If you would rather be taught it, Marlbridge runs Business classes one-to-one, online in your own time zone. The first trial class is free. WhatsApp replies within an hour (8am–11pm Pakistan time, every day); email the same day.
IB Business teachers at Marlbridge

