
Study Guides
IB DP Business Management: Market research
Study guide to market research for IB DP Business Management section 4.4: why and how, primary and secondary methods, qualitative data, sampling.
- Subject
- Business
- Level
- IB
- Topic
- Unit 4: Marketing
- Author
- Marlbridge Academic Team
- Updated
- Reviewed by
- Salman Ahmad (what this means)
Aligned to International Baccalaureate IB Diploma Programme Business (DP Business Management), First assessment 2024. Official specification .
Syllabus page (what it covers and how it is assessed): IB Diploma Programme Business.
Syllabus points this page covers
DP Business Management
- 4.4 Market research
Found an error? Report a correction.
Need help with this topic? Request a free trial class for IB Diploma Programme Business (DP Business Management).
This guide covers section 4.4 Market research of the IB Business management guide, first assessment 2024. All of 4.4 is SL and HL content; none of it is marked HL only. It sits inside Unit 4: Marketing, so read it alongside the wider Unit 4 study guide. The companion pages are the revision notes and the practice questions. Course pages: the Business Management hub and the printable checklist. To find out which topics need most work, try the free diagnostics.
What 4.4 asks you to do
| Guide point | What you need to be able to do | Depth label in the guide |
|---|---|---|
| Why and how organizations carry out market research | Give reasons for research, describe how it is carried out, and judge it in context | AO3 |
| Primary research: surveys, interviews, focus groups, observations | Describe each method and say when it suits | AO2 |
| Secondary research: market analyses, academic journals, government publications, media articles, online content | Describe each source and say when it suits | AO2 |
| Qualitative and quantitative research | Explain the difference | AO2 |
| Sampling: quota, random, convenience | Describe each method and apply it to a case | AO2 |
Labelling note: the guide names the methods, sources and sampling types above but does not define them or list their strengths and limitations. The definitions, strengths, limitations, reasons for research and calculations on this page are standard descriptive content written for revision, not wording from the guide.
AO3 means you are expected to go beyond description and weigh up ideas, so “why and how” answers need reasons and a judgment. The other points are labelled AO2, which means applying knowledge to a business situation.
Why organizations carry out market research
Market research is the collection and analysis of information about customers, competitors and the market. Organizations do it to reduce uncertainty before they spend money.
Common reasons:
- To understand customer needs, wants and buying habits before designing a product
- To test an idea, a price or a promotion before launching it, so a poor idea is found out cheaply
- To size and track a market, and to see how much of it a business holds
- To spot trends, gaps and new segments that support marketing planning
- To check how customers feel about the brand and about rivals
- To support a case for finance, since a manager can show lenders or colleagues evidence
Research is not a guarantee. It costs money and time, results can be wrong, and customers can say one thing and do another. A good evaluation compares the cost of research with the cost of a wrong decision. A small test of a low-cost product may not justify an expensive study. A large launch with heavy investment usually does.
How research is carried out
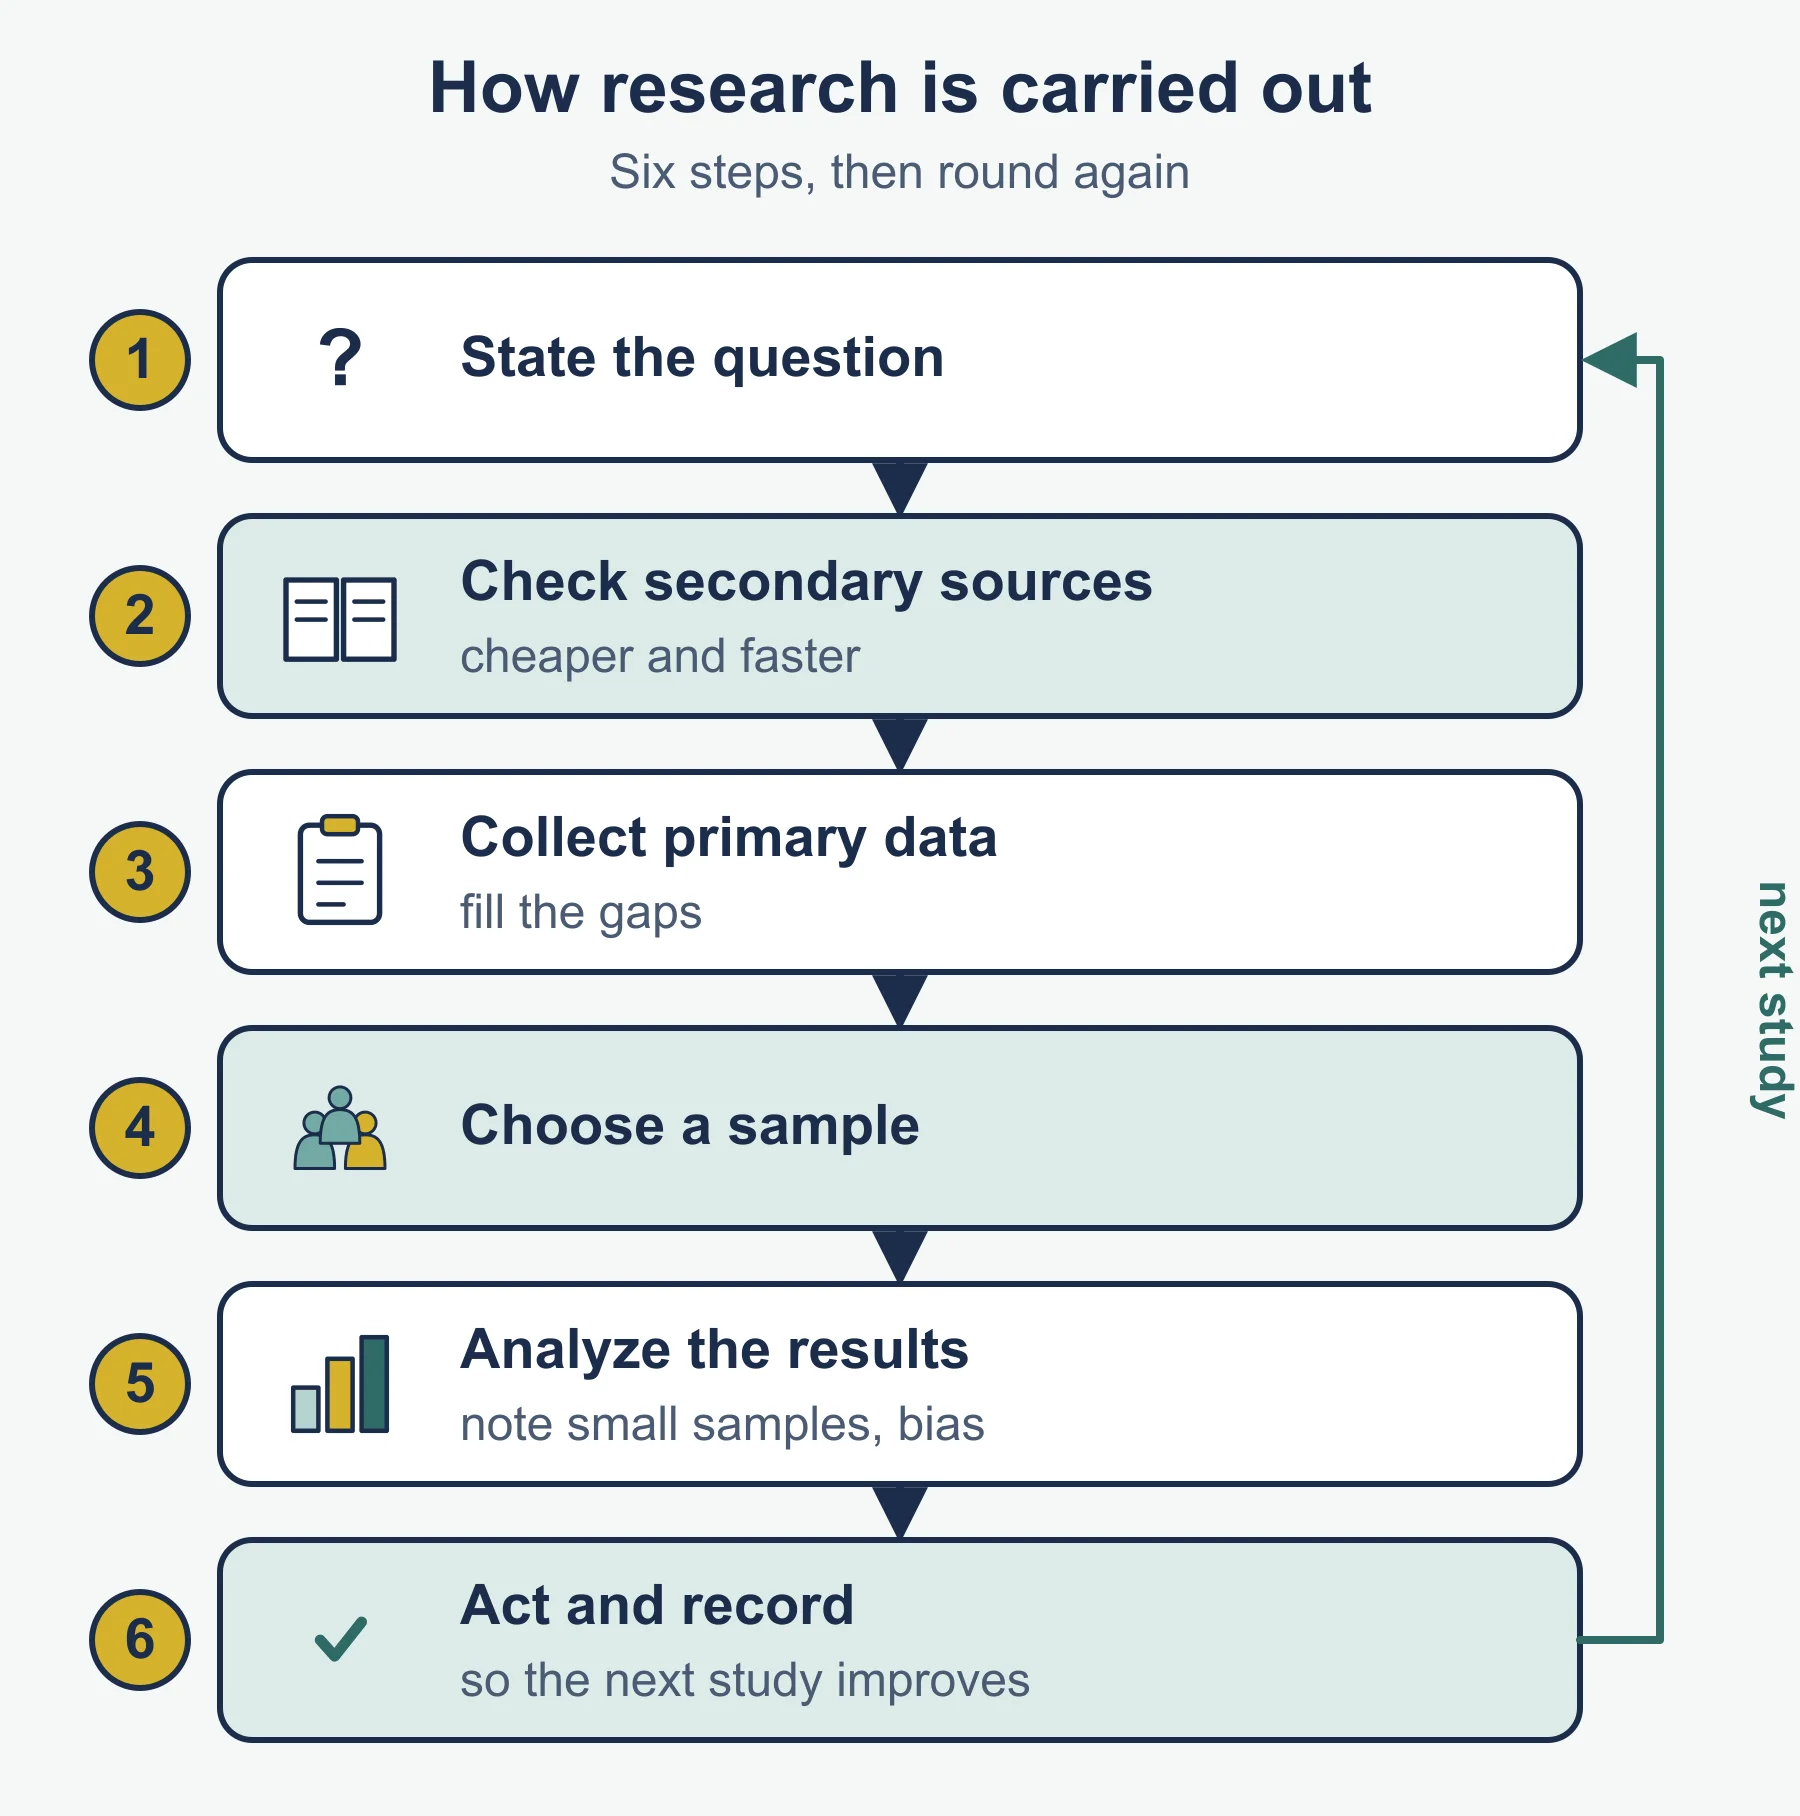
A simple sequence works for most cases:
- State the question the business needs answered (for example, “Would commuters pay more for a lighter frame?”)
- Check secondary sources first, because they are usually cheaper and faster
- Collect primary data where the gaps remain
- Choose a sample of people to ask or watch
- Analyze the results, noting limits such as small samples or bias
- Act on the findings and record what happened, so the next study improves
In an exam, “how” usually means naming a method and saying what the business would do with it, not just listing it.
Primary market research
Primary research is new data collected for the business’s own purpose. The guide lists four methods.
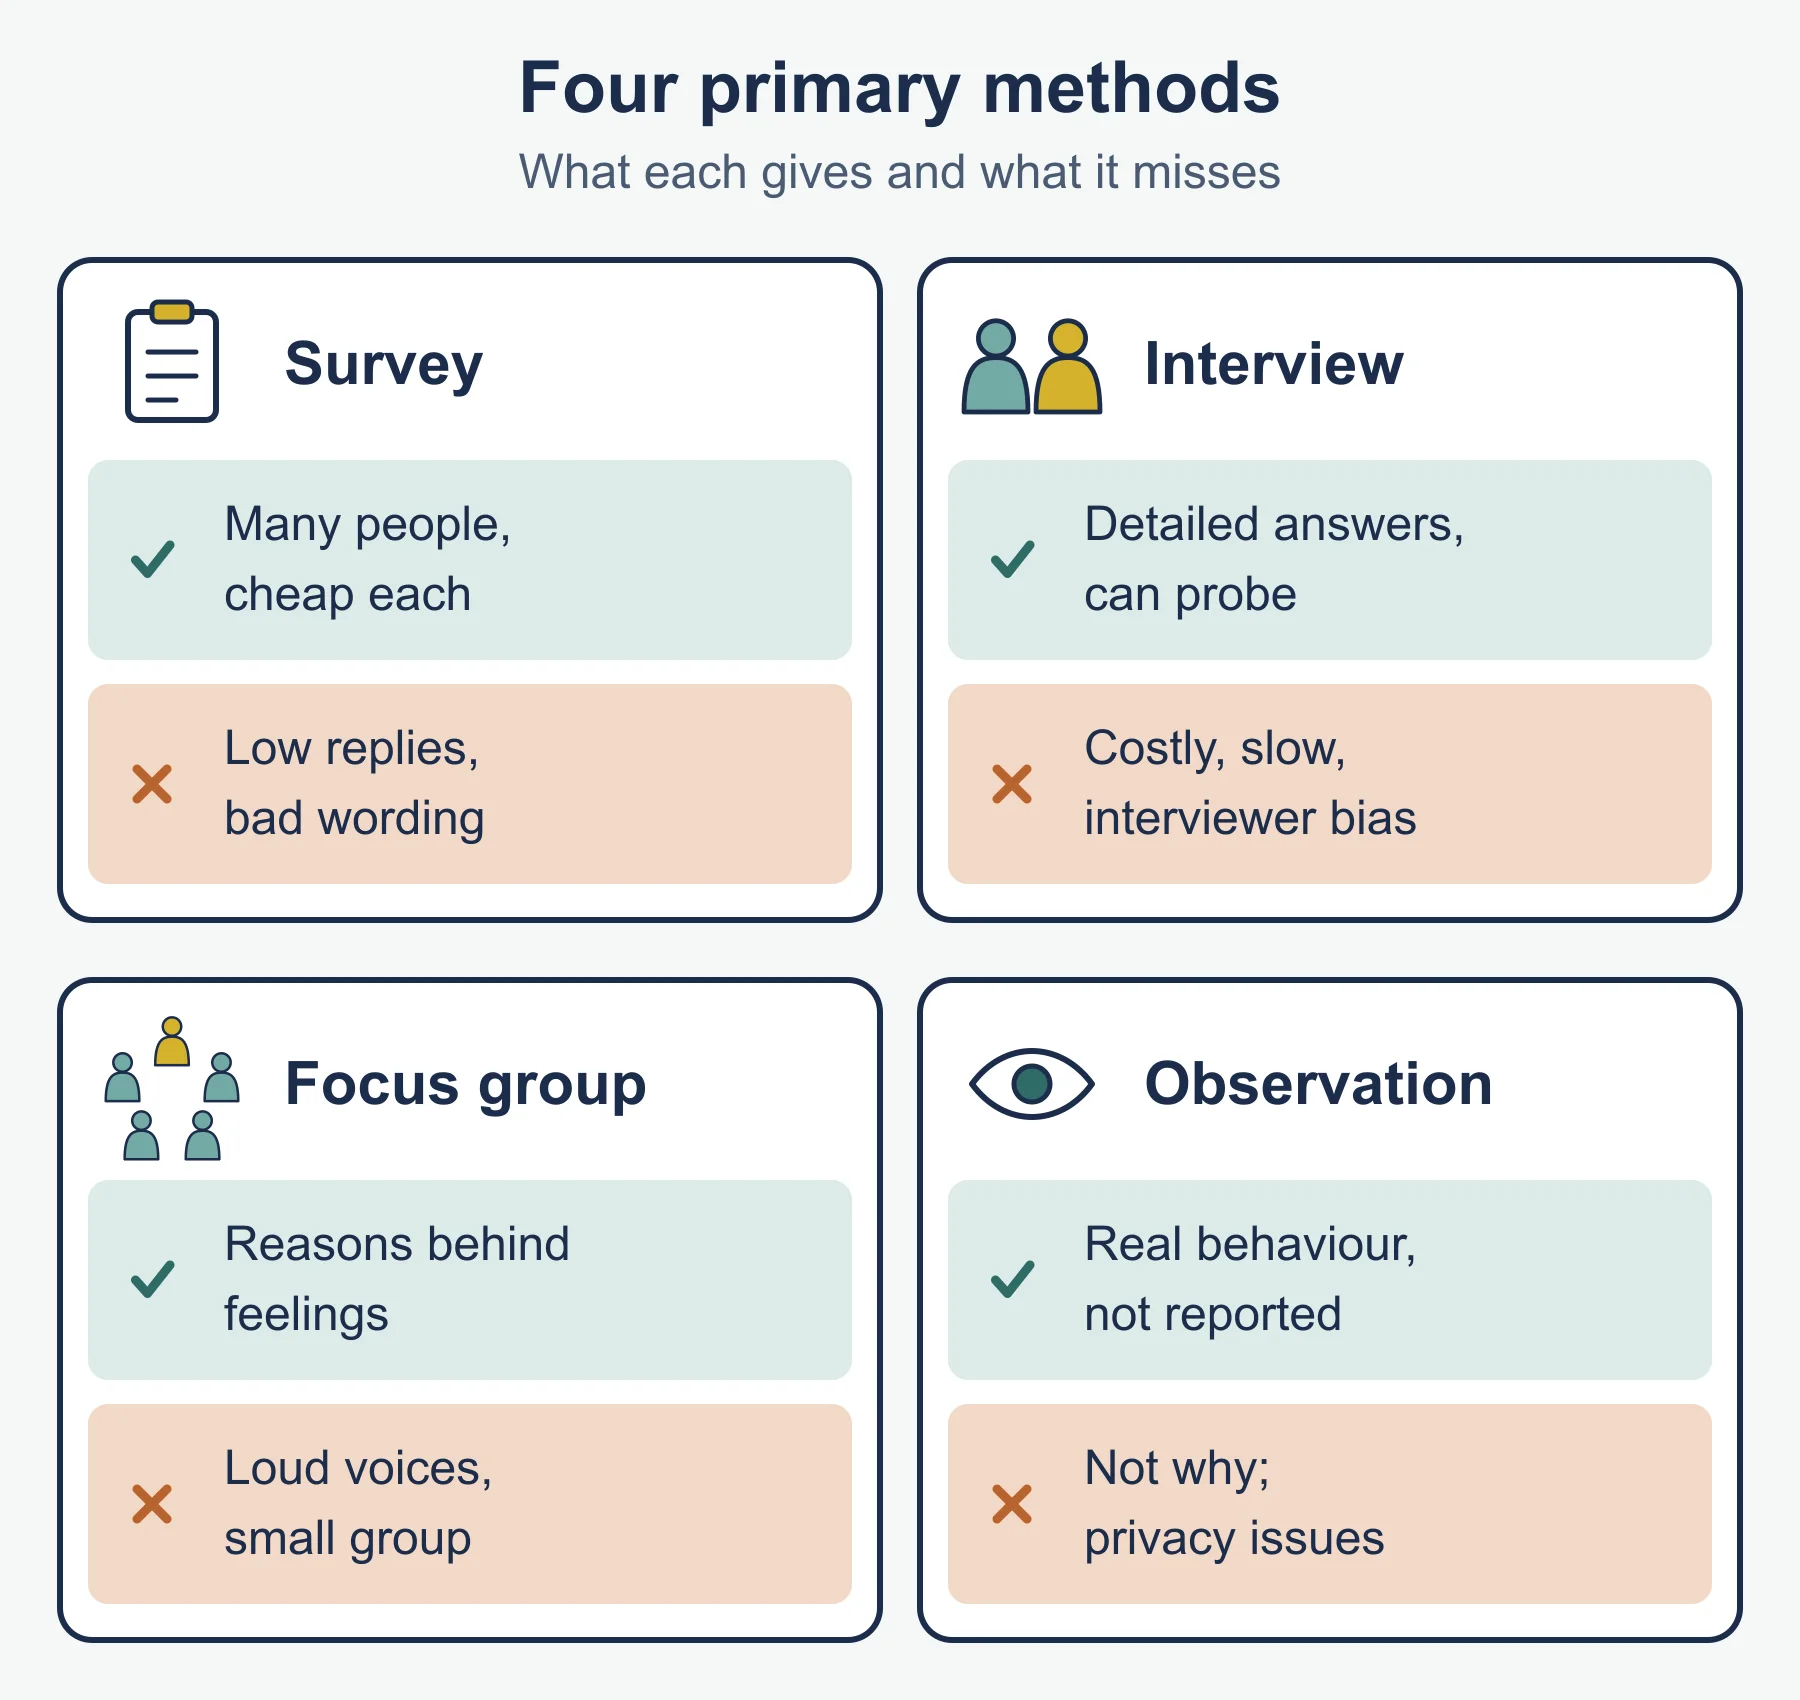
Surveys. A set of questions given to many people, often online, by post, by phone or in person. Closed questions (tick a box, rate 1 to 5) give numbers that are easy to total. Open questions give richer comments but take longer to analyze. Strength: can reach many people at modest cost per response. Limitations: low response rates, people may not answer honestly, and the questions can be badly worded.
Interviews. A researcher asks questions one-to-one. Structured interviews follow a fixed list. Semi-structured or unstructured interviews let the researcher follow up. Strength: detailed answers and the chance to probe. Limitations: costly per person, slow, and the interviewer can influence the answers.
Focus groups. A small group discusses a product, advertisement or idea, led by a moderator. Strength: reveals how opinions form and change through discussion and gives reasons behind feelings. Limitations: a few strong voices can dominate, the group is small and may not represent the market, and the language the moderator uses can steer the conclusions.
Observations. The researcher watches what people actually do, such as which shelf they look at, how long they queue, or how they use a website. Strength: shows real behavior rather than reported behavior. Limitations: it shows what people do but not why, and watching people raises privacy questions if they do not know.
Secondary market research
Secondary research uses data that already exists, collected by someone else for another purpose. The guide lists five types.
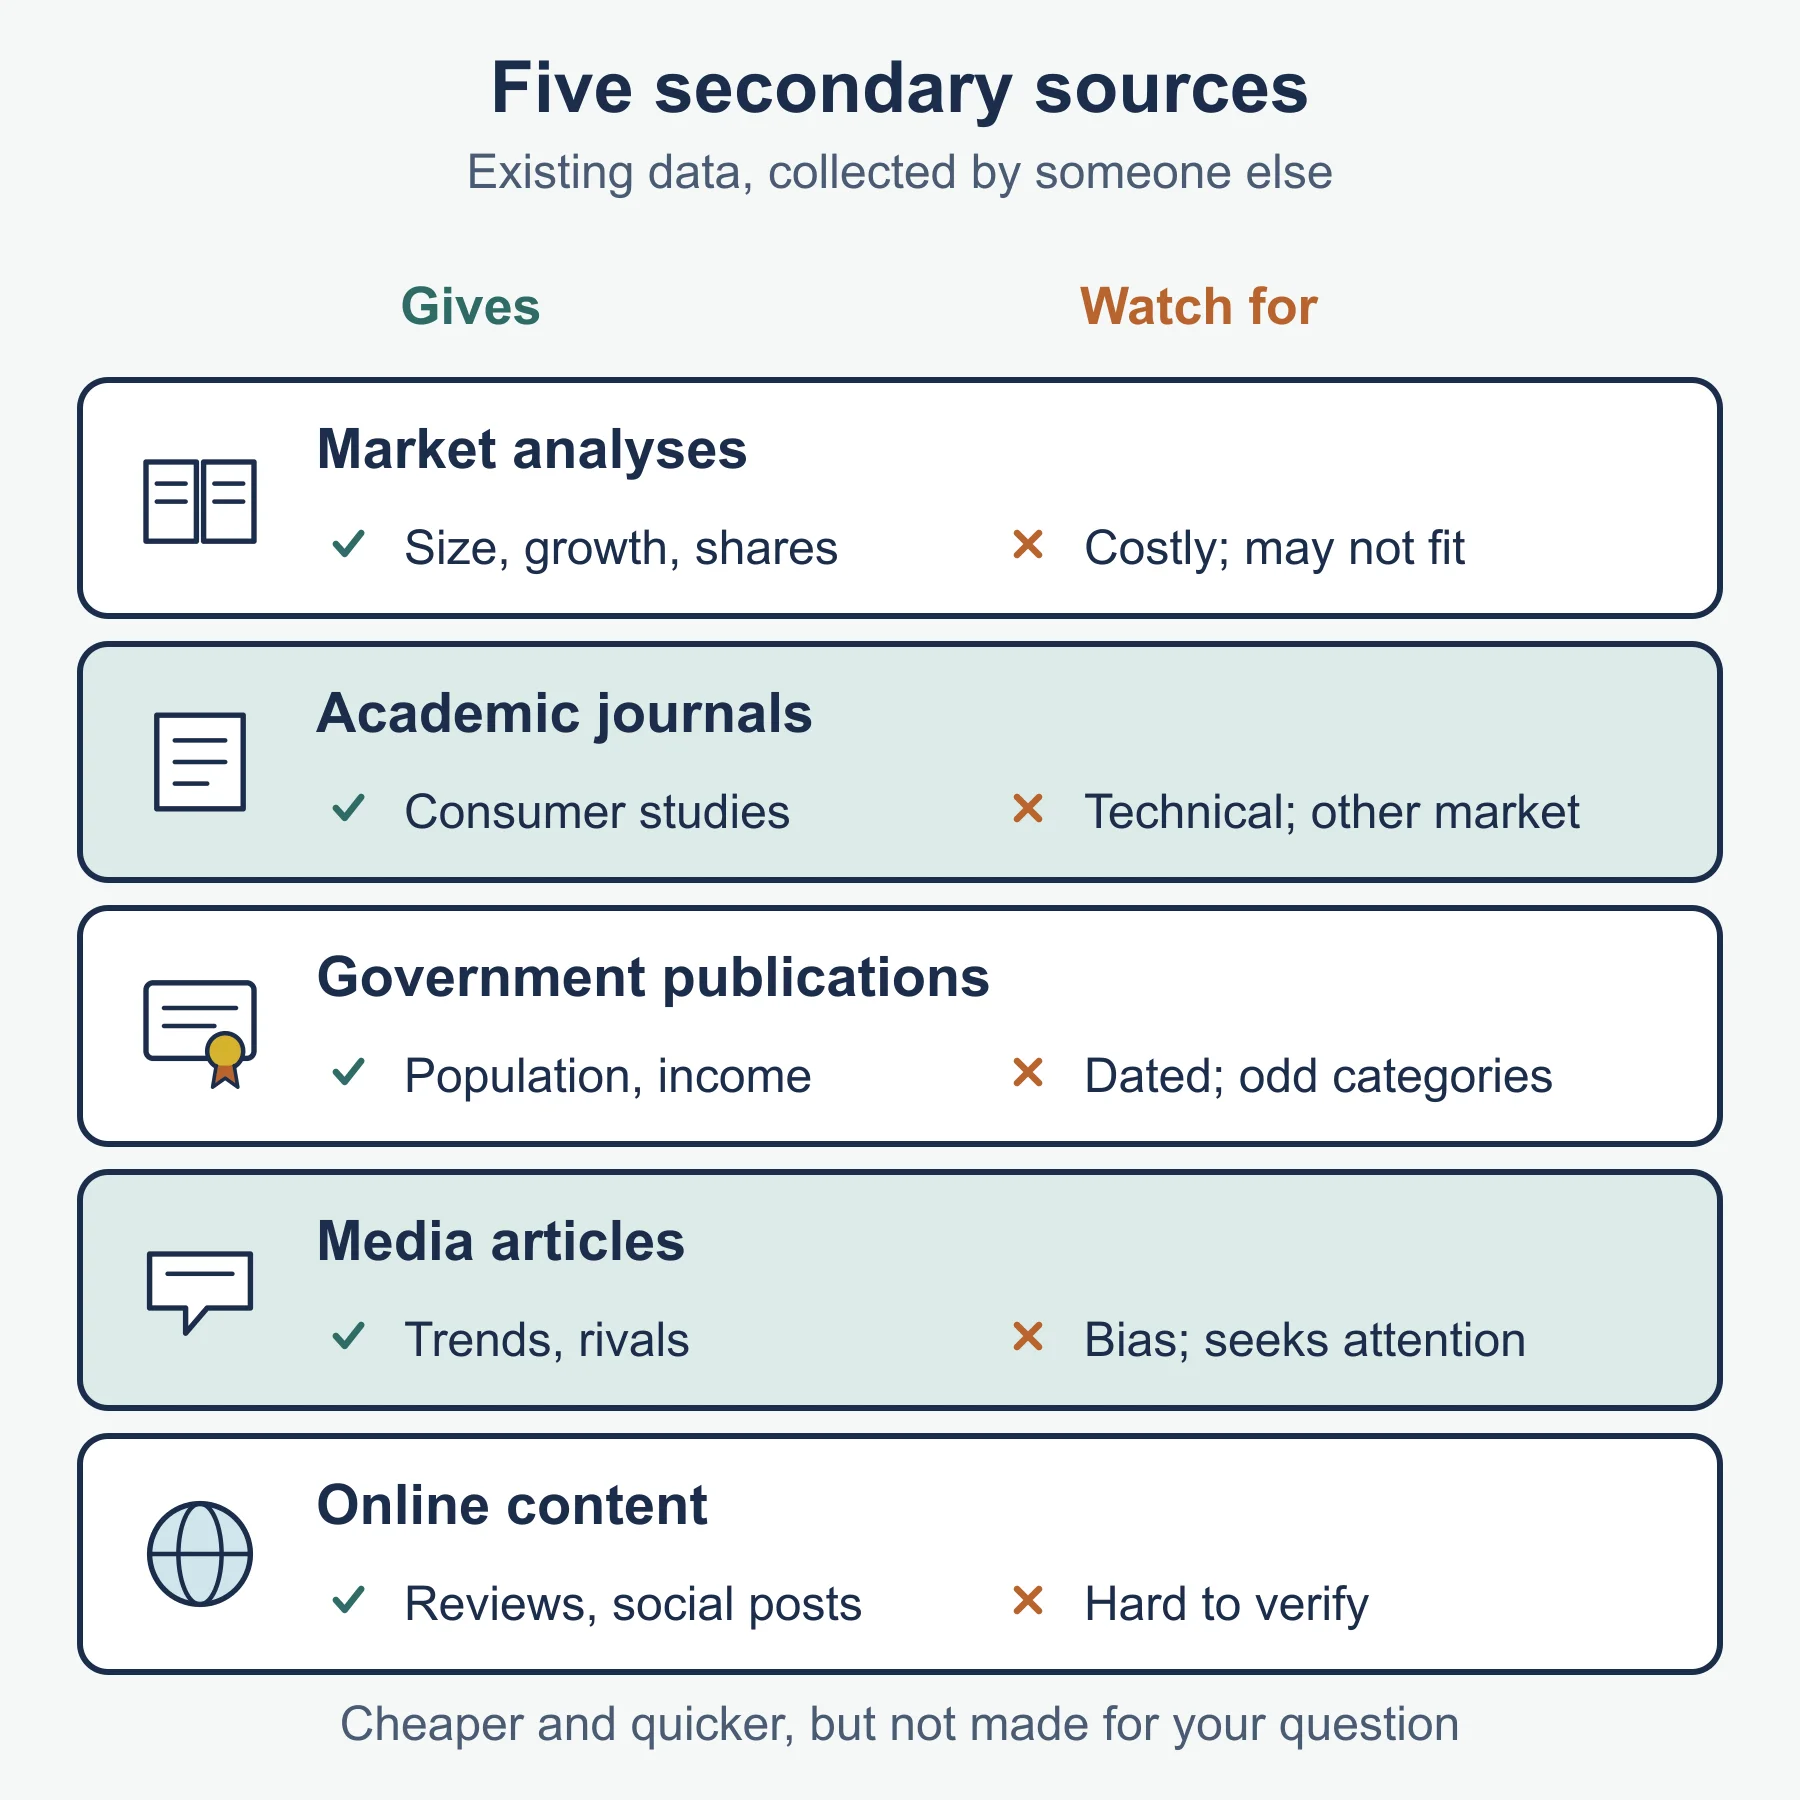
| Source | Typical content | Watch for |
|---|---|---|
| Market analyses | Market size, growth, segments and competitor shares, often from a research firm | May be costly to buy and may not match the business’s exact question |
| Academic journals | Studies of consumer behavior and methods, written by researchers | Can be technical and not about your market or time period |
| Government publications | Population, income, employment and household statistics | May be out of date by publication, and may use categories that do not fit |
| Media articles | News and trade stories on trends and rivals | May be biased or written to attract attention |
| Online content | Websites, social media posts, reviews, forums | Easy to find but hard to verify, and posts may come from unrepresentative users |
General strengths of secondary research: cheaper, quicker, and good for background. General limitations: not designed for your question, may be out of date, and you cannot check how it was collected. Many businesses start here and use primary research to fill what is missing.
Qualitative and quantitative research
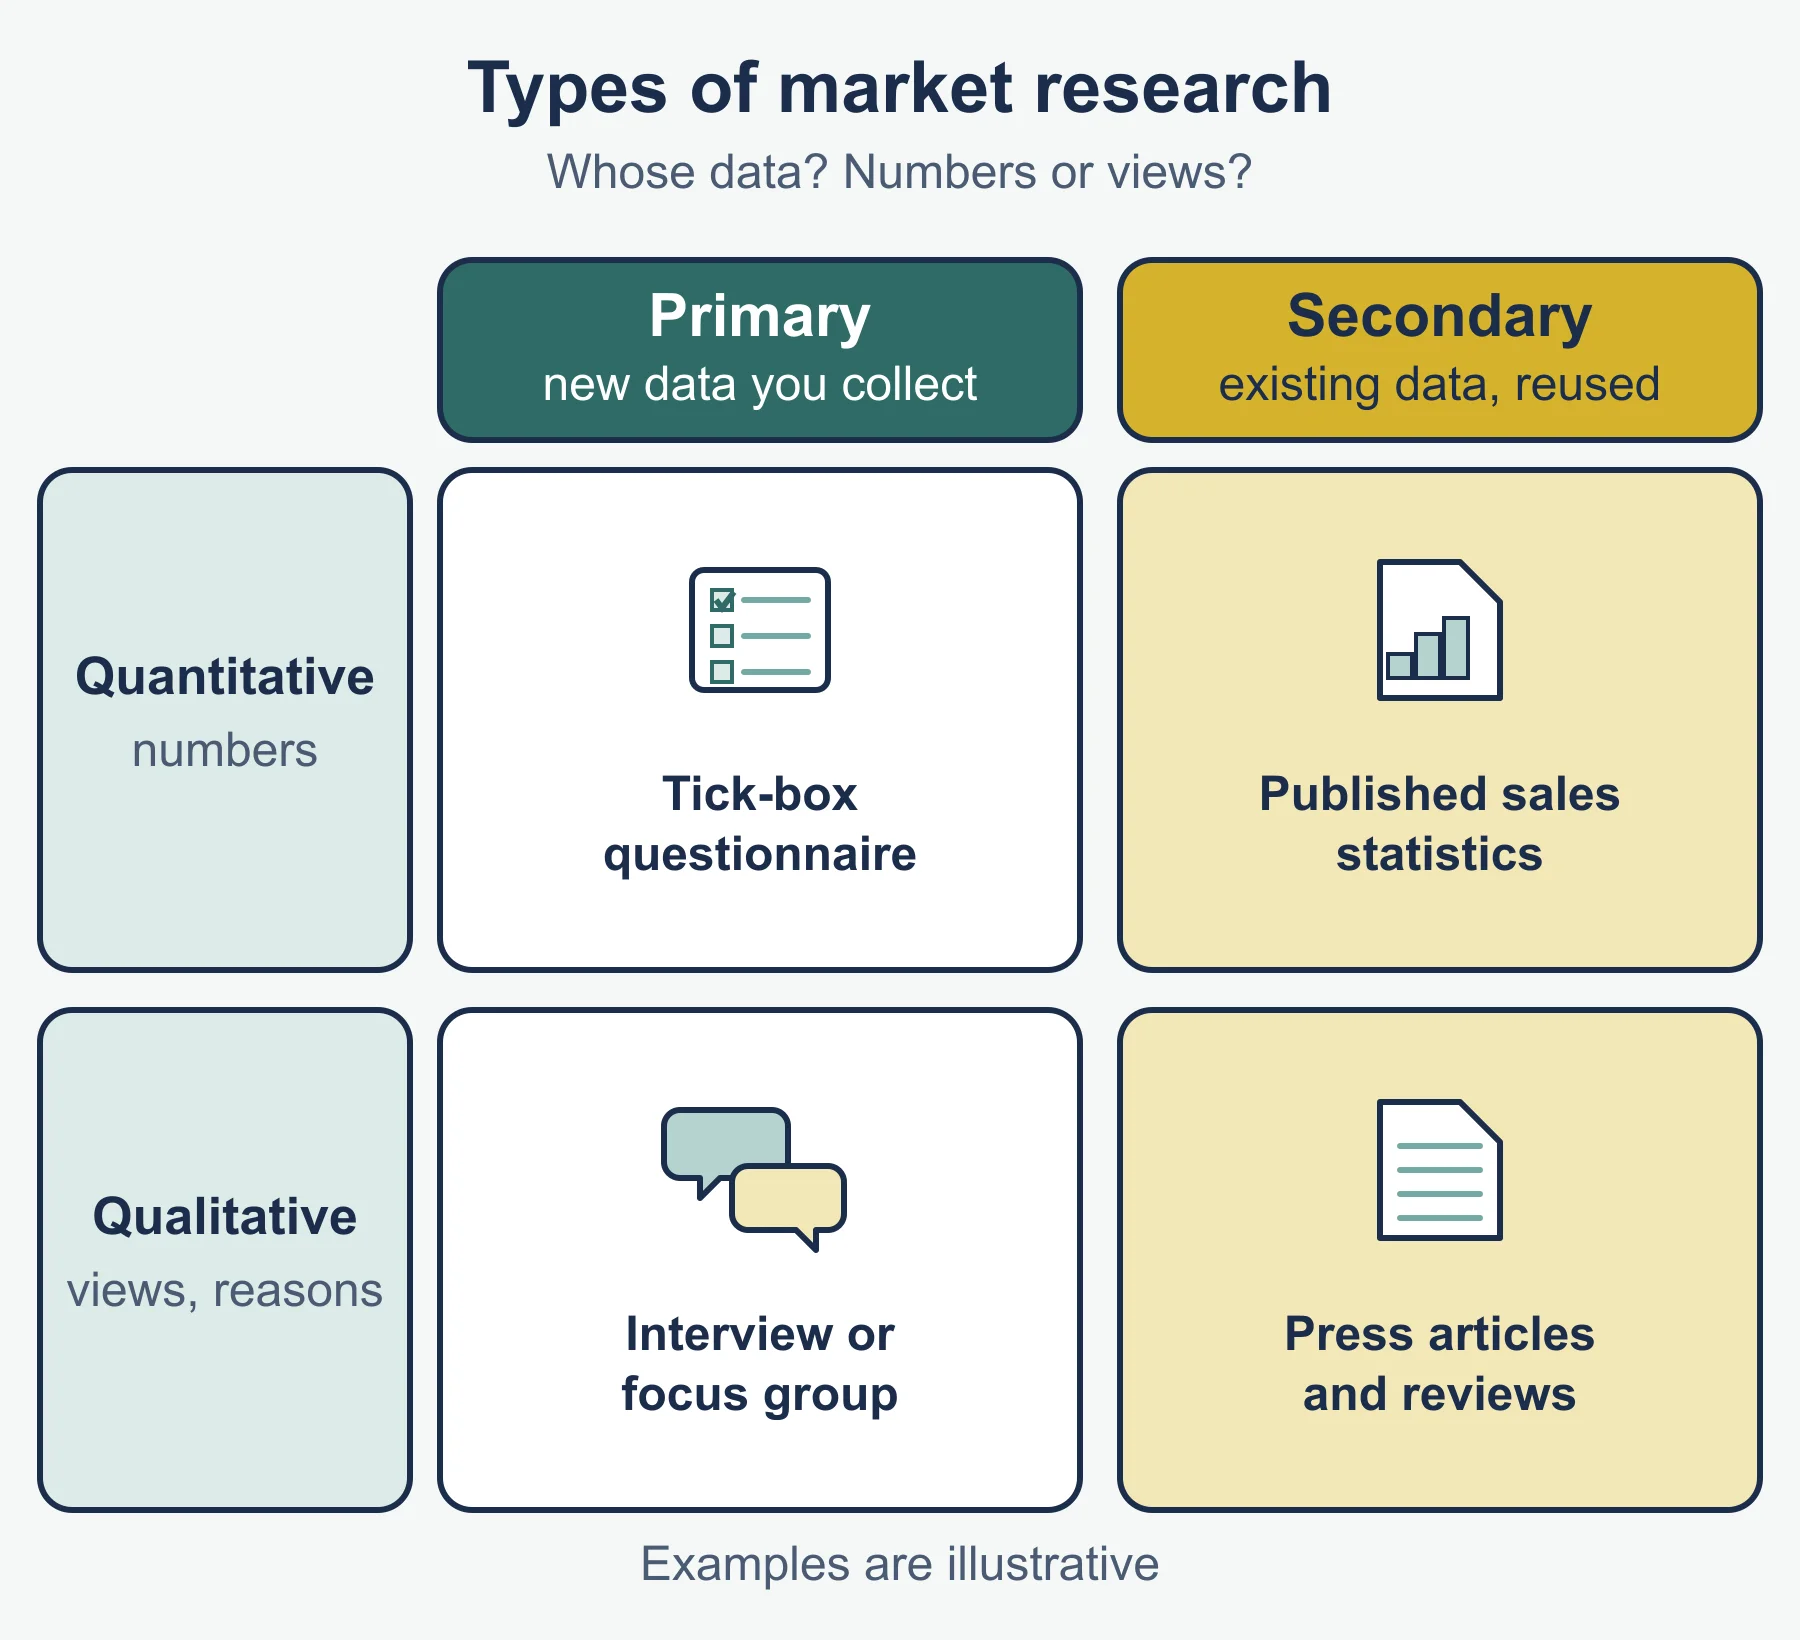
Quantitative research produces numerical data that can be counted, averaged or tested statistically, such as sales figures, percentages and rating scores. It tells you how many, how much and how often. It needs larger samples to be reliable.
Qualitative research produces descriptive data about opinions, attitudes and motives, such as comments, stories and reactions. It tells you why and how people feel. It is usually gathered from fewer people, is harder to summarize, and is open to interpretation.
The methods do not map neatly one-to-one. A survey with only closed questions is mainly quantitative, a survey with open questions adds a qualitative element, and interviews and focus groups are mainly qualitative. Many studies use both: qualitative work finds out which issues matter, then quantitative work measures how widespread they are.
Sampling
Researchers rarely ask everyone, so they choose a sample of the target population. A sample is useful only if it reflects the population well enough that the results can be trusted. The guide names three methods.
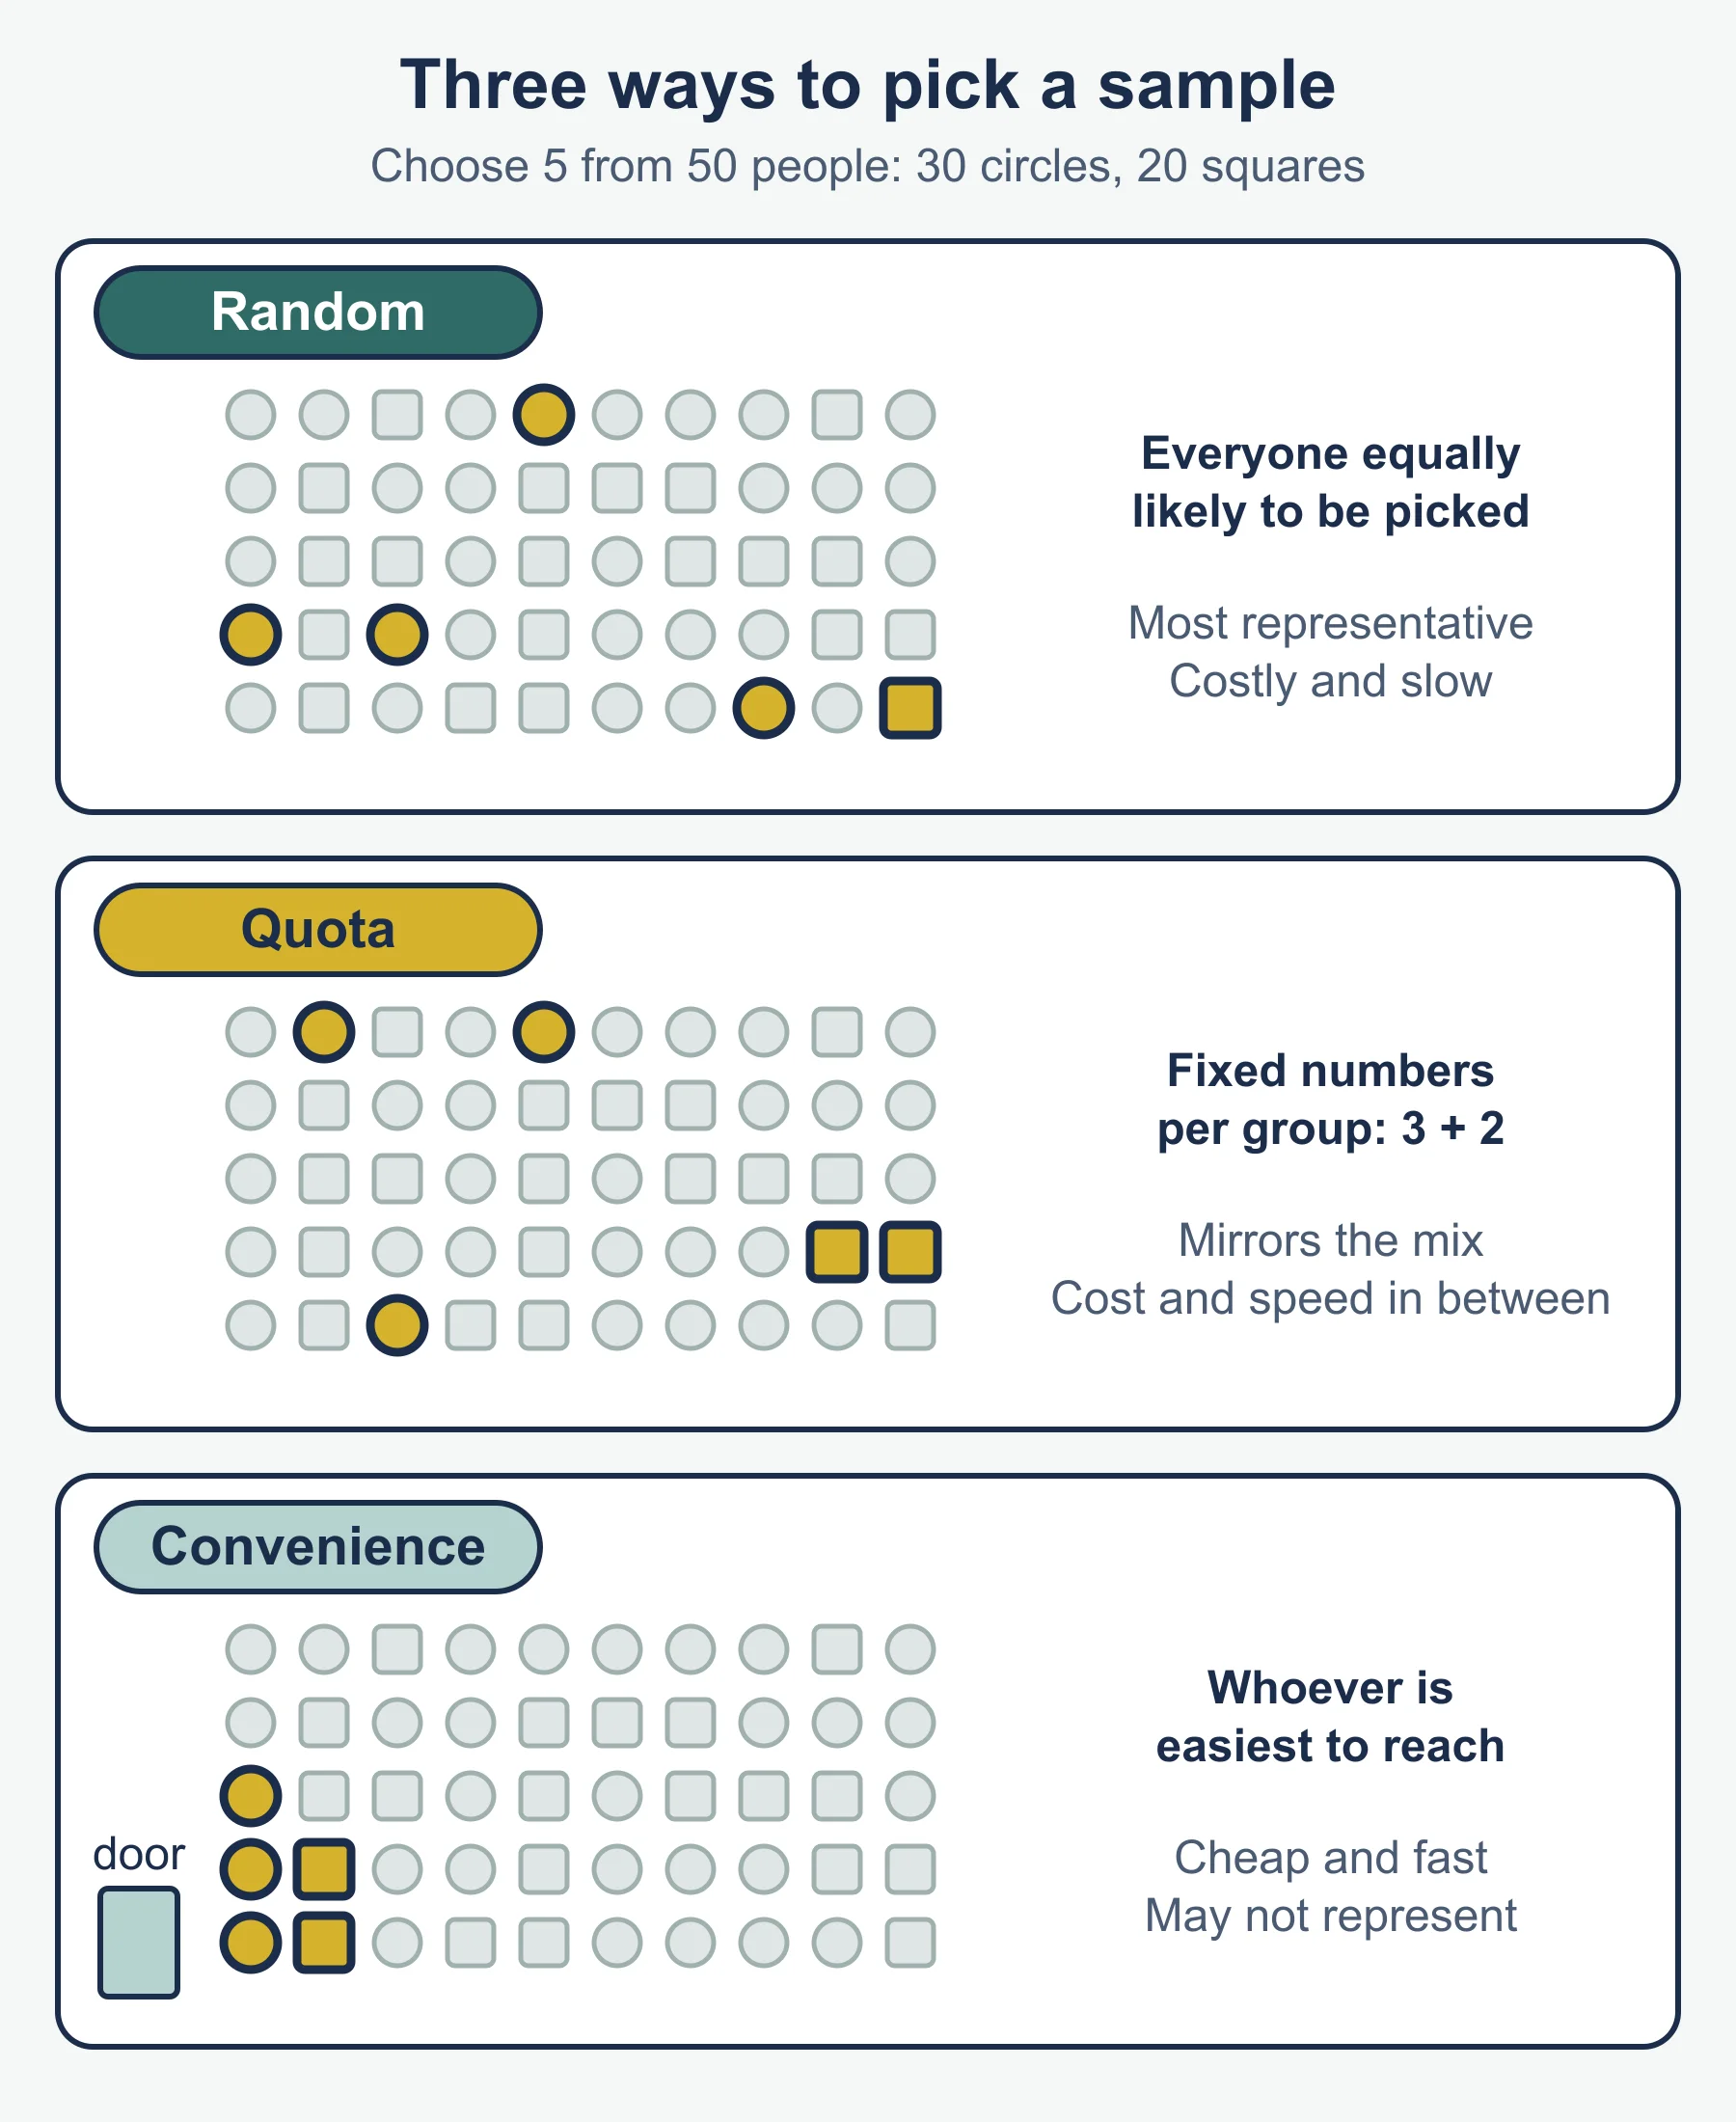
Random sampling. Every member of the population has an equal chance of being picked, for example by numbering a customer list and using a random number generator. Strength: reduces the researcher’s bias in who is chosen. Limitations: needs a full list of the population, which many businesses lack, and a small random sample can still miss some groups by chance.
Quota sampling. The population is split into groups (for example by age or gender) and the researcher fills a set number from each group, in proportion to the population. Strength: guarantees each group is represented and is cheaper than a full random approach. Limitation: inside each quota the researcher picks who to ask, so personal bias can remain.
Convenience sampling. The researcher asks whoever is easy to reach, such as passers-by outside a shop. Strength: quick and cheap. Limitation: probably the least representative, because the people who are easy to reach are not typical of everyone.
Extension beyond the content list: the guide’s content list for 4.4 does not mention sample error or bias. They appear only in its suggested theory of knowledge questions, which ask how a company might protect against sample error and bias and whether researcher bias can be eliminated. Sampling can introduce sample error and bias. Larger samples and clear selection rules reduce the risk but do not remove it. Bias can also arise from the researcher, for example through leading questions.
Worked example 1: a quota sample
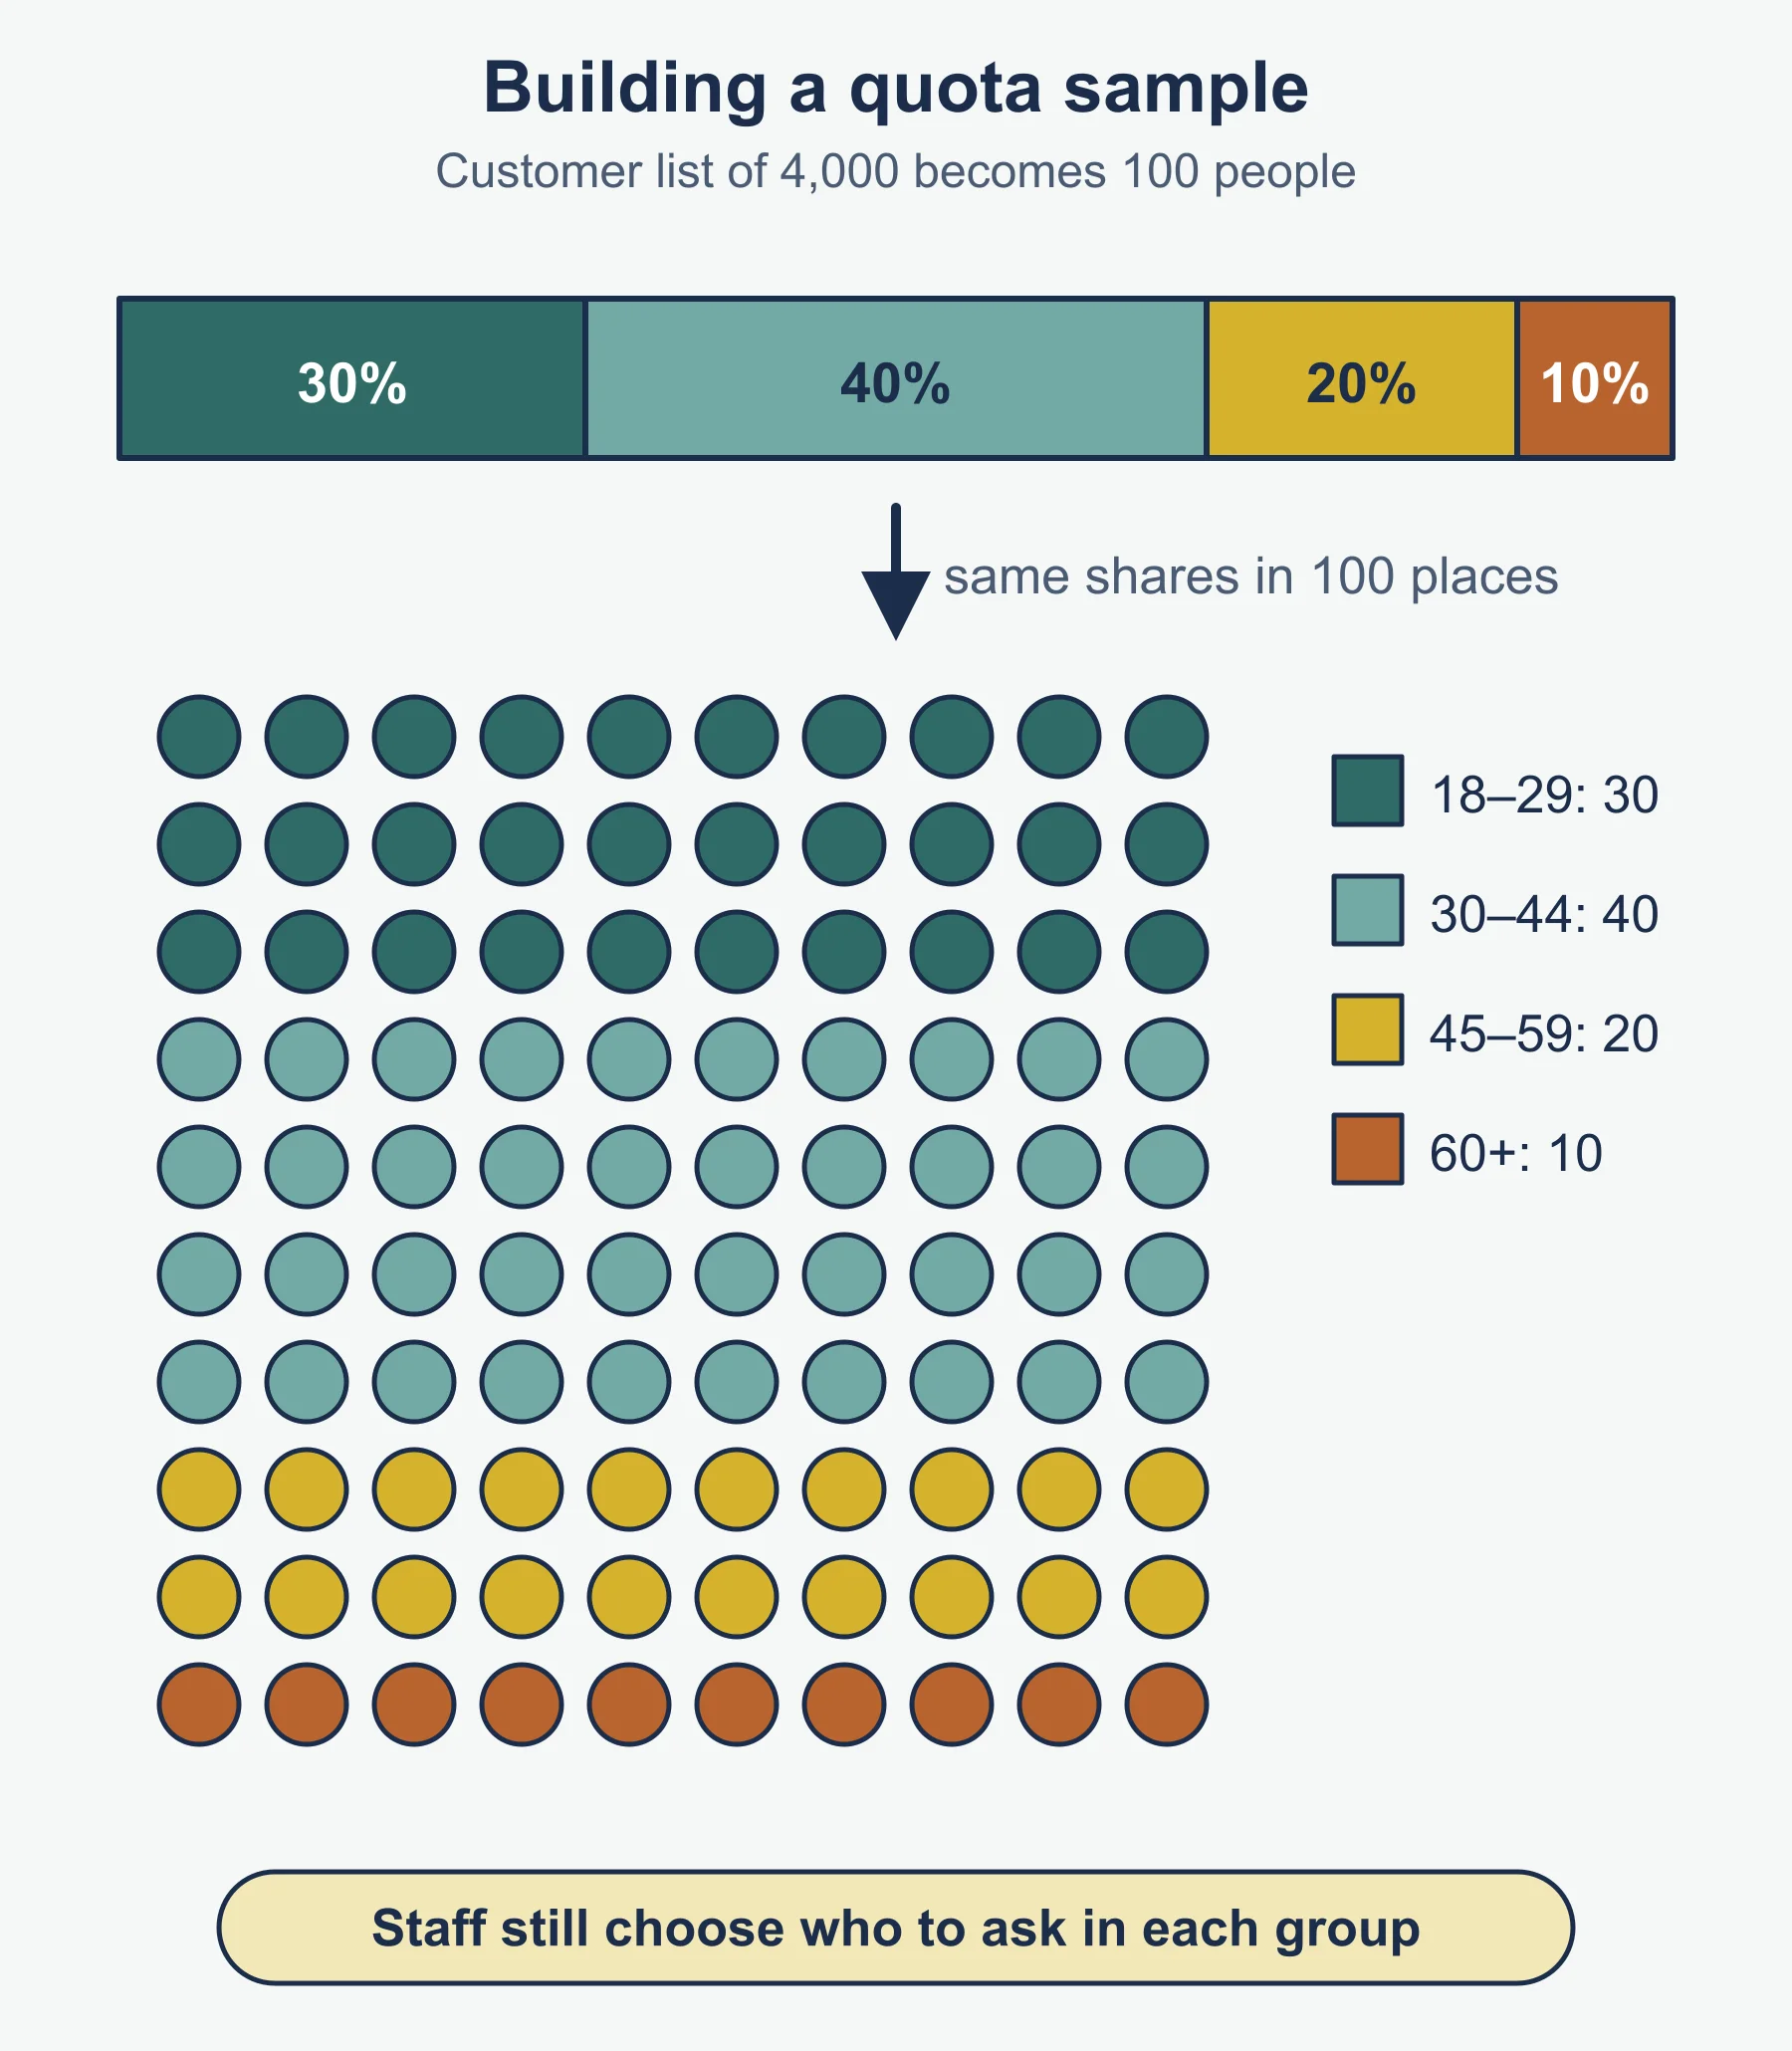
Ellerby Fold Cycles plans a folding bicycle for commuters. Its customer list has 4,000 people: 1,200 aged 18 to 29, 1,600 aged 30 to 44, 800 aged 45 to 59 and 400 aged 60 and over. It wants a quota sample of 100.
Step 1: Work out each group’s share of the list. 1,200 / 4,000 = 30%, 1,600 / 4,000 = 40%, 800 / 4,000 = 20%, 400 / 4,000 = 10%.
Step 2: Apply each share to the sample of 100. The quotas are 30, 40, 20 and 10 respondents.
Step 3: Comment. The sample mirrors the list’s age profile. But inside each age band the staff choose whom to ask, so it is not random, and a list of existing customers says little about people who do not yet buy from the business.
Worked example 2: reading survey results
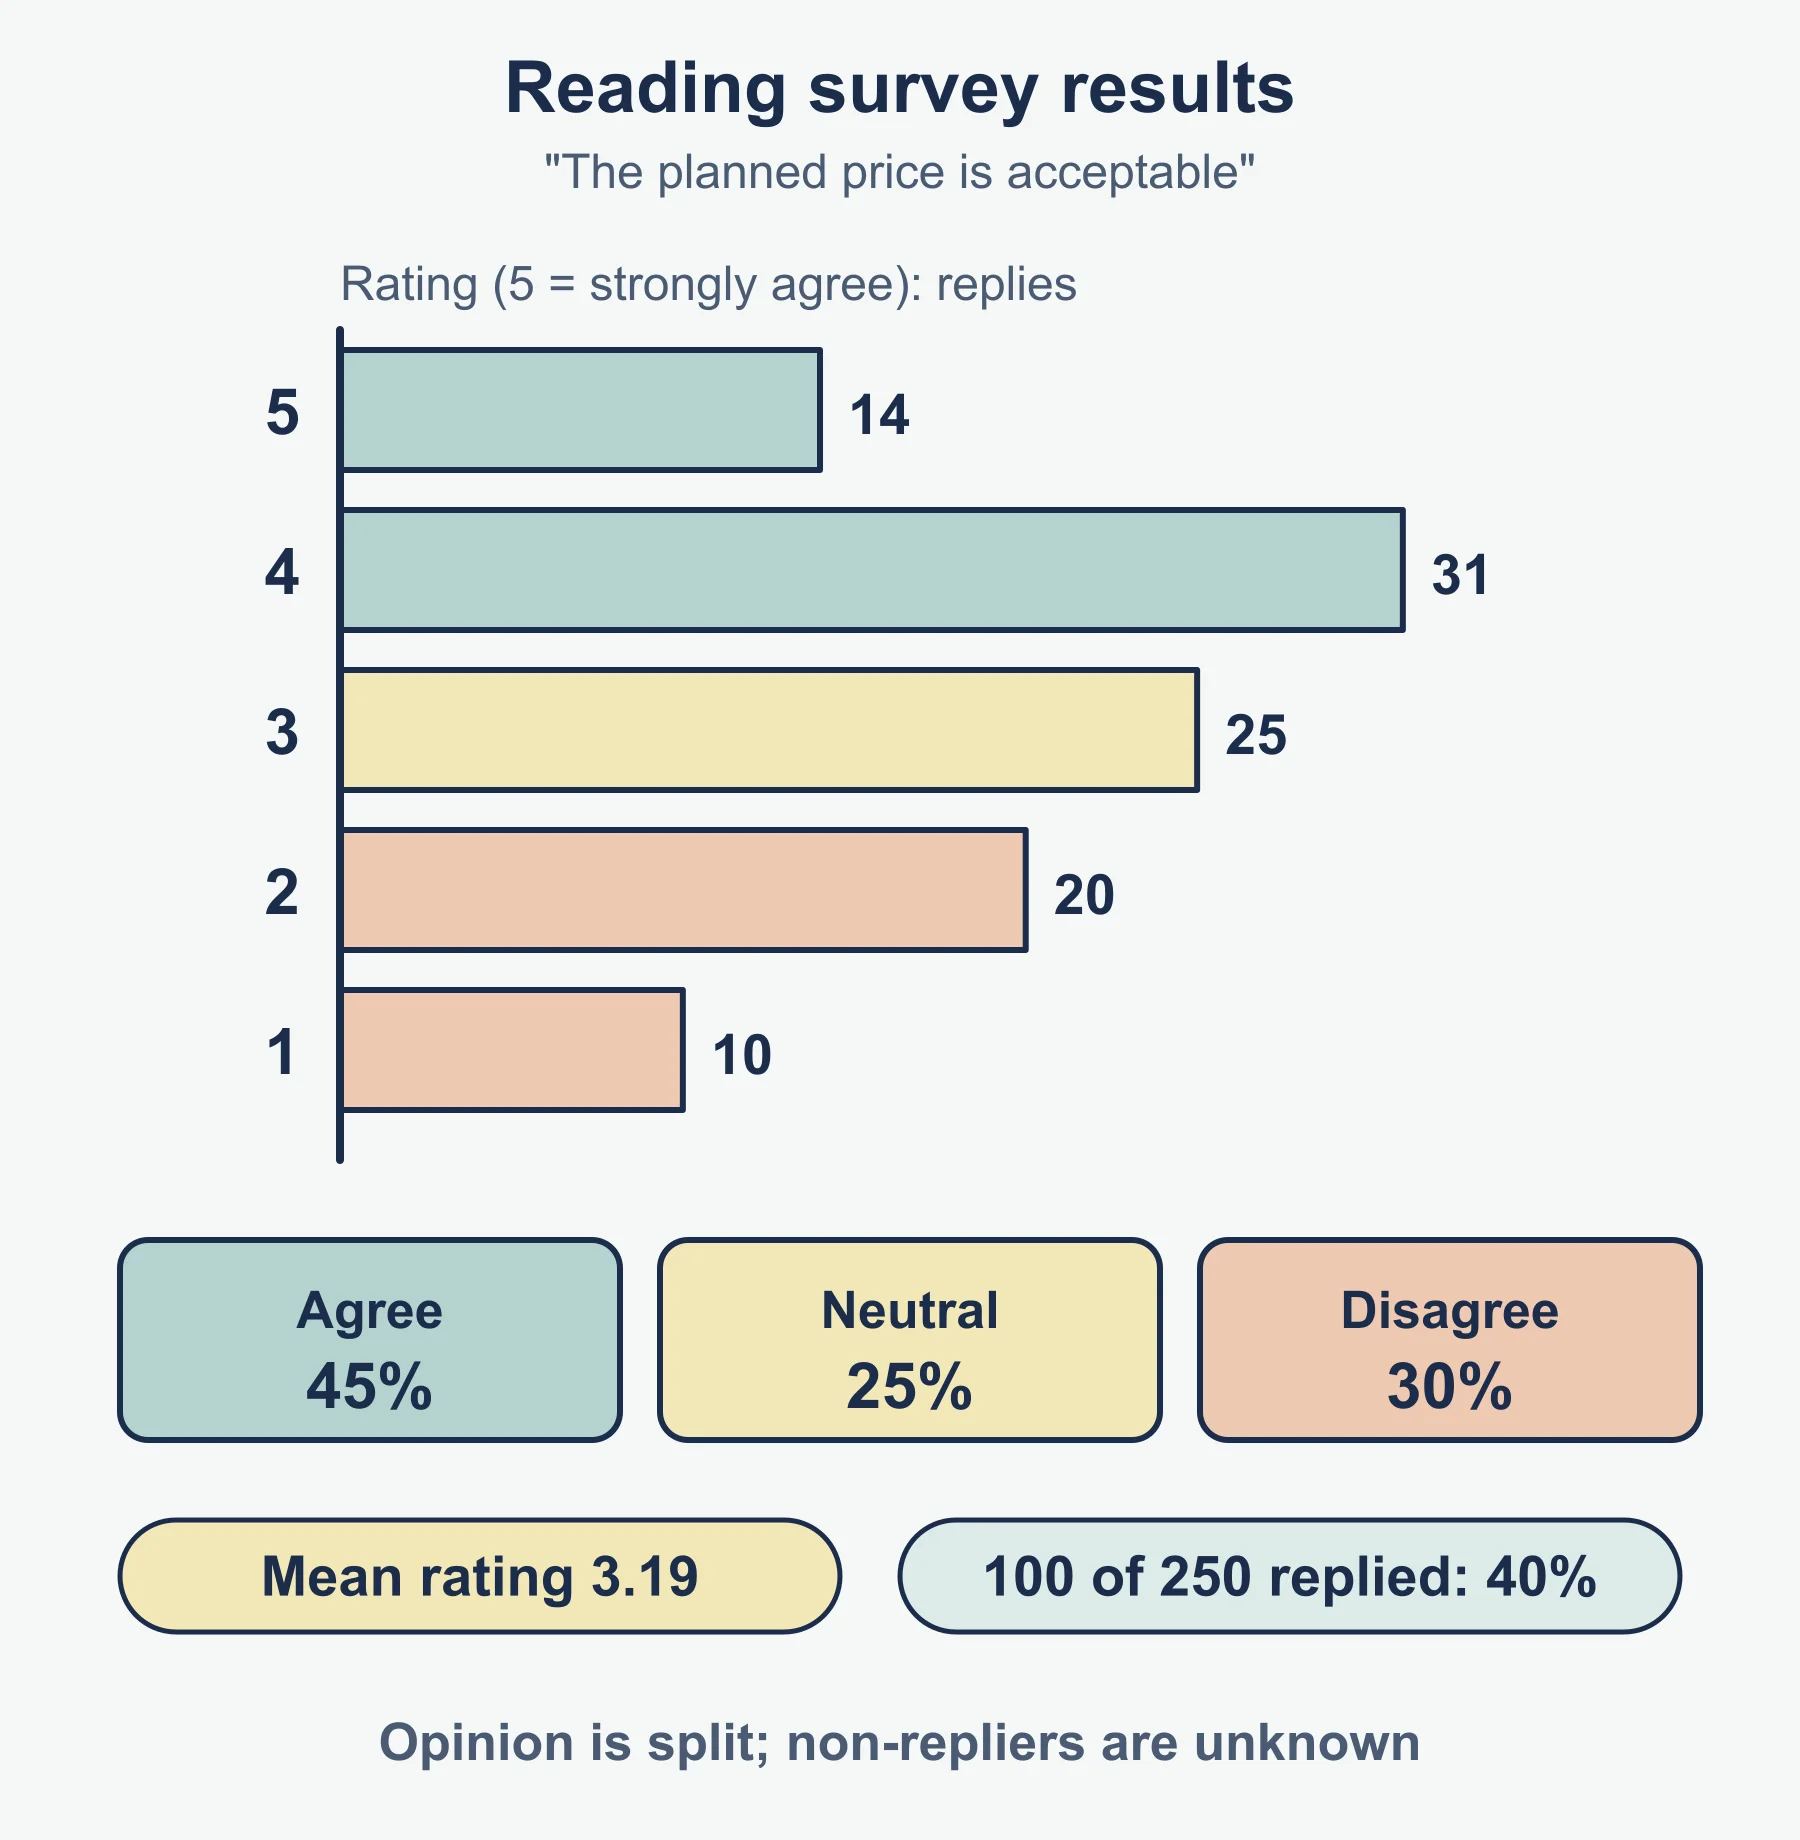
Ellerby emails the survey to 250 customers and receives 100 replies. Respondents rate “the planned price is acceptable” from 1 (strongly disagree) to 5 (strongly agree):
| Rating | 5 | 4 | 3 | 2 | 1 |
|---|---|---|---|---|---|
| Respondents | 14 | 31 | 25 | 20 | 10 |
Response rate: 100 / 250 = 40%. Mean rating: (5 × 14 + 4 × 31 + 3 × 25 + 2 × 20 + 1 × 10) / 100 = (70 + 124 + 75 + 40 + 10) / 100 = 3.19. Share who agree or strongly agree: (14 + 31) / 100 = 45%.
Interpretation: opinion is split, with a mean just above the midpoint. Only 40% replied, so those who did may feel more strongly than those who did not. Ellerby may follow up with a focus group of price-sensitive customers to learn why 30 respondents disagreed.
Worked example 3: combining secondary and primary data
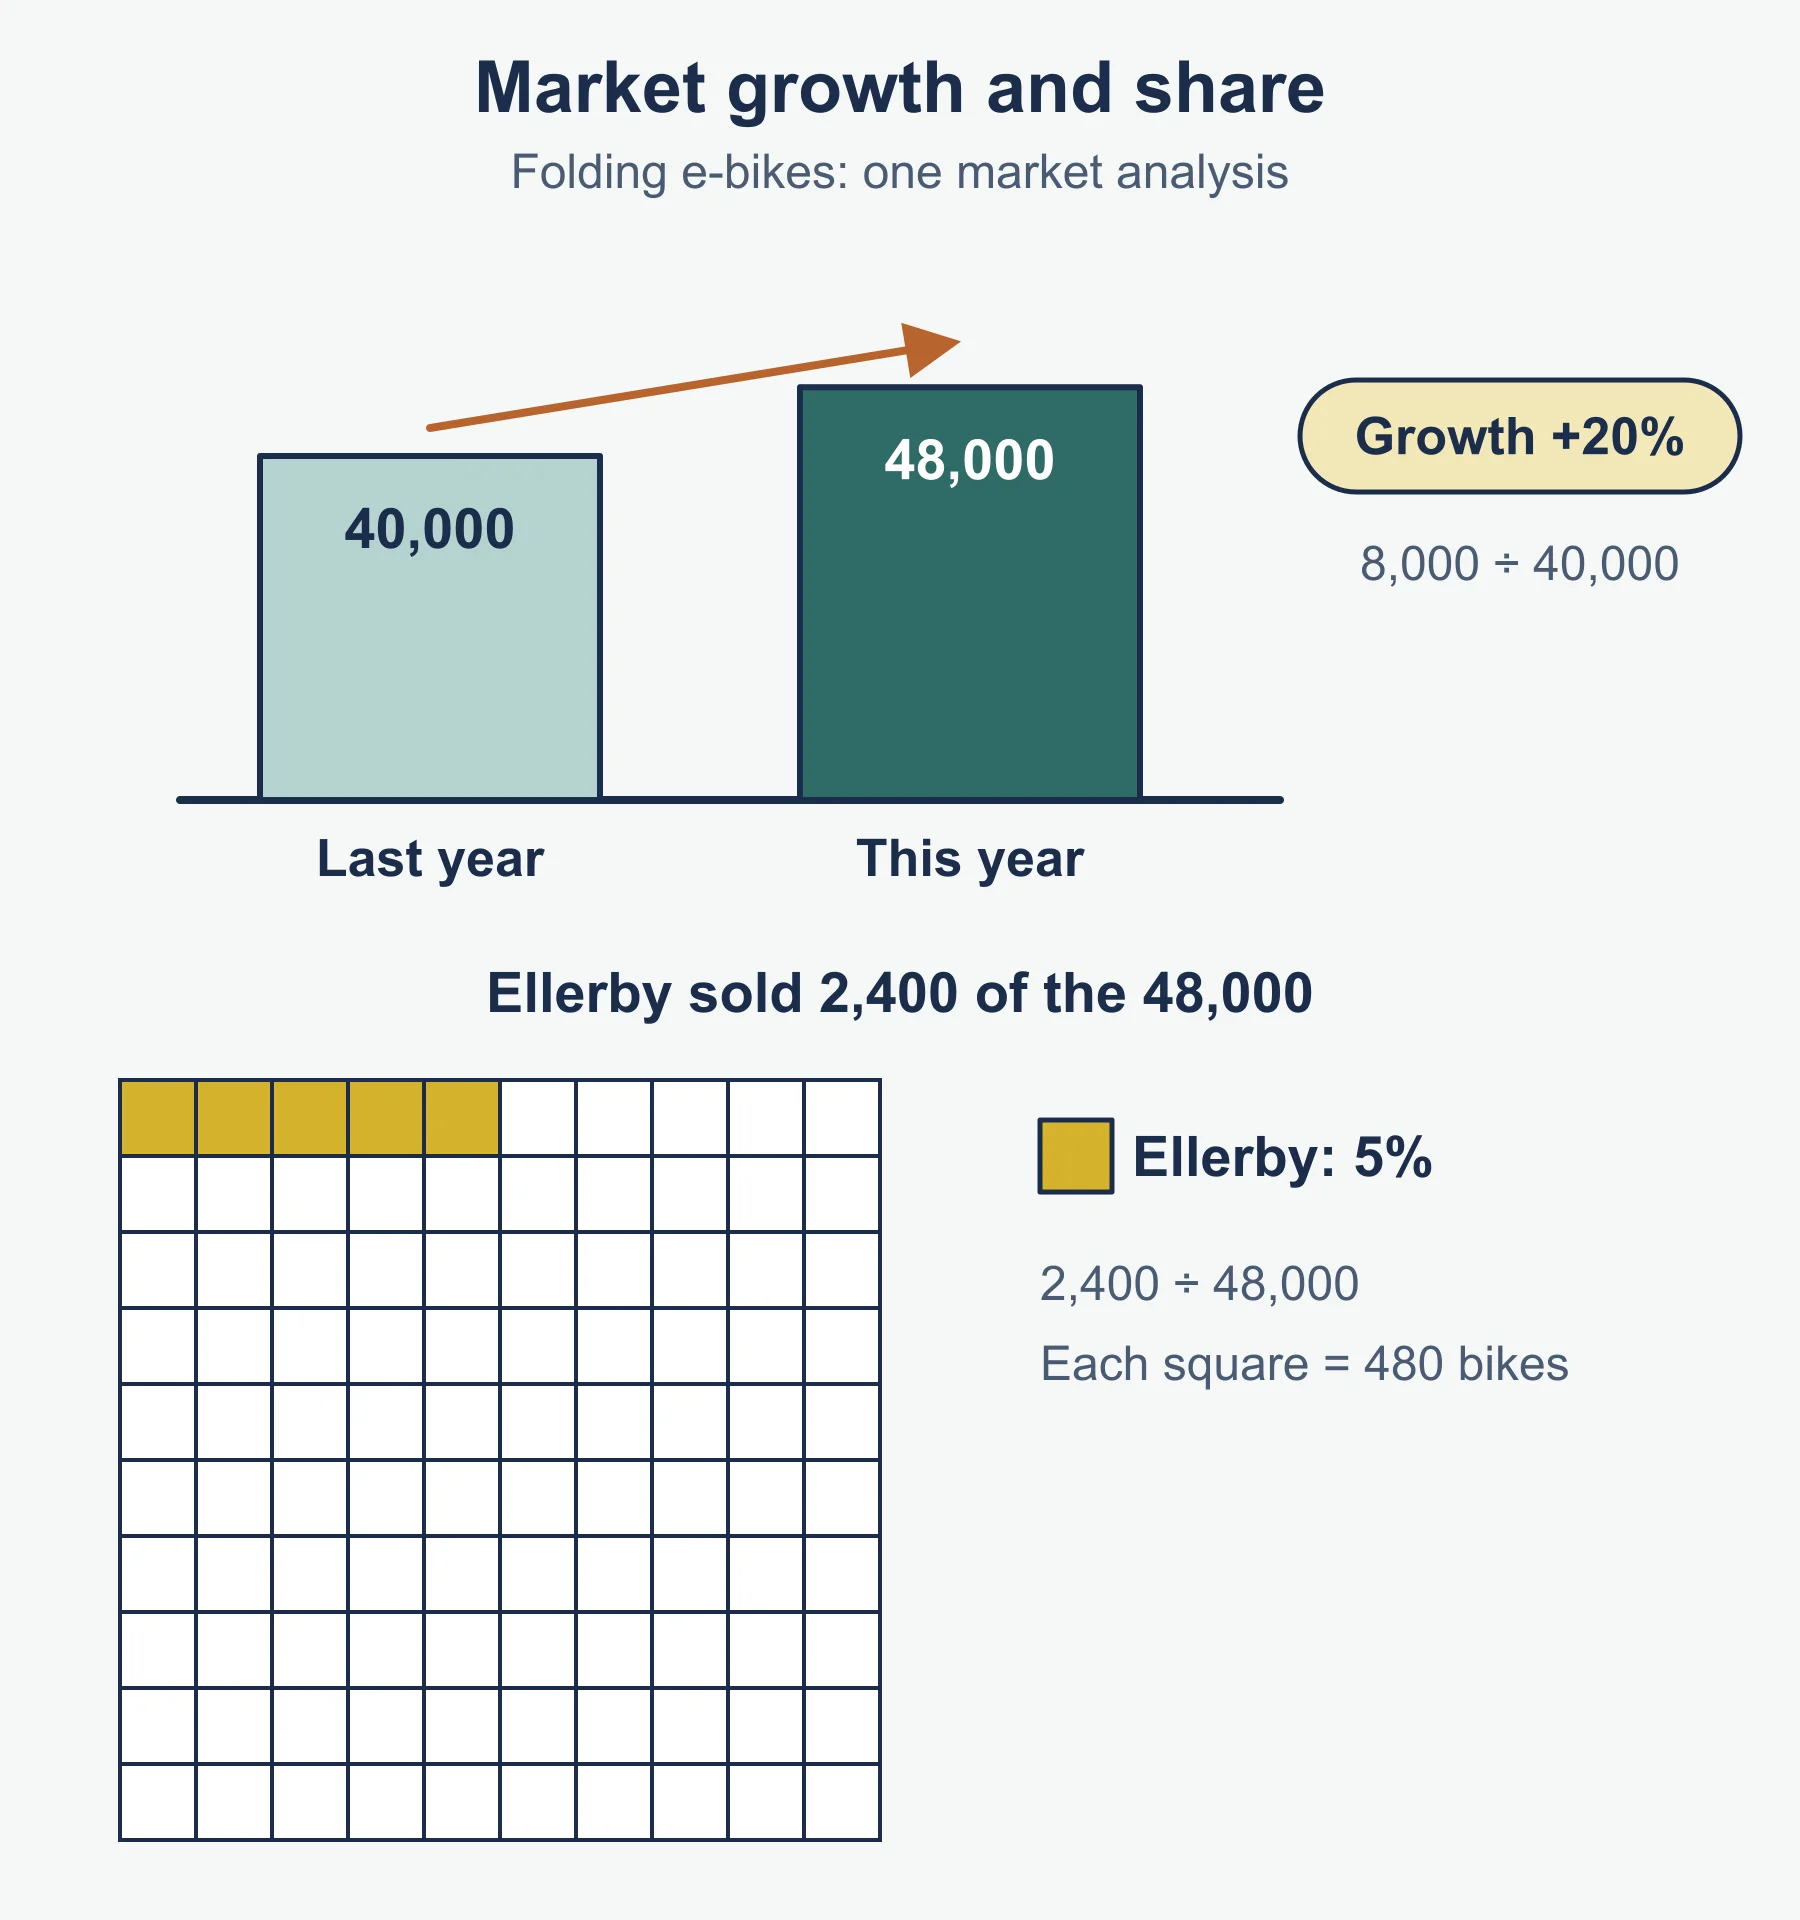
A market analysis shows folding e-bike sales rose from 40,000 units to 48,000 units in a year. Growth is (48,000 − 40,000) / 40,000 = 20%. Ellerby sold 2,400 units, so its share is 2,400 / 48,000 = 5%.
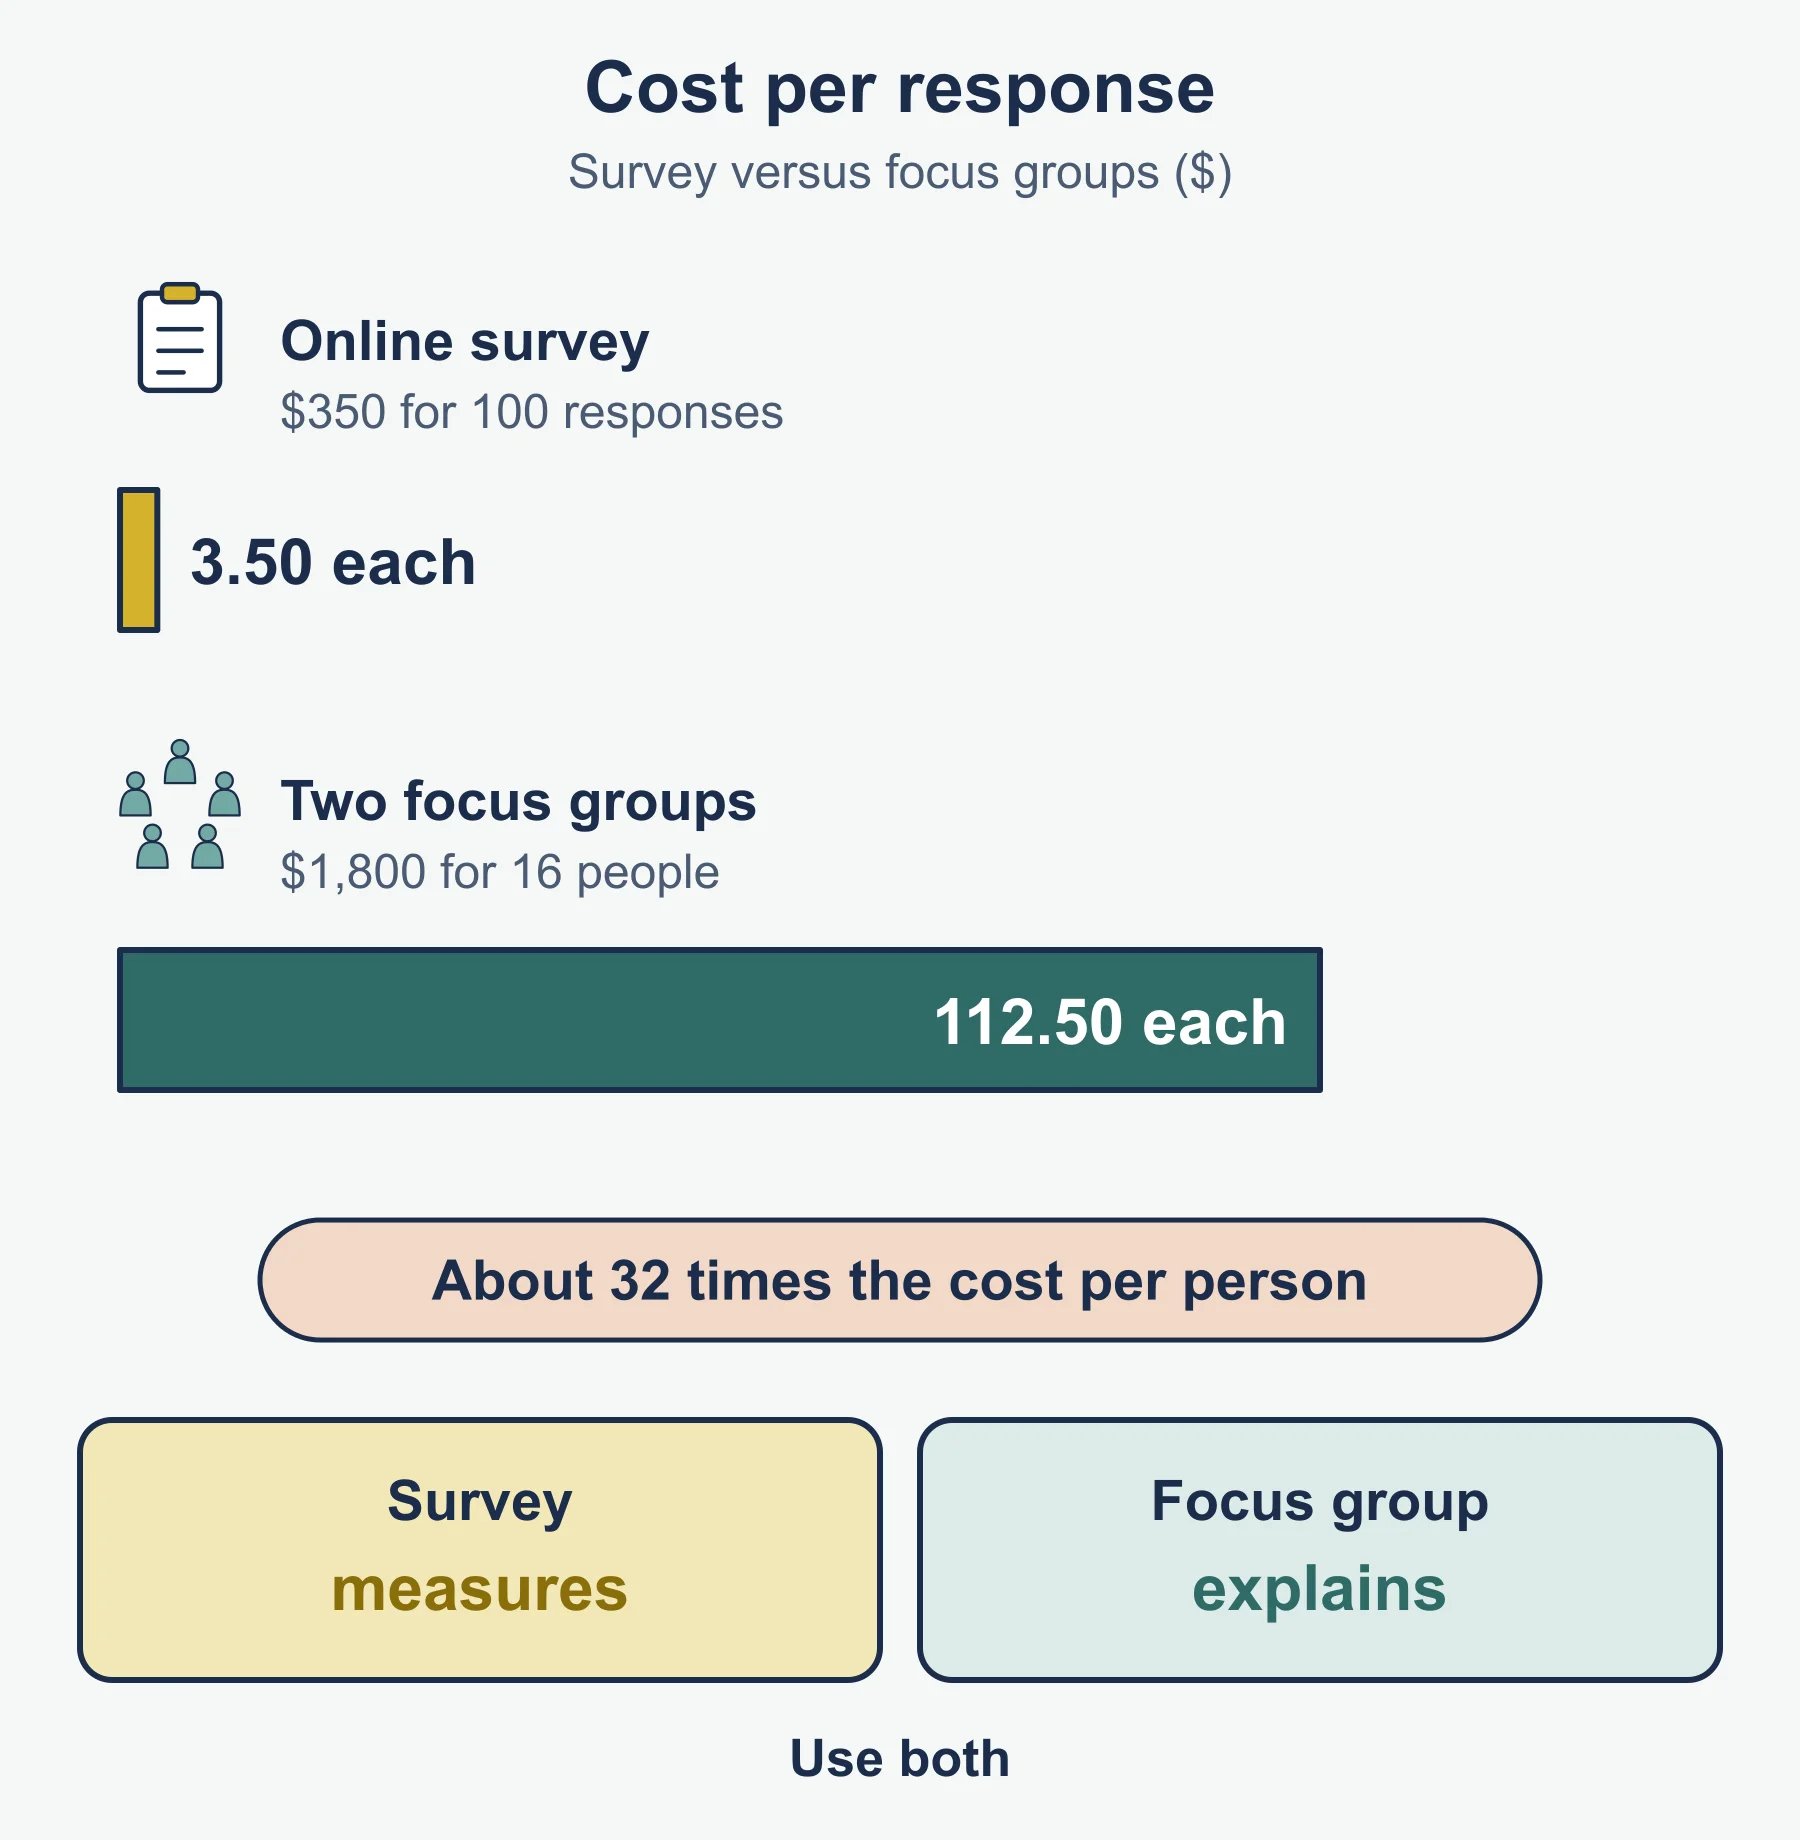
Cost comparison for the primary work: the online survey cost USD 350 for 100 responses, which is 3.50 per response. Two focus groups of eight people cost USD 900 each, so 1,800 / 16 = 112.50 per participant. The focus groups cost far more per person but explain the reasons behind the numbers. Neither replaces the other, so a justified recommendation is to use the survey to measure and the focus group to explain.
Common errors
- Writing “primary research is better” without a context. The better method depends on the question, budget and time.
- Calling a survey “qualitative” without checking whether the questions are closed or open.
- Describing a quota sample as random. Quota groups are filled by choice.
- Listing sources without saying what the business learns from them.
- Treating secondary data as free of bias or error.
- Forgetting the limits of the sample when drawing a conclusion from results.
Next: test yourself with the revision notes and the practice questions.
Frequently asked questions
What is the difference between primary and secondary market research? Primary research is new data collected for the business’s own purpose, through surveys, interviews, focus groups or observations. Secondary research uses data that already exists, collected by someone else for another purpose; it is usually cheaper and quicker but not designed for the business’s question.
What is the difference between qualitative and quantitative research? Quantitative research produces numerical data that can be counted or averaged, such as ratings. Qualitative research produces descriptive data about opinions, attitudes and motives, such as comments; many businesses use both.
What is convenience sampling? Convenience sampling means asking whoever is easy to reach, such as passers-by outside a shop. It is quick and cheap, but the people reached may not represent the target market, so results may be biased.
Does market research guarantee a product will succeed? No. Research costs money and time, results can be wrong, and customers can say one thing and do another, so it reduces uncertainty rather than removing it.
Official syllabus
IB Diploma Programme Business management guide, first assessment 2024, published by the International Baccalaureate Organization. This page covers section 4.4 Market research.
Get free revision emails (optional)
Occasional emails with practice questions, worked explanations and links to free resources for the qualification and subjects you choose. No spam, and you can unsubscribe from any email. The free tools on this site never need an email.
Related resources
-
Practice questions
IB DP Business Management: Market research – Practice Questions
Original practice questions with worked answers on market research for IB DP Business Management section 4.4, including sampling and short cases.
Business · International Baccalaureate · IB
Try questions -
Revision notes
IB DP Business Management: Market research – Revision Notes
Revision notes on market research for IB DP Business Management section 4.4: methods, sampling, qualitative versus quantitative, and a self-test.
Business · International Baccalaureate · IB
Revise topic -
Study guides
IB DP Business Management: Sales forecasting (HL only)
Study guide to the benefits and limitations of sales forecasting, with simple linear regression worked through, for IB DP Business Management HL.
Business · International Baccalaureate · IB
Read guide
Related articles
-
teaching
A Level tuition in Dubai: Cambridge or Pearson Edexcel International A Level?
Schools in Dubai and Abu Dhabi teach either Cambridge International AS & A Level or Pearson Edexcel International A Level. How the two are structured, why it matters for tuition, and how online classes from Lahore work.
9 October 2026
-
curriculum guides
Choosing subjects at IGCSE and A Level
How subject choices at 14 and 16 affect university options later, and how to keep pathways open without overloading a timetable.
28 July 2026
Studying this with a teacher
Working through Business IB?
This page is free and stays free. If you would rather be taught it, Marlbridge runs Business classes one-to-one, online in your own time zone. The first trial class is free. WhatsApp replies within an hour (8am–11pm Pakistan time, every day); email the same day.
IB Business teachers at Marlbridge

