
Revision Notes
IB DP Business Management: Sales forecasting (HL only) – Revision Notes
Condensed revision notes on sales forecasting benefits, limitations and simple linear regression, with a self-test, for IB Business Management HL.
- Subject
- Business
- Level
- IB
- Topic
- Unit 4: Marketing
- Author
- Marlbridge Academic Team
- Updated
- Reviewed by
- Salman Ahmad (what this means)
Aligned to International Baccalaureate IB Diploma Programme Business (DP Business Management), First assessment 2024. Official specification .
Syllabus page (what it covers and how it is assessed): IB Diploma Programme Business.
Syllabus points this page covers
DP Business Management
- 4.3 Sales forecasting (HL only)
Found an error? Report a correction.
Need help with this topic? Request a free trial class for IB Diploma Programme Business (DP Business Management).
These notes condense section 4.3, Sales forecasting (HL only), from Unit 4 of the IB Business management guide, first assessment 2024. For full explanations and worked examples, read the study guide. The guide lists one content point here, the benefits and limitations of sales forecasting (AO3), and lists simple linear regression (HL only) in its toolkit.
Links: course hub, printable checklist, practice questions, Unit 4 overview, and the free diagnostics.
Key definitions
| Term | Meaning |
|---|---|
| Sales forecast | A prediction of future sales, in units, revenue or both. The guide does not define it, so this is a working definition. |
| Trend | The general direction of sales over time, such as steady growth or decline. |
| Scatter diagram | A graph of paired data, here time (x) against sales (y). |
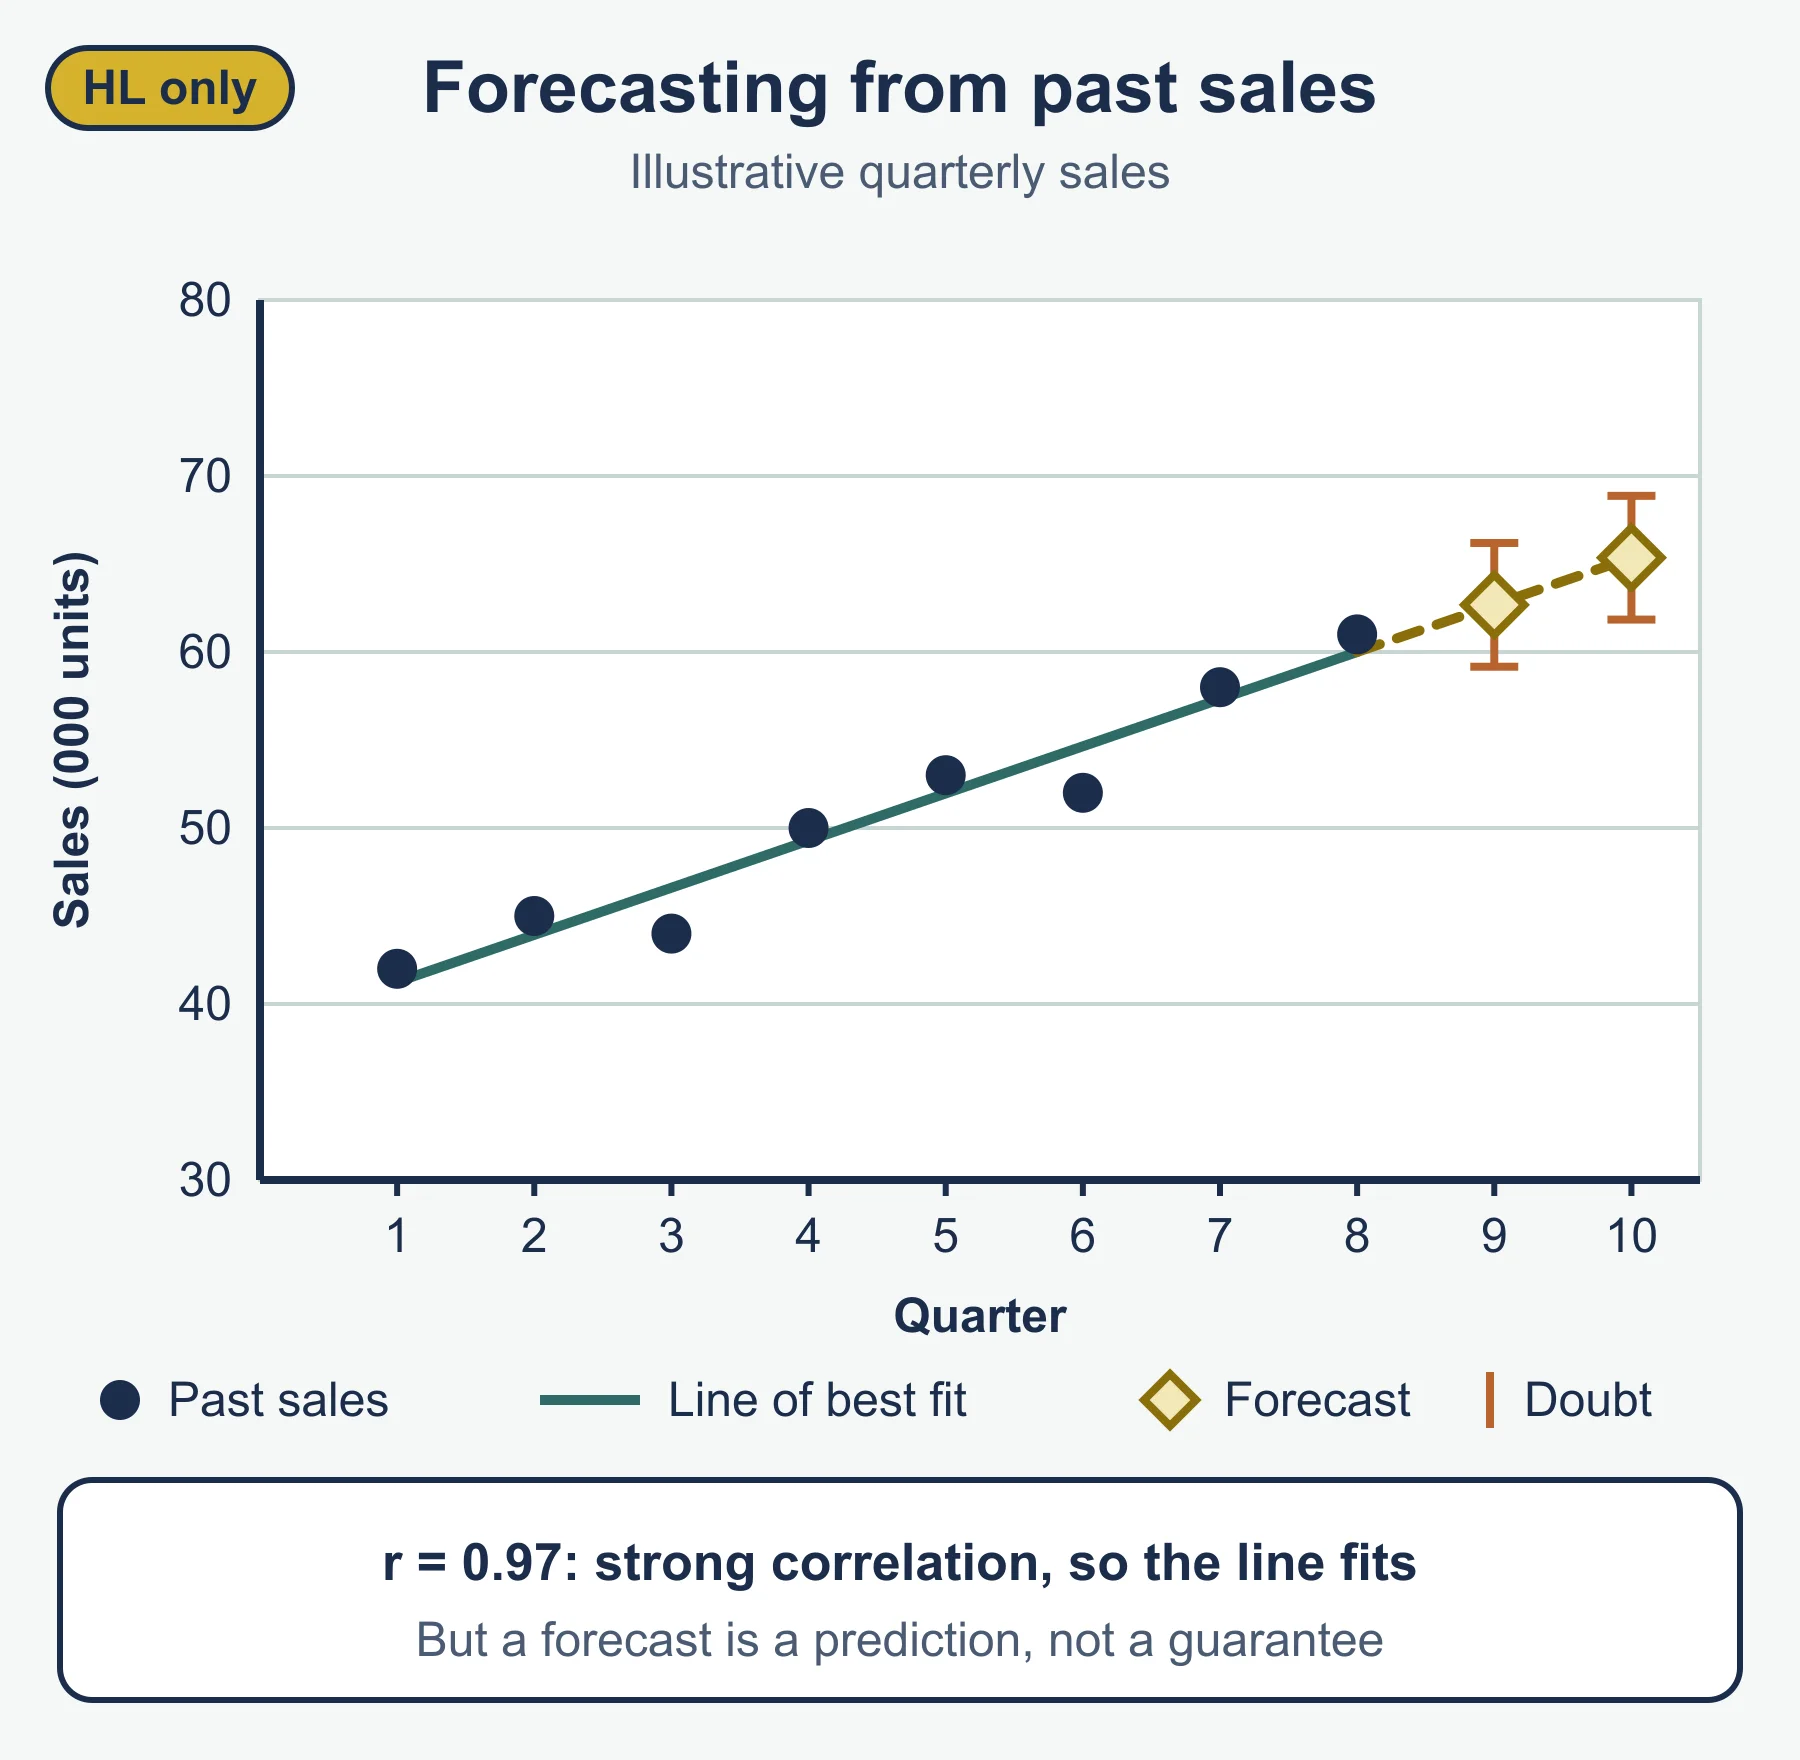
| Line of best fit | The straight line that follows the points most closely. |
| Correlation | How closely points follow a straight line, positive or negative. |
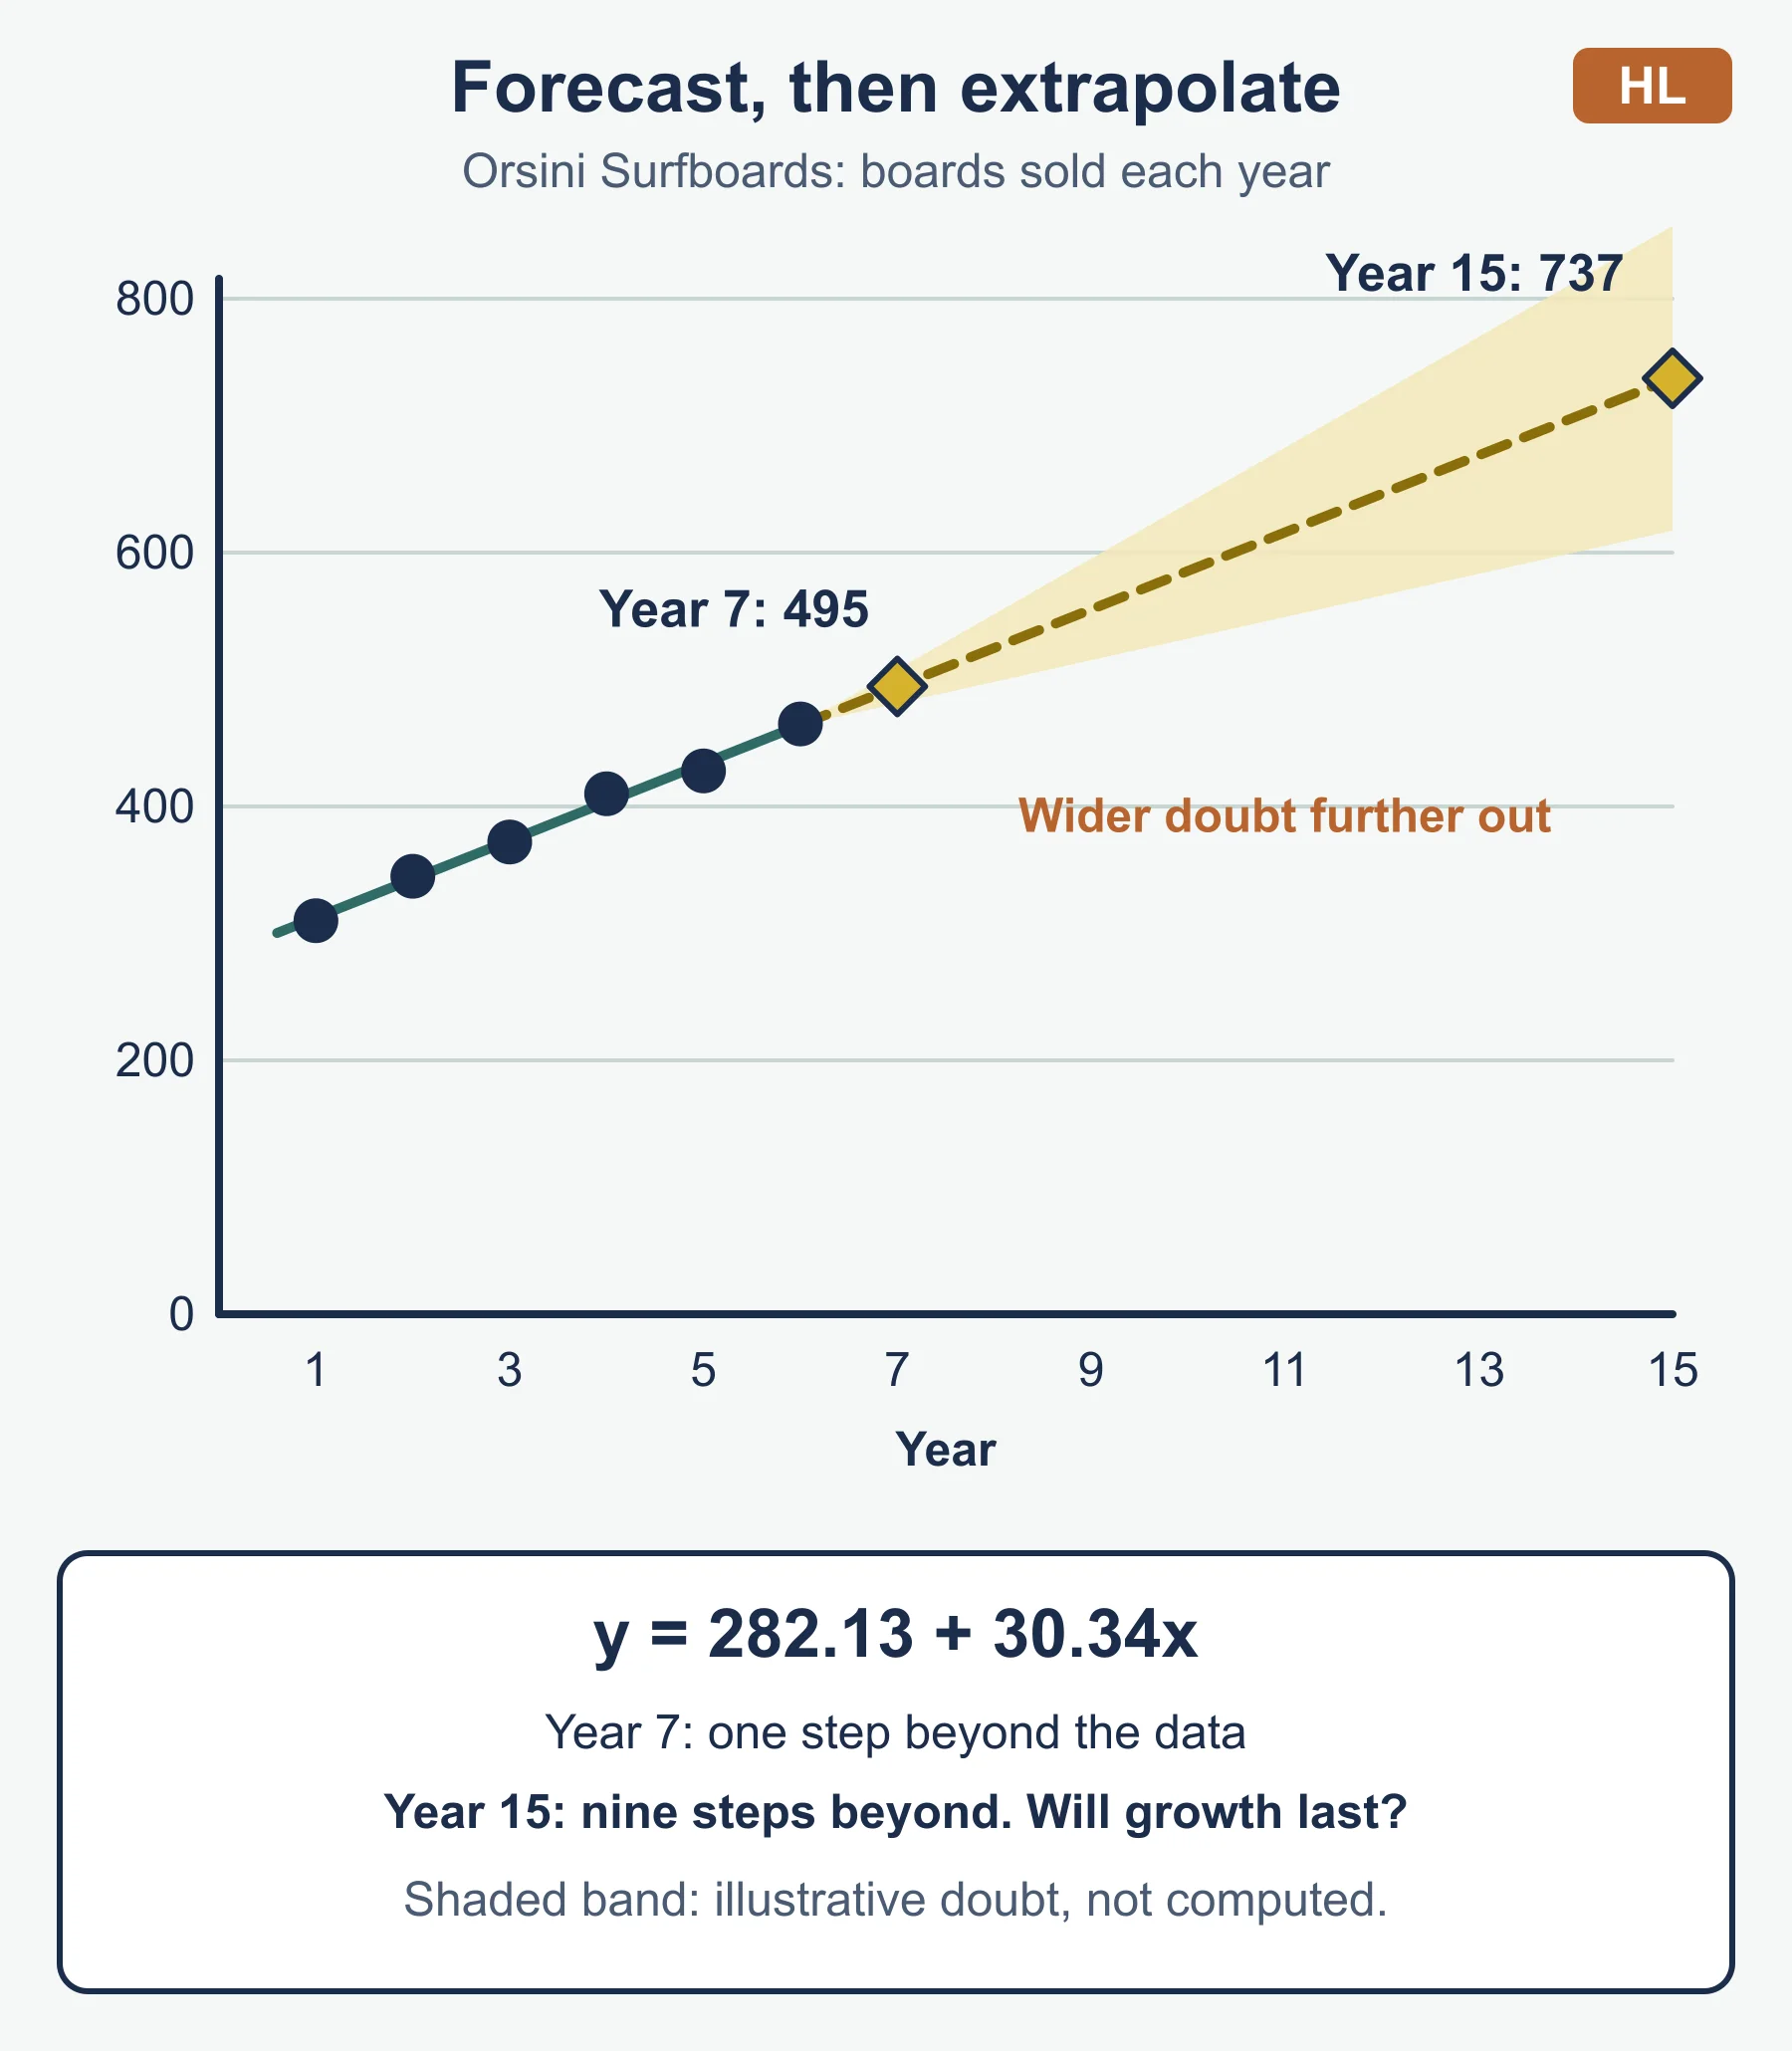
| Extrapolation | Extending the line beyond the data to predict a value. |
| Interpolation | Reading a value from within the range of the data. |
Benefits at a glance
| Area | How the forecast helps |
|---|---|
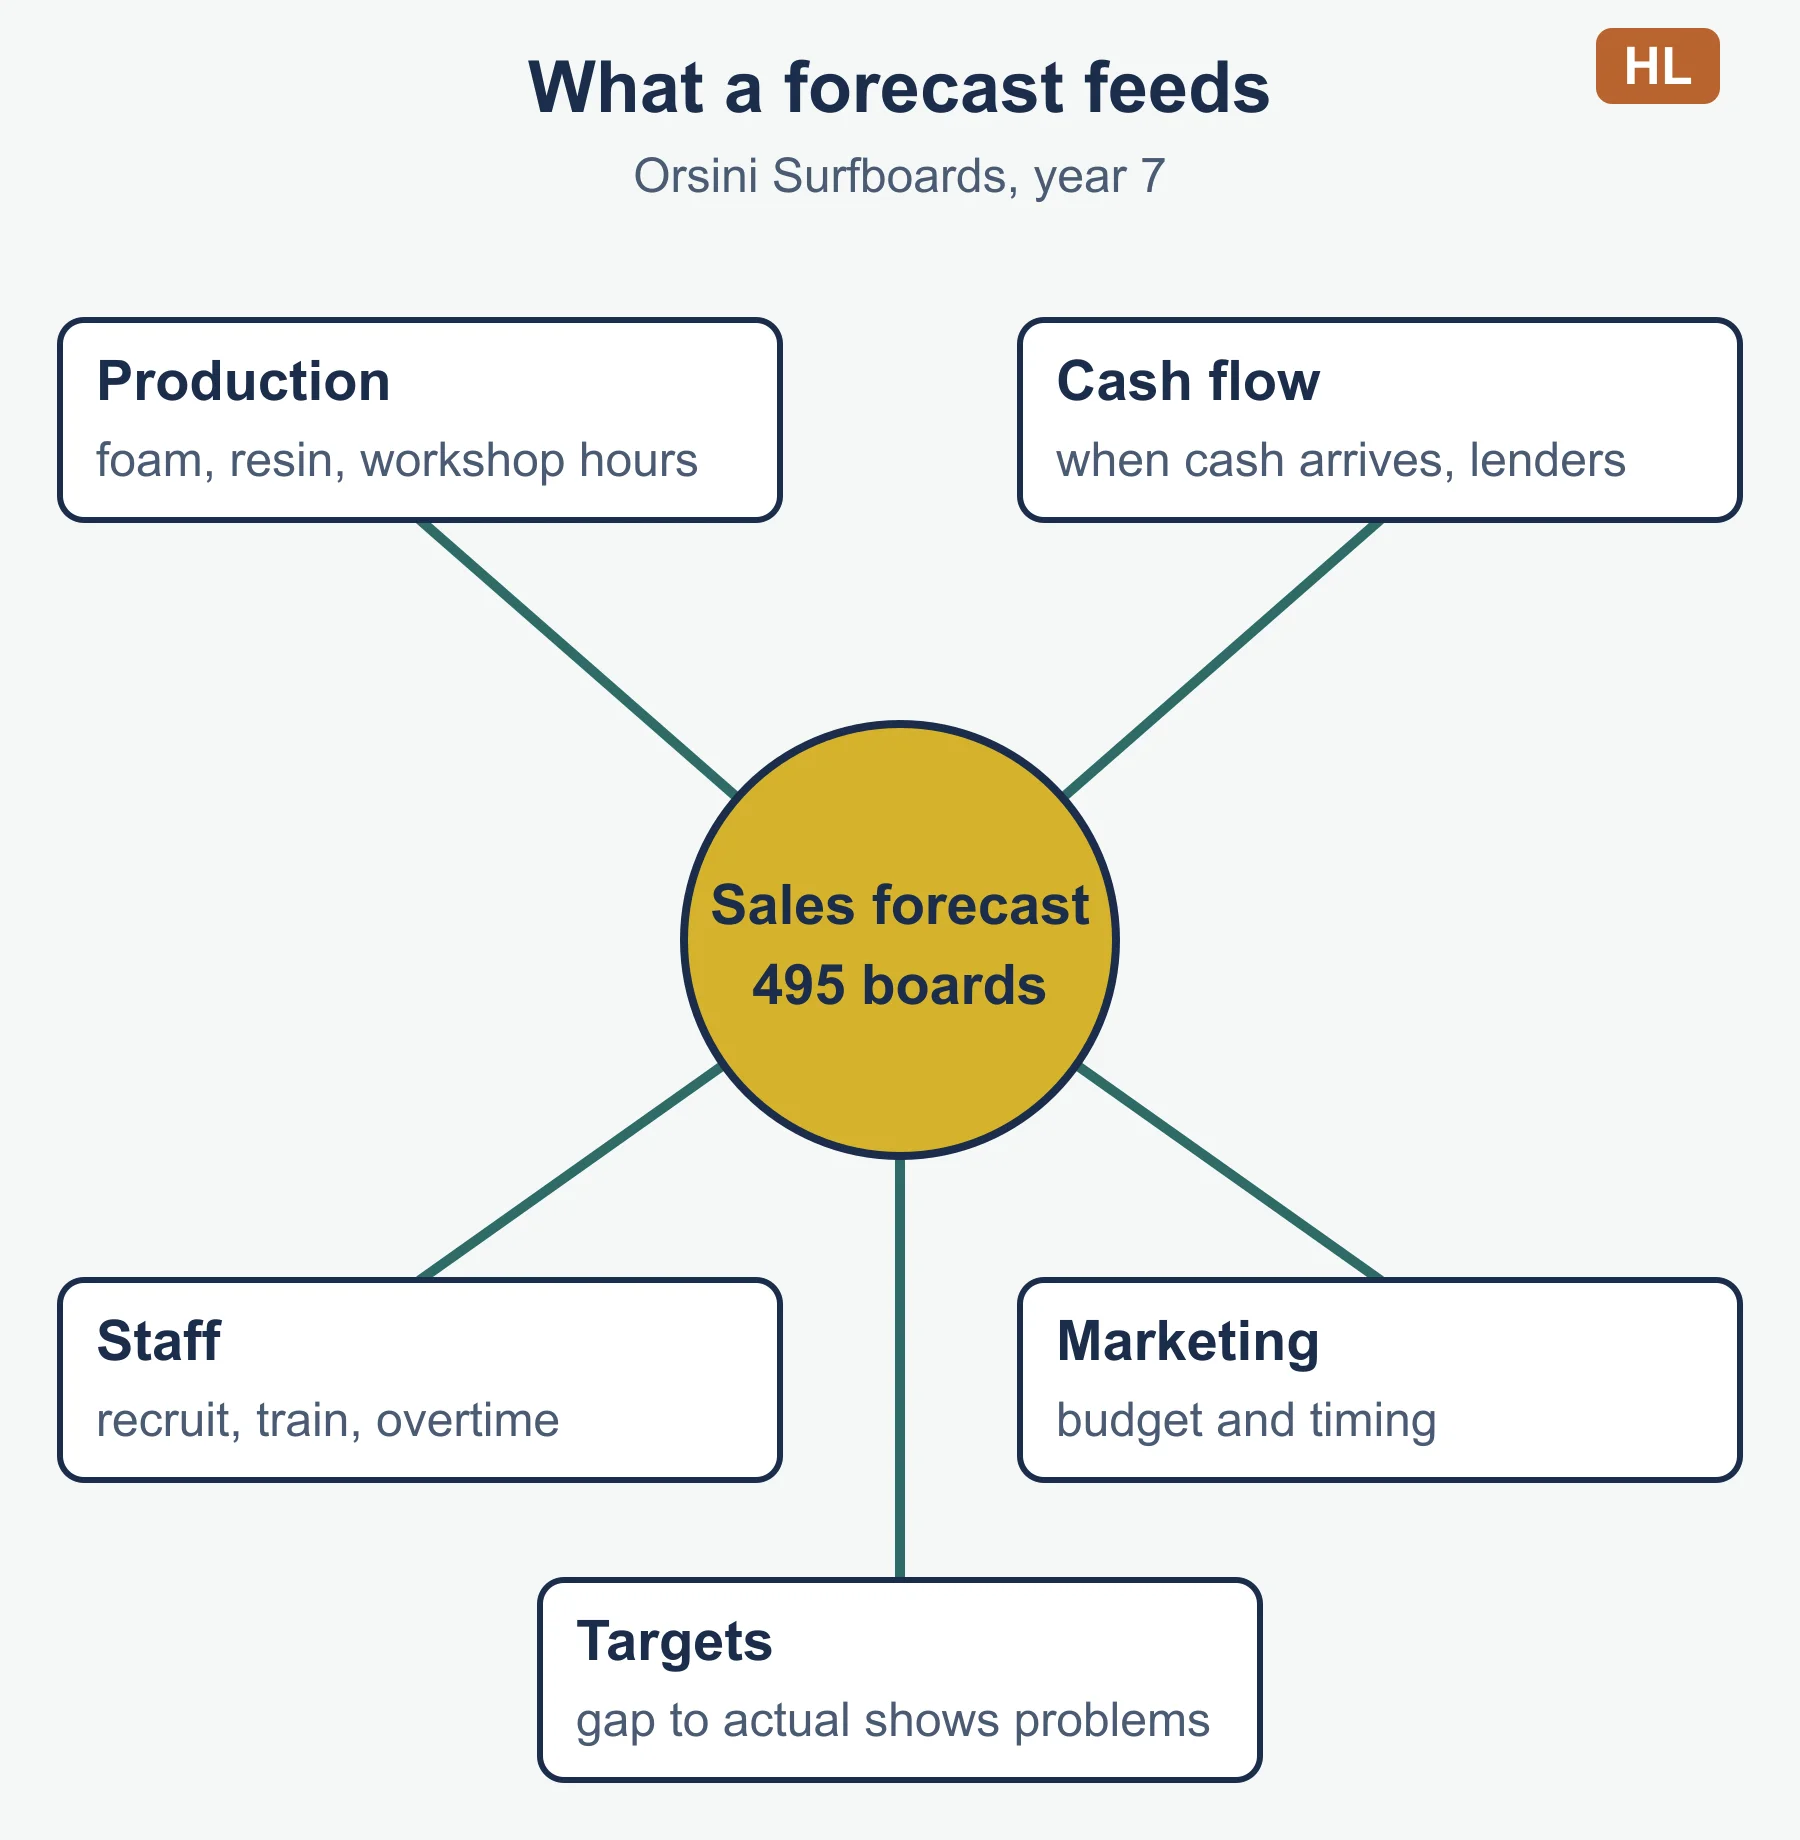
| Operations | Plans production, purchasing and stock levels, cutting stockouts and excess stock |
| Finance | Shapes the cash flow forecast and the case for loans or investment |
| People | Guides recruitment, training and overtime |
| Marketing | Sets promotion budgets and tests whether objectives are realistic |
| Control | Gives targets, and the gap with actual sales shows where to look |
| Risk | Replaces guesses with evidence, so decisions are easier to defend |
Limitations at a glance
| Limitation | Why it matters |
|---|---|
| Past data | Assumes yesterday’s pattern continues |
| External change | Competitors, tastes, the economy, technology and regulation move demand |
| Shocks | One-off events are not in any data set |
| Time horizon | Longer forecasts carry more error |
| Thin data | New products or few data points give weak lines |
| Bias | Optimistic or cautious managers distort figures |
| Cost and time | Data work uses resources |
| False confidence | A precise number can hide a wide range of outcomes |
Method: simple linear regression (HL only)
The guide gives the headings only (scatter diagrams, line of best fit, correlation/extrapolation). The formulas below are the standard least-squares form.
- Number the periods x = 1, 2, 3 and so on. Record sales as y.
- Find the means x̄ and ȳ.
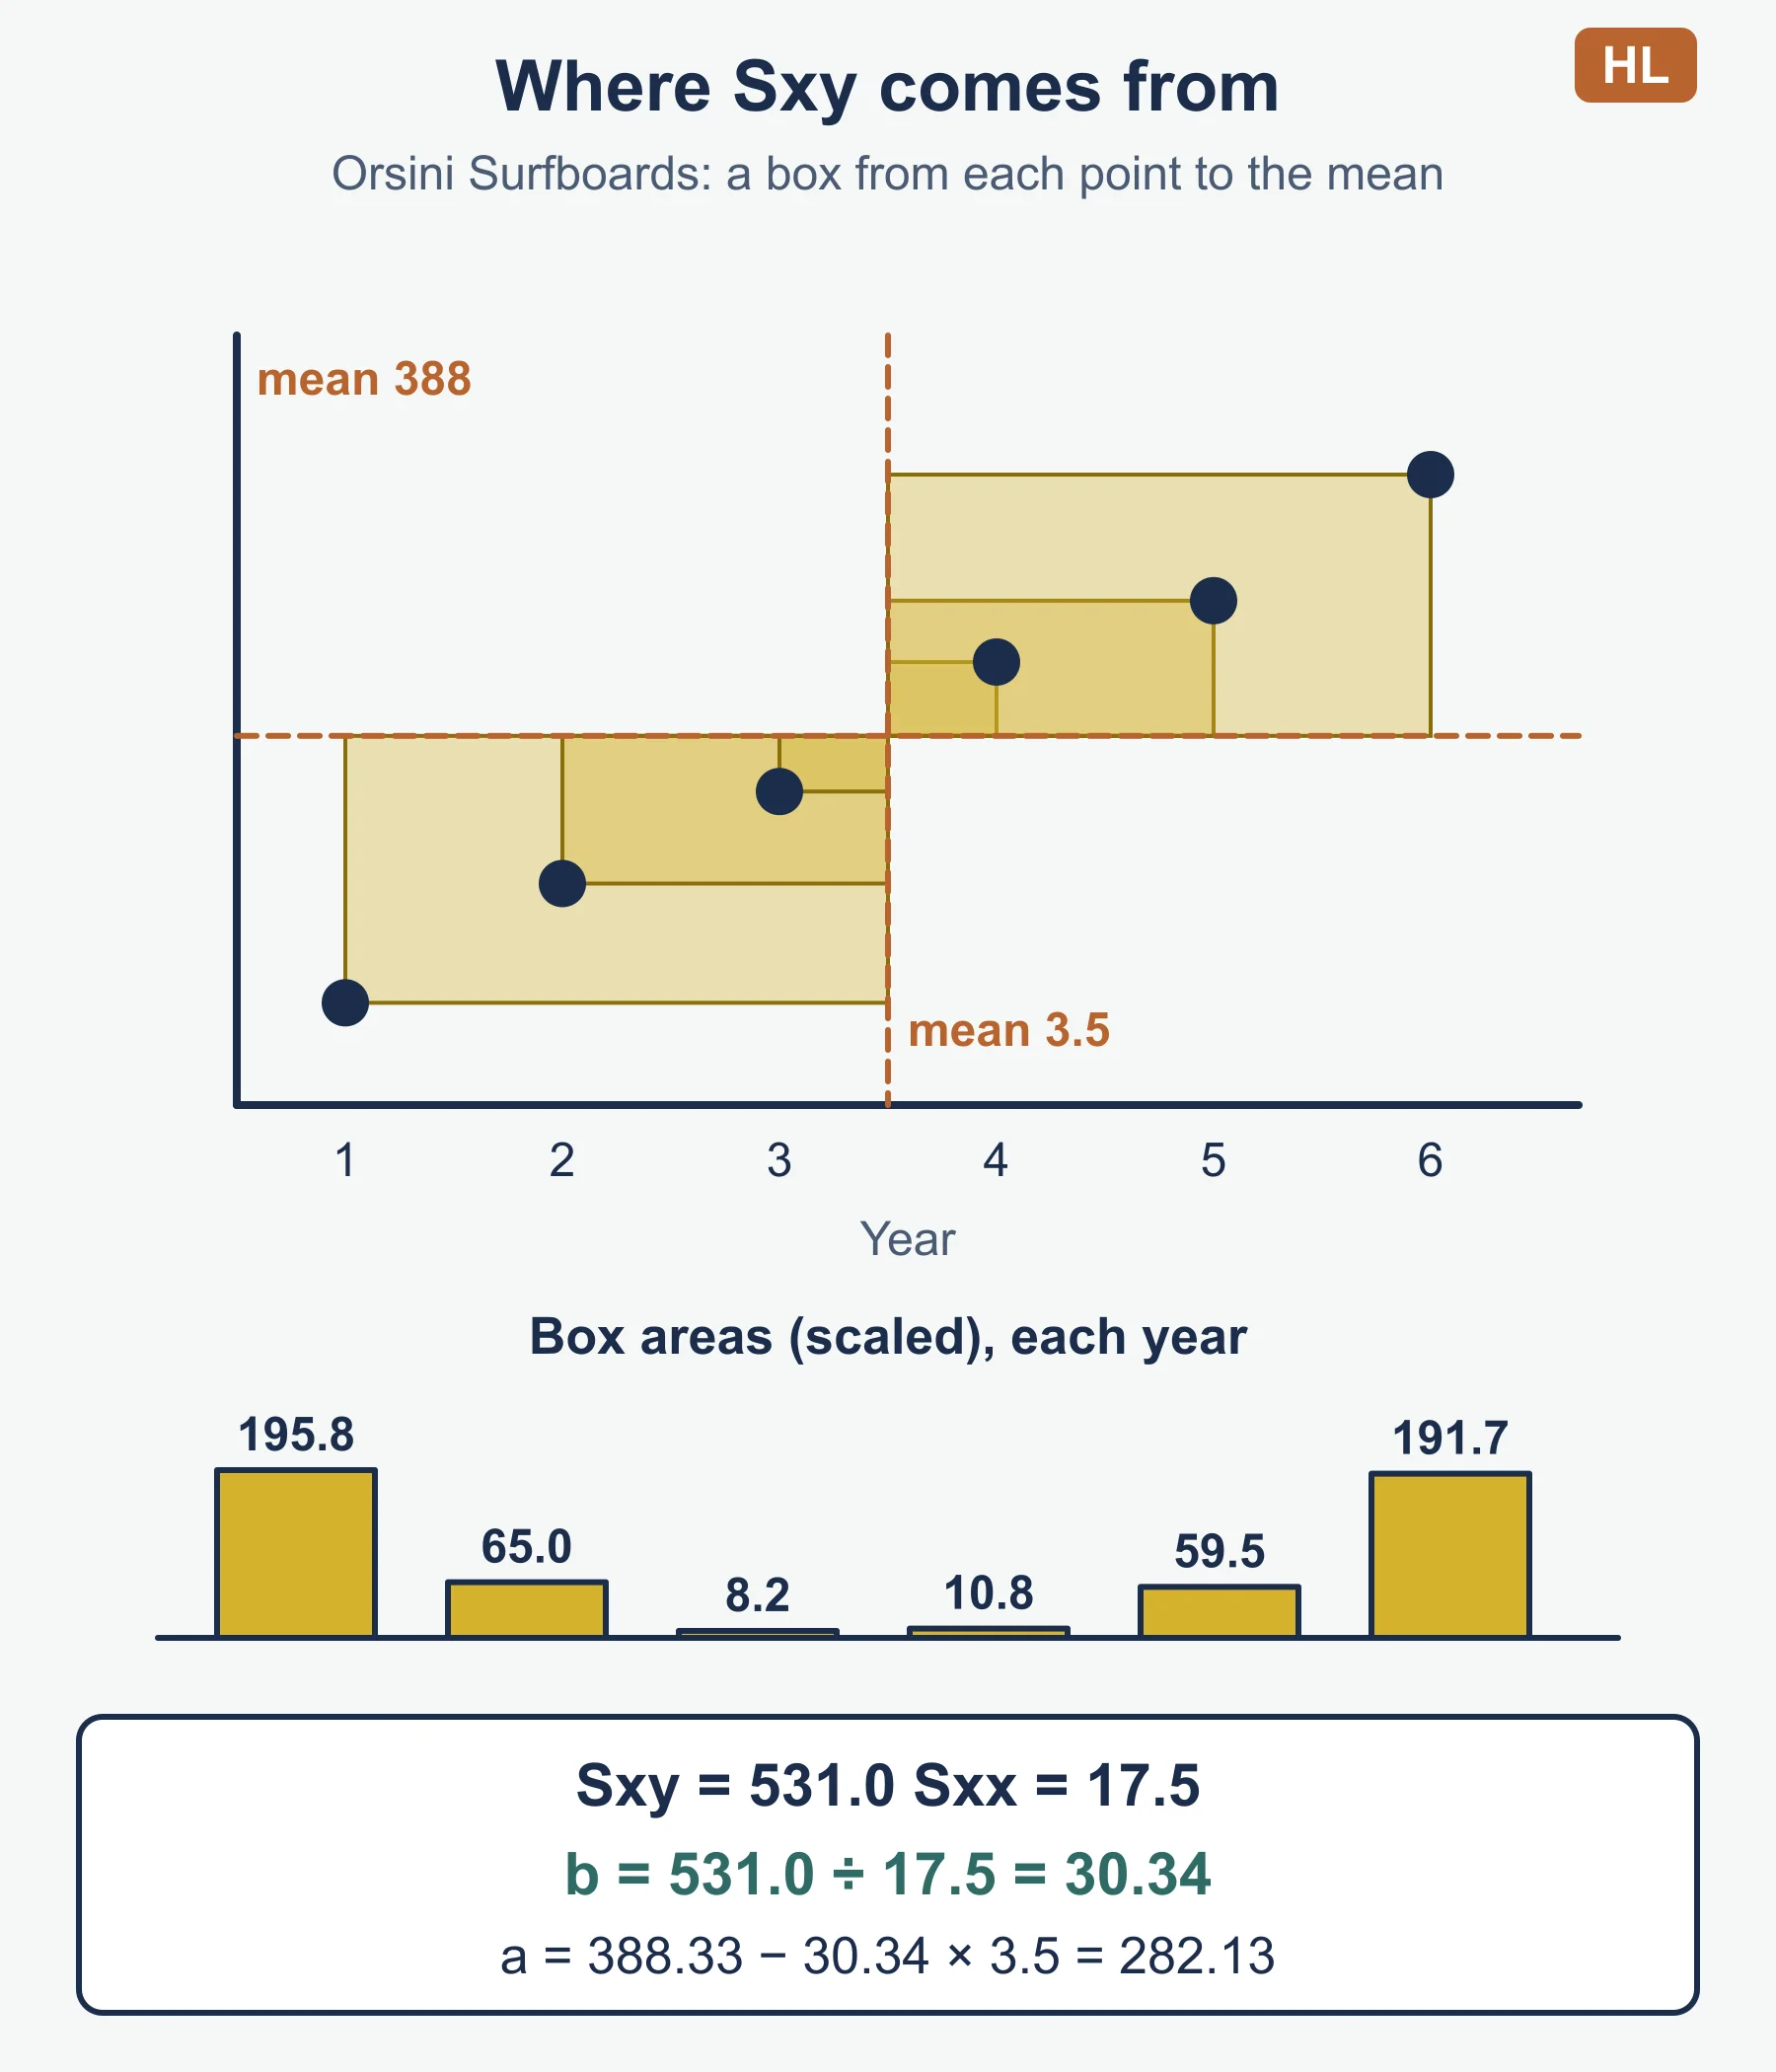
- Find Sxy = sum of (x − x̄)(y − ȳ) and Sxx = sum of (x − x̄)².
- Gradient b = Sxy / Sxx. Intercept a = ȳ − b·x̄.
- Write the line as y = a + bx.
- Substitute the next period’s x to forecast.
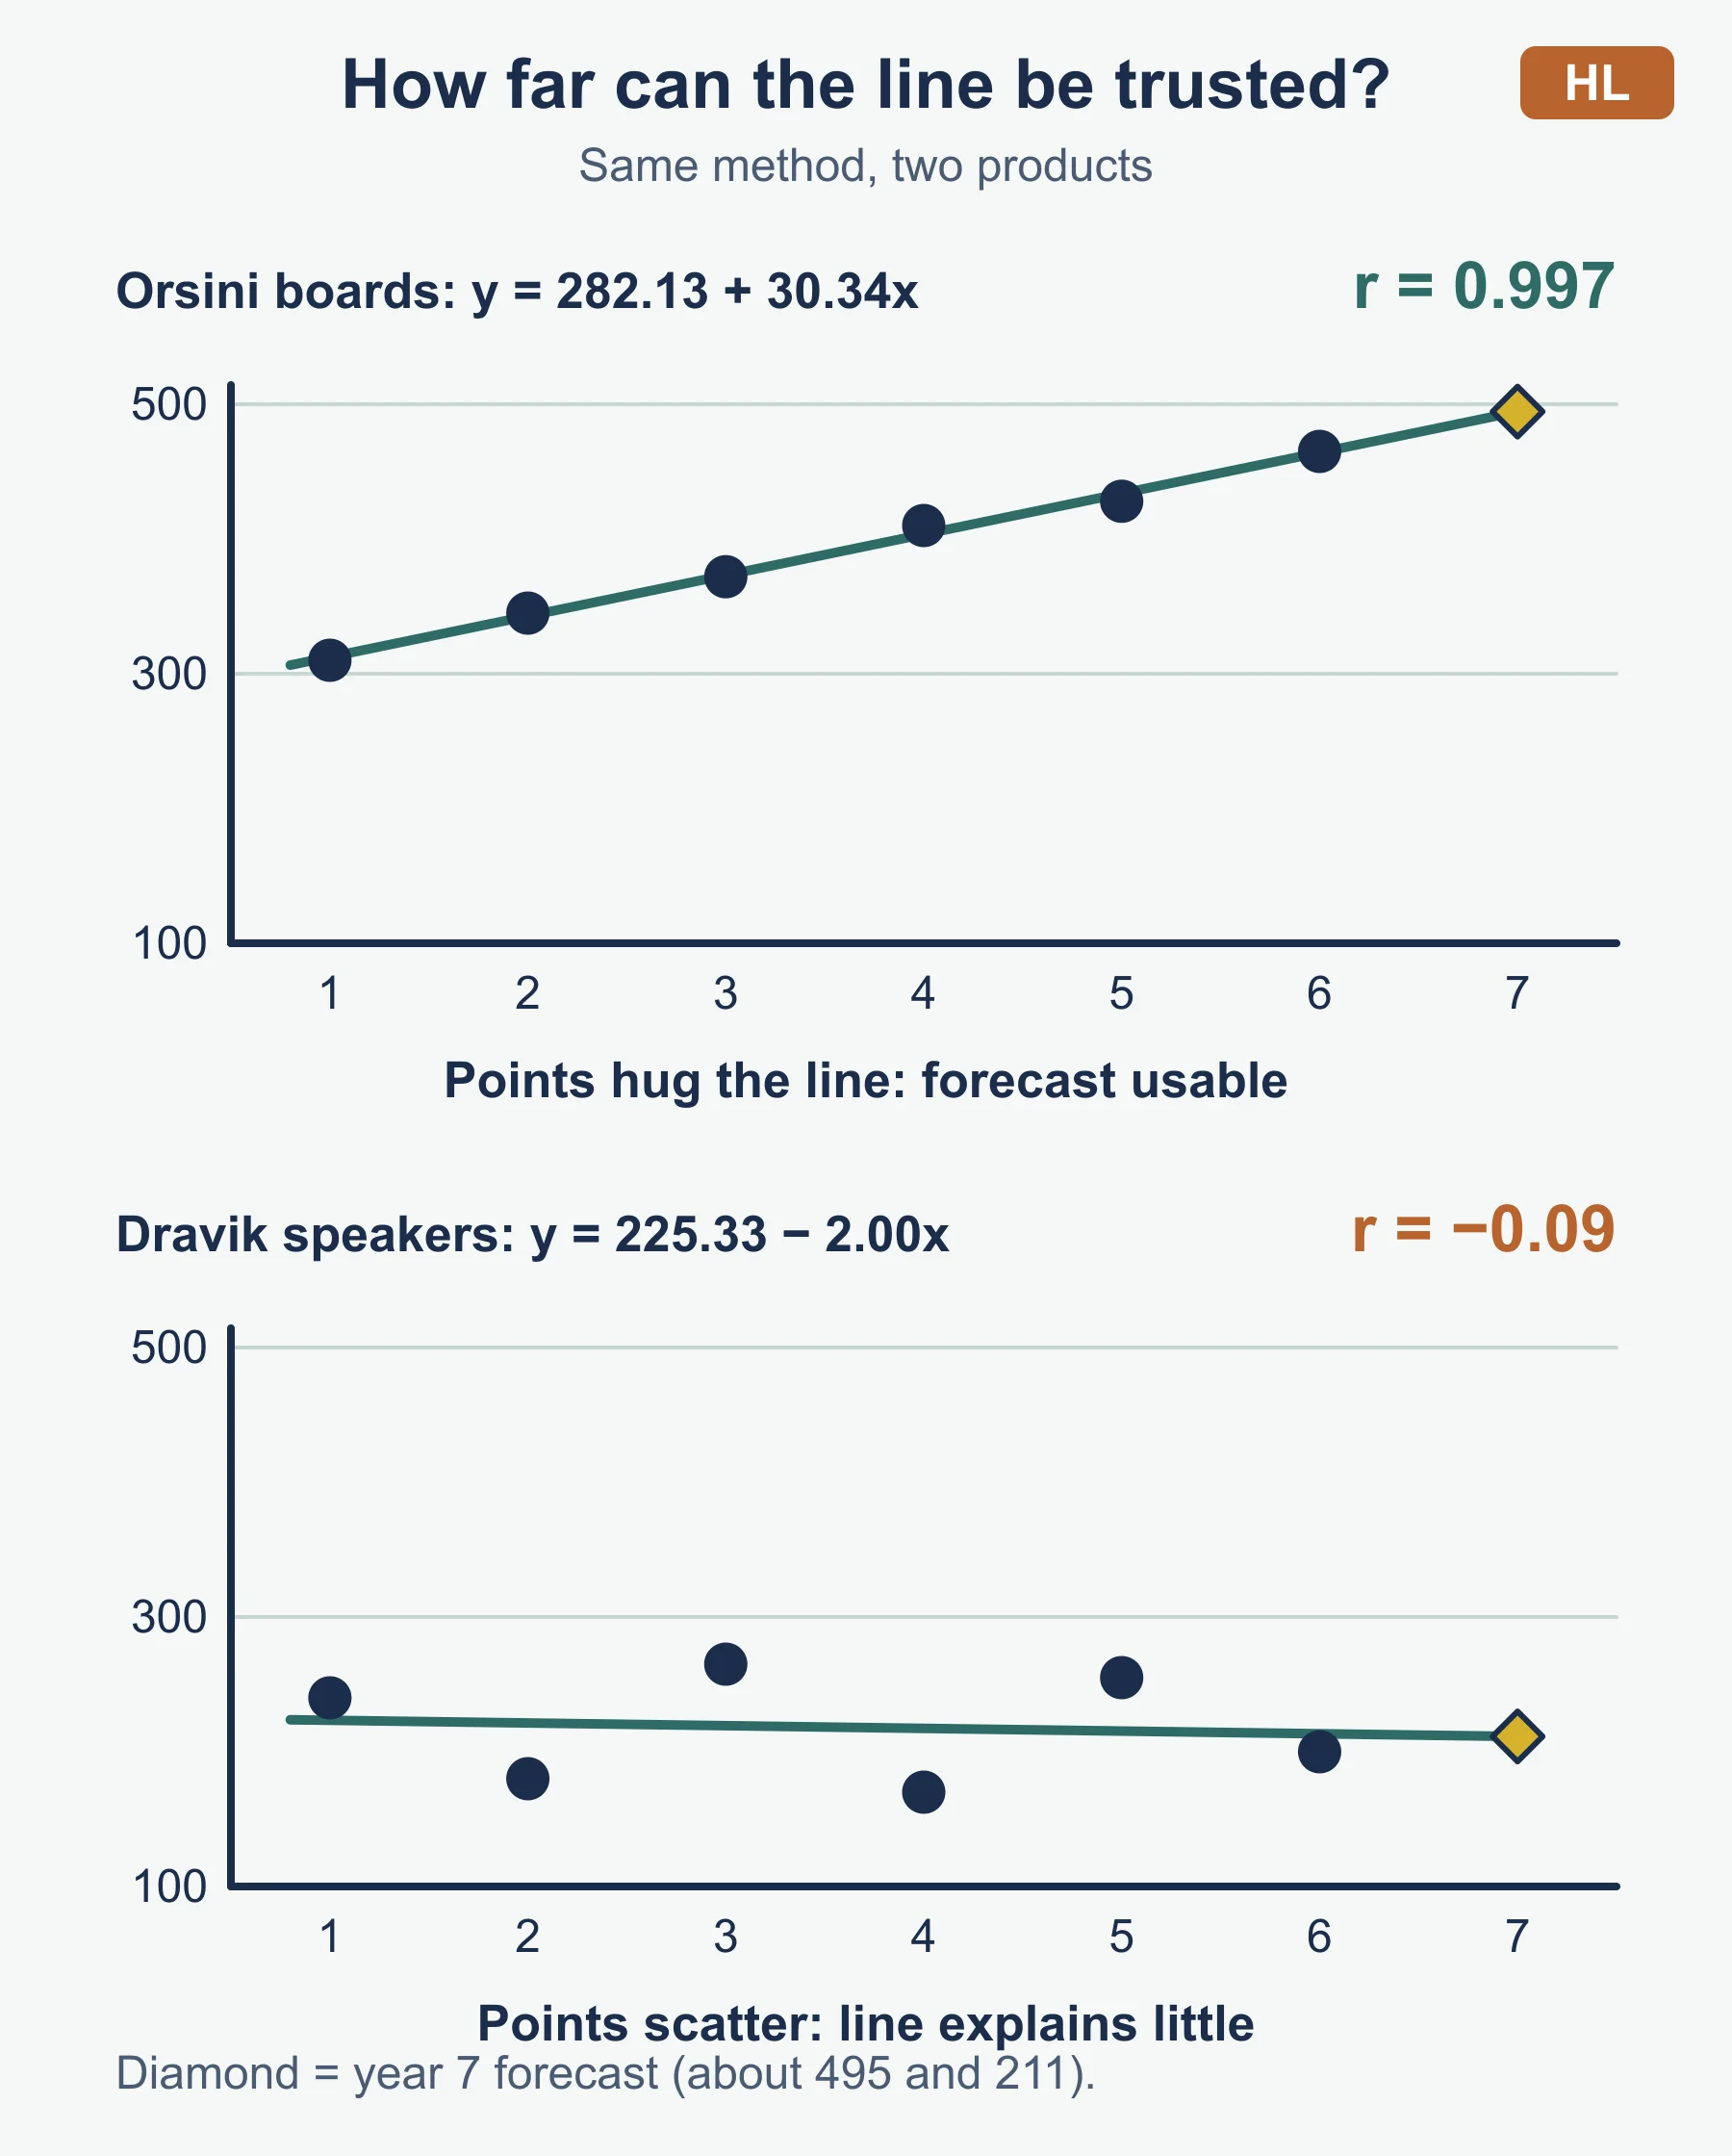
- Check correlation r (between −1 and +1) before trusting the line.
| Item | Standard form |
|---|---|
| Line of best fit | y = a + bx |
| Gradient | b = Sxy / Sxx |
| Intercept | a = ȳ − b·x̄ |
| Correlation coefficient | r = Sxy / √(Sxx × Syy), where Syy is the sum of (y − ȳ)² |
Worked reminder
Ulverne Cycles sold 120, 132, 145, 151 and 166 bikes in years 1 to 5.
- x̄ = 3 and ȳ = 142.8.
- Sxy = 111 and Sxx = 10, so b = 11.1.
- a = 142.8 − 11.1 × 3 = 109.5.
- Line: y = 109.5 + 11.1x.
- Year 6 forecast: 109.5 + 11.1 × 6 = 176.1, about 176 bikes.
- r = 0.994, a very strong positive correlation, so a one-year-ahead forecast looks reasonable.
Reading correlation
| Value of r | Reading |
|---|---|
| Close to +1 | Strong positive: sales rise steadily with time |
| Close to −1 | Strong negative: sales fall steadily with time |
| Close to 0 | Little or no straight-line relationship: the line is a poor guide |
High correlation shows that past points fit a line. It does not show that the future will follow it.
Must-know distinctions
- Sales forecast and cash flow forecast. A sales forecast predicts sales. A cash flow forecast predicts money in and out. The first feeds the second.
- Interpolation and extrapolation. Interpolation stays inside the data range. Extrapolation goes beyond it and is less reliable.
- Strong fit and accurate forecast. A strong fit describes the past. Accuracy depends on whether the future behaves like the past.
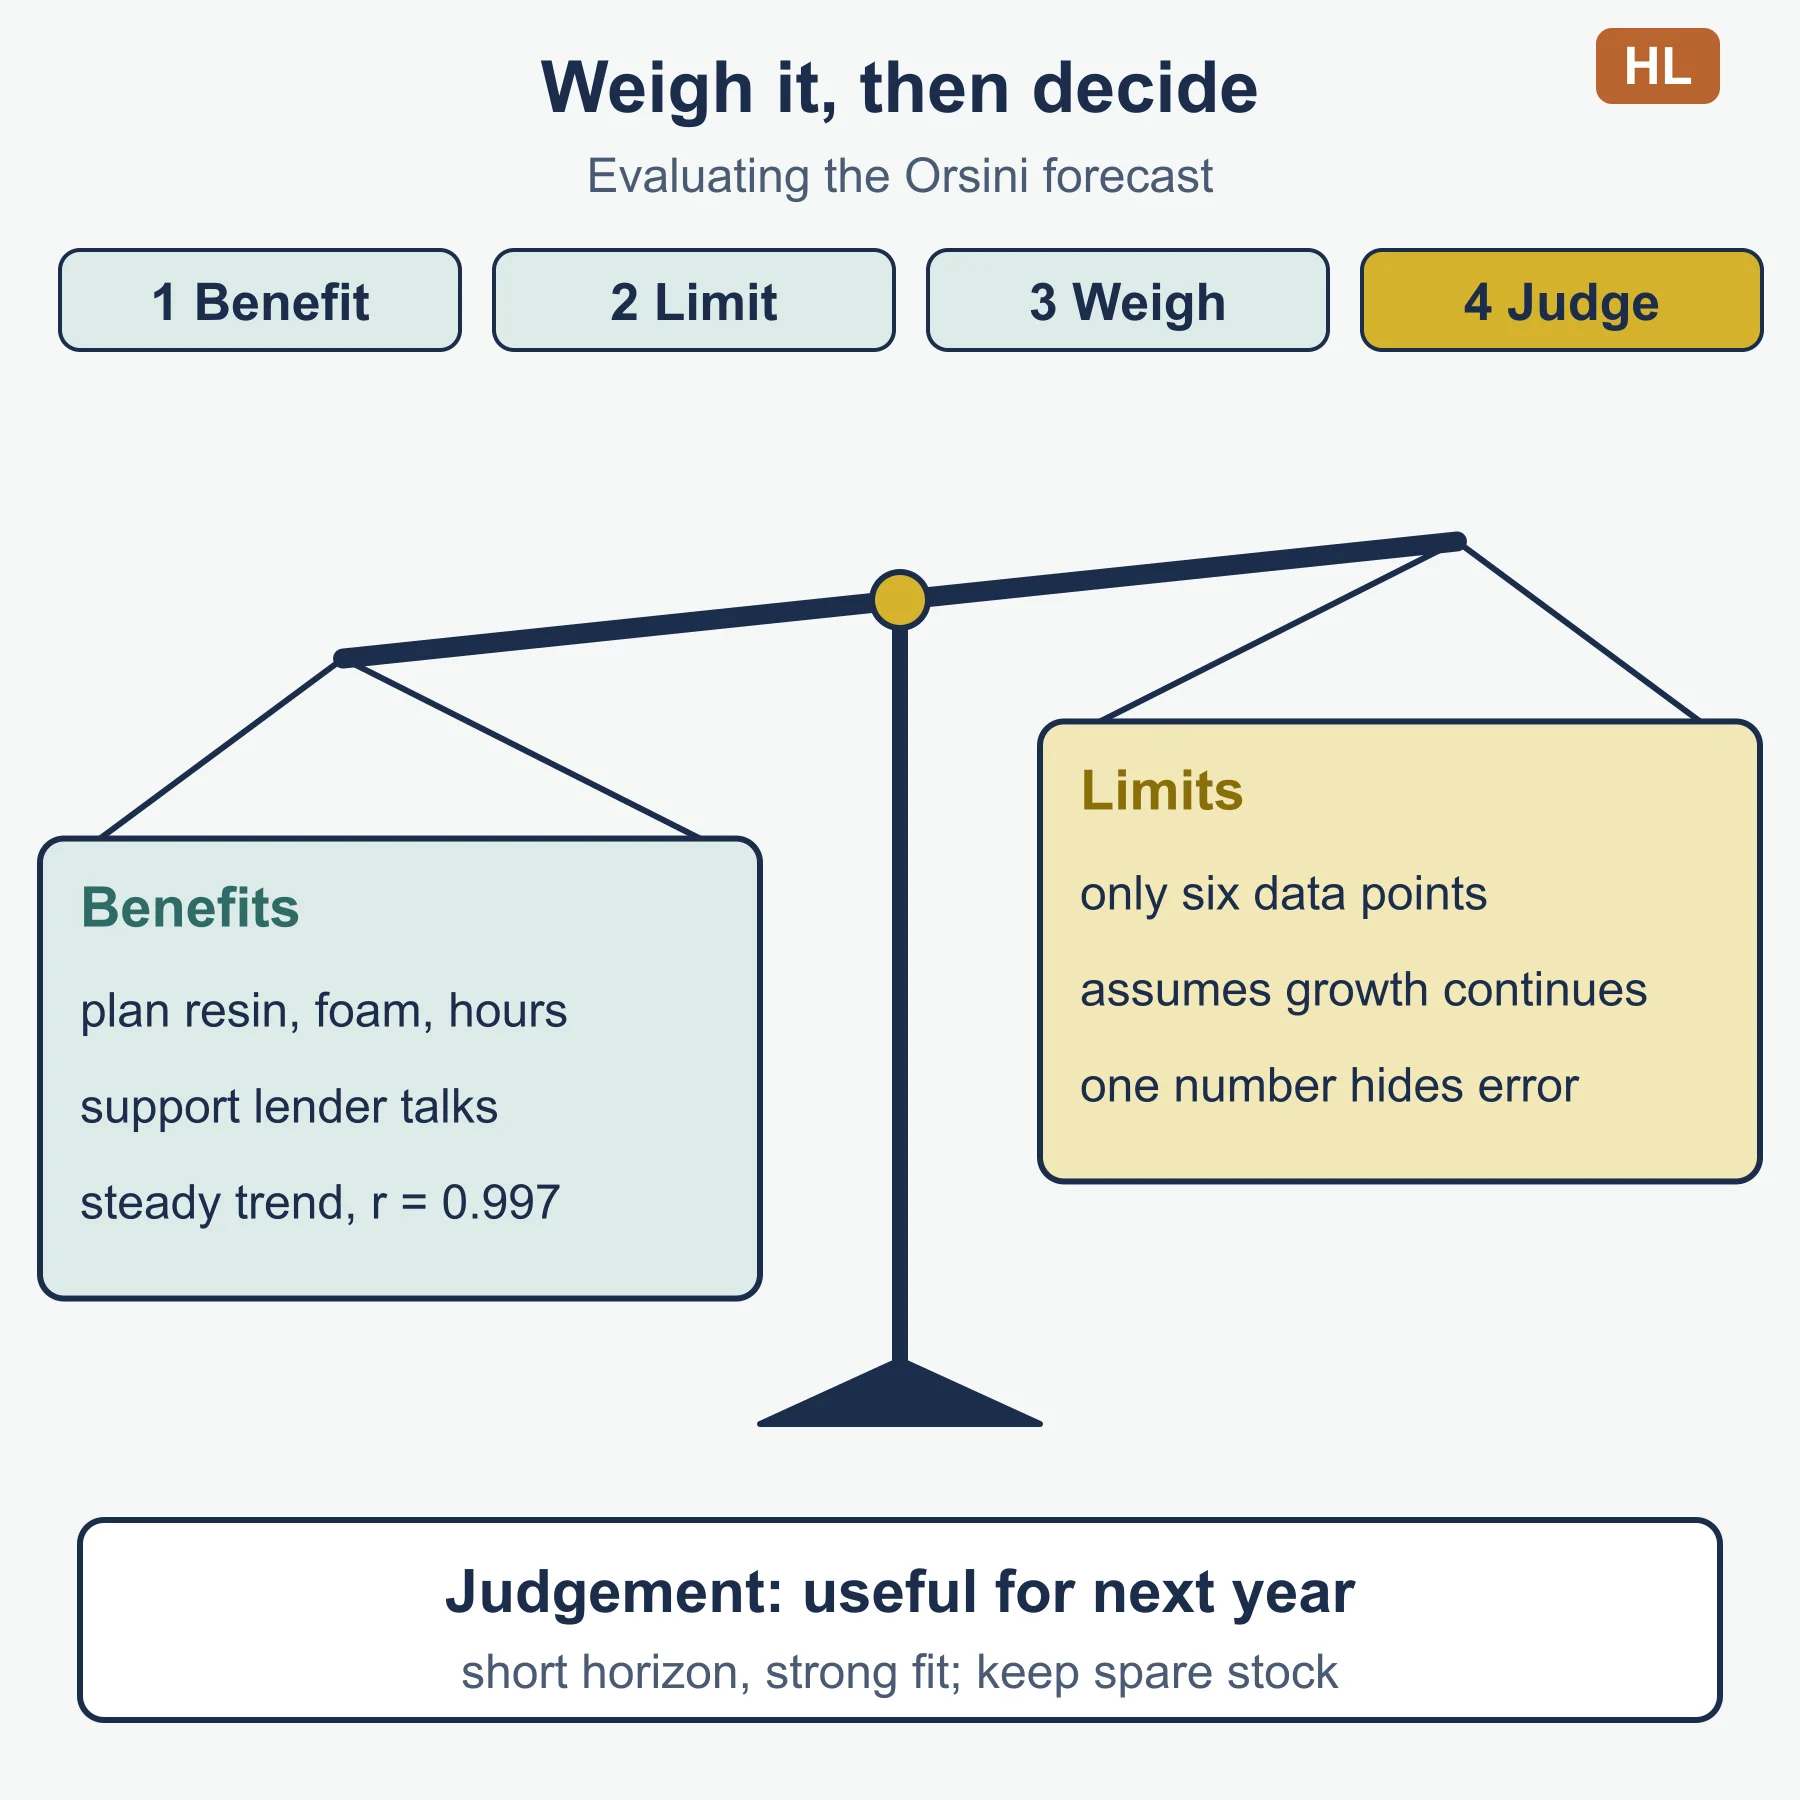
- Benefit and limitation. A benefit is what the forecast lets you do. A limitation is why it may mislead. An evaluation needs both and a judgement.
- Forecast and target. A forecast is a prediction. A target is a goal. Managers sometimes treat one as the other.
Factors that decide the weighing
| Factor | Forecast more useful when | Forecast less useful when |
|---|---|---|
| Market | Stable, mature demand | Fast-changing tastes or technology |
| Horizon | Next month or next year | Several years ahead |
| Cost of error | Stock can be stored or output changed quickly | Goods perish or commitments cannot be undone |
| Data | Many periods, high correlation | Few periods, correlation near zero |
| Flexibility | Spare capacity, short supplier lead times | Fixed capacity, long lead times |
Linking to other units
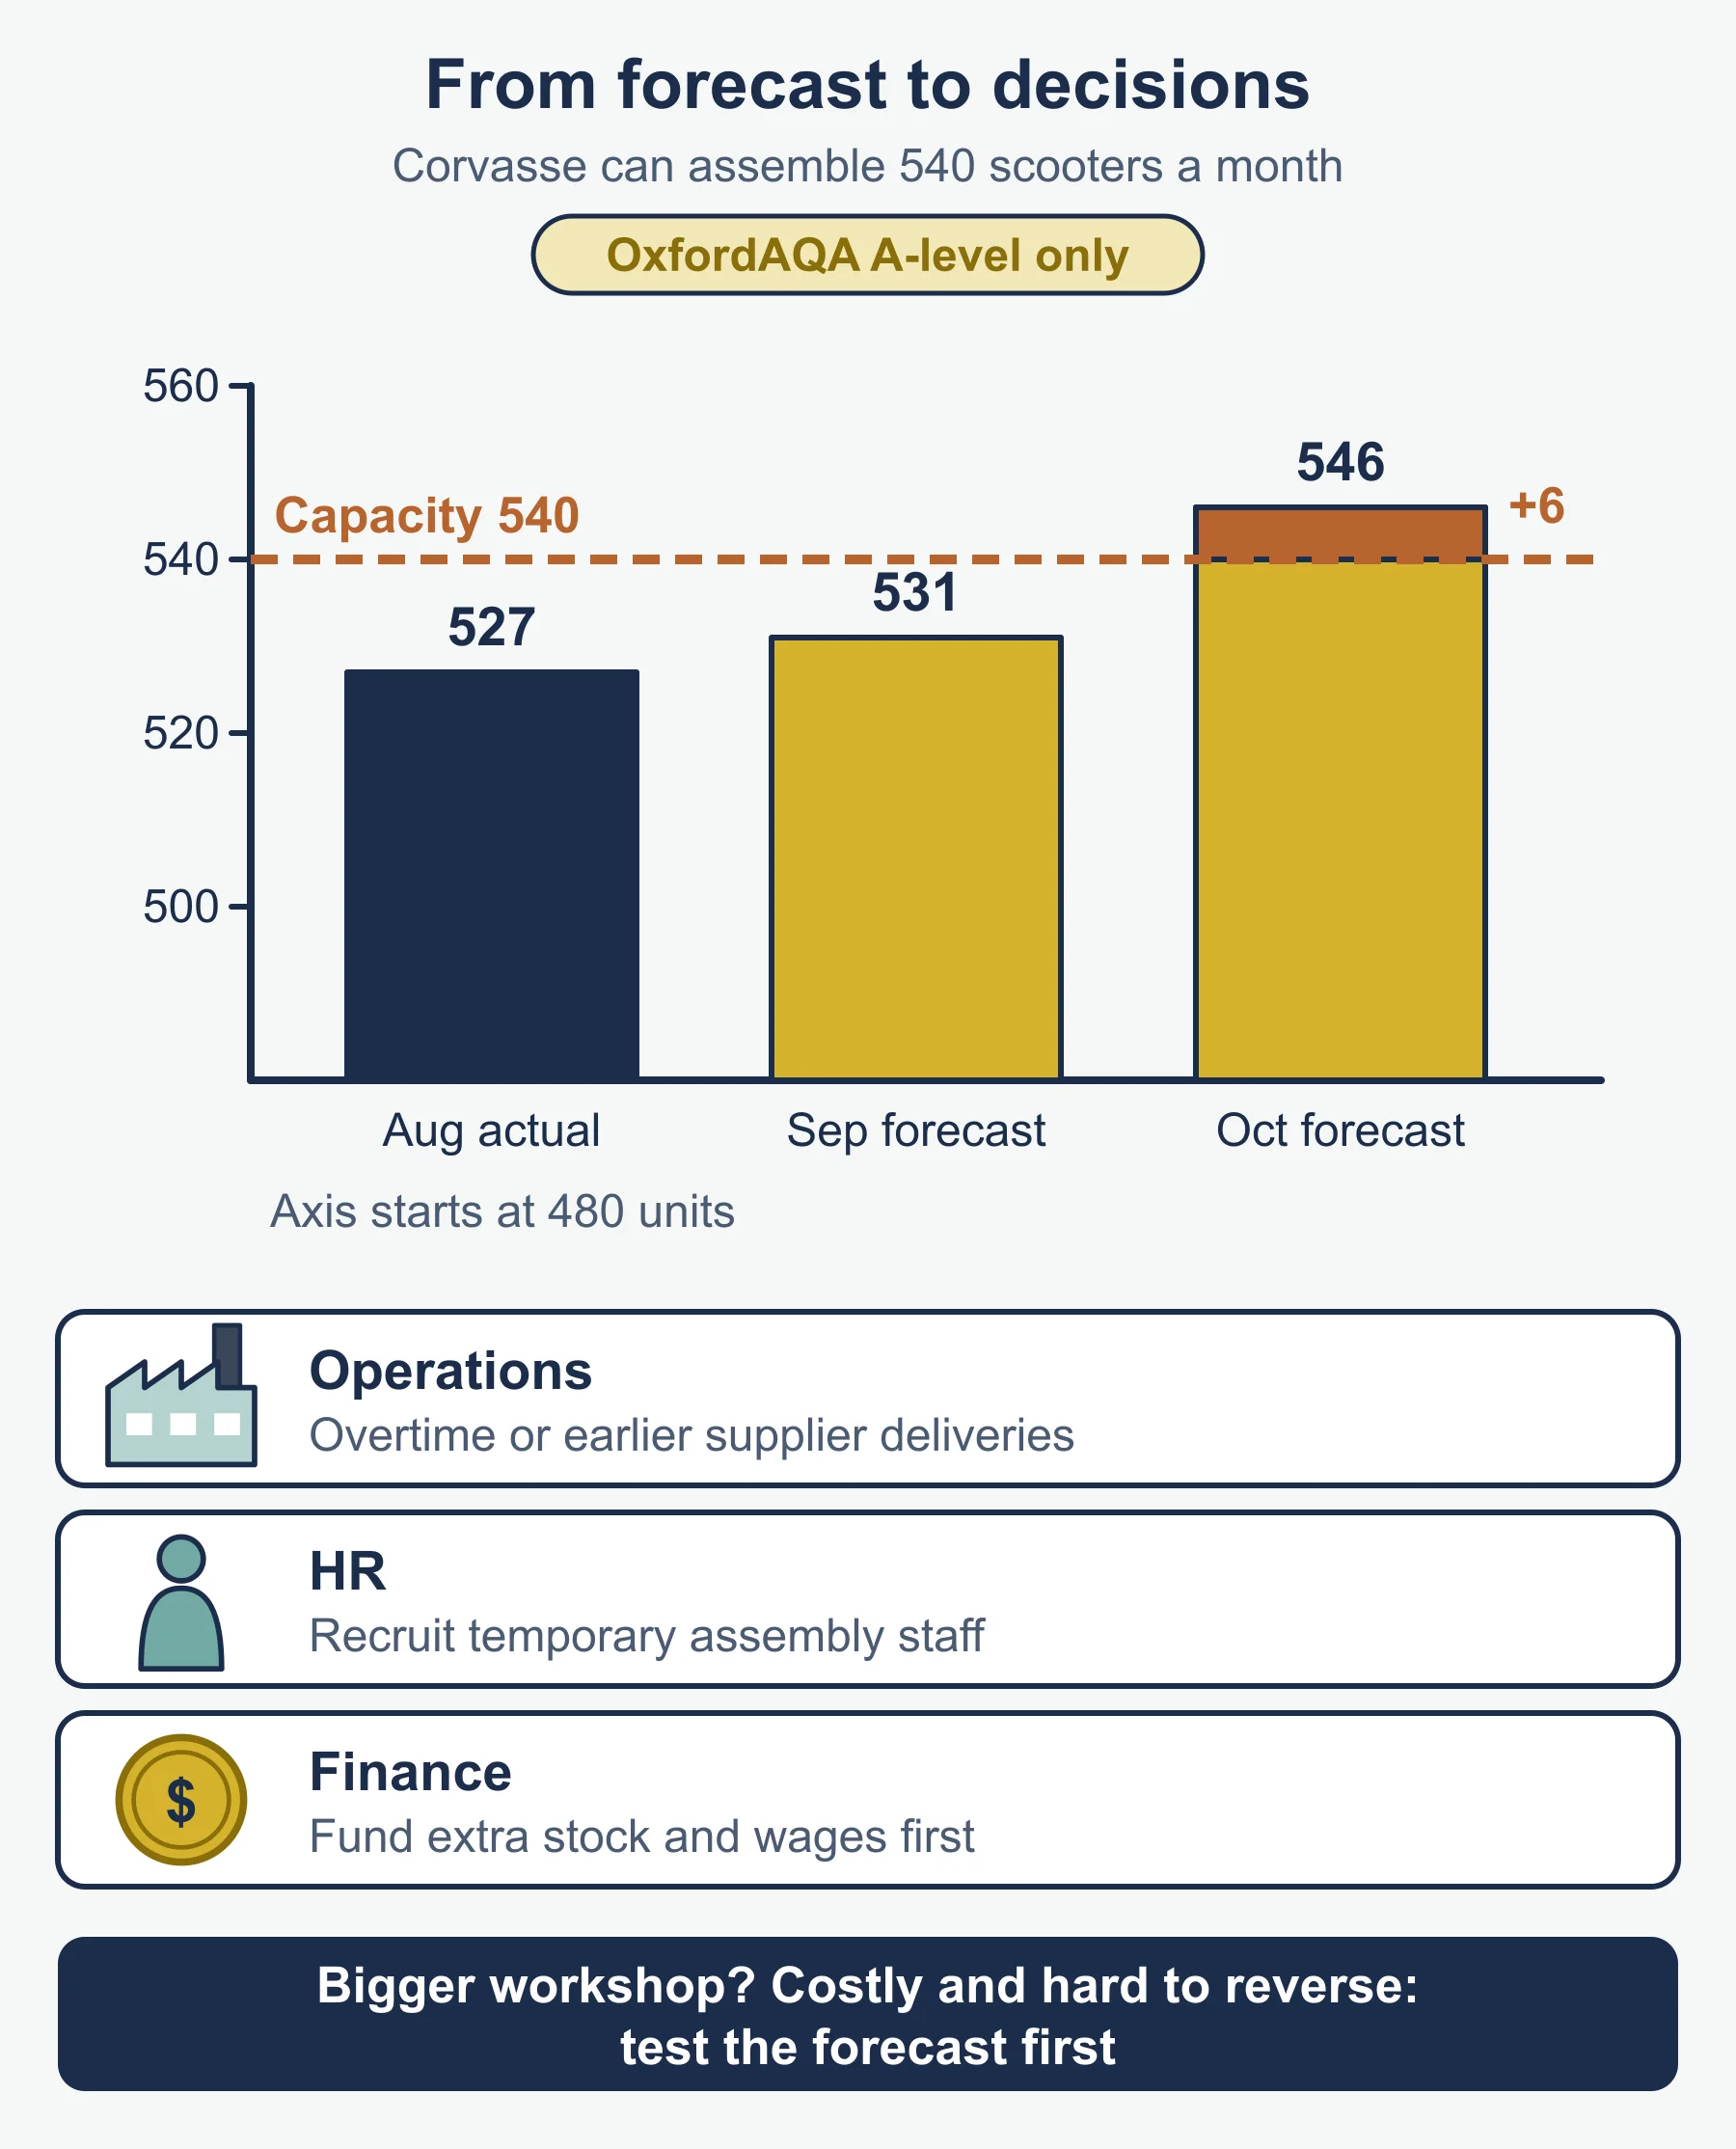
A forecast is an input to other plans, so an error spreads. Too high a forecast leads to surplus stock, tied-up cash and possible price cuts. Too low a forecast leads to stockouts, unmet orders and lost customers. When a case study gives a forecast, test it against capacity, cash and staffing before you praise it.
Percentage check
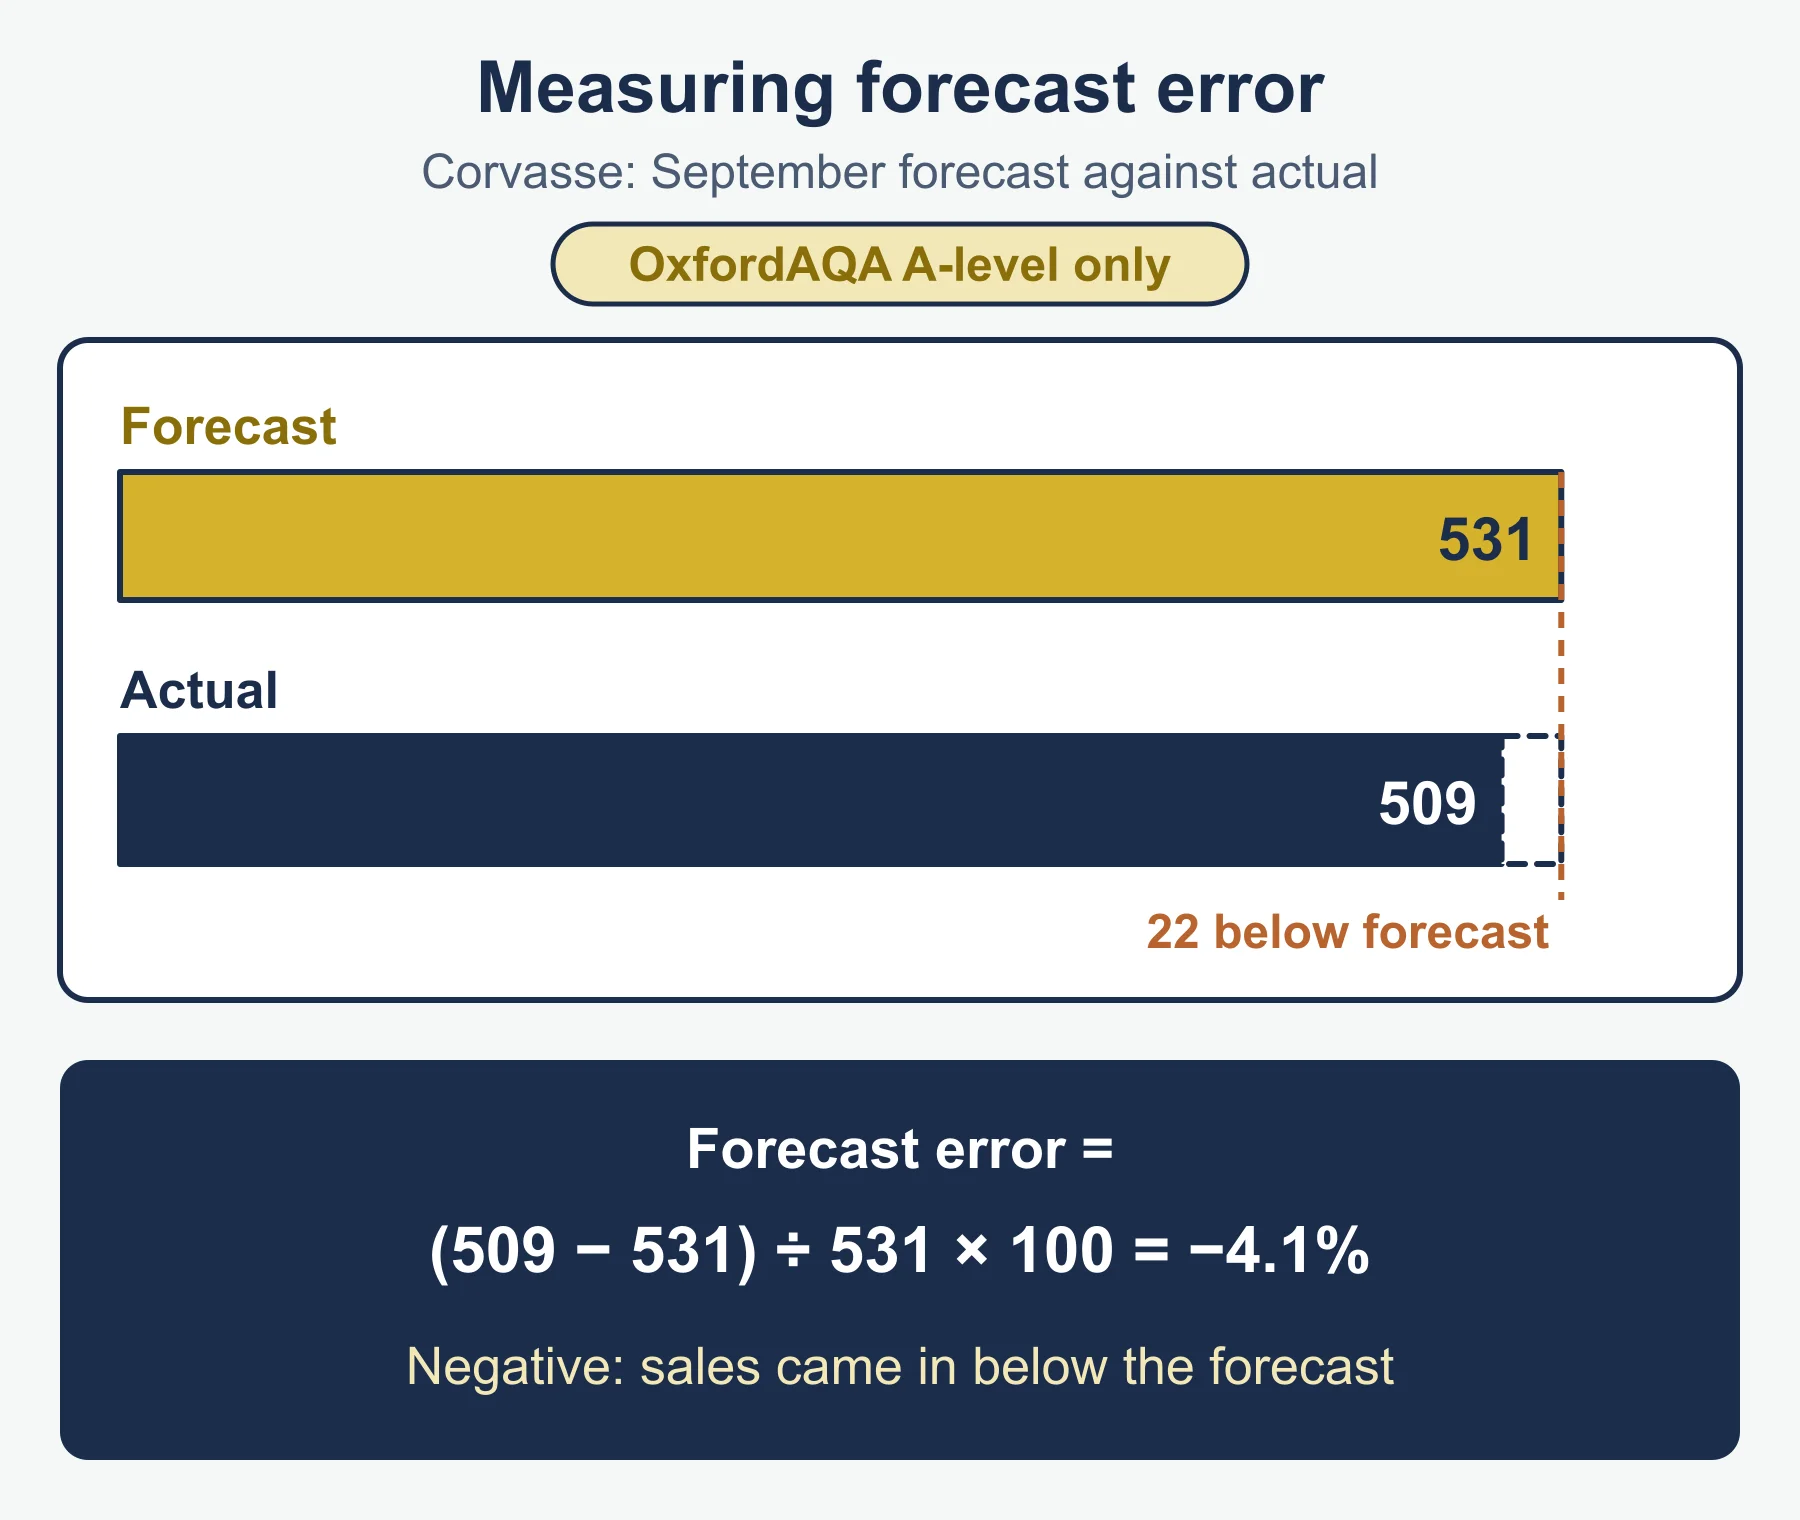
Forecast error is often expressed against the actual figure: (forecast − actual) / actual × 100. If a forecast is 500 and actual is 460, the forecast was 8.7% above actual sales. State which base you used.
How to write an evaluation (AO3)
- Benefit tied to the business and a decision it supports.
- Limitation tied to a feature of the case.
- Weigh using market stability, time horizon, cost of error, data quality and flexibility.
- Judgement with a reason, such as “useful for next year, less so for five years, because…”.
Quick self-test
- Define a sales forecast.
- State two benefits of sales forecasting.
- State two limitations of sales forecasting.
- Ulverne’s line is y = 109.5 + 11.1x. Forecast sales for year 6.
- For Ulverne, r = 0.994. What does this suggest?
- Use the same line to forecast year 20. Should the owner rely on it?
- Distinguish between interpolation and extrapolation.
- A bakery forecast 500 loaves and sold 460. By what percentage did the forecast exceed actual sales? Give the answer to 1 decimal place.
- What does the command term “evaluate” ask you to do?
- Explain how a sales forecast links to a cash flow forecast.
- Give the standard formula for the gradient b.
Answers
- A prediction of the sales (units, revenue or both) a business expects over a future period.
- Any two, such as: better production and stock planning; support for the cash flow forecast and borrowing; guides recruitment; helps set marketing budgets; provides targets to check against.
- Any two, such as: relies on past data; external changes such as competitors or tastes; unexpected events; less reliable further ahead; thin data; bias.
- 109.5 + 11.1 × 6 = 176.1, so about 176 bikes.
- A very strong positive correlation. Sales have risen steadily and the points fit the line closely, which supports a short-range forecast.
- 109.5 + 11.1 × 20 = 331.5, so about 332 bikes. This is far beyond the five years of data, so the owner should not rely on it. The market, competitors or tastes could change.
- Interpolation reads a value from inside the range of the data. Extrapolation extends the line beyond the data and carries more risk.
- (500 − 460) / 460 × 100 = 8.7%.
- Make an appraisal by weighing up strengths and limitations, and reach a reasoned judgement.
- Expected sales revenue shapes expected cash inflows, and expected volumes shape purchases and wages, which are cash outflows. A wrong sales forecast therefore makes the cash flow forecast wrong too.
- b = Sxy / Sxx, where Sxy is the sum of (x − x̄)(y − ȳ) and Sxx is the sum of (x − x̄)².
Where marks are usually lost
- Listing benefits and limitations in general terms without linking them to the business in the case.
- Stopping at “it might be wrong” instead of saying what in the case could make it wrong.
- Calling a forecast certain, or calling it useless, with no balance.
- Treating a high correlation as proof of future accuracy.
- Extrapolating a long way from the data and quoting the answer with no warning.
- Mixing up the sales forecast and the cash flow forecast.
- Leaving out the judgement in an “evaluate” or “justify” question.
- Slips in the regression arithmetic, such as using the wrong mean or mixing up the sign of b. Show each step so the working can be followed.
Next steps
Try the practice questions, return to the study guide for any gaps, and tick off the topic on the checklist.
Frequently asked questions
What is the difference between interpolation and extrapolation? Interpolation reads a value from inside the range of the data. Extrapolation extends the line beyond the data to predict a future value, which becomes less reliable the further it goes.
How do you calculate forecast error as a percentage? Forecast error is often expressed against the actual figure: (forecast − actual) ÷ actual × 100. For example, forecasting 500 loaves and selling 460 gives an error of 8.7%.
What is the difference between a sales forecast and a cash flow forecast? A sales forecast predicts sales, in units or revenue. A cash flow forecast predicts money coming in and going out; the sales forecast feeds into it through expected receipts.
How do you find the gradient of a line of best fit? In standard form, the gradient b = Sxy ÷ Sxx, where Sxy is the sum of (x − x̄)(y − ȳ) and Sxx is the sum of (x − x̄)². The intercept is a = ȳ − b·x̄.
Official syllabus
IB Diploma Programme Business management guide, first assessment 2024, published by the International Baccalaureate Organization. Sections used: 4.3 Sales forecasting (HL only), and the business management tools listing for simple linear regression (HL only).
Get free revision emails (optional)
Occasional emails with practice questions, worked explanations and links to free resources for the qualification and subjects you choose. No spam, and you can unsubscribe from any email. The free tools on this site never need an email.
Related resources
-
Study guides
IB DP Business Management: The seven Ps of the marketing mix
Study guide to section 4.5 of IB DP Business Management: product, price, promotion, place, people, processes, physical evidence and marketing mixes.
Business · International Baccalaureate · IB
Read guide -
Practice questions
IB DP Business Management: The seven Ps of the marketing mix – Practice Questions
Original practice questions with worked answers on section 4.5 of IB DP Business Management: pricing, promotion, branding, service Ps and mixes.
Business · International Baccalaureate · IB
Try questions -
Revision notes
IB DP Business Management: The seven Ps of the marketing mix – Revision Notes
Condensed revision notes for IB DP Business Management section 4.5: the seven Ps, pricing methods, promotion types, PLC links and a short self-test.
Business · International Baccalaureate · IB
Revise topic
Related articles
-
teaching
A Level tuition in Dubai: Cambridge or Pearson Edexcel International A Level?
Schools in Dubai and Abu Dhabi teach either Cambridge International AS & A Level or Pearson Edexcel International A Level. How the two are structured, why it matters for tuition, and how online classes from Lahore work.
9 October 2026
-
curriculum guides
Choosing subjects at IGCSE and A Level
How subject choices at 14 and 16 affect university options later, and how to keep pathways open without overloading a timetable.
28 July 2026
Studying this with a teacher
Working through Business IB?
This page is free and stays free. If you would rather be taught it, Marlbridge runs Business classes one-to-one, online in your own time zone. The first trial class is free. WhatsApp replies within an hour (8am–11pm Pakistan time, every day); email the same day.
IB Business teachers at Marlbridge

