
Revision Notes
IB DP Business Management: The seven Ps of the marketing mix – Revision Notes
Condensed revision notes for IB DP Business Management section 4.5: the seven Ps, pricing methods, promotion types, PLC links and a short self-test.
- Subject
- Business
- Level
- IB
- Topic
- Unit 4: Marketing
- Author
- Marlbridge Academic Team
- Updated
- Reviewed by
- Salman Ahmad (what this means)
Aligned to International Baccalaureate IB Diploma Programme Business (DP Business Management), First assessment 2024. Official specification .
Syllabus page (what it covers and how it is assessed): IB Diploma Programme Business.
Syllabus points this page covers
DP Business Management
- 4.5 The seven Ps of the marketing mix
Found an error? Report a correction.
Need help with this topic? Request a free trial class for IB Diploma Programme Business (DP Business Management).
These notes condense section 4.5, The seven Ps of the marketing mix, from the IB Business management guide, first assessment 2024, for SL and HL. Full explanations and worked examples are in the study guide. Test yourself with the practice questions, and see the wider unit in the Unit 4 revision notes. Course hub: IB DP Business Management. Checklist: syllabus checklist. Not sure where to start? Try the free diagnostics.
HL only items are labelled: dynamic pricing, competitive pricing, contribution pricing and price elasticity of demand. Everything else applies to SL and HL.
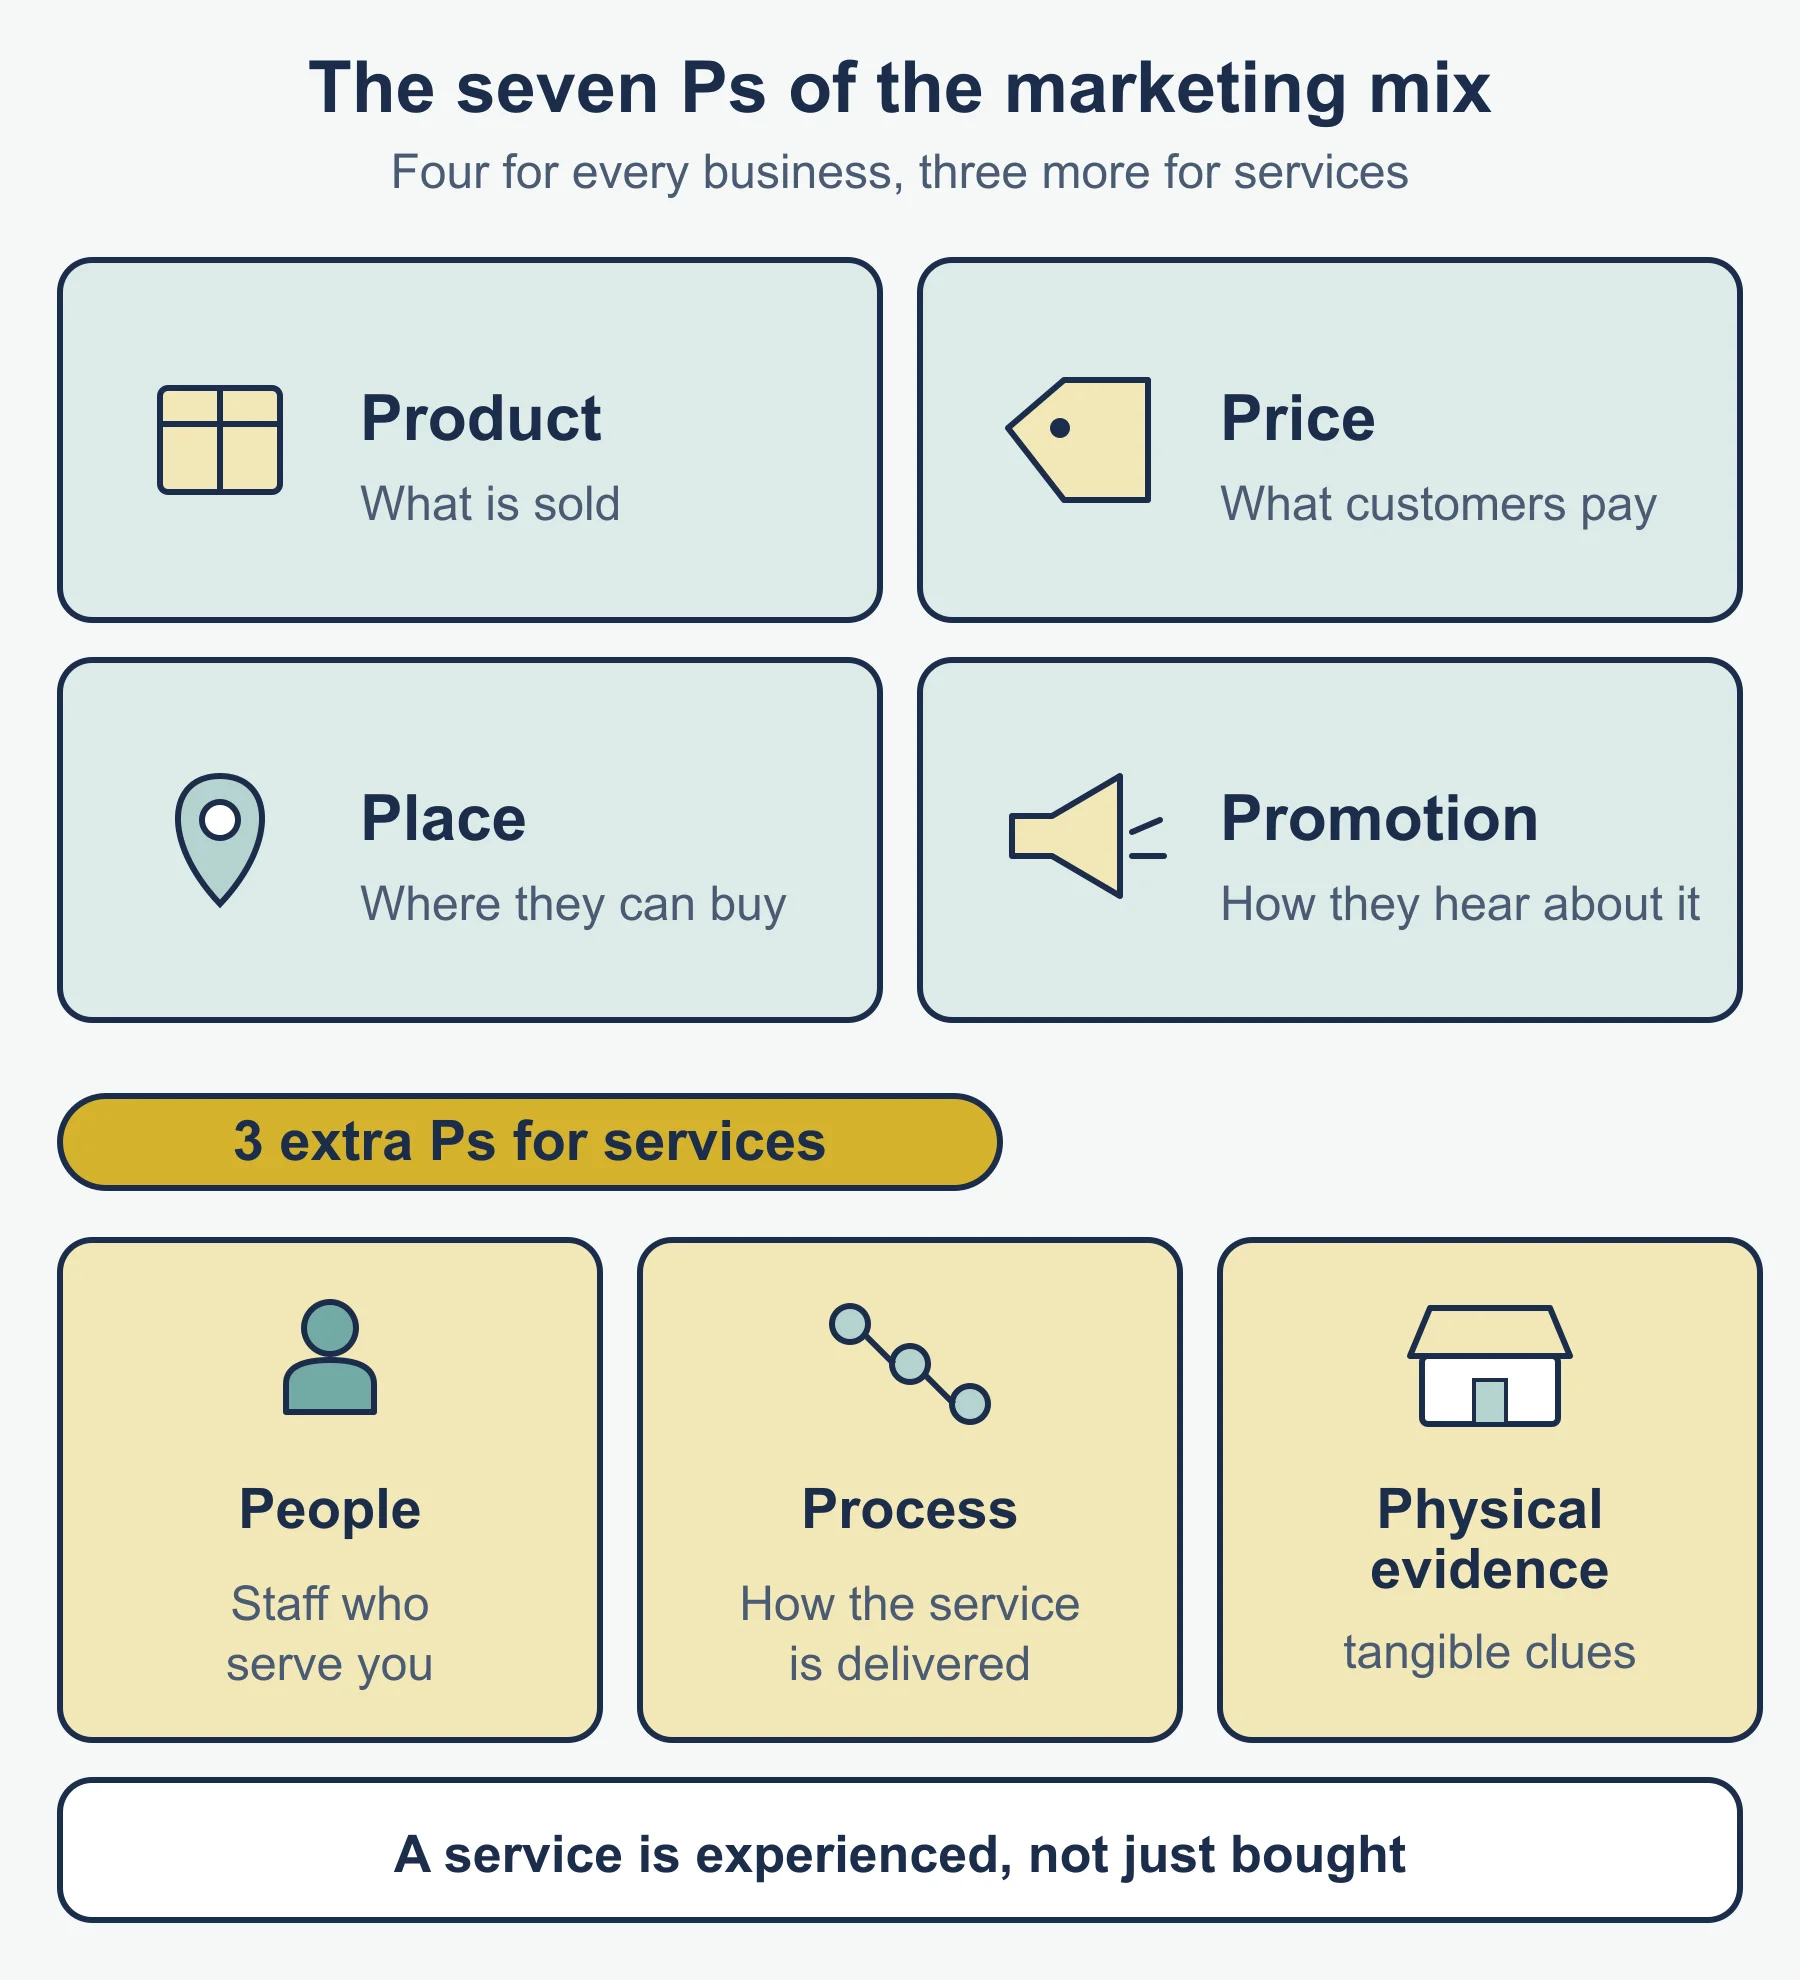
The seven Ps at a glance
| P | Core idea | Typical judgement |
|---|---|---|
| Product | What is sold: features, quality, brand, stage in the life cycle | Is the product, or its extension, right for the market? |
| Price | What the customer pays and how it is set | Which method fits the objective and the market? |
| Promotion | How the business communicates | Is the mix of media worth its cost? |
| Place | How the product reaches the customer | Which channel balances reach, margin and control? |
| People | Staff and their contact with customers | Do relationships create loyalty? |
| Processes | How the service is delivered | Is delivery reliable and efficient? |
| Physical evidence | Tangible cues that signal quality | Does the setting match the promise? |
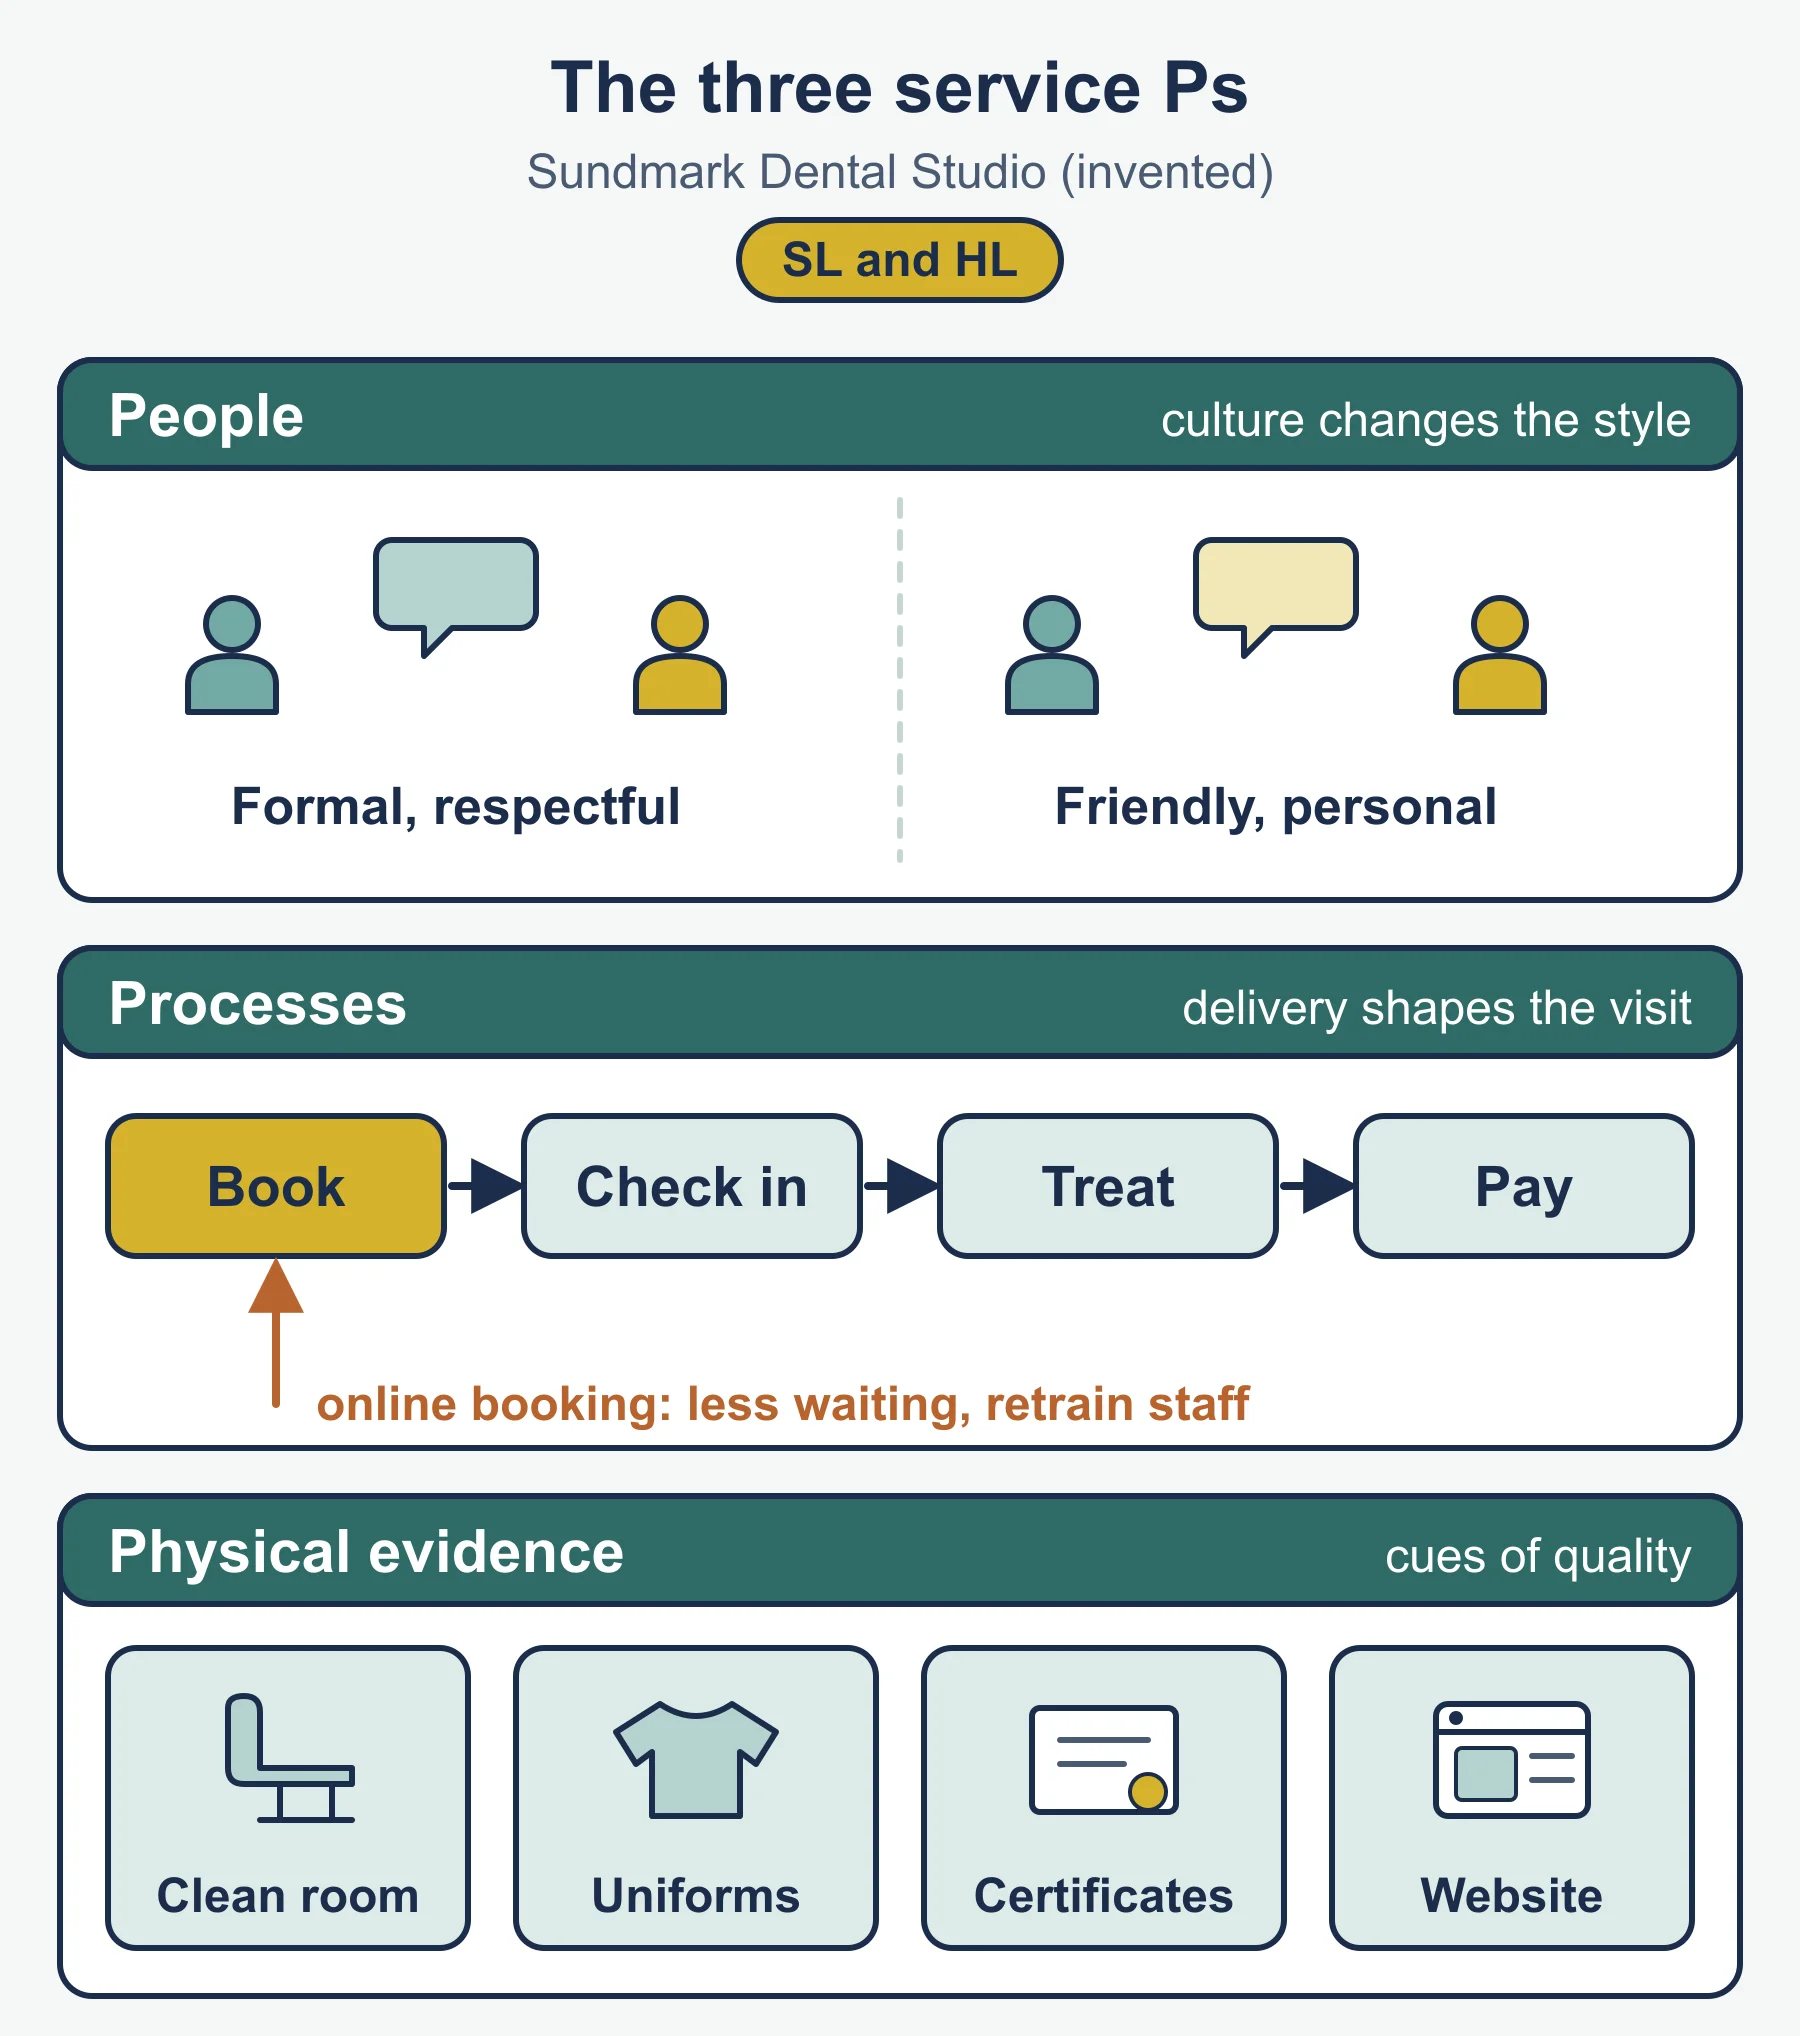
The guide frames people, processes and physical evidence in the context of marketing a service. Evaluate them for a named service business.
Product
Life cycle, portfolio and the mix
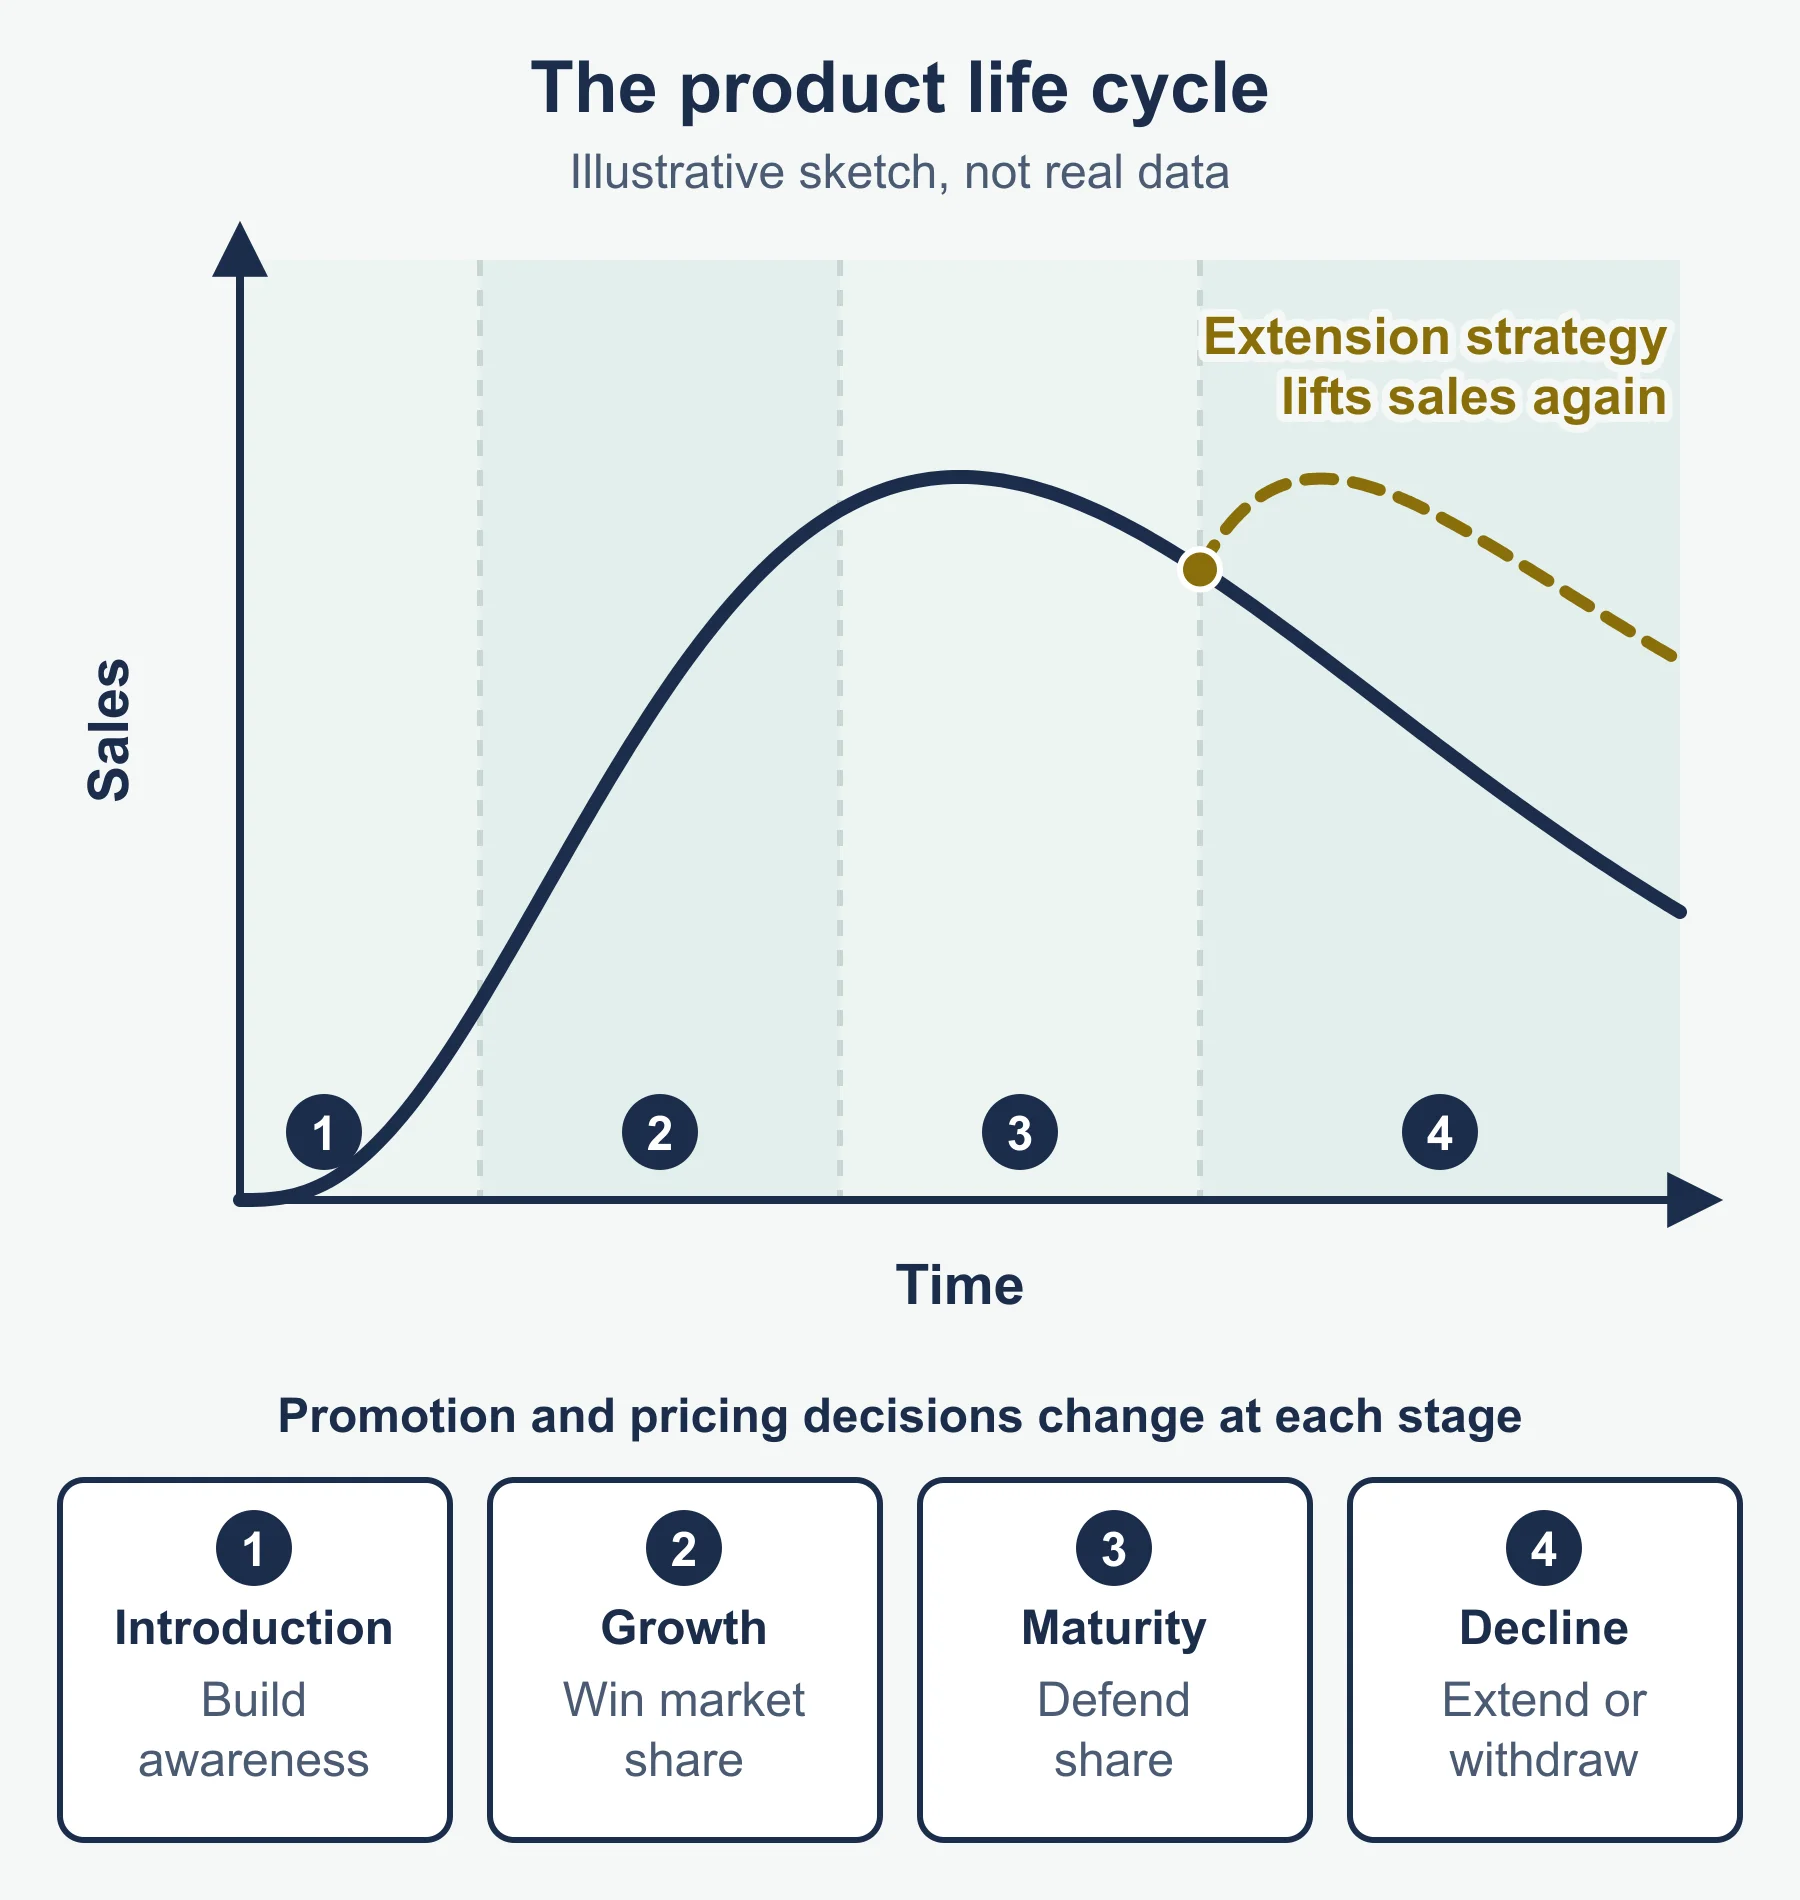
- Stages (standard form): introduction, growth, maturity, decline.
- A product portfolio is the range of products a business sells. A balanced portfolio has products at different stages.
- The Boston Consulting Group (BCG) matrix is one model for judging a portfolio.
- The mix changes with the stage: awareness and often a low or high launch price early; differentiation and price competition in maturity; little spending in decline.
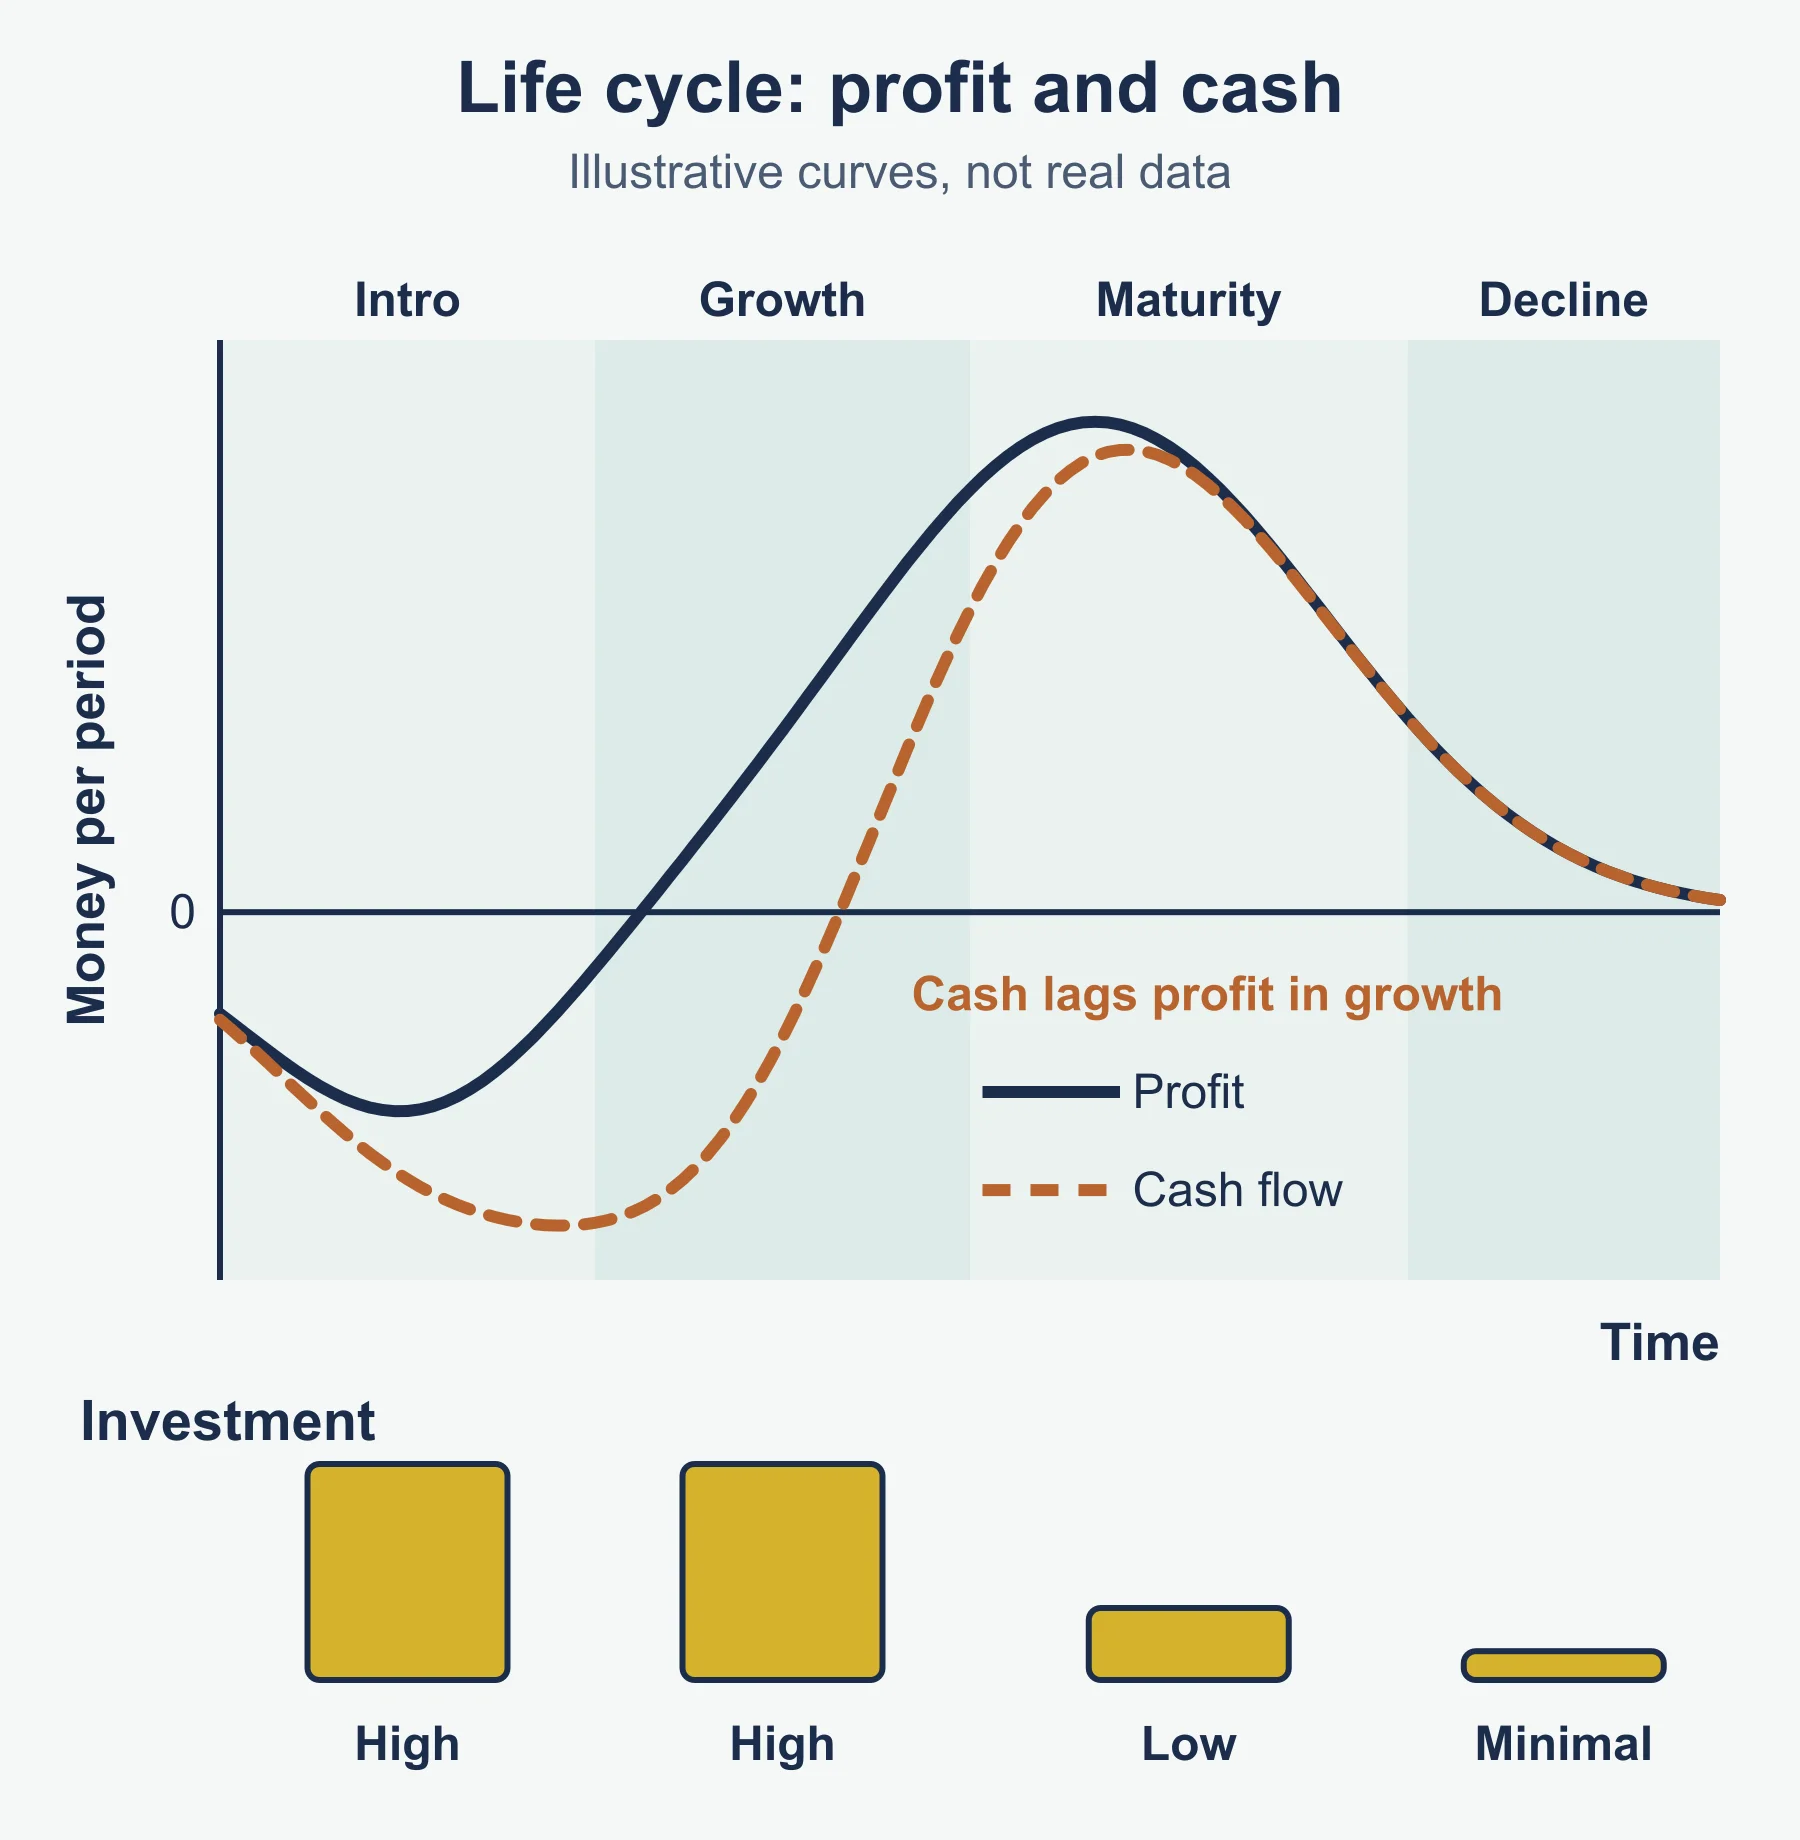
Life cycle, investment, profit and cash flow
| Stage | Investment | Profit | Cash flow |
|---|---|---|---|
| Introduction | High | Loss likely | Negative |
| Growth | High | Rising | Often negative to improving |
| Maturity | Low | Highest | Strongly positive |
| Decline | Minimal | Falling | Positive, shrinking |
Link: cash from mature products pays for launches elsewhere in the portfolio.
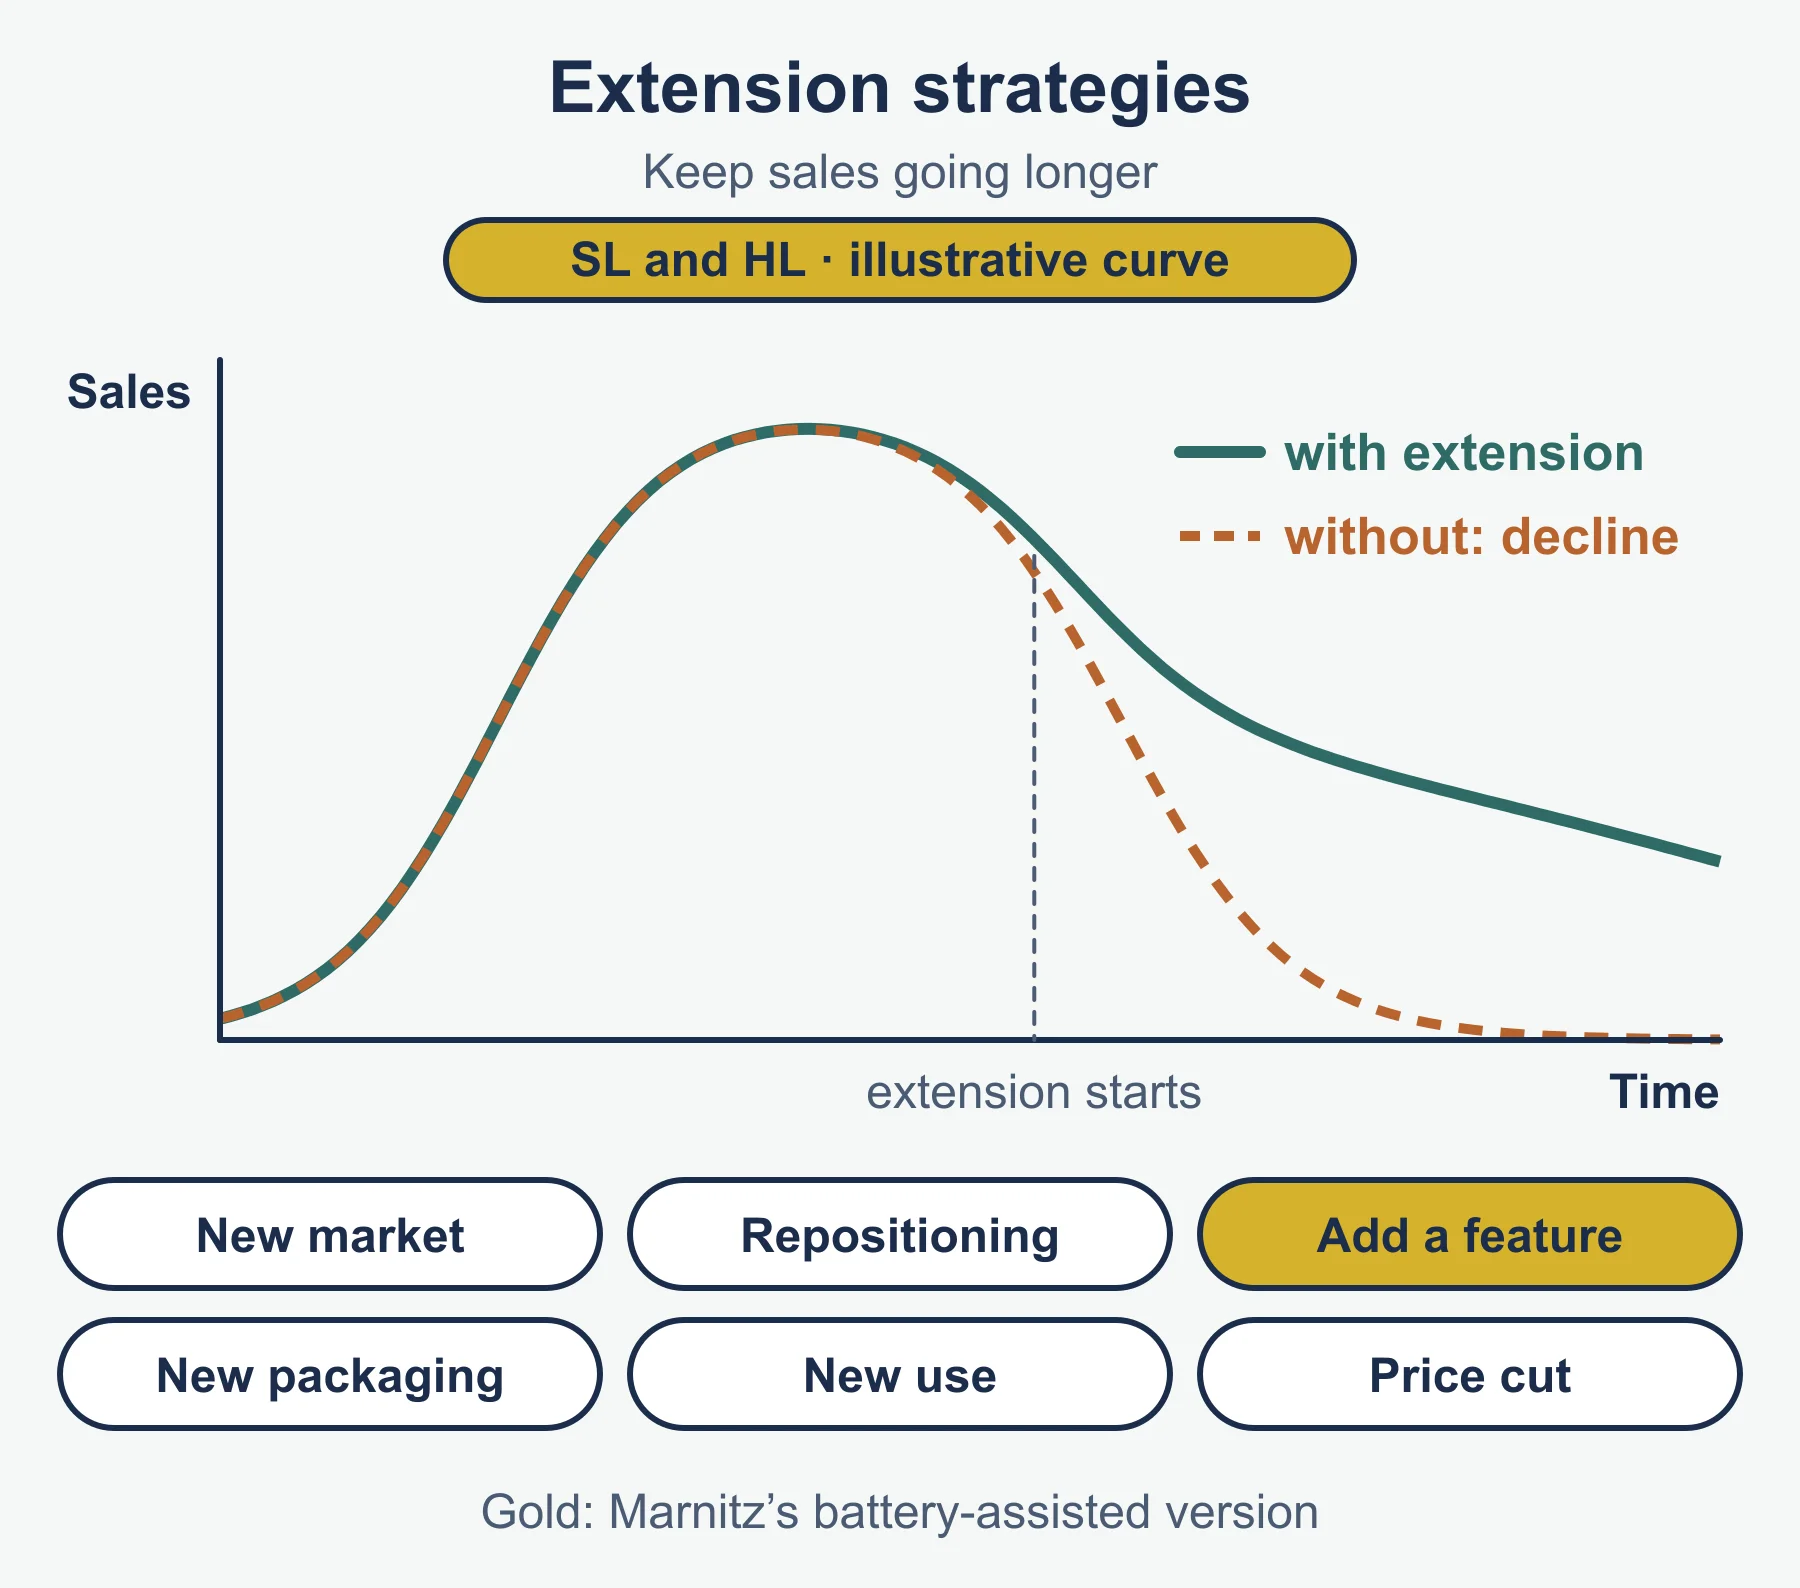
Extension strategies
Actions that delay decline: new markets, repositioning, new features or variants, new packaging, new uses, price changes. Evaluate on cost, risk to the brand, fit with the product and how long the effect lasts.
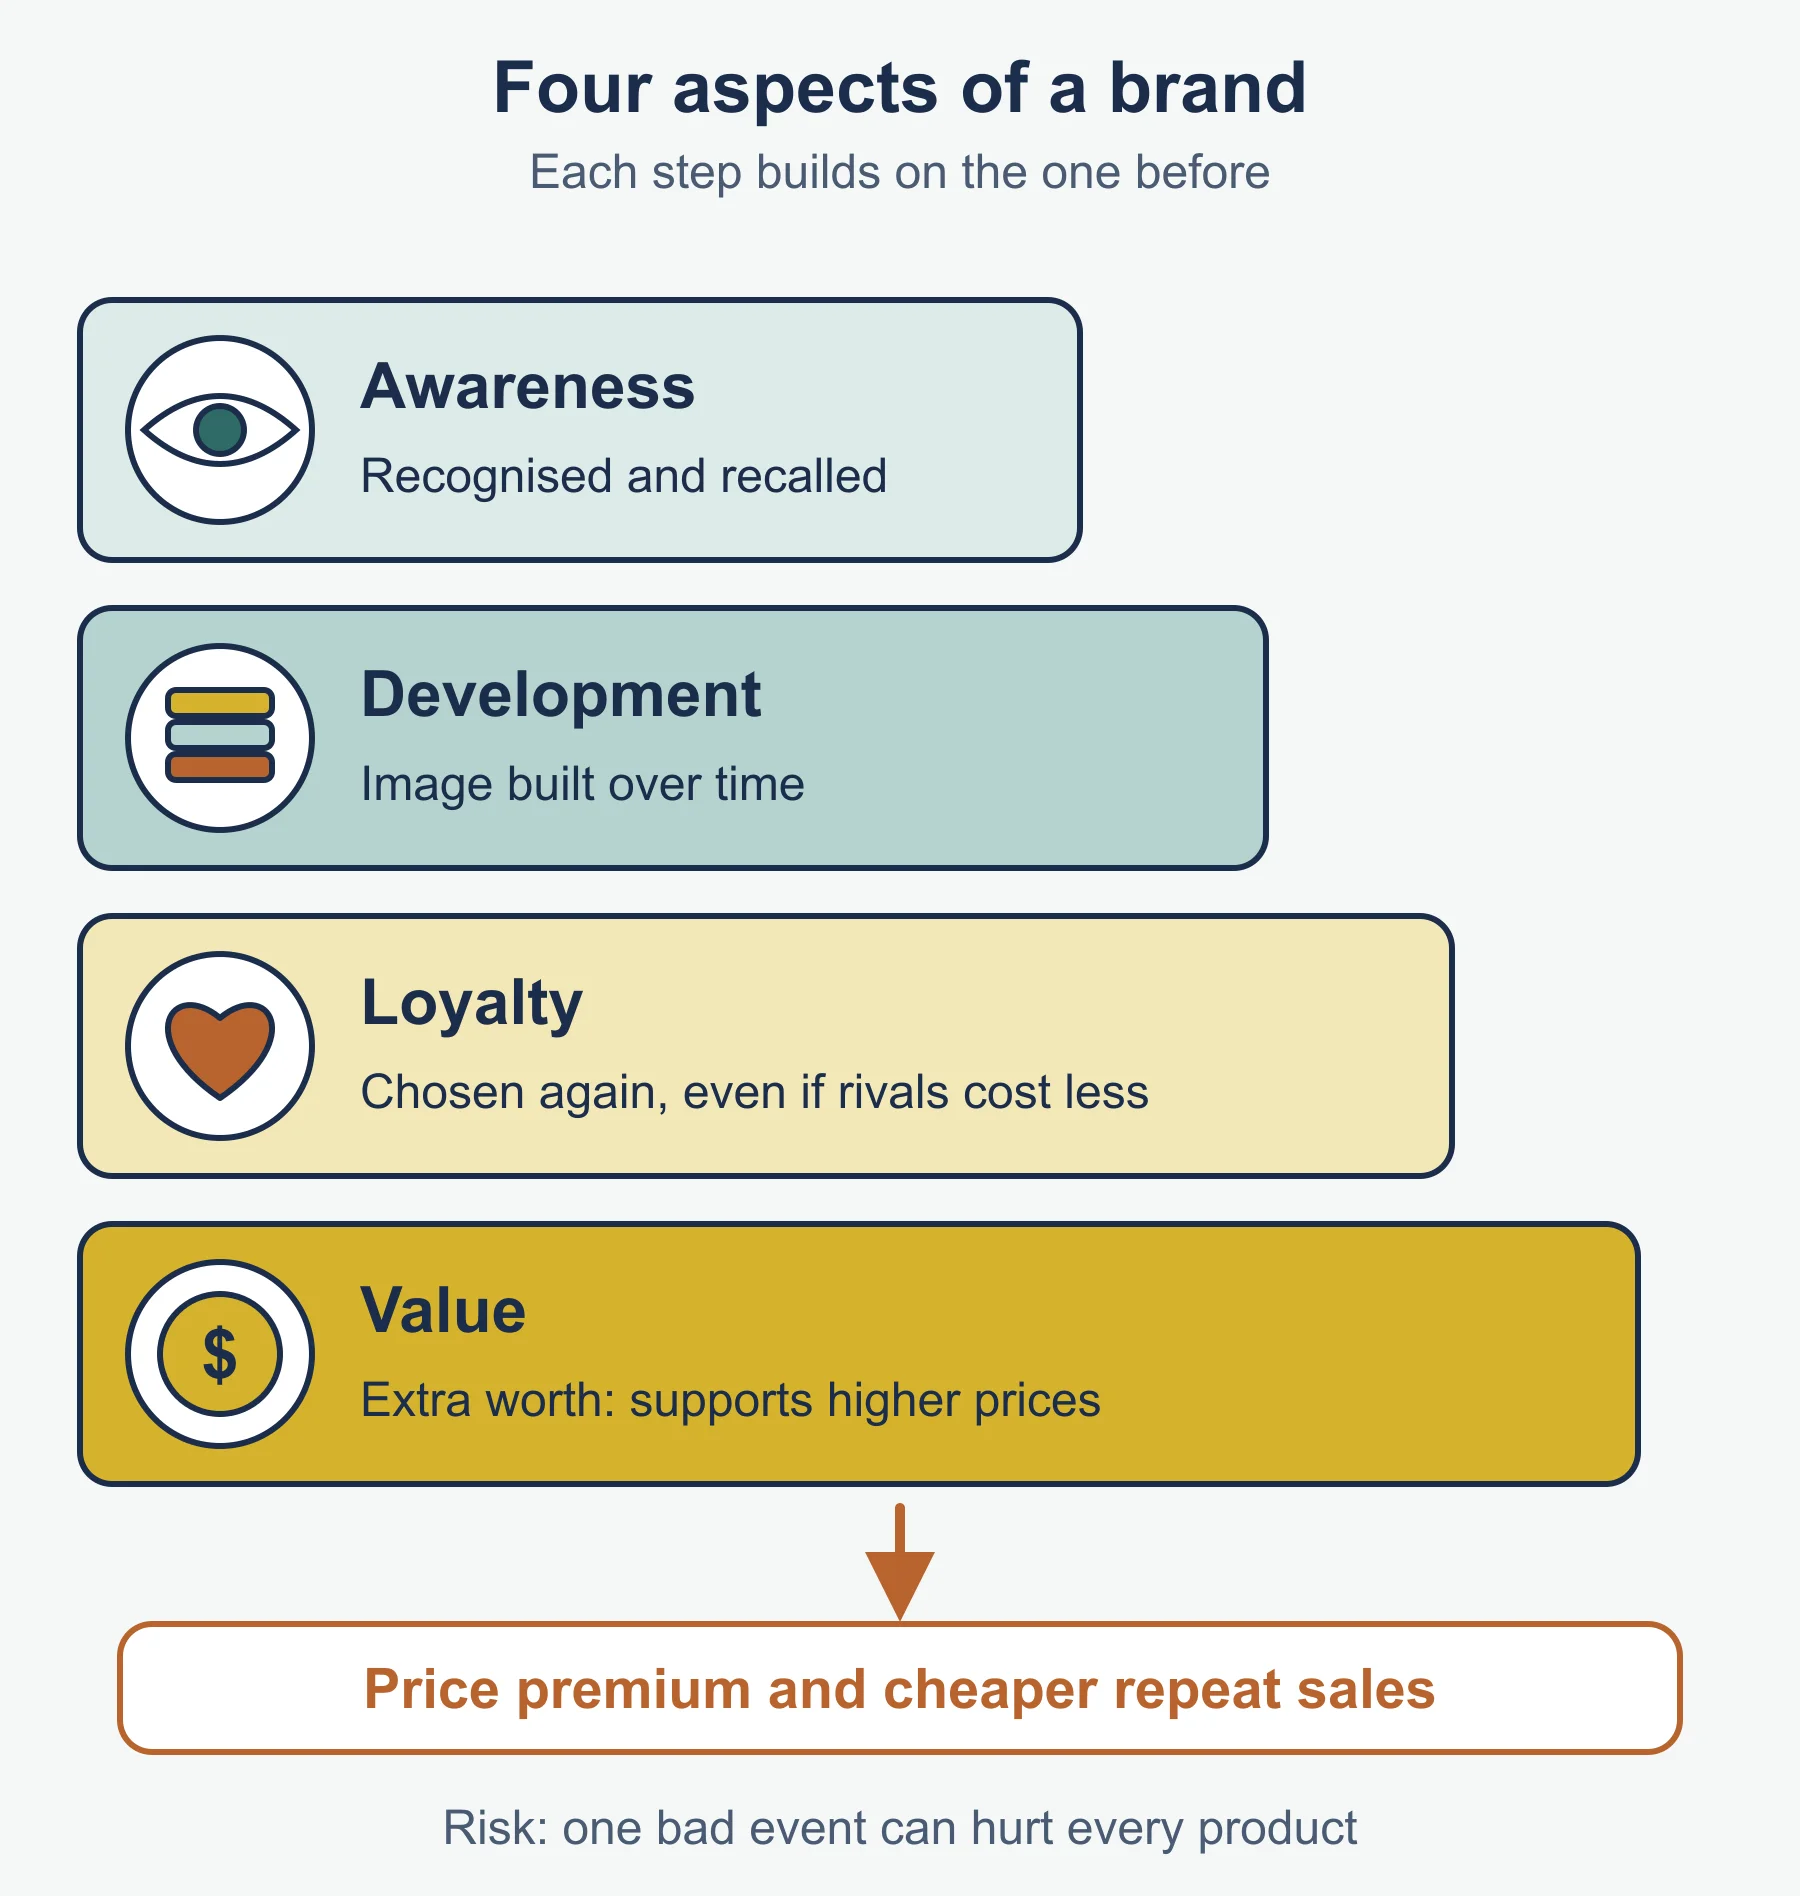
Branding
| Aspect | Meaning in one line |
|---|---|
| Awareness | Customers recognize and recall the brand |
| Development | Image built over time by consistent quality and messaging |
| Loyalty | Repeat purchase despite alternatives |
| Value | Extra worth that supports price and sale value |
Importance: differentiation, price premium, cheaper repeat sales, easier new launches. Risk: one failure harms the whole brand.
Price
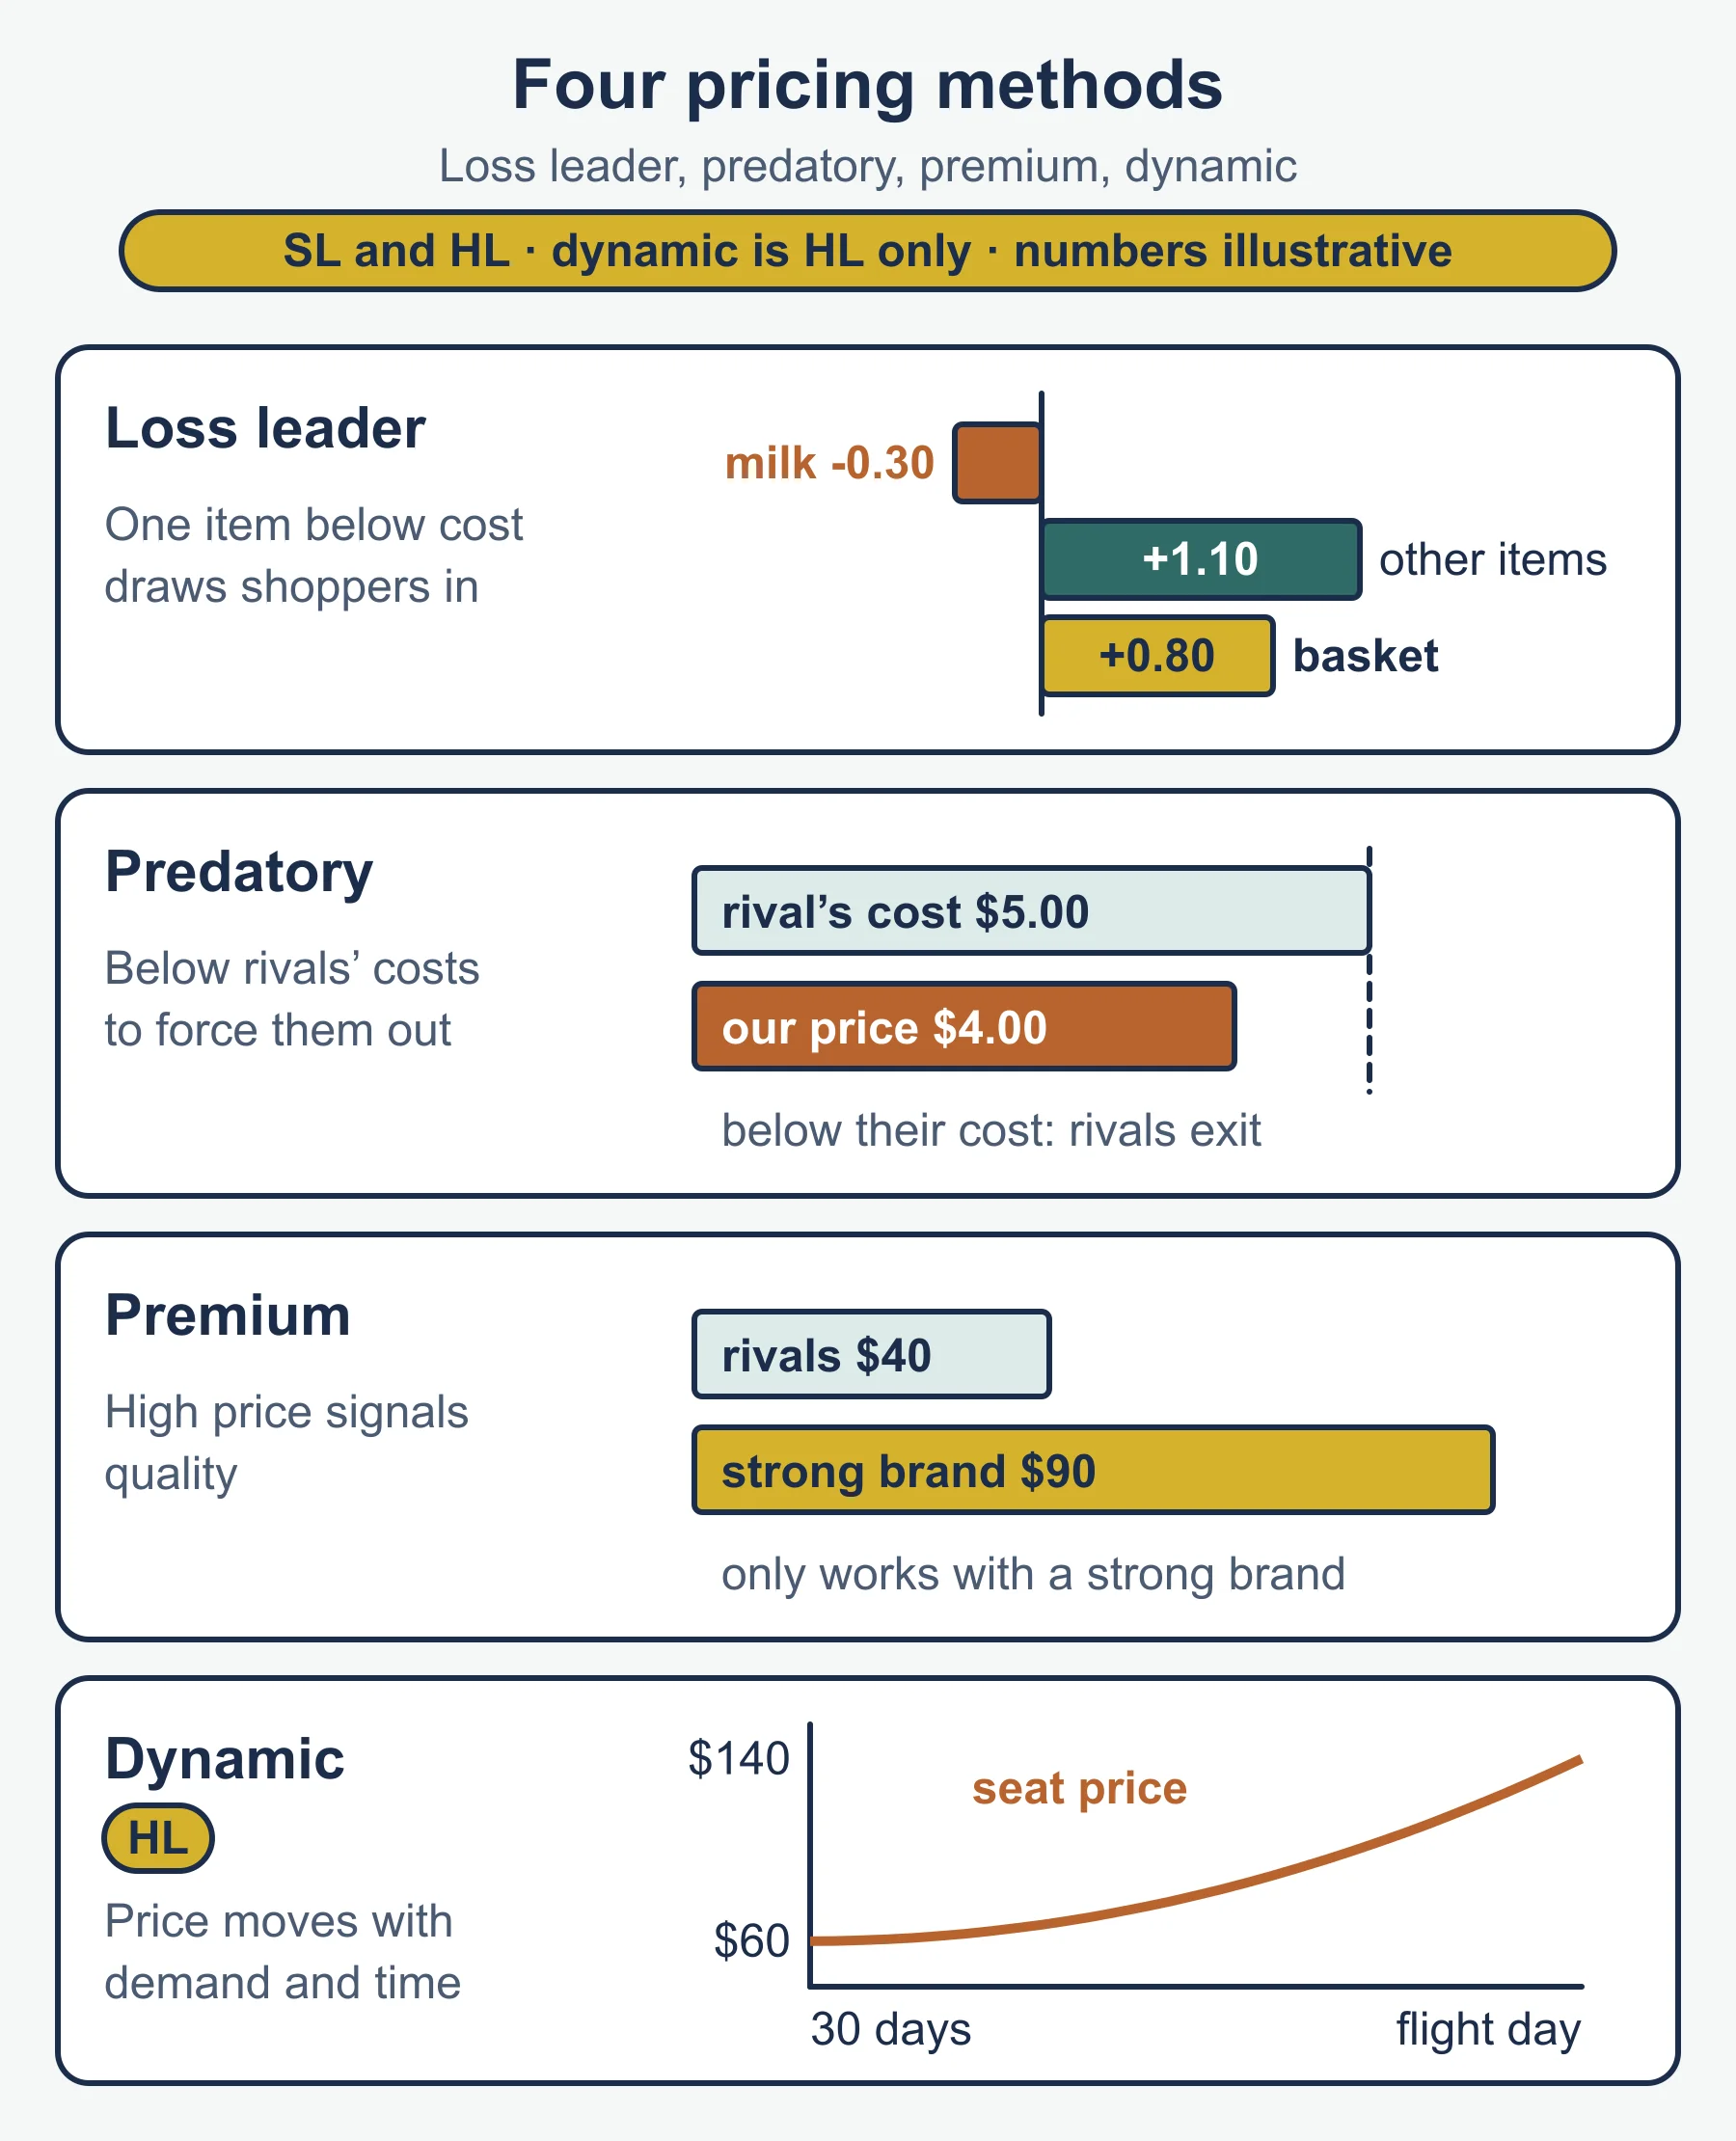
Methods (appropriateness is what you judge)
| Method | Key feature | Best when | Main weakness |
|---|---|---|---|
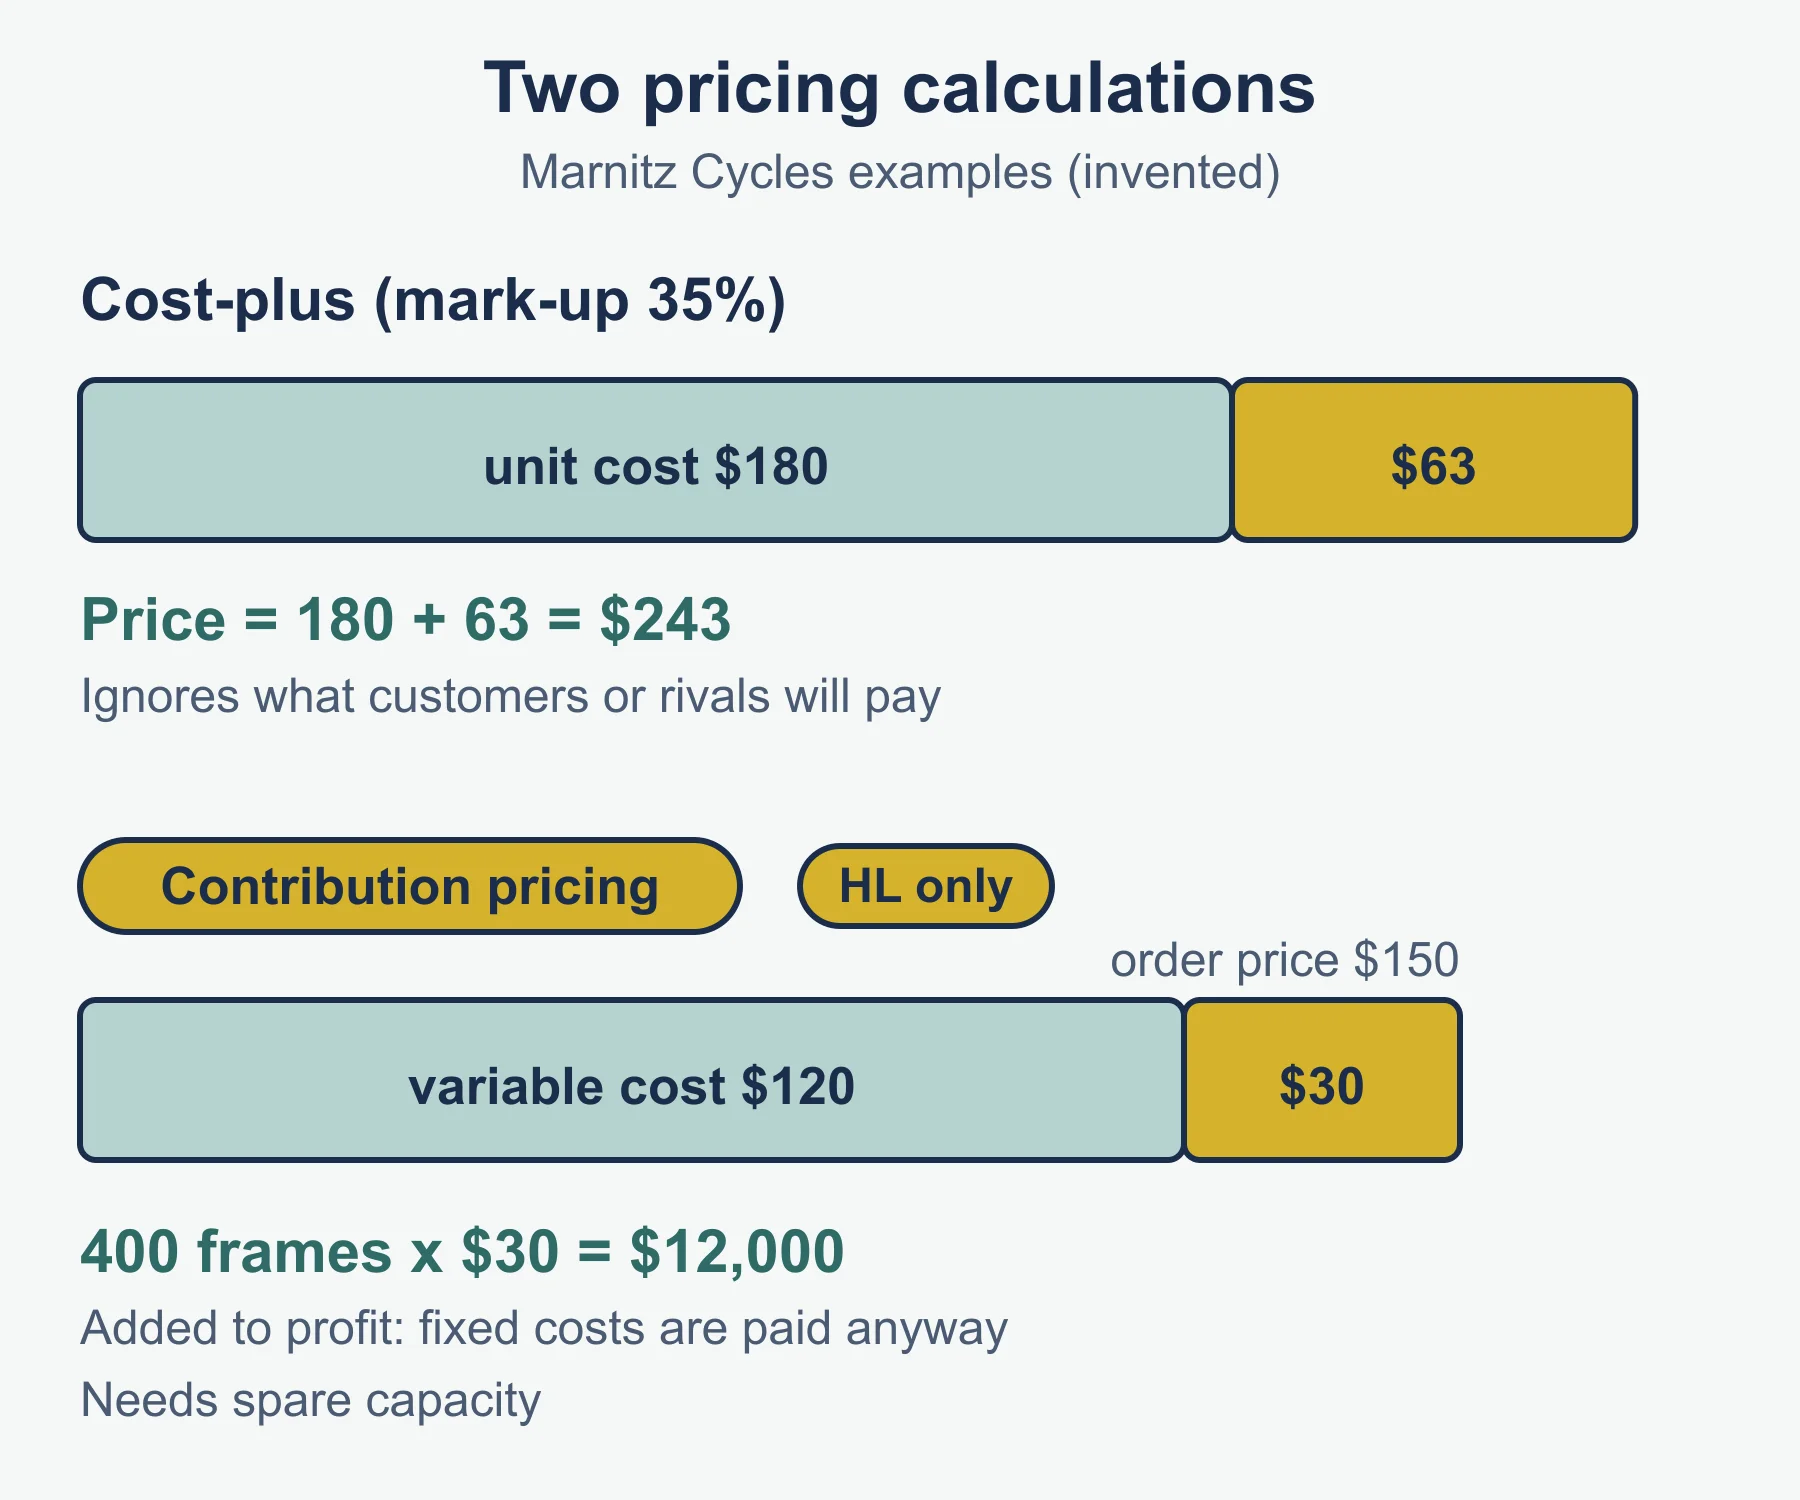
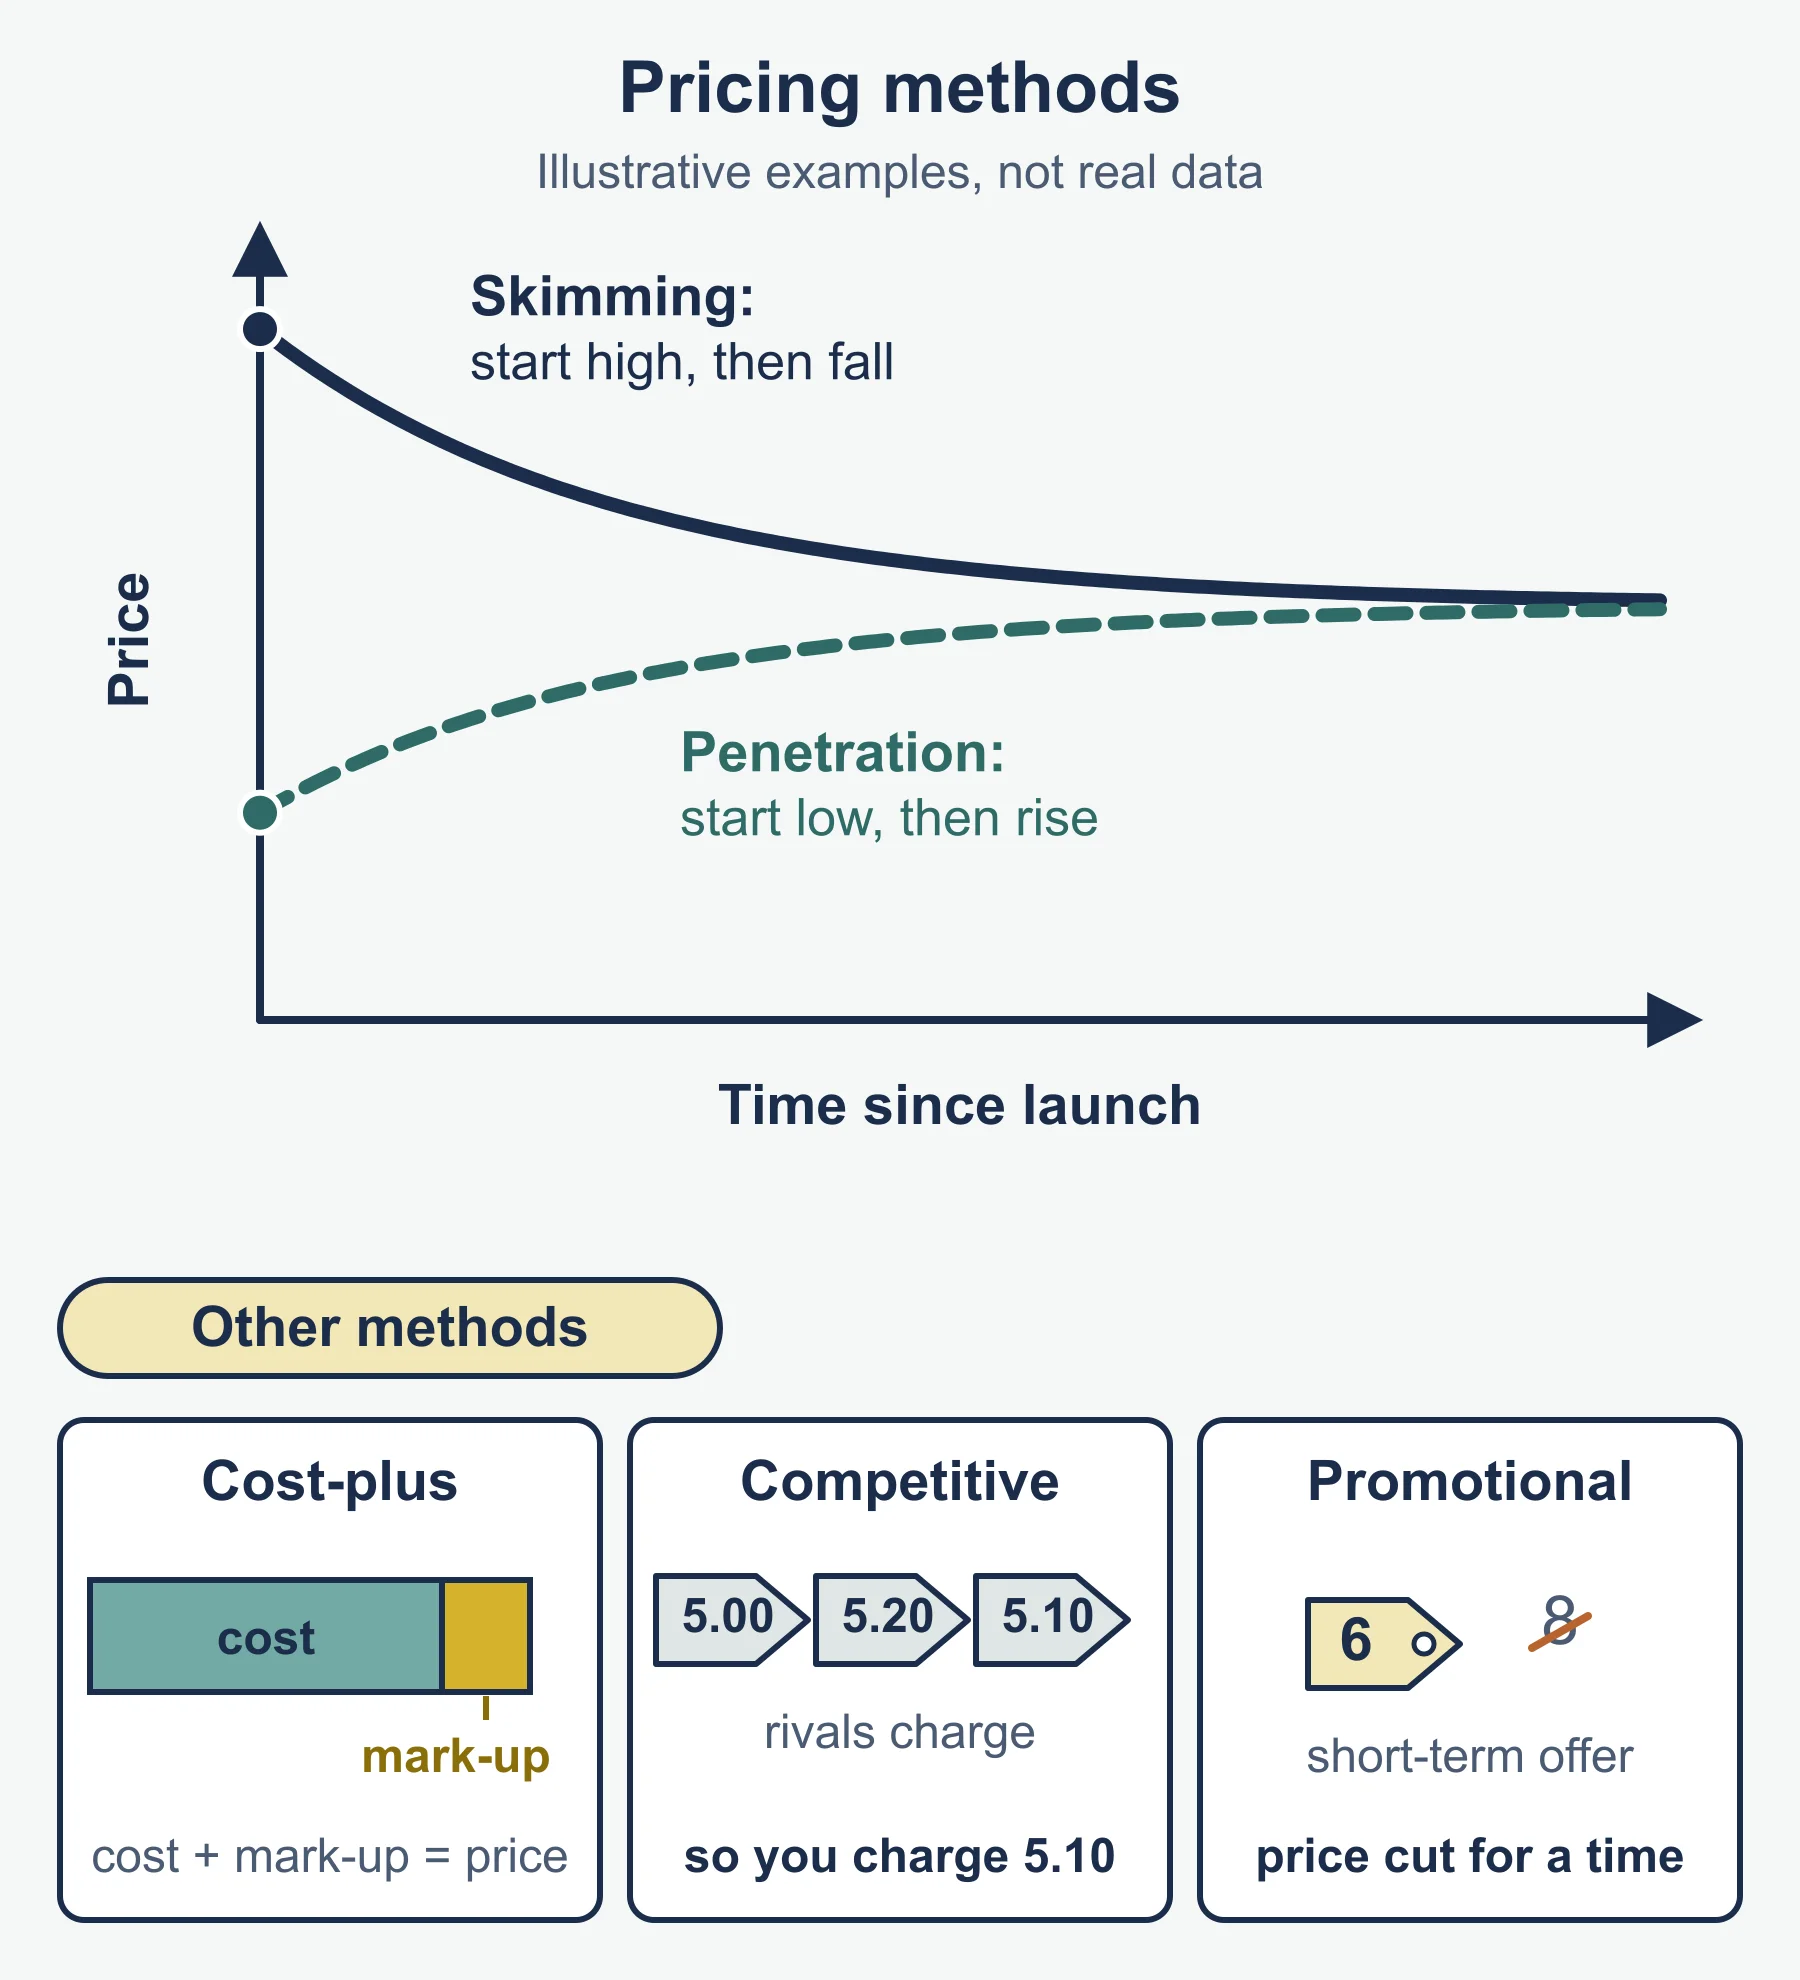
| Cost-plus (mark-up) | Unit cost plus percentage | Costs are known and stable | Ignores demand and rivals |
| Penetration | Low launch price | Customers are price sensitive | Margins thin; hard to raise later |
| Loss leader | Sold below cost to attract buyers | Wide range, customers buy extras | Shoppers cherry-pick the offer |
| Predatory | Price set to drive rivals out | Deep pockets, short period | Heavy losses; brand and scrutiny risk |
| Premium | High price signaling quality | Strong brand, unique product | Small market; needs support from other Ps |
| Dynamic (HL only) | Changes with demand or time | Perishable capacity, online sales | Customers may feel treated unfairly |
| Competitive (HL only) | Set by reference to rivals | Many similar products | Little room for profit; may start price war |
| Contribution (HL only) | Covers variable cost plus a contribution | Spare capacity, special orders | Ignores full cost if used all the time |
Formulas
| Item | Form |
|---|---|
| Cost-plus price | Unit cost + (unit cost × mark-up %) |
| Contribution per unit (HL only) | Selling price − variable cost per unit |
| Total contribution (HL only) | Contribution per unit × units |
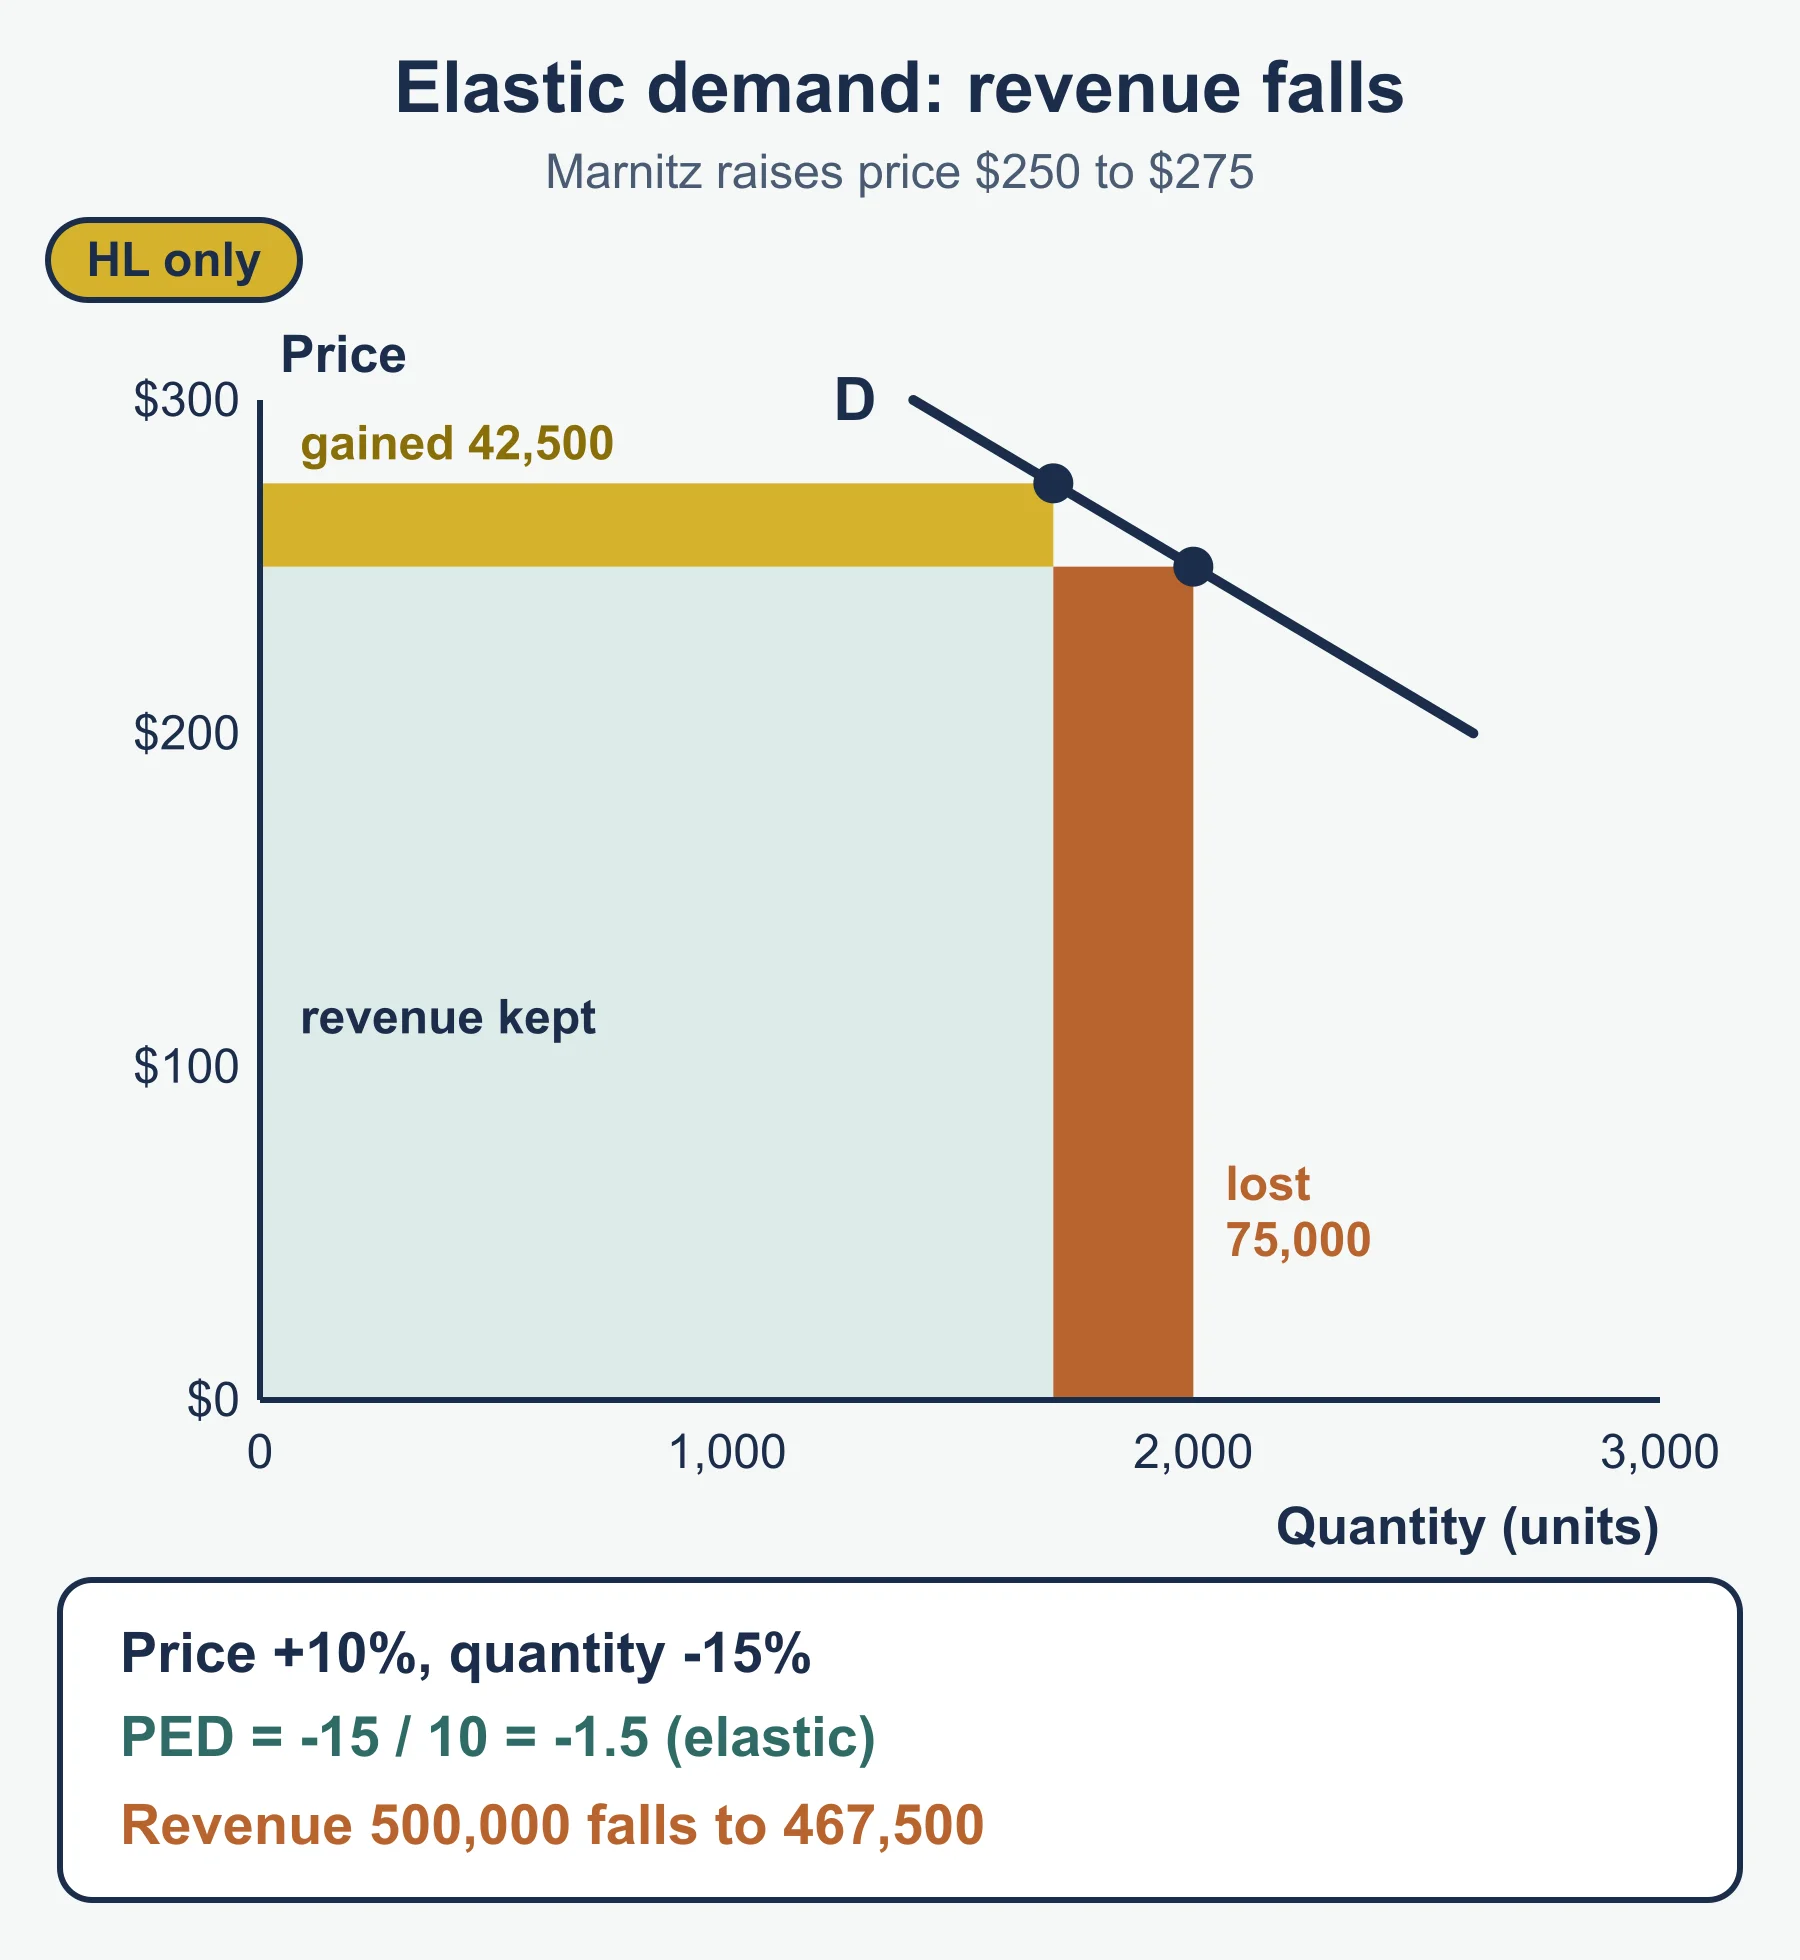
| PED (HL only) | Percentage change in quantity demanded ÷ percentage change in price |
The guide does not print these formulas, so these are the standard forms.
PED reminders (HL only)
- Usually negative because price and quantity move in opposite directions. State the sign.
- Size above 1: elastic. Raising price lowers revenue.
- Size below 1: inelastic. Raising price raises revenue.
- Products with close substitutes tend to be more elastic, so a price rise is riskier for them.
Method in steps: calculating PED (HL only)
- Work out the percentage change in price: (new − old) ÷ old × 100.
- Work out the percentage change in quantity the same way.
- Divide quantity change by price change.
- State the sign, then say elastic or inelastic.
- Link to revenue or to the decision asked for.
Promotion
| Type | One-line meaning | Examples |
|---|---|---|
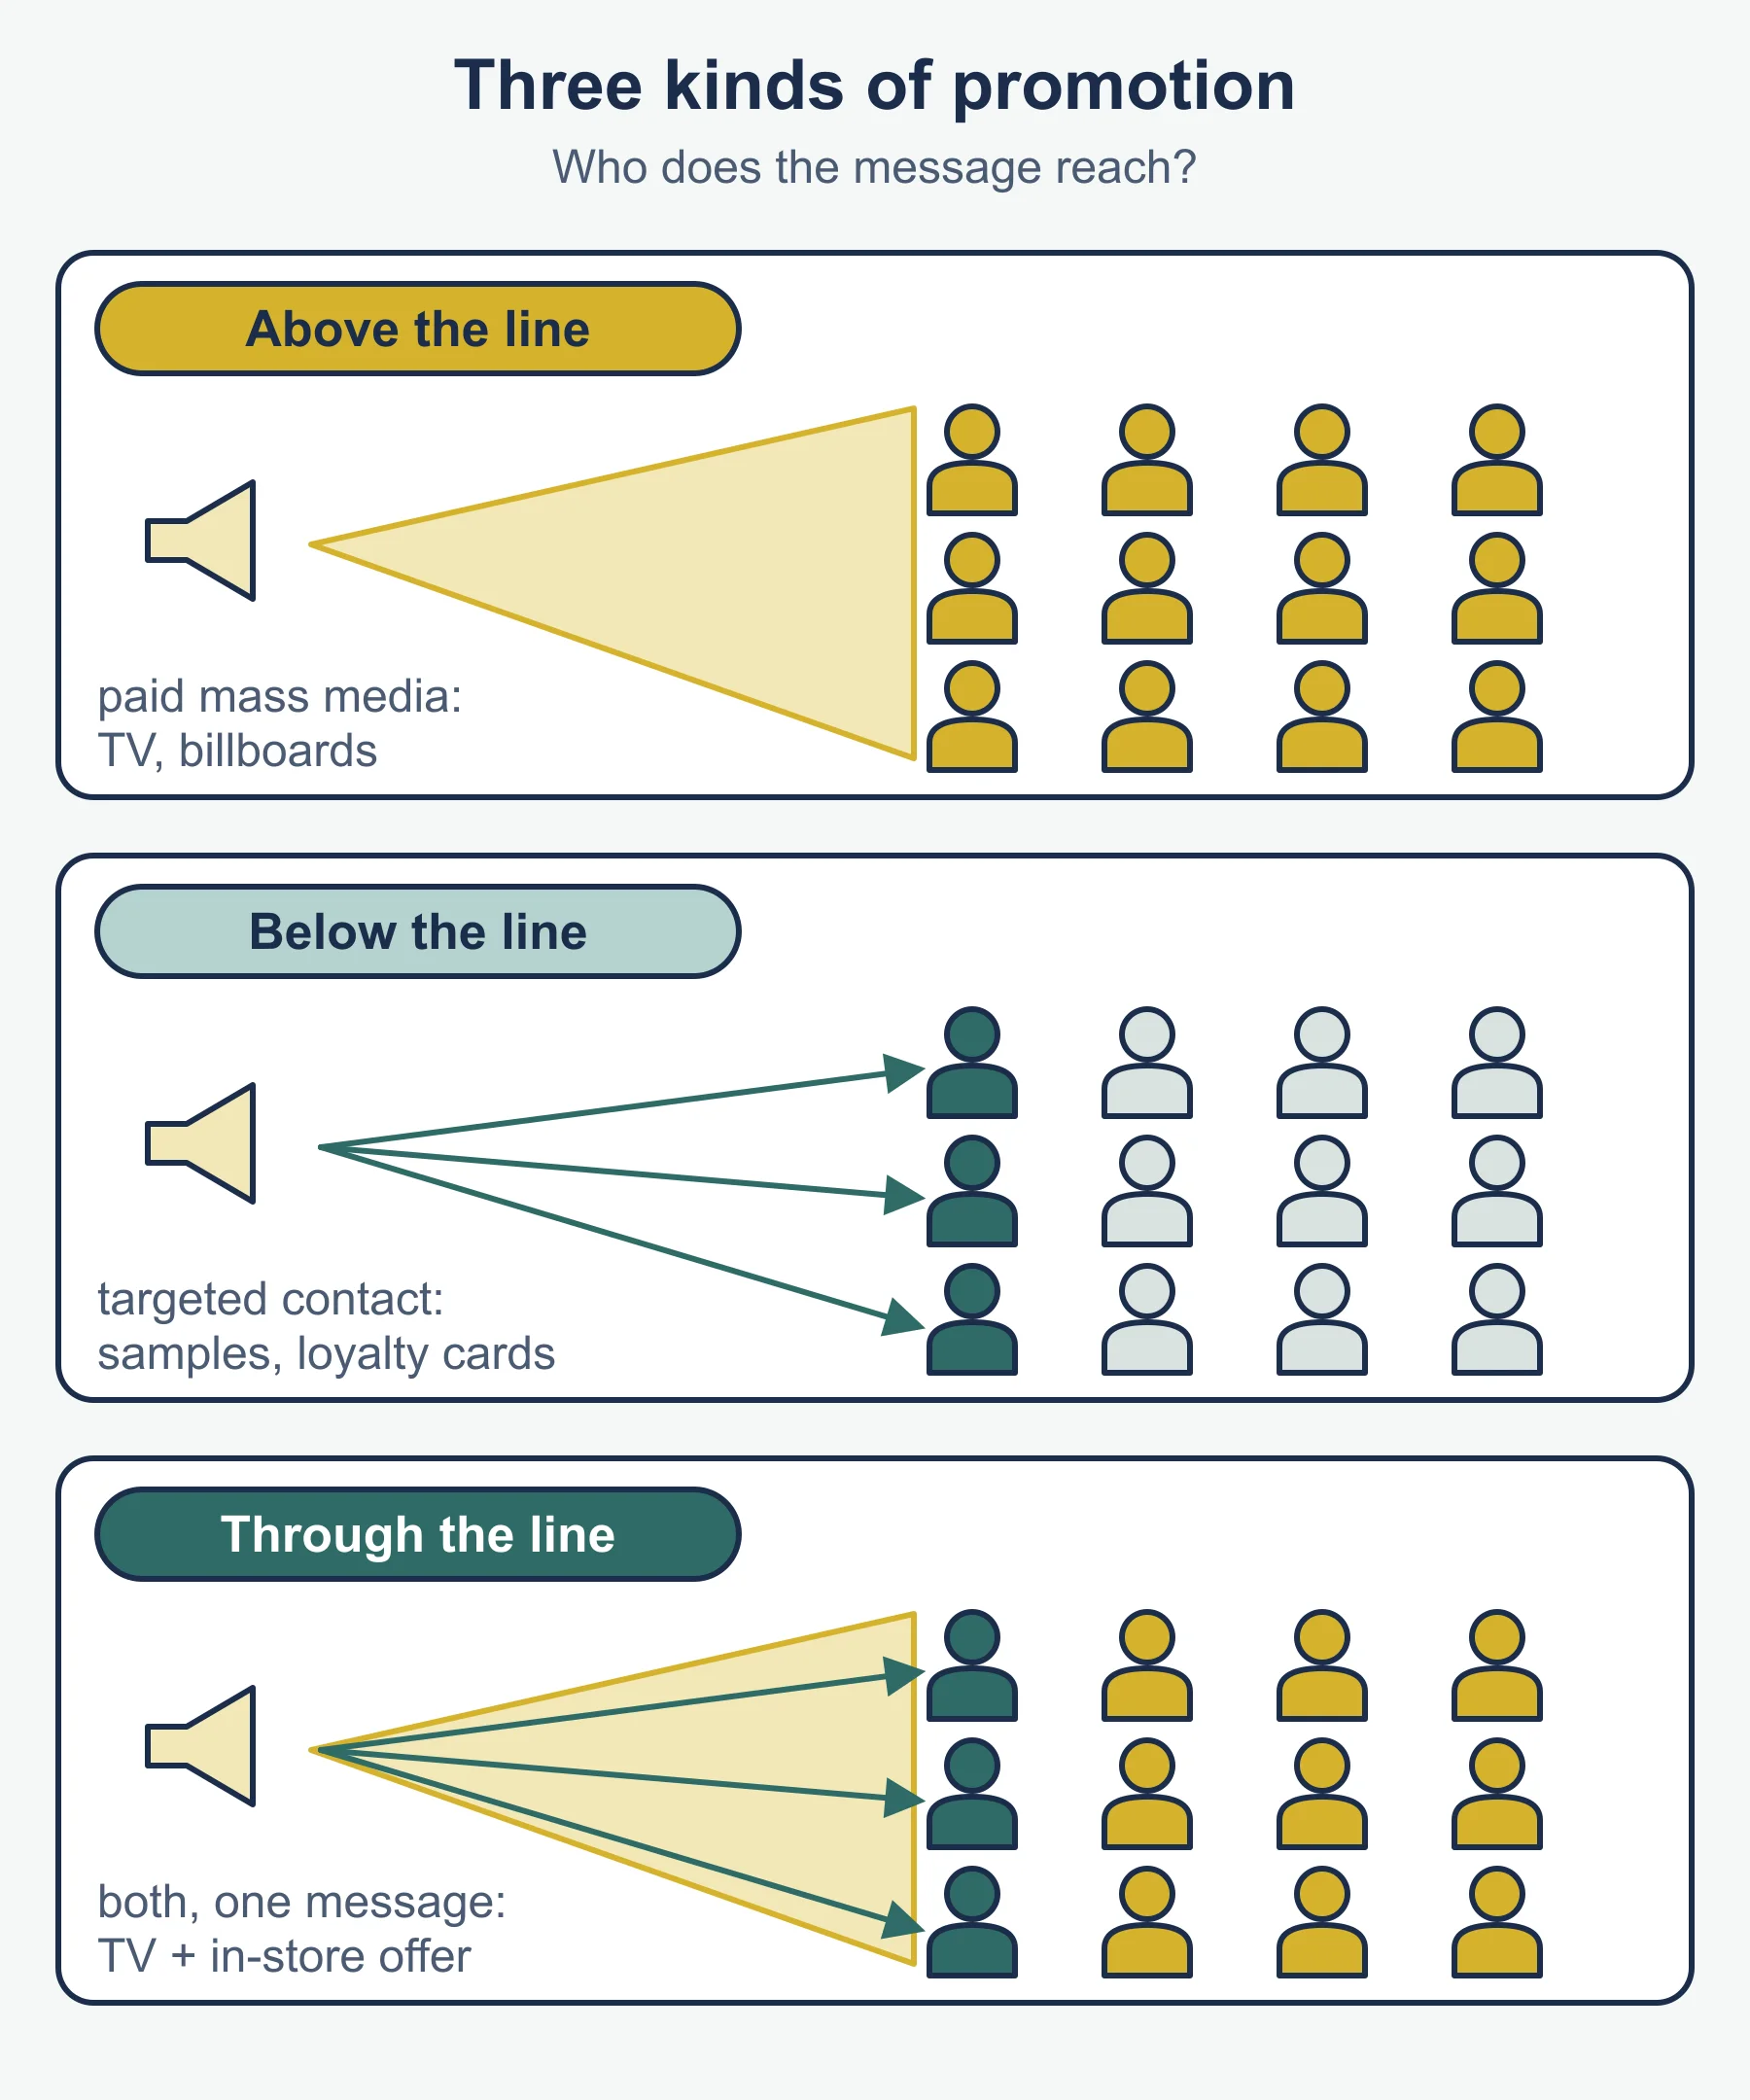
| Above the line | Paid mass media, wide audience | TV, radio, press, billboards |
| Below the line | Targeted, business-controlled contact | Samples, discounts, loyalty cards, events |
| Through the line | Both together under one message | Broadcast advert plus in-store offer |
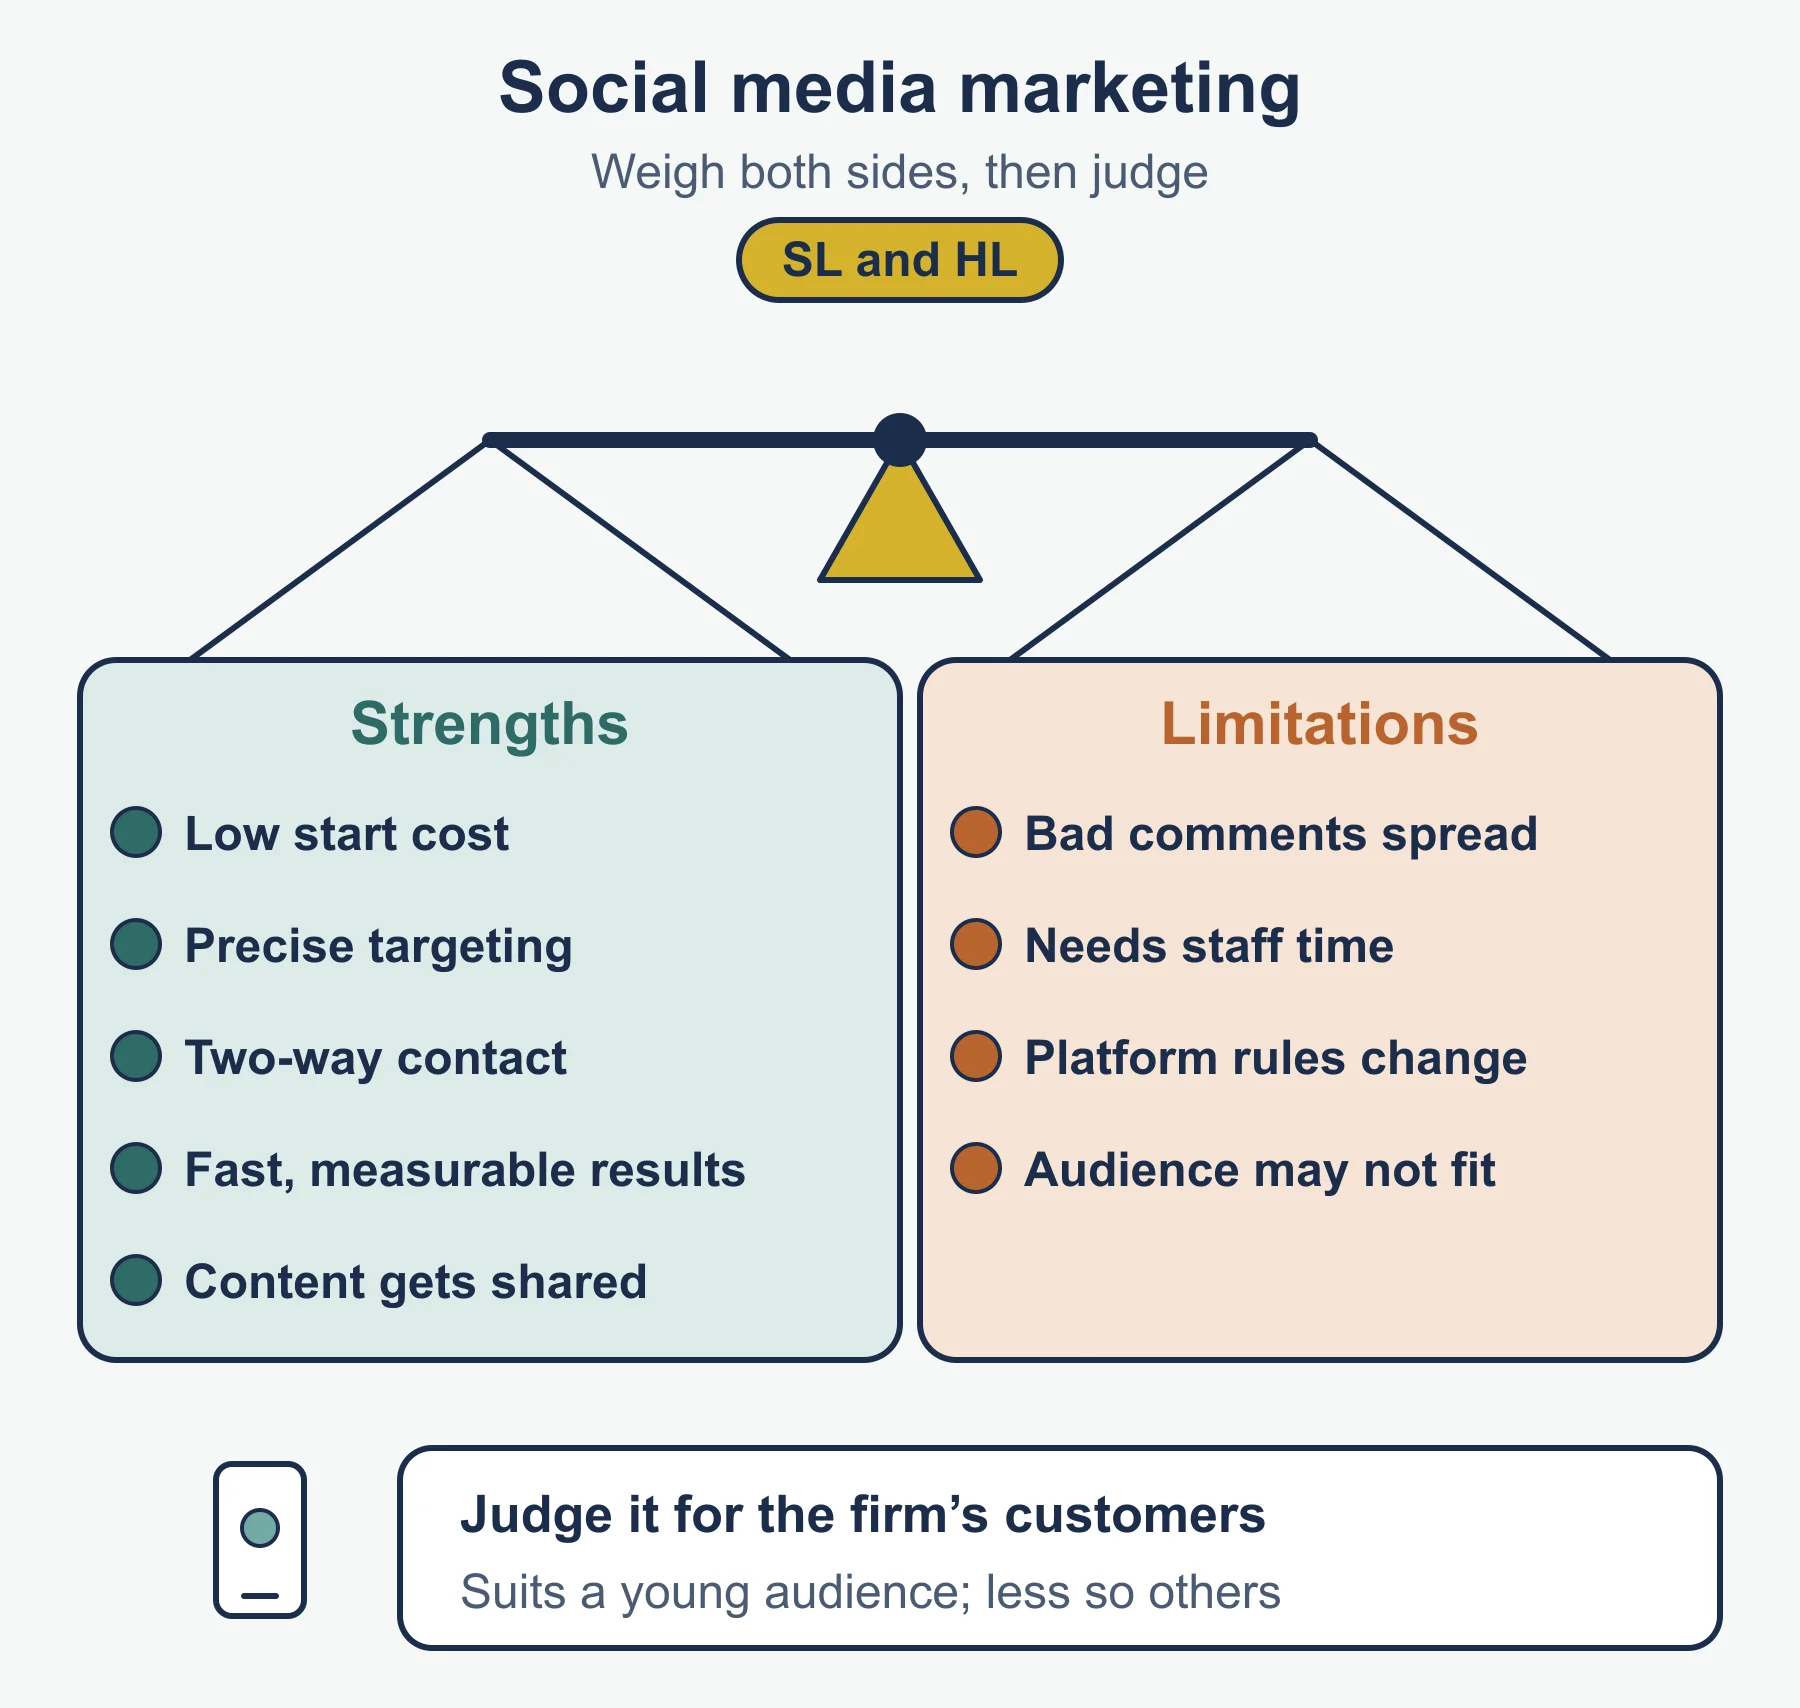
Social media marketing, to evaluate:
- For: low entry cost, precise targeting, two-way contact, fast results data, shareable content.
- Against: negative comments spread, needs staff time, platform changes, audience may not match the target market.
Place
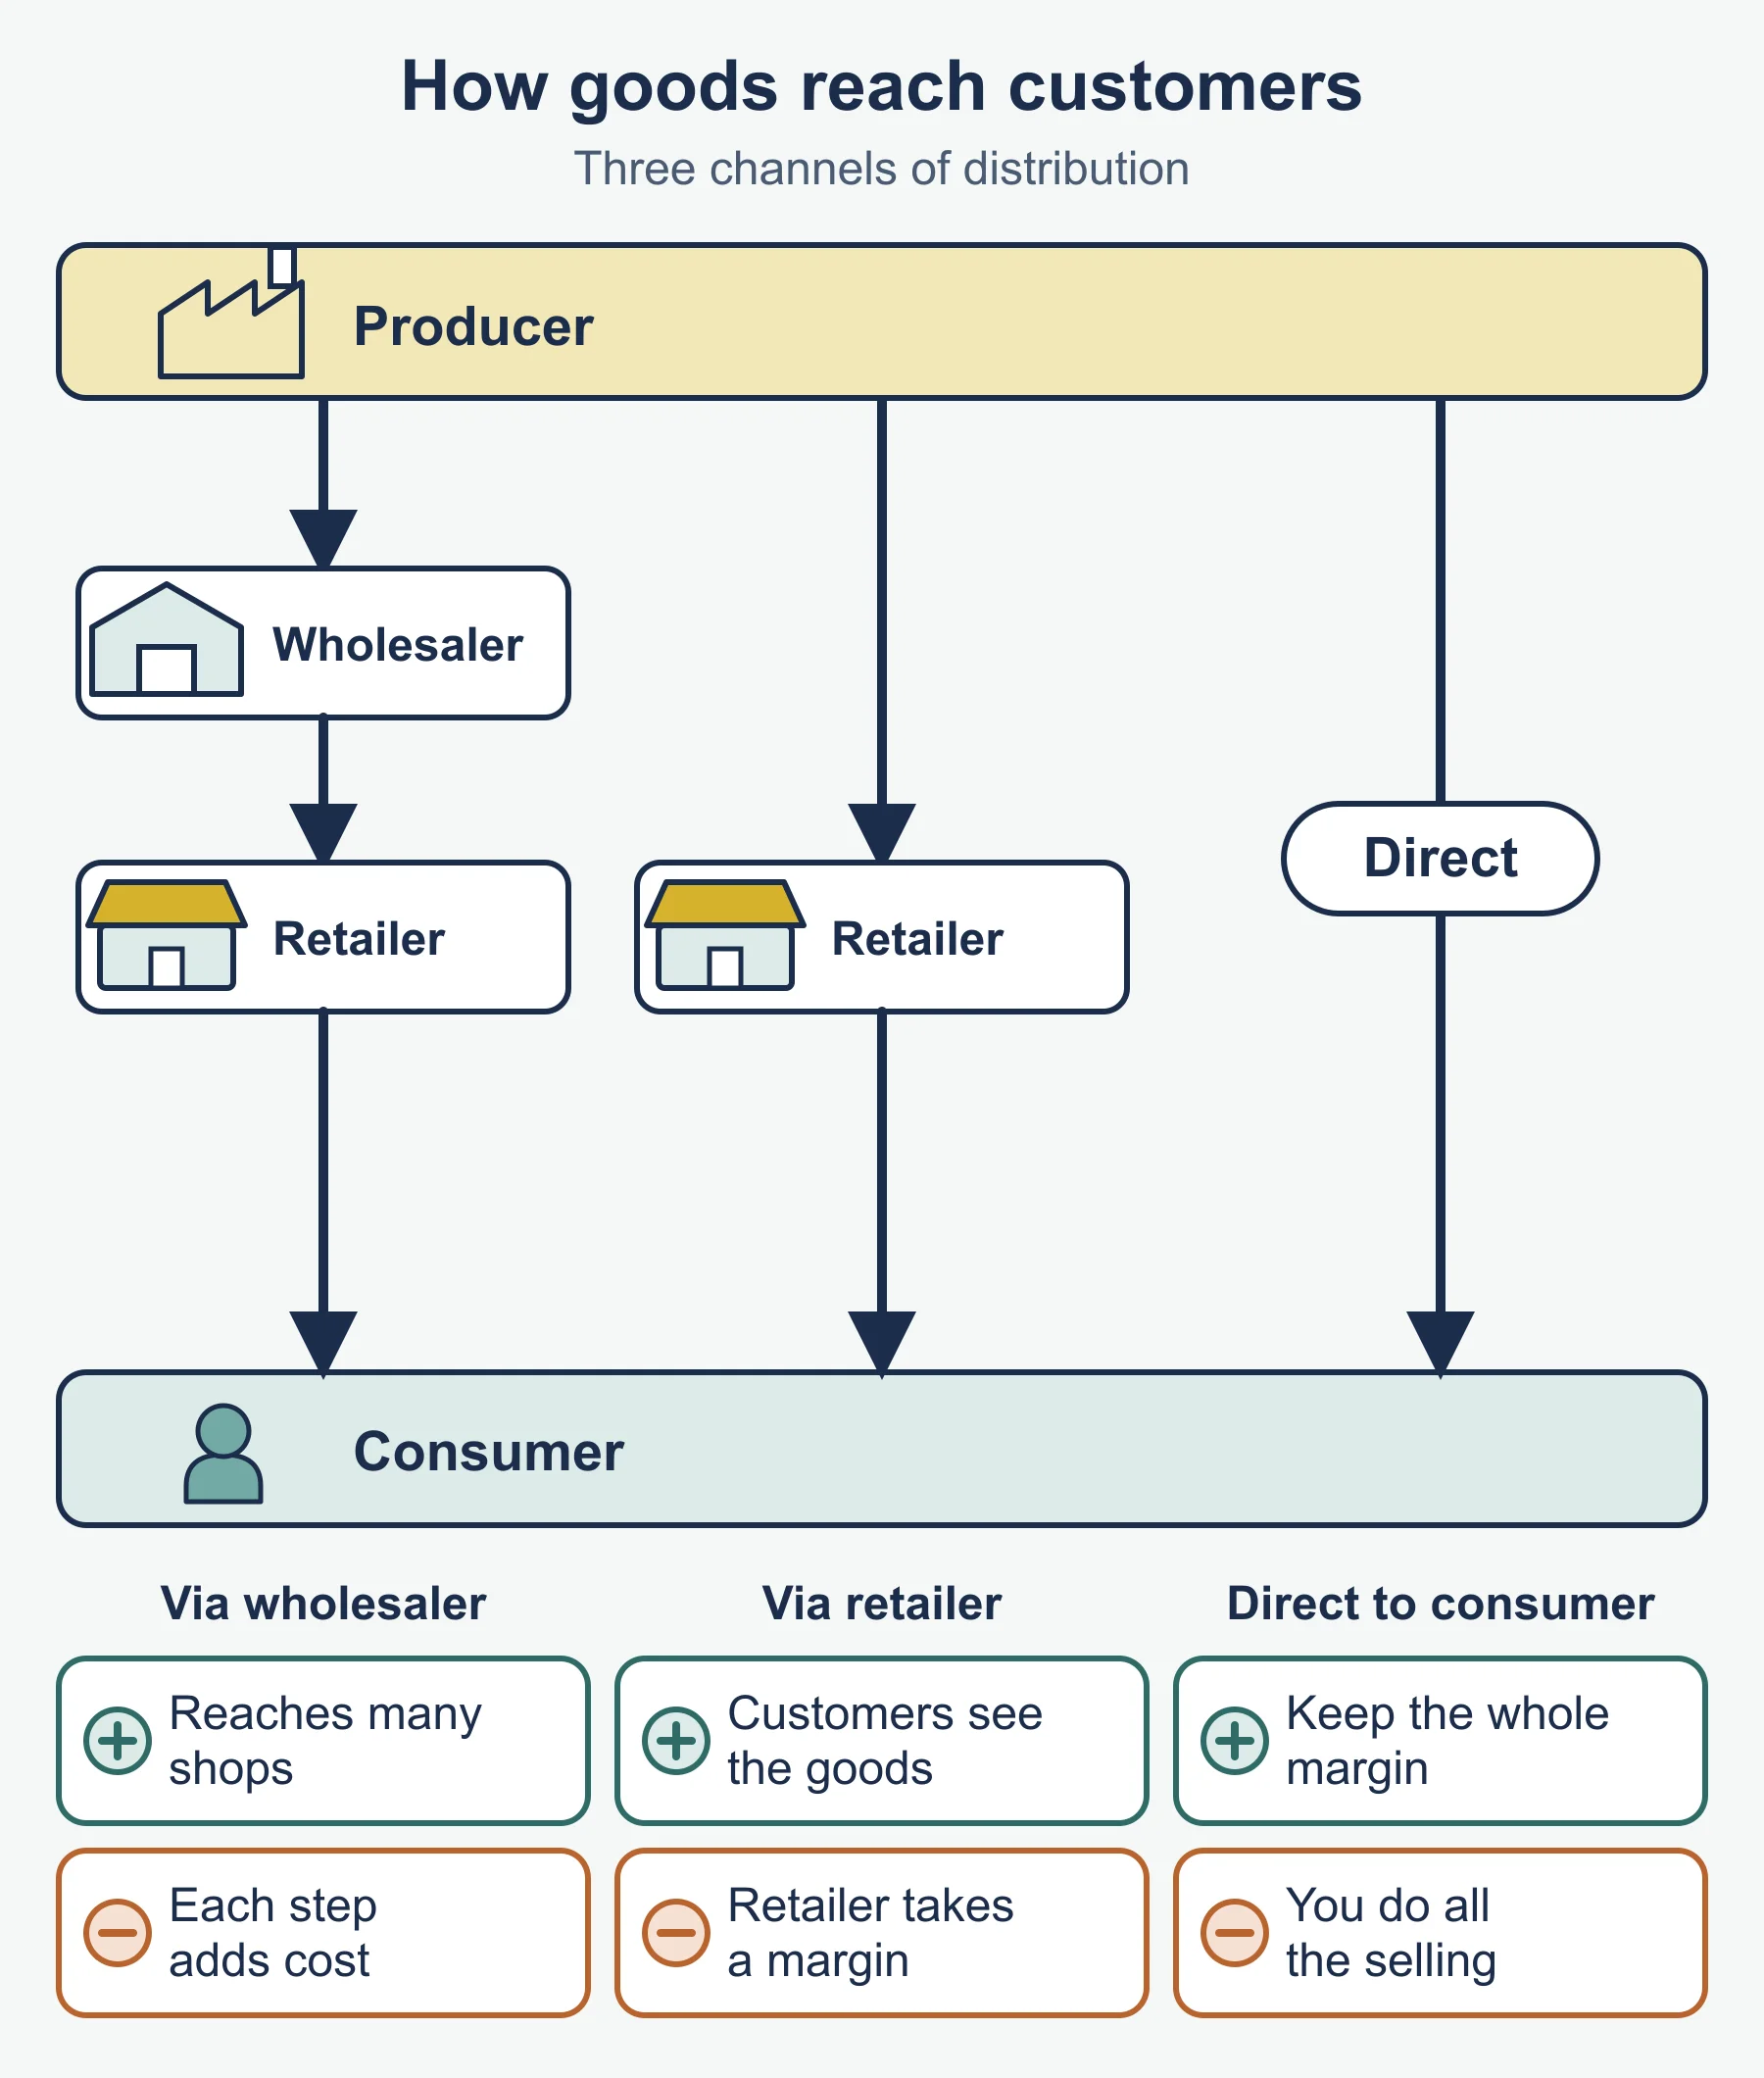
- Direct channel: producer to customer, full margin and data but the business bears cost and risk.
- Indirect channel: via retailers, wholesalers or agents, giving reach at the cost of margin and control.
- Online: wide reach at low cost, but needs delivery and returns systems.
- Match to product: image products need control; low-price products need wide availability.
People, processes, physical evidence
| P | Importance | Key point to add |
|---|---|---|
| People | Staff behavior shapes the whole customer experience | Cultural variation in expected relationships; training and recruitment |
| Processes | Reliable, quick delivery builds loyalty | Changes (such as automation or online booking) bring benefits and disruption |
| Physical evidence | Intangible services need tangible cues | Premises, uniforms, website, branded materials must match the promised quality |
Appropriate marketing mixes
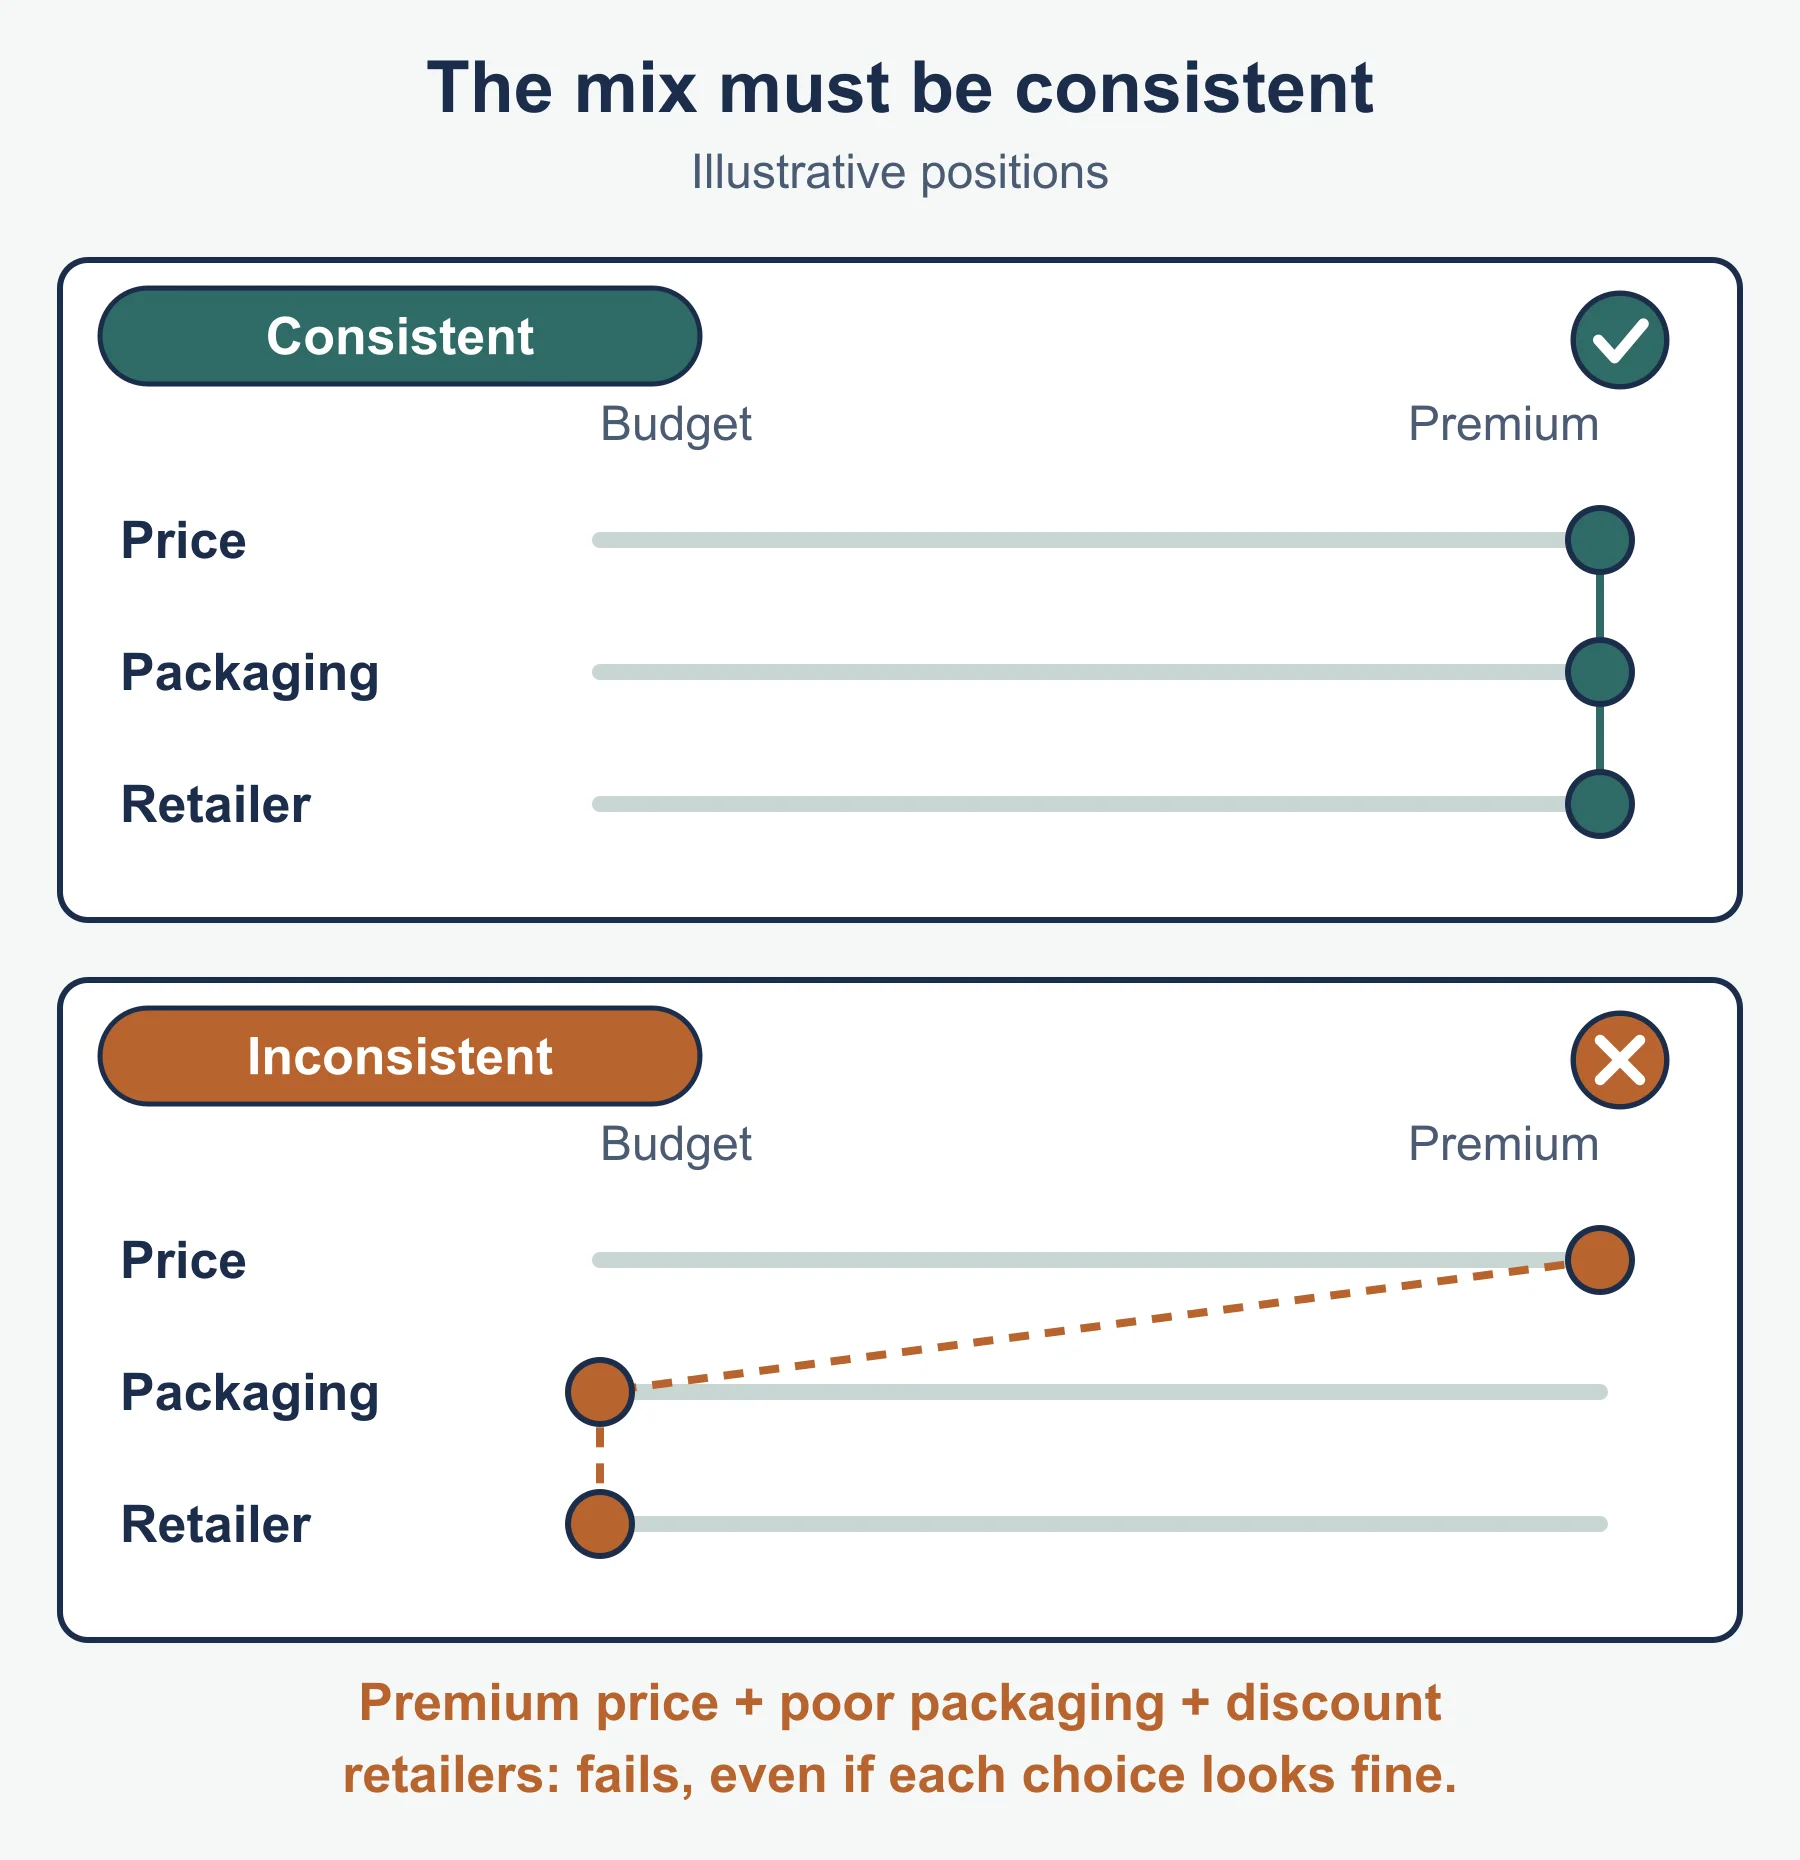
Check three things: fit with the target market, fit with the stage in the life cycle and objective, and consistency across the seven Ps. Example: a premium watch needs premium price, controlled distribution and quality physical evidence, while a budget product relies on competitive pricing and wide distribution.
Must-know distinctions
- Penetration pricing (low launch price to gain share) versus predatory pricing (price set to remove rivals).
- Loss leader (one product below cost to attract buyers) versus penetration (a whole new product priced low).
- Above the line (paid mass media) versus below the line (targeted, business-controlled) versus through the line (both).
- Brand awareness (recognized) versus brand loyalty (repeatedly chosen).
- Profit versus cash flow at the growth stage.
Quick self-test
- A bakery has a unit cost of 40 dollars and a mark-up of 25%. State the selling price.
- Vandermere Tea raises its price by 5% and sales fall by 2%. Calculate PED and describe demand (HL only).
- A firm sells at 14 dollars with variable cost of 9 dollars. A one-off order of 300 units arrives. Calculate the total contribution (HL only).
- At which stage of the life cycle are profits usually highest?
- State two extension strategies.
- Name the four aspects of branding in the guide.
- Distinguish above the line from below the line promotion.
- Why is physical evidence important to a service?
- Give one limitation of social media marketing.
- Give one reason why a direct channel may be chosen over a retailer.
Answers
- Mark-up = 40 × 0.25 = 10, so price is 50 dollars.
- PED = −2 ÷ 5 = −0.4. The size is below 1, so demand is price inelastic.
- Contribution per unit = 14 − 9 = 5. Total = 300 × 5 = 1,500 dollars.
- Maturity.
- Any two: new market, new variant or feature, repositioning, new packaging, new use, price change.
- Awareness, development, loyalty and value.
- Above the line is paid mass media to a wide audience. Below the line is targeted promotion where the business controls the contact.
- A service is intangible, so premises, uniforms and materials act as tangible cues that signal quality before and during use.
- For example, negative comments spread quickly, or the audience may not match the target market.
- For example, the business keeps the full margin and customer data.
Where marks are usually lost
- Listing Ps without tying them to the named business.
- Describing a pricing method without judging whether it is appropriate.
- Mixing up penetration, loss leader and predatory pricing.
- Leaving out the sign or the elastic/inelastic label in a PED answer (HL only).
- Calculating a percentage change from the new value instead of the old value.
- Saying a growth-stage product is cash positive because profit is rising.
- Treating through the line as another word for above the line.
- Ending an evaluation with “it depends” and no deciding factor.
- Using the Ps for a service business but ignoring people, processes and physical evidence.
Frequently asked questions
What is the difference between penetration pricing and predatory pricing? Penetration pricing sets a low launch price to gain market share quickly. Predatory pricing sets a price to harm or drive out competitors and is generally viewed unfavourably.
What is the difference between above the line, below the line and through the line promotion? Above the line is paid mass media aimed at a wide audience, such as TV and billboards. Below the line is targeted promotion the business controls, such as samples, discounts and loyalty cards, and through the line combines both.
Is a product in the growth stage cash positive? Not necessarily. Profit may be rising in growth, but cash flow is often still negative or only improving, because the business pays for stock and equipment before the revenue arrives.
What does a PED above 1 mean? If the size of PED is above 1, demand is price elastic, so raising the price lowers total revenue. If it is below 1, demand is inelastic and a price rise raises revenue; PED is HL only.
Official syllabus
International Baccalaureate Organization, Diploma Programme Business management guide, first assessment 2024, section 4.5, published February 2022 and updated May 2022.
Get free revision emails (optional)
Occasional emails with practice questions, worked explanations and links to free resources for the qualification and subjects you choose. No spam, and you can unsubscribe from any email. The free tools on this site never need an email.
Related resources
-
Study guides
IB DP Business Management: International marketing (HL only)
Study guide to IB DP Business Management 4.6 (HL only): the opportunities and threats of entering and operating internationally, with worked examples.
Business · International Baccalaureate · IB
Read guide -
Practice questions
IB DP Business Management: International marketing (HL only) – Practice Questions
Original practice questions with worked answers on IB DP Business Management 4.6 (HL only): international opportunities, threats and exchange rates.
Business · International Baccalaureate · IB
Try questions -
Revision notes
IB DP Business Management: International marketing (HL only) – Revision Notes
Condensed revision notes for IB DP Business Management 4.6 (HL only): international opportunities, threats, adaptation, key calculations and a self-test.
Business · International Baccalaureate · IB
Revise topic
Related articles
-
teaching
A Level tuition in Dubai: Cambridge or Pearson Edexcel International A Level?
Schools in Dubai and Abu Dhabi teach either Cambridge International AS & A Level or Pearson Edexcel International A Level. How the two are structured, why it matters for tuition, and how online classes from Lahore work.
9 October 2026
-
curriculum guides
Choosing subjects at IGCSE and A Level
How subject choices at 14 and 16 affect university options later, and how to keep pathways open without overloading a timetable.
28 July 2026
Studying this with a teacher
Working through Business IB?
This page is free and stays free. If you would rather be taught it, Marlbridge runs Business classes one-to-one, online in your own time zone. The first trial class is free. WhatsApp replies within an hour (8am–11pm Pakistan time, every day); email the same day.
IB Business teachers at Marlbridge

