
Study Guides
IB DP Business Management: Sales forecasting (HL only)
Study guide to the benefits and limitations of sales forecasting, with simple linear regression worked through, for IB DP Business Management HL.
- Subject
- Business
- Level
- IB
- Topic
- Unit 4: Marketing
- Author
- Marlbridge Academic Team
- Updated
- Reviewed by
- Salman Ahmad (what this means)
Aligned to International Baccalaureate IB Diploma Programme Business (DP Business Management), First assessment 2024. Official specification .
Syllabus page (what it covers and how it is assessed): IB Diploma Programme Business.
Syllabus points this page covers
DP Business Management
- 4.3 Sales forecasting (HL only)
Found an error? Report a correction.
Need help with this topic? Request a free trial class for IB Diploma Programme Business (DP Business Management).
This guide covers section 4.3, Sales forecasting, in Unit 4 (Marketing) of the IB Business management guide, first assessment 2024. Section 4.3 is HL only. It applies to HL candidates sitting examinations under that guide. The guide lists one content point for the section: the benefits and limitations of sales forecasting, assessed at AO3 (evaluation). It is HL content, so it can appear where an HL paper draws on HL extension topics.
Related pages: course hub, printable checklist, revision notes for this topic, practice questions for this topic, and the wider Unit 4 study guide. To find out where you stand first, try the free diagnostics.
What the guide asks for
| Guide item | What you must be able to do | Level |
|---|---|---|
| 4.3 The benefits and limitations of sales forecasting | Weigh up what a forecast gives a business against where it can mislead, for a named business | HL only, AO3 |
| Business management tools: simple linear regression (scatter diagrams, line of best fit, correlation/extrapolation) | Build and read a trend forecast from past sales data | HL only, listed in the toolkit (units 1, 4, 5) |
Section 4.3 has no calculation of its own. The regression tool is listed separately in the toolkit, and the guide suggests integrating it with Unit 4. This guide teaches both, because you cannot evaluate a forecast well if you do not know how a trend forecast is produced.
The guide’s command term for this kind of AO3 content is often “evaluate”: make an appraisal by weighing up the strengths and limitations. So your answer needs both sides and a reasoned judgement. Pros and cons set out with no verdict make an incomplete answer.
What a sales forecast is
A sales forecast is a prediction of the sales a business expects over a future period, stated in units, in revenue, or both. The guide does not define the term, so treat this as a working definition. A forecast is an estimate. It is built from information available today, so it is never a promise.
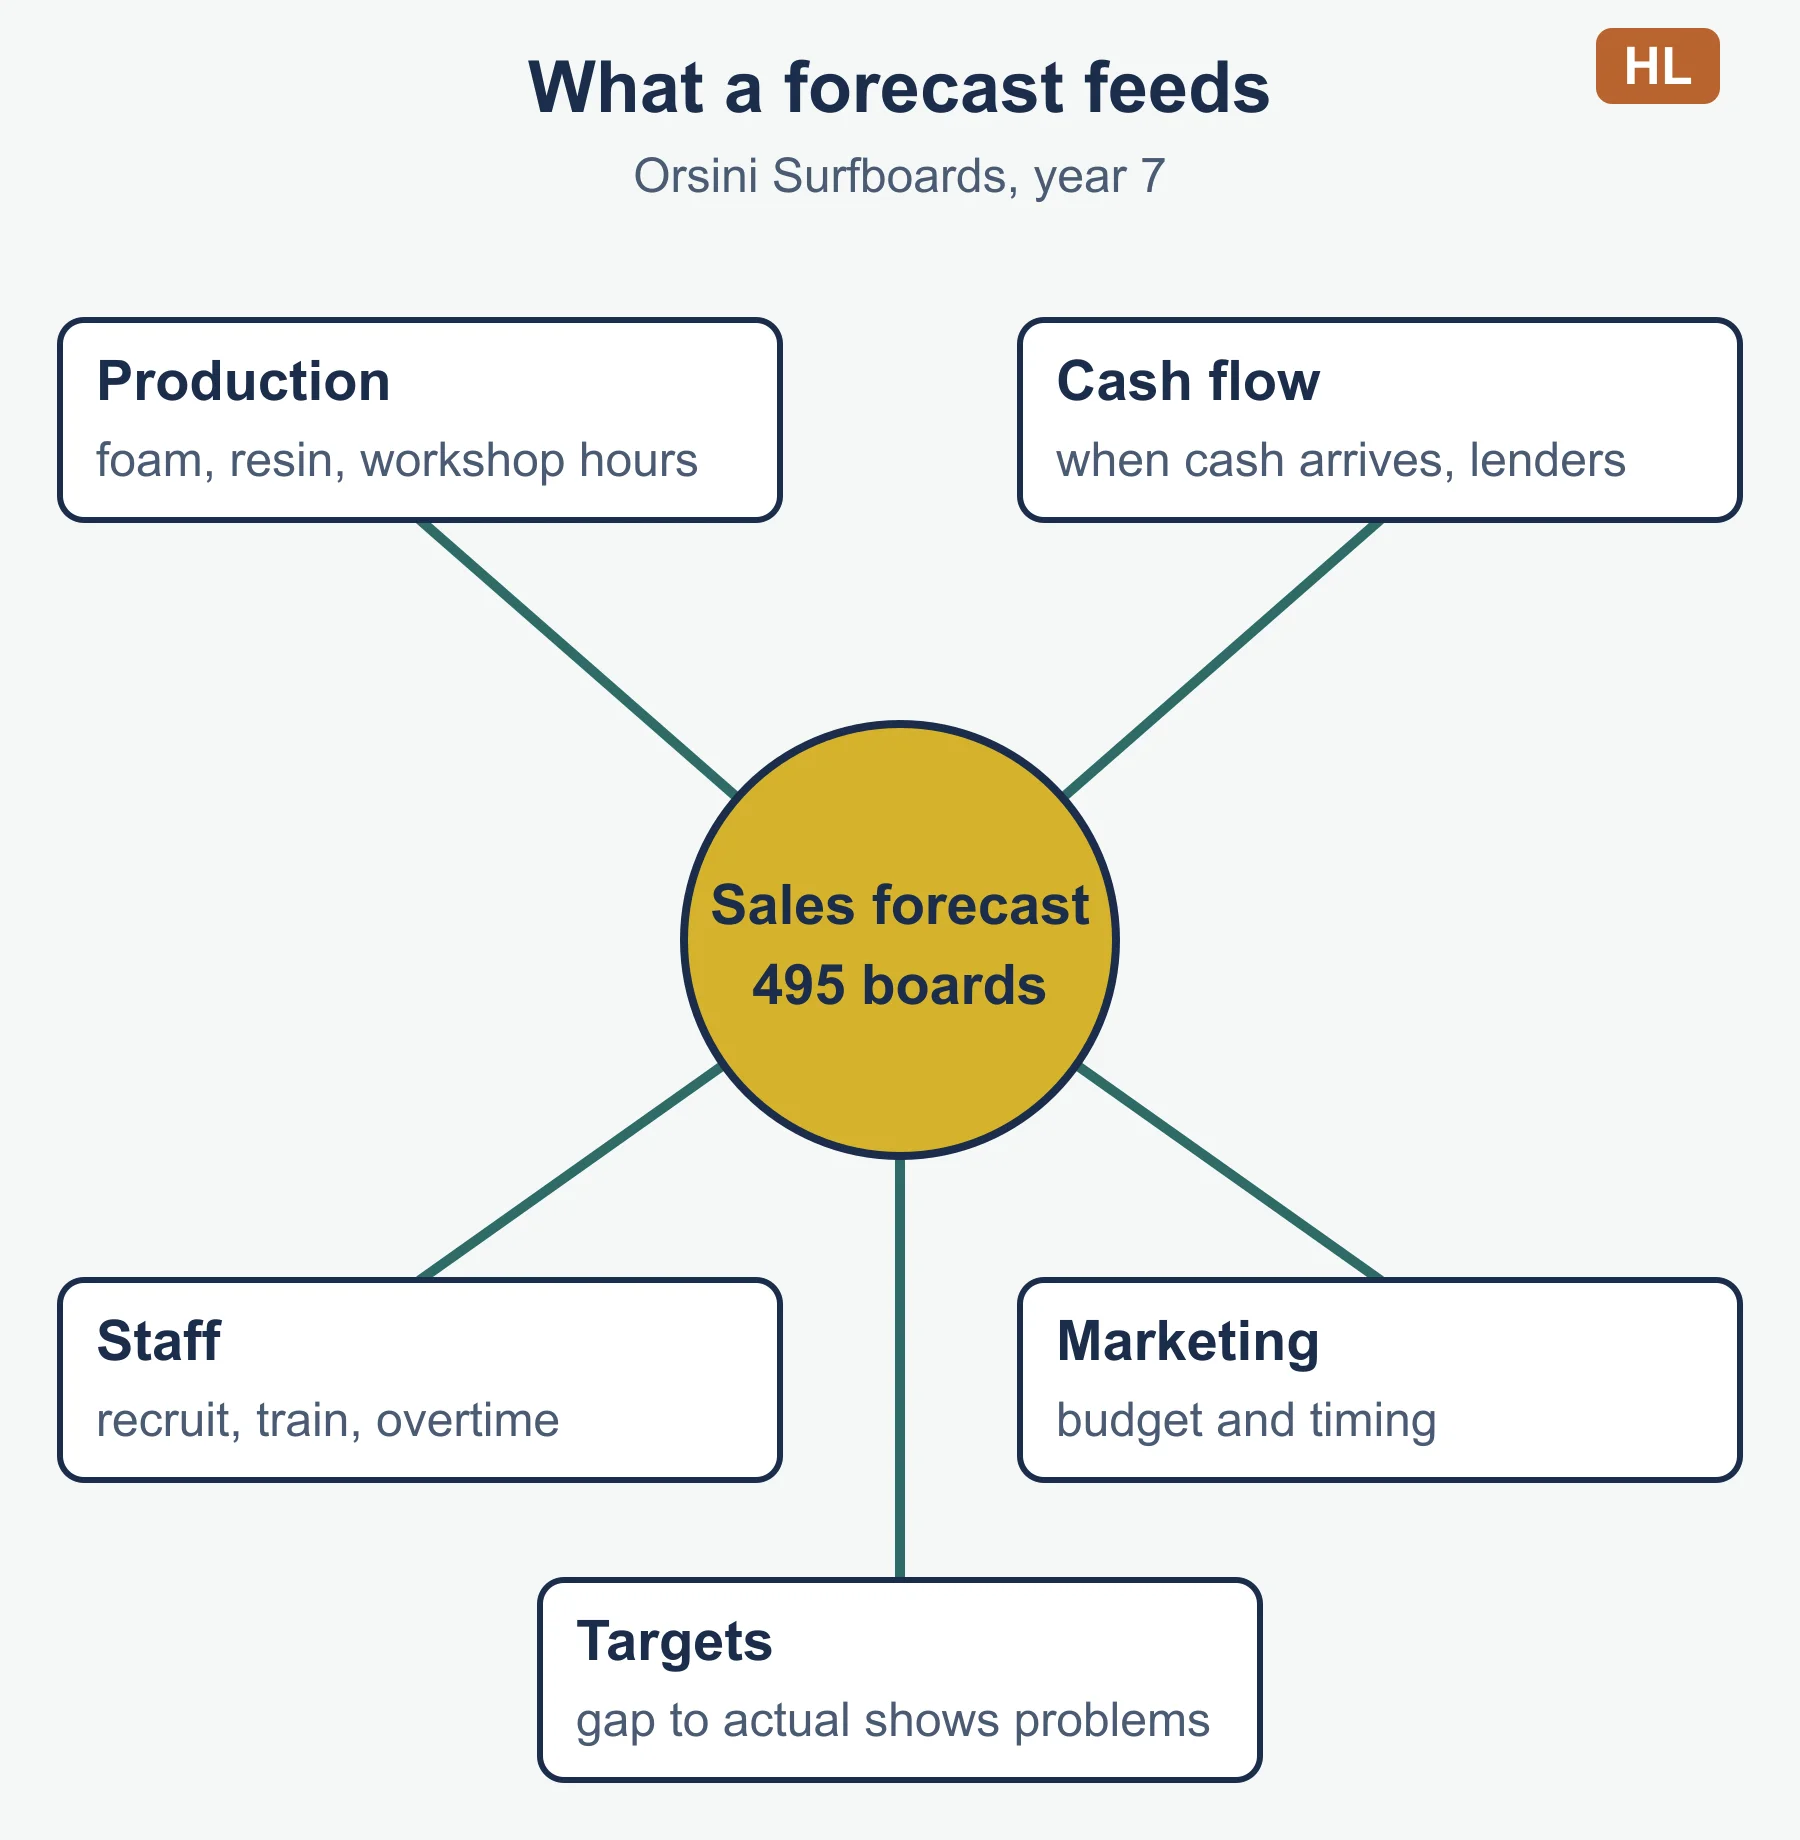
Forecasts feed other plans. The sales figure is often the starting point for production schedules, purchasing, staffing, marketing budgets and cash flow forecasts.
Benefits of sales forecasting
Each benefit below works only if the forecast is reasonably close to what happens. Always say how the benefit helps this particular business.
- Production and stock planning. If Orsini Surfboards expects to sell 495 boards, it can order materials and schedule workers for that volume. This reduces stockouts and avoids money tied up in unsold stock.
- Cash flow and finance. Expected sales revenue tells the business when cash will arrive, so it can plan when to pay suppliers, and whether it needs an overdraft. Lenders and investors usually want to see forecasts before they commit funds.
- Human resource planning. Expected volumes show whether to recruit, train, offer overtime or avoid replacing leavers.
- Marketing planning. A forecast helps set the promotion budget and timing. It also lets the business judge whether a marketing objective (for example, a share of the market) is realistic.
- Targets and control. Forecast figures give managers and sales teams a target. Later, the gap between forecast and actual sales shows where to investigate.
- Reduced uncertainty and risk. Planning from evidence is better than planning from guesswork, which makes decisions on capacity, pricing and expansion easier to defend to stakeholders.
Limitations of sales forecasting
- It relies on past data. A trend forecast assumes the past pattern continues. If the market changes direction, the forecast fails.
- External factors change. Competitors, consumer tastes, the economy, technology and regulation can all shift demand in ways a trend line cannot see.
- Unexpected events. One-off shocks (a supply disruption, a bad review that spreads, a change in weather) are not in any data set.
- Longer horizons are less reliable. The further ahead the forecast, the more can change.
- Poor or small data sets. A new business or a new product has little history. A handful of points can give a misleading line.
- Judgement and bias. Managers may be optimistic to impress owners or lenders. Sales staff may understate the forecast so targets are easy to beat.
- Cost and time. Collecting data and analyzing it takes resources. A small business may not be able to afford detailed work.
- False confidence. A precise-looking number can lead managers to commit to production, hiring or borrowing before they check the assumptions.
Simple linear regression as a forecasting tool (HL only)
The guide lists three parts: scatter diagrams, line of best fit, and correlation/extrapolation. The guide does not give a formula for the line. The least-squares form below is the standard form.
- Scatter diagram. Plot time on the horizontal axis (year 1, 2, 3 and so on) and sales on the vertical axis.
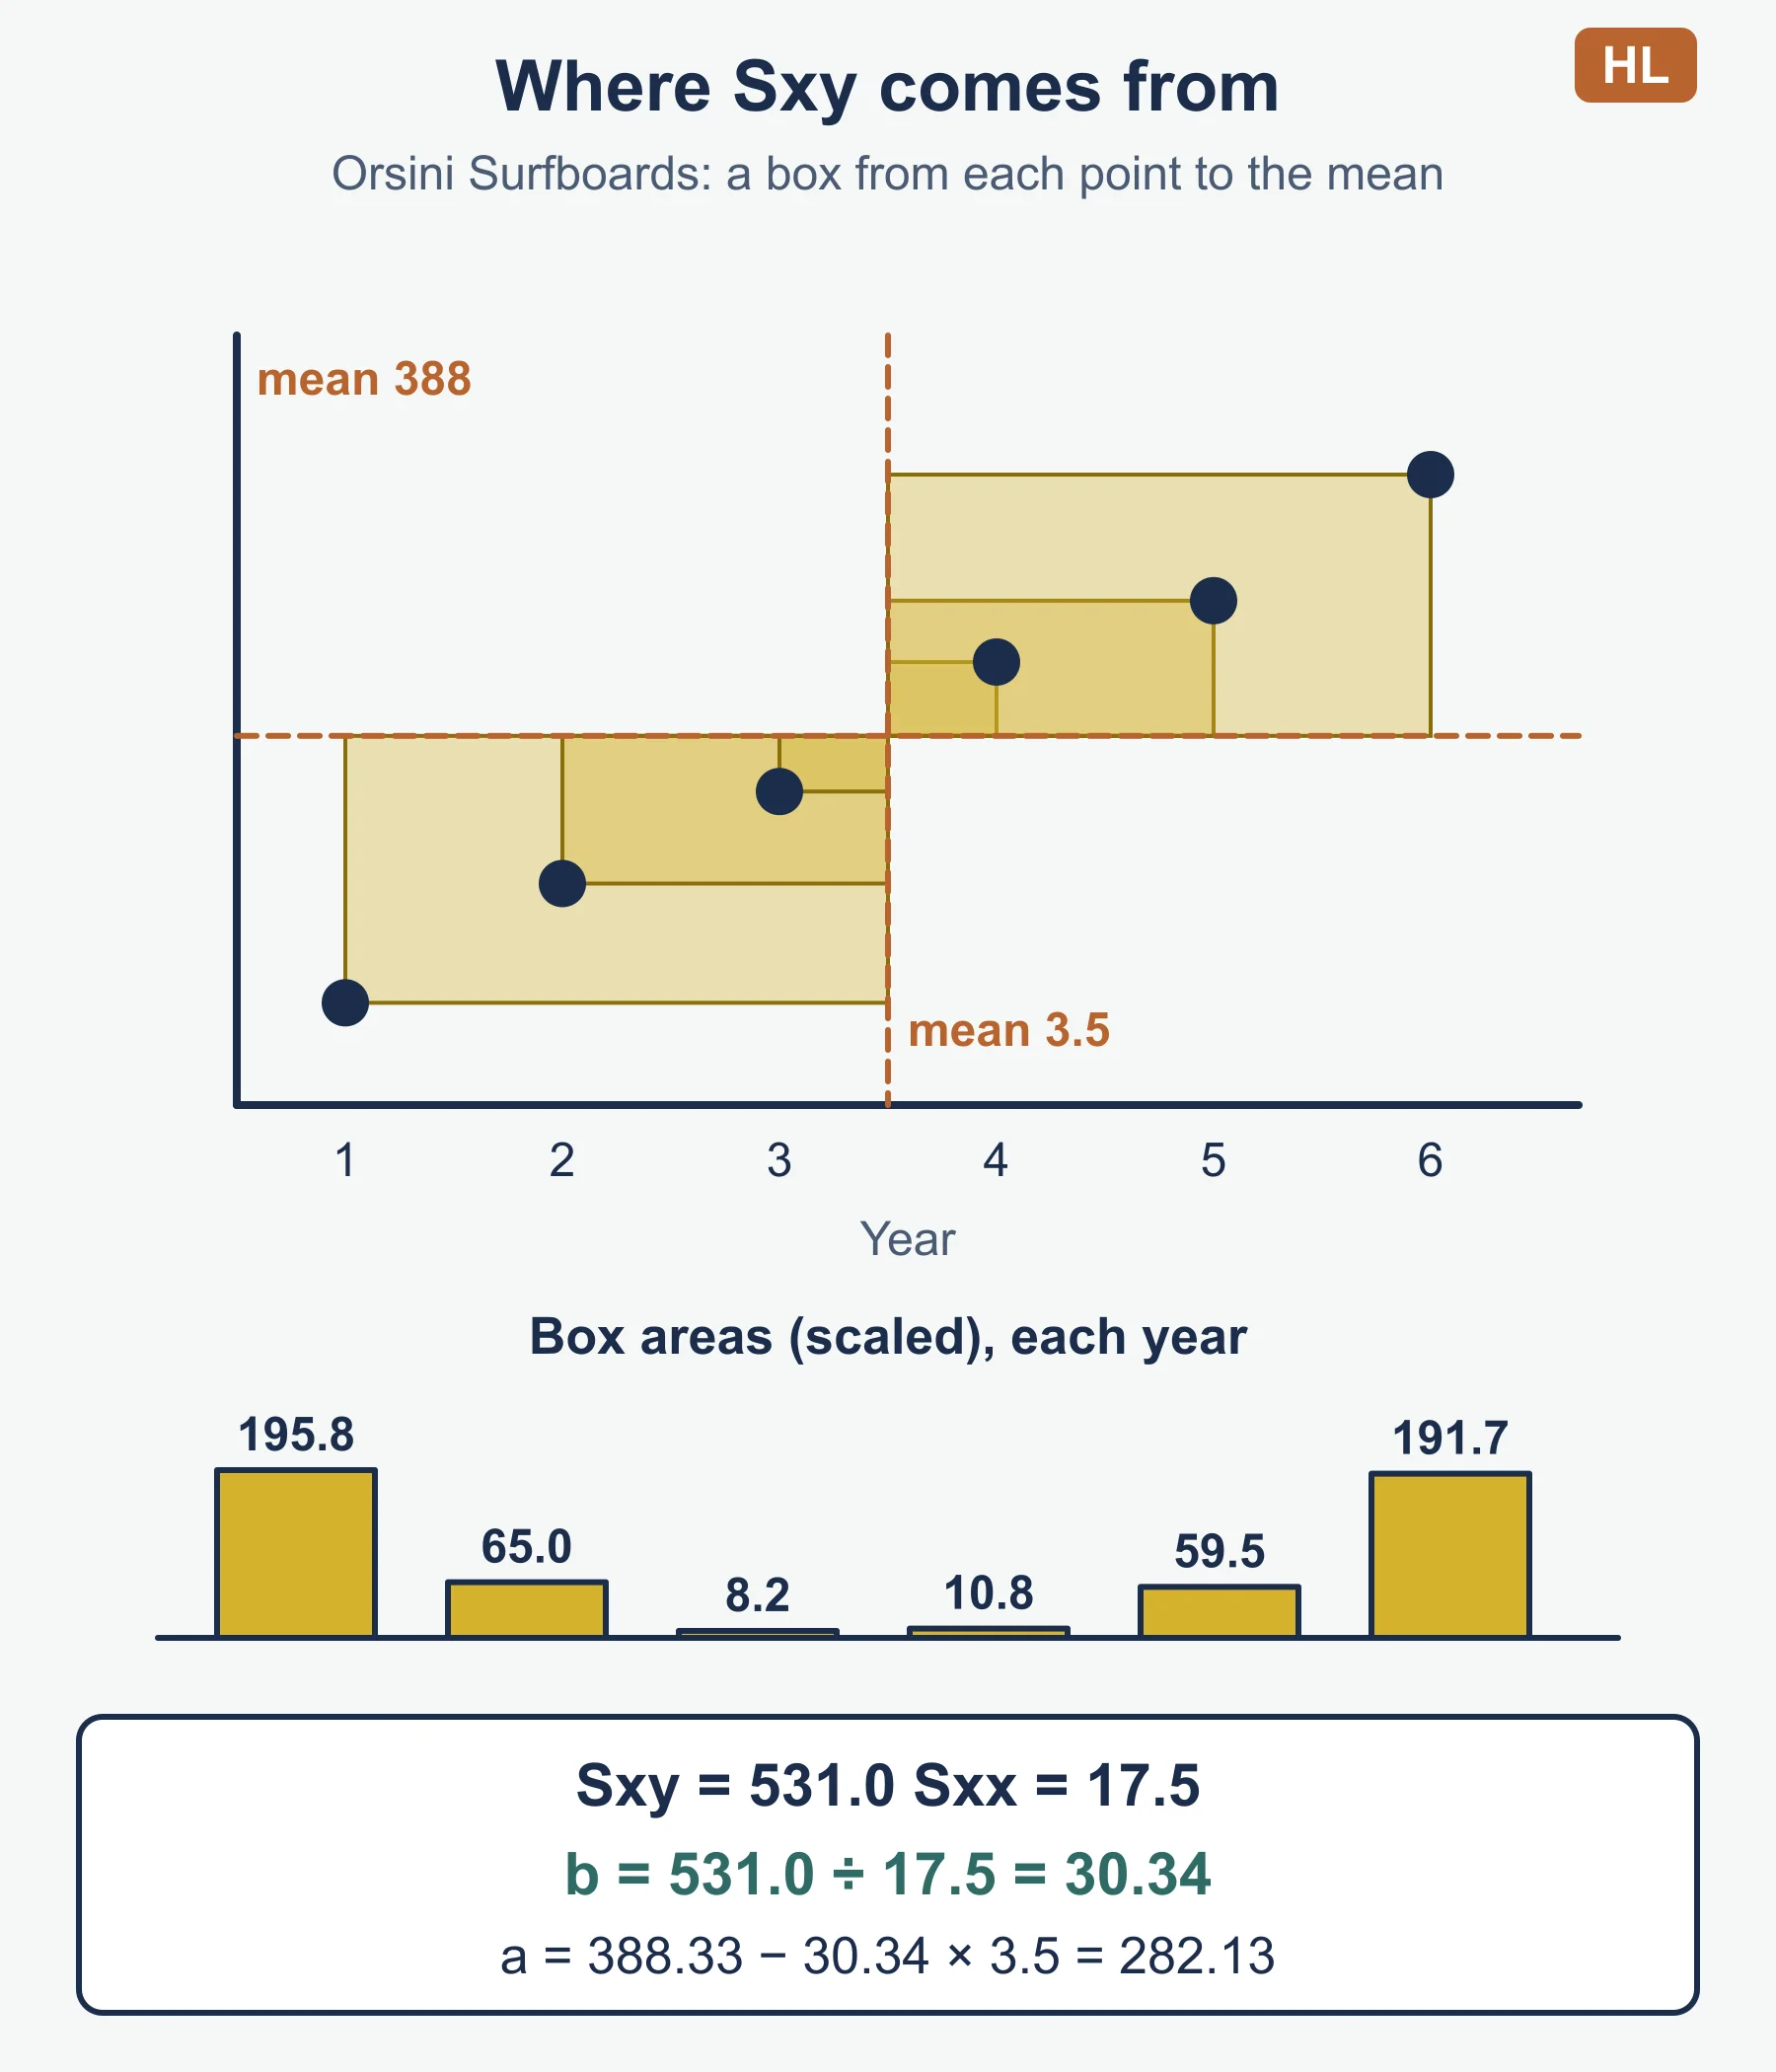
- Line of best fit. Draw the straight line that follows the points most closely. In standard form it is y = a + bx, where b is the gradient (the change in sales per year) and a is the value where the line meets the vertical axis. The standard least-squares results are b = Sxy / Sxx and a = ȳ − b·x̄, where Sxy is the sum of (x − x̄)(y − ȳ) and Sxx is the sum of (x − x̄)².
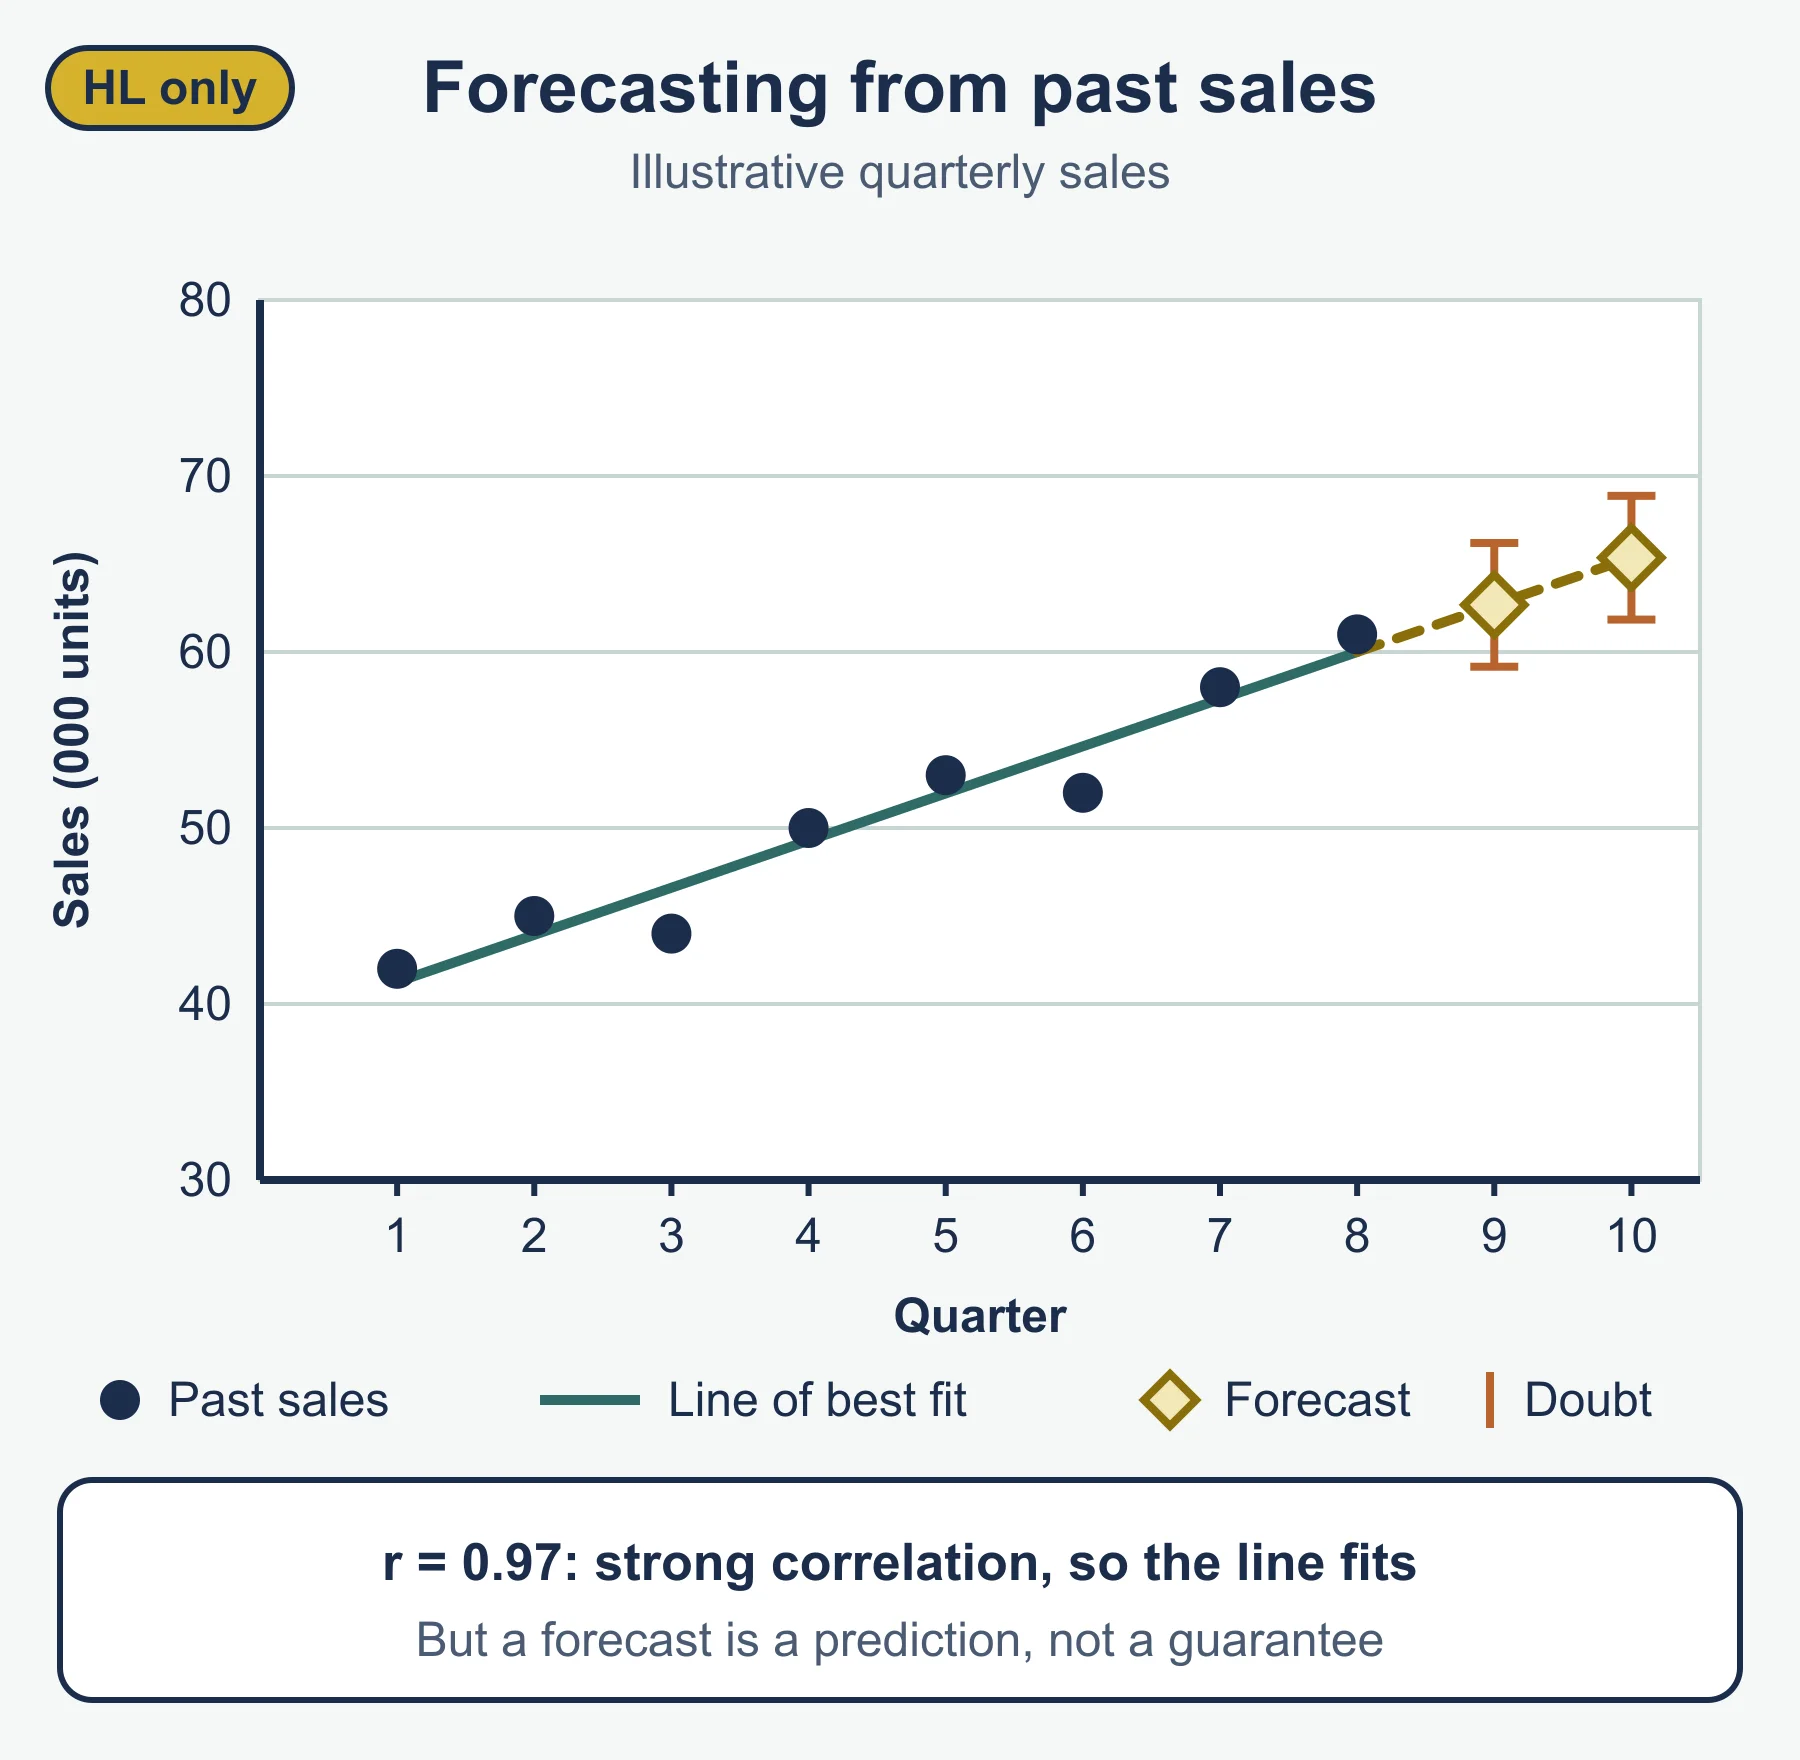
- Correlation. Correlation describes how closely the points follow a straight line. The standard correlation coefficient r lies between −1 and +1. Values near +1 show strong positive correlation, values near −1 show strong negative correlation, and values near 0 show little linear relationship.
- Extrapolation. Extending the line beyond the data to predict a future value. Reading a value inside the data range is interpolation. Extrapolation is the riskier of the two, especially far from the last data point.
Worked example 1: a strong trend
Orsini Surfboards recorded these annual sales.
| Year (x) | 1 | 2 | 3 | 4 | 5 | 6 |
|---|---|---|---|---|---|---|
| Boards sold (y) | 310 | 345 | 372 | 410 | 428 | 465 |
Step 1. x̄ = 3.5 and ȳ = 388.33.
Step 2. Sxy = 531.0 and Sxx = 17.5, summing the products of the deviations from each mean.
Step 3. b = 531.0 / 17.5 = 30.34, so sales rose by about 30 boards per year.
Step 4. a = 388.33 − 30.34 × 3.5 = 282.13.
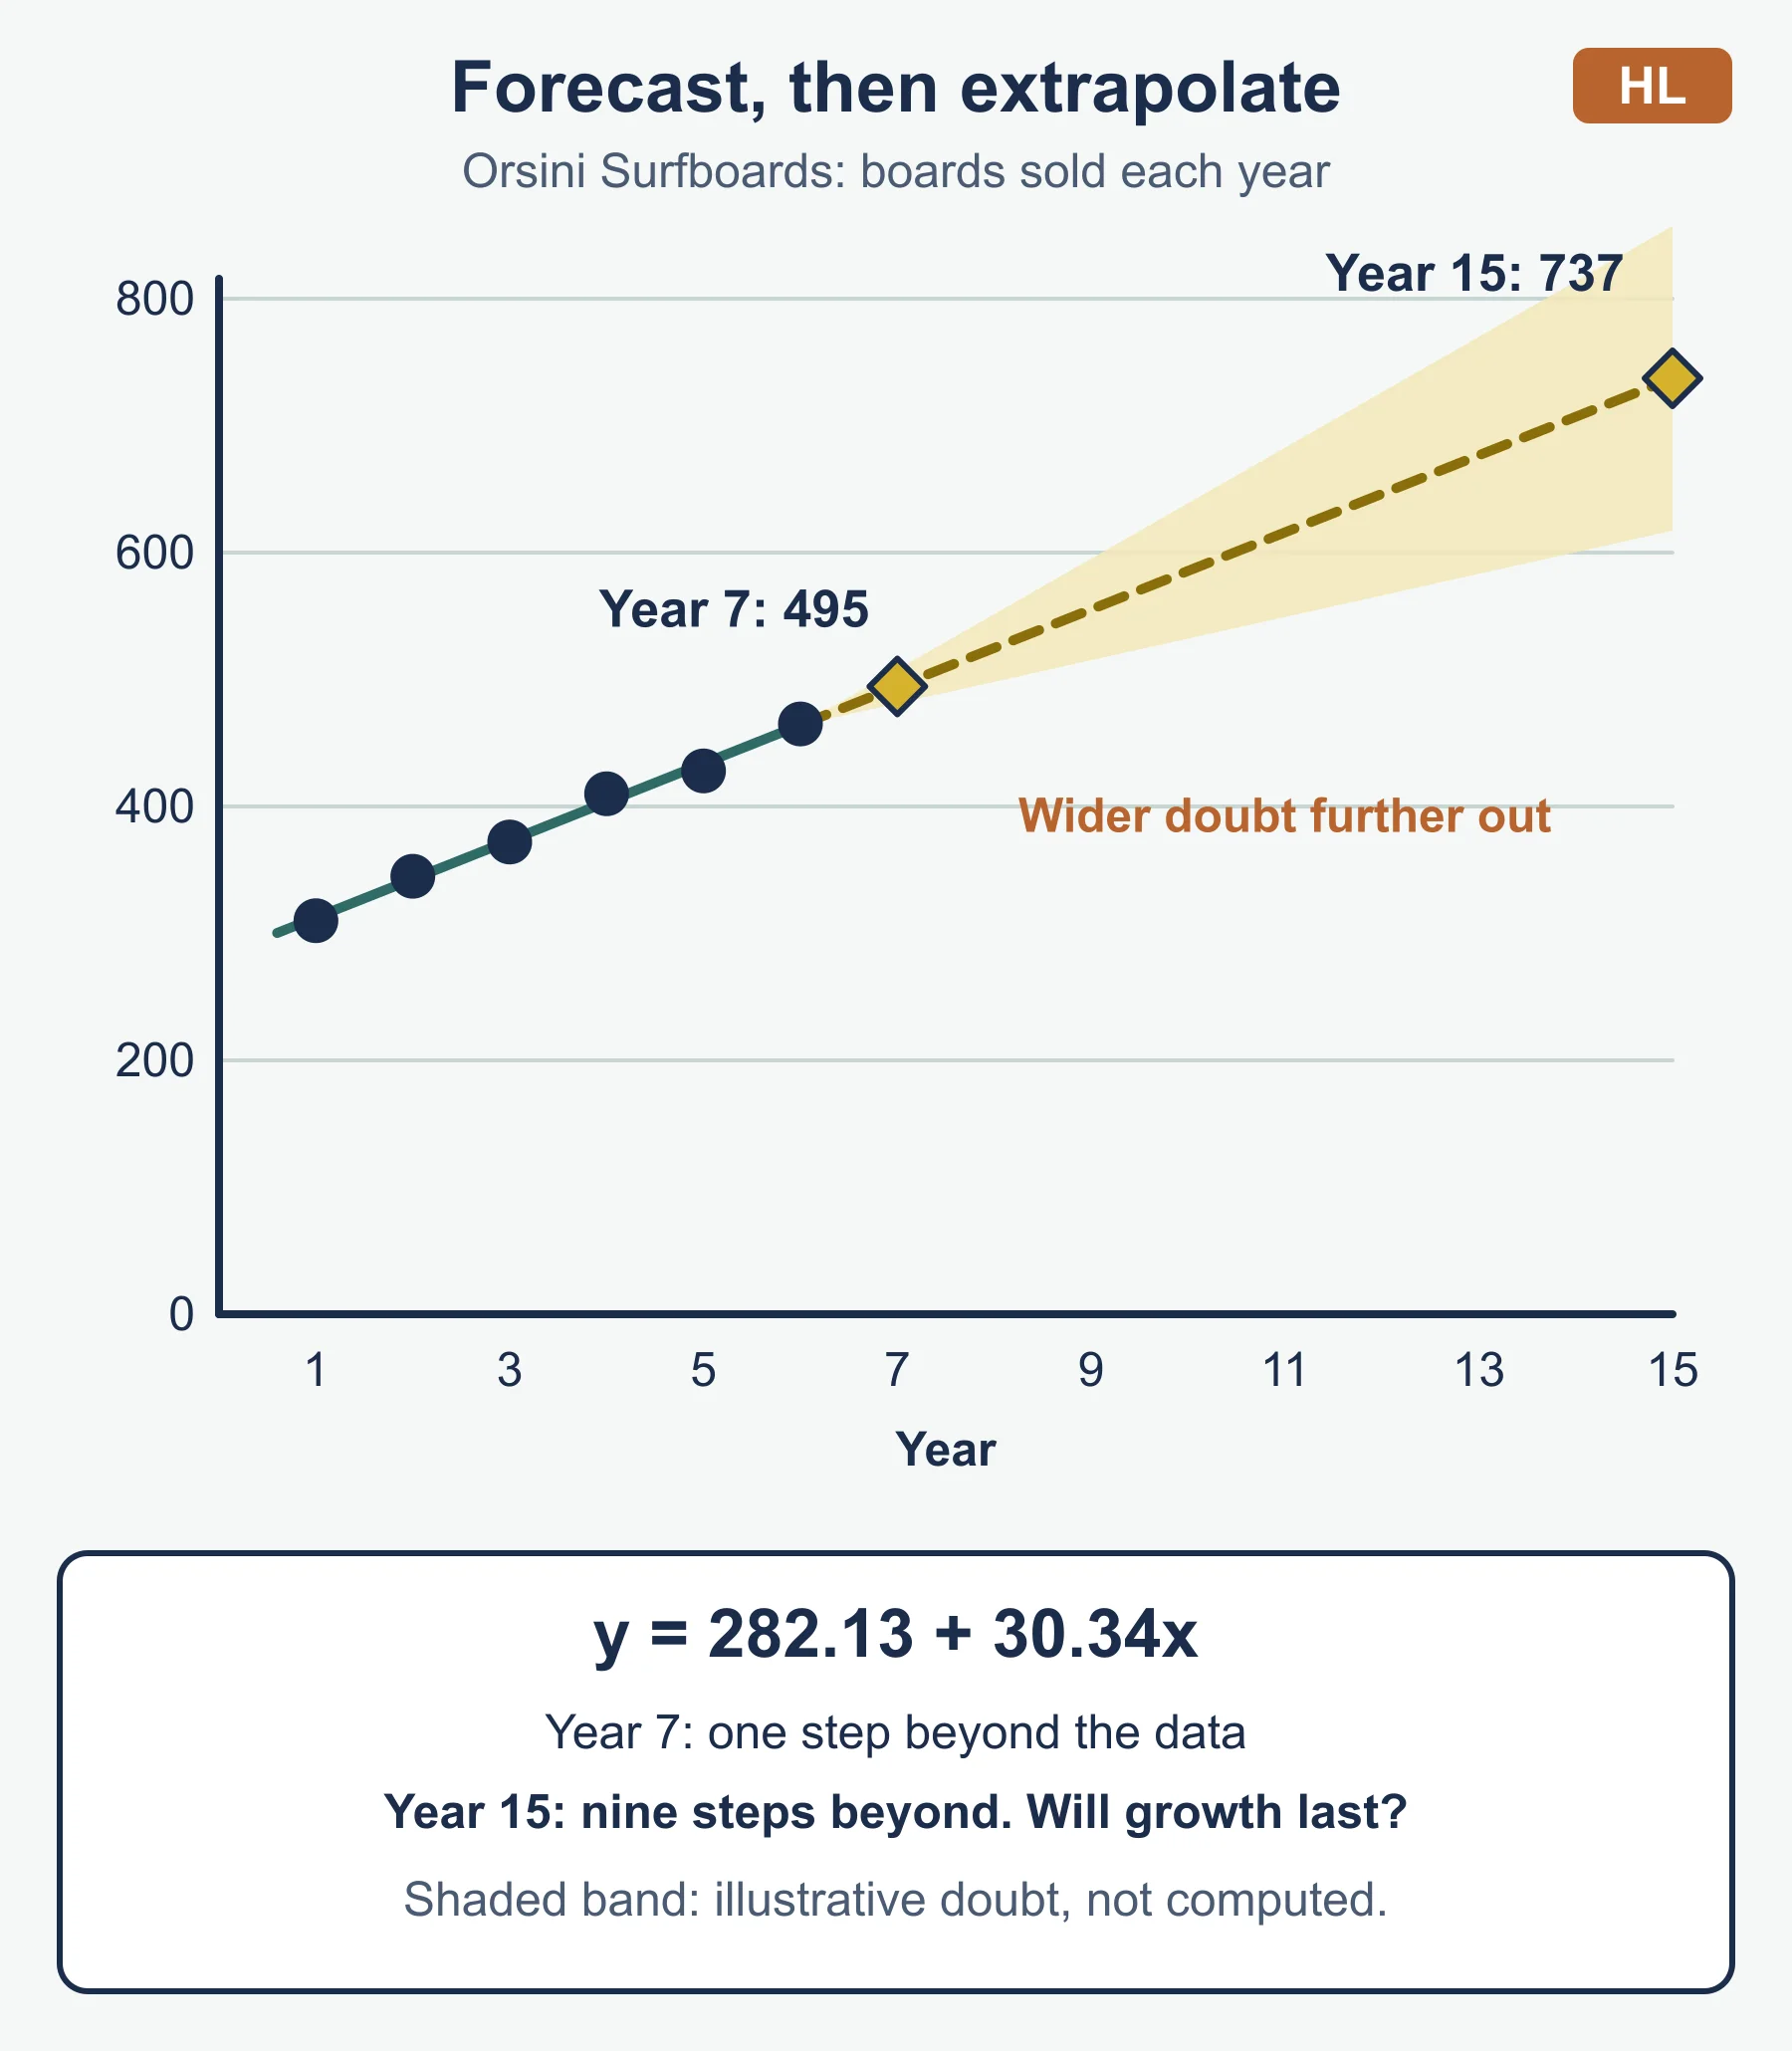
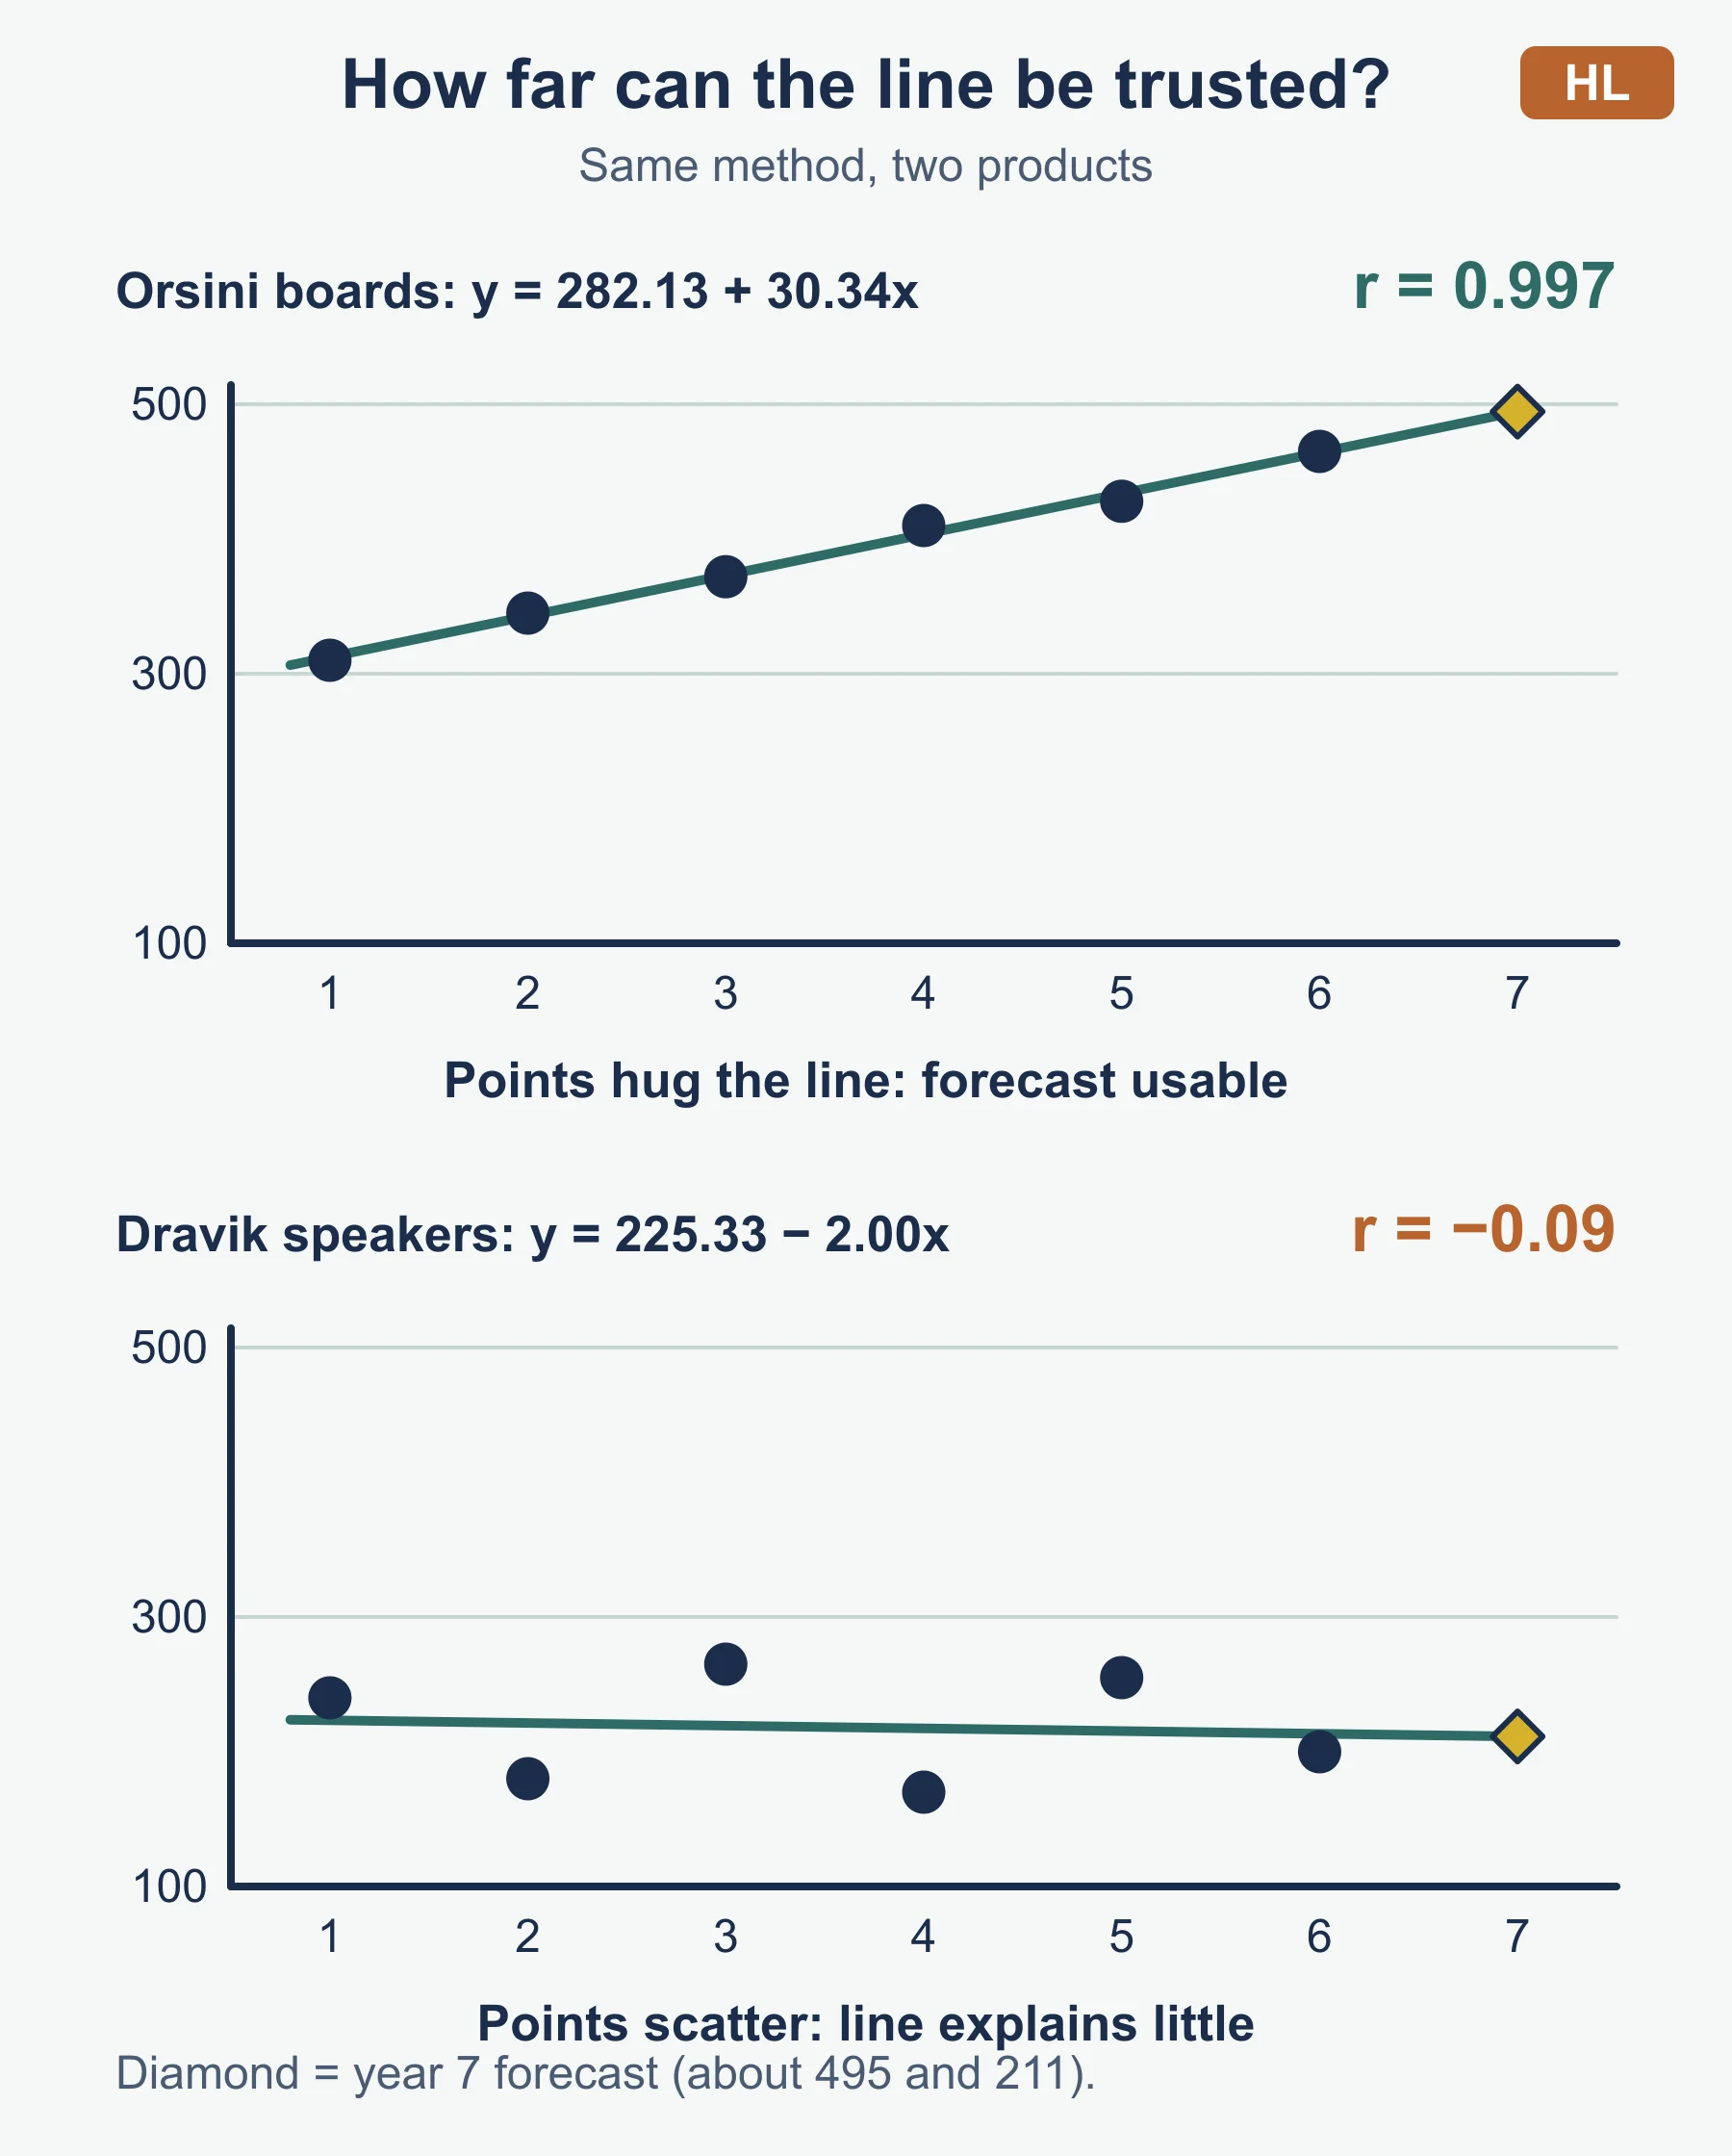
Step 5. The line is y = 282.13 + 30.34x. For year 7, y = 282.13 + 30.34 × 7 = 494.5, so the forecast is about 495 boards.
Step 6. The correlation coefficient is r = 0.997, a very strong positive correlation. The points sit close to the line, which supports the forecast one year ahead.
Step 7. Extrapolate far ahead and the reliability falls. The same line gives about 737 boards in year 15, but nothing in six years of data shows that the market will keep growing at a steady 30 boards a year for nine more years. Surfboards may saturate the local market, a competitor may enter, or tastes may move.
Worked example 2: a weak relationship
Dravik Audio sold a portable speaker over six years.
| Year (x) | 1 | 2 | 3 | 4 | 5 | 6 |
|---|---|---|---|---|---|---|
| Speakers sold (y) | 240 | 180 | 265 | 170 | 255 | 200 |
The line of best fit is y = 225.33 − 2.00x and r = −0.09. The points zigzag around a mean of about 218 with no clear trend. The line predicts about 211 for year 7, but the correlation is so close to zero that the line explains almost none of the variation. Using this as a firm forecast would be unwise. A better response is to collect more information (for example, what happened in the high and low years) before committing to production.
Using the benefits and limitations in an evaluation
AO3 marks reward a judgement supported by the case, not a general list. A useful structure is:
- State a benefit and tie it to the business (name the decision it supports).
- State a limitation and tie it to the business (name the feature of the market or the data that causes it).
- Weigh them using factors from the case.
- Reach a conclusion and justify it.
Factors that often decide the weighing:
- Stability of the market. A mature market with steady demand suits forecasting better than a fashion or technology market.
- Length of the horizon. A forecast for next month carries less risk than one for five years.
- Cost of being wrong. If errors mean large unsold stock or lost customers, the forecast needs more care. If production can be changed quickly, errors cost less.
- Quality and amount of data. Many years of data with a high correlation support the forecast more than a few erratic years.
- Flexibility. A business with spare capacity, short supplier lead times or a flexible workforce can cope with forecast error more easily.
Worked example 3: short evaluation
Question: Evaluate the usefulness of the regression forecast to Orsini Surfboards.
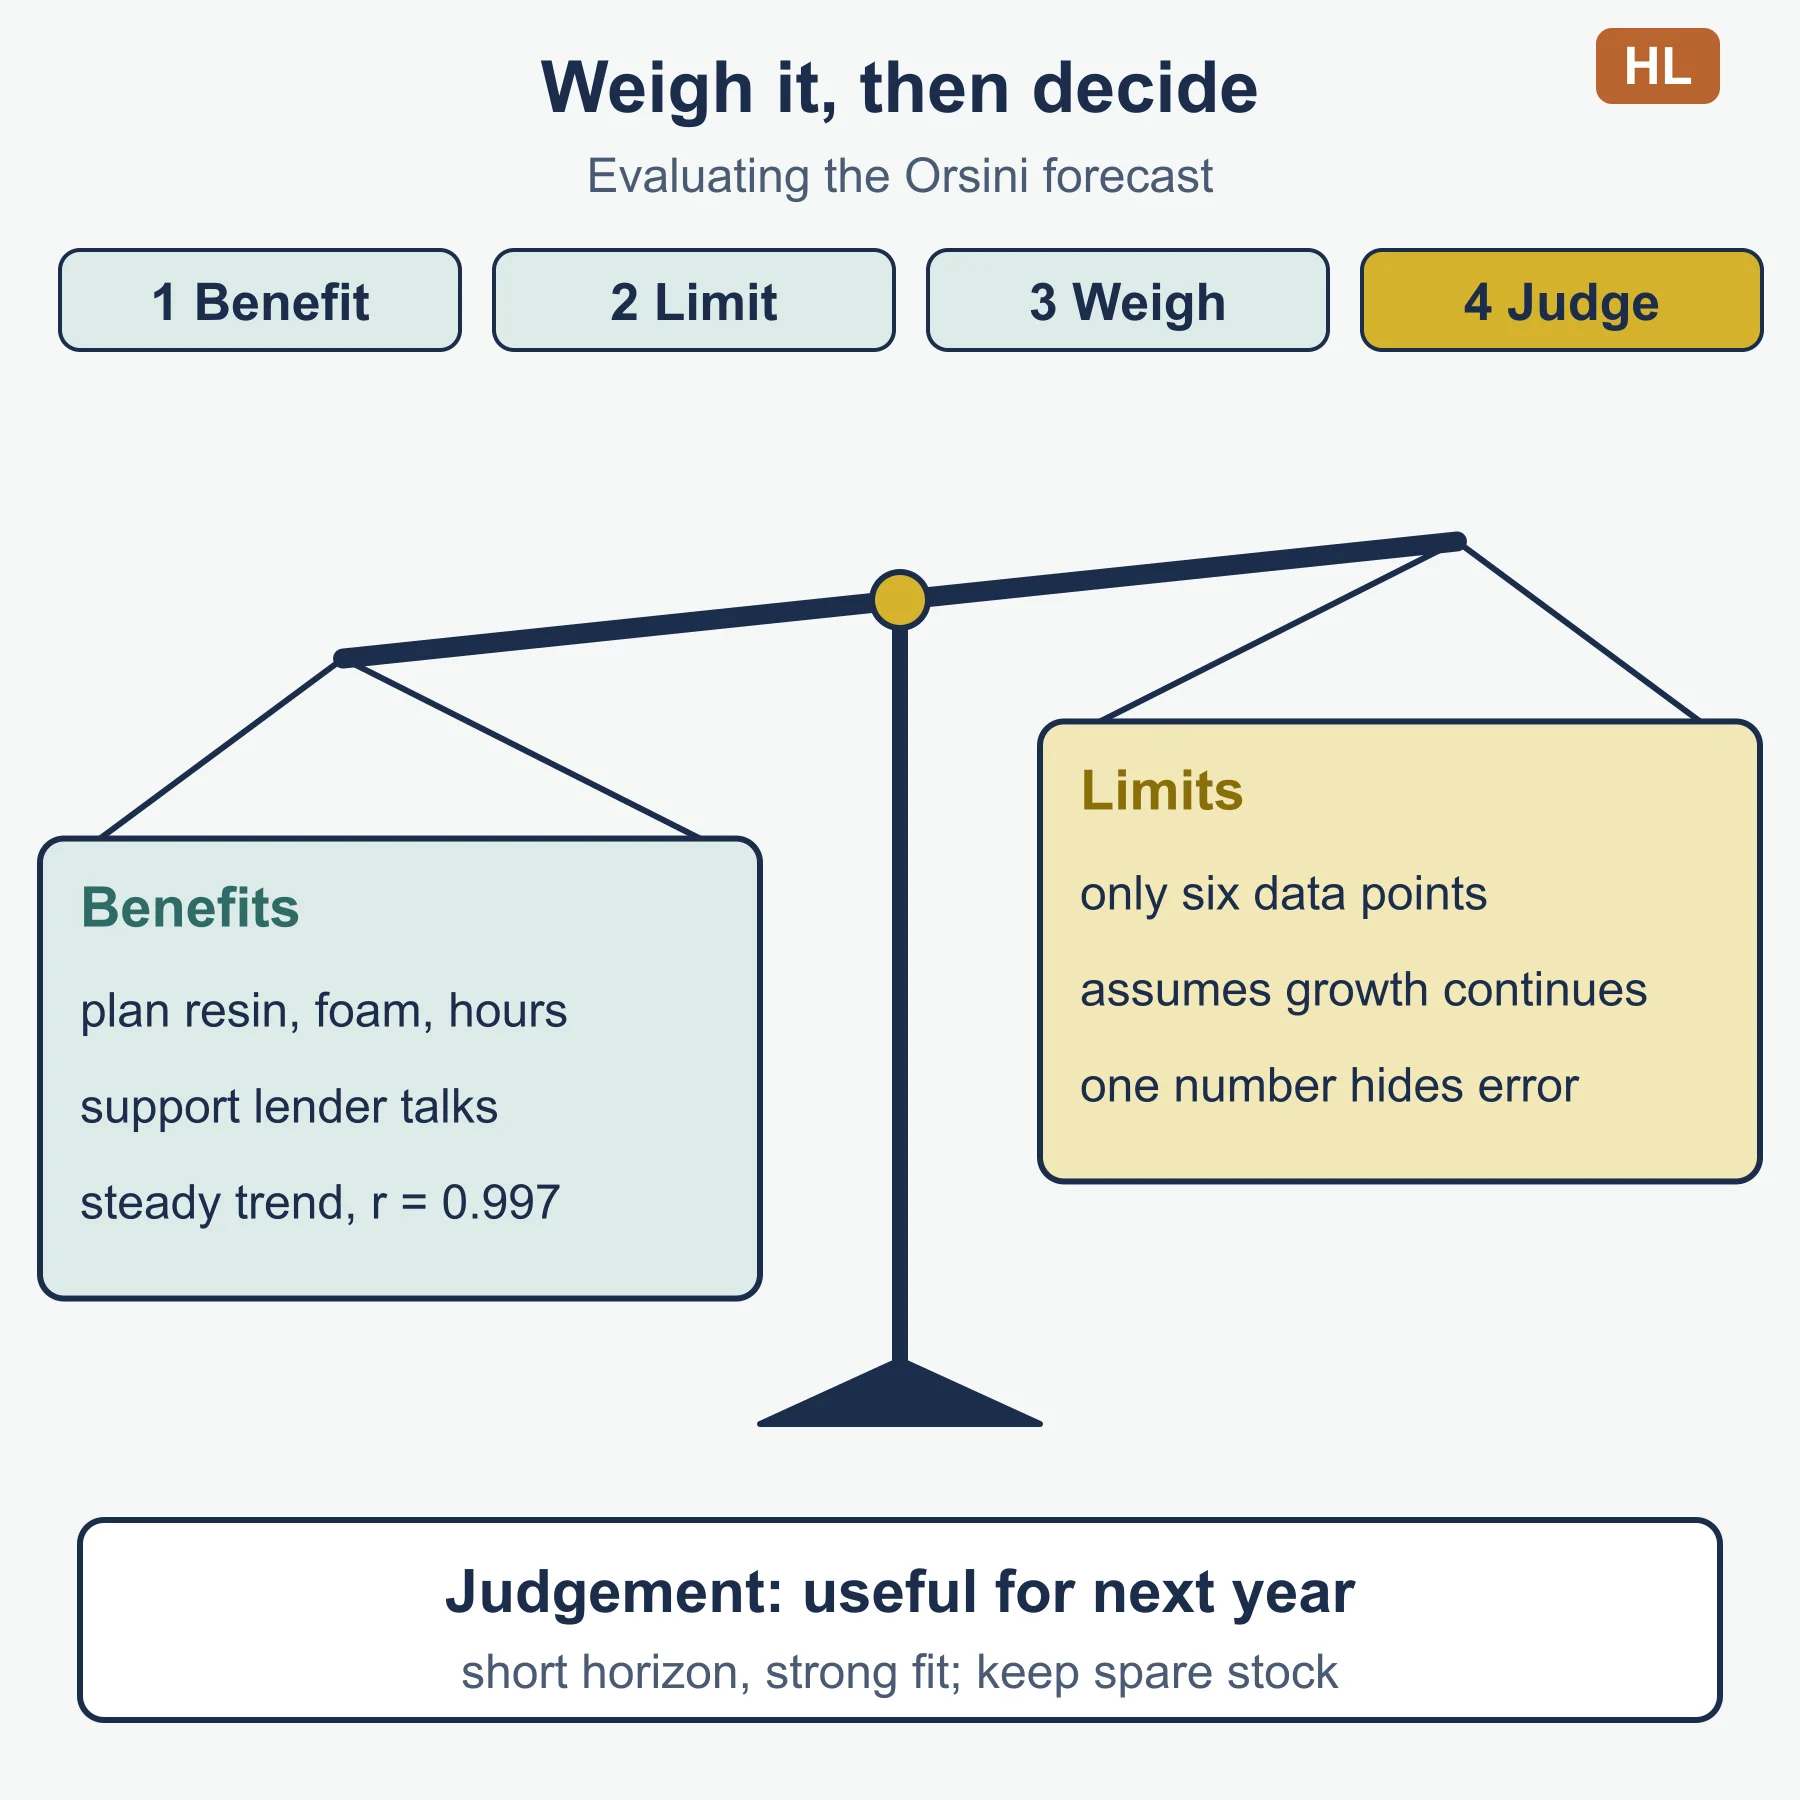
Answer outline. The forecast of about 495 boards for year 7 helps the firm plan resin, foam blanks and workshop hours, and it can support a conversation with a lender because it rests on six years of data. The correlation of 0.997 suggests the trend has been steady. However, six points is a small data set, and the line assumes the past rate of growth carries on. A new competitor, a poor summer or a rise in input costs could cut sales below the line. The forecast is also a single figure, so it hides how far real sales could differ from it. Overall, the forecast is useful for next year’s plan because the horizon is short and the fit is strong. Orsini should treat it as a central estimate, keep some spare stock and capacity, and check it against actual sales each quarter rather than treat the figure as certain.
Common errors
- Writing a list of benefits and limitations with no link to the business in the case.
- Claiming a high correlation proves the forecast will be right. It only shows that the past data followed a line.
- Extrapolating many periods beyond the data and presenting the result without comment.
- Saying that forecasts are “inaccurate” without saying why, or what the business could do about it.
- Confusing a sales forecast (sales, in units or revenue) with a cash flow forecast (money in and out). The first feeds the second.
- Giving a verdict with no reason, or ending with “it depends” and no judgement.
Where to go next
Work through the practice questions, then use the revision notes for quick recall. The Unit 4 study guide shows how 4.3 sits with the rest of the unit, and the free diagnostics help you find your weak areas.
Frequently asked questions
What is a sales forecast? A sales forecast is a prediction of the sales a business expects over a future period, stated in units, revenue or both. It is often the starting point for production, staffing, marketing and cash flow plans.
What are the benefits of sales forecasting? Sales forecasting supports production and stock planning, cash flow and finance, human resource planning, marketing planning, and targets for managers and sales teams. It reduces uncertainty compared with planning from guesswork.
What are the limitations of sales forecasting? Forecasts rely on past data, can be upset by external changes and unexpected events, become less reliable over longer horizons, and can be distorted by small data sets or bias. A precise-looking number can also give false confidence.
When is a sales forecast most useful? A forecast is more useful in a stable, mature market, over a short horizon, with many years of good data, and where the business can adjust if it is wrong. It is less useful where tastes or technology change fast or the cost of error is high.
Official syllabus
IB Diploma Programme Business management guide, first assessment 2024, published by the International Baccalaureate Organization. This page follows section 4.3 (HL only) and the business management tools listing for simple linear regression (HL only).
Get free revision emails (optional)
Occasional emails with practice questions, worked explanations and links to free resources for the qualification and subjects you choose. No spam, and you can unsubscribe from any email. The free tools on this site never need an email.
Related resources
-
Practice questions
IB DP Business Management: Sales forecasting (HL only) – Practice Questions
Original practice questions with worked answers on sales forecasting and simple linear regression for IB DP Business Management HL, section 4.3.
Business · International Baccalaureate · IB
Try questions -
Revision notes
IB DP Business Management: Sales forecasting (HL only) – Revision Notes
Condensed revision notes on sales forecasting benefits, limitations and simple linear regression, with a self-test, for IB Business Management HL.
Business · International Baccalaureate · IB
Revise topic -
Study guides
IB DP Business Management: The seven Ps of the marketing mix
Study guide to section 4.5 of IB DP Business Management: product, price, promotion, place, people, processes, physical evidence and marketing mixes.
Business · International Baccalaureate · IB
Read guide
Related articles
-
teaching
A Level tuition in Dubai: Cambridge or Pearson Edexcel International A Level?
Schools in Dubai and Abu Dhabi teach either Cambridge International AS & A Level or Pearson Edexcel International A Level. How the two are structured, why it matters for tuition, and how online classes from Lahore work.
9 October 2026
-
curriculum guides
Choosing subjects at IGCSE and A Level
How subject choices at 14 and 16 affect university options later, and how to keep pathways open without overloading a timetable.
28 July 2026
Studying this with a teacher
Working through Business IB?
This page is free and stays free. If you would rather be taught it, Marlbridge runs Business classes one-to-one, online in your own time zone. The first trial class is free. WhatsApp replies within an hour (8am–11pm Pakistan time, every day); email the same day.
IB Business teachers at Marlbridge

