
Revision Notes
IB DP Business Management: Introduction to marketing and Marketing planning – Revision Notes
Condensed IB DP Business Management revision notes for 4.1 and 4.2: share and growth formulas, STP, niche versus mass, USP and differentiation.
- Subject
- Business
- Level
- IB
- Topic
- Unit 4: Marketing
- Author
- Marlbridge Academic Team
- Updated
- Reviewed by
- Salman Ahmad (what this means)
Aligned to International Baccalaureate IB Diploma Programme Business (DP Business Management), First assessment 2024. Official specification .
Syllabus page (what it covers and how it is assessed): IB Diploma Programme Business.
Syllabus points this page covers
DP Business Management
- 4.1 Introduction to marketing
- 4.2 Marketing planning
Found an error? Report a correction.
Need help with this topic? Request a free trial class for IB Diploma Programme Business (DP Business Management).
These notes condense sections 4.1 Introduction to marketing and 4.2 Marketing planning of the IB Business management guide, first assessment 2024, for SL and HL. The one HL-only point (4.1, the importance of market share and market leadership) is labelled. For full explanations and worked examples, read the study guide. Then try the practice questions. Wider unit notes: Unit 4 revision notes. Course hub: IB DP Business Management. Tick-list: printable checklist. Not sure where to start? Take a free 10-minute diagnostic.
Definitions to know
| Term | Meaning in one line |
|---|---|
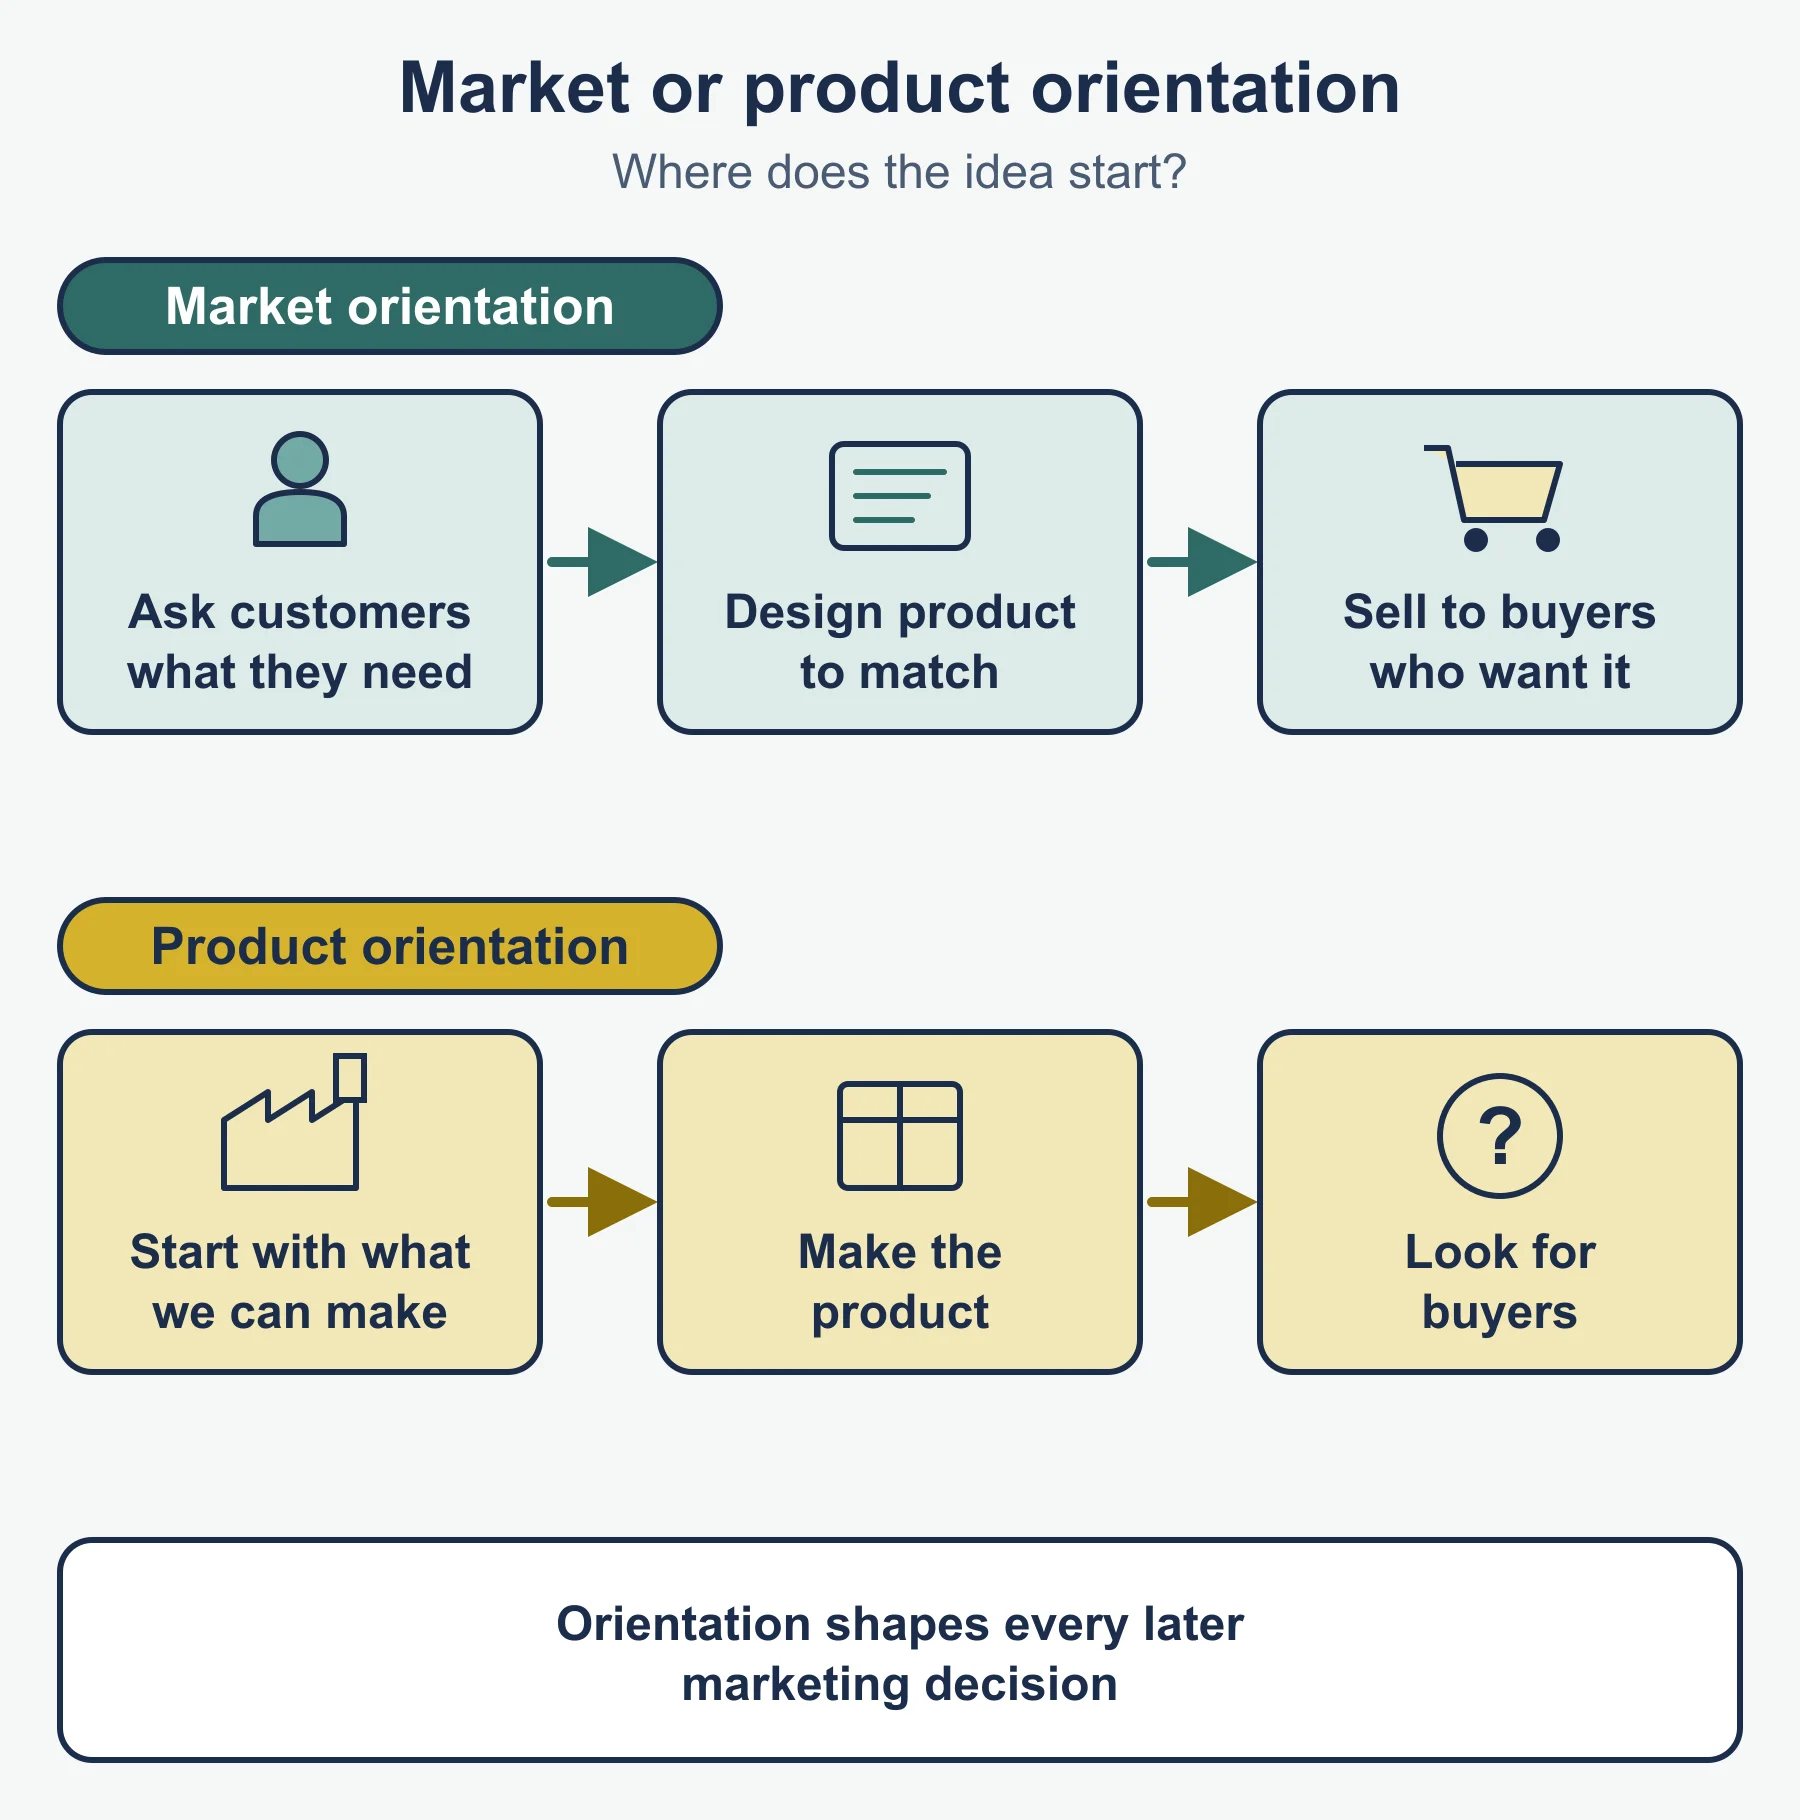
| Market orientation | Decisions start from customer needs found through research |
| Product orientation | Decisions start from what the business can make; buyers are sought afterwards |
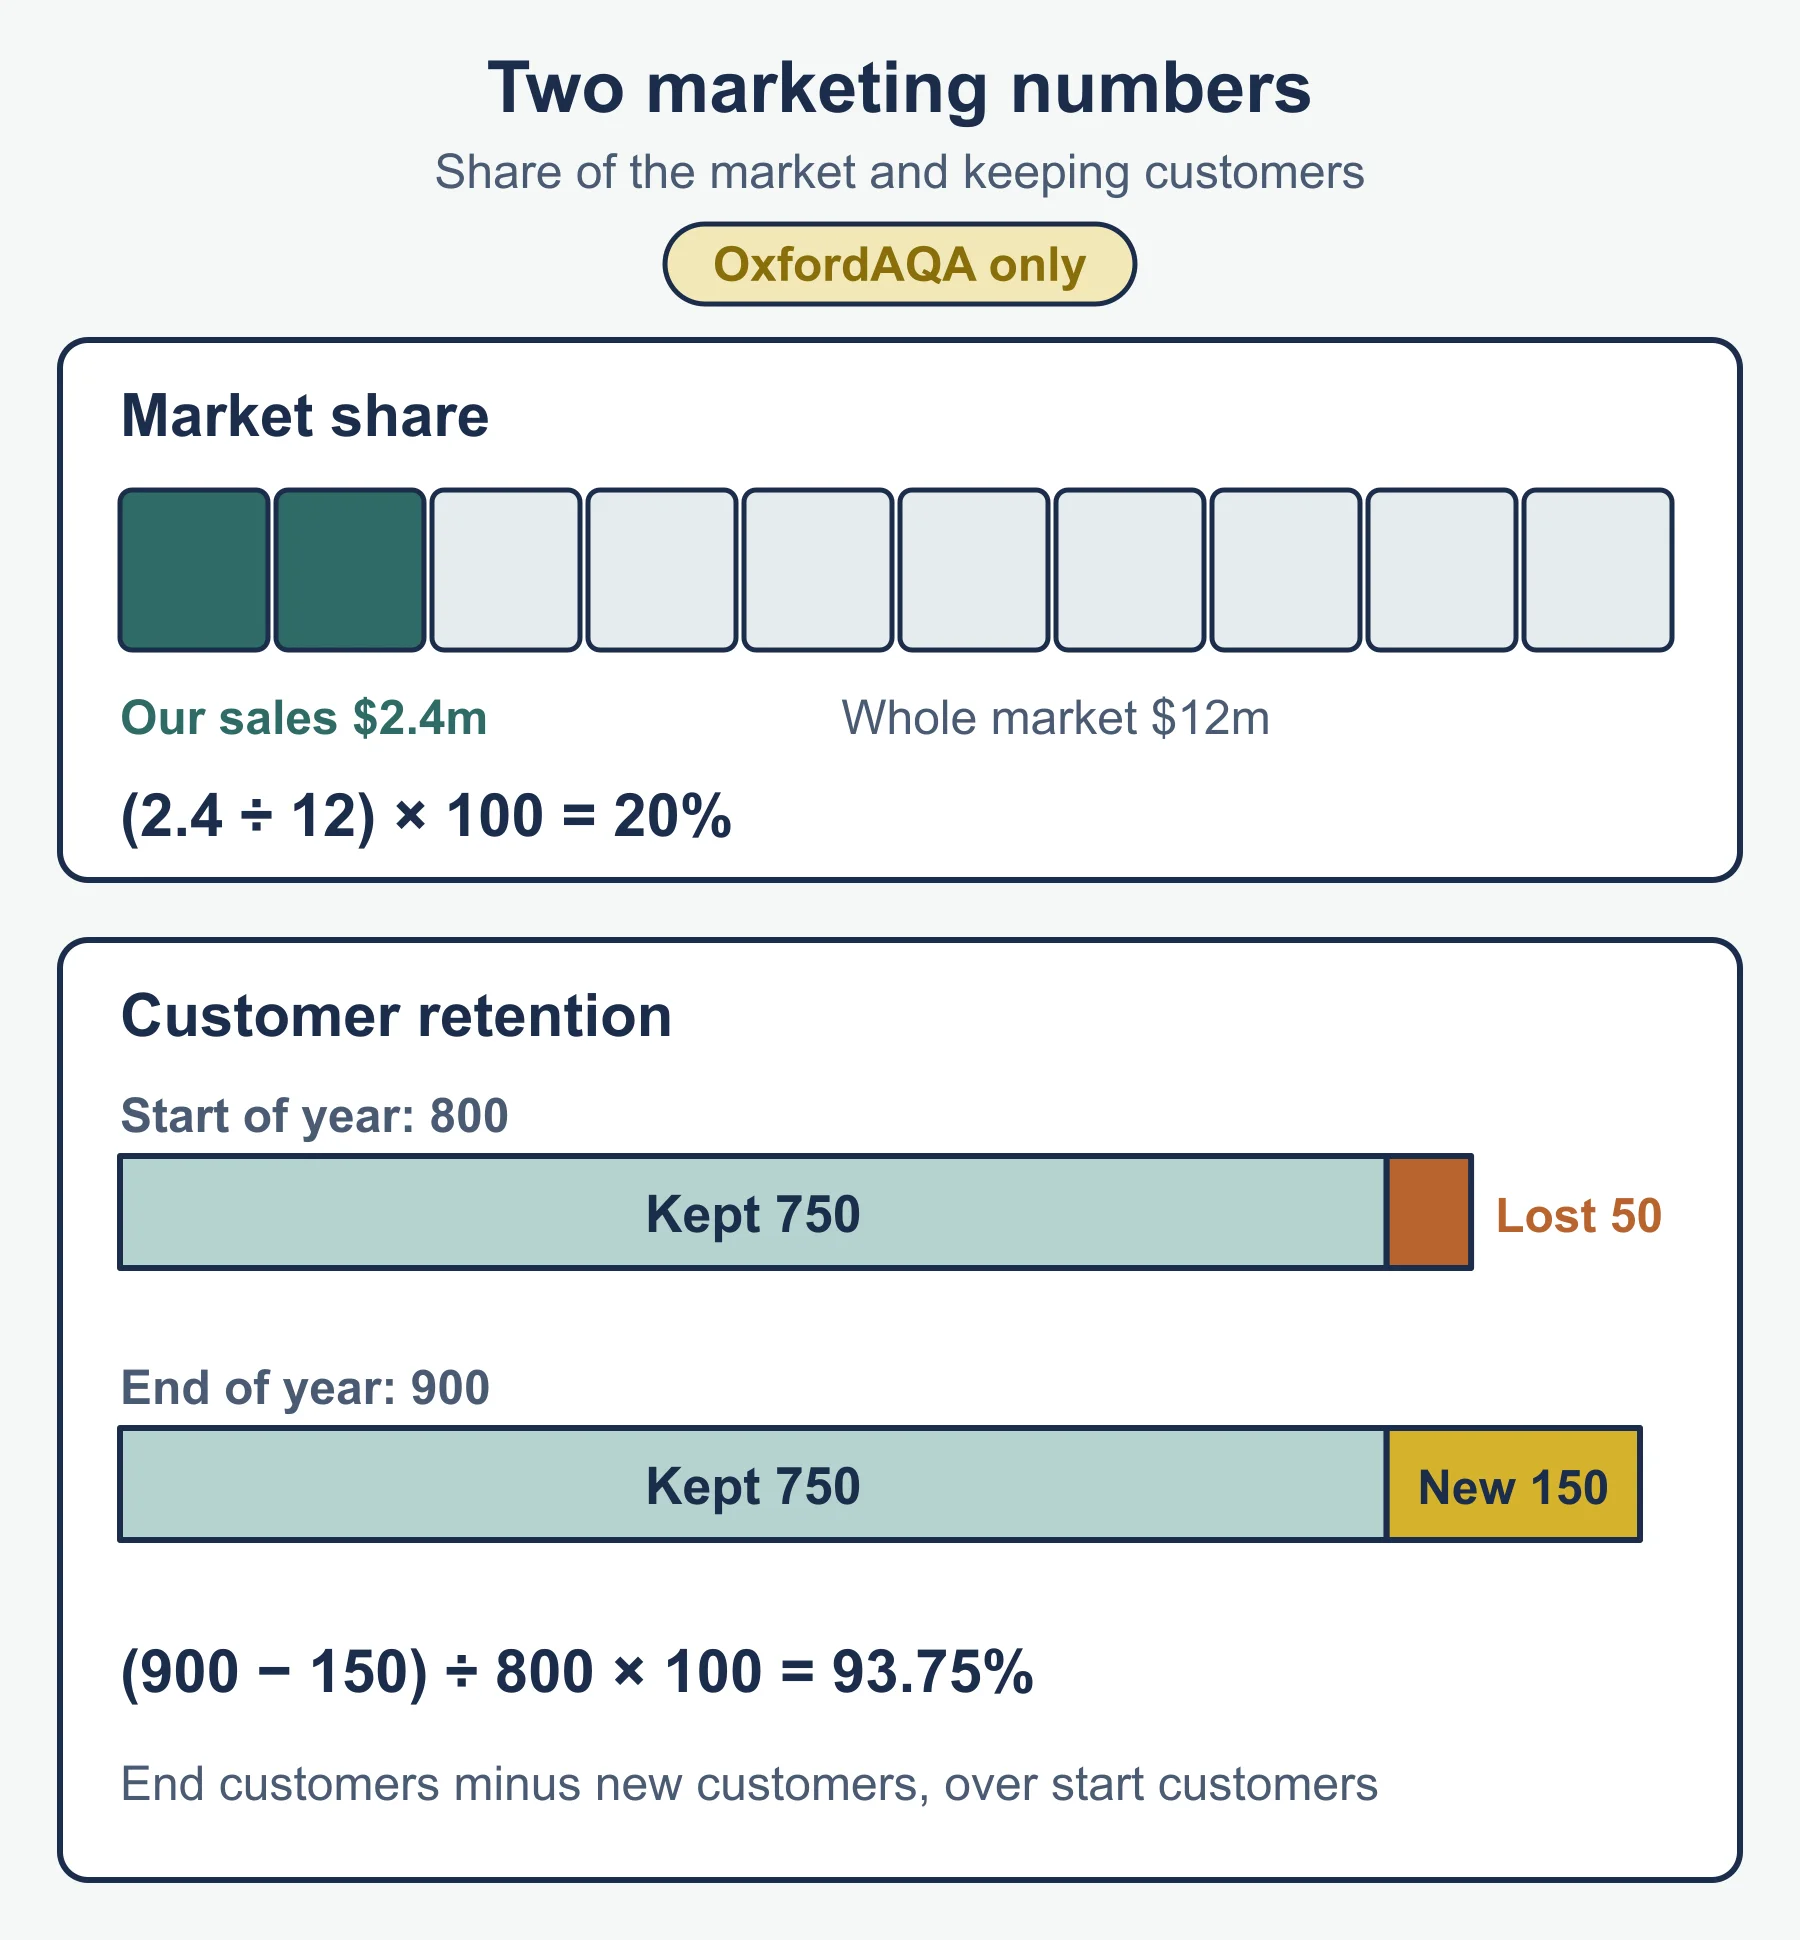
| Market share | A business’s slice of total sales in its market, as a percentage |
| Market growth | Percentage change in total market sales between two periods |
| Market leader (HL only) | The business with the largest share of its market |
| Marketing planning | Turning overall objectives into marketing aims, actions, budgets and timings |
| Segmentation | Dividing a market into groups with shared needs or characteristics |
| Targeting | Choosing which segment(s) to serve: the target market |
| Positioning | How customers see the product compared with rivals; shown on a position map |
| Niche market | Small, specialized segment with distinct needs |
| Mass market | Large market of customers with broadly similar needs |
| USP | Feature or benefit that sets a product apart in a way customers value |
| Differentiation | Making an offer different from rivals’ in ways customers notice |
Formulas (standard forms)
The guide lists market share and market growth as content but does not print formulas, so these are the standard forms.
| Measure | Formula |
|---|---|
| Market share (%) | business’s sales / total market sales x 100 |
| Market growth (%) | (market sales this period - market sales last period) / market sales last period x 100 |
| Sales needed for a target share | target share (as a decimal) x expected market sales |
Keep the measure (revenue or units) and the period the same on both parts of each calculation.
Method in steps: share and growth
- Write down the market totals for each period and the business’s own sales.
- Calculate market growth first, so you know the pace of the market.
- Calculate the share in each period using that period’s market total.
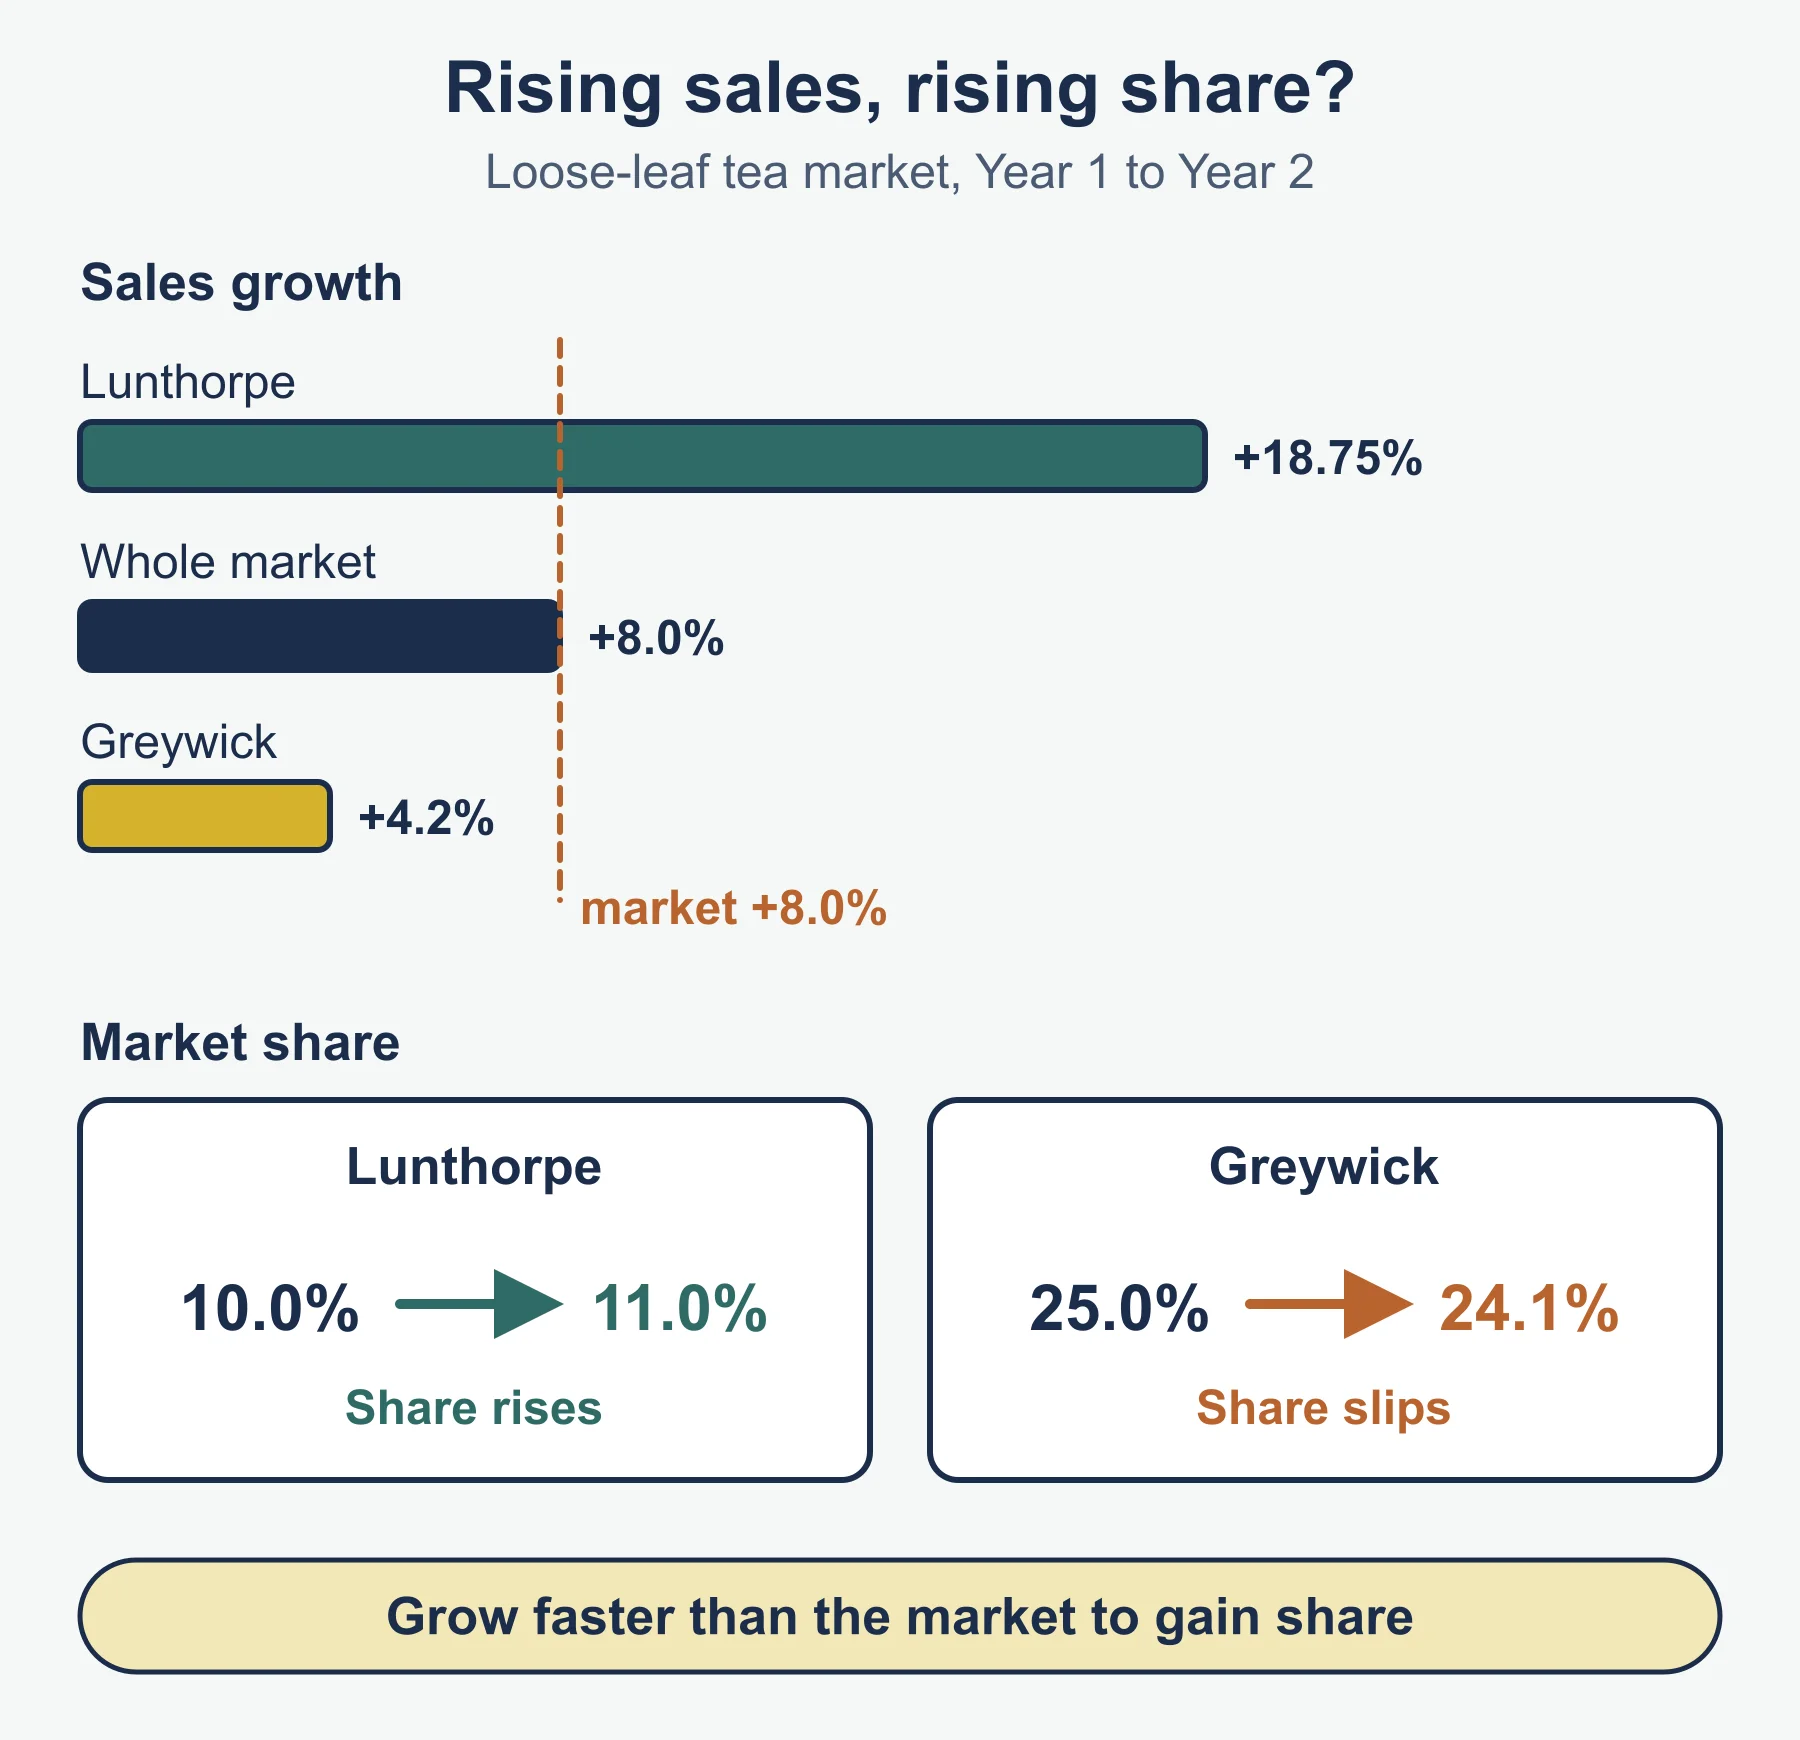
- Compare: if business sales grew faster than the market, share rose; if slower, share fell.
- Comment in context. Mention percentage points when comparing two shares, and say what the result means for the business.
Worked reminder: Ilkesby Candles
Market sales rose from USD 25.0 million to USD 26.5 million. Ilkesby’s sales rose from USD 2.5 million to USD 2.65 million.
Market growth = (26.5 - 25.0) / 25.0 x 100 = 6.0%
Share Y1      = 2.5  / 25.0 x 100          = 10.0%
Share Y2      = 2.65 / 26.5 x 100          = 10.0%
Sales growth  = (2.65 - 2.5) / 2.5 x 100   = 6.0%
Ilkesby grew exactly as fast as its market, so its share did not move even though sales rose. Growth in line with the market means standing still in share terms.
4.1 at a glance
- Market orientation: research first, then design, price and promote to match. Lowers the risk of an unwanted product; costs time and money; may miss needs customers cannot yet express.
- Product orientation: product first, buyers second. Can lead to innovation; risks weak demand and extra promotion spend to persuade buyers.
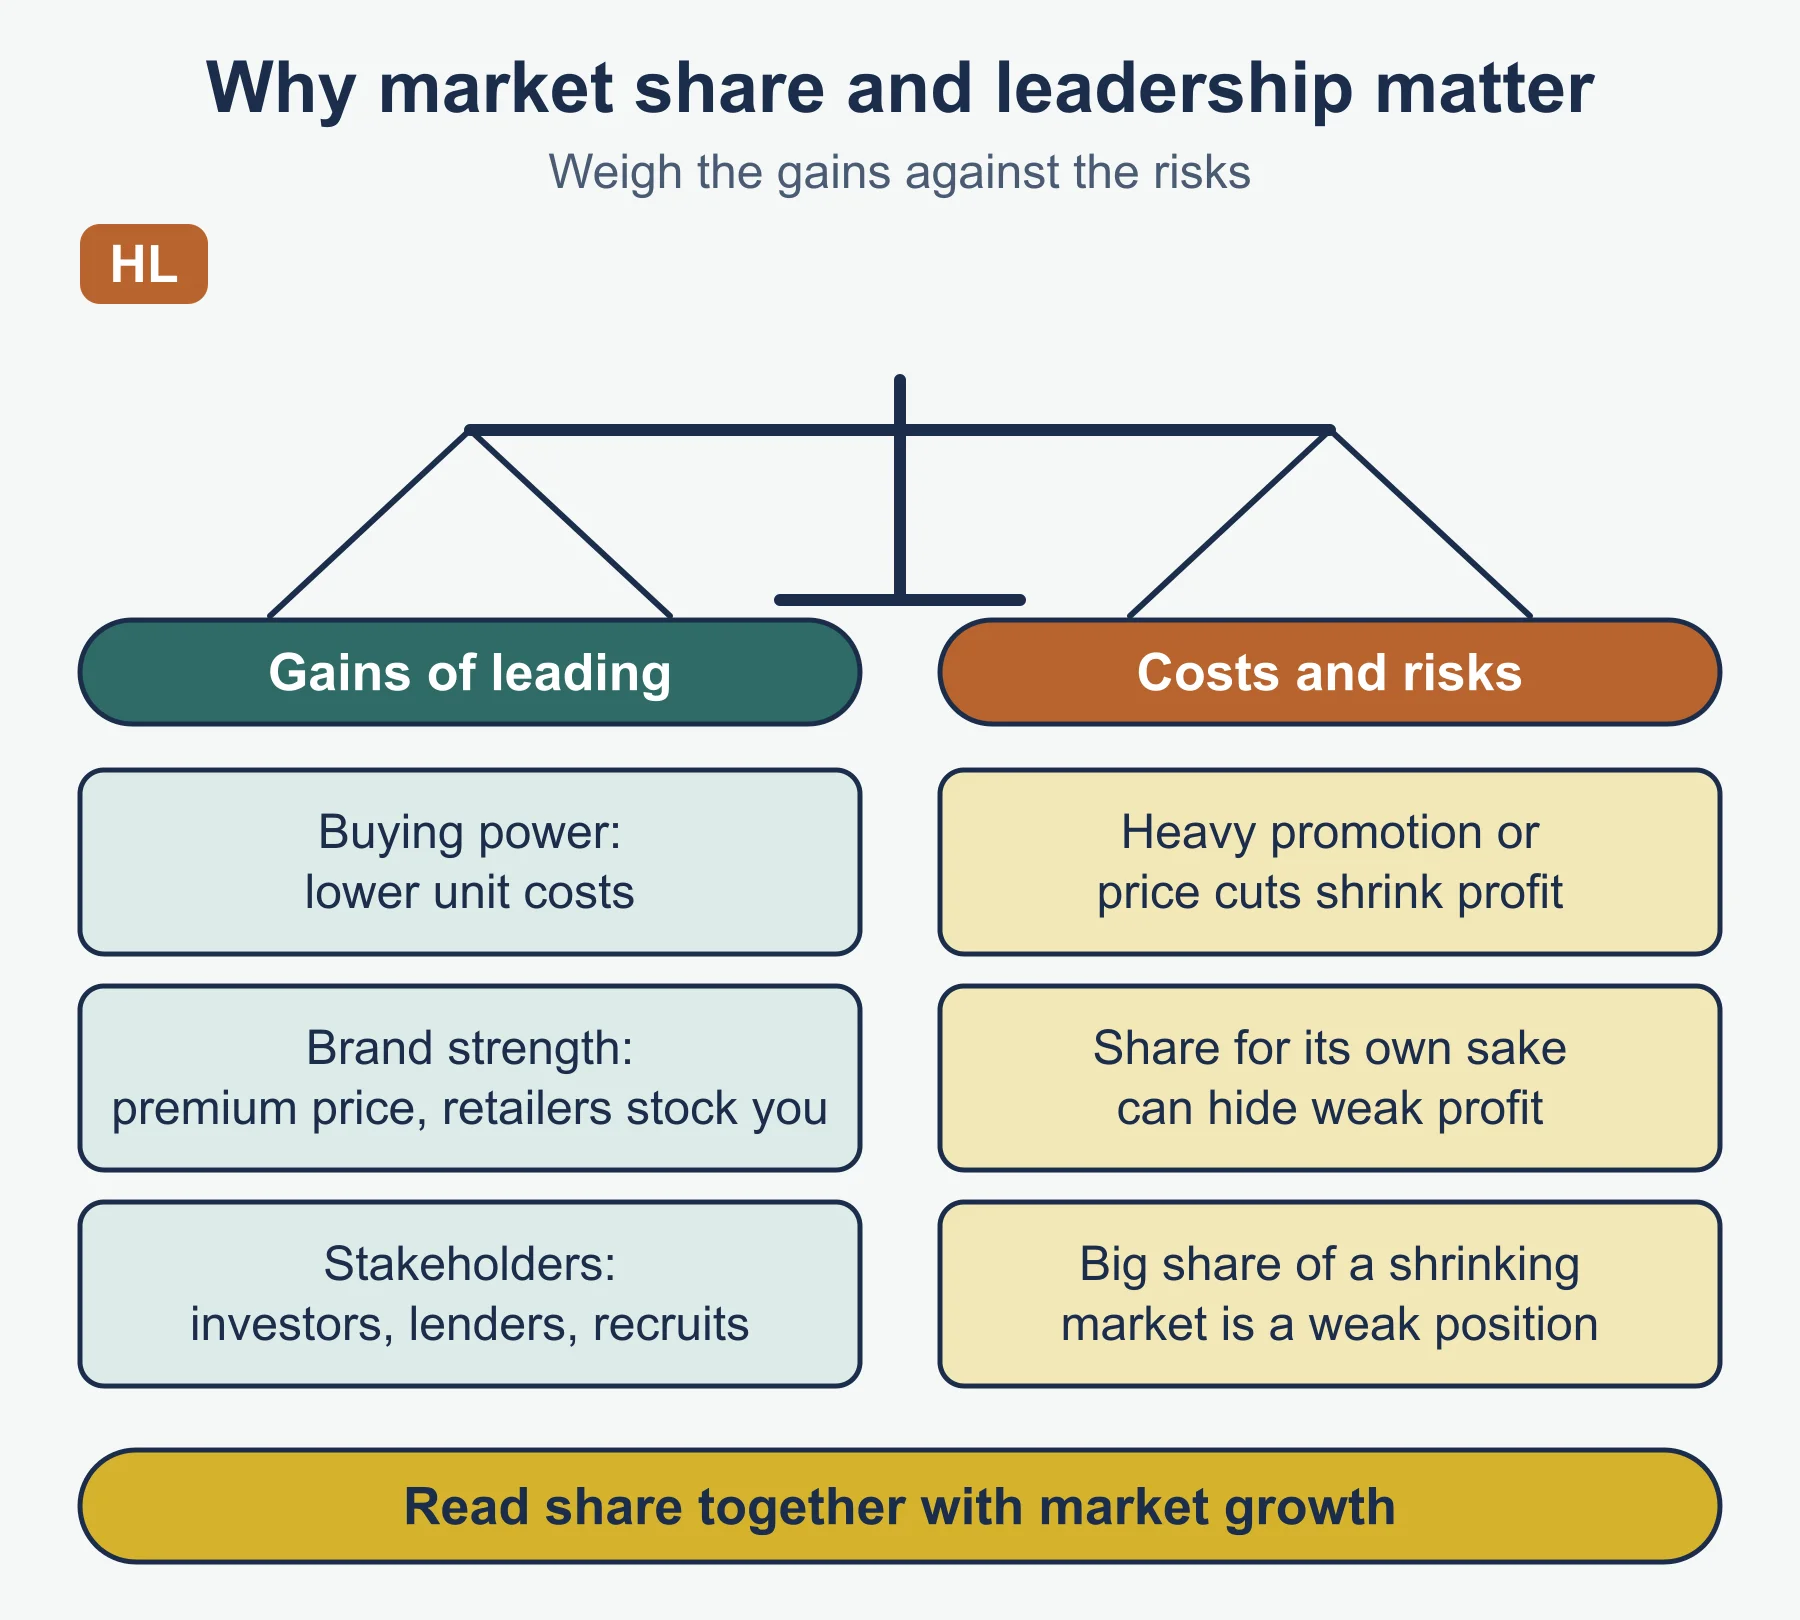
- Share and growth: always read them together. A rising share in a shrinking market can still mean a weak position. A falling share in a booming market can still mean rising sales.
- Importance of market share and market leadership (HL only):
- For: purchasing power, brand strength, retailer and investor confidence, ability to influence price.
- Against: costly to win and defend, may distract from profit, complacency.
- Judgment: depends on how much unit costs fall with volume and on whether customers favor familiar brands.
4.2 at a glance
Role of marketing planning
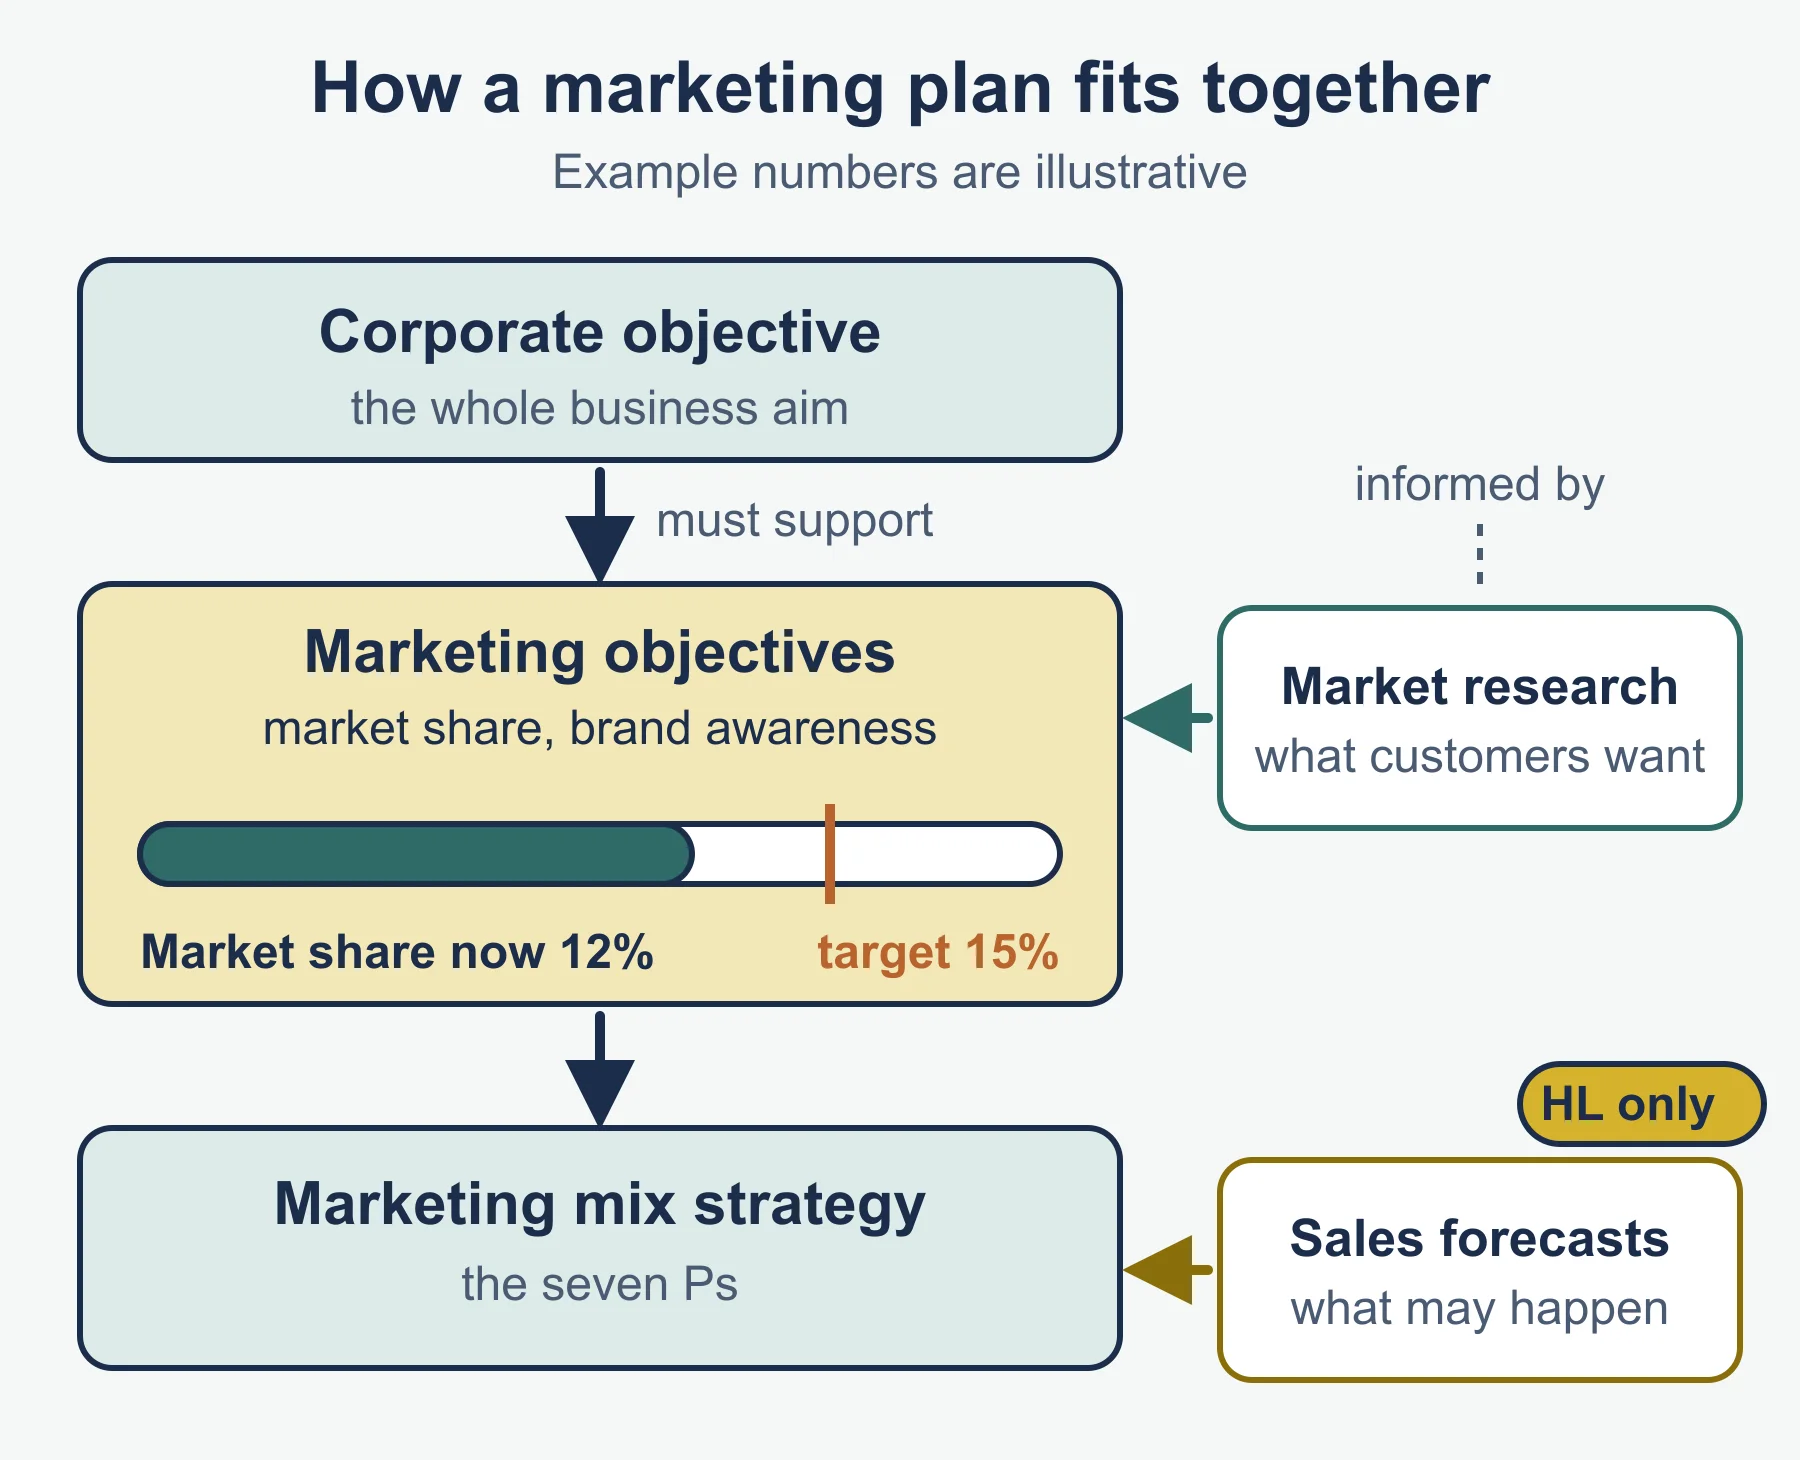
- Links marketing to the corporate objectives.
- Sets measurable targets (for example a share target) and a budget.
- Coordinates actions and people; lets managers compare results with the plan.
- Limitation: relies on assumptions and forecasts, so it needs review as conditions change. SWOT and STEEPLE analysis can feed it.
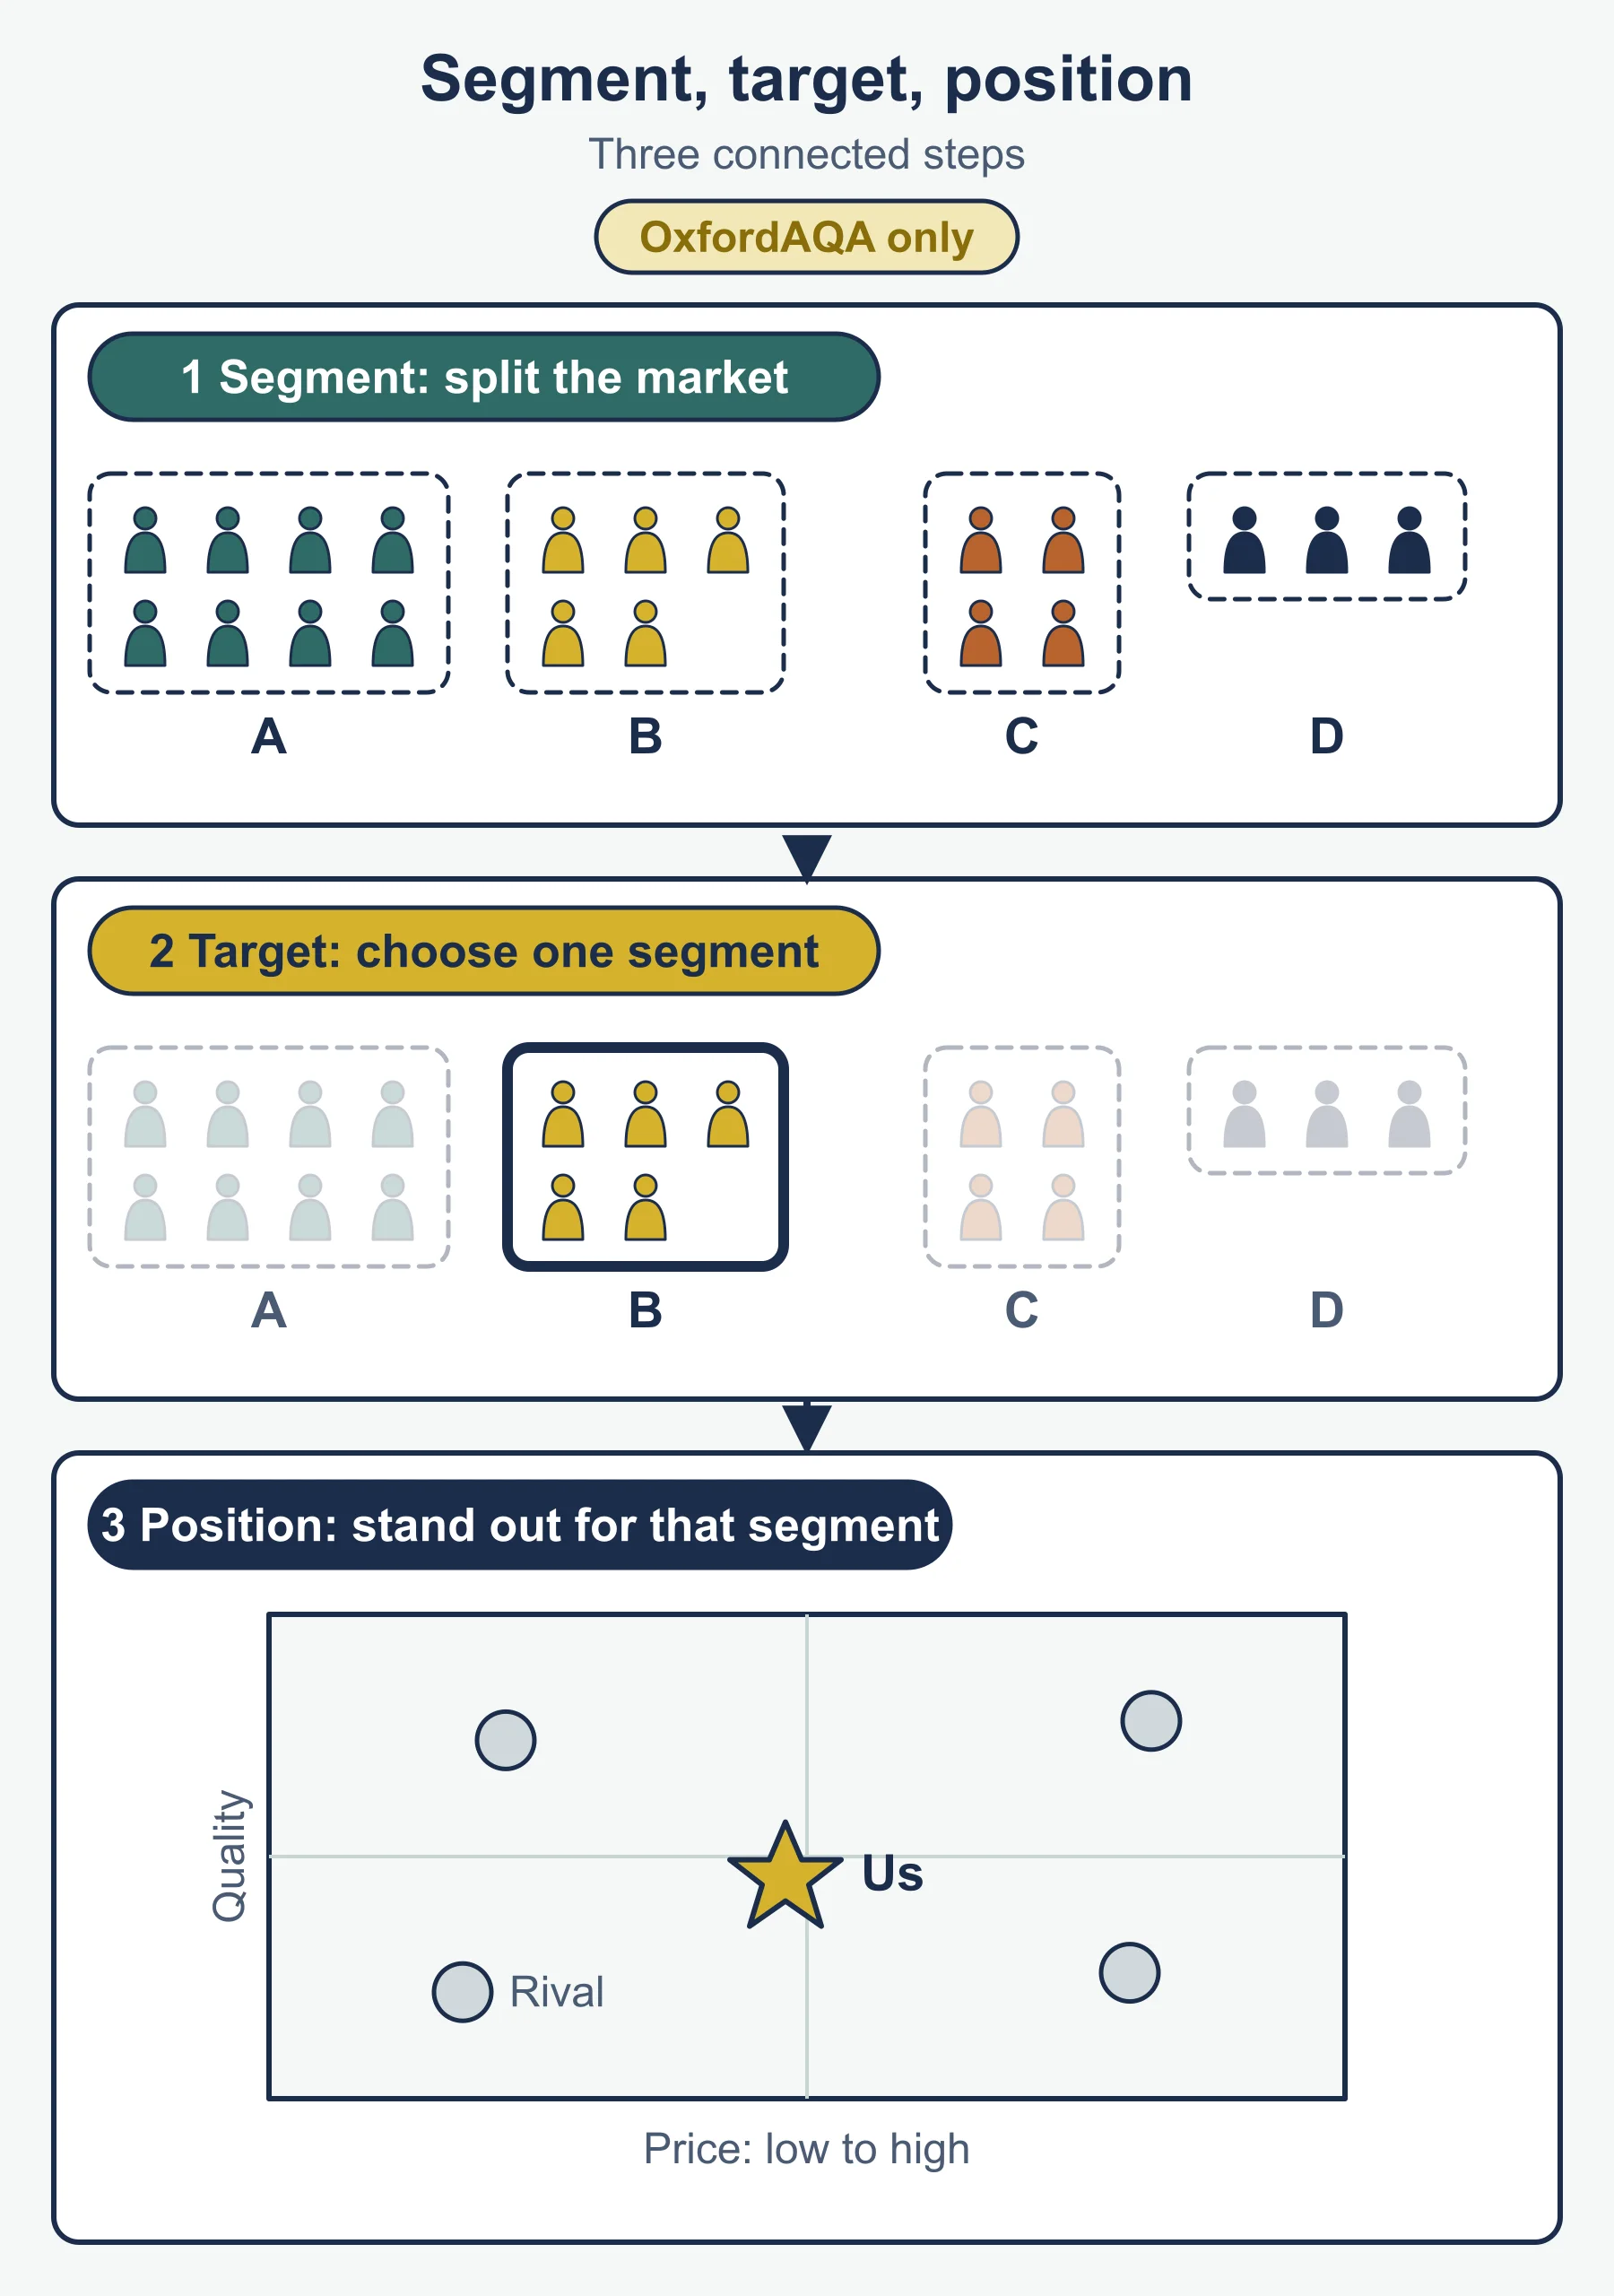
Method in steps: segment, target, position
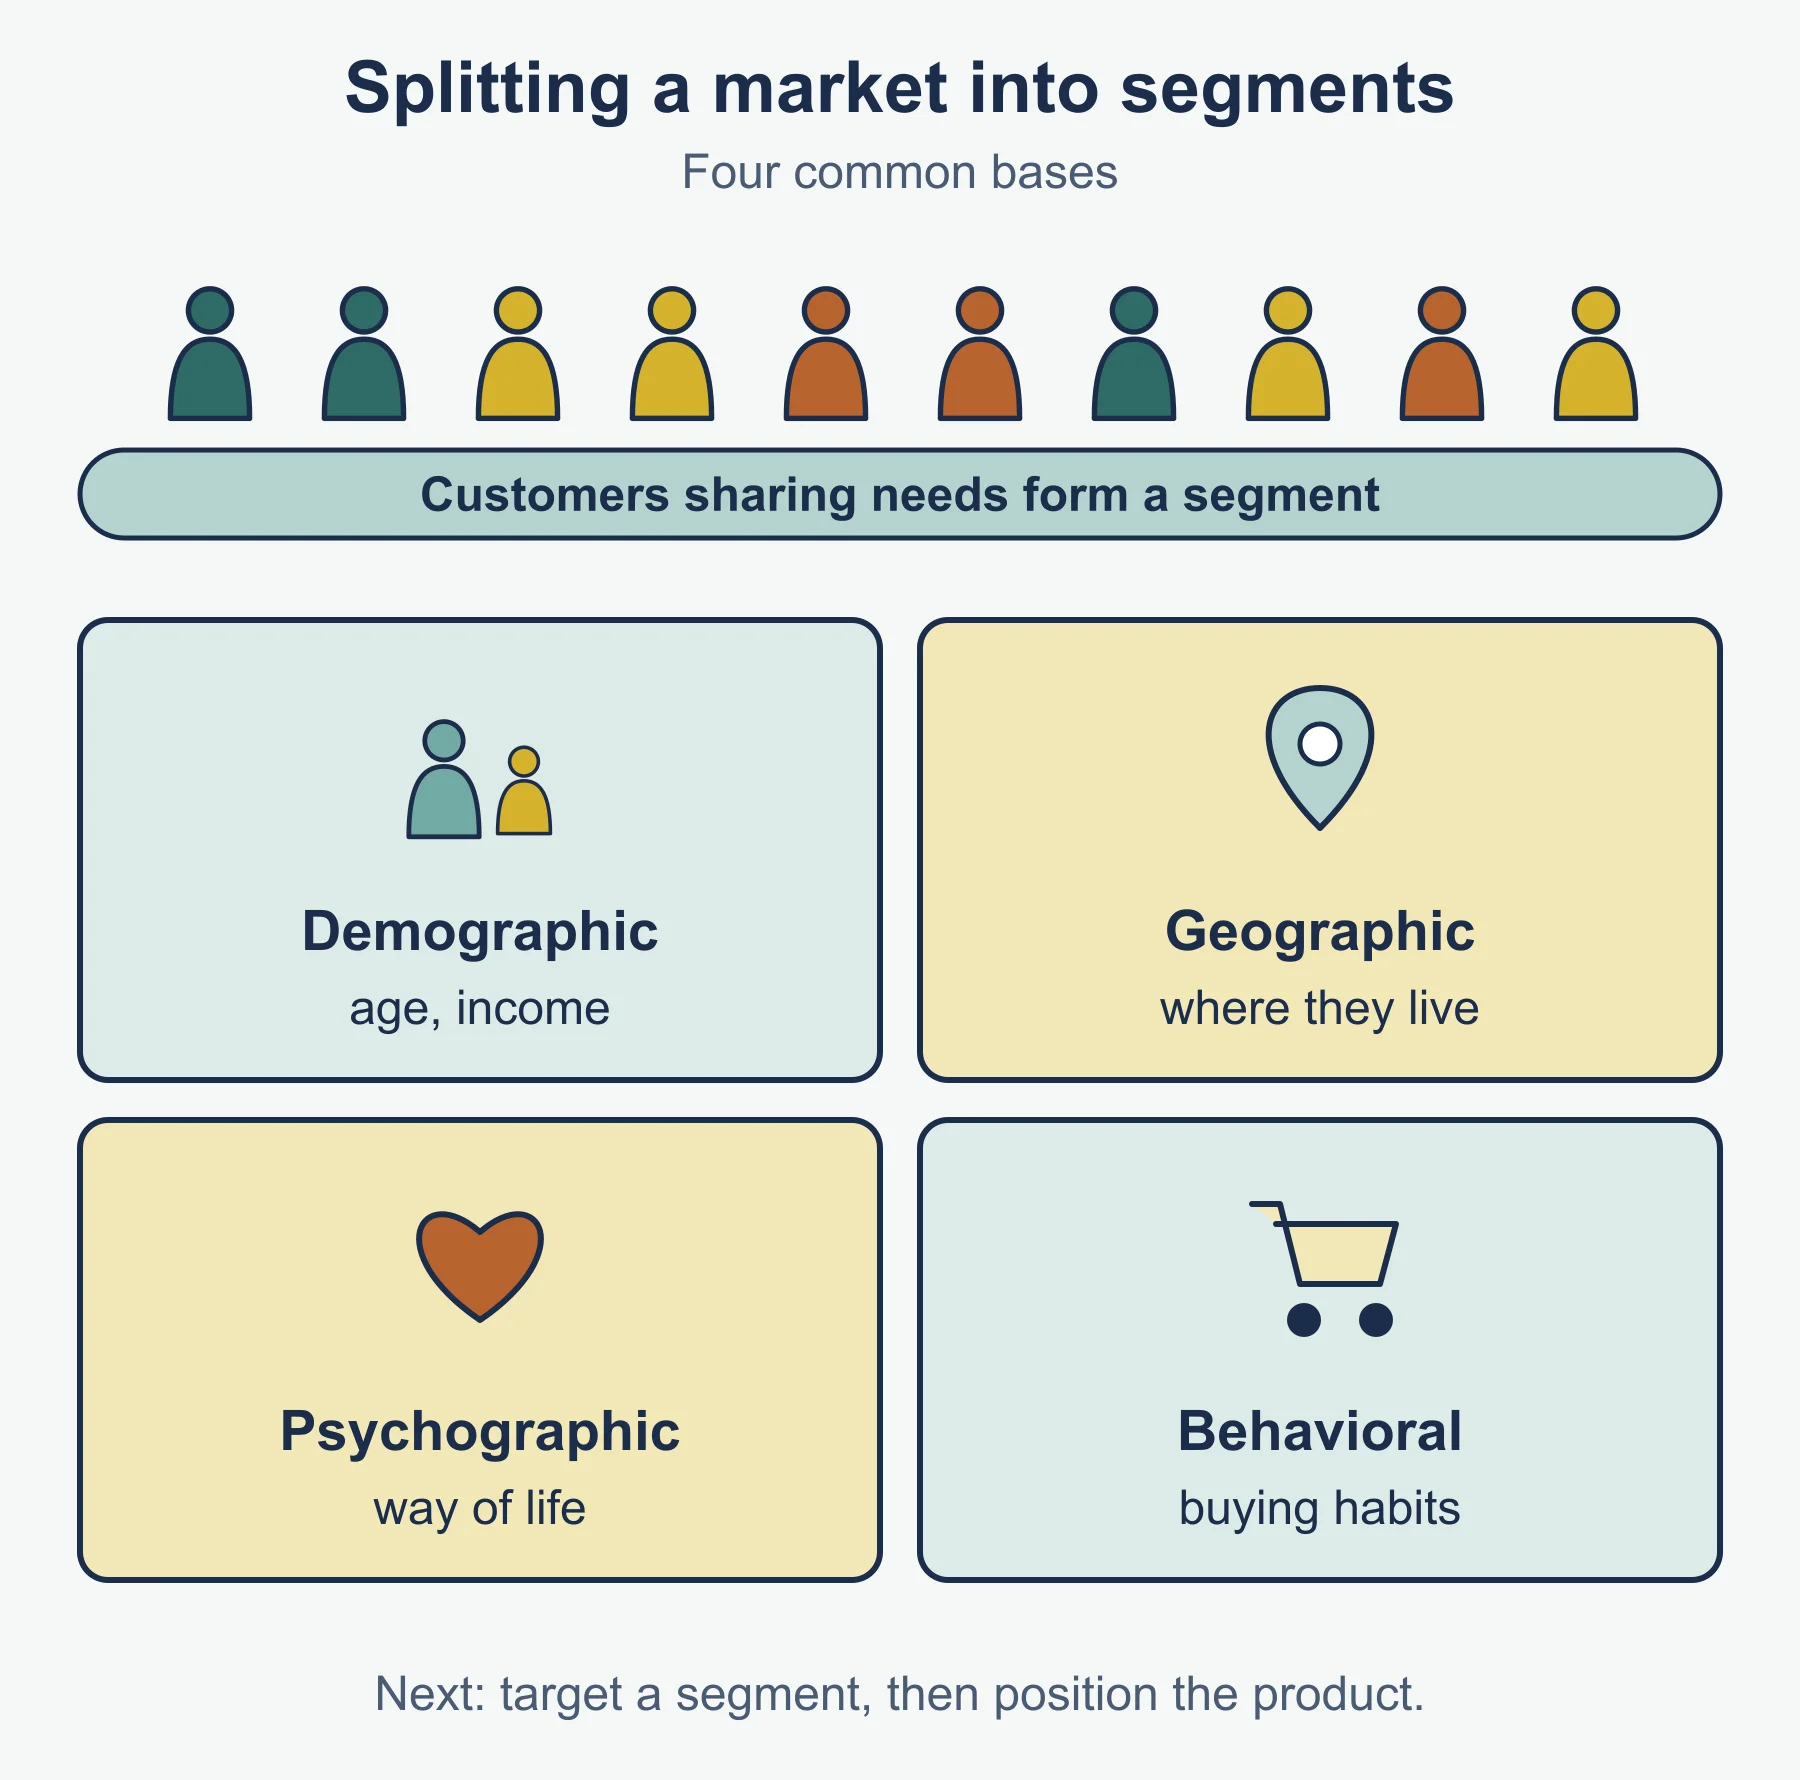
- Choose bases for segmentation (age, income, location, lifestyle, behavior).
- Estimate each segment’s size, spending and competition.
- Select the target market and justify the choice.
- Choose a position and draw or read the position map.
- State the USP that supports the position.
Position maps
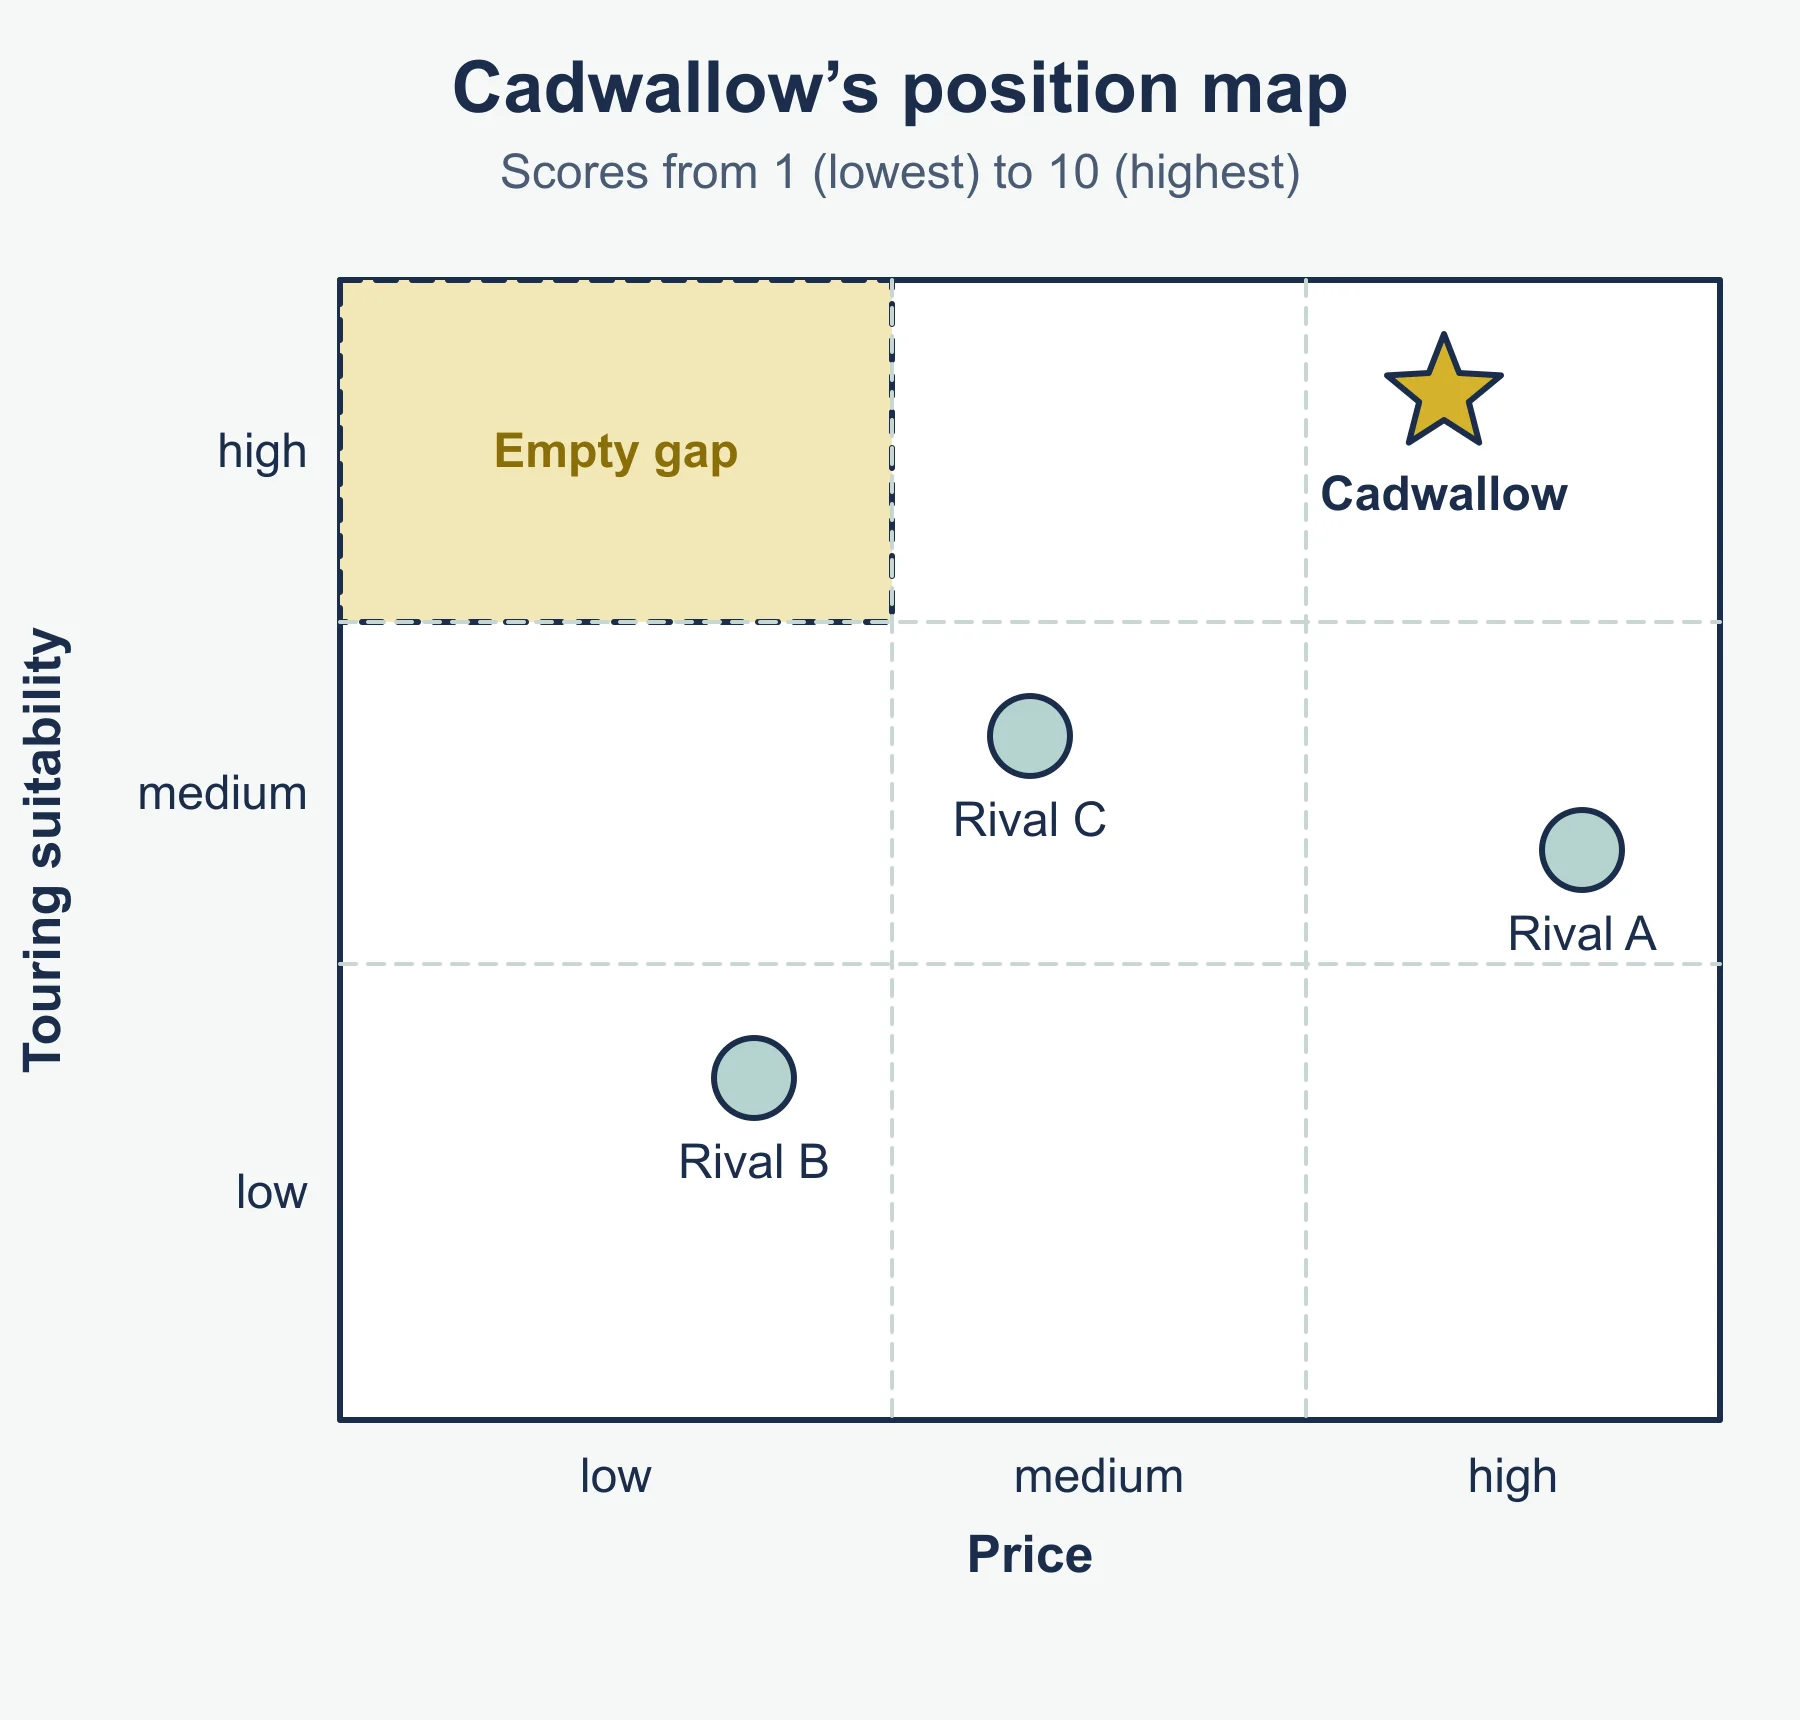
A position map has two axes, for example price and quality. Brands close together are direct rivals. An empty area is a possible gap, but it only becomes an opportunity if enough customers want what the gap offers and the business can supply it profitably.
Niche versus mass
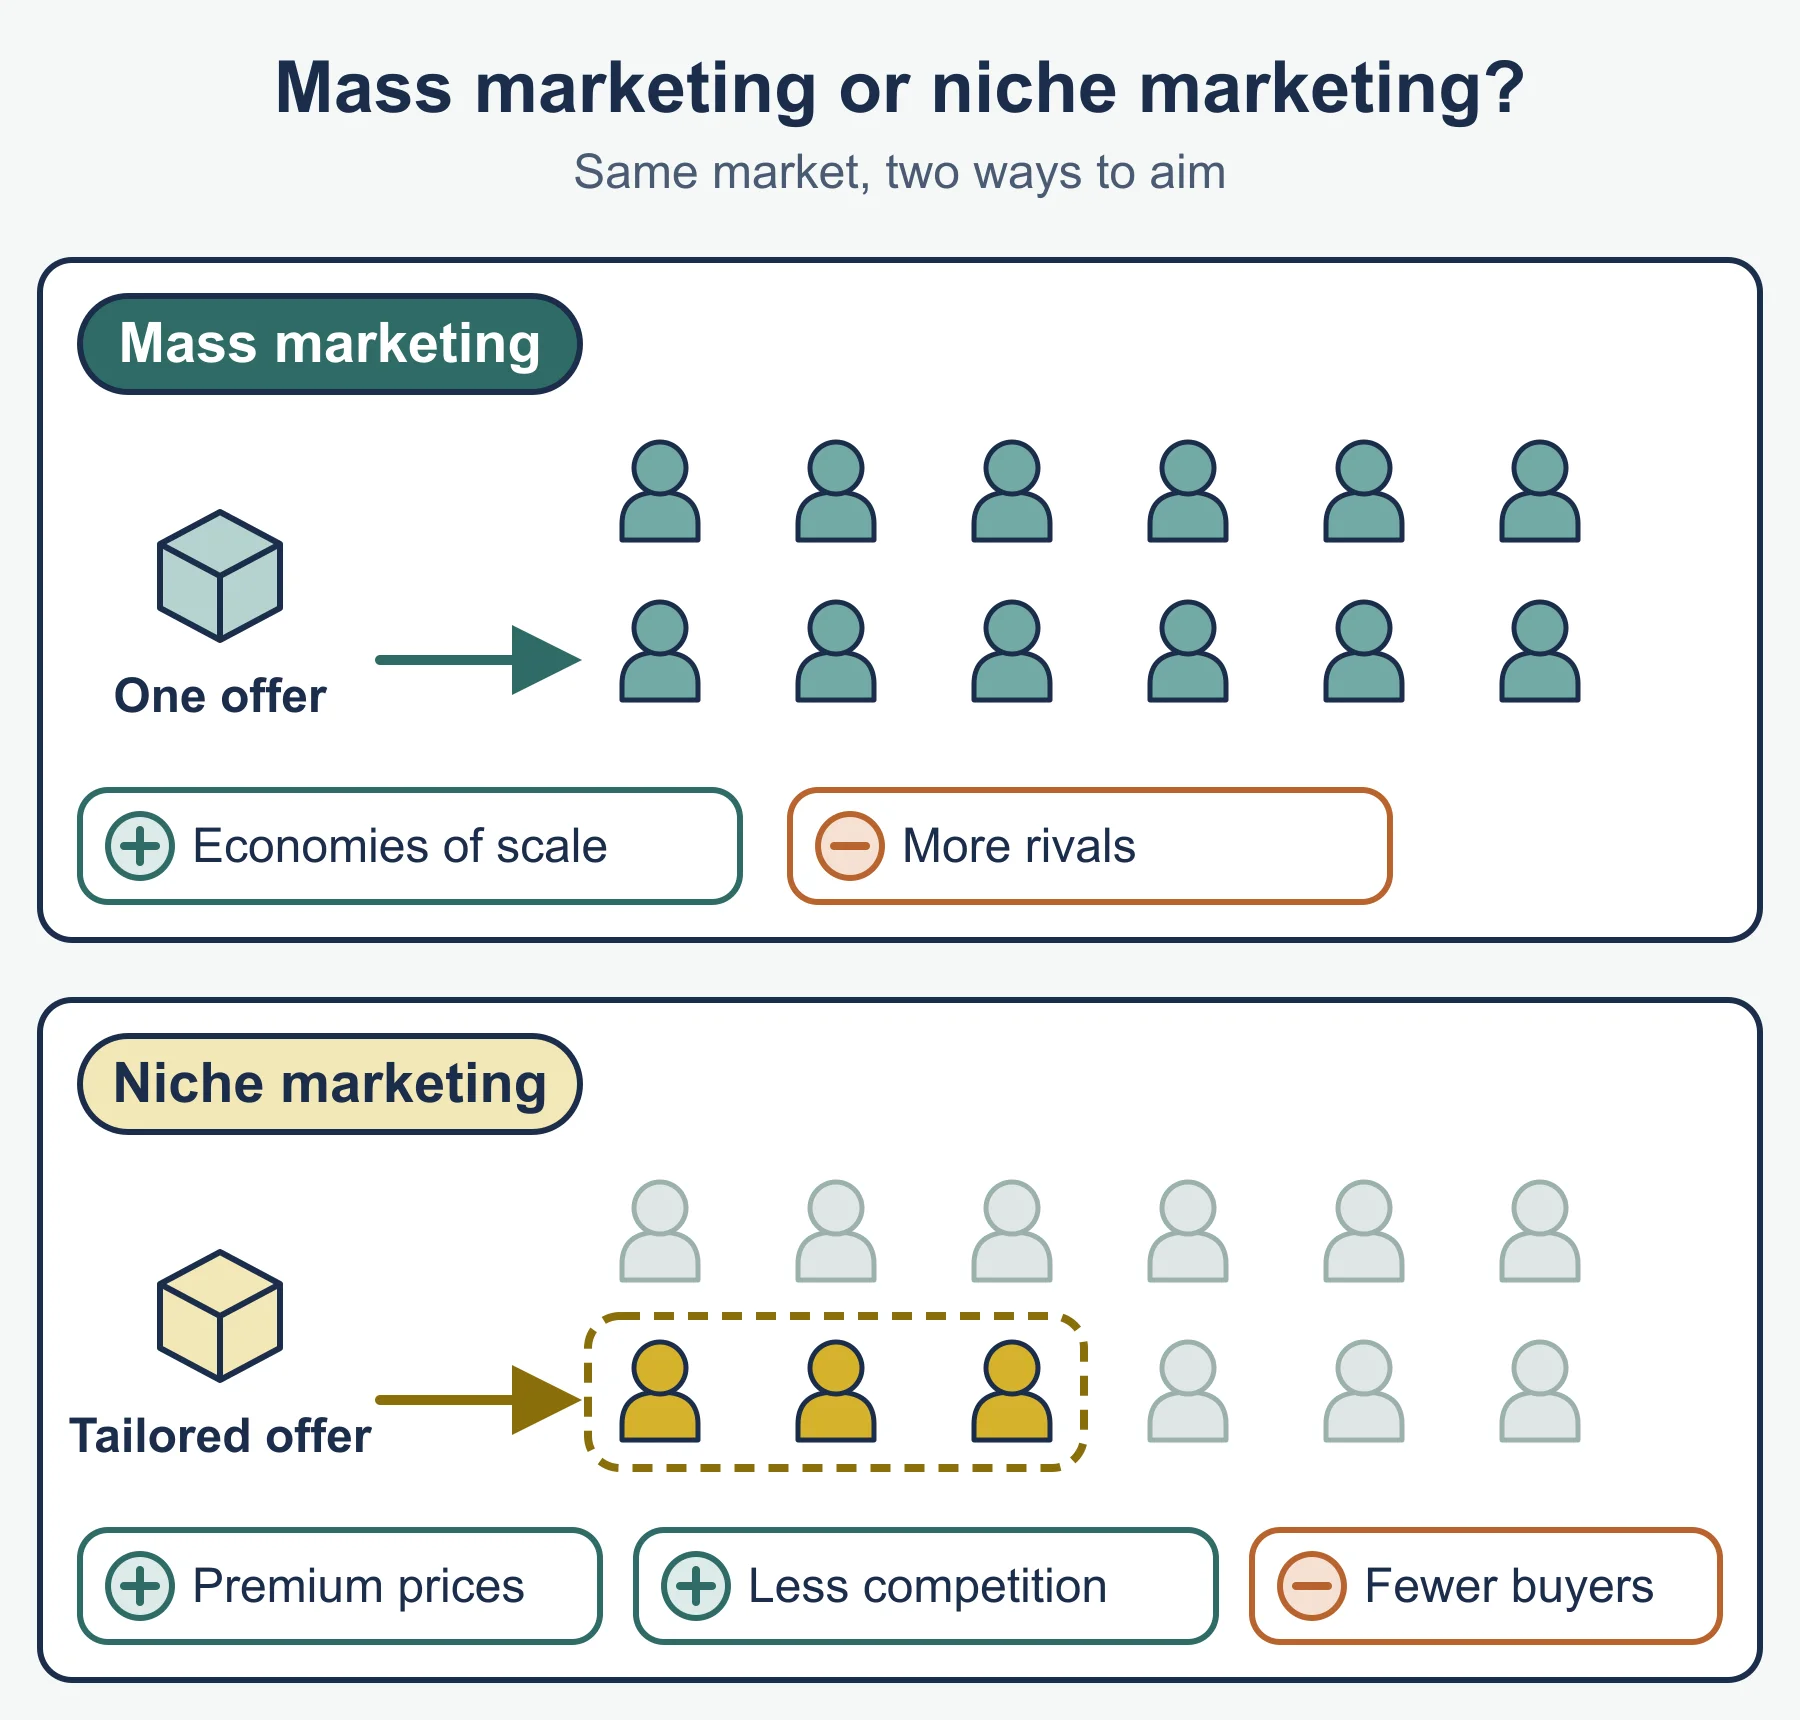
| Factor | Niche | Mass |
|---|---|---|
| Size | Small | Large |
| Competition | Often lower | Often high |
| Price | Often premium | Often competitive |
| Main risk | Small customer base; larger rival may enter | Low margins; hard to stand out |
USP and differentiation
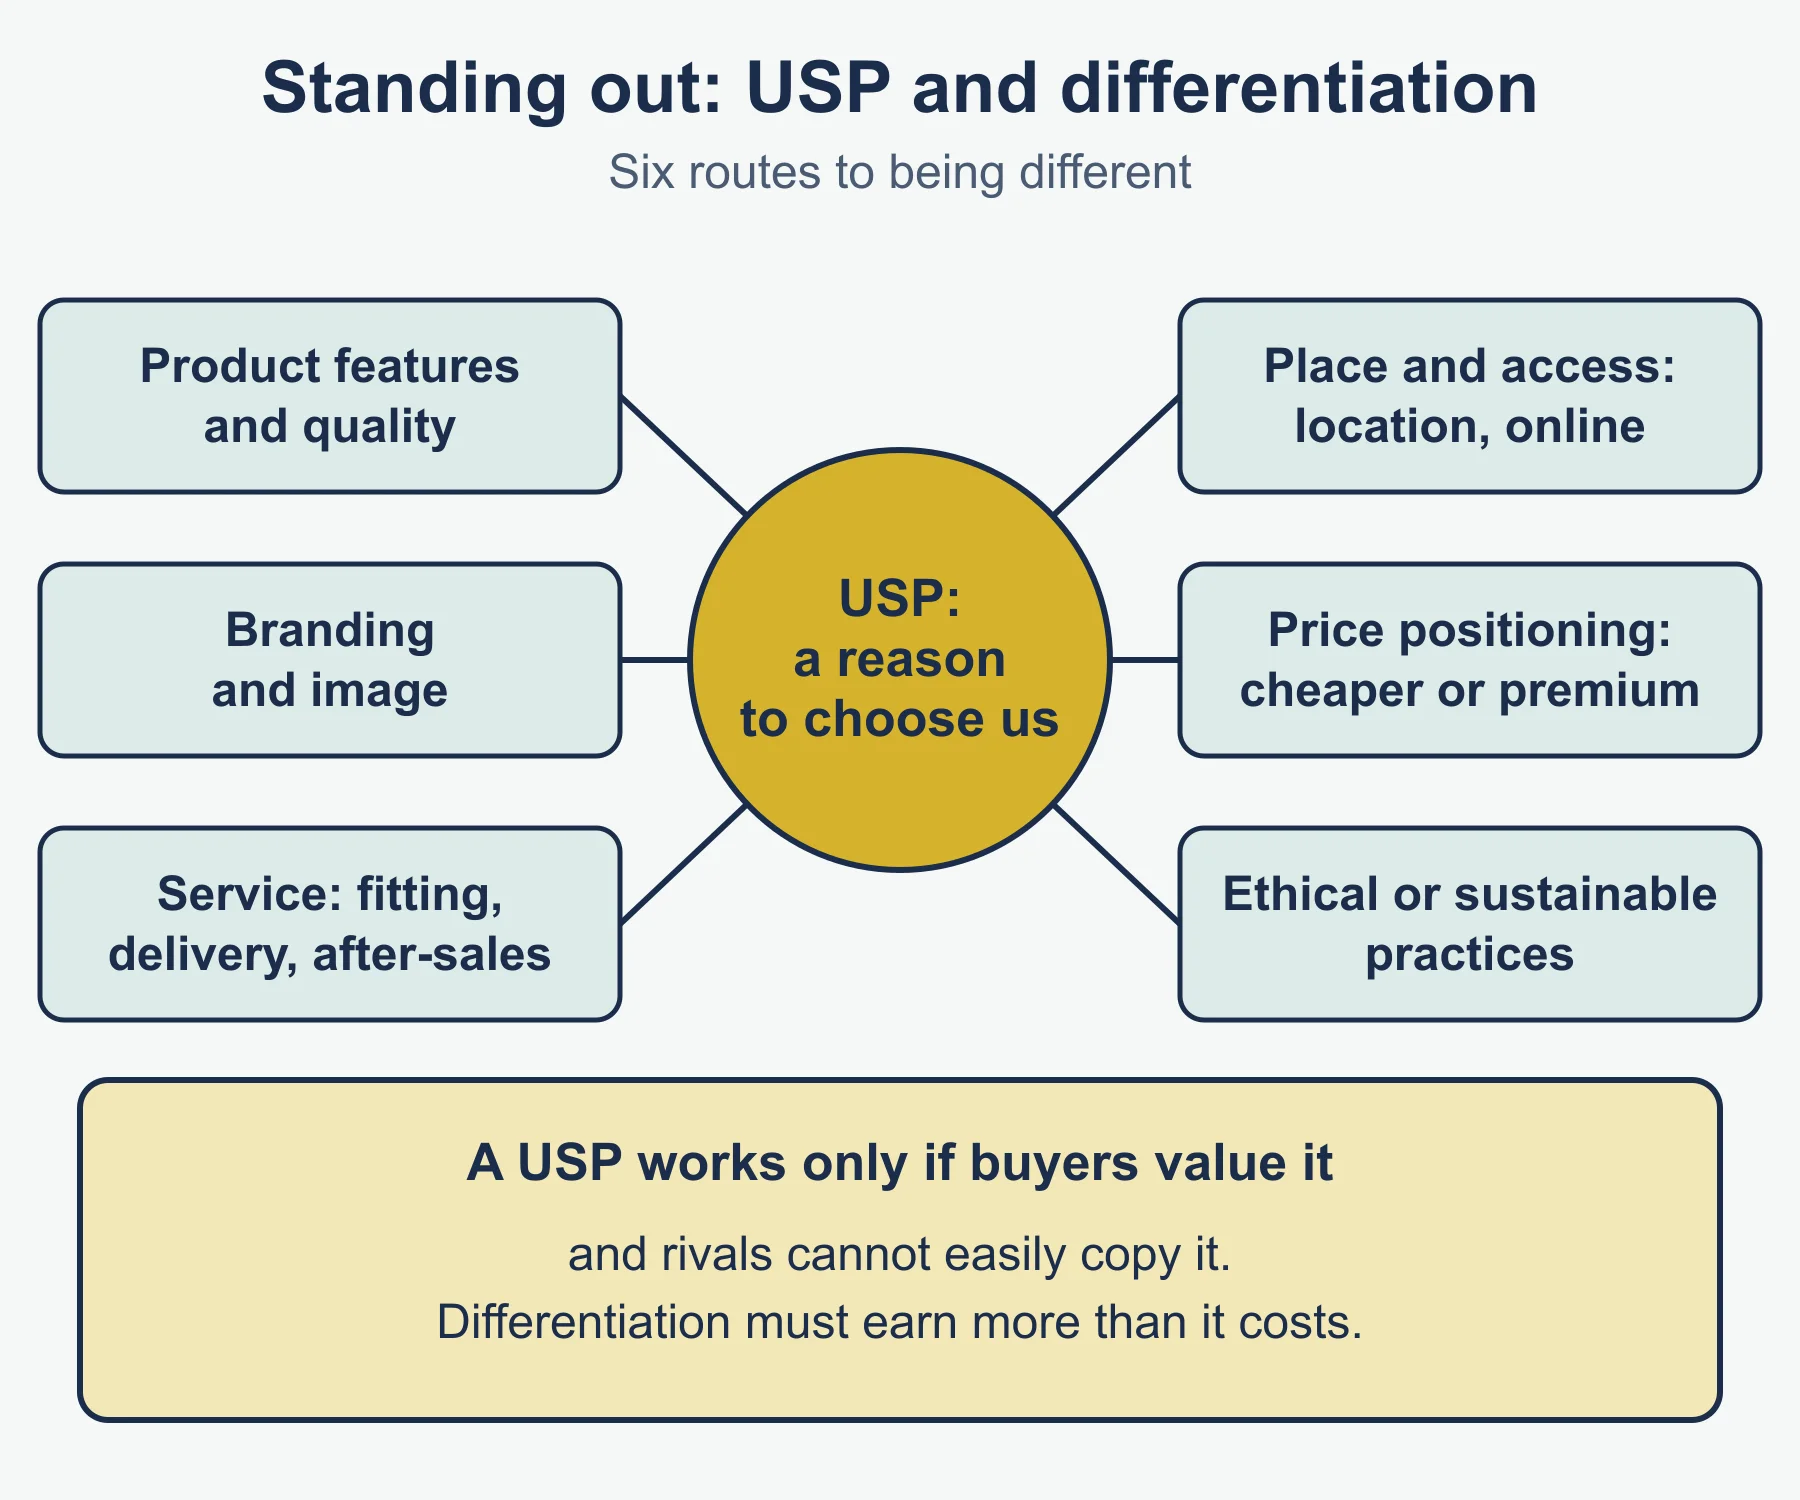
- A USP must be valued by the target market, not just different.
- It is stronger if rivals cannot easily copy it.
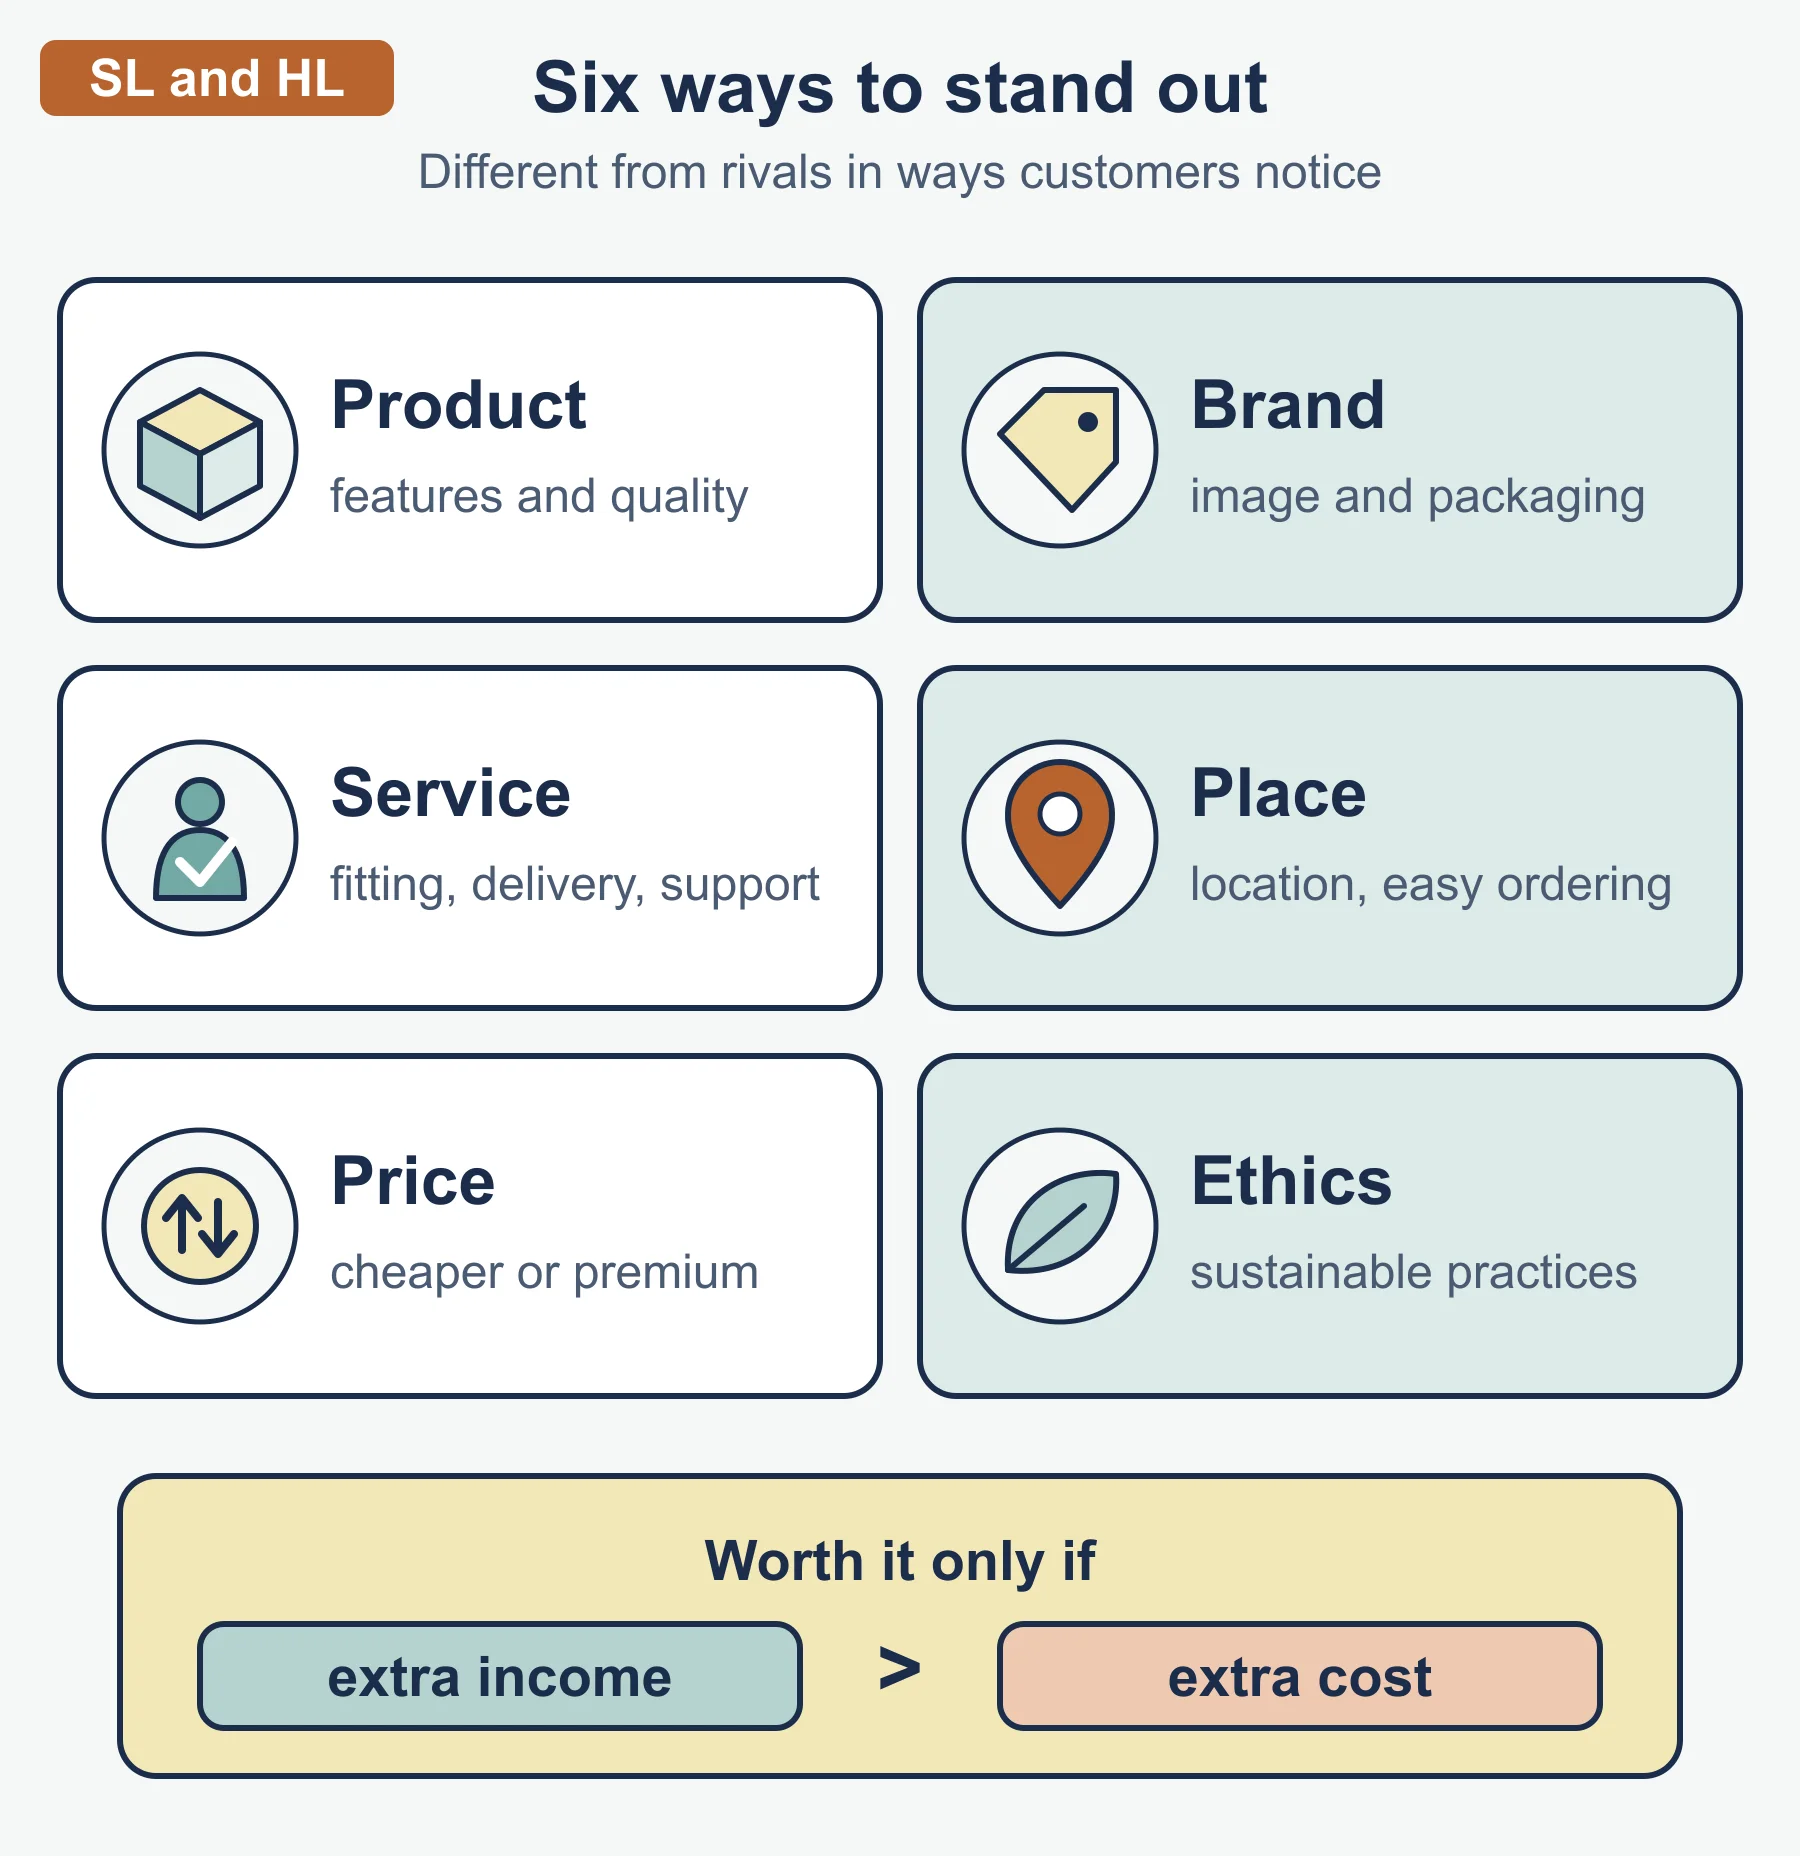
- Ways to differentiate: features and quality, brand image, service, access or location, price position, ethical or sustainable practice.
- Differentiation is worthwhile only if the extra revenue exceeds the extra cost.
Must-know distinctions
| Pair | Key difference |
|---|---|
| Market orientation and product orientation | Starting point of decisions: customers or the product |
| Market share and market growth | One measures the business’s slice; the other measures the whole market’s change |
| Business growth and market growth | Business growth is the firm’s own sales change; compare the two to explain share |
| Segmentation and targeting | Dividing the market versus choosing which part to serve |
| Targeting and positioning | Who you serve versus how they should see you |
| Niche and mass | Small distinct group versus large common-need group |
| USP and differentiation | A USP is a specific selling feature; differentiation is the wider effort to stand apart |
Command words for these sections
The guide classifies command terms by assessment objective. Typical uses here:
- Define, state, identify, outline: short knowledge answers, such as a definition of market share.
- Calculate: show the working; give the percentage with a sensible number of decimals.
- Explain, distinguish, analyse, comment, suggest: application to the case. Say why, using the data given.
- Evaluate, justify, recommend: weigh strengths and limitations, then give a reasoned judgment.
Quick self-test
- State the formula for market share.
- A market grew from 90 million to 99 million (USD). Calculate market growth.
- A firm sold USD 6.6 million in a market worth USD 55.0 million. Calculate its market share.
- A firm targets a 15% share of a market expected to be worth USD 40.0 million. How much must it sell?
- A firm’s sales rose from USD 1.8 million to USD 1.89 million while its market rose from USD 30.0 million to USD 33.0 million. Did its share rise or fall? Give both shares.
- Distinguish between segmentation and targeting.
- Give two reasons a niche strategy can be riskier than a mass-market one.
- What makes a USP effective?
- Outline one way a business could differentiate its product through service.
- (HL only) State one benefit and one limitation of being the market leader.
Answers
- Business sales / total market sales x 100.
- (99 - 90) / 90 x 100 = 10.0%.
- 6.6 / 55.0 x 100 = 12.0%.
- 0.15 x 40.0 = USD 6.0 million.
- Share before: 1.8 / 30.0 = 6.0%. Share after: 1.89 / 33.0 = 5.7% (3 s.f.). Share fell, because sales grew by 5.0% and the market by 10.0%.
- Segmentation divides the market into groups; targeting chooses which group(s) to serve.
- Dependence on a small customer base, and the chance that a larger rival enters once the niche proves profitable.
- It is valued by the target market, and rivals cannot easily copy it.
- For example, free fitting or fast delivery, if customers value it enough to choose the brand because of it.
- Benefit: lower unit costs from large volumes (or other valid). Limitation: share may have been bought through heavy spending that reduces profit (or other valid).
Where marks are usually lost
- Dividing by the wrong market total, or mixing revenue and units.
- Writing “share rose by 1%” when it rose by one percentage point.
- Calling any research-first business market-oriented without noting that it must also act on the findings.
- Listing segmentation bases with no link to the business in the question.
- Treating an empty gap on a position map as proof of demand.
- Giving a USP that is a vague claim such as “quality”.
- Describing niche and mass markets without saying which suits this business and why.
- In “evaluate” or “justify” answers, stopping at one side without a reasoned judgment.
- Forgetting that HL points on market leadership need both a benefit and a limitation.
Frequently asked questions
How do you calculate market share and market growth? Market share (%) is the business’s sales divided by total market sales, multiplied by 100. Market growth (%) is the change in market sales between two periods divided by the earlier period’s market sales, multiplied by 100; these are standard forms, as the IB guide does not print the formulas.
Can a business’s sales rise while its market share falls? Yes. If the business’s sales grow more slowly than the market as a whole, its share falls even though its sales rise; if they grow at the same rate, its share stays the same.
What makes a USP effective? A USP must be valued by the target market, not just different, and it is stronger if rivals cannot easily copy it. A vague claim such as “quality” is not an effective USP.
What is the difference between segmentation and targeting? Segmentation divides a market into groups of customers with shared needs or characteristics. Targeting chooses which of those groups the business will serve.
Official syllabus
International Baccalaureate Organization, Business management guide, first assessment 2024, sections 4.1 and 4.2.
Get free revision emails (optional)
Occasional emails with practice questions, worked explanations and links to free resources for the qualification and subjects you choose. No spam, and you can unsubscribe from any email. The free tools on this site never need an email.
Related resources
-
Study guides
IB DP Business Management: Market research
Study guide to market research for IB DP Business Management section 4.4: why and how, primary and secondary methods, qualitative data, sampling.
Business · International Baccalaureate · IB
Read guide -
Practice questions
IB DP Business Management: Market research – Practice Questions
Original practice questions with worked answers on market research for IB DP Business Management section 4.4, including sampling and short cases.
Business · International Baccalaureate · IB
Try questions -
Revision notes
IB DP Business Management: Market research – Revision Notes
Revision notes on market research for IB DP Business Management section 4.4: methods, sampling, qualitative versus quantitative, and a self-test.
Business · International Baccalaureate · IB
Revise topic
Related articles
-
teaching
A Level tuition in Dubai: Cambridge or Pearson Edexcel International A Level?
Schools in Dubai and Abu Dhabi teach either Cambridge International AS & A Level or Pearson Edexcel International A Level. How the two are structured, why it matters for tuition, and how online classes from Lahore work.
9 October 2026
-
curriculum guides
Choosing subjects at IGCSE and A Level
How subject choices at 14 and 16 affect university options later, and how to keep pathways open without overloading a timetable.
28 July 2026
Studying this with a teacher
Working through Business IB?
This page is free and stays free. If you would rather be taught it, Marlbridge runs Business classes one-to-one, online in your own time zone. The first trial class is free. WhatsApp replies within an hour (8am–11pm Pakistan time, every day); email the same day.
IB Business teachers at Marlbridge

