
Revision Notes
IB DP Business Management: Market research – Revision Notes
Revision notes on market research for IB DP Business Management section 4.4: methods, sampling, qualitative versus quantitative, and a self-test.
- Subject
- Business
- Level
- IB
- Topic
- Unit 4: Marketing
- Author
- Marlbridge Academic Team
- Updated
- Reviewed by
- Salman Ahmad (what this means)
Aligned to International Baccalaureate IB Diploma Programme Business (DP Business Management), First assessment 2024. Official specification .
Syllabus page (what it covers and how it is assessed): IB Diploma Programme Business.
Syllabus points this page covers
DP Business Management
- 4.4 Market research
Found an error? Report a correction.
Need help with this topic? Request a free trial class for IB Diploma Programme Business (DP Business Management).
These notes condense section 4.4 Market research of the IB Business management guide, first assessment 2024, for the final weeks of revision. The content is SL and HL. For full explanations and worked examples, use the study guide. When you are ready to test yourself, move on to the practice questions. More resources: the Unit 4 revision notes, the Business Management hub, the printable checklist and the free diagnostics.
Core definitions
The guide names the methods, sources and sampling types but does not define them, so these definitions, the strengths and limitations and the formulas below are standard descriptive content, not guide wording.
| Term | Meaning |
|---|---|
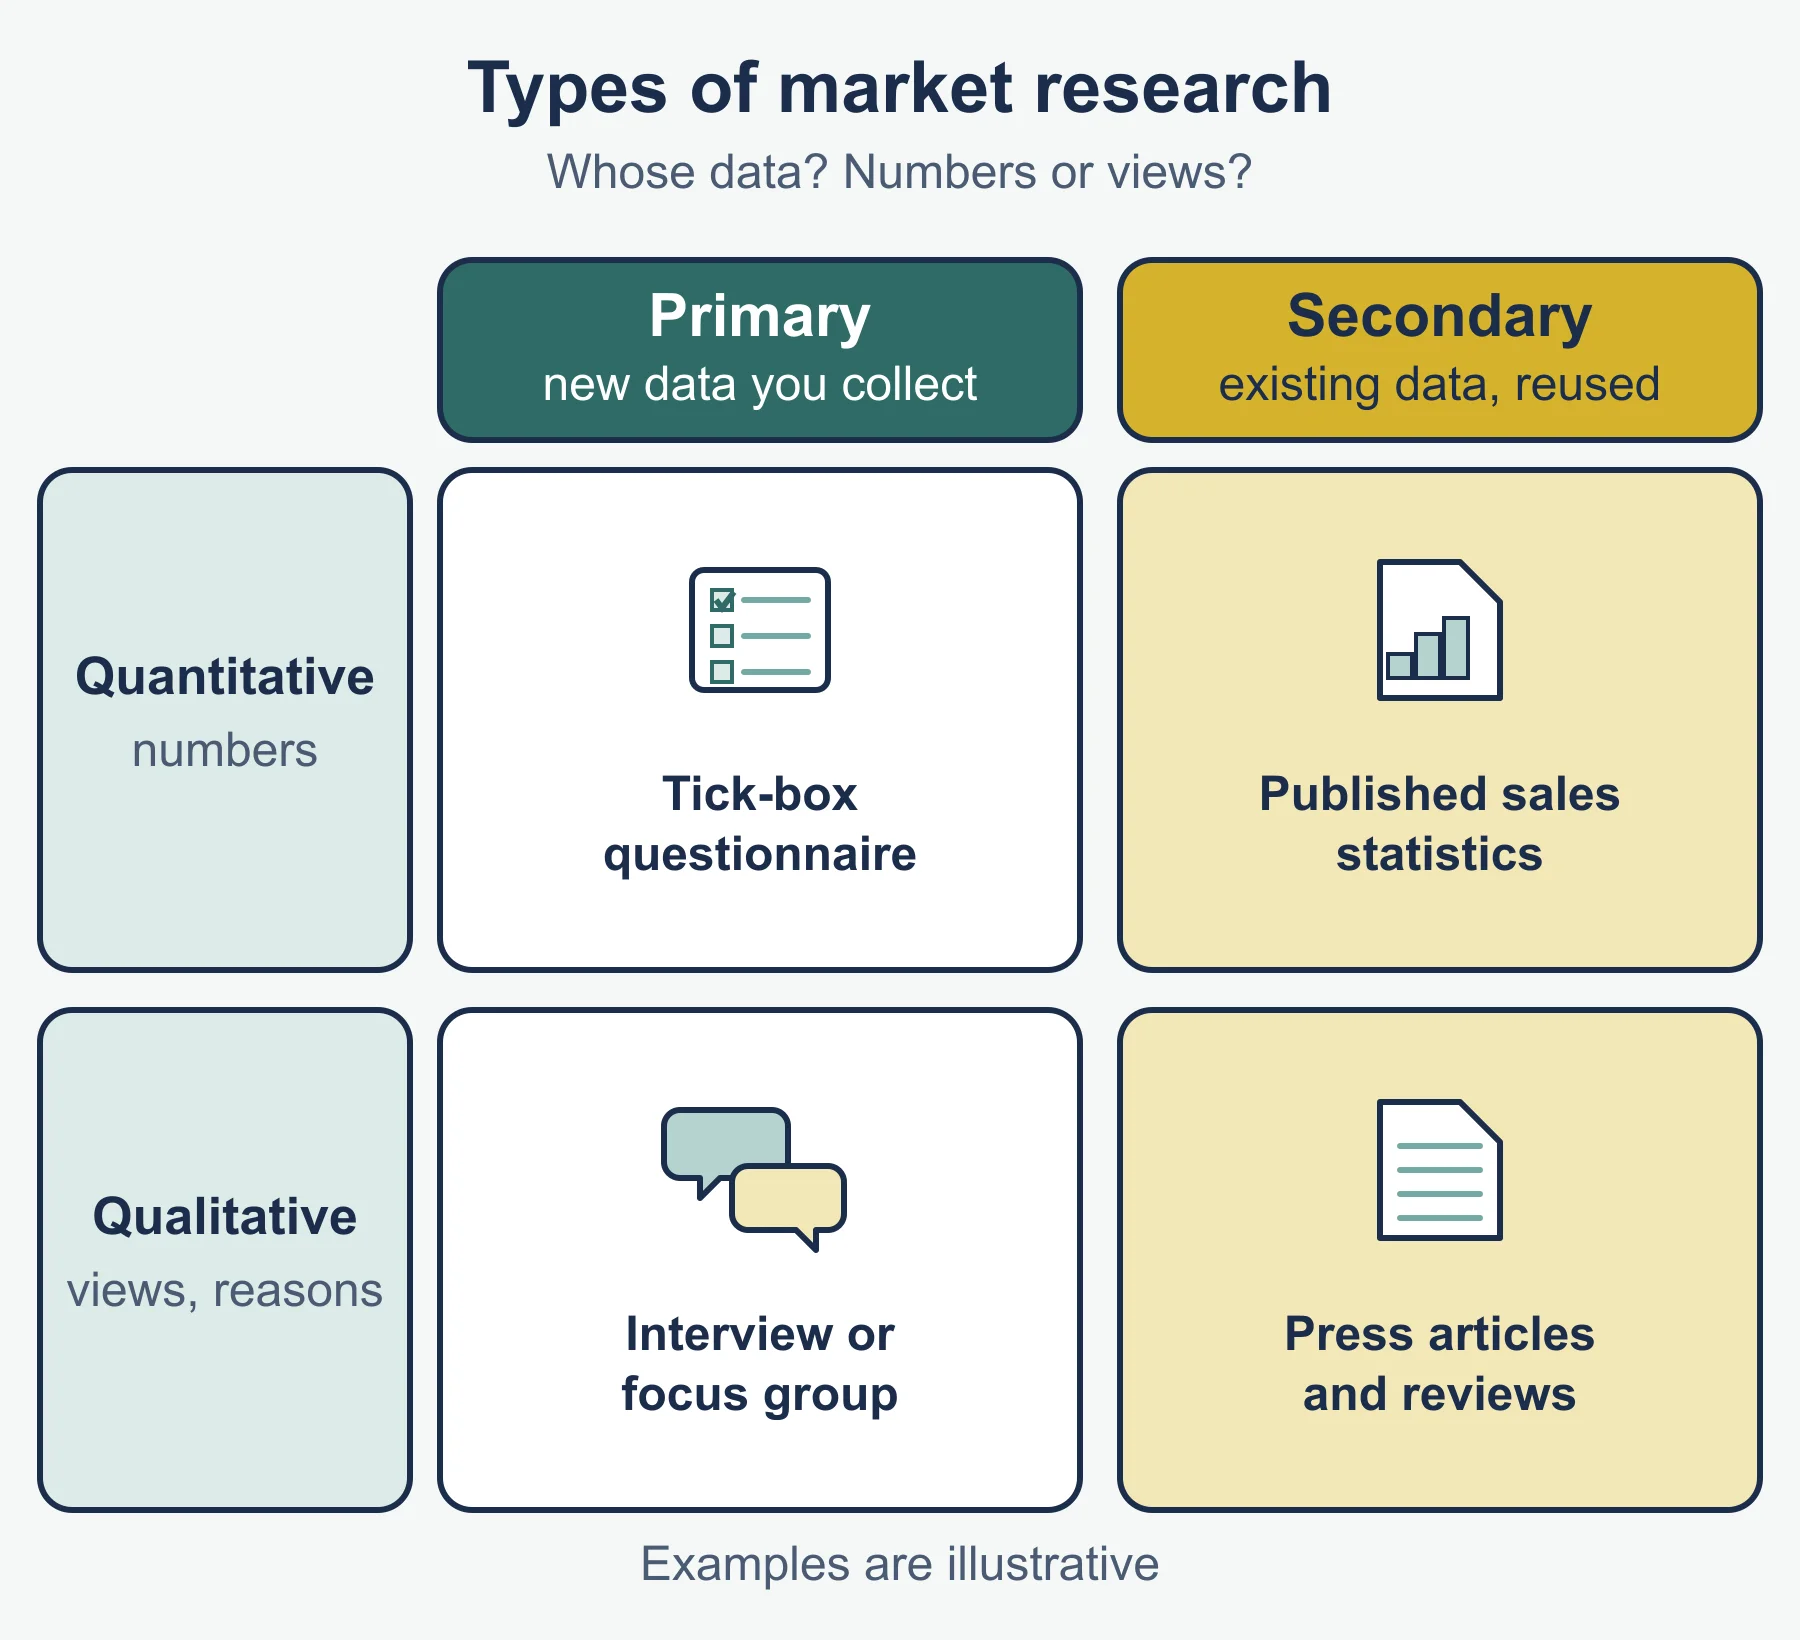
| Market research | Collecting and analyzing information about customers, competitors and the market to support decisions |
| Primary research | New data collected for the business’s own purpose |
| Secondary research | Existing data collected by others for another purpose |
| Quantitative research | Numerical data: how many, how much, how often |
| Qualitative research | Descriptive data: opinions, attitudes, motives, reasons |
| Sample | The part of the target population actually asked or observed |
Why organizations do it
- Reduce risk before spending money on a launch
- Understand customer needs, wants and habits
- Test a product, price or promotion early
- Measure market size, growth and own share
- Find trends, gaps and segments for marketing planning
- Provide evidence for managers, owners or lenders
Evaluation point: compare the cost of the research with the cost of a wrong decision. Research reduces uncertainty but does not remove it.
How: a short method
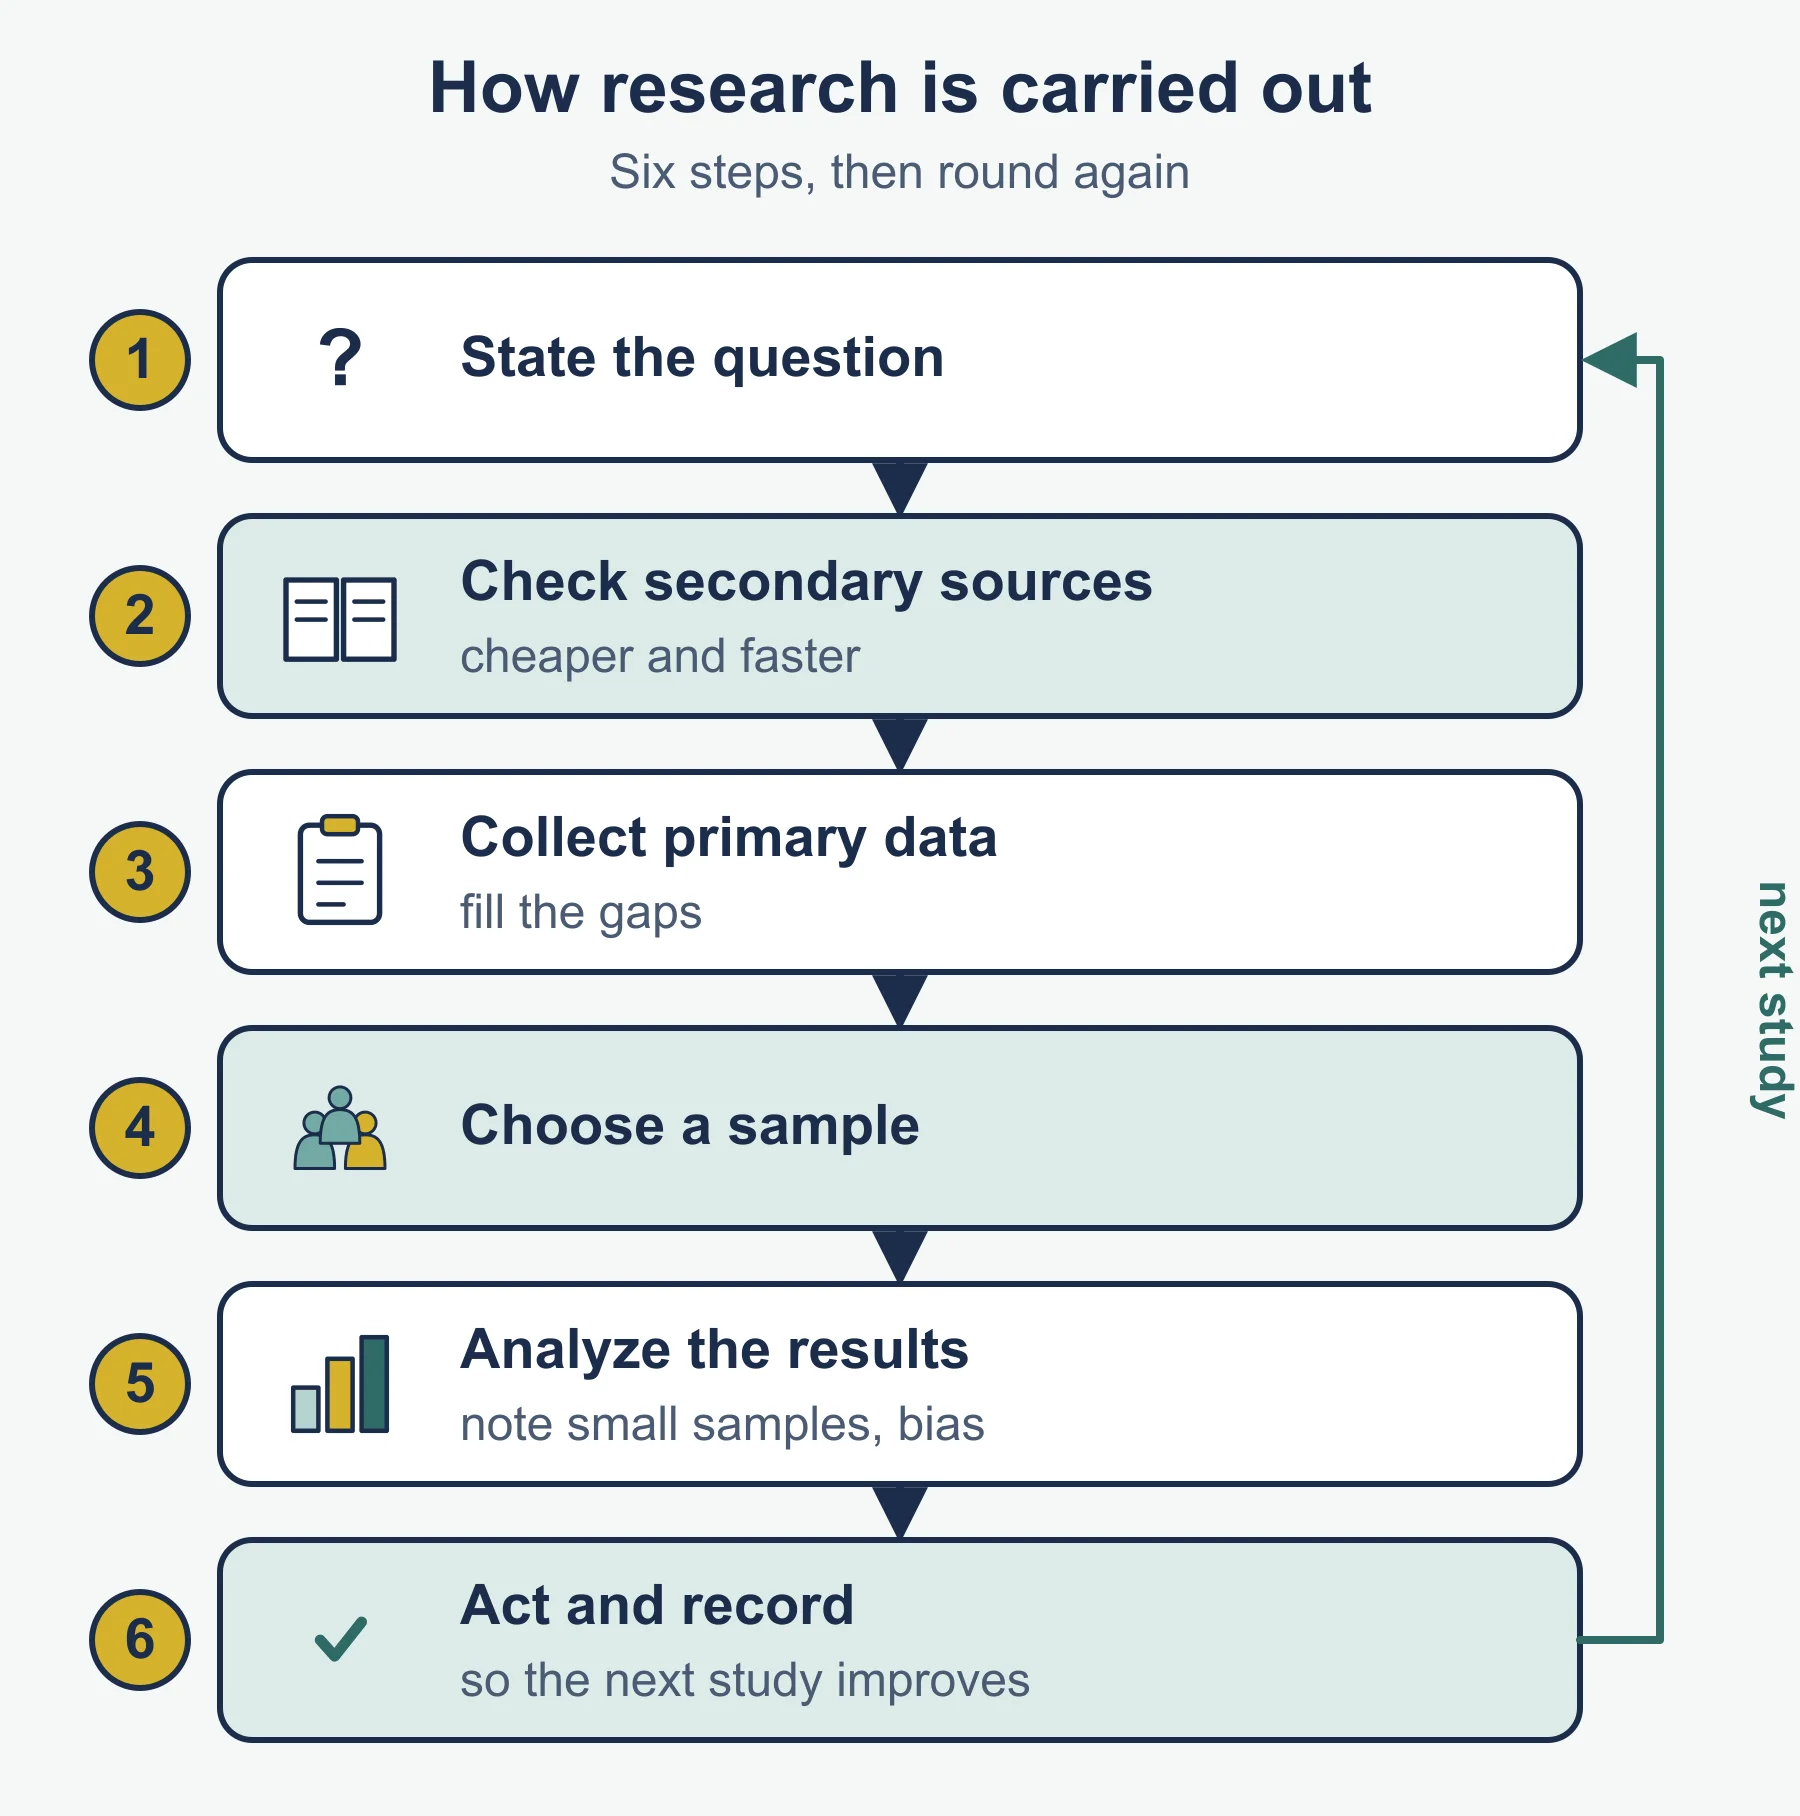
- Define the question
- Check secondary sources
- Collect primary data to fill gaps
- Select a sample
- Analyze and note limits
- Act, then review
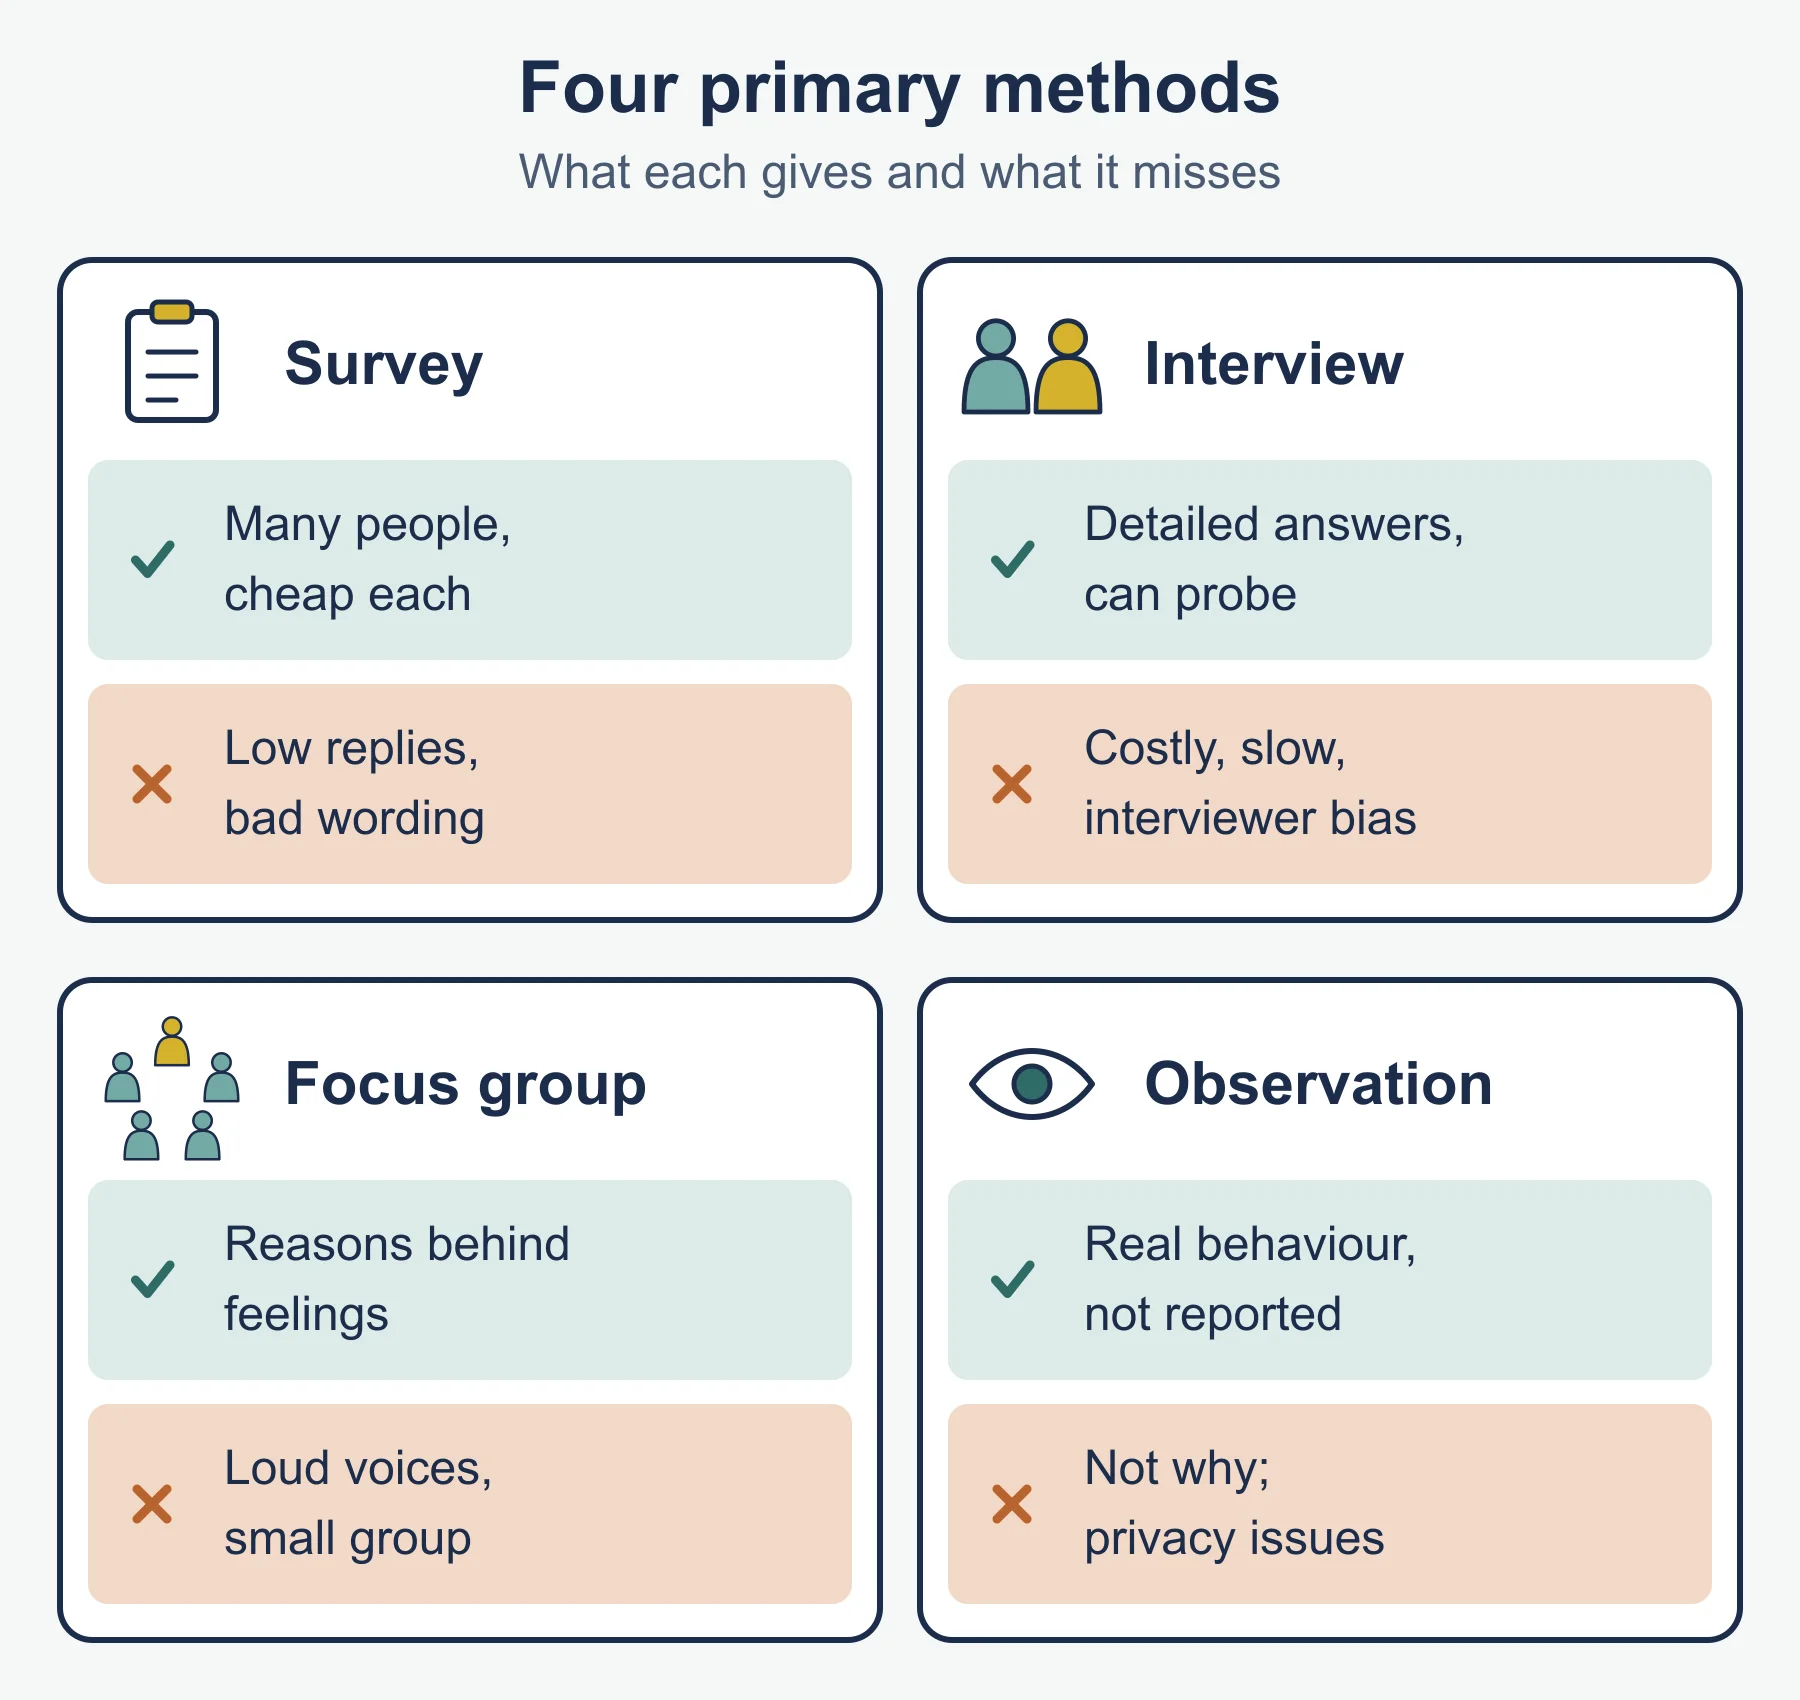
Primary methods at a glance
| Method | Best for | Main strength | Main limitation |
|---|---|---|---|
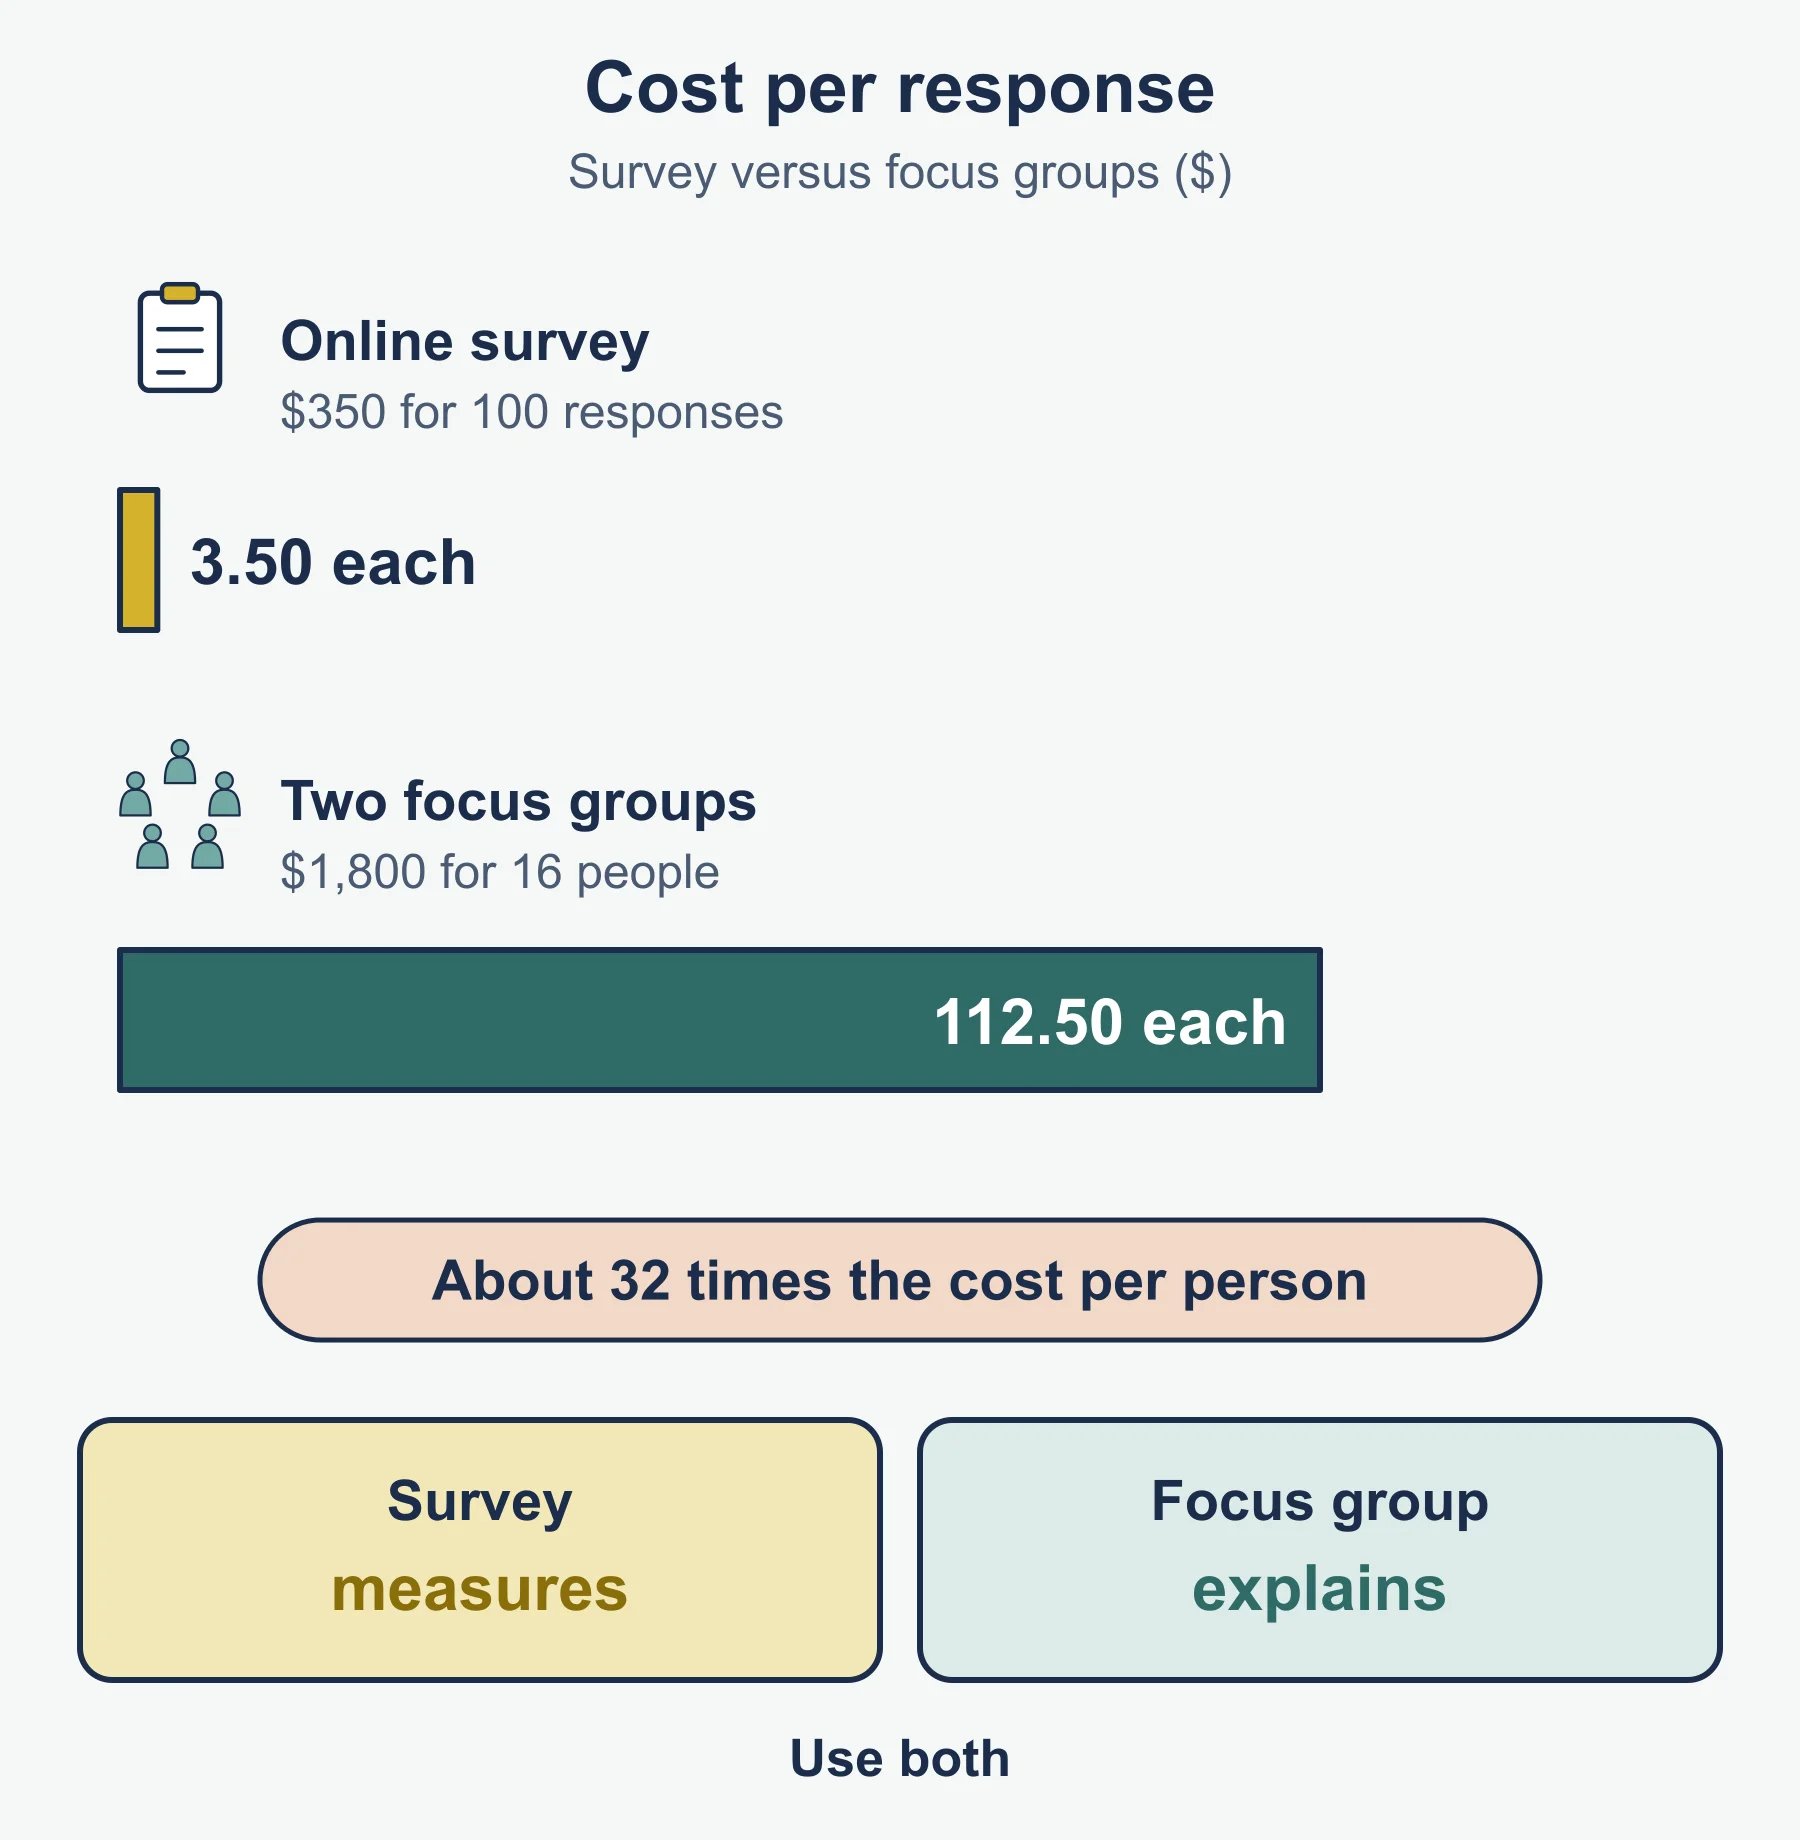
| Surveys | Measuring opinions across many people | Wide reach, low cost per response | Low response rates, honesty, poor wording |
| Interviews | Detailed views from individuals | Can probe and follow up | Slow, costly per person, interviewer influence |
| Focus groups | Reasons behind attitudes, reactions to ideas | Discussion reveals why people feel as they do | Small group, dominant voices, moderator influence |
| Observations | Real behavior, such as how shoppers move | Shows what people do, not what they say | Does not explain why, privacy concerns |
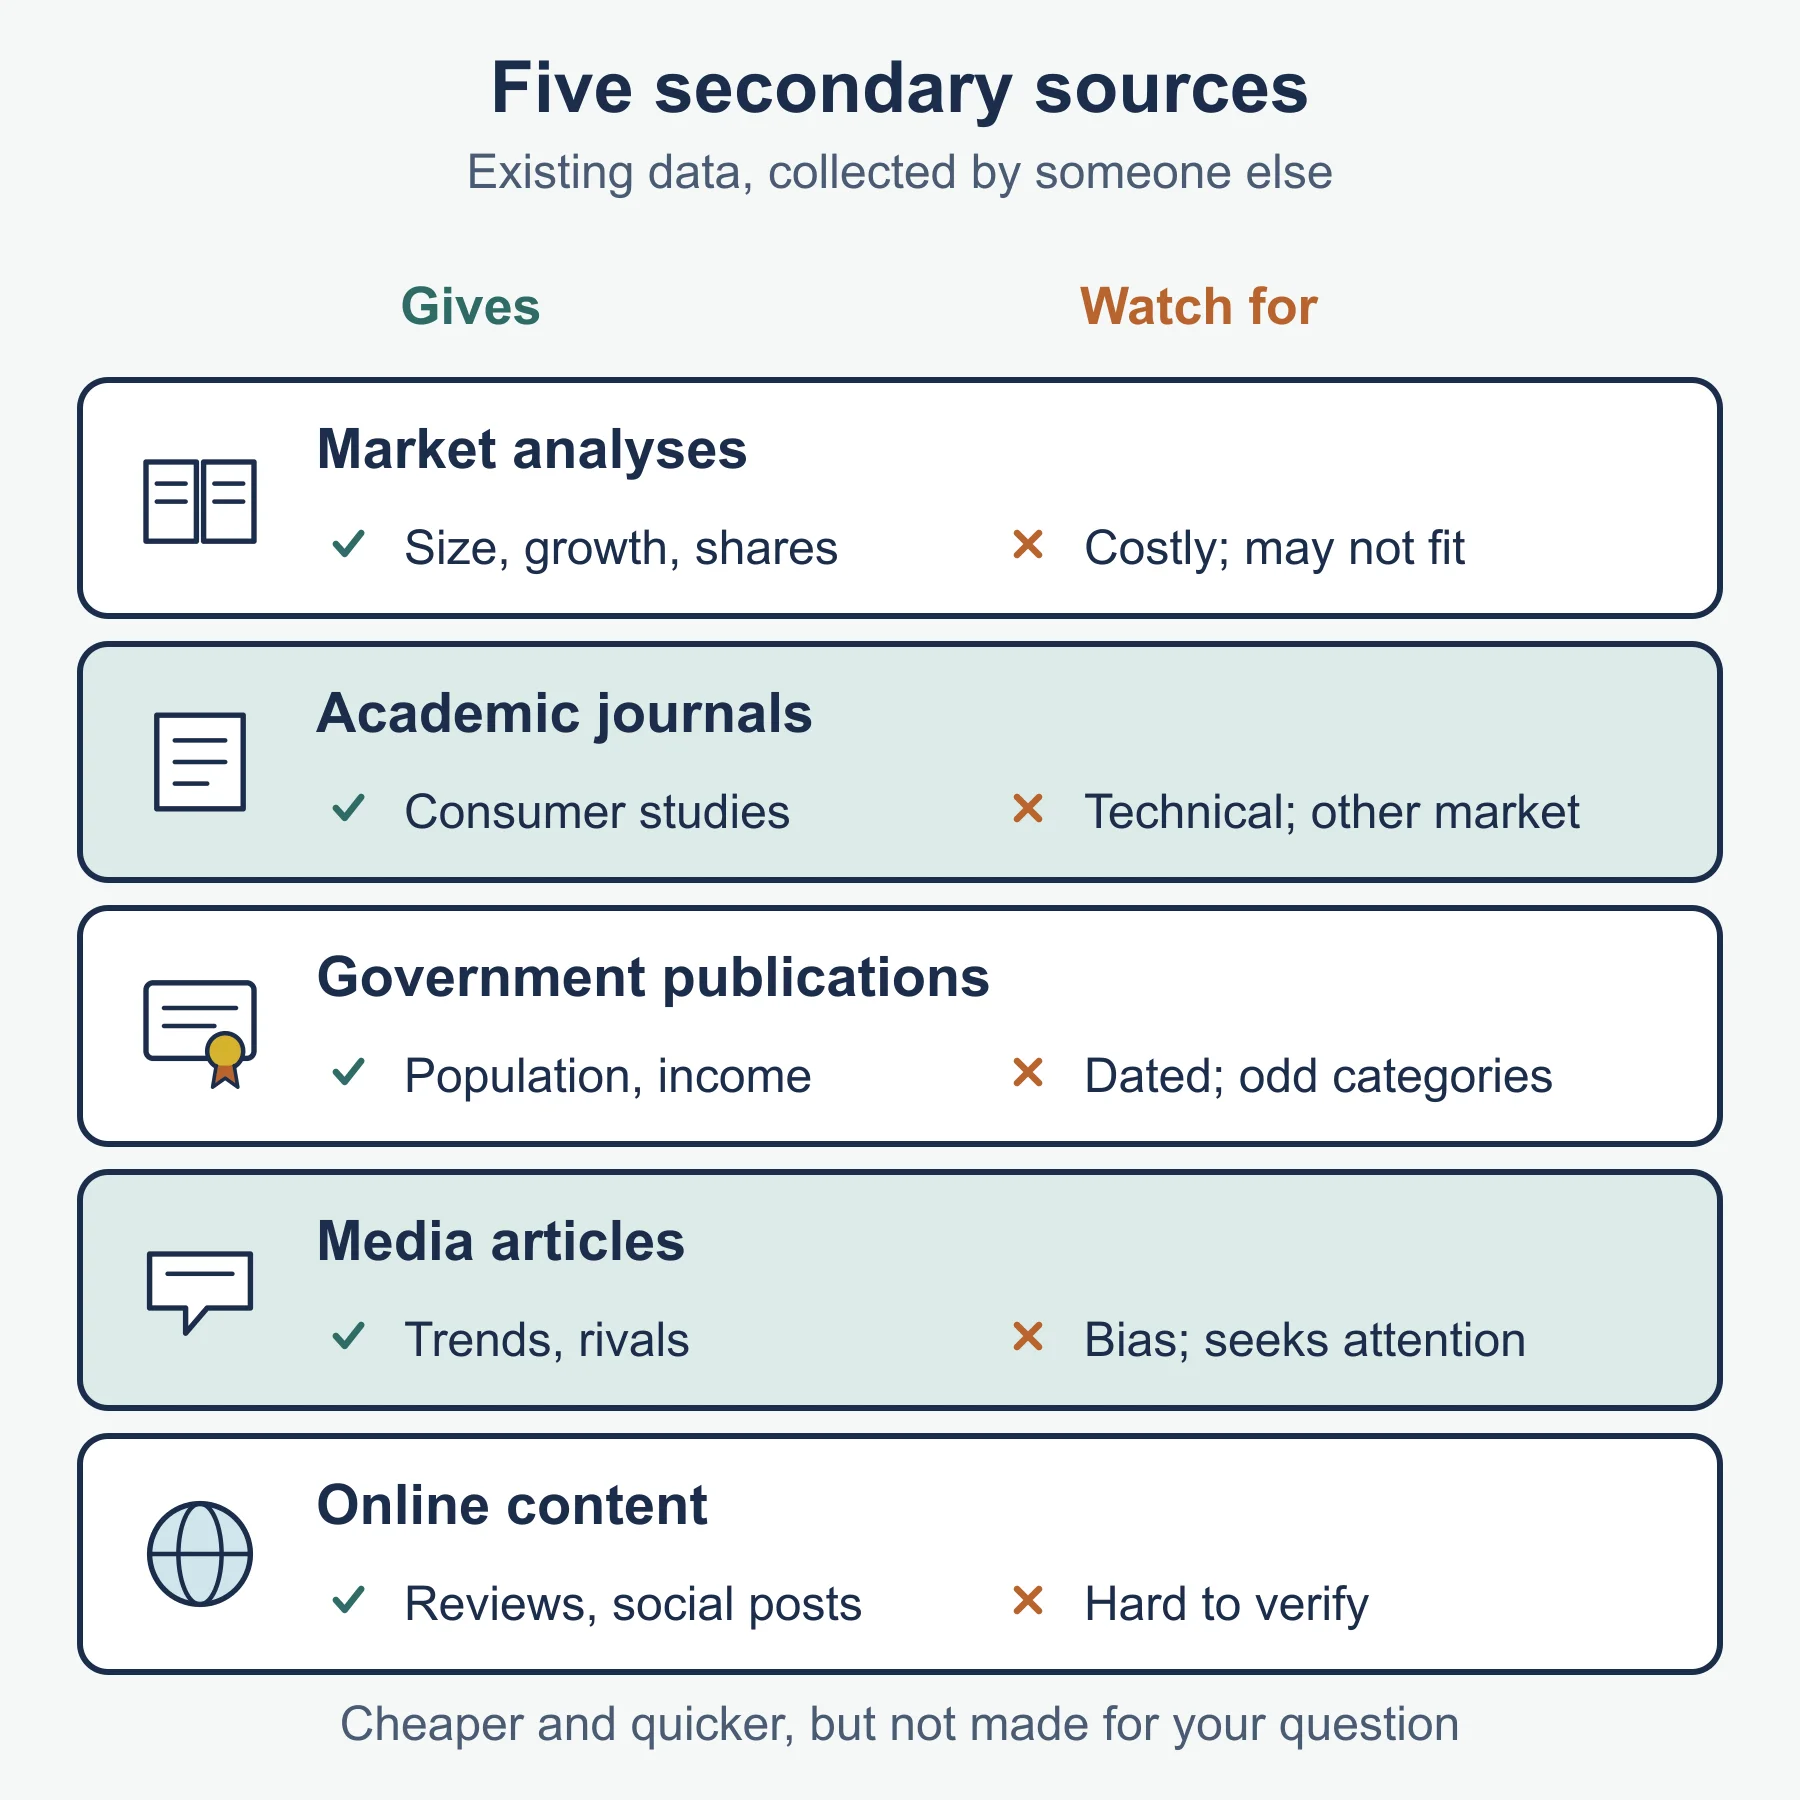
Secondary sources at a glance
| Source | Use | Caution |
|---|---|---|
| Market analyses | Size, growth, shares | Cost, may not fit your question |
| Academic journals | Consumer behavior research | Technical, may be dated or from another market |
| Government publications | Population, income, employment data | Dated, categories may not fit |
| Media articles | Trends and competitor news | Bias, headline-driven |
| Online content | Reviews, forums, social posts | Hard to verify, unrepresentative |
General: cheaper and faster than primary, but not designed for your question and not under your control.
Qualitative versus quantitative
- Quantitative: numbers, larger samples, easy to compare and total, but gives little reason.
- Qualitative: words and reasons, smaller samples, rich detail, but open to interpretation and hard to generalize.
- Best practice often uses both: qualitative to find the issues, quantitative to measure them.
- Do not label a method by name alone. A survey can be quantitative (closed questions) or partly qualitative (open questions).
Sampling methods
| Method | How it works | Strength | Limitation |
|---|---|---|---|
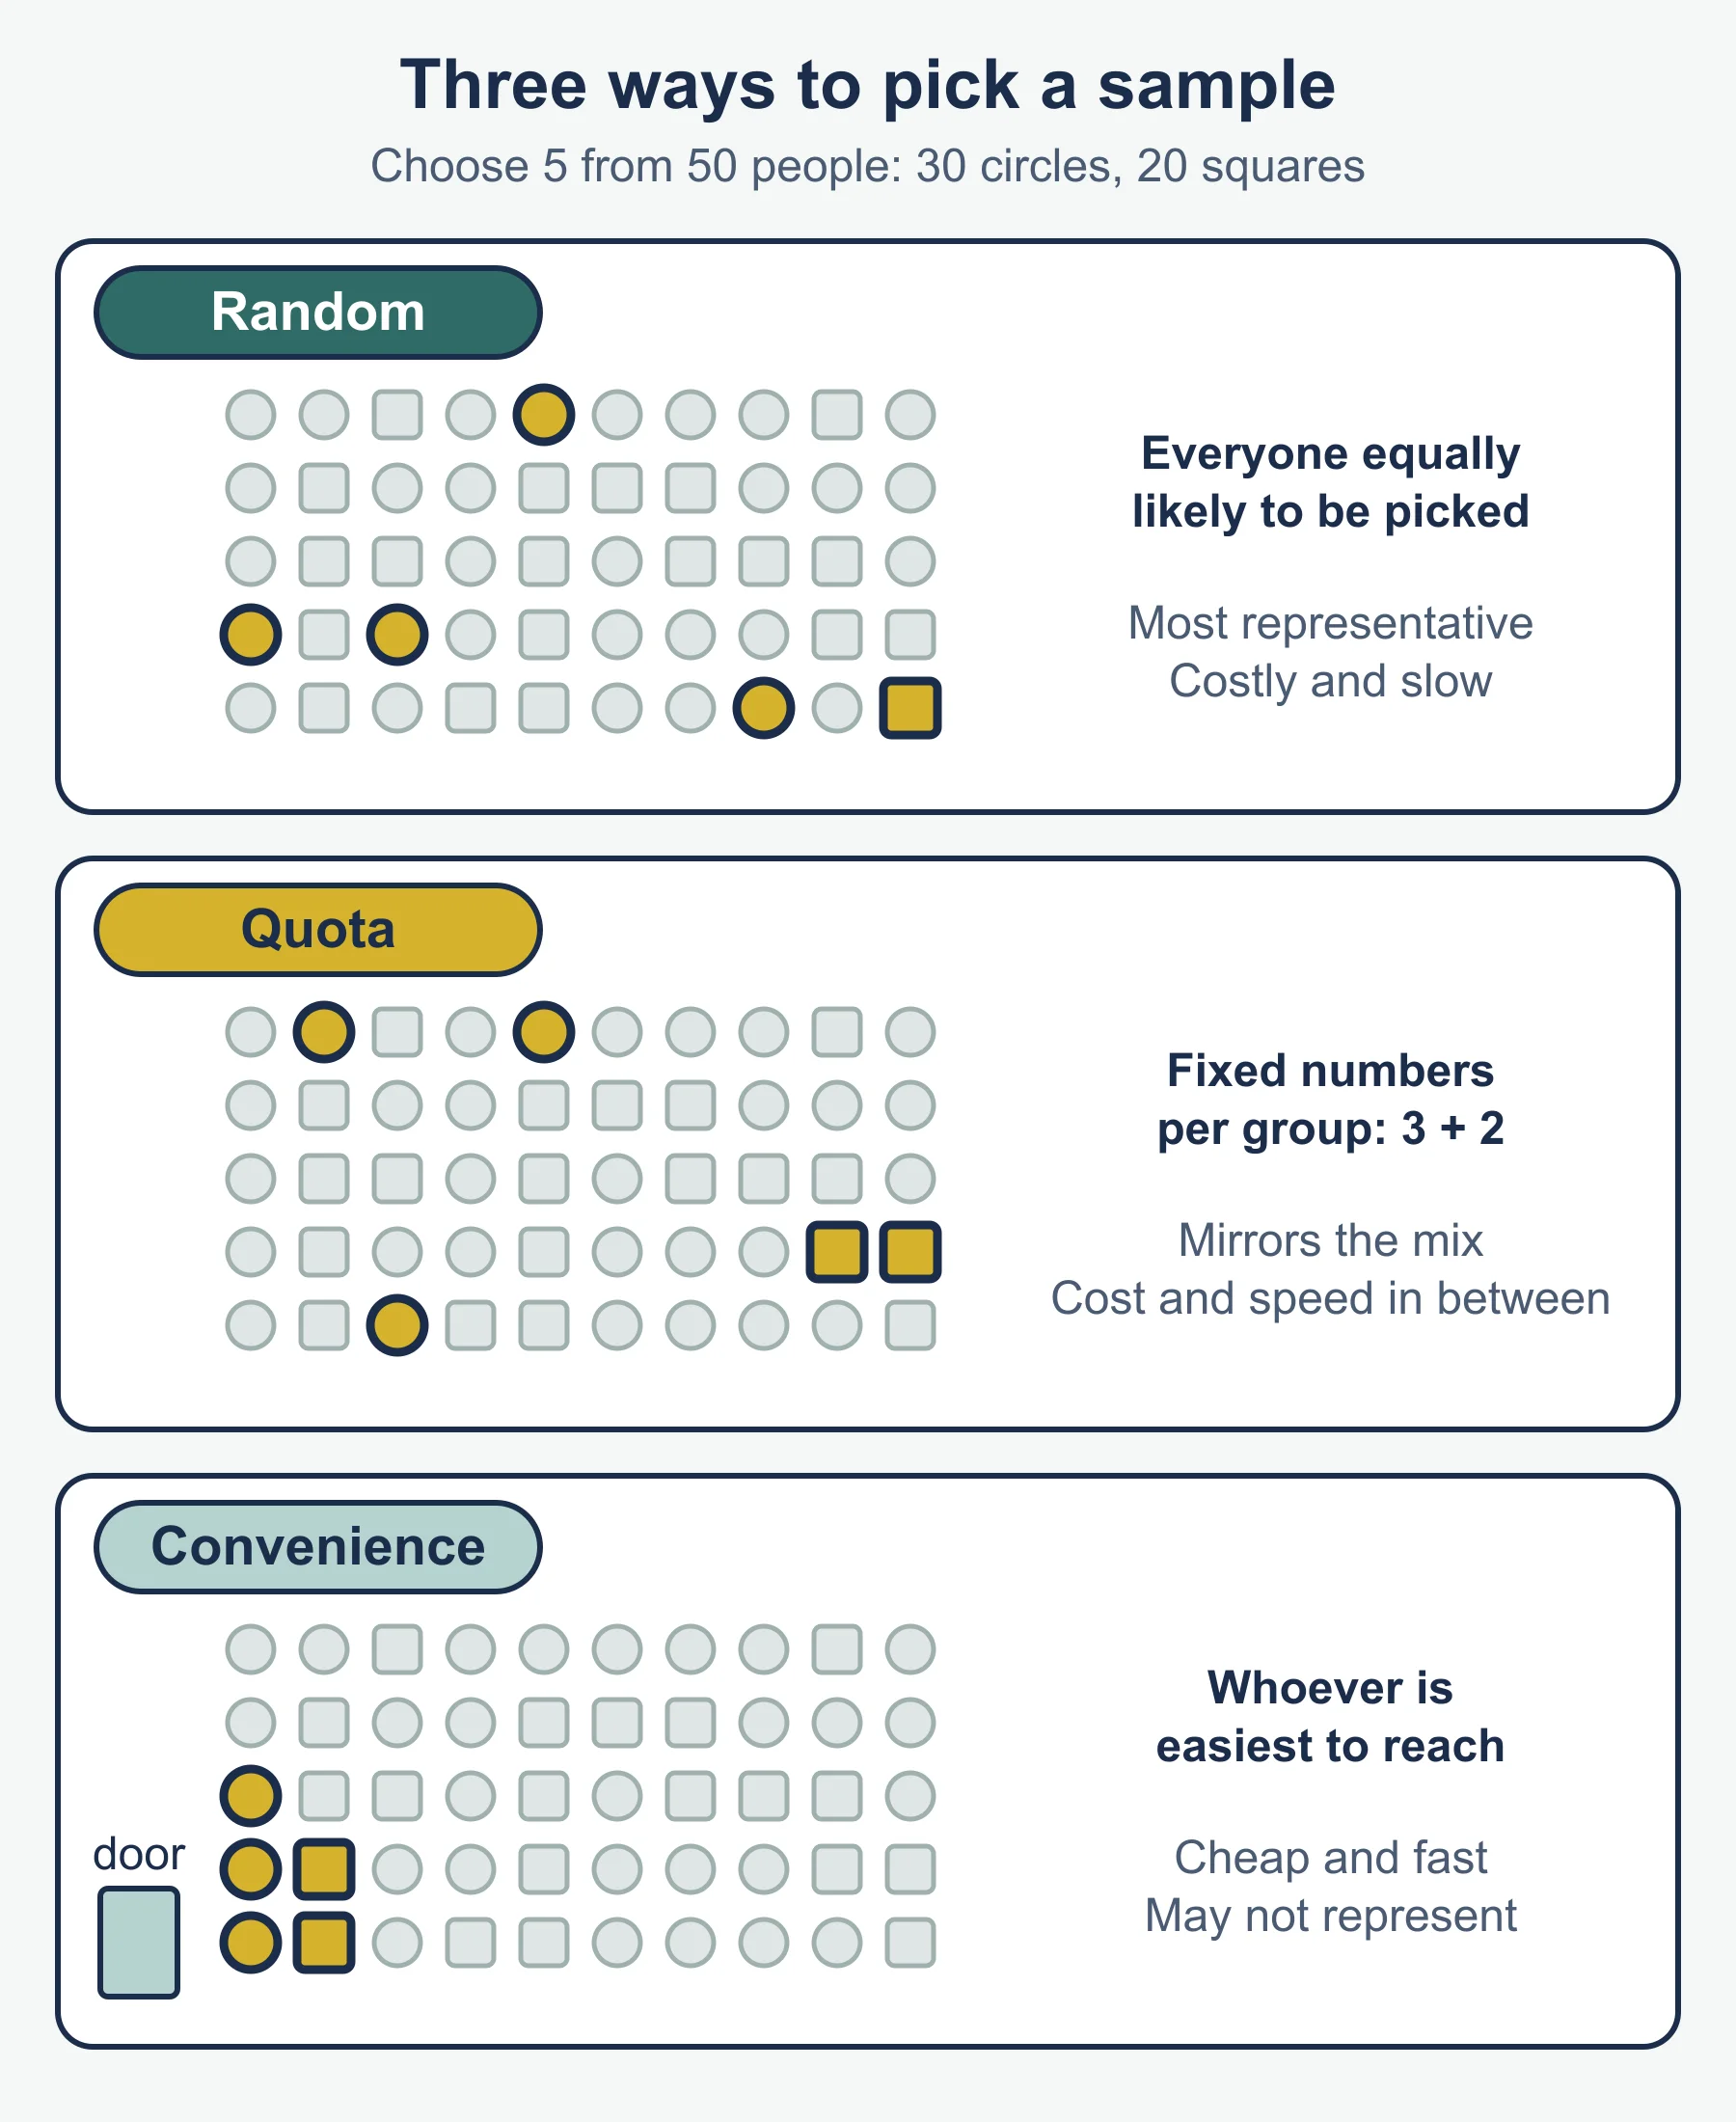
| Random | Everyone in the population has an equal chance | Limits researcher bias | Needs a full list; chance can still skew it |
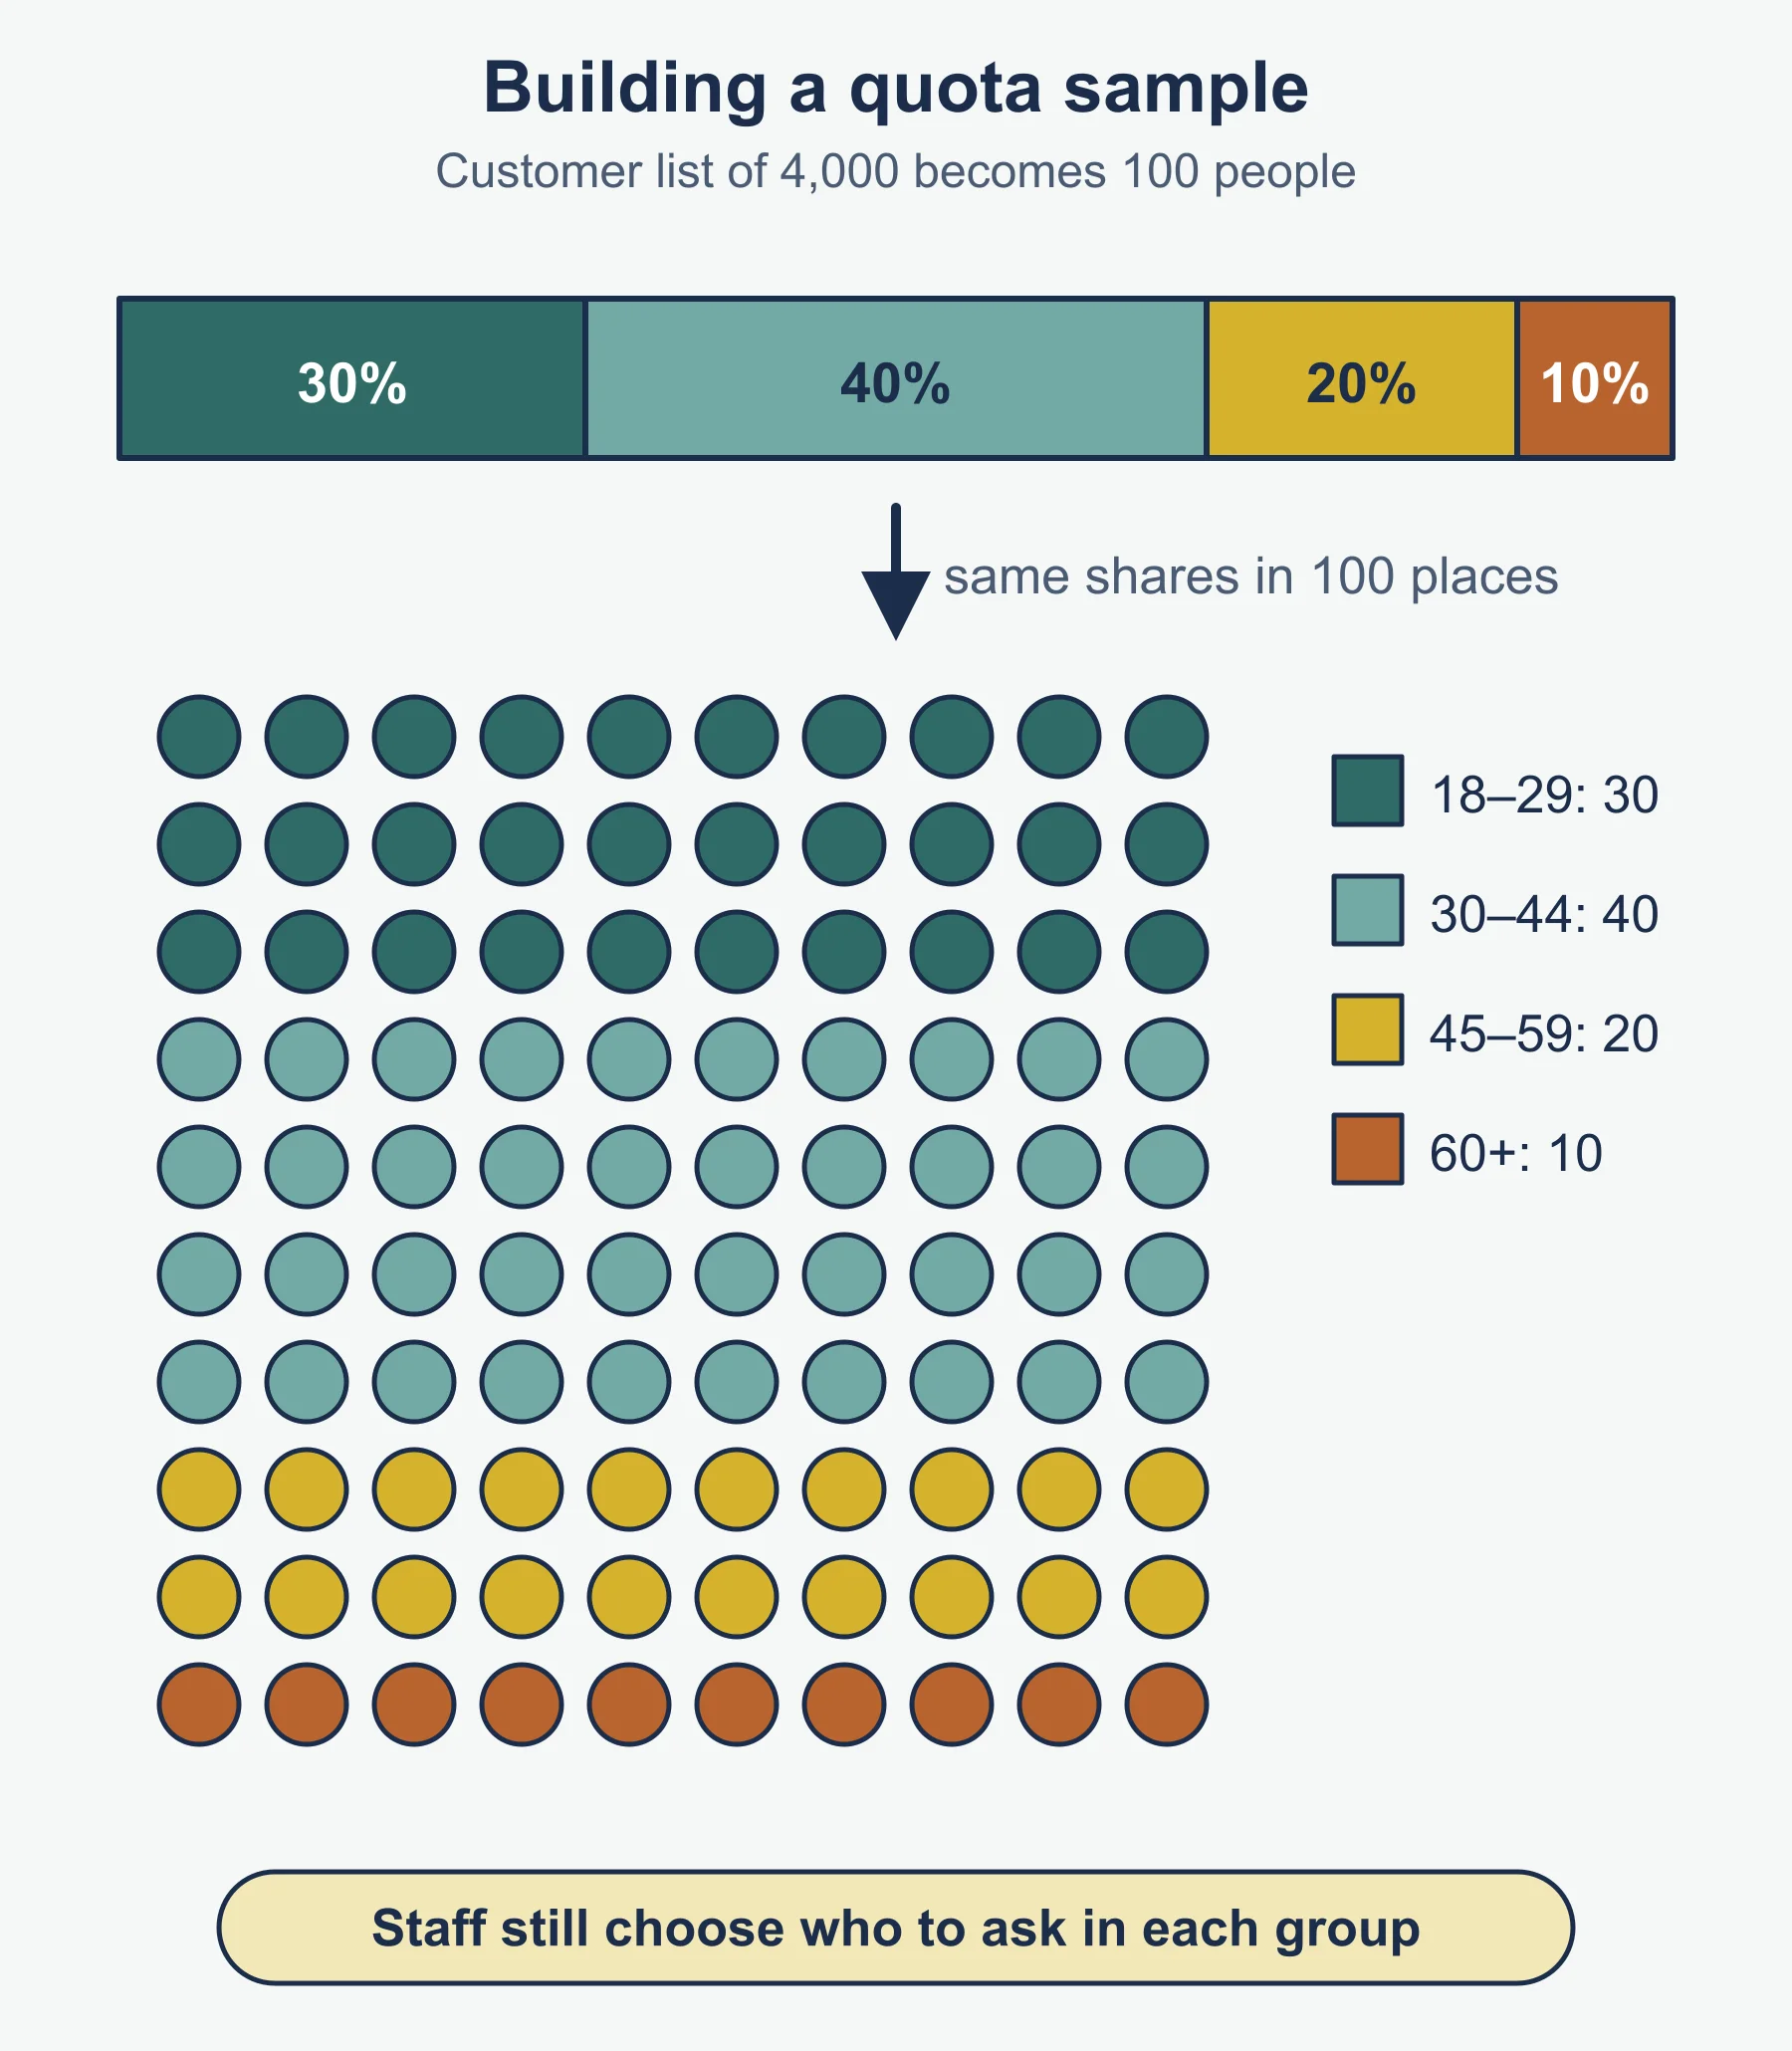
| Quota | Fixed numbers from each group, in proportion to the population | Guarantees each group appears; cheaper | Choice within each quota can be biased |
| Convenience | Ask whoever is easiest to reach | Quick and cheap | Least representative |
Quota calculation reminder: quota for a group = (group size / population size) × total sample.
Worked reminder: Plumbridge Soap Works has 600 customers, 70% women and 30% men, and wants a quota sample of 40. Women: 0.70 × 40 = 28. Men: 0.30 × 40 = 12. Total 28 + 12 = 40.
Bias reminders (extension: the content list does not include sample error or bias; they come from the guide’s suggested theory of knowledge questions): sample error (the sample differs from the population), selection bias (how people are chosen), non-response bias (people who reply differ from those who do not) and researcher bias (leading questions or interviewer influence). Larger samples and clear rules reduce these risks but do not remove them.
Must-know distinctions
- Primary versus secondary: who collected the data and for what purpose.
- Quantitative versus qualitative: type of data, not type of method.
- Random versus quota: random uses chance; quota uses groups and the researcher’s choice inside each.
- Focus group versus interview: the group setting produces discussion and shared influence; an interview gives one person’s view with no peer pressure.
- Survey versus observation: what people say versus what people do.
Method in steps: choosing and justifying a method
- State what the business needs to know.
- Say whether that need is numbers (quantitative) or reasons (qualitative).
- Name the method that fits and say why, using facts from the case.
- Give one limitation and, if possible, a remedy (for example, pair the survey with a focus group).
- Reach a judgment that links the choice to cost, time, risk or the decision at stake.
Worked reminders for calculations
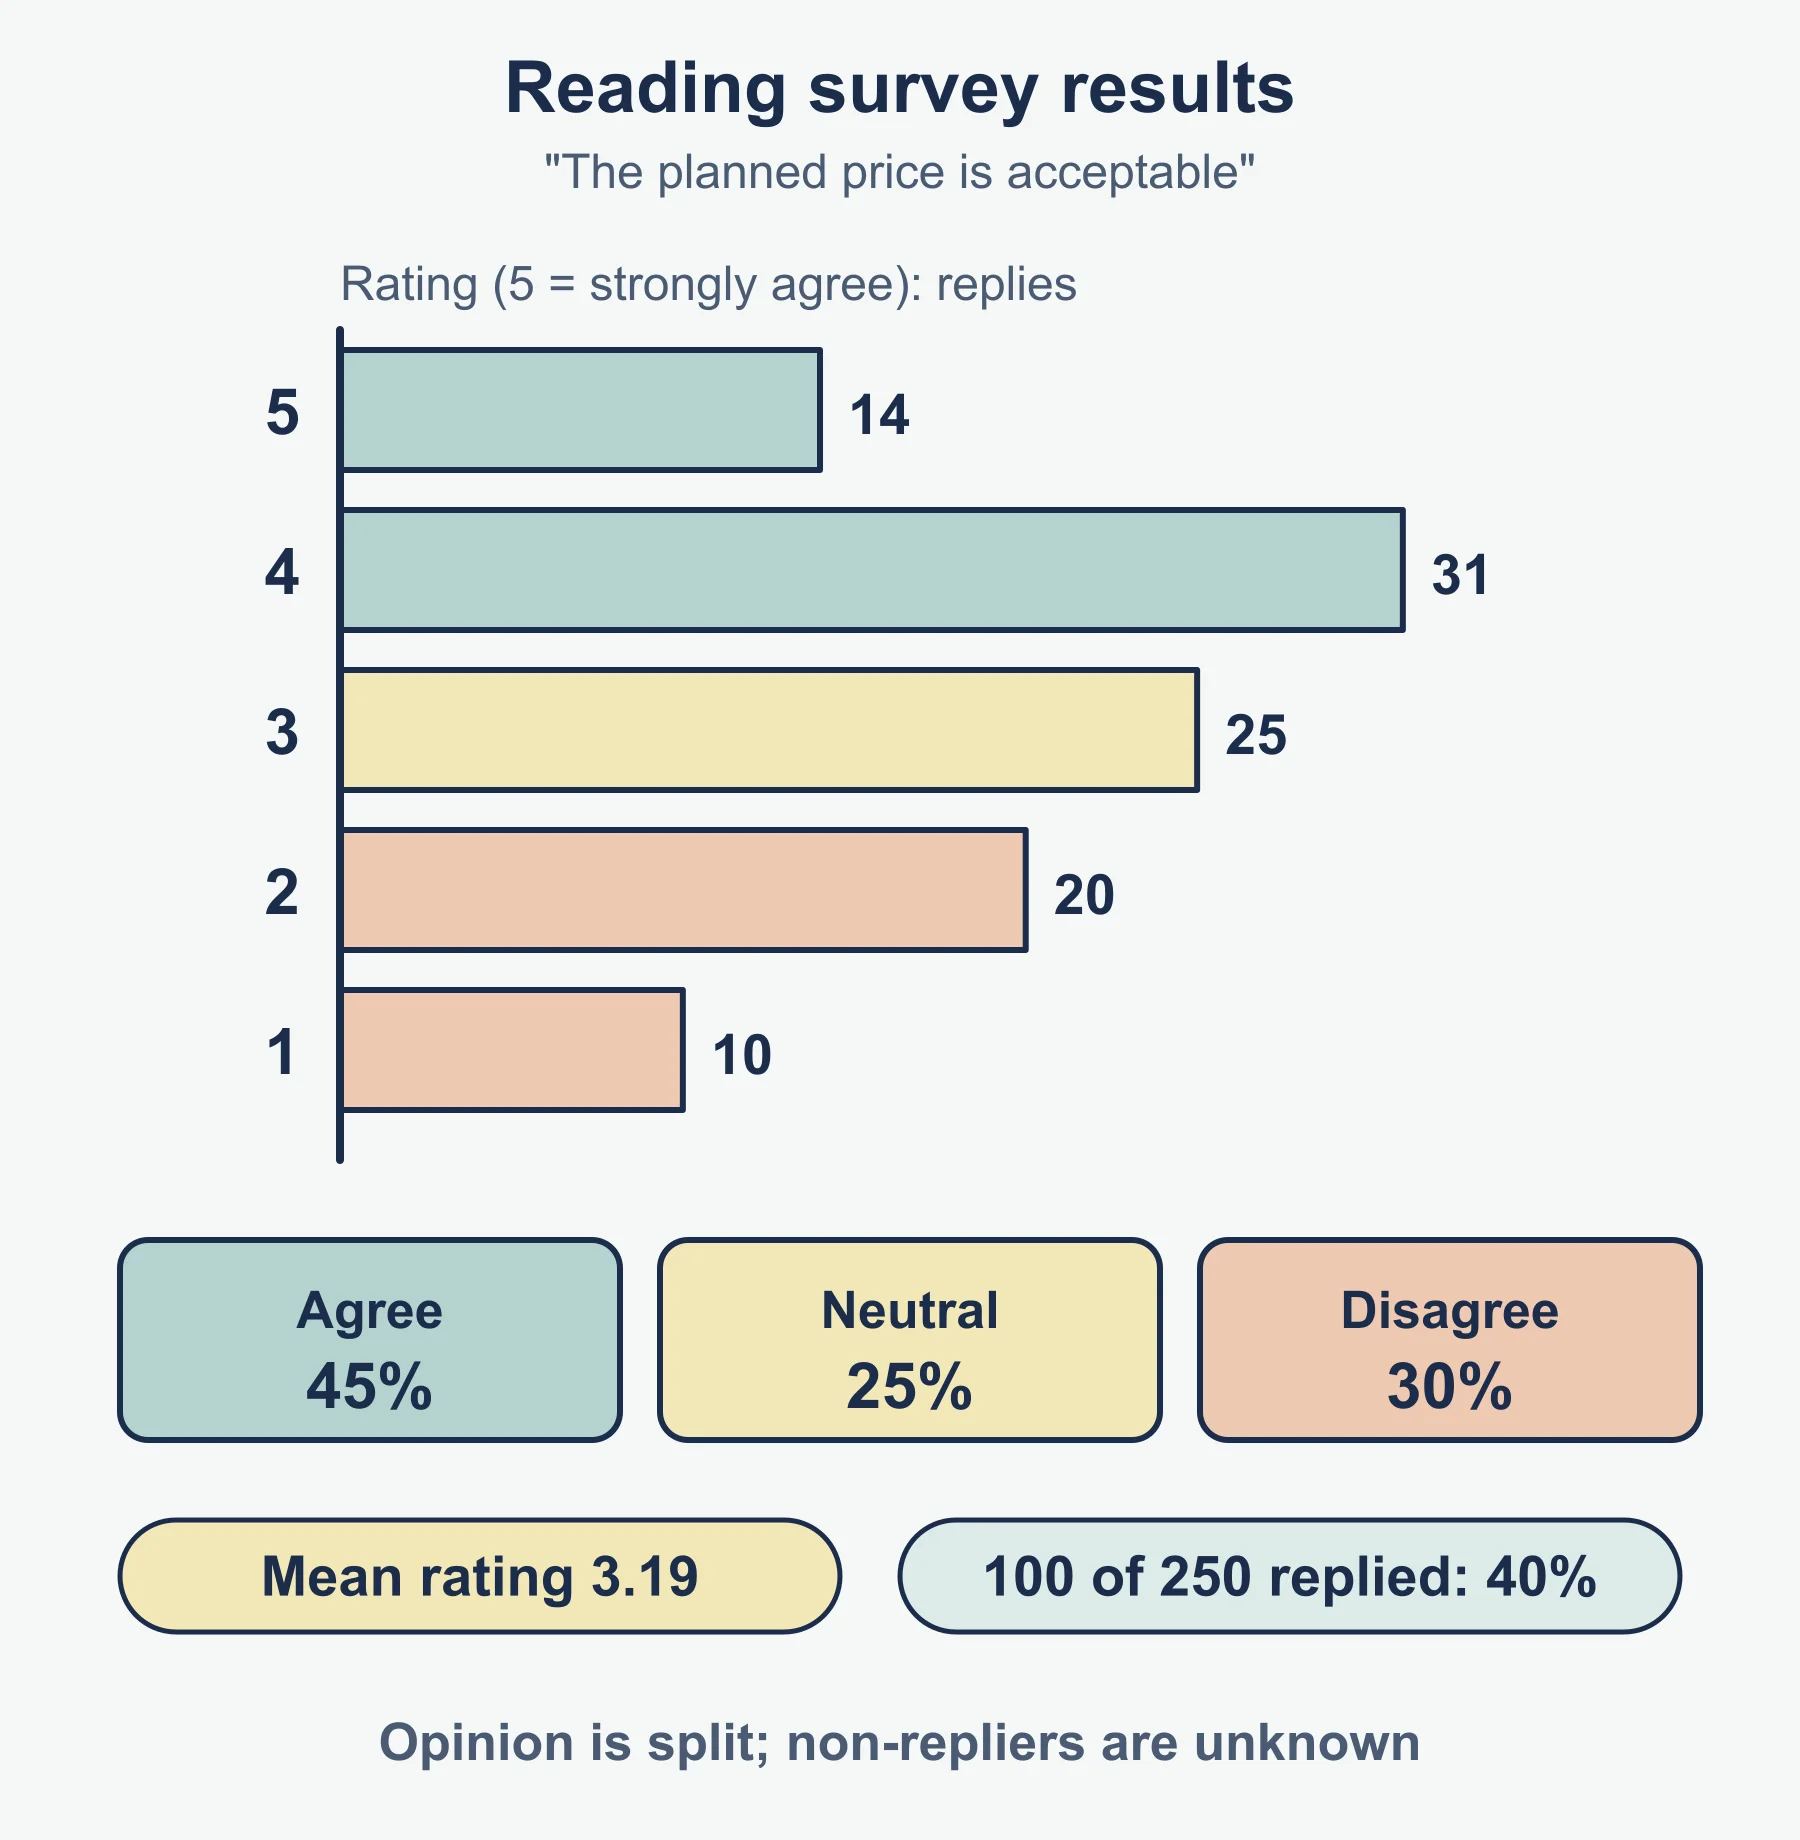
Plumbridge Soap Works posts a short survey to 120 customers and gets 30 replies. Respondents rate a new soap scent from 1 to 5: eight give 5, twelve give 4, six give 3, three give 2 and one gives 1.
- Response rate: 30 / 120 = 25%
- Total score: 5 × 8 + 4 × 12 + 3 × 6 + 2 × 3 + 1 × 1 = 40 + 48 + 18 + 6 + 1 = 113
- Mean rating: 113 / 30 = 3.77 to three significant figures
- Share rating 4 or 5: (8 + 12) / 30 = 20 / 30 = 66.7%
Always state the base of a percentage. Here the percentage who rate the scent highly is out of the 30 who replied, not out of the 120 who were asked. Then add a comment: a 25% response rate means the replies may come from customers with stronger views, so the result is indicative and not conclusive.
Writing evaluation answers on research
When a question says evaluate or justify, a short frame helps:
- Name the options in the case (for example survey or focus group, quota or convenience sample).
- Give a strength of each that uses a fact from the stem.
- Give a limitation of each that uses a fact from the stem.
- Weigh the points against the decision at stake: how costly is a wrong decision, how much time is there, how big is the budget?
- Choose one option, or a combination, and say what would change your mind.
Useful linking ideas: research is worth more when the investment is large and hard to reverse; qualitative work is worth more when the reasons are unknown; quantitative work is worth more when the business needs to measure how common a view is; secondary data is worth more at the start because it is cheap.
Question design and bias
Extension beyond the content list, linked to the guide’s theory of knowledge questions on bias and focus group language. Even a well-chosen sample can mislead if the questions are poor. Watch for these:
- Leading questions that suggest the “right” answer
- Questions that ask two things at once
- Rating scales with no clear labels
- Interviewers or moderators who react to answers and so steer the next ones
- Participants who say what they think the researcher wants to hear
Remedies include testing the questionnaire on a few people first, using neutral wording, training the interviewer, and combining methods so that one method checks another. These points link to the sample error and bias issues in the sampling table above.
Quick self-test
- Define primary research.
- Name the five types of secondary research listed in 4.4.
- Give one reason why a business might prefer secondary research to primary research at the start of a project.
- Is a set of comments from a focus group qualitative or quantitative?
- State the sampling method in which every member of the population has an equal chance of selection.
- A town has 5,000 members in a sports club: 3,000 adults and 2,000 juniors. Find the quota for juniors in a sample of 50.
- A survey is sent to 300 customers and 75 reply. Calculate the response rate.
- Give one limitation of convenience sampling.
- Why might observation give different results from a survey on the same topic?
- A manager says “our survey was qualitative because it was online”. Explain what is wrong with this claim.
Answers
- New data collected for the business’s own purpose.
- Market analyses, academic journals, government publications, media articles, online content.
- It is usually cheaper and quicker, and it shows what is already known so primary work can focus on the gaps.
- Qualitative.
- Random sampling.
- 2,000 / 5,000 × 50 = 20 juniors.
- 75 / 300 = 25%.
- The people who are easy to reach may not represent the target market, so results may be biased.
- People may report their behavior inaccurately, while observation records what they actually do.
- Online is how the survey was delivered, not what type of data it produced. If the questions are closed with ratings, the data is mainly quantitative.
Where marks are usually lost
- Listing a method without saying why it suits the business in the case.
- Giving only advantages or only disadvantages when the command term asks you to evaluate or justify.
- Treating quota sampling as random sampling.
- Confusing the type of data with the type of method.
- Not using numbers from the stem, such as sample size, cost or response rate.
- Describing a source of secondary research with no mention of what the business would learn.
- Forgetting to give a judgment at the end of a longer answer.
- Writing about market research in general terms and not about the product or market in the case.
Frequently asked questions
What are the five types of secondary research in IB Business Management? Section 4.4 lists market analyses, academic journals, government publications, media articles and online content as secondary research.
How do you calculate a quota for a group in a sample? The quota for a group is the group size divided by the population size, multiplied by the total sample. For example, 2,000 juniors in a club of 5,000 gives a quota of 20 in a sample of 50.
Is an online survey qualitative or quantitative? It depends on the questions, not the delivery method. A survey with closed questions produces mainly quantitative data, while open questions produce qualitative data.
Why might observation give different results from a survey? People may report their behaviour inaccurately in a survey, while observation records what they actually do.
Official syllabus
IB Diploma Programme Business management guide, first assessment 2024, published by the International Baccalaureate Organization. These notes cover section 4.4 Market research.
Get free revision emails (optional)
Occasional emails with practice questions, worked explanations and links to free resources for the qualification and subjects you choose. No spam, and you can unsubscribe from any email. The free tools on this site never need an email.
Related resources
-
Study guides
IB DP Business Management: Sales forecasting (HL only)
Study guide to the benefits and limitations of sales forecasting, with simple linear regression worked through, for IB DP Business Management HL.
Business · International Baccalaureate · IB
Read guide -
Practice questions
IB DP Business Management: Sales forecasting (HL only) – Practice Questions
Original practice questions with worked answers on sales forecasting and simple linear regression for IB DP Business Management HL, section 4.3.
Business · International Baccalaureate · IB
Try questions -
Revision notes
IB DP Business Management: Sales forecasting (HL only) – Revision Notes
Condensed revision notes on sales forecasting benefits, limitations and simple linear regression, with a self-test, for IB Business Management HL.
Business · International Baccalaureate · IB
Revise topic
Related articles
-
teaching
A Level tuition in Dubai: Cambridge or Pearson Edexcel International A Level?
Schools in Dubai and Abu Dhabi teach either Cambridge International AS & A Level or Pearson Edexcel International A Level. How the two are structured, why it matters for tuition, and how online classes from Lahore work.
9 October 2026
-
curriculum guides
Choosing subjects at IGCSE and A Level
How subject choices at 14 and 16 affect university options later, and how to keep pathways open without overloading a timetable.
28 July 2026
Studying this with a teacher
Working through Business IB?
This page is free and stays free. If you would rather be taught it, Marlbridge runs Business classes one-to-one, online in your own time zone. The first trial class is free. WhatsApp replies within an hour (8am–11pm Pakistan time, every day); email the same day.
IB Business teachers at Marlbridge

