
Study Guides
IB DP Business Management: Introduction to operations management and Operations methods
Study guide to IB DP Business Management 5.1 and 5.2: the role of operations management and job, batch, mass/flow and mass customization.
- Subject
- Business
- Level
- IB
- Topic
- Unit 5: Operations management
- Author
- Marlbridge Academic Team
- Updated
- Reviewed by
- Salman Ahmad (what this means)
Aligned to International Baccalaureate IB Diploma Programme Business (DP Business Management), First assessment 2024. Official specification .
Syllabus page (what it covers and how it is assessed): IB Diploma Programme Business.
Syllabus points this page covers
DP Business Management
- 5.1 Introduction to operations management
- 5.2 Operations methods
Found an error? Report a correction.
Need help with this topic? Request a free trial class for IB Diploma Programme Business (DP Business Management).
This guide covers sections 5.1 Introduction to operations management and 5.2 Operations methods of the IB Business management guide (first assessment 2024), for SL and HL. Neither section is marked HL only. The guide sets 5.1 at AO2 (application and analysis) and 5.2 at AO3 (synthesis and evaluation), so for 5.2 you must be ready to weigh methods against each other, not just describe them. Course hub: IB DP Business Management. Tick-list: printable checklist. Spot your weak areas with the free diagnostics. Next: the revision notes and the practice questions.
What this unit covers
| Section | What you must be able to do | Depth (from the guide) |
|---|---|---|
| 5.1 | Explain the role of operations management | AO2 |
| 5.2 | Job production | AO3 |
| 5.2 | Batch production | AO3 |
| 5.2 | Mass/flow production | AO3 |
| 5.2 | Mass customization | AO3 |
The guide lists “the role of operations management” as a single content point and gives no further breakdown. The detail in the next section is therefore the standard understanding of the term, built so that you can apply it to a case study. Where this guide gives a formula the official text does not give, it says so.
5.1 The role of operations management
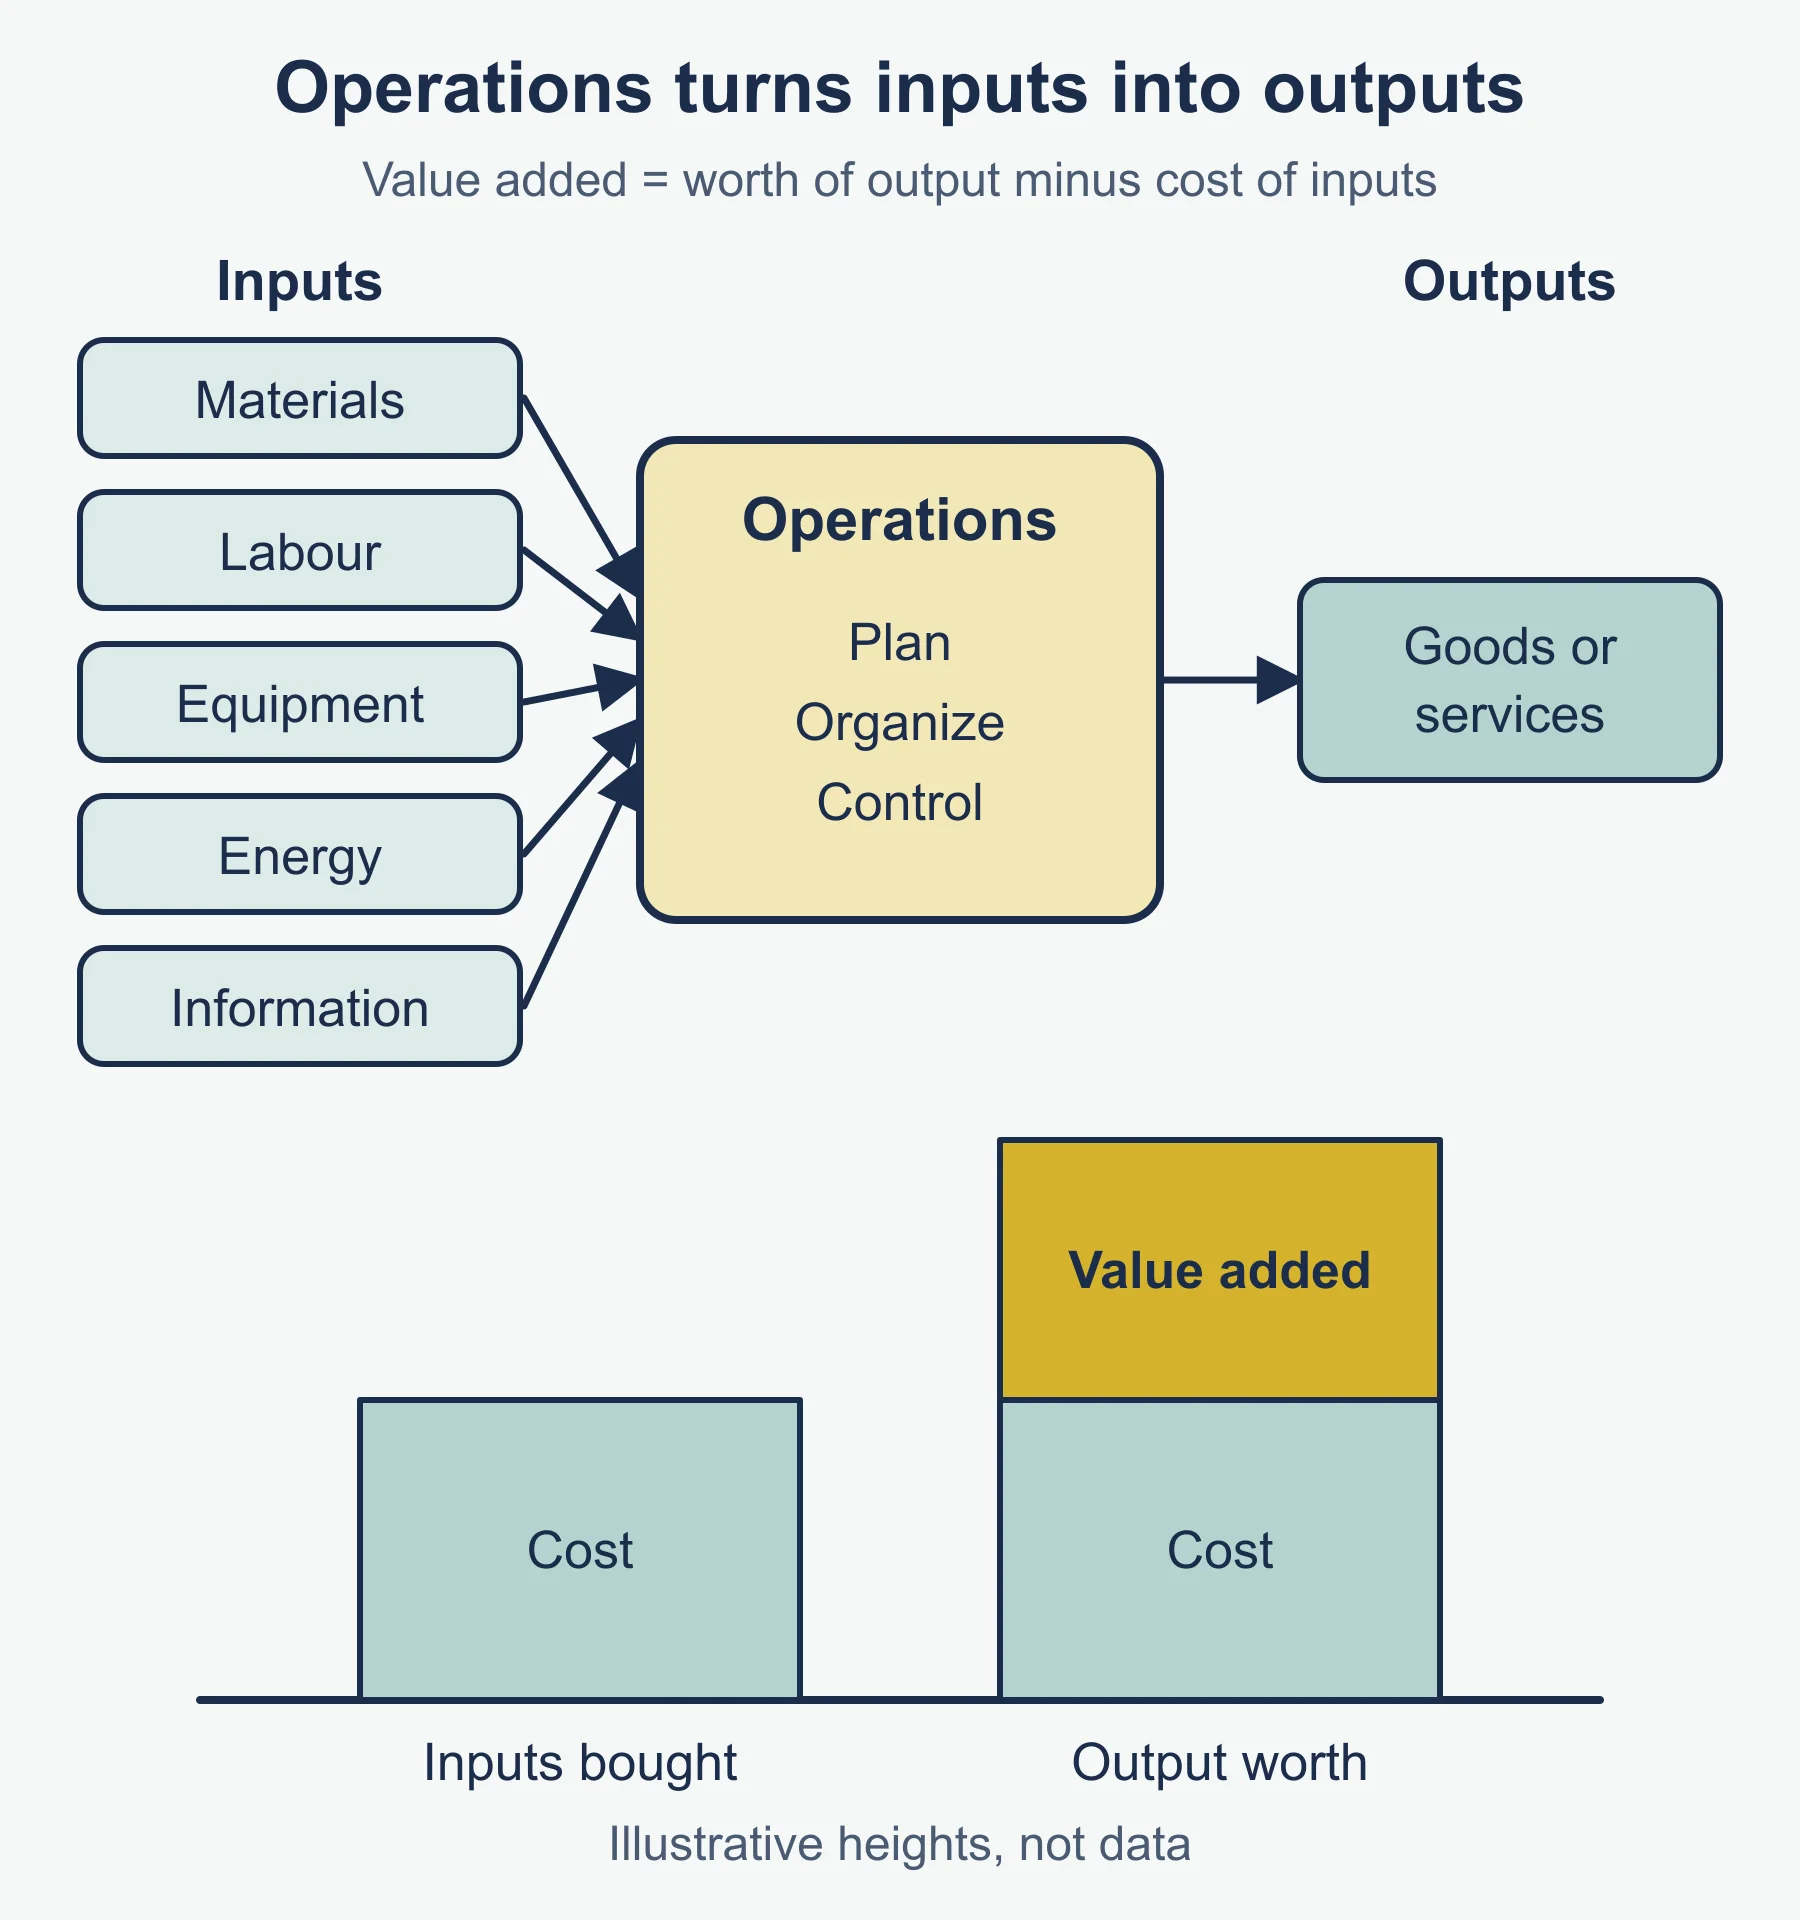
Operations management is the part of a business that plans, organizes and controls the process that turns inputs into outputs. Inputs are resources such as materials, labour, equipment, energy and information. Outputs are the goods or services the customer receives. The difference between what the output is worth and what the inputs cost is the value added. This is the standard form of the definition, so state it in your own words and tie it to the business in the question.
Operations exist in every organization, including a clinic, a school, a charity or a software firm. A restaurant transforms ingredients and staff time into meals. A courier transforms vehicles and drivers into delivery. Do not treat operations as “factory work” only.
What operations managers are responsible for
Use this list as a checklist when a case study asks why operations matter. Each item is a decision someone has to take.
- Output level and capacity. How much to produce, and how much a site can produce at most.
- Quality. Whether the product meets what the customer expects, and what it costs when it does not.
- Cost and efficiency. Getting the required output from fewer or cheaper inputs.
- Timing. Delivering when promised, and not holding stock for longer than needed.
- Method of production. Choosing between the four methods in 5.2.
- Suppliers and inventory. Securing inputs and storing them sensibly.
- Sustainability and ethics. Waste, energy use, working conditions and sourcing.
Links to other functions
The guide’s conceptual understandings give you the best framework for an analysis answer.
- Change in operations impacts other business activities. A move to automated production changes the finance function (capital spending), human resources (skills, redundancies, training) and marketing (delivery times, price).
- A creative production process can disrupt the market. A business that finds a new way to make or deliver a product can undercut or outperform rivals using older methods.
- Operational changes may affect the ethical stance of the business. Cutting cost by cutting corners on safety or pay is an ethical decision, not only a financial one.
- Sustainability ensures efficiency in business operations. Using fewer resources and wasting less often lowers cost as well as harm to the environment.
The guide suggests decision trees, descriptive statistics and circular business models as tools to integrate in this unit. You will see the first two in the worked examples below. A circular business model keeps materials in use through reuse, repair or recycling instead of a one-way take, make, dispose line.
5.2 Operations methods
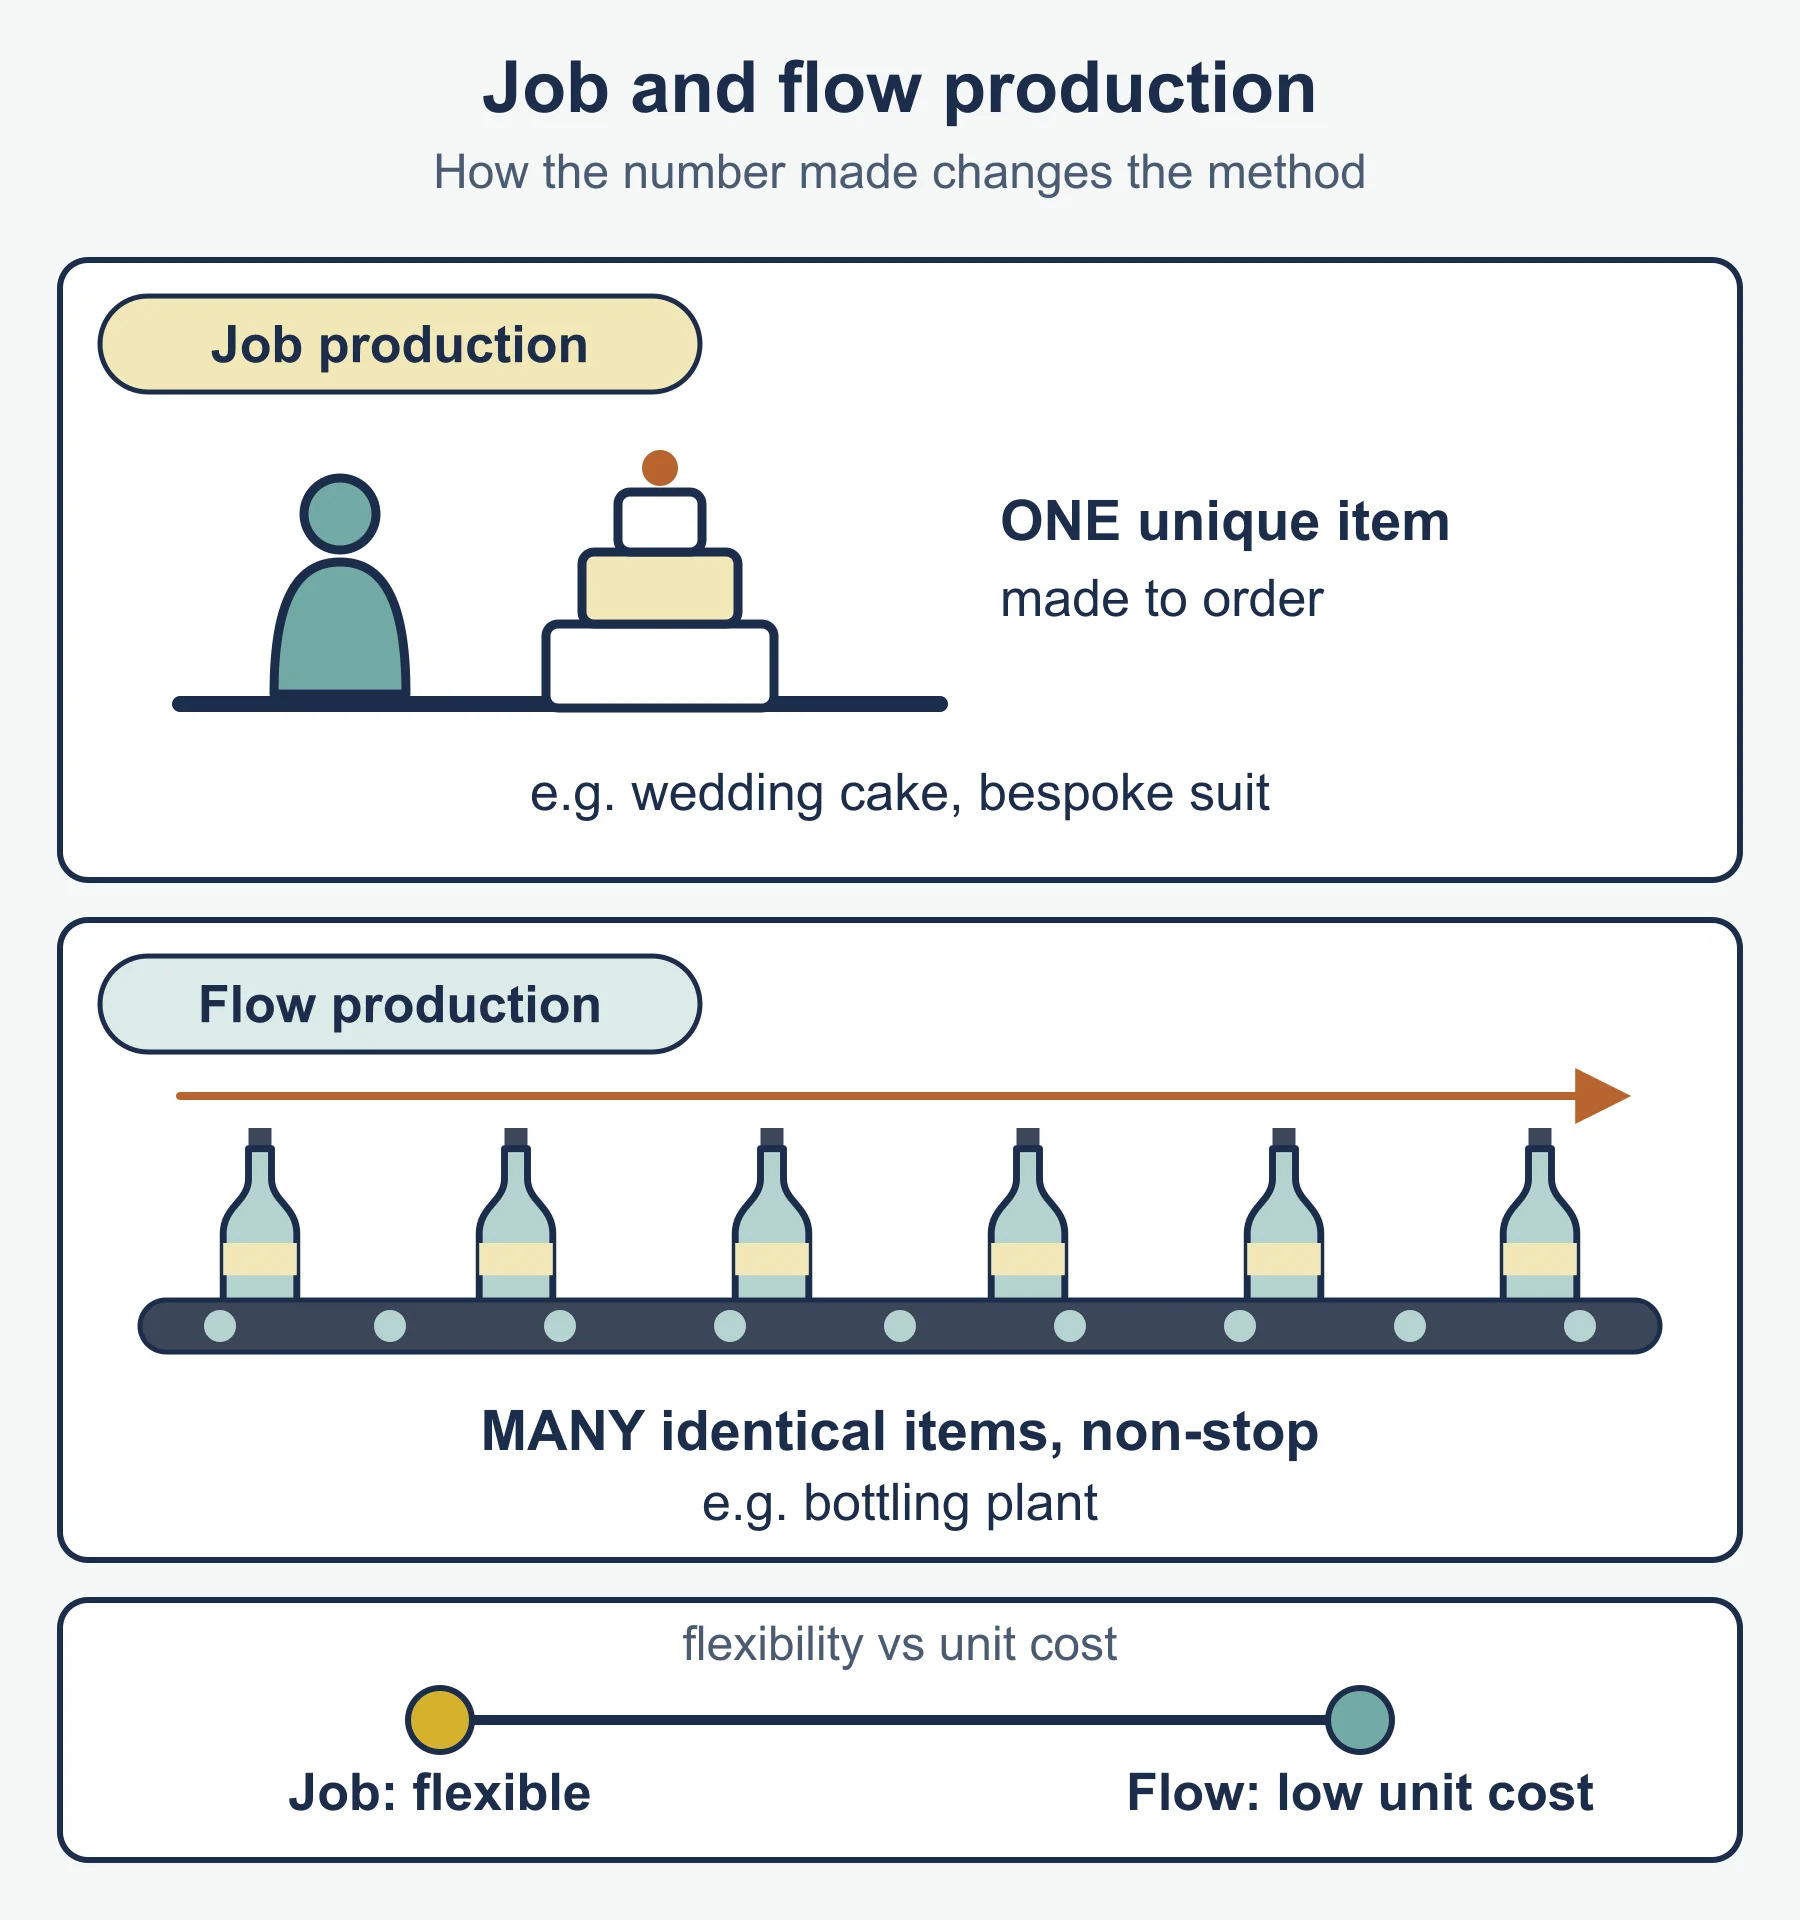
The four methods differ in two things: how many identical units are made, and how closely each unit matches an individual customer’s wishes. Think of a line from “one unique unit” to “huge numbers of identical units”, with mass customization sitting on the high-volume end but with variety added.
Job production
Job production makes a single, one-off product to a customer’s specification. Each job is different.
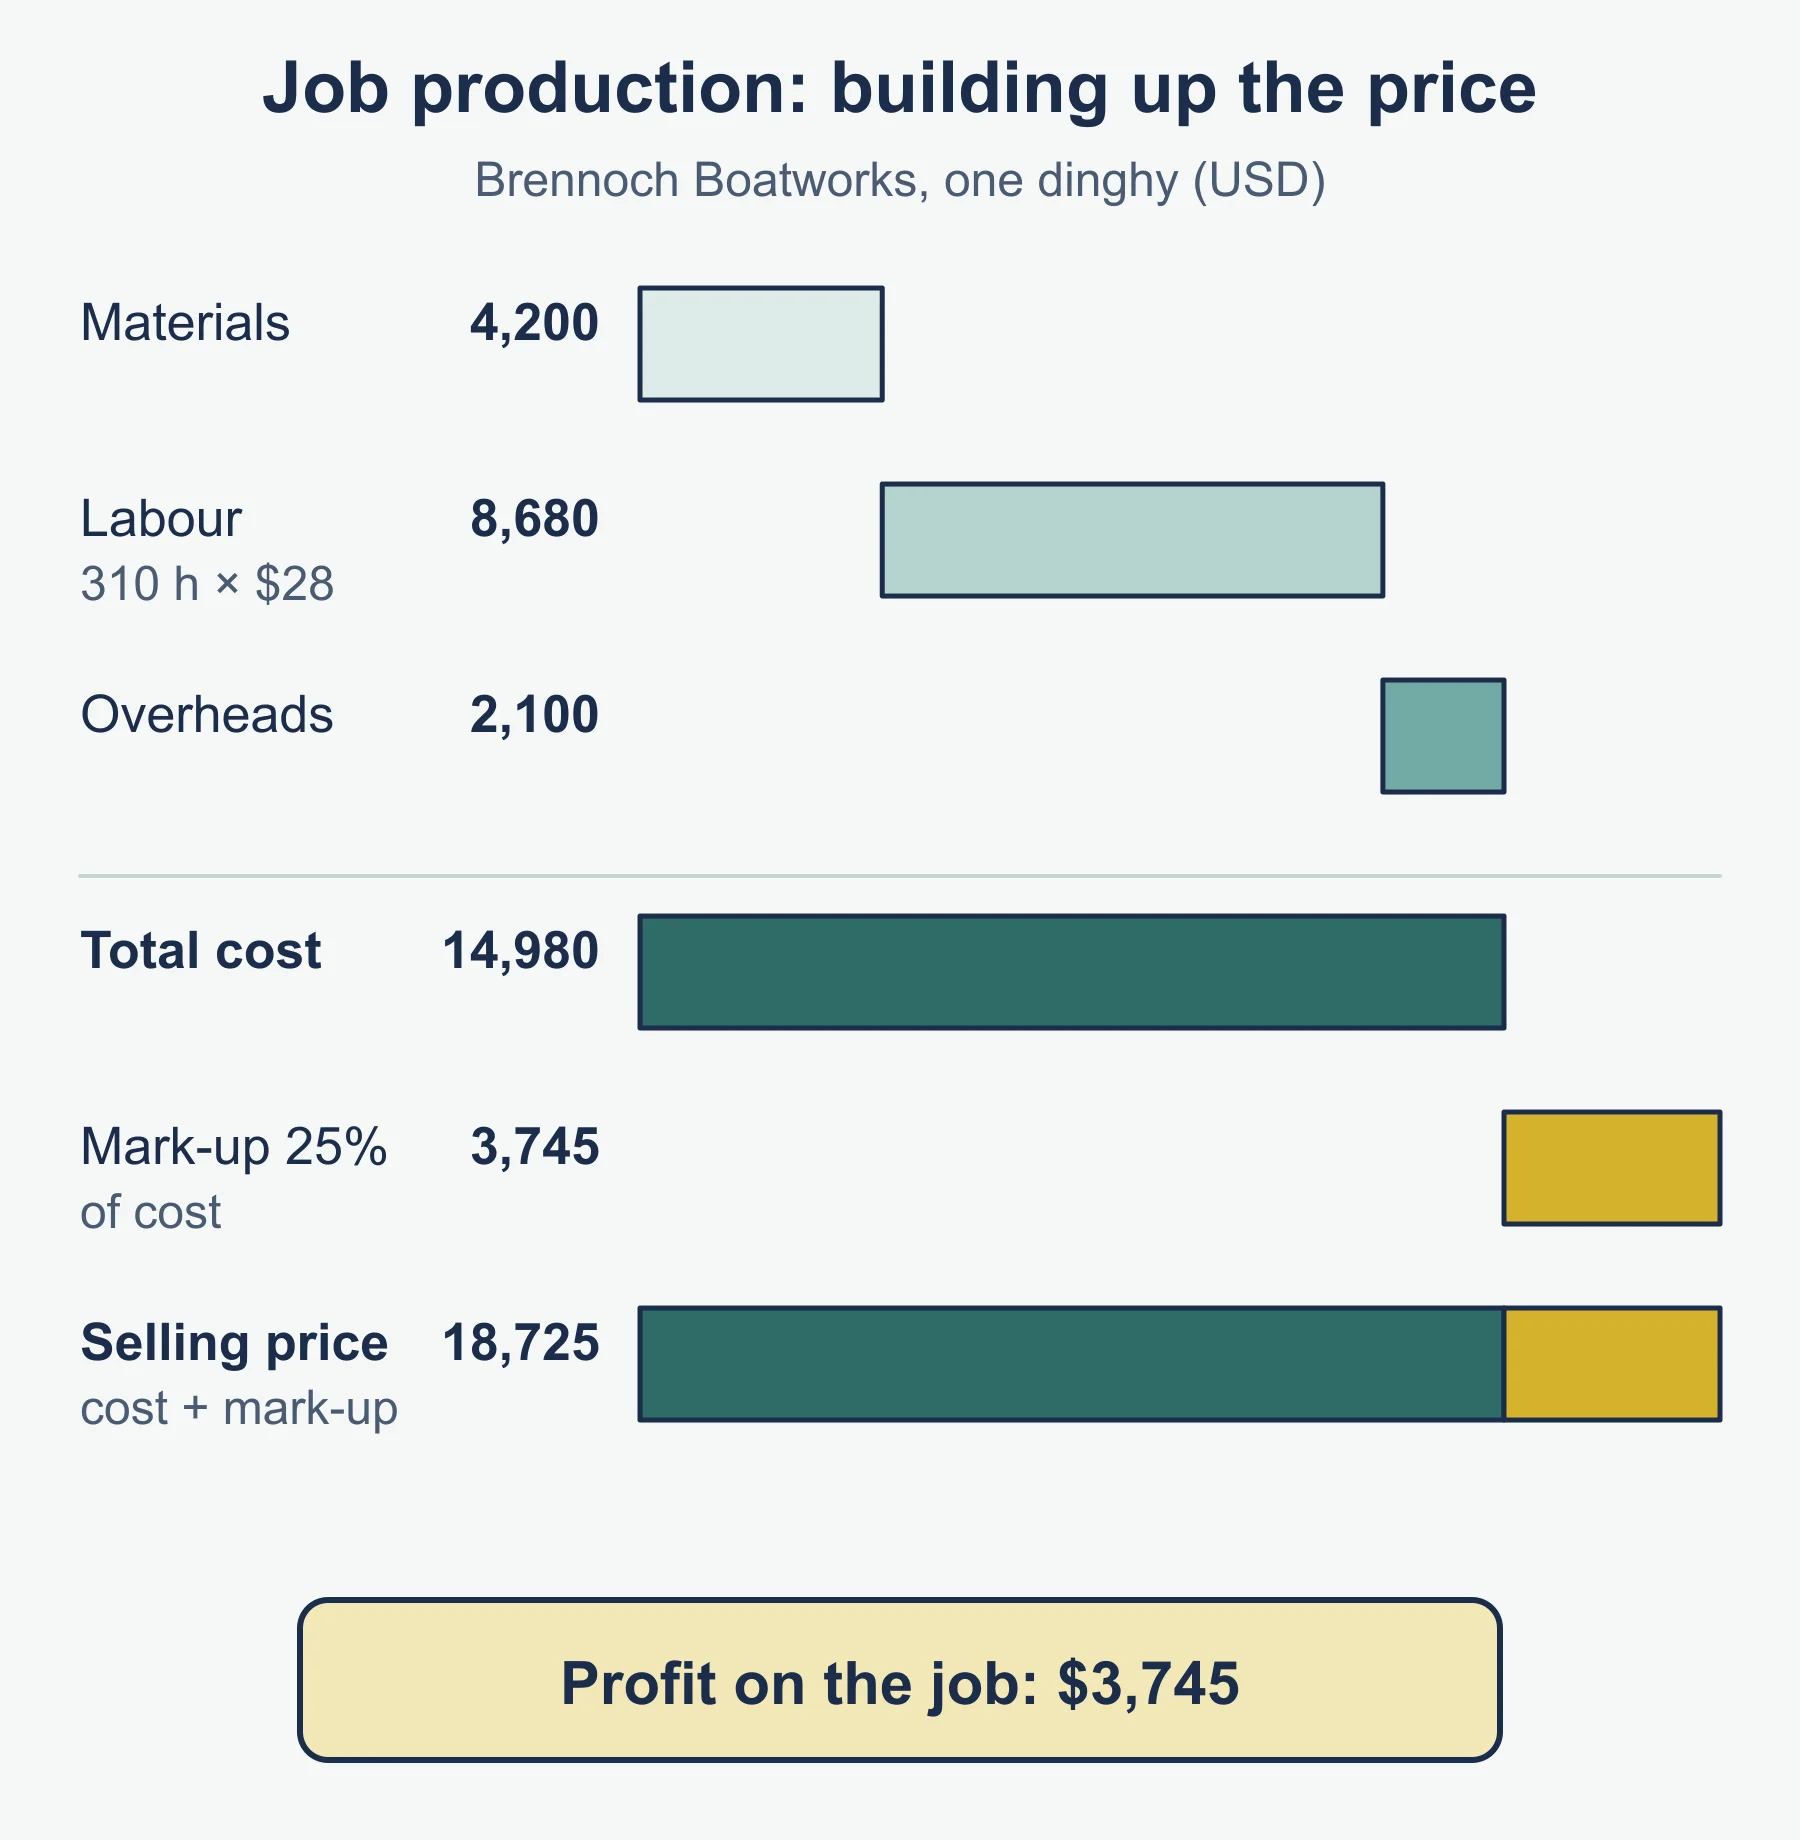
Worked example. Brennoch Boatworks builds a wooden sailing dinghy to a customer’s design. Materials cost USD 4,200. A craftsperson spends 310 hours at USD 28 an hour, which is 310 × 28 = USD 8,680 labour. Overheads allocated to the job are USD 2,100. Total cost = 4,200 + 8,680 + 2,100 = USD 14,980. A 25% mark-up on cost gives a price of 14,980 × 1.25 = USD 18,725, a profit of USD 3,745 on the job.
- Strengths: the product fits the customer exactly; skilled workers are motivated by varied, whole tasks; a high price can be charged.
- Limitations: high cost per unit; slow; no gains from repeating a task; heavy reliance on scarce skilled labour; cash is tied up in each job until the customer pays.
- Suited to: bespoke goods and services where the customer pays for uniqueness.
Batch production
Batch production makes a group of identical items together, then the equipment is reset for the next batch.
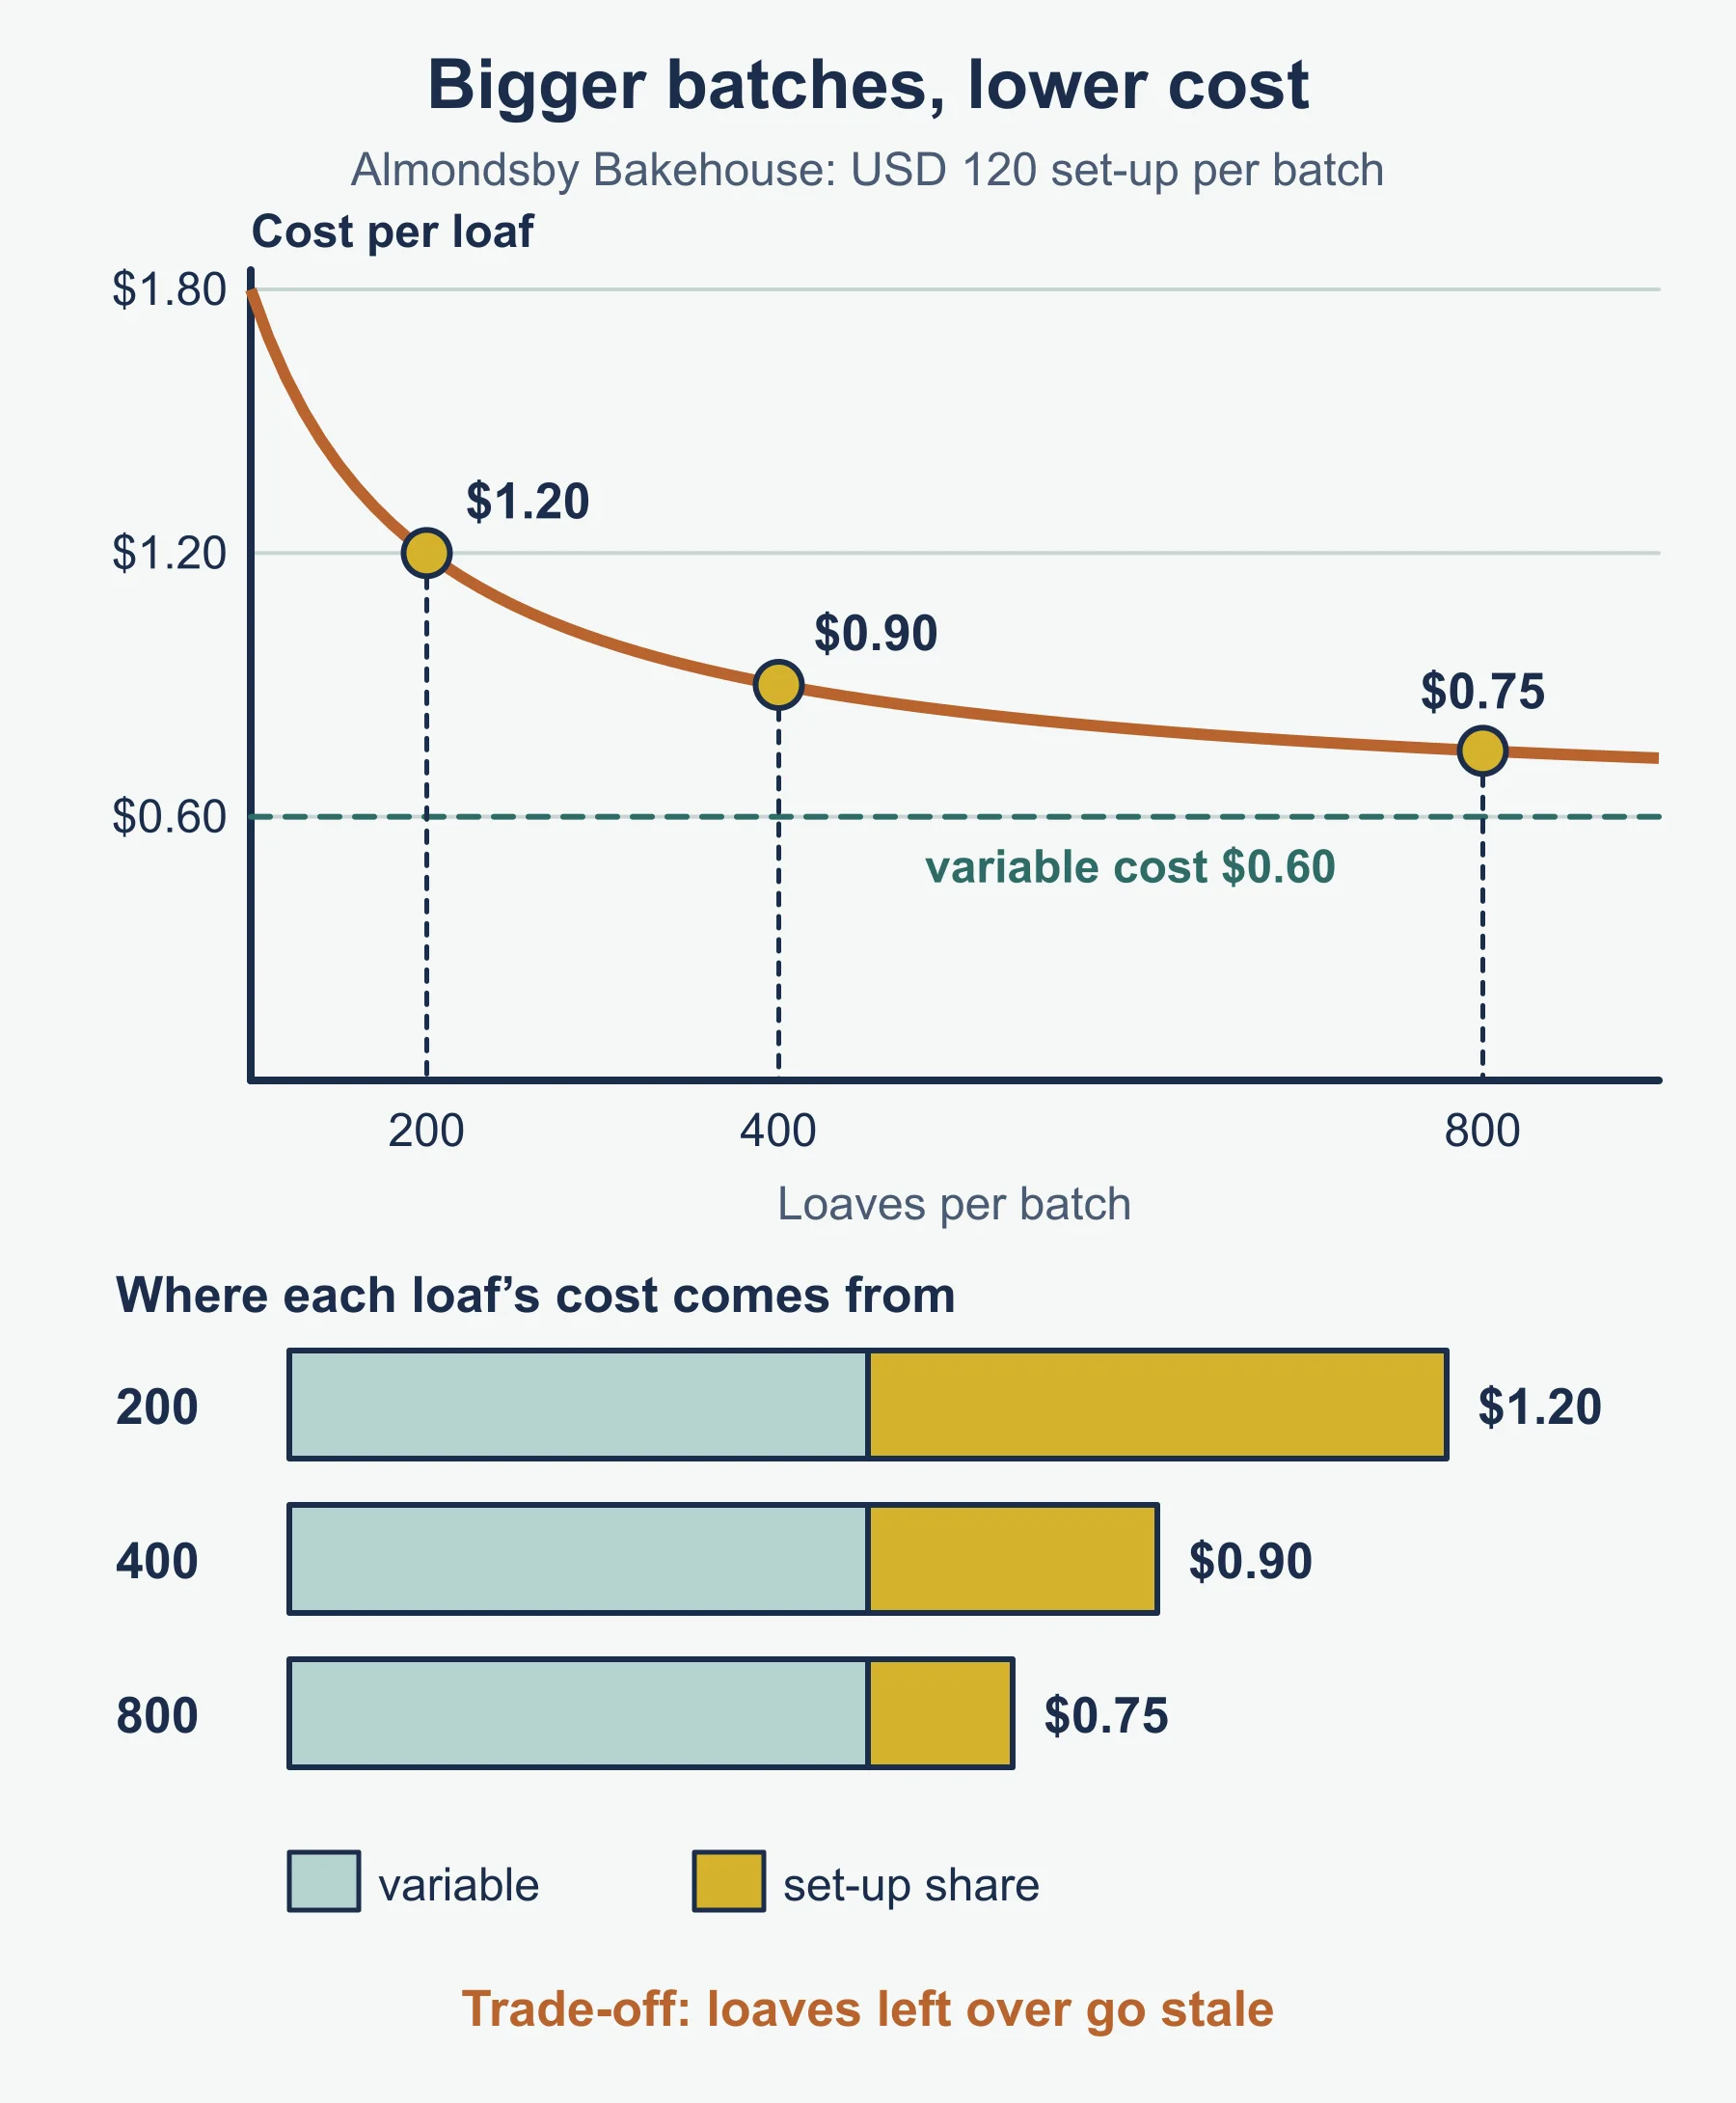
Worked example. Almondsby Bakehouse bakes loaves in batches. Each batch has a set-up and cleaning cost of USD 120 and a variable cost of USD 0.60 per loaf. Cost per loaf = 0.60 + 120 ÷ batch size.
| Batch size | Set-up cost per loaf | Cost per loaf |
|---|---|---|
| 200 | 0.60 | USD 1.20 |
| 400 | 0.30 | USD 0.90 |
| 800 | 0.15 | USD 0.75 |
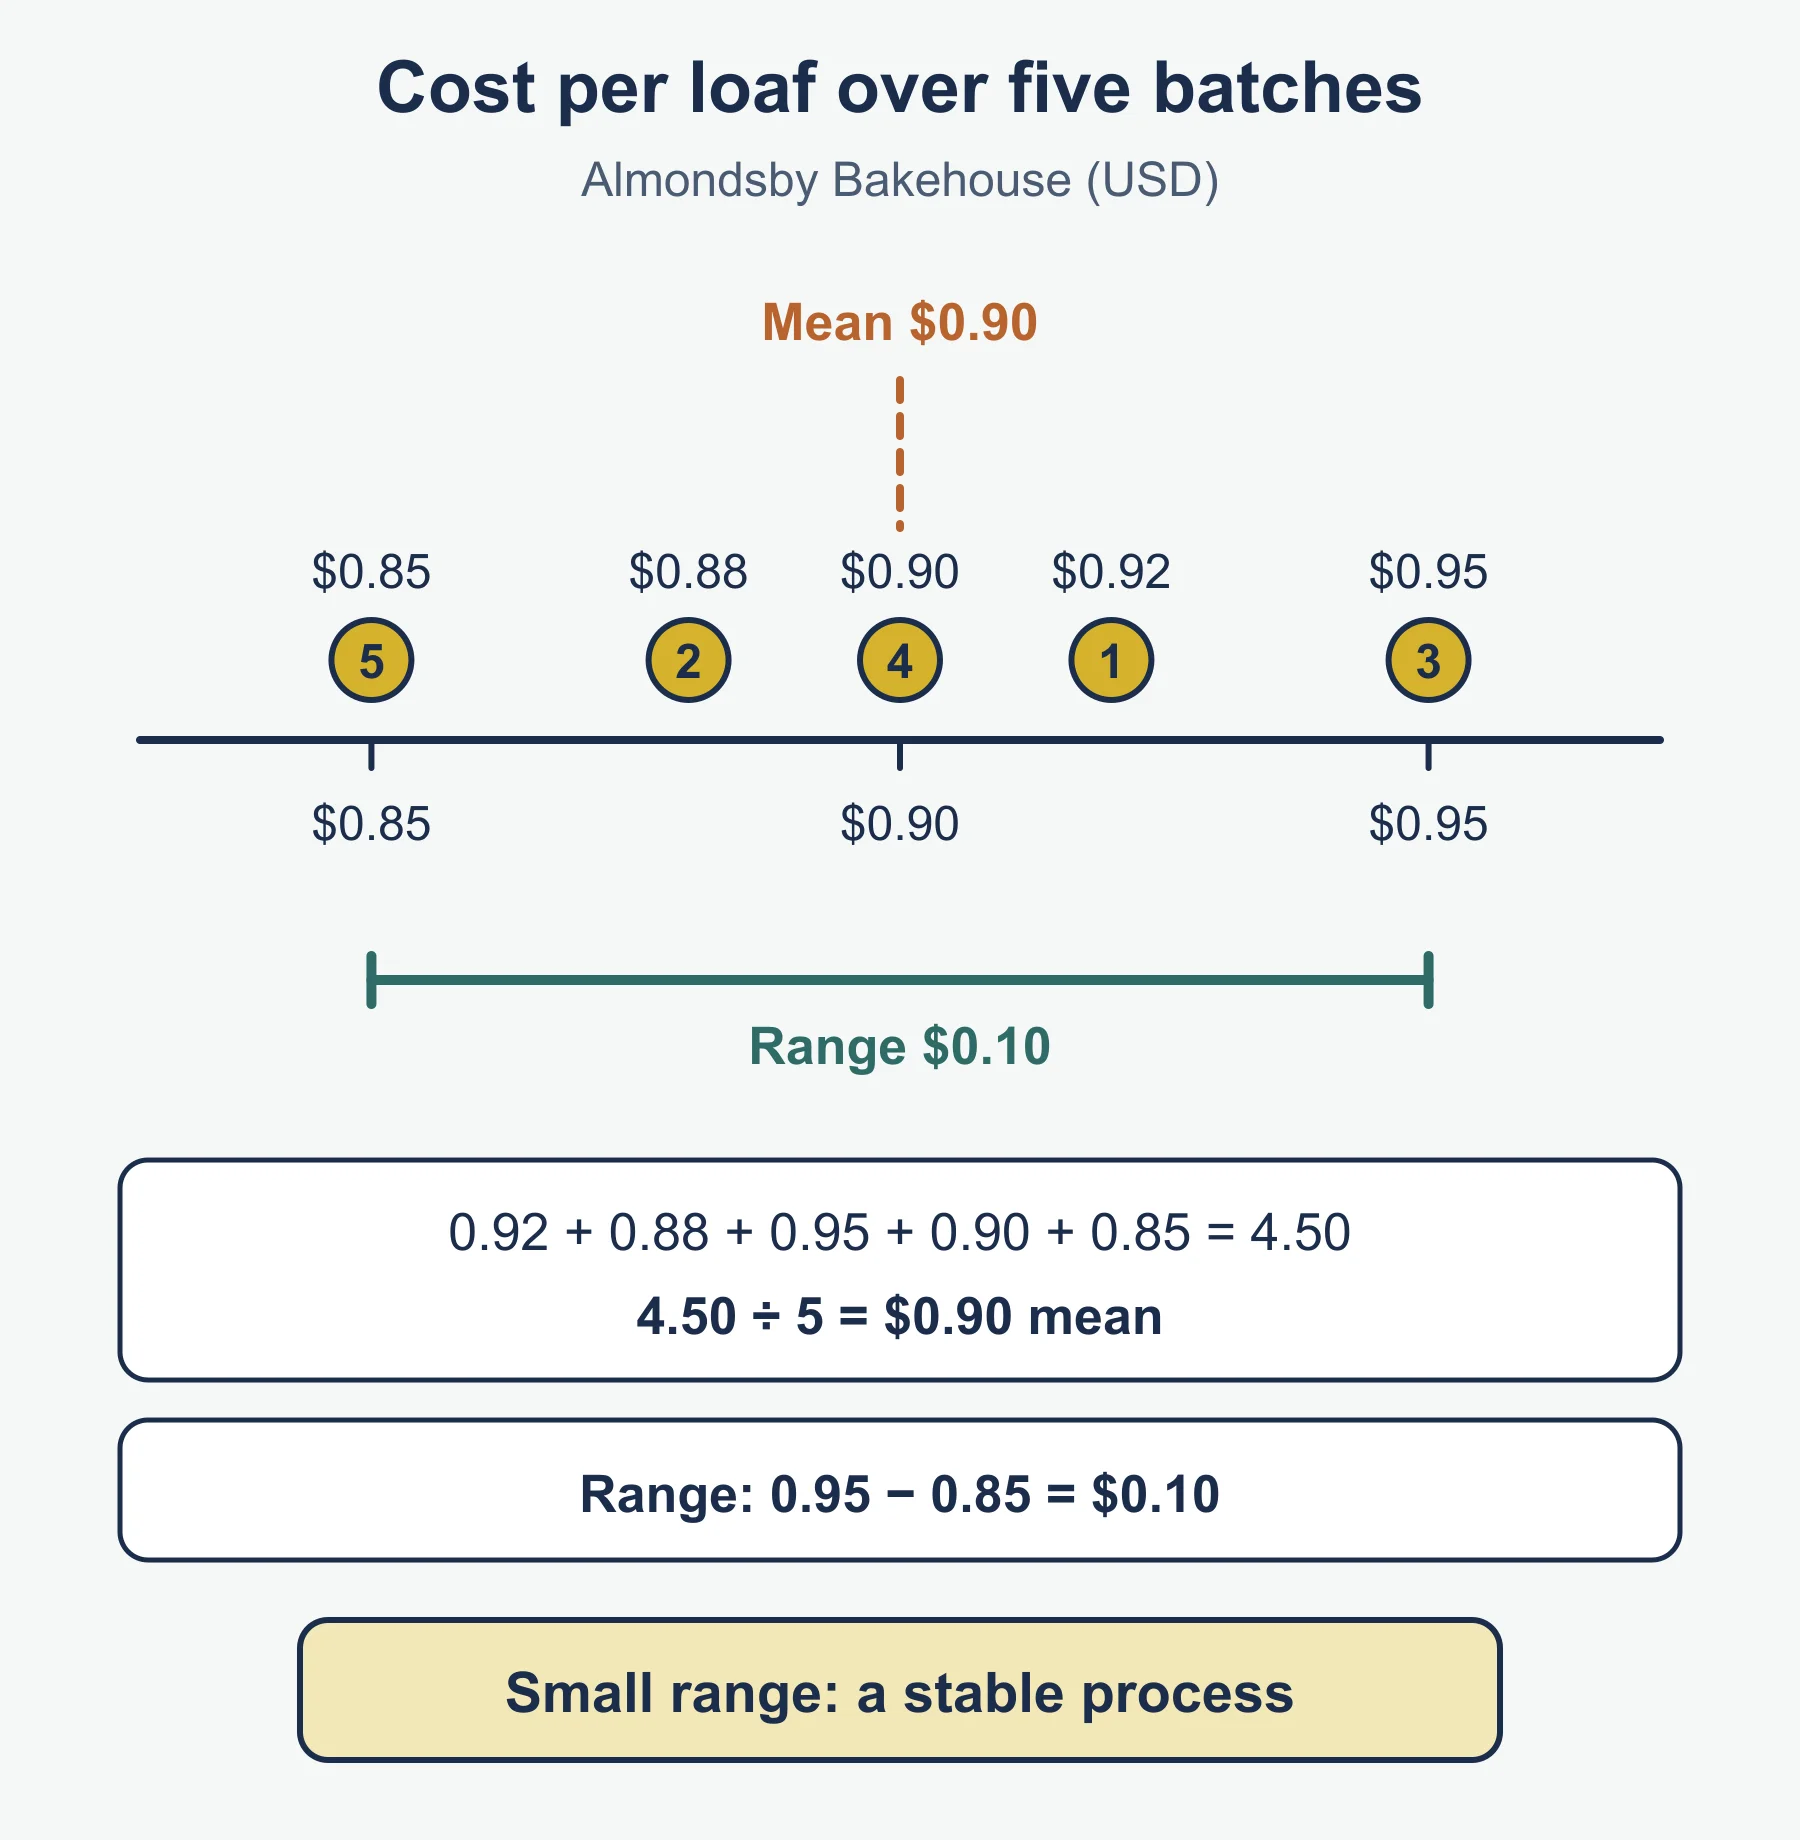
Larger batches spread the set-up cost over more units. The trade-off is unsold stock, because loaves go stale. A descriptive statistic helps here: if the bakery’s cost per loaf over five batches was 0.92, 0.88, 0.95, 0.90 and 0.85, the mean is USD 0.90 and the range is USD 0.10. A small range suggests a stable process.
- Strengths: flexible, because the equipment can switch products; some saving per unit; the business can respond to demand for different lines.
- Limitations: idle time during changeovers; stock of finished or part-finished goods; planning is harder than with a single line.
- Suited to: products with several varieties, repeat orders and demand that varies by season or size.
Mass/flow production
Mass production (also called flow production) makes large numbers of a standardized product on a continuous line, with each unit moving from stage to stage. The guide names it “mass/flow production”, so treat the two terms as one method.
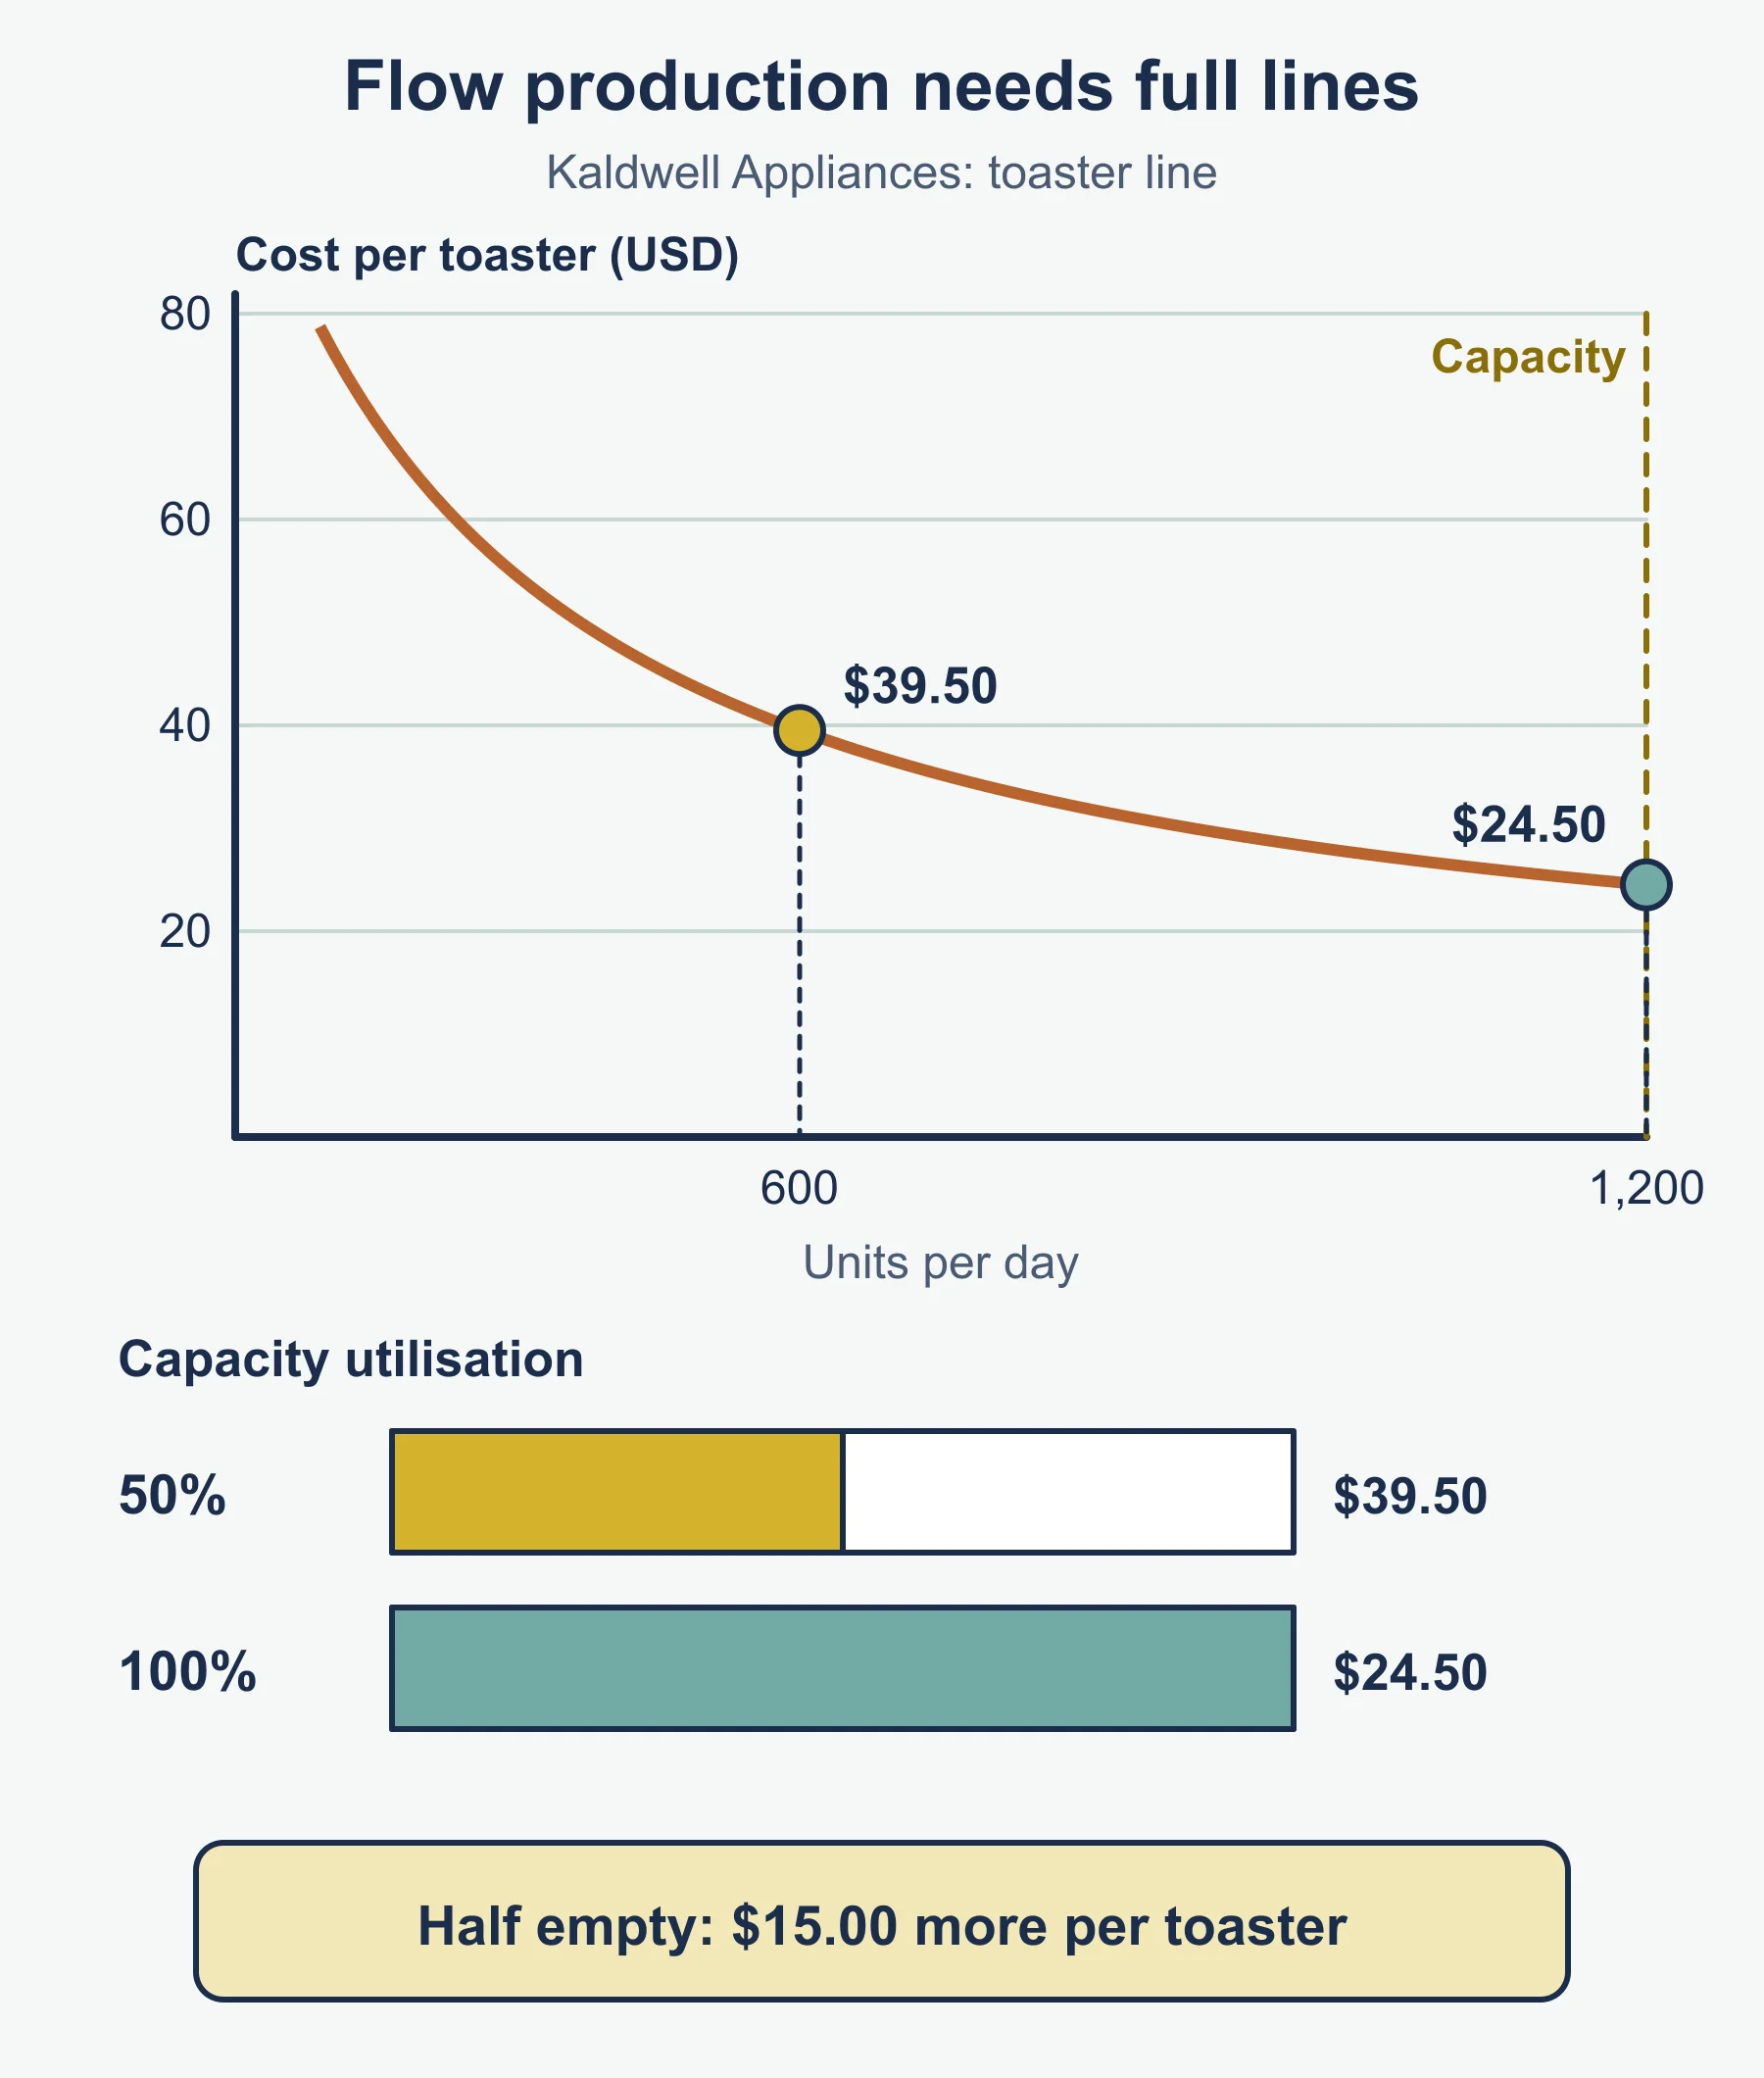
Worked example. Kaldwell Appliances runs a toaster line with capacity of 1,200 units a day. Fixed cost is USD 18,000 a day and variable cost is USD 9.50 a unit.
- Full output: 18,000 ÷ 1,200 + 9.50 = USD 24.50 a unit.
- Half output (600 units): 18,000 ÷ 600 + 9.50 = USD 39.50 a unit.
The USD 15.00 difference shows why flow production depends on high, steady demand. Capacity utilization is output as a percentage of capacity. This is the standard form; the guide does not give a formula. At 600 units it is 600 ÷ 1,200 × 100 = 50%.
- Strengths: lowest cost per unit at high volume; consistent quality; fast output.
- Limitations: very high set-up cost for the line; inflexible; repetitive jobs can demotivate workers; a breakdown can stop the whole line; unsold output piles up if demand falls.
- Suited to: standard products with large, stable demand.
Mass customization
Mass customization uses mass-production techniques and standard components to offer products that each customer can personalize.
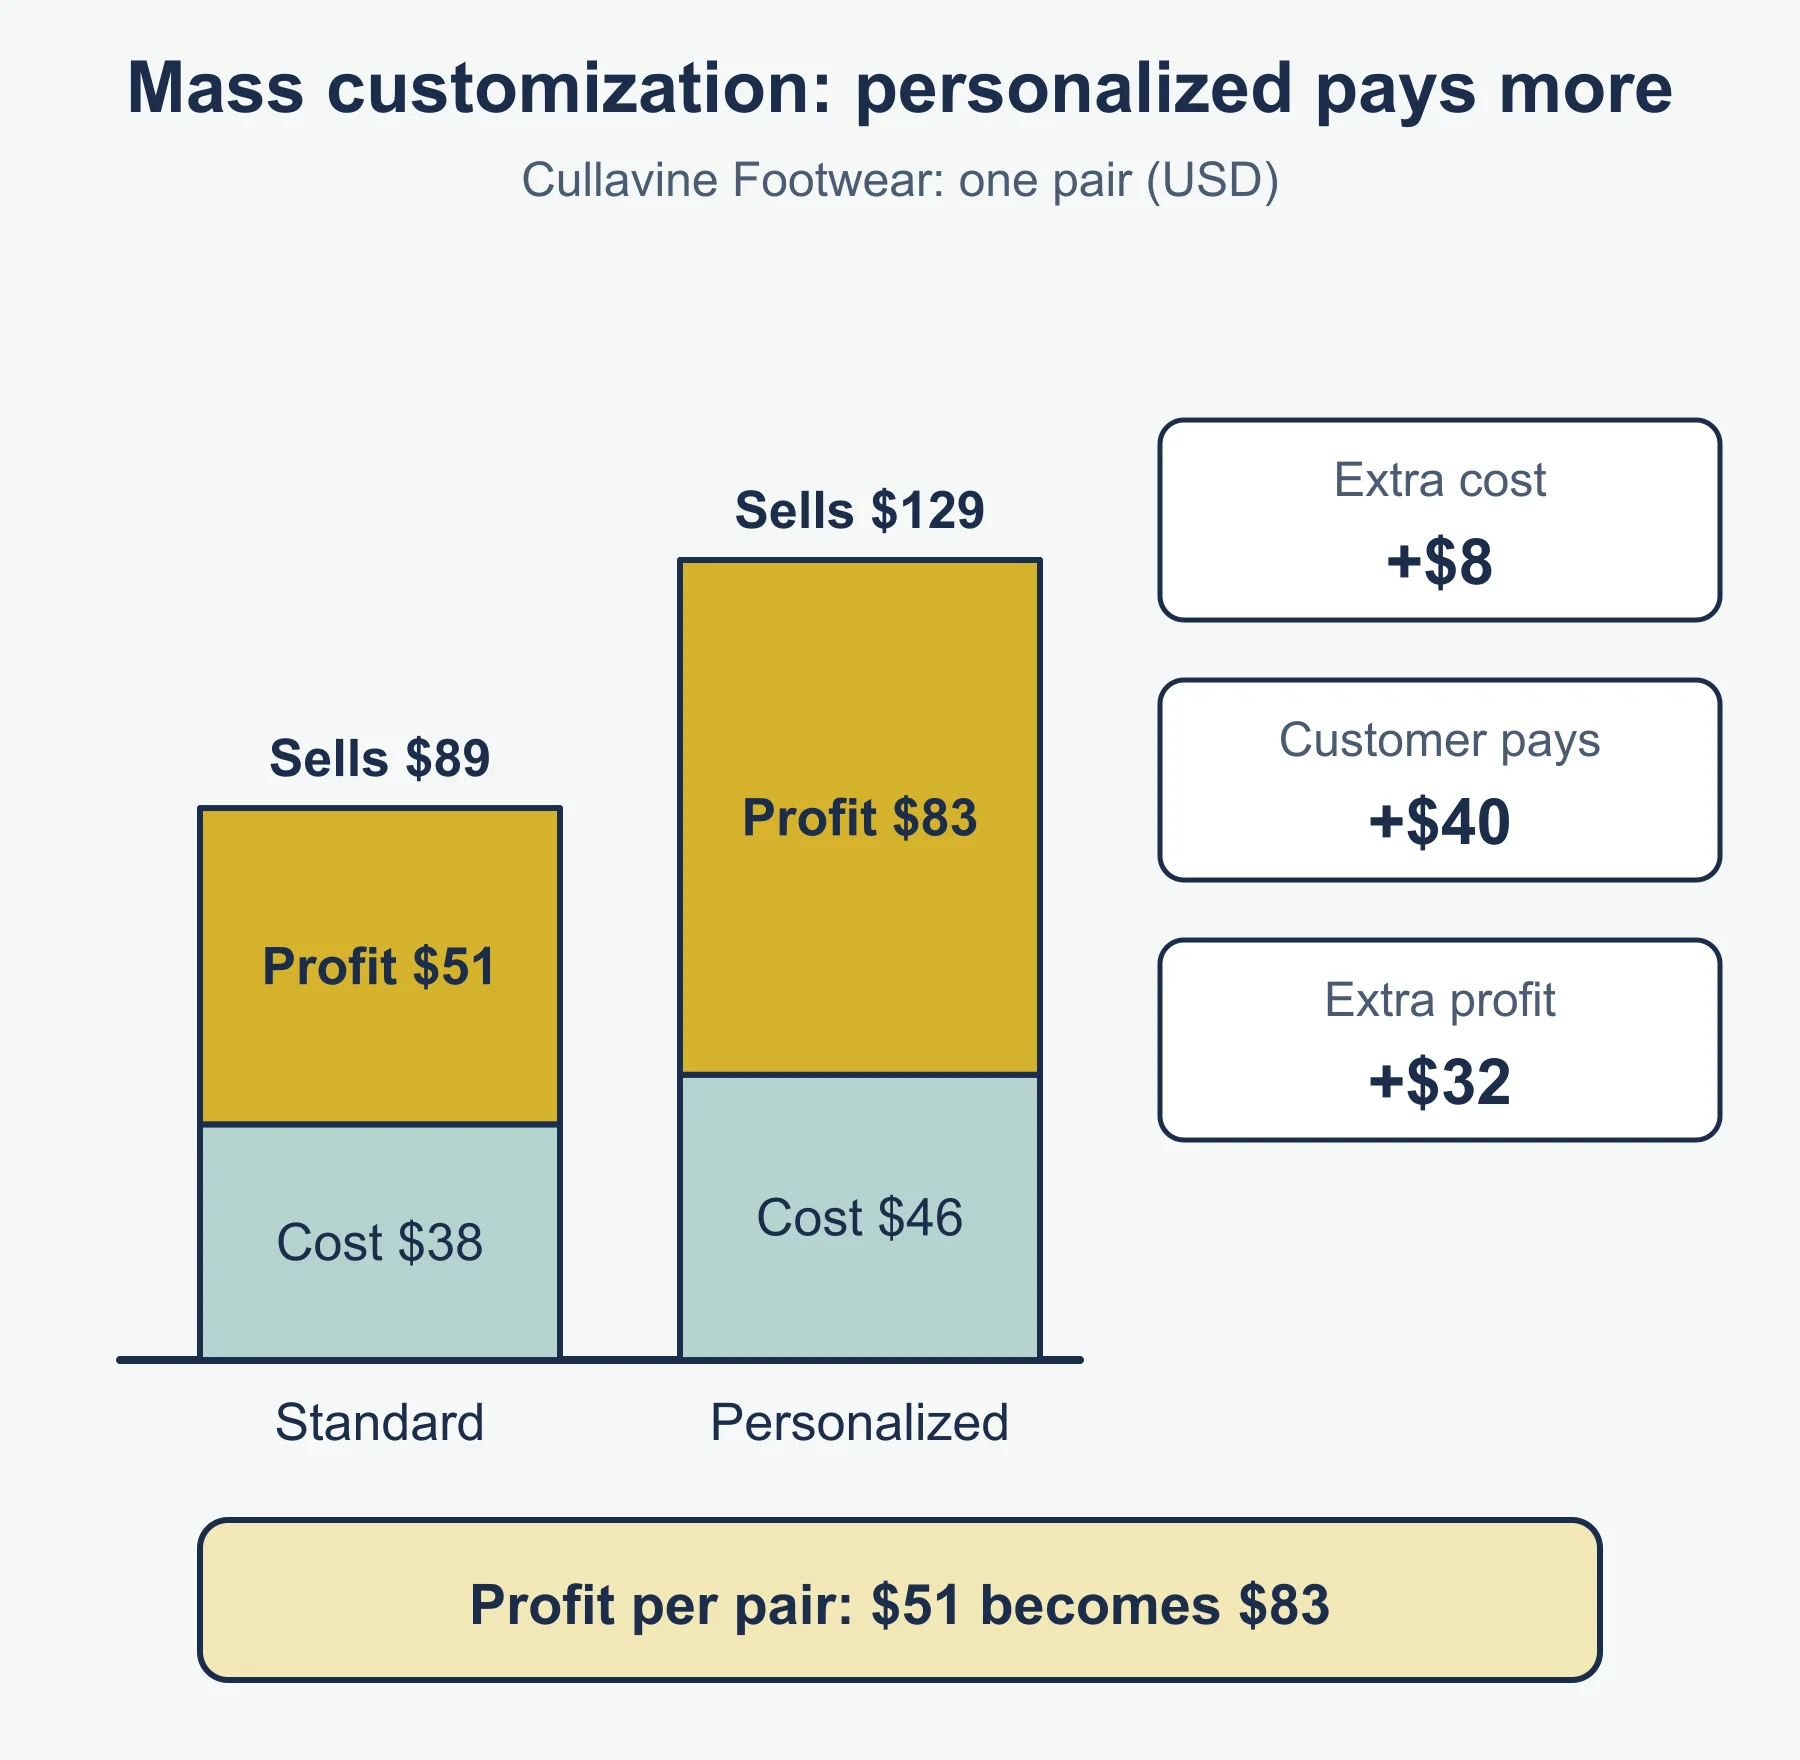
Worked example. Cullavine Footwear lets customers pick colours, materials and widths from standard parts through an app. A standard shoe costs USD 38 to make and sells for USD 89, a profit of USD 51. A personalized pair costs USD 46 and sells for USD 129, a profit of USD 83. The extra cost is USD 8, and the customer pays USD 40 more.
- Strengths: customers pay a premium for personalization; low cost compared with job production; less unsold stock, because pairs are made to order; customer data feeds back to the design team.
- Limitations: needs flexible machines or technology and a well-organized supply chain; delivery takes longer than buying from a shelf; complexity is harder to manage; the premium may not be worth it if customers want speed or the lowest price.
- Suited to: markets where customers value individuality and the product can be built from modules.
Comparing the four methods
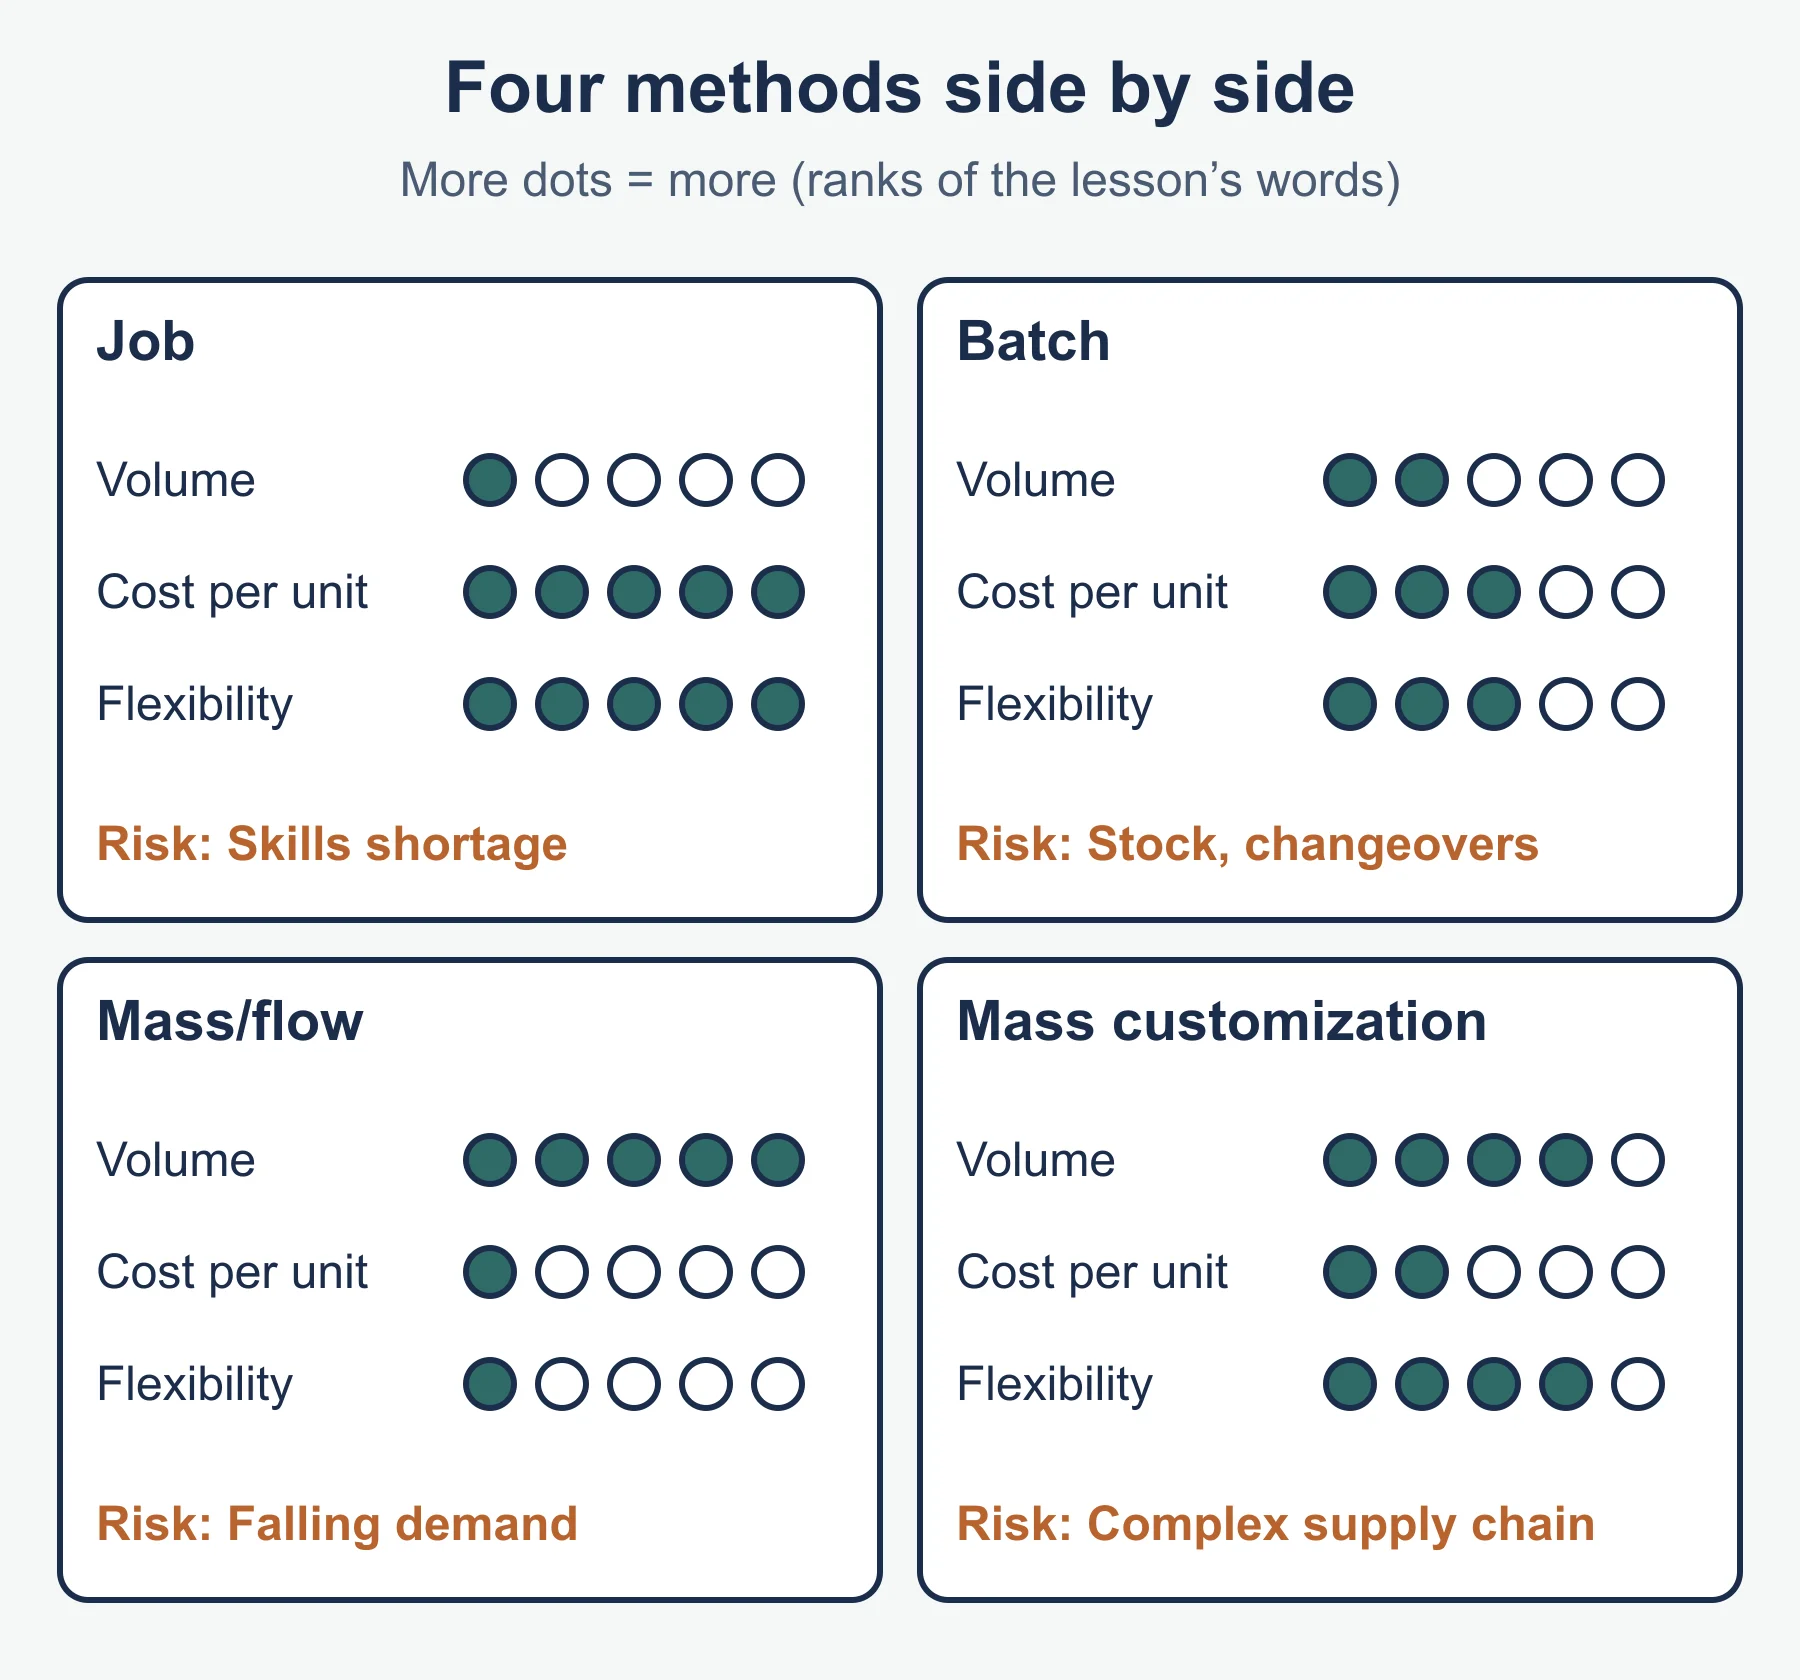
| Feature | Job | Batch | Mass/flow | Mass customization |
|---|---|---|---|---|
| Volume | One | Groups | Very high | High |
| Variety | Unique | Several lines | Standard | Personalized from modules |
| Cost per unit | Highest | Medium | Lowest | Low to medium |
| Flexibility | Very high | Medium | Low | Medium to high |
| Typical risk | Skills shortage | Stock and changeovers | Falling demand | Complex supply chain |
Choosing a method: an evaluation example
AO3 questions want a judgement. The choice of method depends on demand, product, capital available, customer expectations and the business’s values.
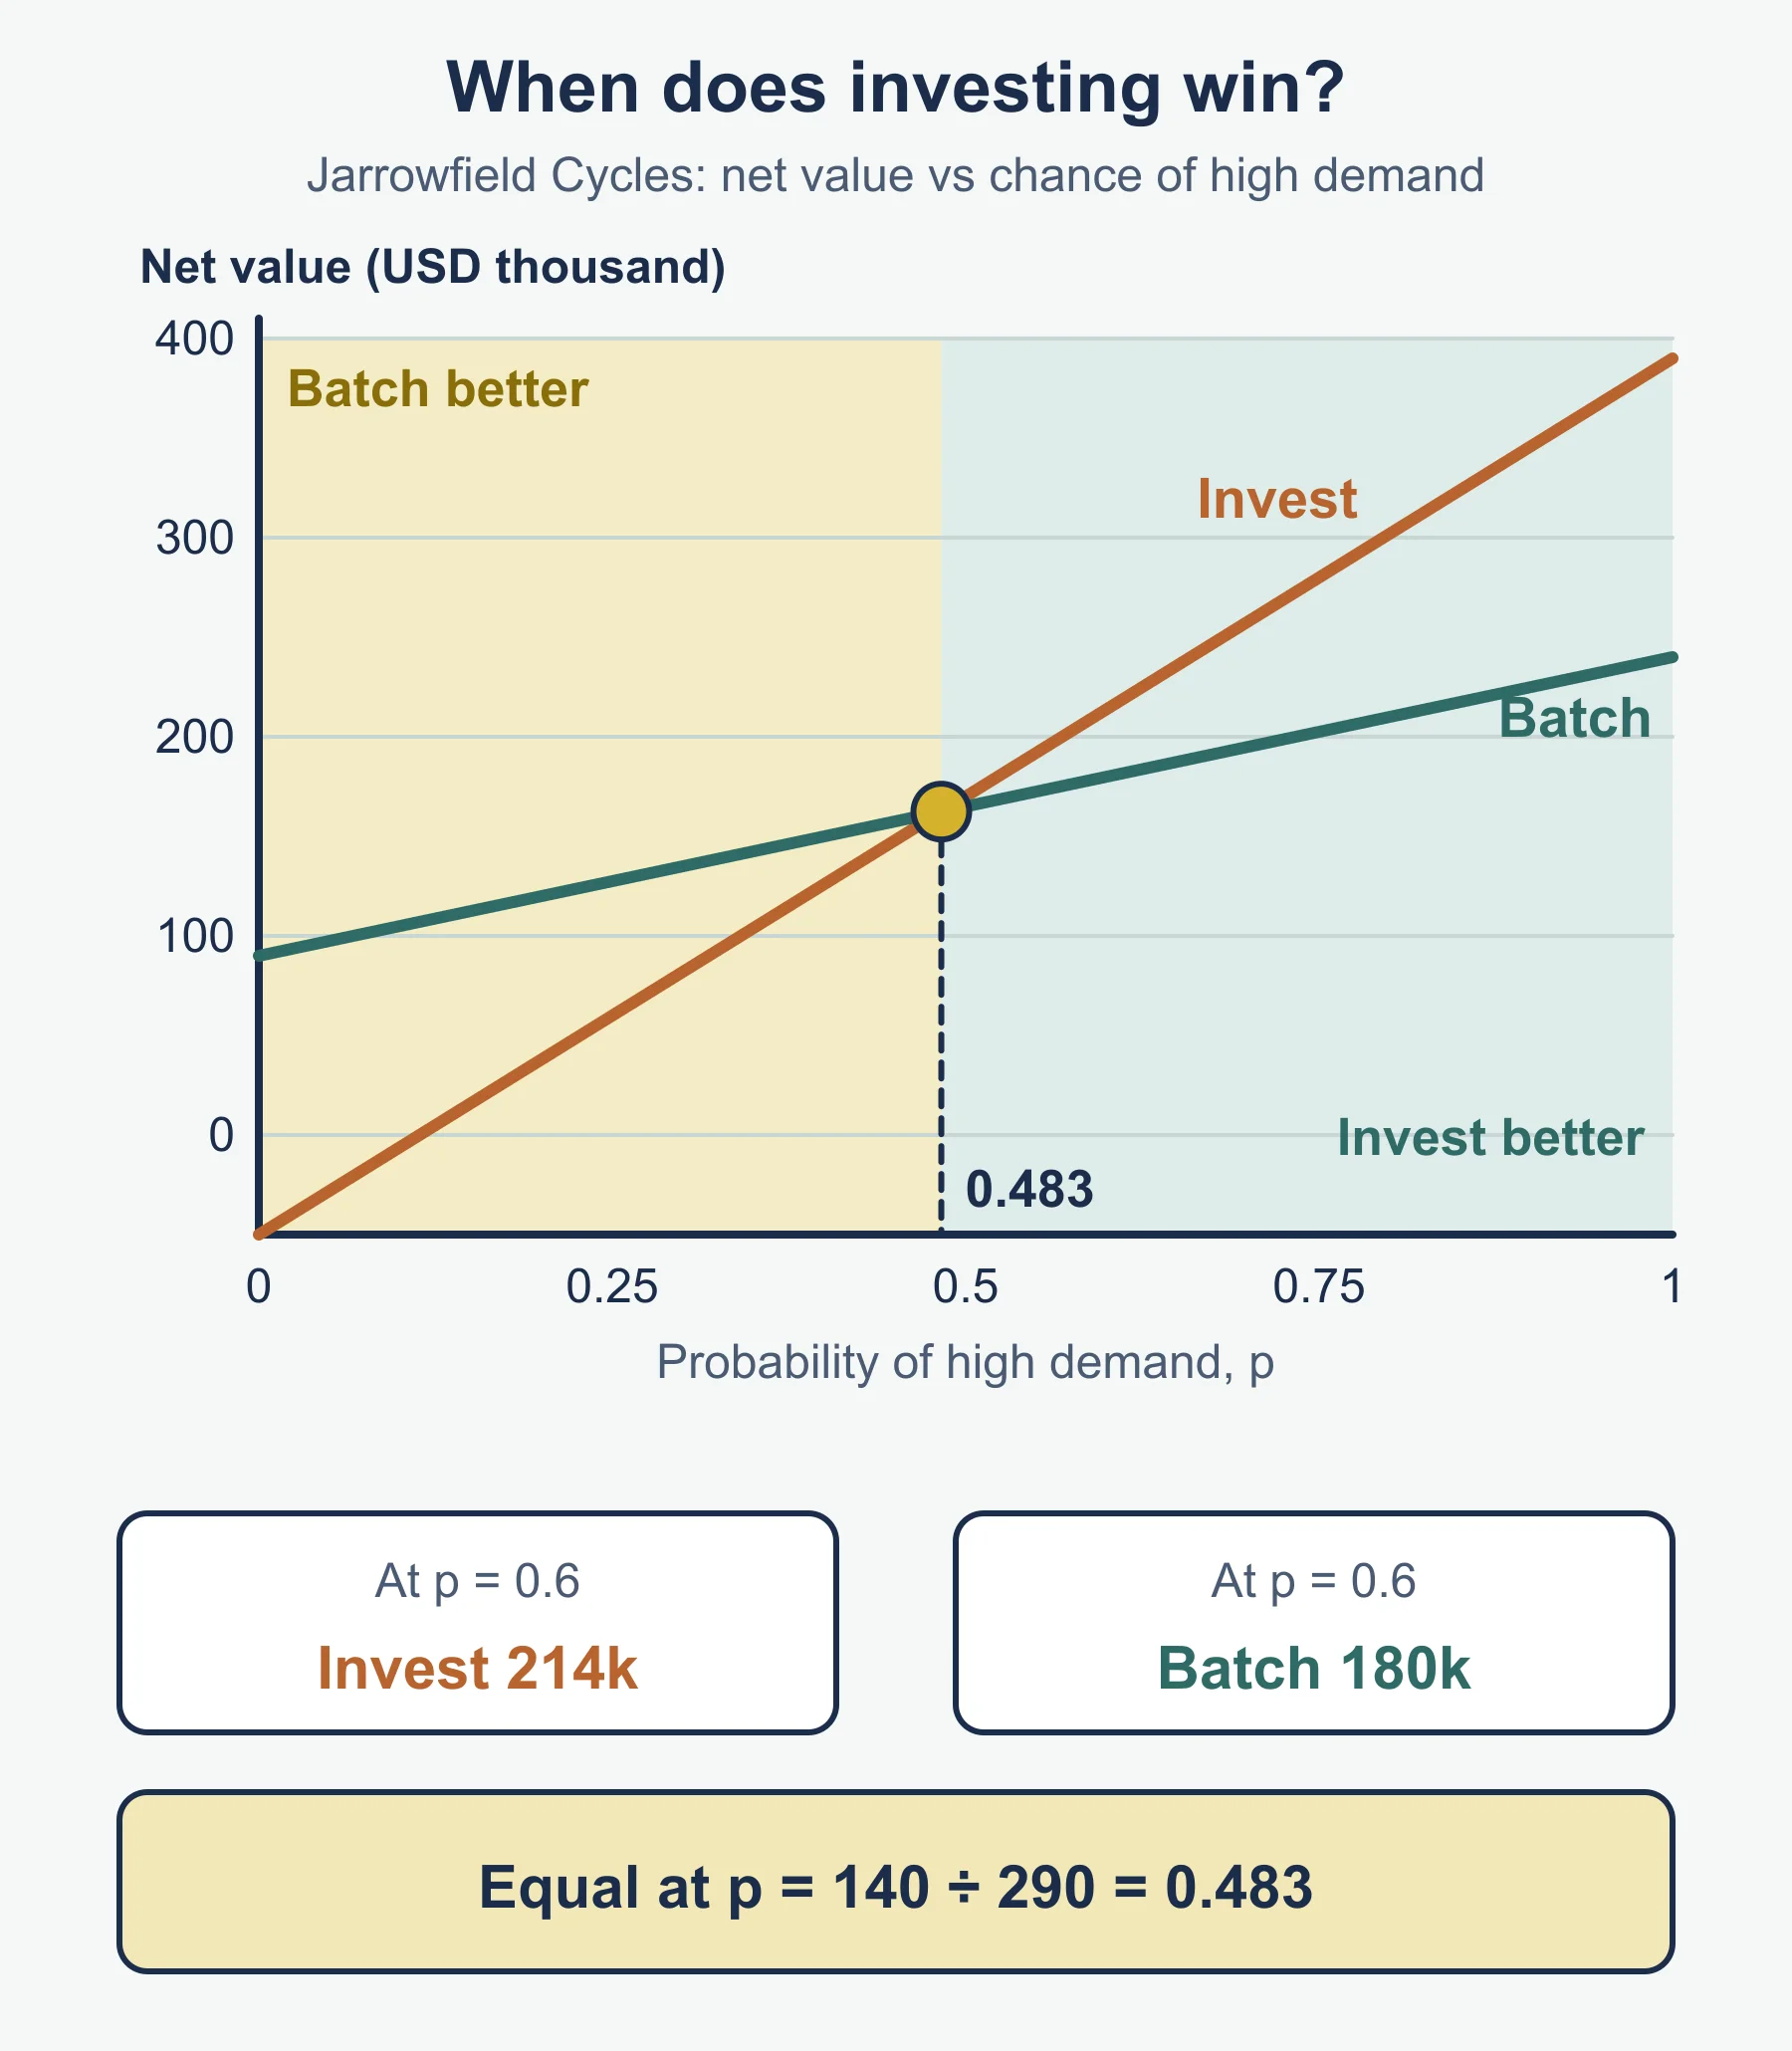
Jarrowfield Cycles currently uses batch production. It could invest in flexible production cells for personalized frames. A decision tree compares expected values.
- Invest: cost USD 250,000. High demand (probability 0.6) brings a return of USD 640,000; low demand (0.4) brings USD 200,000. Expected value = 0.6 × 640,000 + 0.4 × 200,000 = 464,000. Net = 464,000 − 250,000 = USD 214,000.
- Stay with batch: cost USD 60,000. High demand returns USD 300,000; low demand USD 150,000. Expected value = 0.6 × 300,000 + 0.4 × 150,000 = 240,000. Net = 240,000 − 60,000 = USD 180,000.
Investing is ahead by USD 34,000 on these figures. If the probability of high demand is p, the two options are equal when 440p − 50 = 150p + 90 (in thousands), so p = 140 ÷ 290 = 0.483. Below that, staying with batch production is better. A strong answer also weighs what the numbers leave out: the owners’ access to finance, the risk of the low-demand outcome, the effect on employees’ skills, and whether personalization suits the brand.
Common errors
- Describing a method without applying it to the business in the case study.
- Saying mass production is “always cheapest”. It is cheapest per unit only when output is high and steady.
- Mixing up batch and mass customization. Batch makes identical groups; mass customization makes individual variations.
- Treating job production as low quality. Its weakness is cost and speed, not quality.
- Giving only advantages in an “evaluate” or “justify” answer. The guide’s glossary defines evaluate as weighing up strengths and limitations.
- Forgetting a conclusion that picks a method and says why.
Frequently asked questions
What is operations management? Operations management is the part of a business that plans, organizes and controls the process that turns inputs into outputs customers value. It exists in every organization, including services such as clinics, schools and charities.
What are the four production methods in IB Business Management? Section 5.2 covers job production, batch production, mass/flow production and mass customization. They differ in how many identical units are made and how closely each unit matches an individual customer.
Is mass production always the cheapest method? No. Mass production gives the lowest cost per unit only when output is high and steady, because its fixed costs are spread over many units; at lower output, cost per unit rises sharply.
What are the limitations of job production? Job production has a high cost per unit, is slow, gains nothing from repeating tasks and relies heavily on scarce skilled labour. Its weakness is cost and speed, not quality.
Official syllabus
IB Diploma Programme Business management guide, first assessment 2024, International Baccalaureate Organization: Unit 5, sections 5.1 and 5.2.
Get free revision emails (optional)
Occasional emails with practice questions, worked explanations and links to free resources for the qualification and subjects you choose. No spam, and you can unsubscribe from any email. The free tools on this site never need an email.
Related resources
-
Practice questions
IB DP Business Management: Introduction to operations management and Operations methods – Practice Questions
Original IB DP Business Management practice questions with worked answers on 5.1 and 5.2: operations roles and production methods.
Business · International Baccalaureate · IB
Try questions -
Revision notes
IB DP Business Management: Introduction to operations management and Operations methods – Revision Notes
Condensed revision notes for IB DP Business Management 5.1 and 5.2: operations roles, four production methods compared, and a self-test.
Business · International Baccalaureate · IB
Revise topic -
Study guides
IB DP Business Management: Lean production and quality management (HL only)
Study guide to IB DP Business Management 5.3 (HL only): lean production, kaizen, JIT, cradle to cradle, quality methods, TQM and quality standards.
Business · International Baccalaureate · IB
Read guide
Related articles
-
teaching
A Level tuition in Dubai: Cambridge or Pearson Edexcel International A Level?
Schools in Dubai and Abu Dhabi teach either Cambridge International AS & A Level or Pearson Edexcel International A Level. How the two are structured, why it matters for tuition, and how online classes from Lahore work.
9 October 2026
-
curriculum guides
Choosing subjects at IGCSE and A Level
How subject choices at 14 and 16 affect university options later, and how to keep pathways open without overloading a timetable.
28 July 2026
Studying this with a teacher
Working through Business IB?
This page is free and stays free. If you would rather be taught it, Marlbridge runs Business classes one-to-one, online in your own time zone. The first trial class is free. WhatsApp replies within an hour (8am–11pm Pakistan time, every day); email the same day.
IB Business teachers at Marlbridge

