
Revision Notes
IB DP Business Management: R&D (HL only) and Management information systems (HL only) – Revision Notes
Condensed IB DP Business Management revision notes for 5.8 R&D and 5.9 management information systems (both HL only), with a self-test.
- Subject
- Business
- Level
- IB
- Topic
- Unit 5: Operations management
- Author
- Marlbridge Academic Team
- Updated
- Reviewed by
- Salman Ahmad (what this means)
Aligned to International Baccalaureate IB Diploma Programme Business (DP Business Management), First assessment 2024. Official specification .
Syllabus page (what it covers and how it is assessed): IB Diploma Programme Business.
Syllabus points this page covers
DP Business Management
- 5.8 Research and development (HL only)
- 5.9 Management information systems (HL only)
Found an error? Report a correction.
Need help with this topic? Request a free trial class for IB Diploma Programme Business (DP Business Management).
These revision notes condense sections 5.8 (Research and development) and 5.9 (Management information systems) of the IB Business management guide, first assessment 2024. Both sections are HL only. For full explanations and worked examples, read the study guide, then try the practice questions.
Other links: the IB DP Business Management hub, the syllabus checklist and the free diagnostics. The definitions below are standard working definitions, because the guide lists the terms without defining them.
5.8 Research and development: key points
| Term | Short definition | Link to a decision |
|---|---|---|
| Research and development (R&D) | Work to discover new knowledge and turn it into new or improved products or processes | Spend now, uncertain return later |
| Unmet need | A customer need no good product satisfies; the customer may or may not be aware of it | Where to aim R&D |
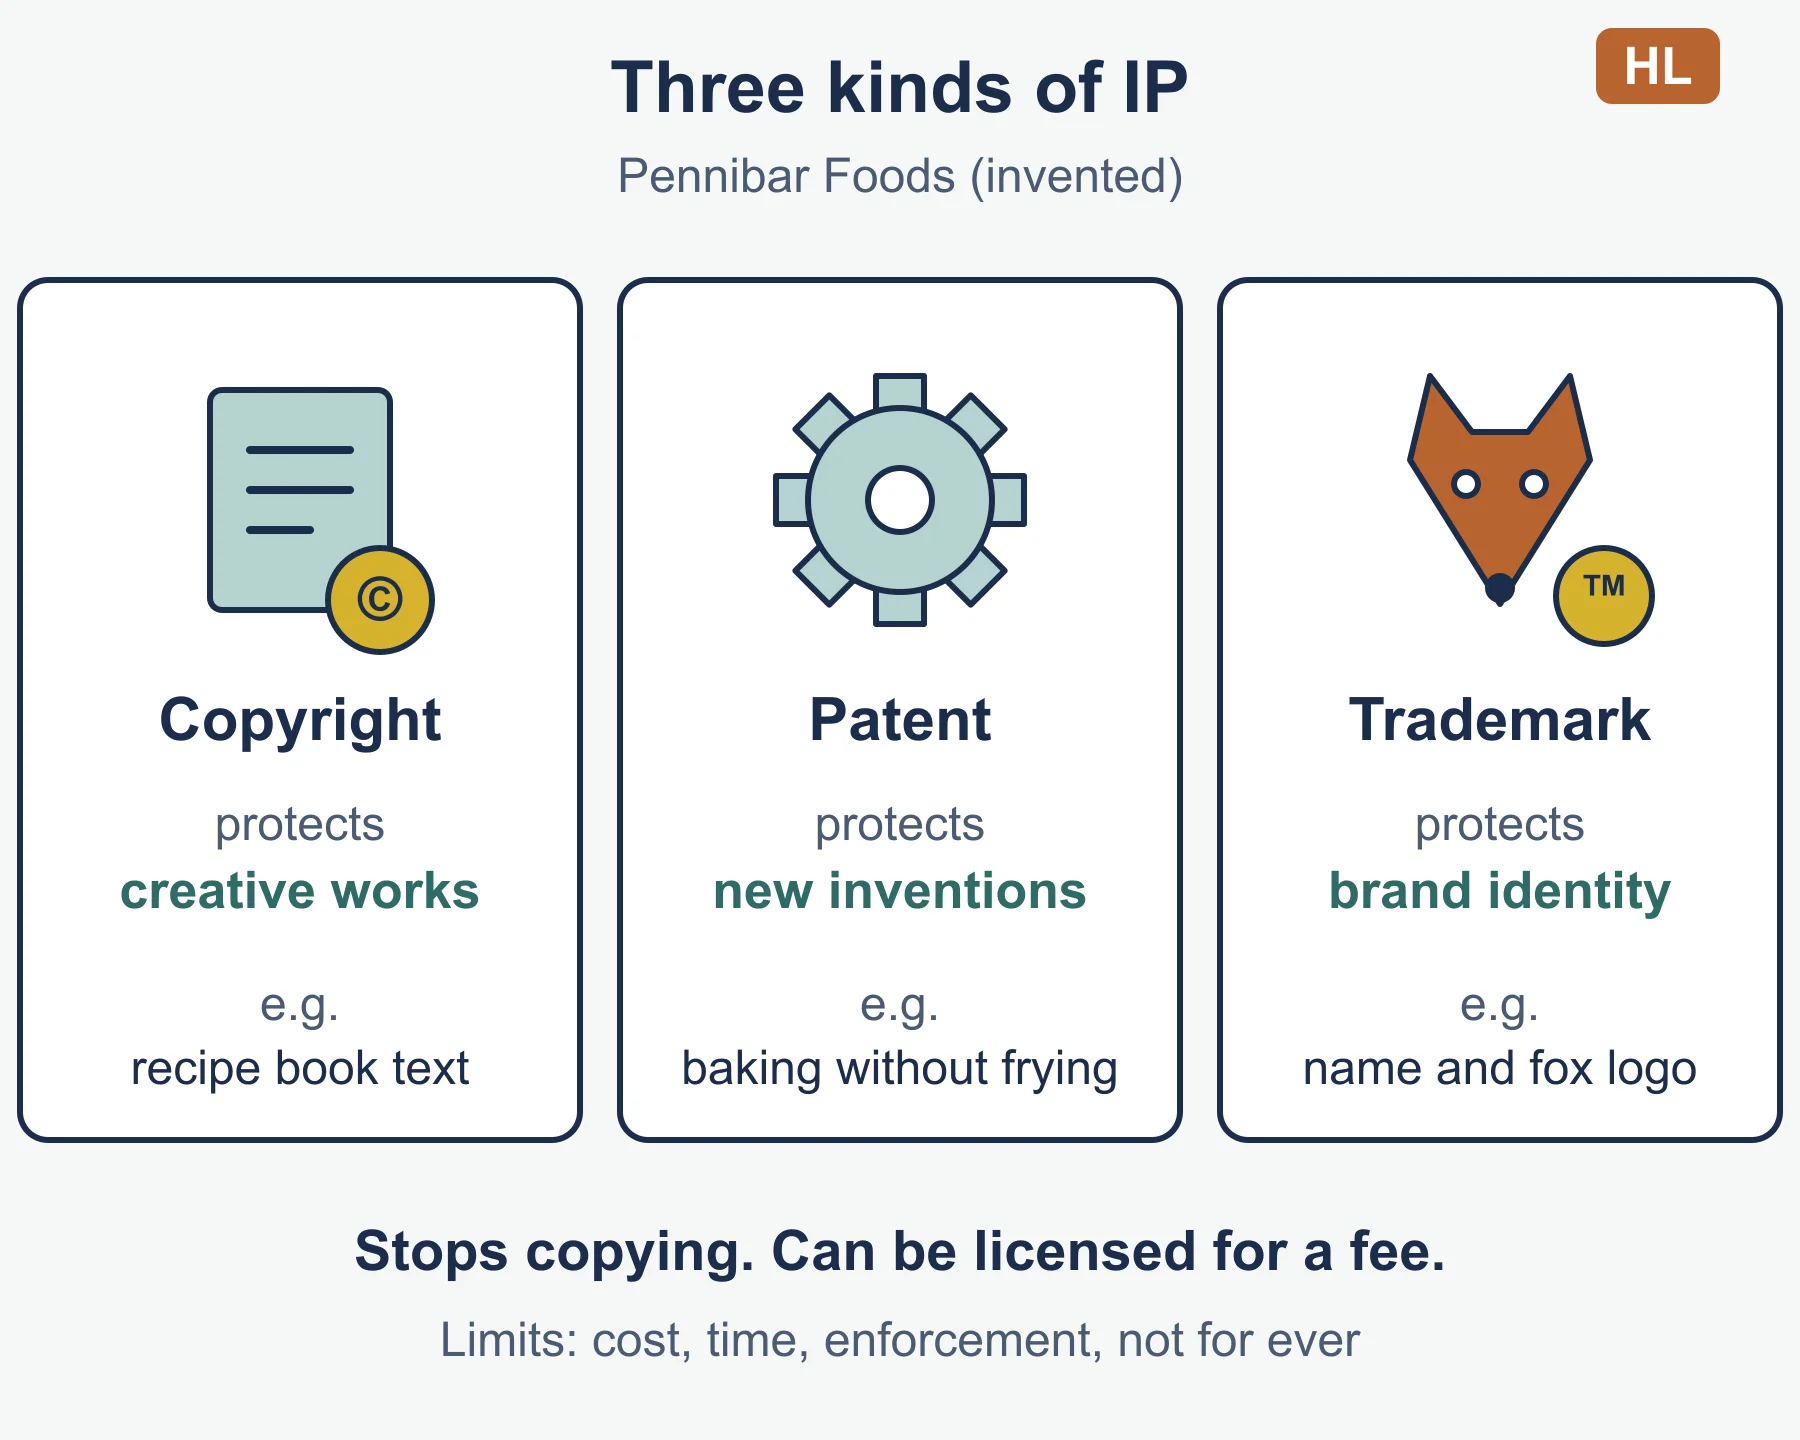
| Copyright | Protection for original creative works | Stops copying of text, images, music, code |
| Patent | Protection for a new invention | Lets the owner exclude or license others |
| Trademark | Protection for a sign that identifies a brand | Protects the brand identity |
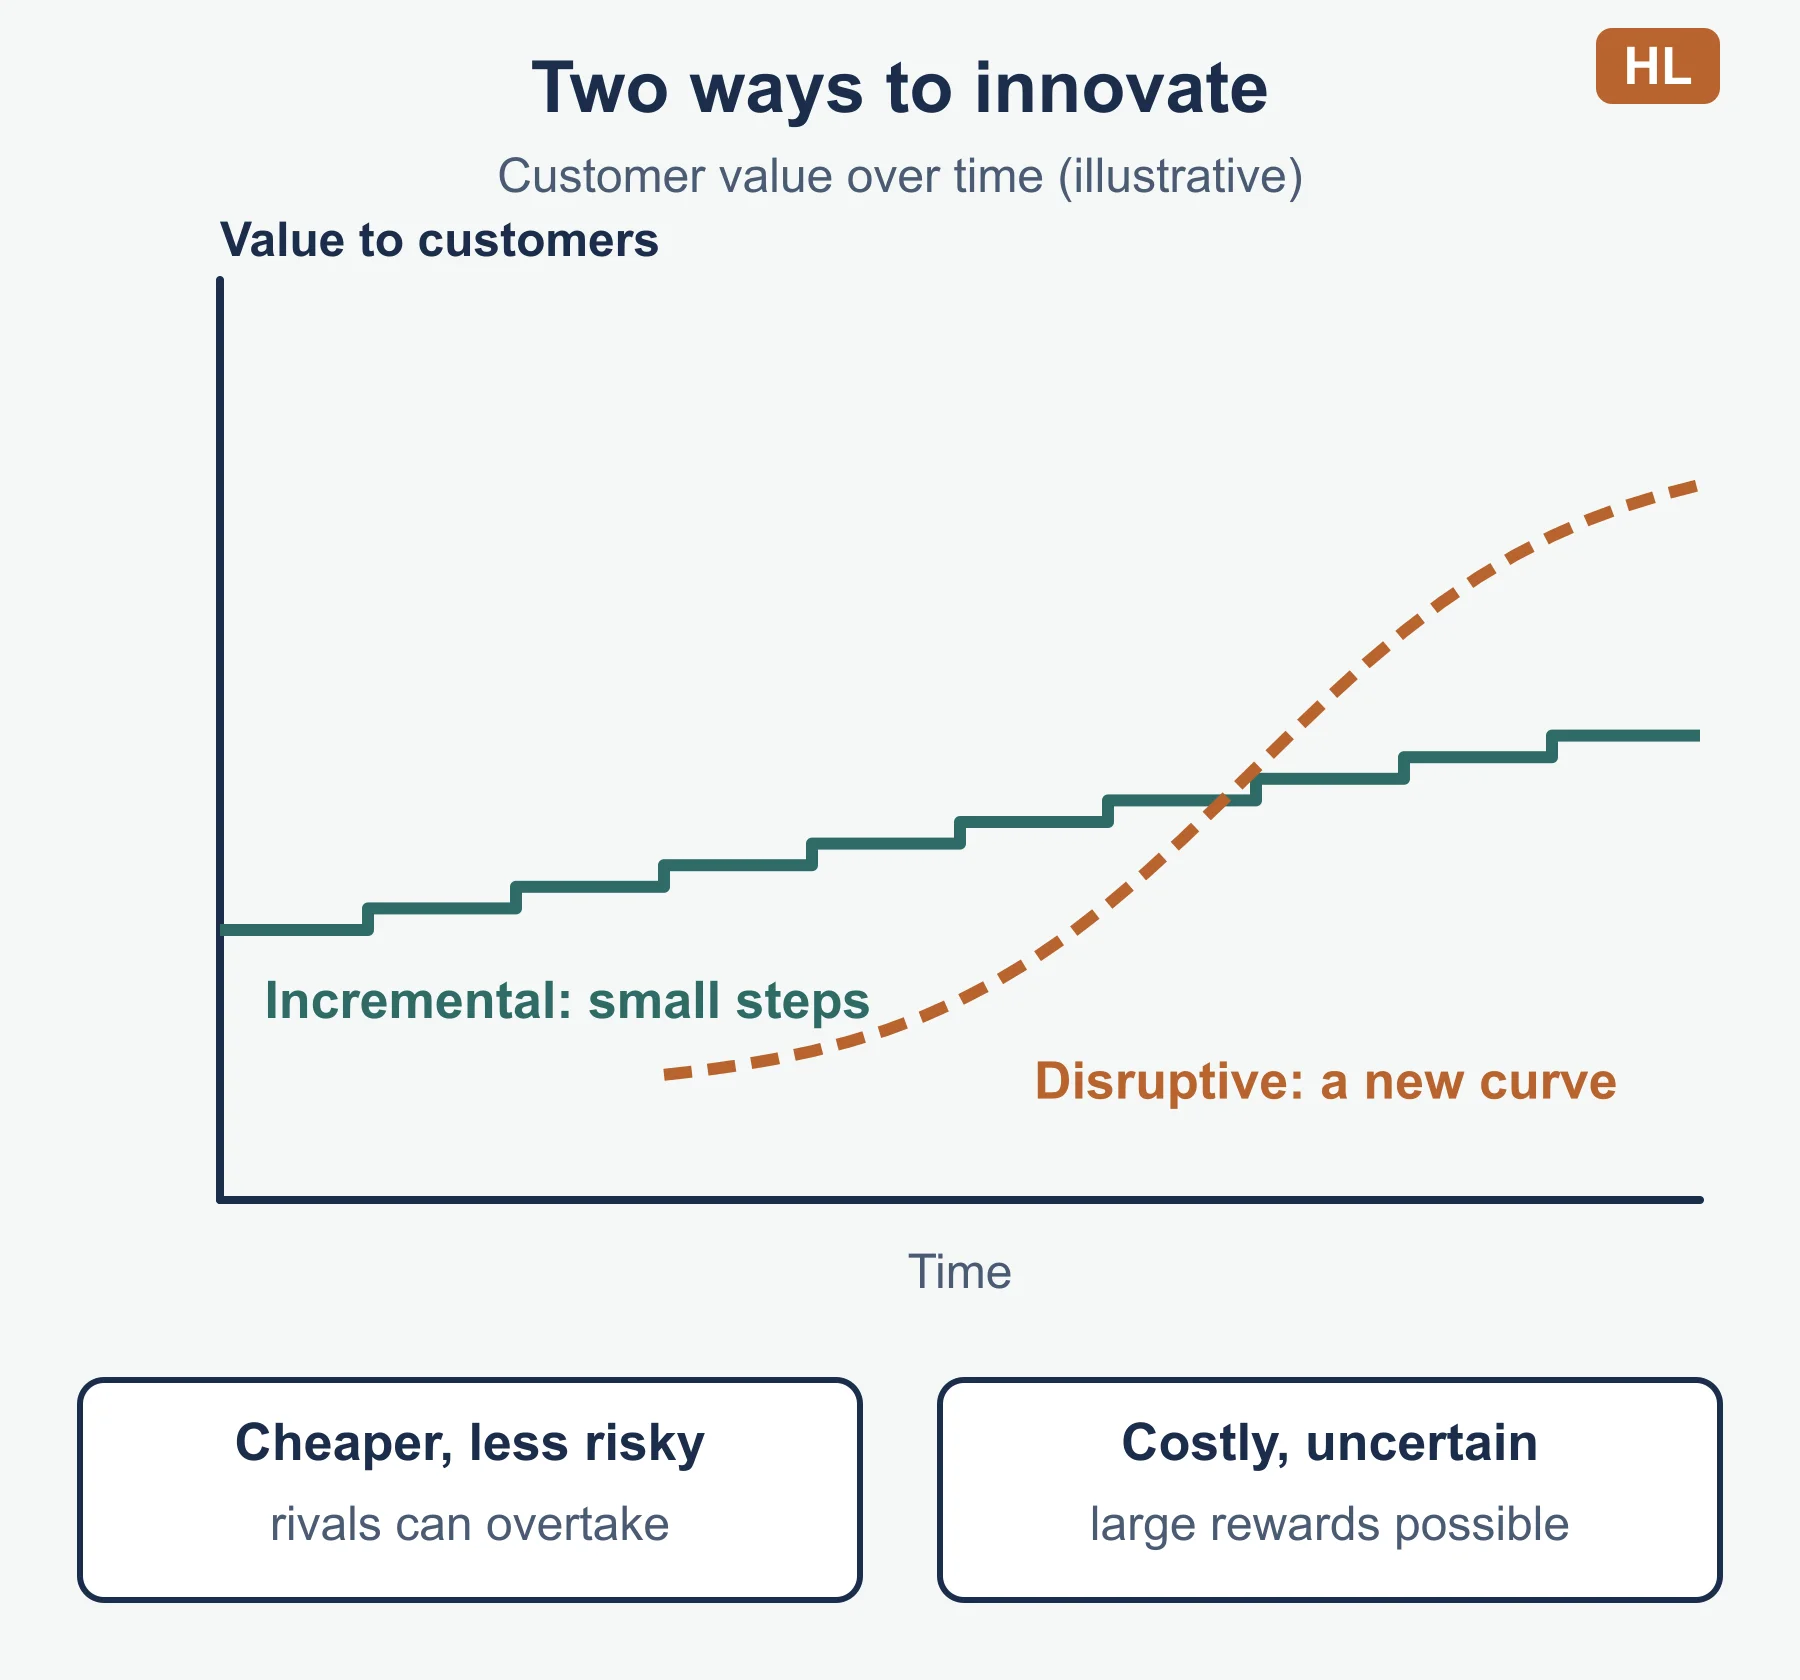
| Incremental innovation | Small improvements to what exists | Lower risk, lower reward |
| Disruptive innovation | A change that reshapes how a market works | Higher risk, possibly higher reward |
Why R&D matters (AO3: weigh both sides)
- For: new products for the portfolio, competitive advantage, lower costs through better processes, access to new markets.
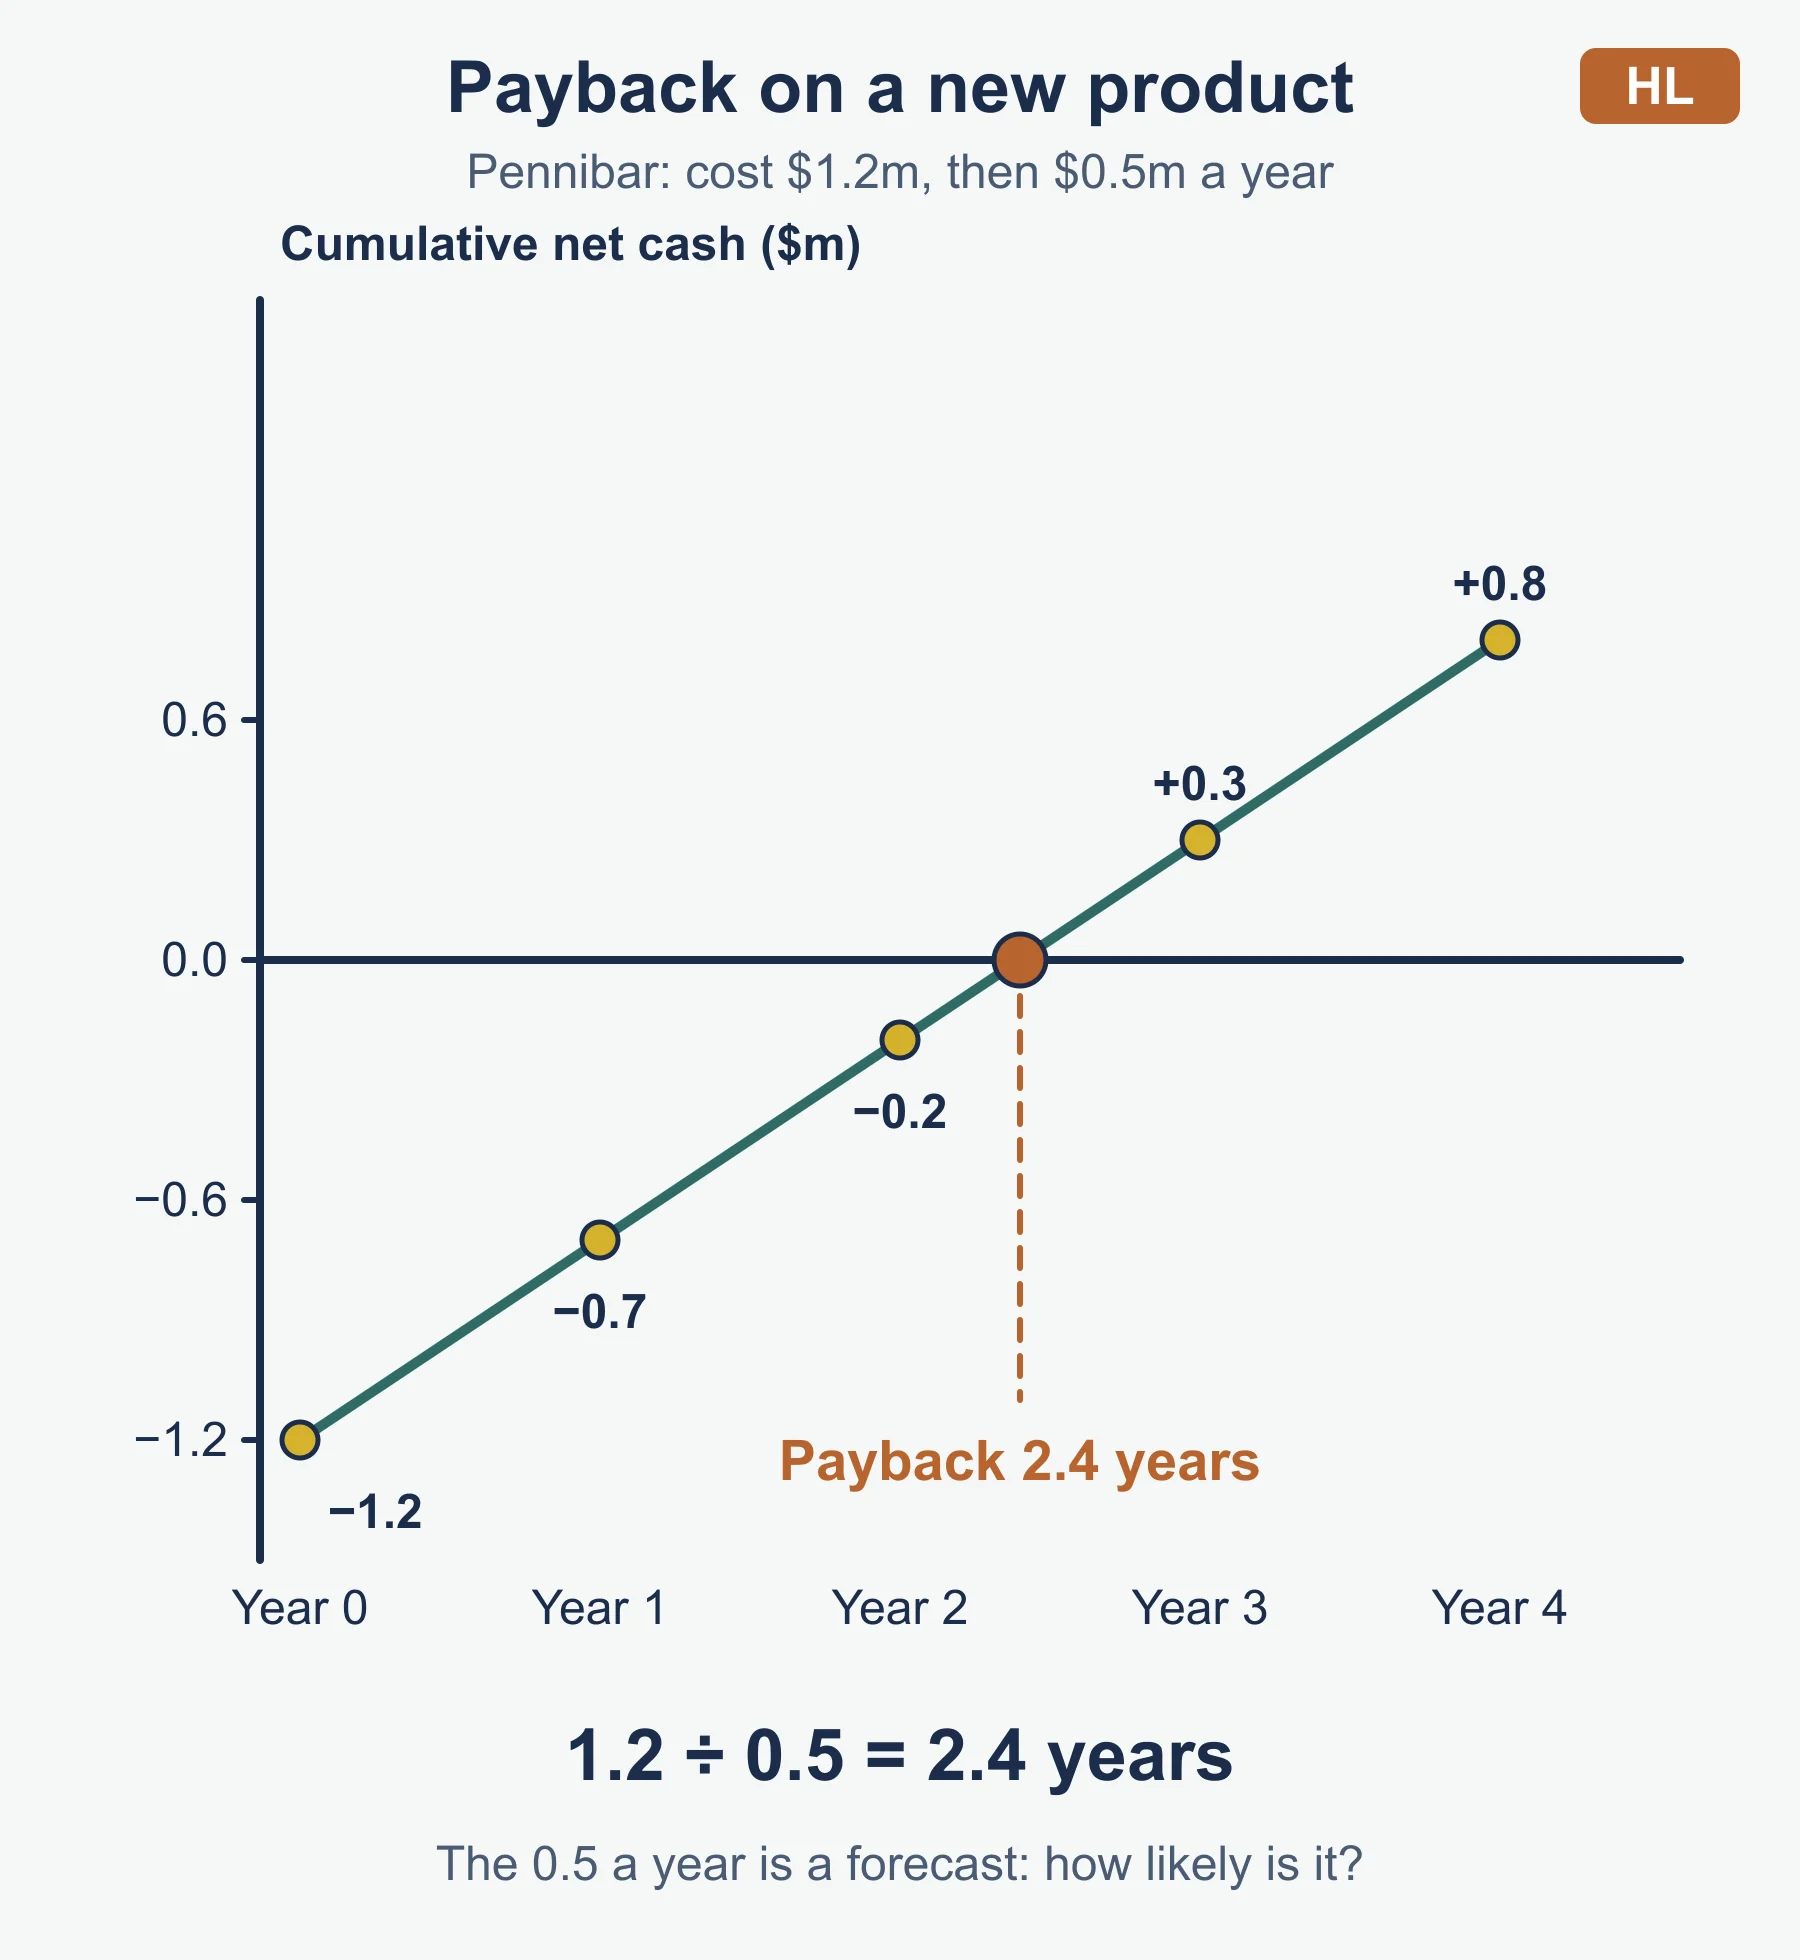
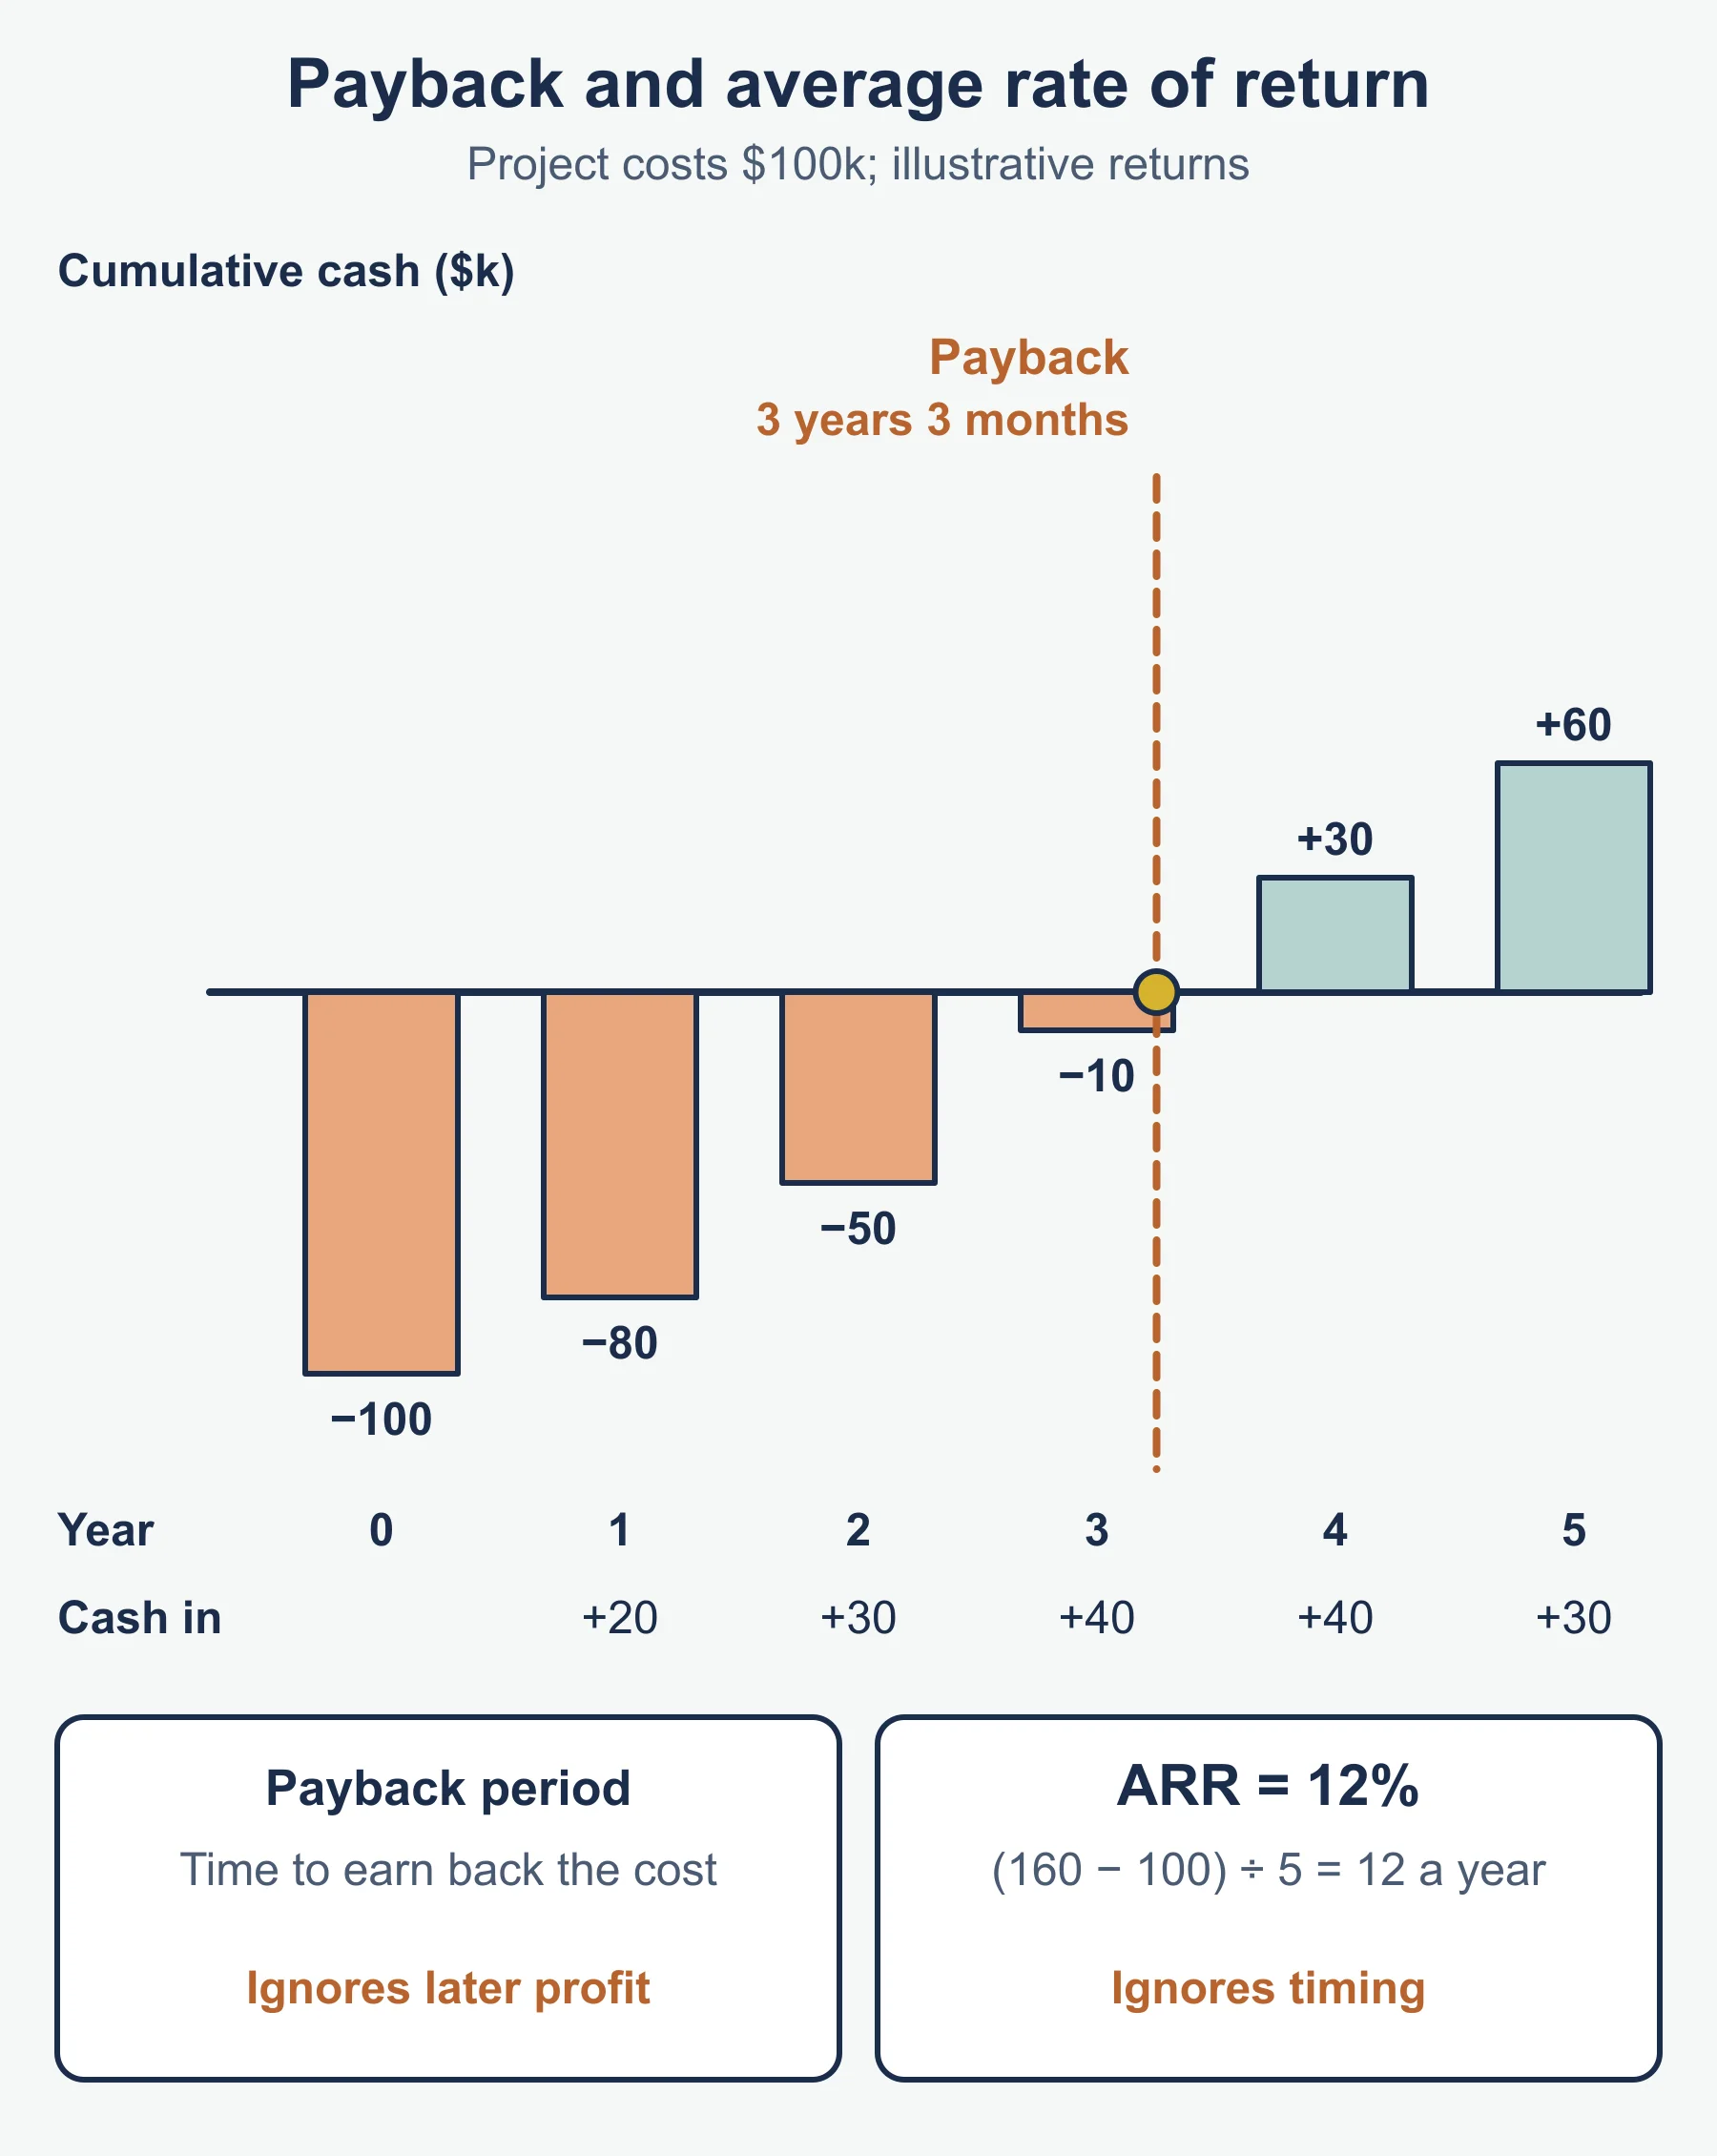
- Against: spending is certain and results are not, payback can be slow, and a finished product may not meet a real need.
- Judgement depends on: finances, size of competitors, speed of market change and quality of the ideas.
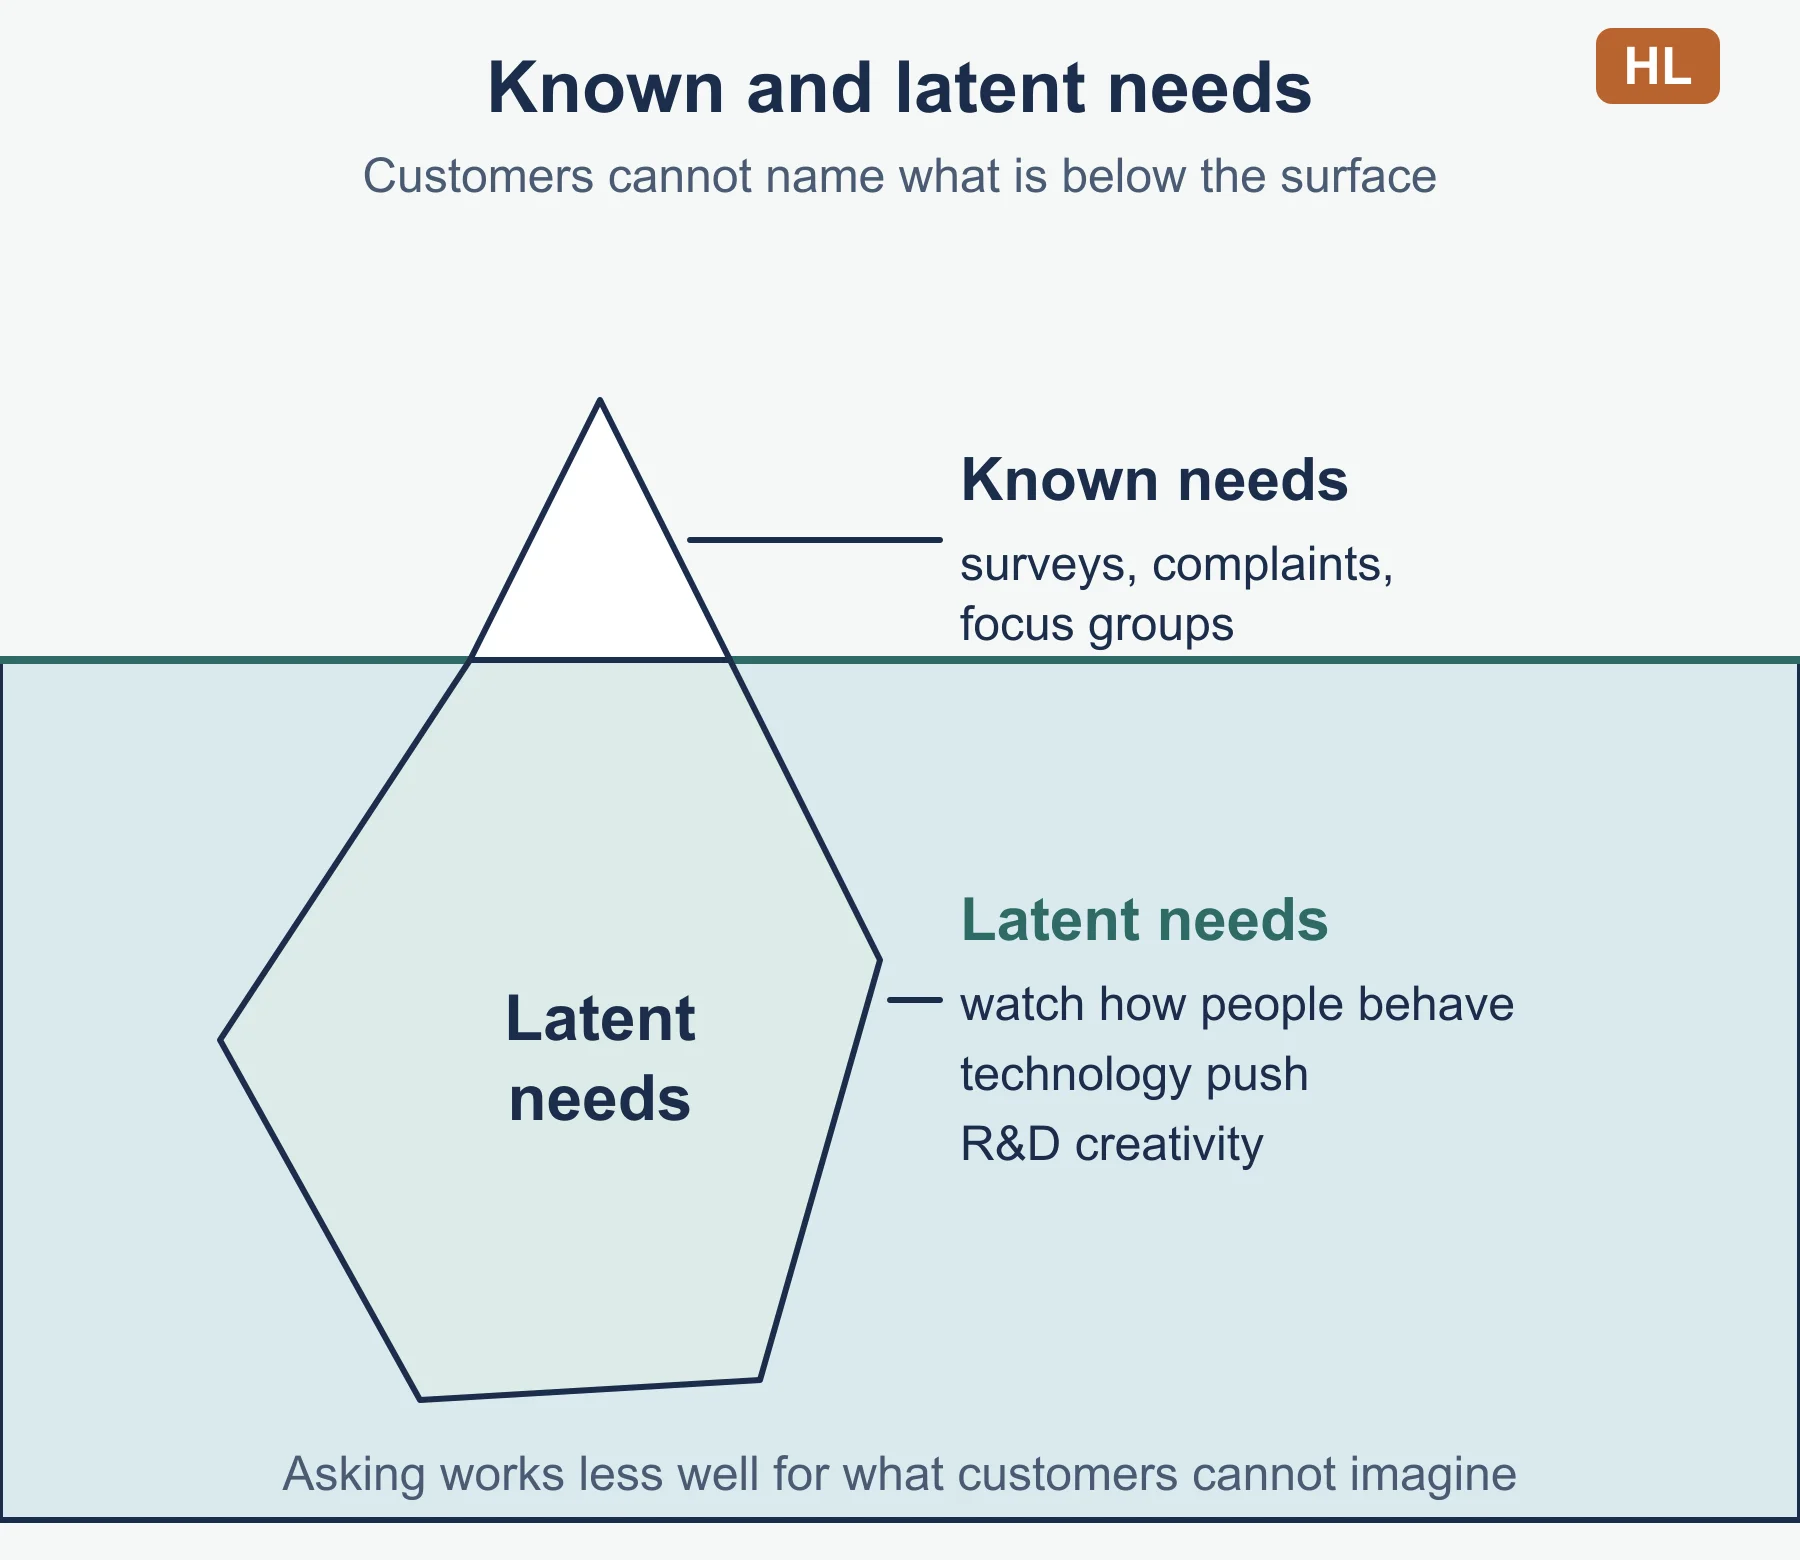
Method: handling a “known” versus “latent” need
- State whether customers can name the need.
- If they can, say how research (surveys, complaints, focus groups) would measure it.
- If they cannot, say how the business might observe behaviour or test a prototype.
- Close with the risk: the need may be smaller than hoped.
Must-know distinctions
| Compare | Incremental | Disruptive |
|---|---|---|
| Size of change | Small steps | Large shift in how the market works |
| Risk | Lower | Higher |
| Typical cost | Lower | Higher, often uncertain |
| Danger | A rival changes the market | Harms existing products; may fail |
Intellectual property: copyright covers creative works, a patent covers an invention, a trademark covers an identifying sign. The guide asks for general knowledge, not the legal rules of a particular country. Say the owner may license the work for a fee.
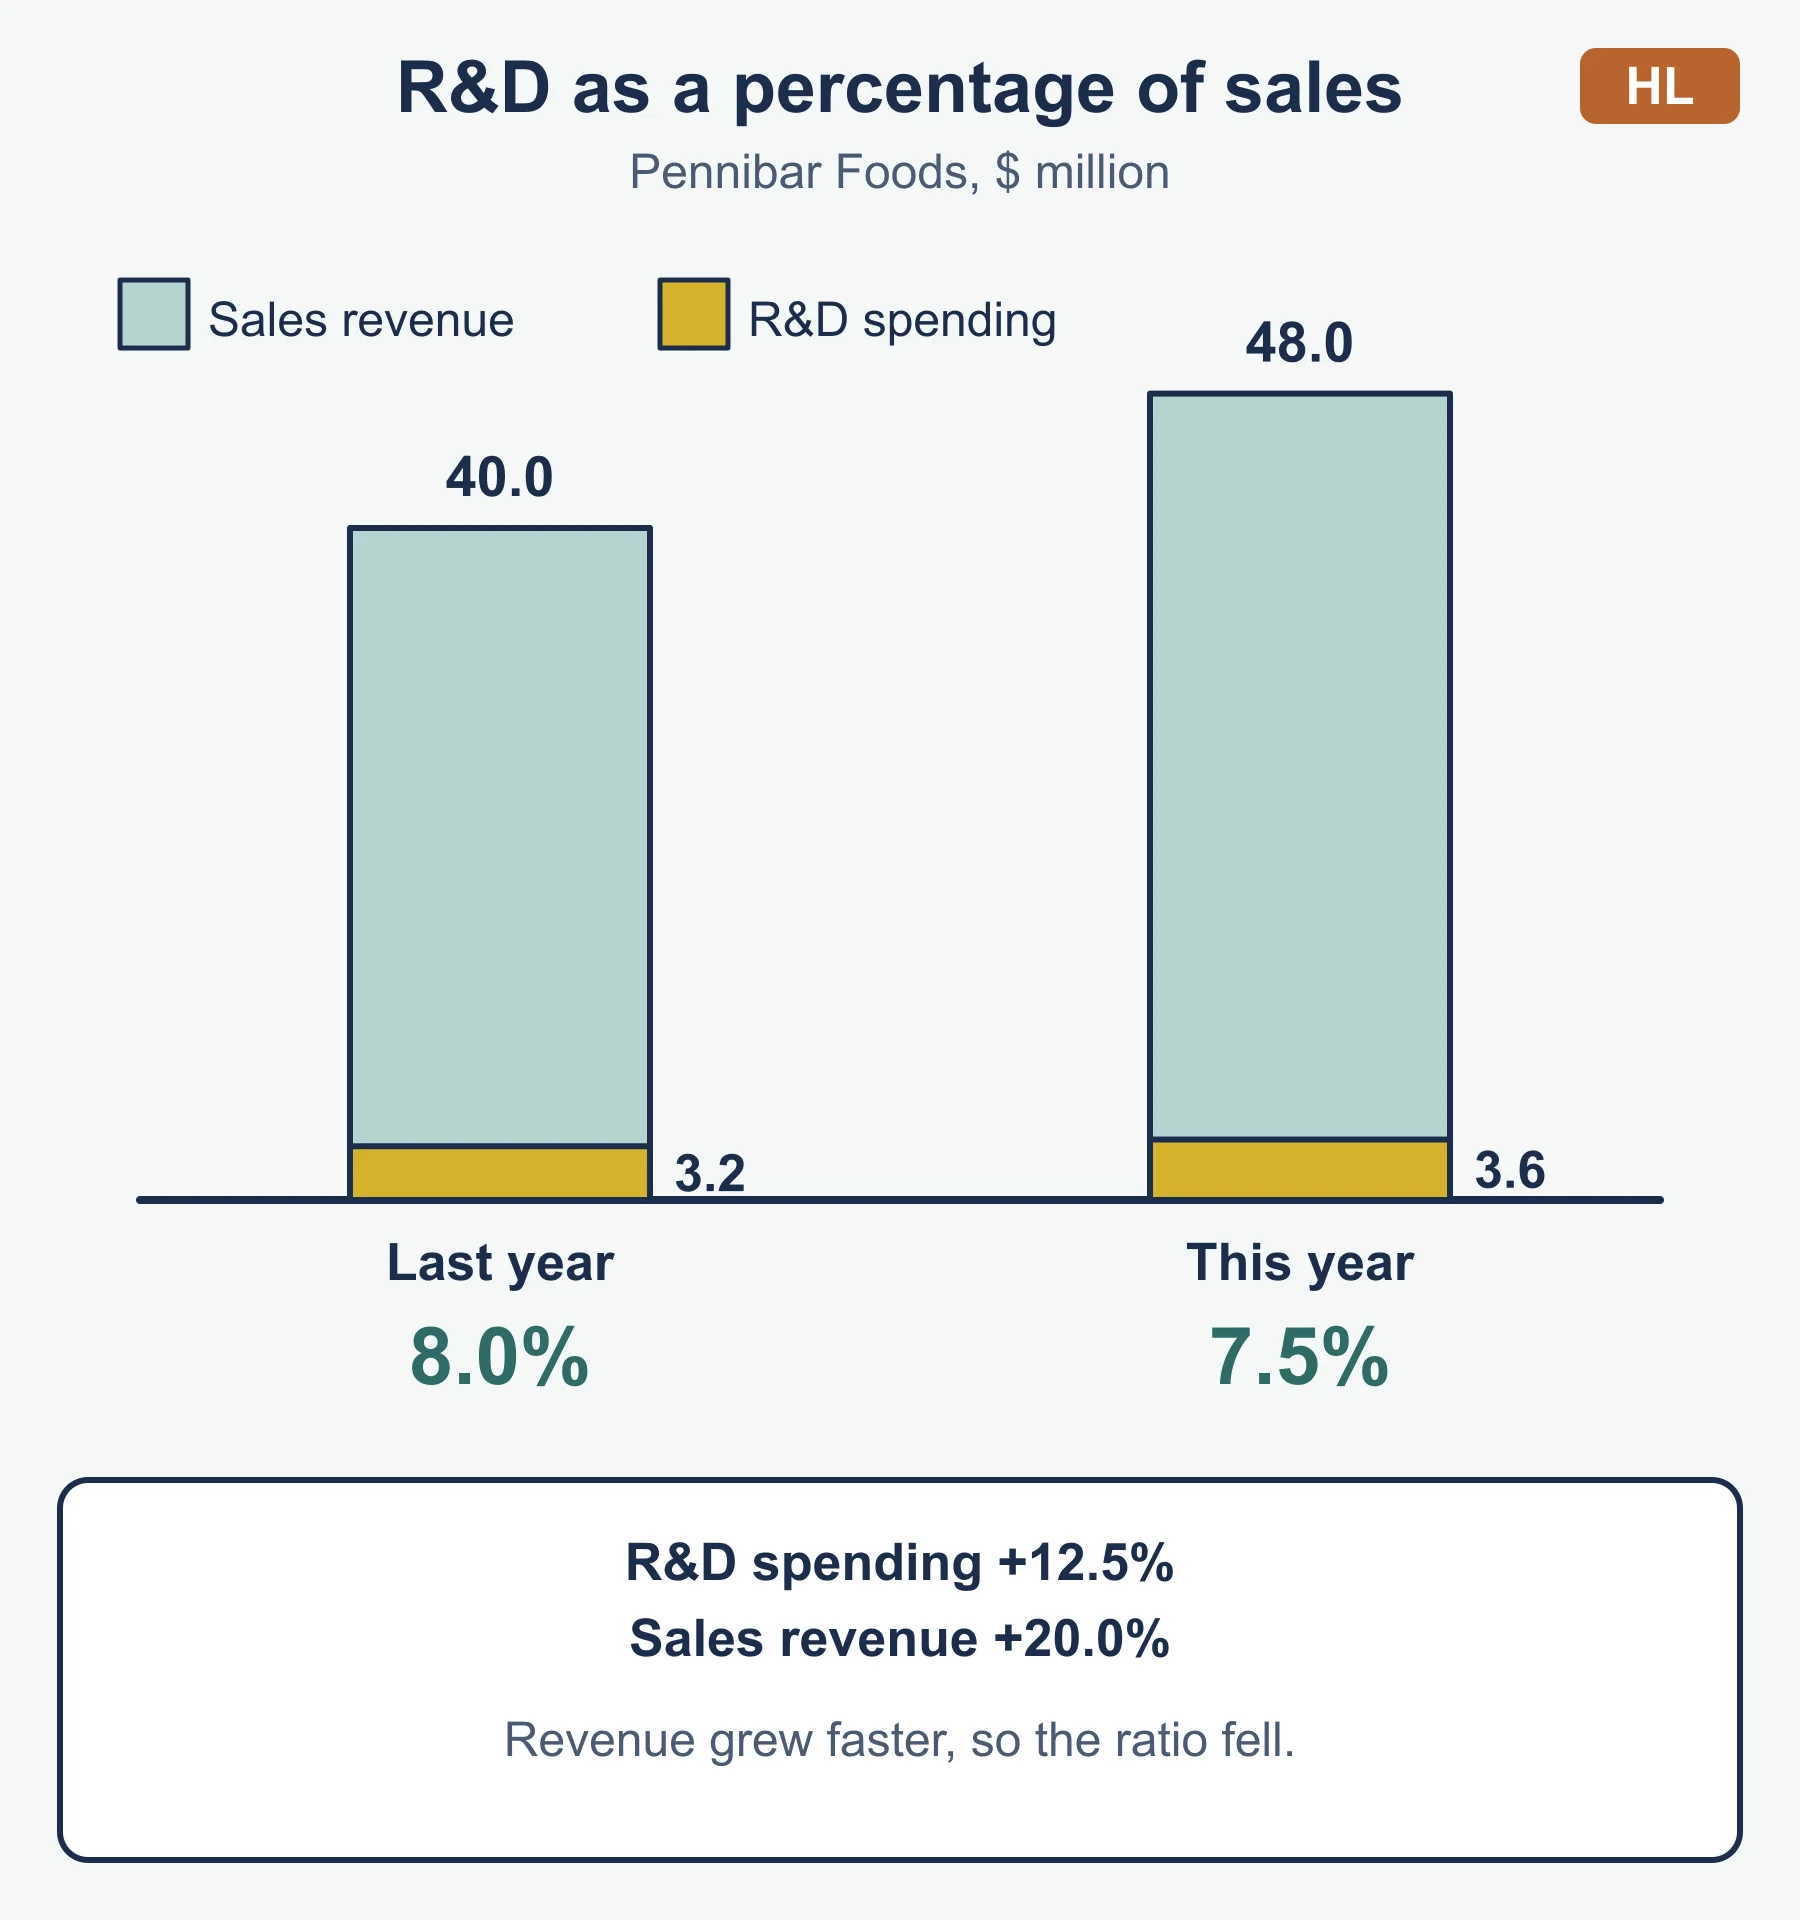
R&D intensity (standard ratio, not named in the guide) = R&D spending ÷ sales revenue × 100. Example: 2.7 million dollars of R&D on 45.0 million of sales revenue = 6.0%.
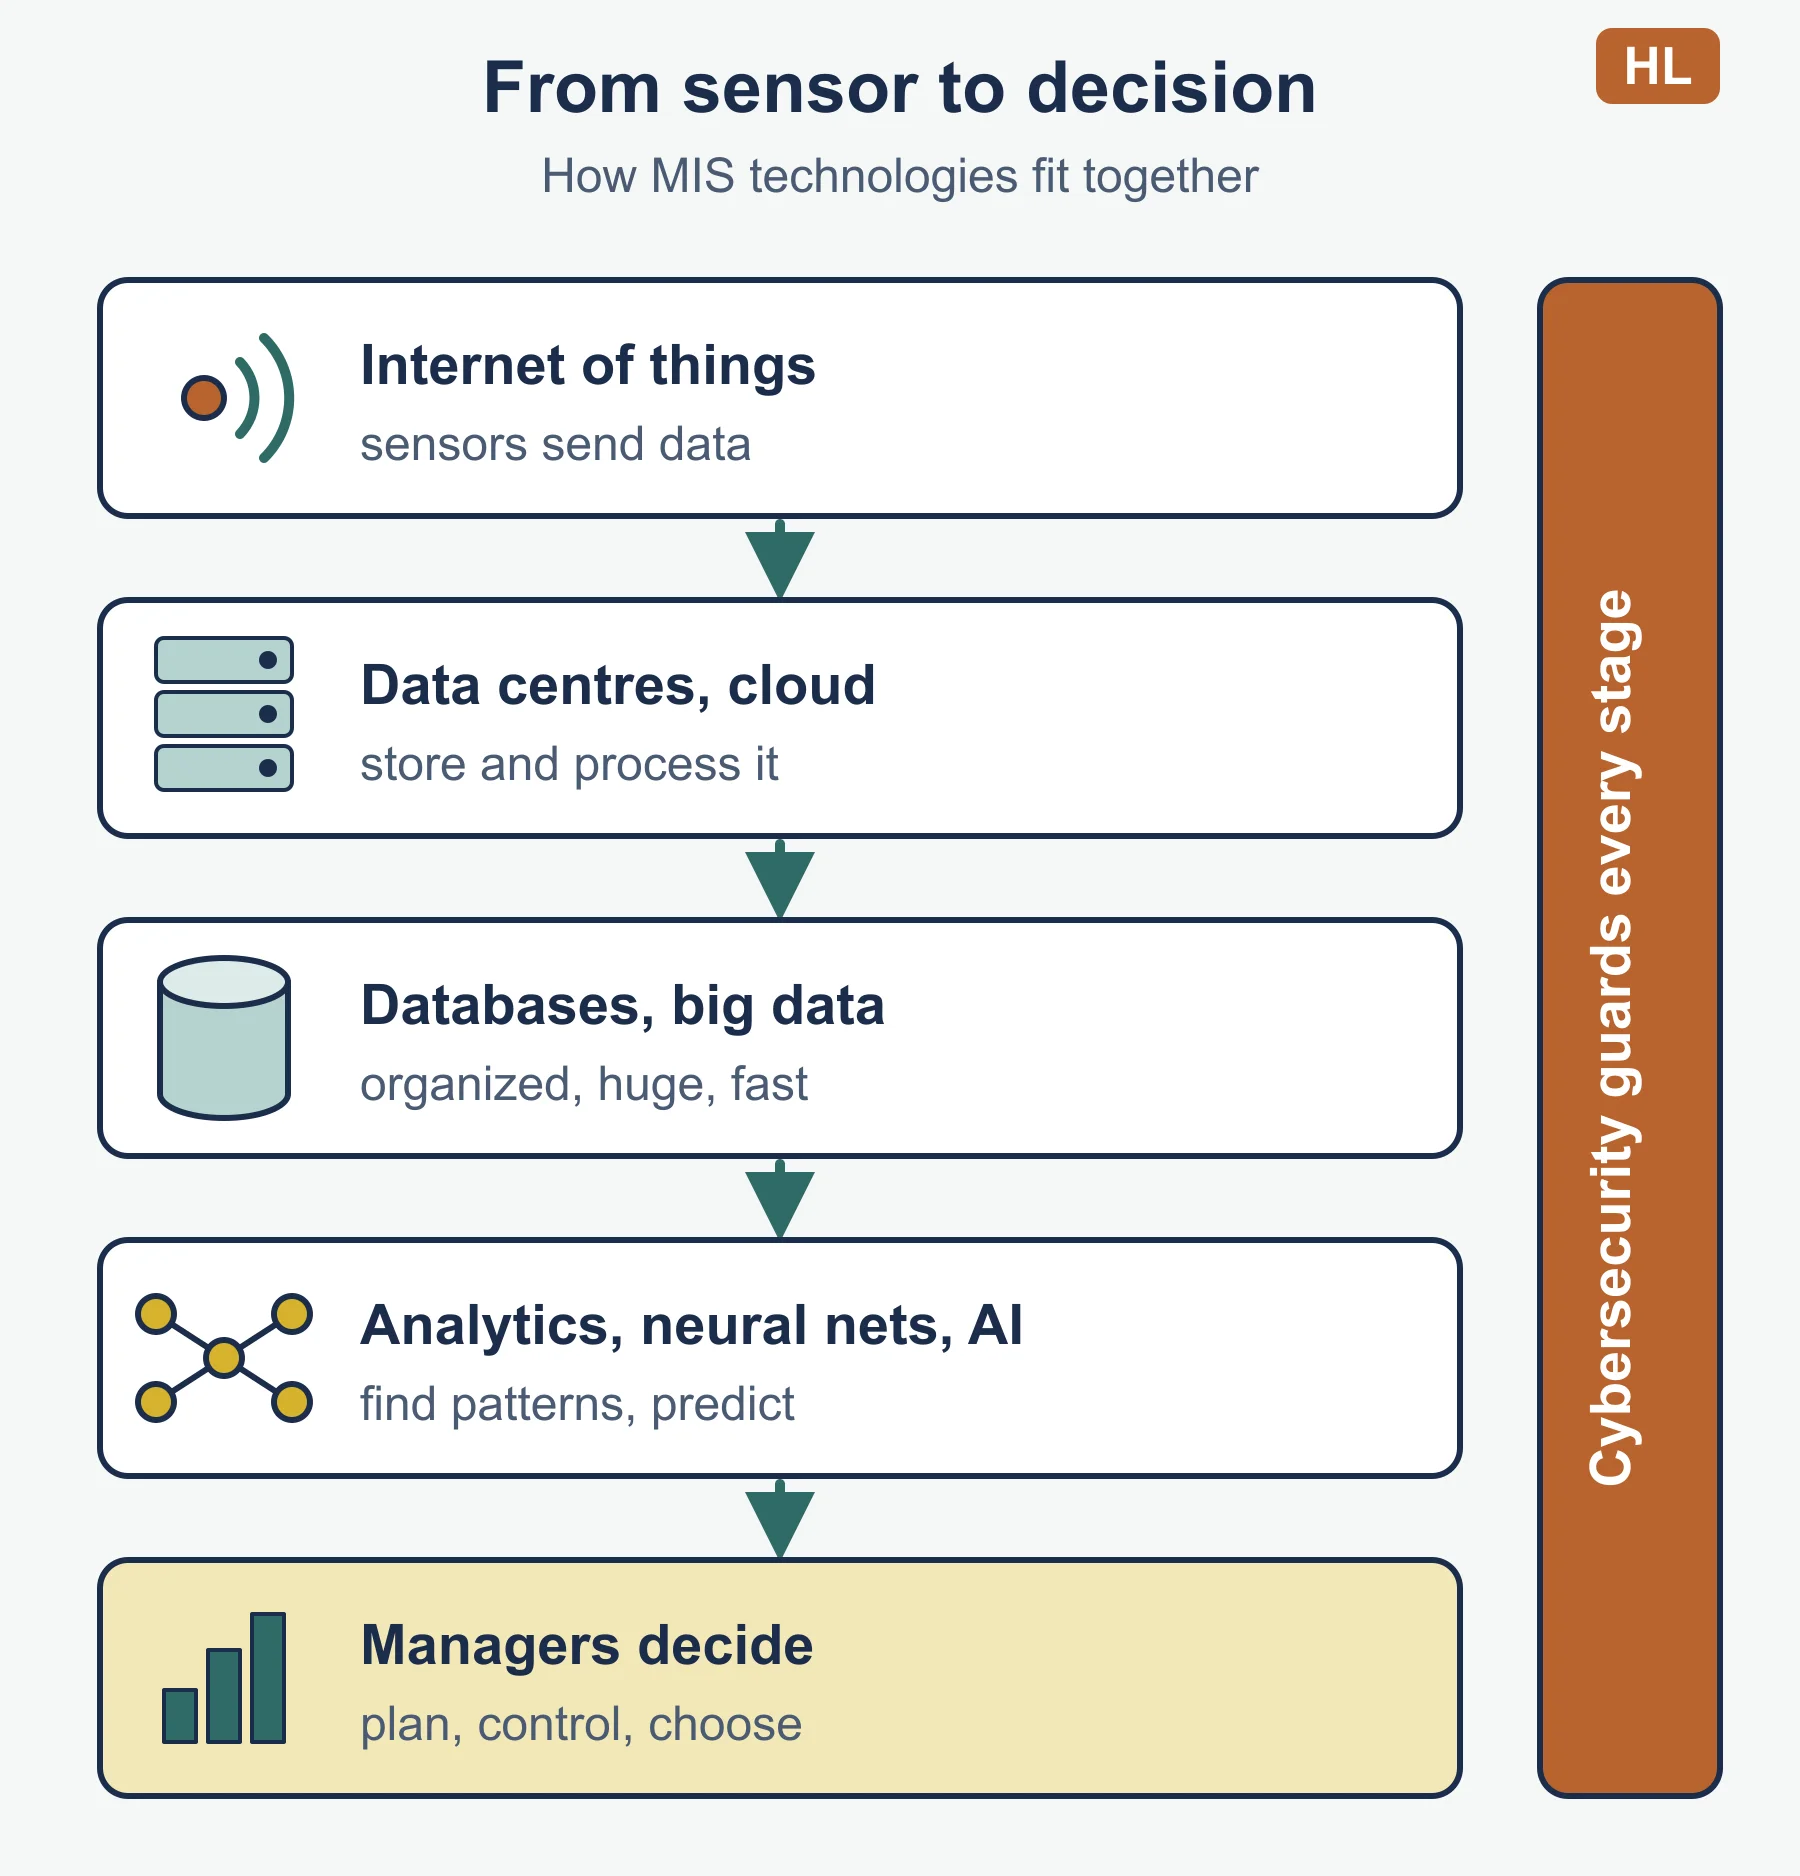
5.9 Management information systems: key points
| Term | Short definition | One benefit | One risk |
|---|---|---|---|
| Data analytics | Examining data for patterns to support decisions | Better-informed decisions | Poor data gives poor decisions |
| Database | Organized, searchable collection of data | Quick access to records | Breach exposes many records |
| Big data | Very large, fast, varied data sets | Detailed view of customers | Cost, privacy, information overload |
| Cybercrime | Crime through computers and networks | Not applicable | Loss of data, money, reputation |
| Cybersecurity | Measures that protect systems and data | Protects trust | Costs and never complete |
| Artificial neural network | System that learns patterns from examples | Forecasting, recognition | Hard to explain results |
| Data centre | Facility housing servers and storage | Reliable capacity | Heavy cost, power use |
| Cloud computing | Storage and processing over the internet | Pay for use, scale quickly | Dependence on supplier |
| Virtual reality (VR) | Immersive computer-generated environment | Safe training, virtual showrooms | Equipment cost |
| Internet of things (IoT) | Connected objects with sensors | Early warning of faults | More points to attack |
| Artificial intelligence (AI) | Systems doing tasks that normally need human intelligence | Fast routine decisions | Bias, lack of transparency, jobs |
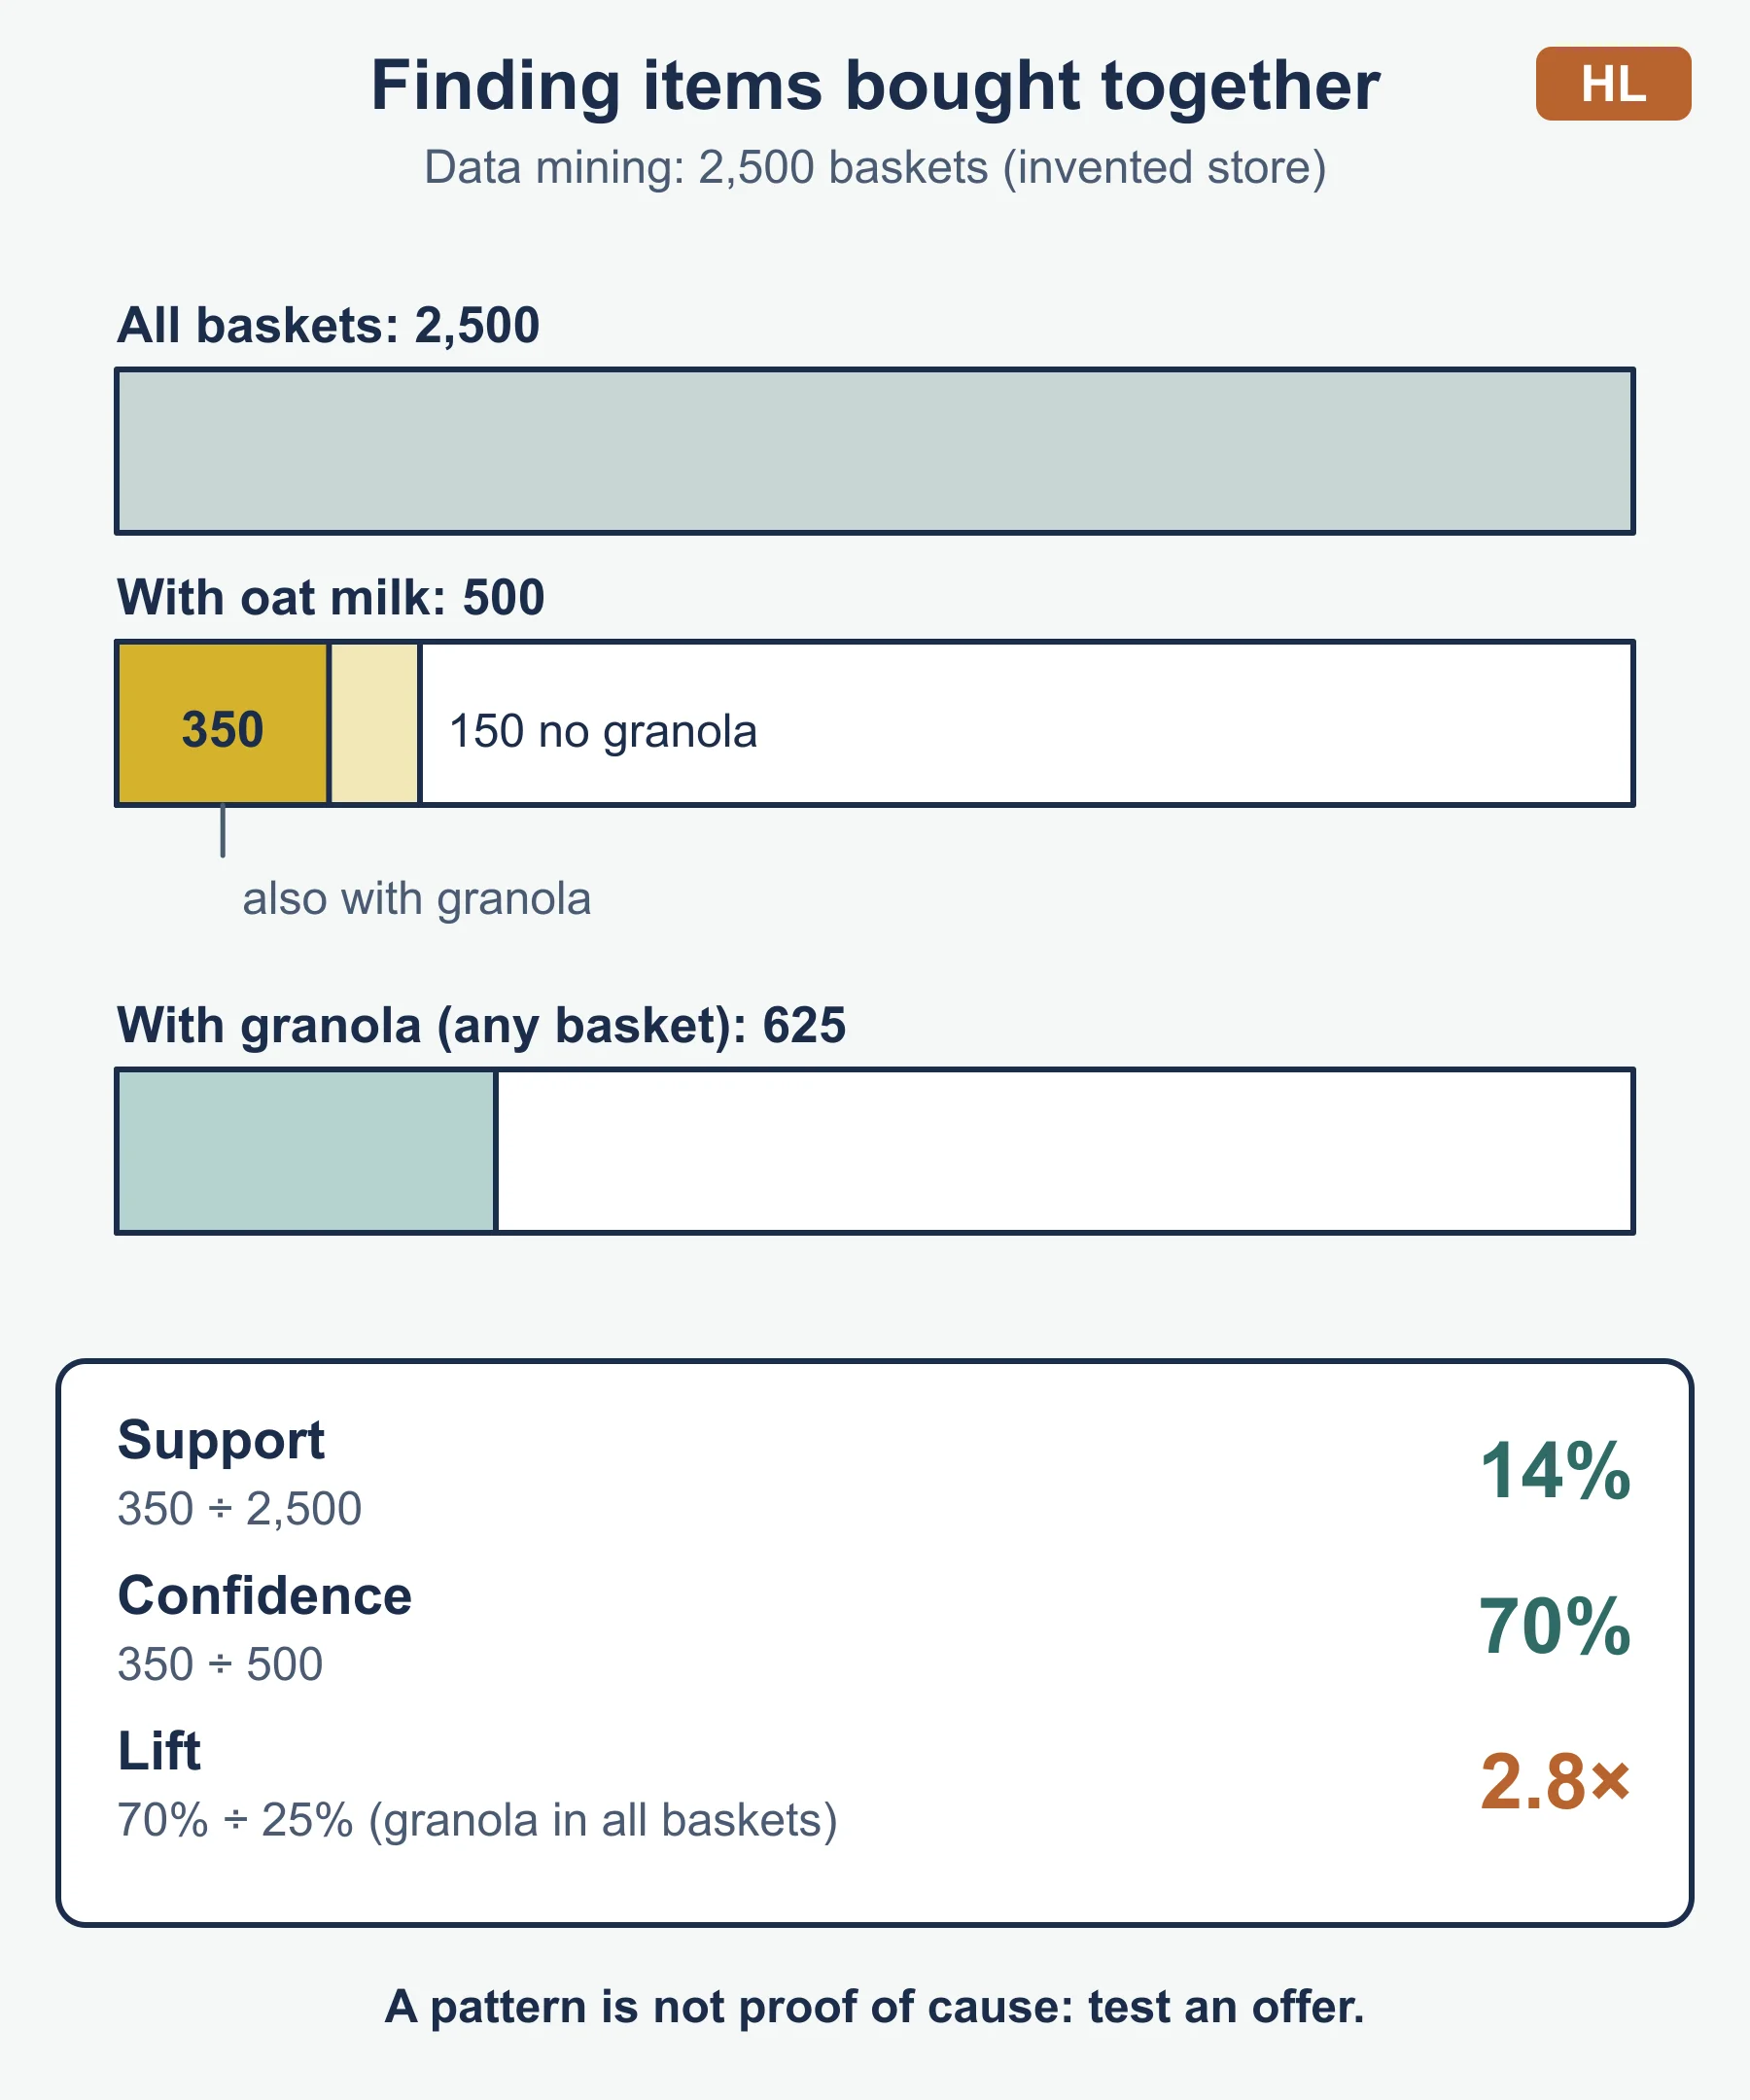
| Data mining | Searching large datasets for patterns | Finds hidden links | A pattern is not a cause |
Customer loyalty programmes (AO3)
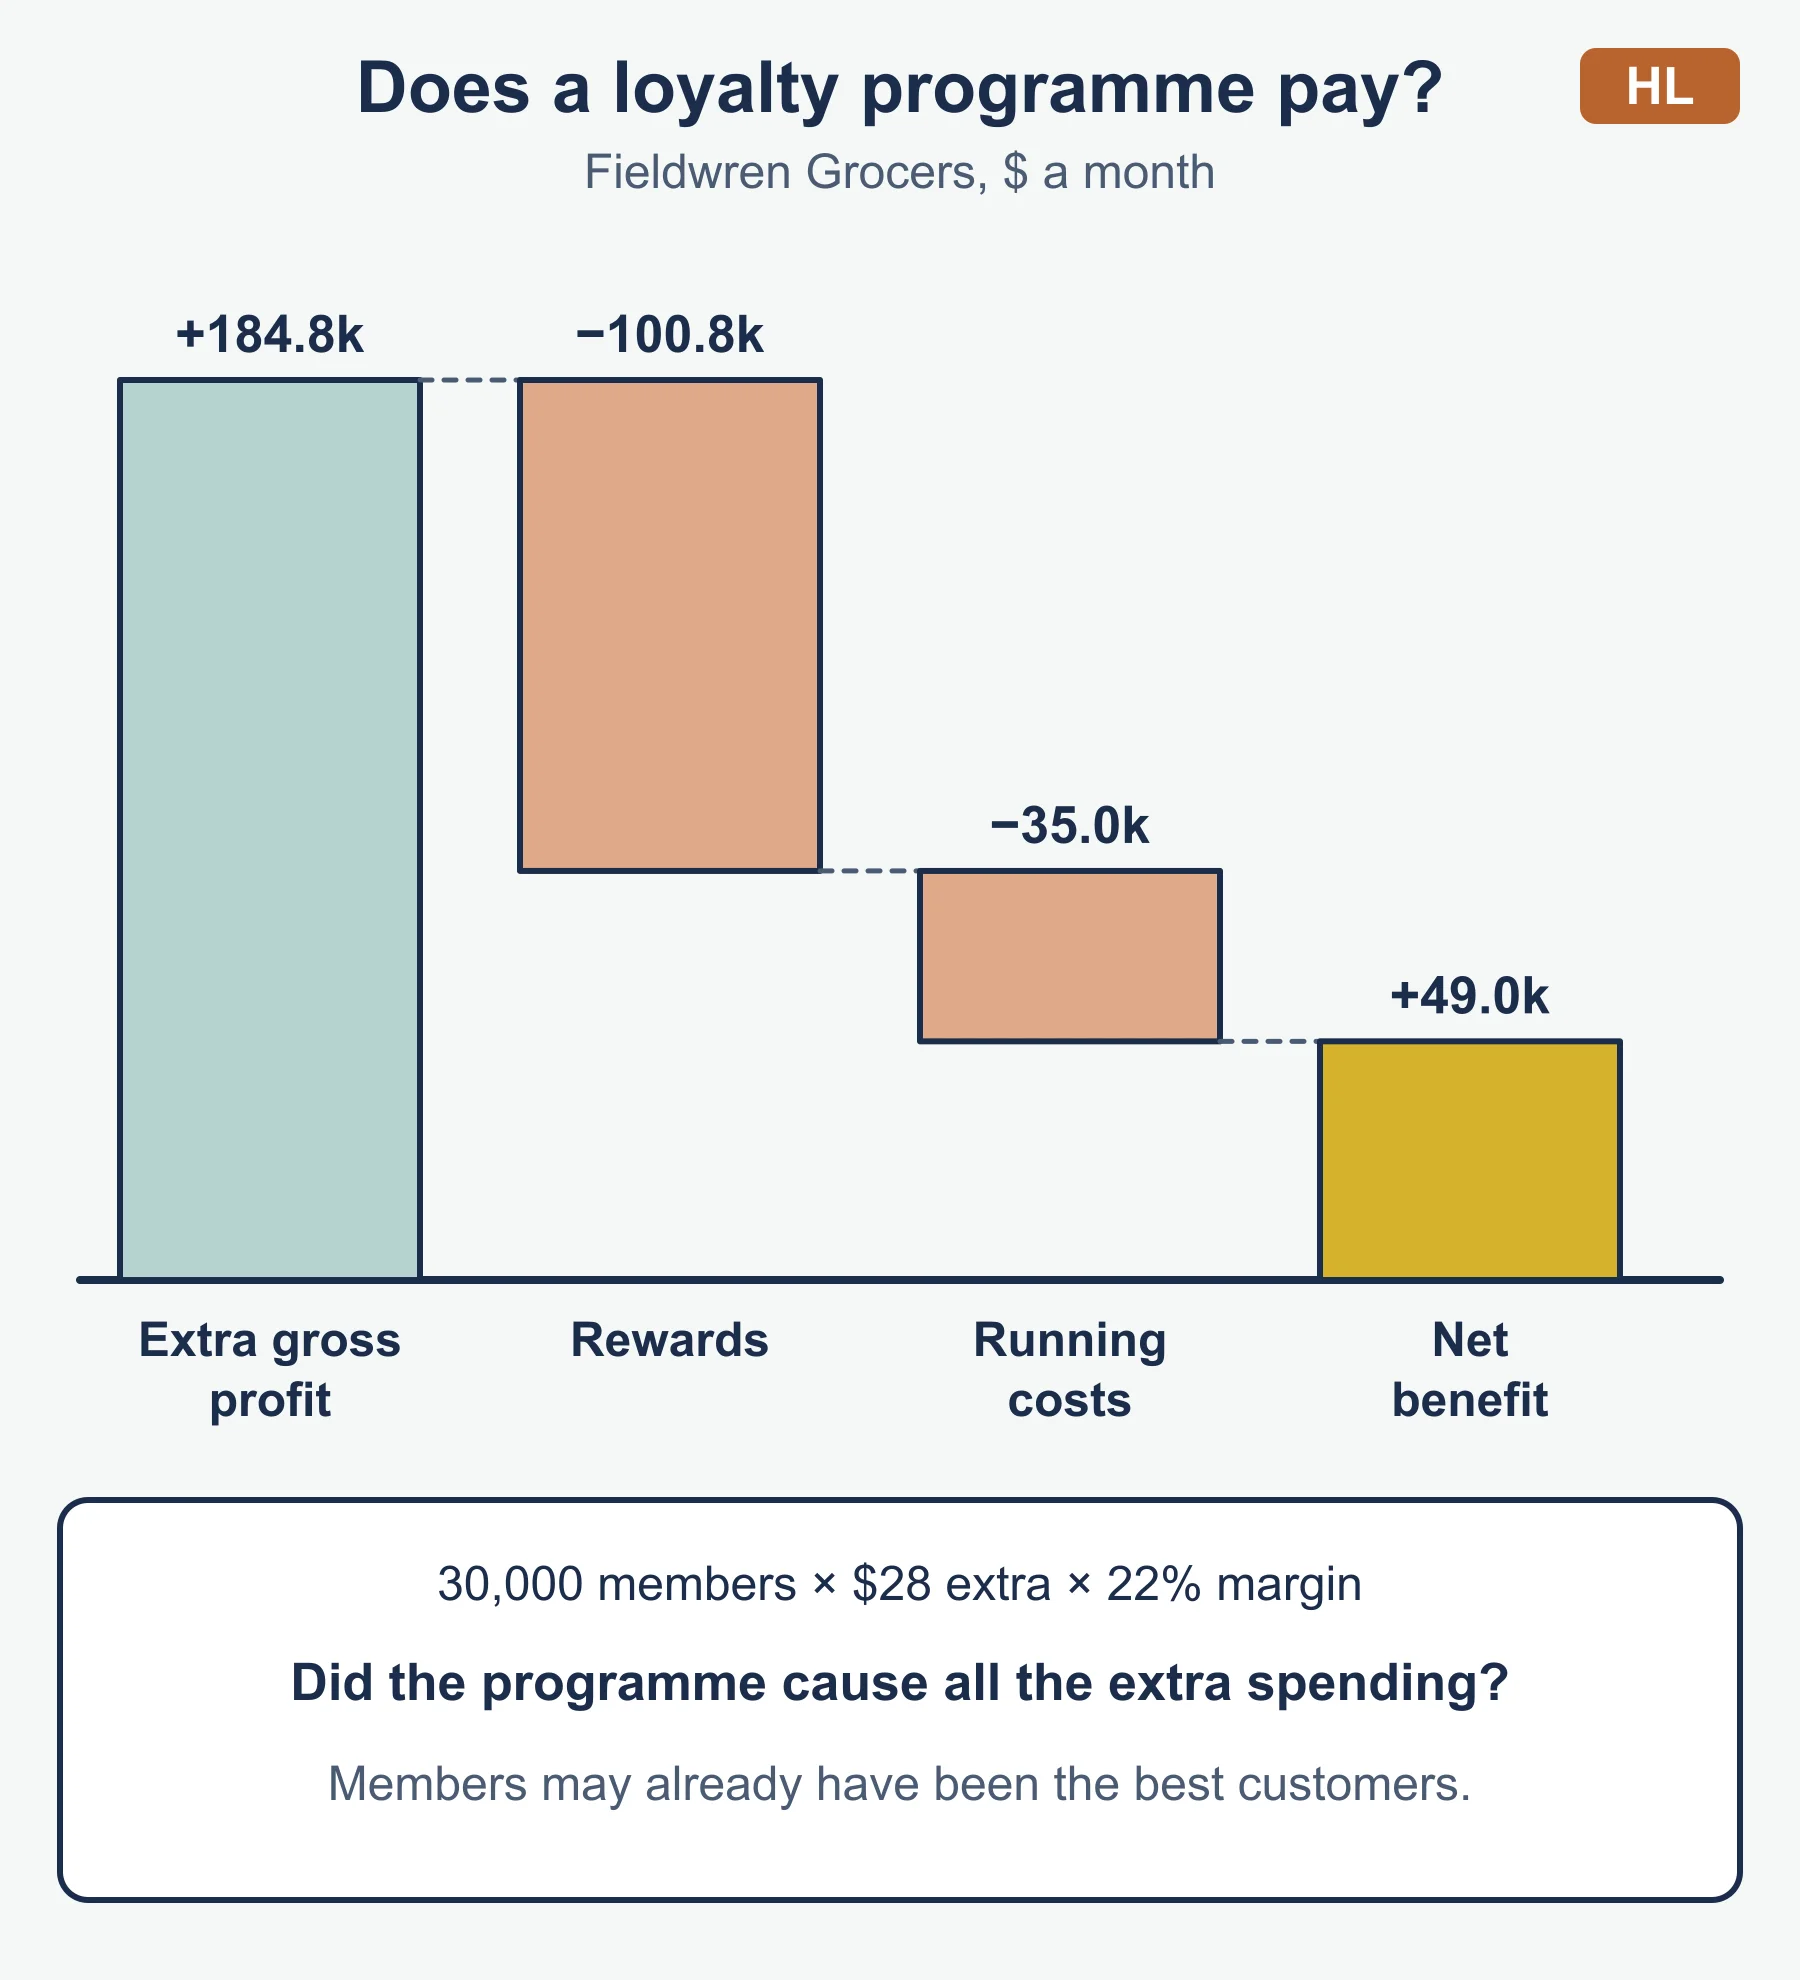
- Idea: reward repeat purchases and collect data on each member.
- For: repeat sales, targeted offers, better knowledge of customers.
- Against: reward cost, privacy concerns, possible bias in offers, members who would have bought anyway.
- Test: compare extra gross profit with reward and running costs, and ask whether the programme caused the extra spending.
Managing and monitoring employees (AO3)
- Uses: schedules, output measures, location tracking, absence flags.
- Digital Taylorism: digital tools apply Taylor’s scientific management, with small measurable tasks, standard times and constant monitoring.
- For: clear targets, quick spotting of problems, evidence for decisions.
- Against: stress, lower trust, privacy loss, quality ignored when only quantity is counted.
Data mining for decisions (AO3)
- State what the business wants to know.
- Say what data it would search.
- Say what pattern might appear and the action it suggests.
- Add the limit: a link is not proof of a cause, and the action should be tested.
Stakeholder grid for technology (AO3)
| Stakeholder | Possible gain | Possible loss |
|---|---|---|
| Customers | Convenience, personalization | Privacy, unequal treatment |
| Employees | Less routine work | Surveillance, job losses |
| Owners and shareholders | Efficiency, growth | Set-up cost, legal and reputation risks |
| Society | Wider access to services | Energy use, unequal access |
Ethical prompts: consent, how long data is kept, who is responsible for an automated decision, and fairness.
Method boxes for command terms
Explain (AO2)
- Make a point about the technology or practice.
- Give the reason or cause.
- Link it to the business or stakeholder named in the stem.
Evaluate, justify and recommend (AO3)
- Give at least one argument for and one against, each tied to the business.
- Say which matters more and why, using figures or facts from the stem.
- State a conclusion, and name what else you would want to know.
Example stem pattern: a firm with a small R&D budget is deciding between a safe upgrade and a risky new design. A balanced answer sets cash available and the rivals’ strength against the possible reward, then recommends one, perhaps with a smaller trial first.
Calculation boxes
- R&D intensity = R&D spending ÷ sales revenue × 100.
- Percentage change = (new − old) ÷ old × 100.
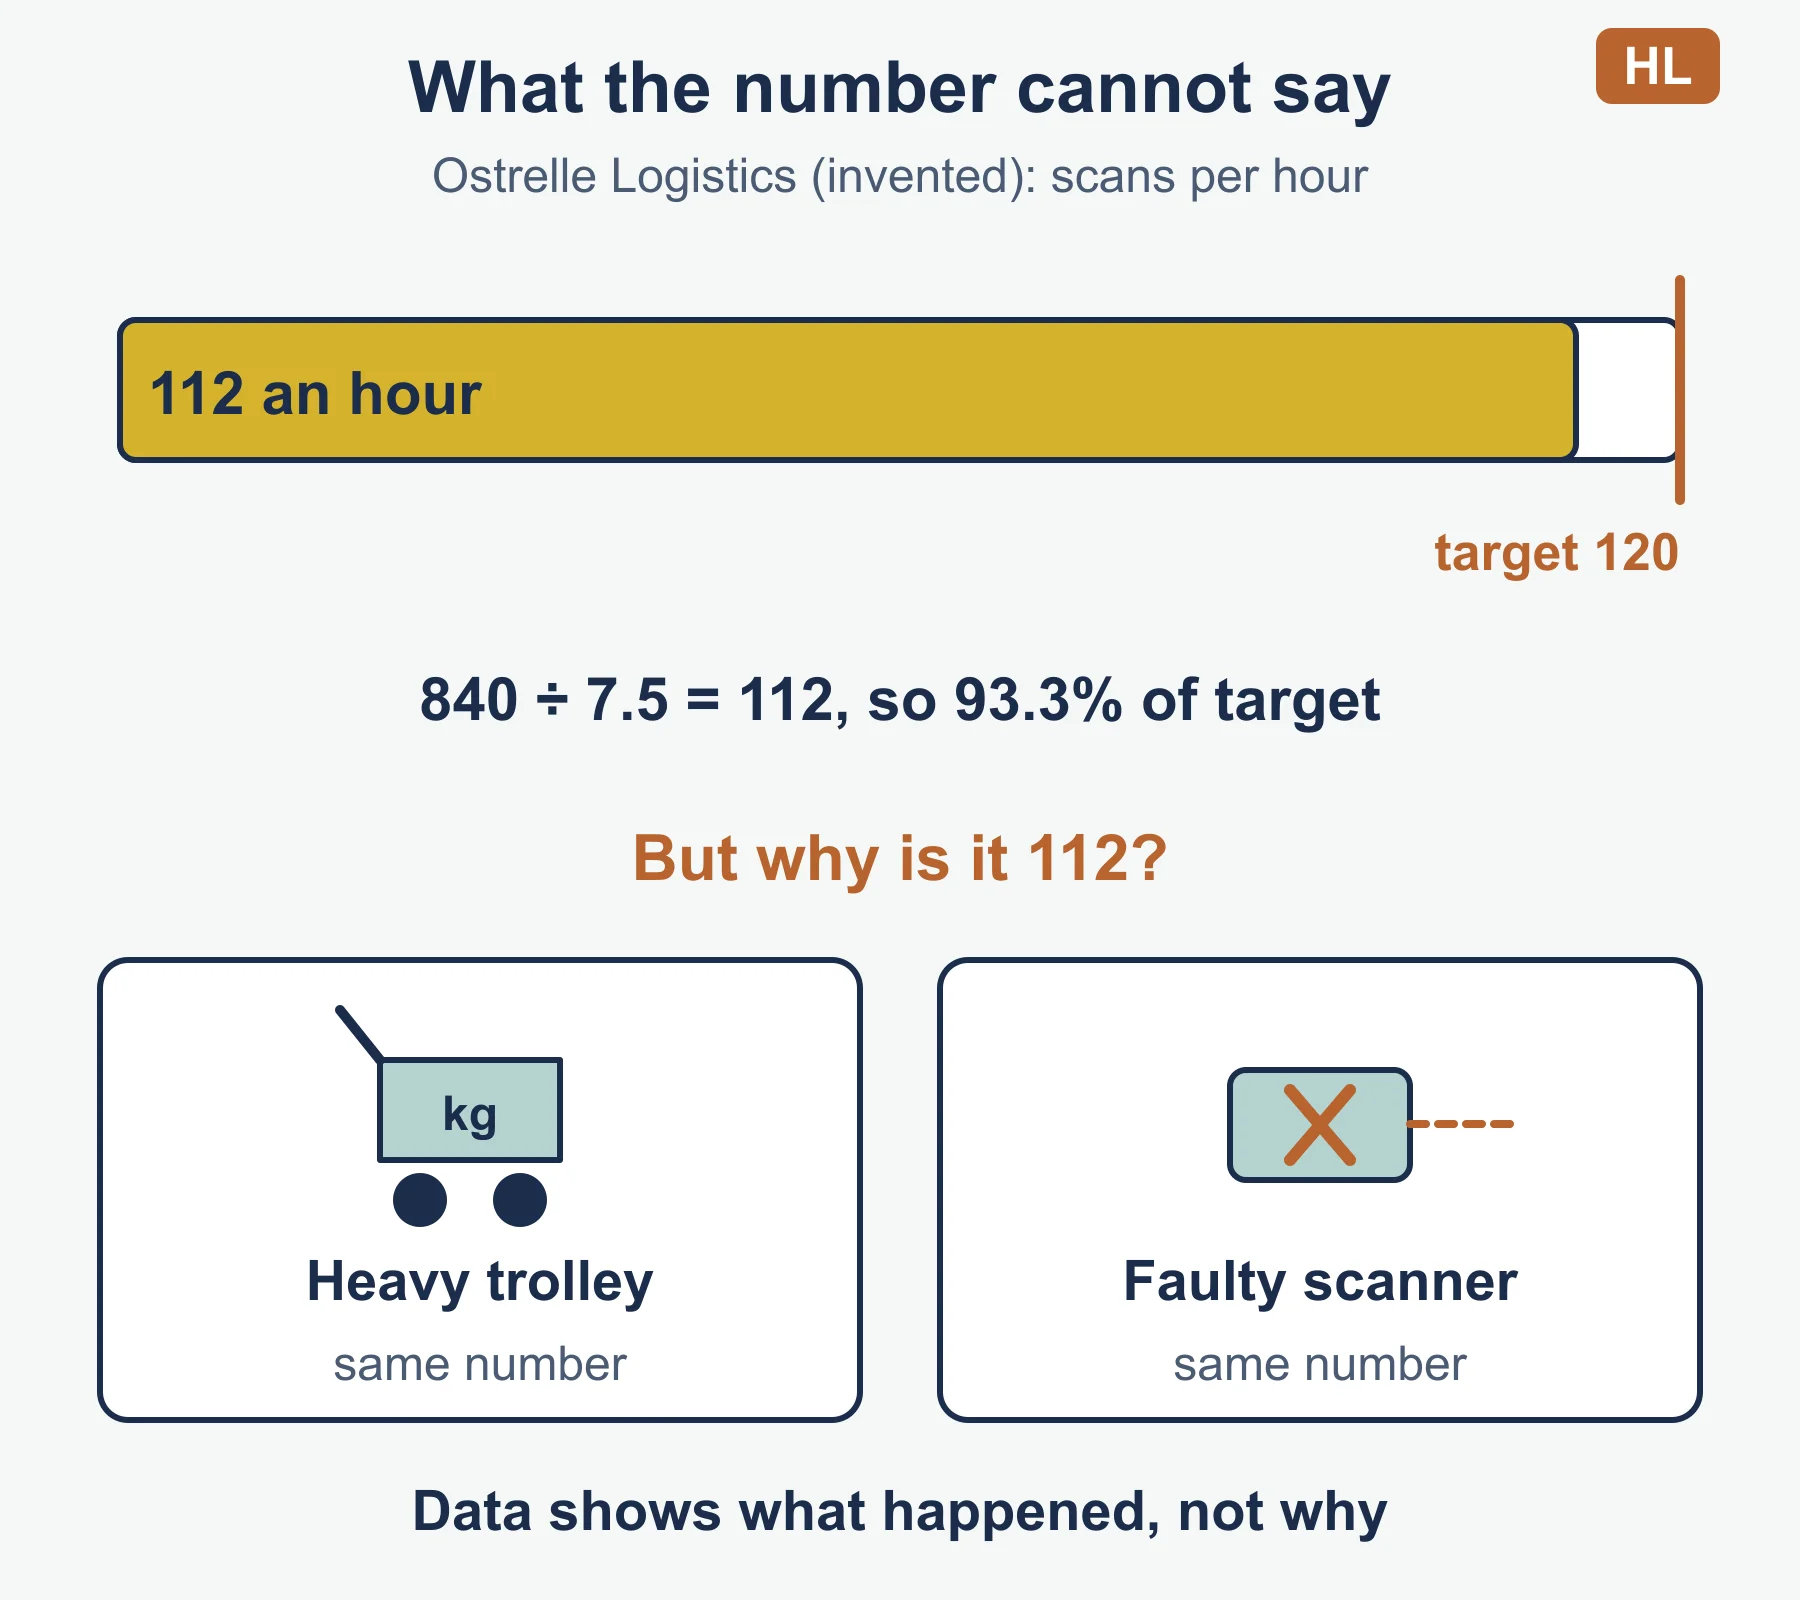
- Rate per hour = items ÷ hours worked; percentage of target = rate ÷ target × 100.
- Support = baskets with both items ÷ all baskets; confidence = baskets with both ÷ baskets with the first item. These two data-mining measures are standard forms, not guide content.
Write the formula, substitute, then give the answer with its unit.
Linking 5.8 and 5.9 to the rest of the course
- Operations: IoT sensors and AI can cut waste and breakdowns, and R&D can improve processes as well as products.
- Marketing: big data and loyalty programmes feed market research and promotion.
- Human resources: monitoring data and Digital Taylorism bear on motivation and employee relations.
- Finance: cloud computing changes the balance between fixed and variable costs, and R&D must be funded.
- Ethics and stakeholders: nearly every 5.9 question can be answered by saying who gains, who loses and whether it is fair.
Quick self-test
- Define research and development.
- State the three forms of intellectual property named in the guide.
- Distinguish a known unmet need from a latent one.
- Give one reason a business may choose incremental innovation.
- A firm spends 2.7 million dollars on R&D with sales revenue of 45.0 million. Calculate R&D as a percentage of sales revenue.
- A firm licenses a patent for a 4% royalty on licensee sales of 5.5 million dollars. Calculate the royalty.
- Outline what cloud computing is.
- Give one risk and one benefit of the internet of things.
- An email campaign sent to 6,400 customers led to 512 purchases. A generic campaign to 6,400 customers led to 320. Calculate the purchase rate of each, and the percentage difference between the two numbers of purchases.
- A warehouse worker scans 960 items in 7.5 working hours against a target of 120 an hour. Calculate the rate and the percentage of target.
- What does Digital Taylorism mean?
- Explain one ethical concern about data mining.
Answers
- Work to discover new knowledge and turn it into new or improved goods, services or processes.
- Copyrights, patents and trademarks.
- In a known need the customers can describe the problem. In a latent need they do not realize it until a product shows them.
- It costs less and carries less risk, and customers already understand the product.
- 2.7 ÷ 45.0 × 100 = 6.0%.
- 4% × 5,500,000 = 220,000 dollars.
- Storage and processing supplied over the internet, usually paid for by use.
- Benefit: sensors warn of a fault before breakdown. Risk: more connected devices give criminals more ways in.
- Personalized: 512 ÷ 6,400 = 8.0%. Generic: 320 ÷ 6,400 = 5.0%. Difference in purchases: (512 − 320) ÷ 320 = 60.0%.
- 960 ÷ 7.5 = 128 an hour, which is 106.7% of target.
- Using digital tools to monitor and measure work broken into small tasks, applying Taylor’s scientific management ideas.
- Customers may not know their data is used, so consent and privacy are in question. Patterns may also copy past bias into offers.
Where marks are usually lost
- Defining a term and stopping, when the command term asks for explanation or judgement.
- Listing technologies with no link to the business in the stimulus.
- Treating the three forms of intellectual property as interchangeable.
- Stating that a patent guarantees success rather than only preventing copying.
- Writing benefits only, with no risk, ethical point or stakeholder.
- Assuming a pattern in data proves a cause.
- Giving a calculation answer with no working or no units.
- Ending an evaluation with no conclusion that weighs the arguments.
Frequently asked questions
What are the three forms of intellectual property in IB Business Management? The guide names copyrights, patents and trademarks. Copyright covers creative works, a patent covers an invention, and a trademark covers a sign that identifies a brand.
What is the difference between incremental and disruptive innovation? Incremental innovation improves an existing product or process in small steps with lower risk. Disruptive innovation creates a product or business model that changes how a market works, with higher risk.
What is Digital Taylorism? Digital Taylorism is using digital tools to monitor and measure work broken into small tasks, applying Taylor’s scientific management ideas. It gives clear targets but can raise stress, lower trust and reduce privacy.
How do you calculate R&D intensity? R&D intensity is R&D spending divided by sales revenue, multiplied by 100. It is a standard ratio rather than one named in the guide.
Official syllabus
IB Diploma Programme Business management guide, first assessment 2024, published by the International Baccalaureate Organization. Sections 5.8 and 5.9 (both HL only).
Get free revision emails (optional)
Occasional emails with practice questions, worked explanations and links to free resources for the qualification and subjects you choose. No spam, and you can unsubscribe from any email. The free tools on this site never need an email.
Related resources
-
Study guides
IB DP Business Management: Break-even analysis
Study guide to IB DP Business Management section 5.5: break-even chart, margin of safety, target profit and price, effects of changes and limitations.
Business · International Baccalaureate · IB
Read guide -
Practice questions
IB DP Business Management: Break-even analysis – Practice Questions
Original IB DP Business Management practice questions on section 5.5 Break-even analysis, with worked answers and examiner insights.
Business · International Baccalaureate · IB
Try questions -
Revision notes
IB DP Business Management: Break-even analysis – Revision Notes
Condensed IB DP Business Management revision notes for section 5.5 Break-even analysis: formulas, chart steps, quick self-test and common mistakes.
Business · International Baccalaureate · IB
Revise topic
Related articles
-
teaching
A Level tuition in Dubai: Cambridge or Pearson Edexcel International A Level?
Schools in Dubai and Abu Dhabi teach either Cambridge International AS & A Level or Pearson Edexcel International A Level. How the two are structured, why it matters for tuition, and how online classes from Lahore work.
9 October 2026
-
curriculum guides
Choosing subjects at IGCSE and A Level
How subject choices at 14 and 16 affect university options later, and how to keep pathways open without overloading a timetable.
28 July 2026
Studying this with a teacher
Working through Business IB?
This page is free and stays free. If you would rather be taught it, Marlbridge runs Business classes one-to-one, online in your own time zone. The first trial class is free. WhatsApp replies within an hour (8am–11pm Pakistan time, every day); email the same day.
IB Business teachers at Marlbridge

