
Revision Notes
IB DP Business Management: Break-even analysis – Revision Notes
Condensed IB DP Business Management revision notes for section 5.5 Break-even analysis: formulas, chart steps, quick self-test and common mistakes.
- Subject
- Business
- Level
- IB
- Topic
- Unit 5: Operations management
- Author
- Marlbridge Academic Team
- Updated
- Reviewed by
- Salman Ahmad (what this means)
Aligned to International Baccalaureate IB Diploma Programme Business (DP Business Management), First assessment 2024. Official specification .
Syllabus page (what it covers and how it is assessed): IB Diploma Programme Business.
Syllabus points this page covers
DP Business Management
- 5.5 Break-even analysis
Found an error? Report a correction.
Need help with this topic? Request a free trial class for IB Diploma Programme Business (DP Business Management).
These notes condense section 5.5 (Break-even analysis) of the IB Business management guide, first assessment 2024, for SL and HL. The section is in Unit 5 (Operations management) and none of it is marked HL only. For full explanations and worked examples, read the 5.5 study guide. When you want to test recall, use the 5.5 practice questions.
Cost types are covered in the 3.3 costs and revenues revision notes. Also see the IB Business Management hub, the printable checklist and the free diagnostics.
The guide does not supply formulas here, so the formulas below are the usual textbook forms. All examples use an invented business, Hobsfield Bakery, with money in dollars.
Base case used in these notes
- Price per loaf box: 25
- Variable cost per box: 10
- Fixed costs per month: 9,000
- Output and sales: 800 boxes per month
Definitions
| Term | Meaning |
|---|---|
| Contribution per unit | Price minus variable cost per unit |
| Total contribution | Contribution per unit multiplied by units sold; also total revenue minus total variable costs |
| Break-even quantity (point) | Output where total revenue equals total costs, so profit is zero |
| Profit or loss | Total revenue minus total costs |
| Margin of safety | Actual (or planned) output minus break-even quantity |
| Target profit output | Output needed to reach a chosen profit |
| Target profit | Profit made at a chosen output |
| Target price | Price needed to reach a chosen profit at a given output |
Formulas
| Item | Standard form | Hobsfield Bakery |
|---|---|---|
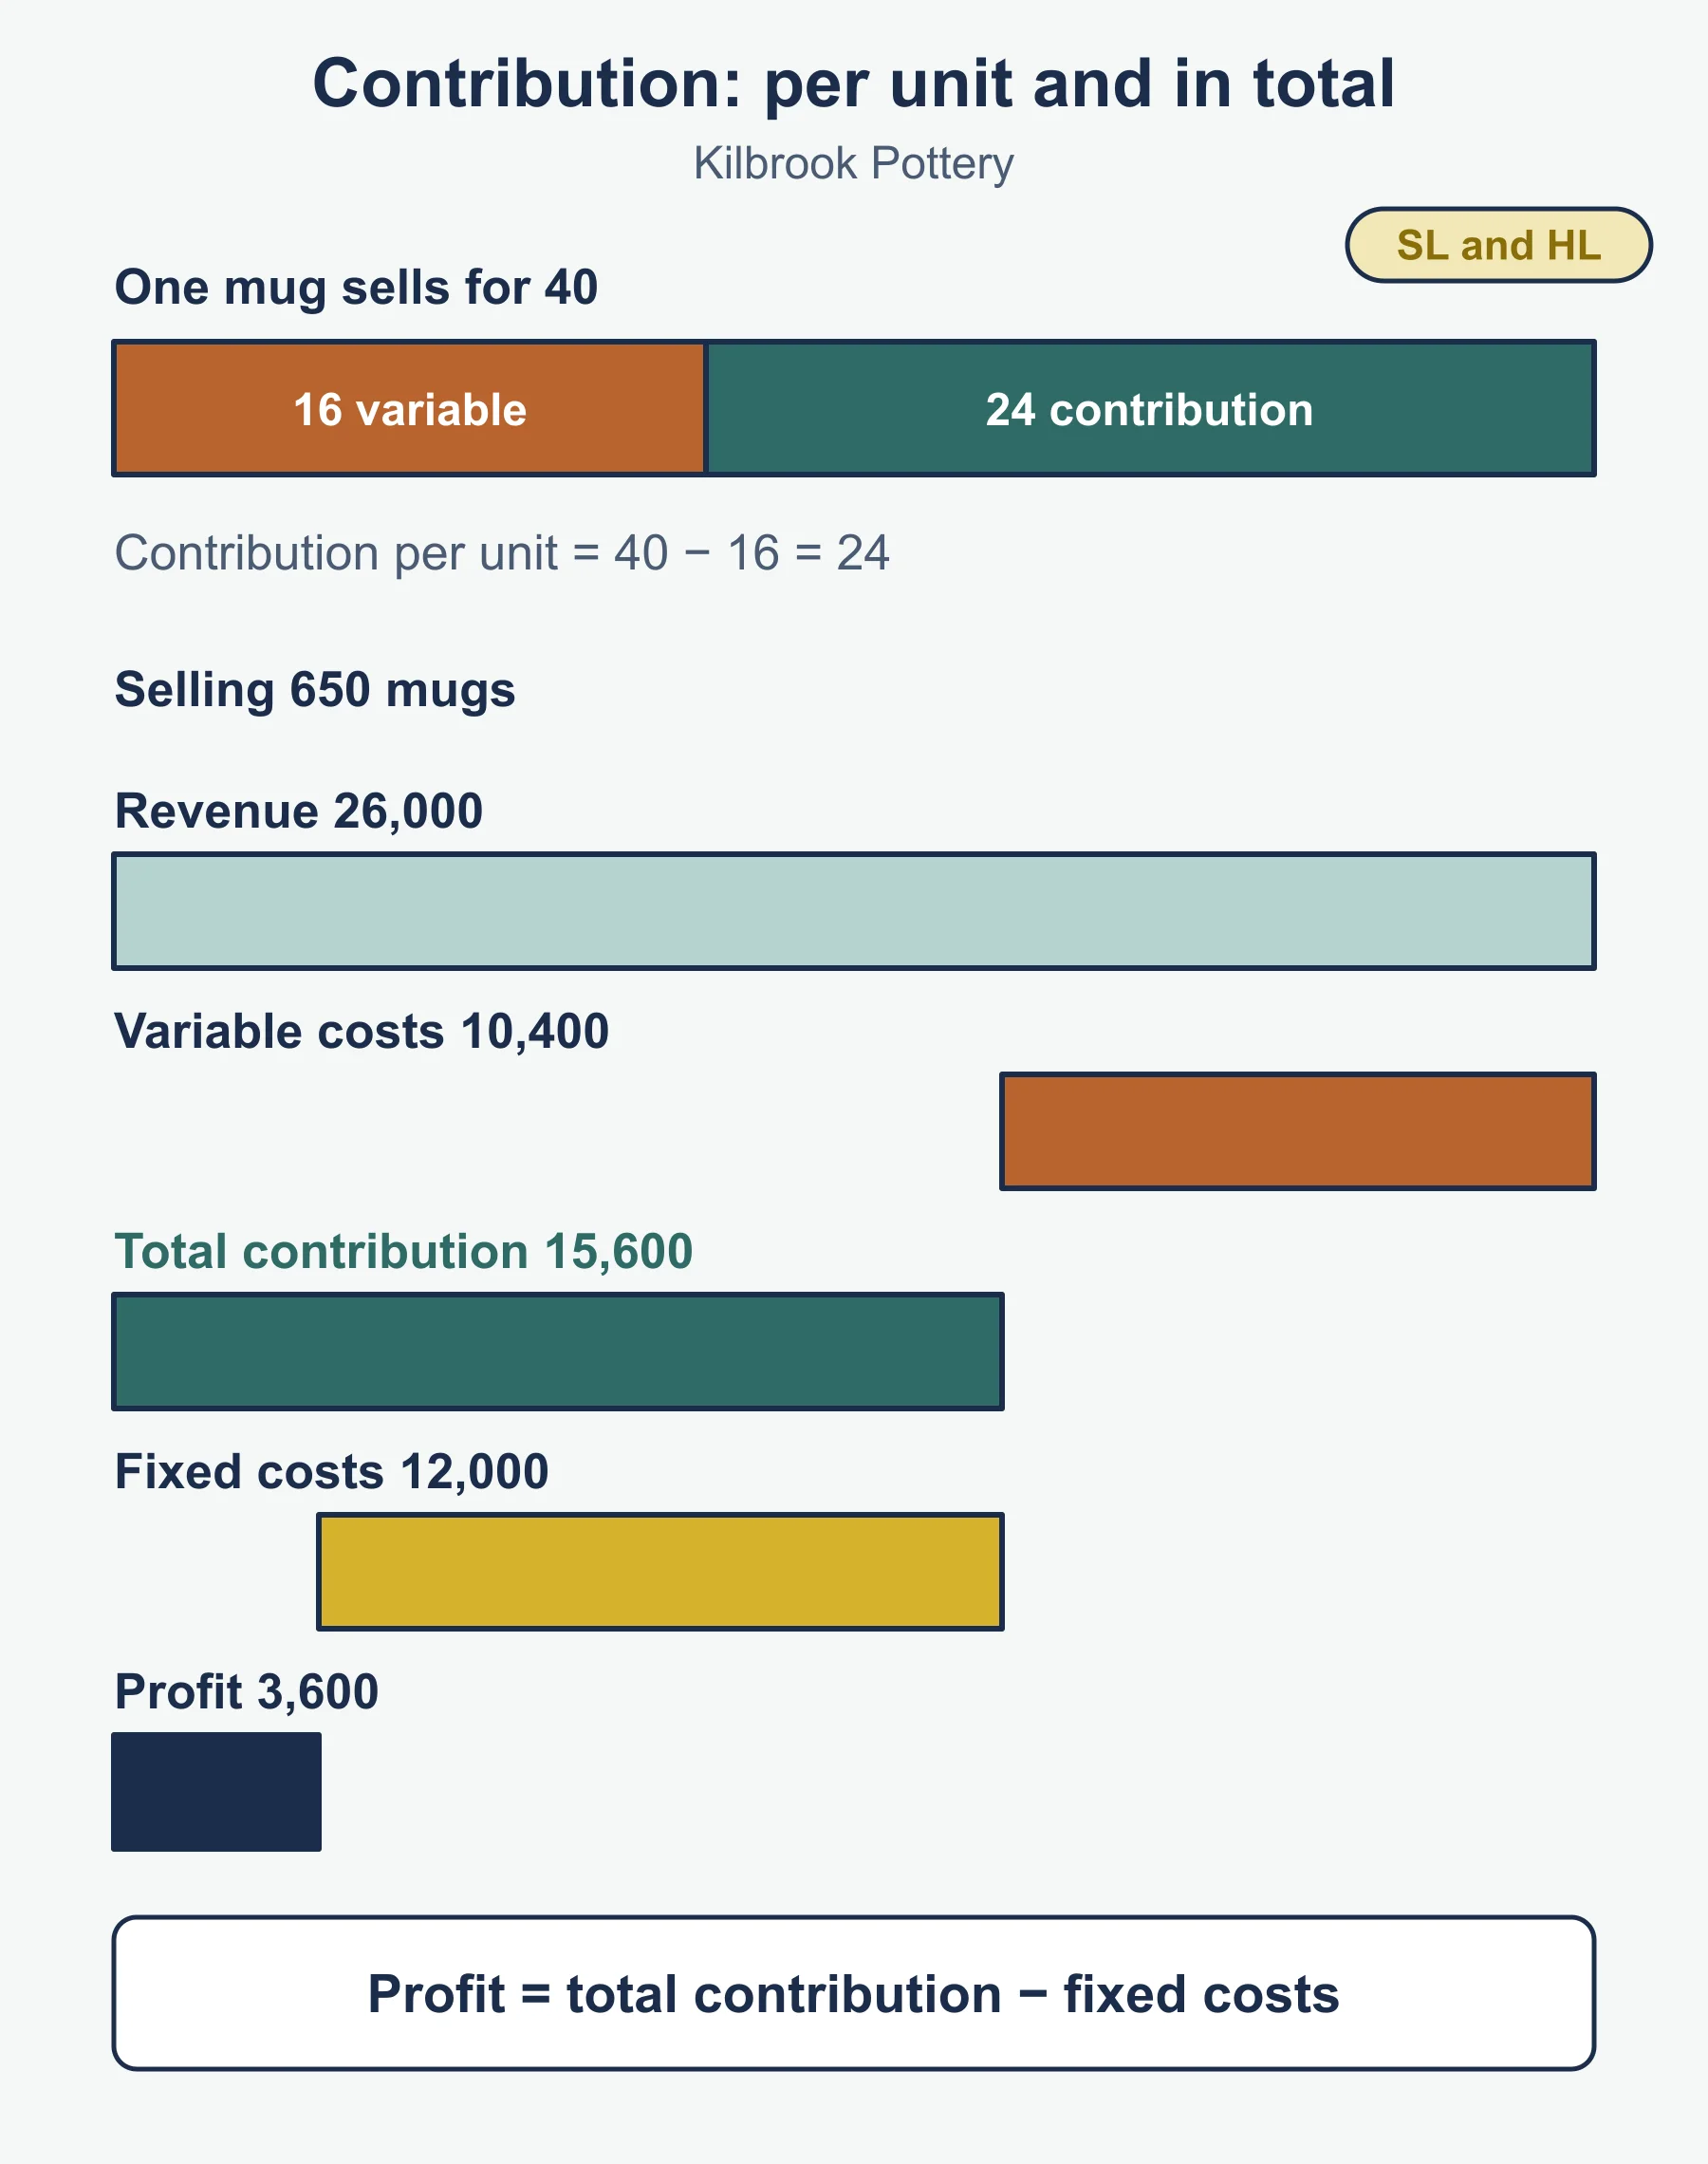
| Contribution per unit | price − variable cost per unit | 25 − 10 = 15 |
| Total contribution | contribution per unit × output | 800 × 15 = 12,000 |
| Break-even quantity | fixed costs / contribution per unit | 9,000 / 15 = 600 |
| Profit (loss) | total contribution − fixed costs | 12,000 − 9,000 = 3,000 |
| Margin of safety (units) | actual output − break-even quantity | 800 − 600 = 200 |
| Margin of safety (%) | margin of safety / actual output × 100 | 200 / 800 × 100 = 25% |
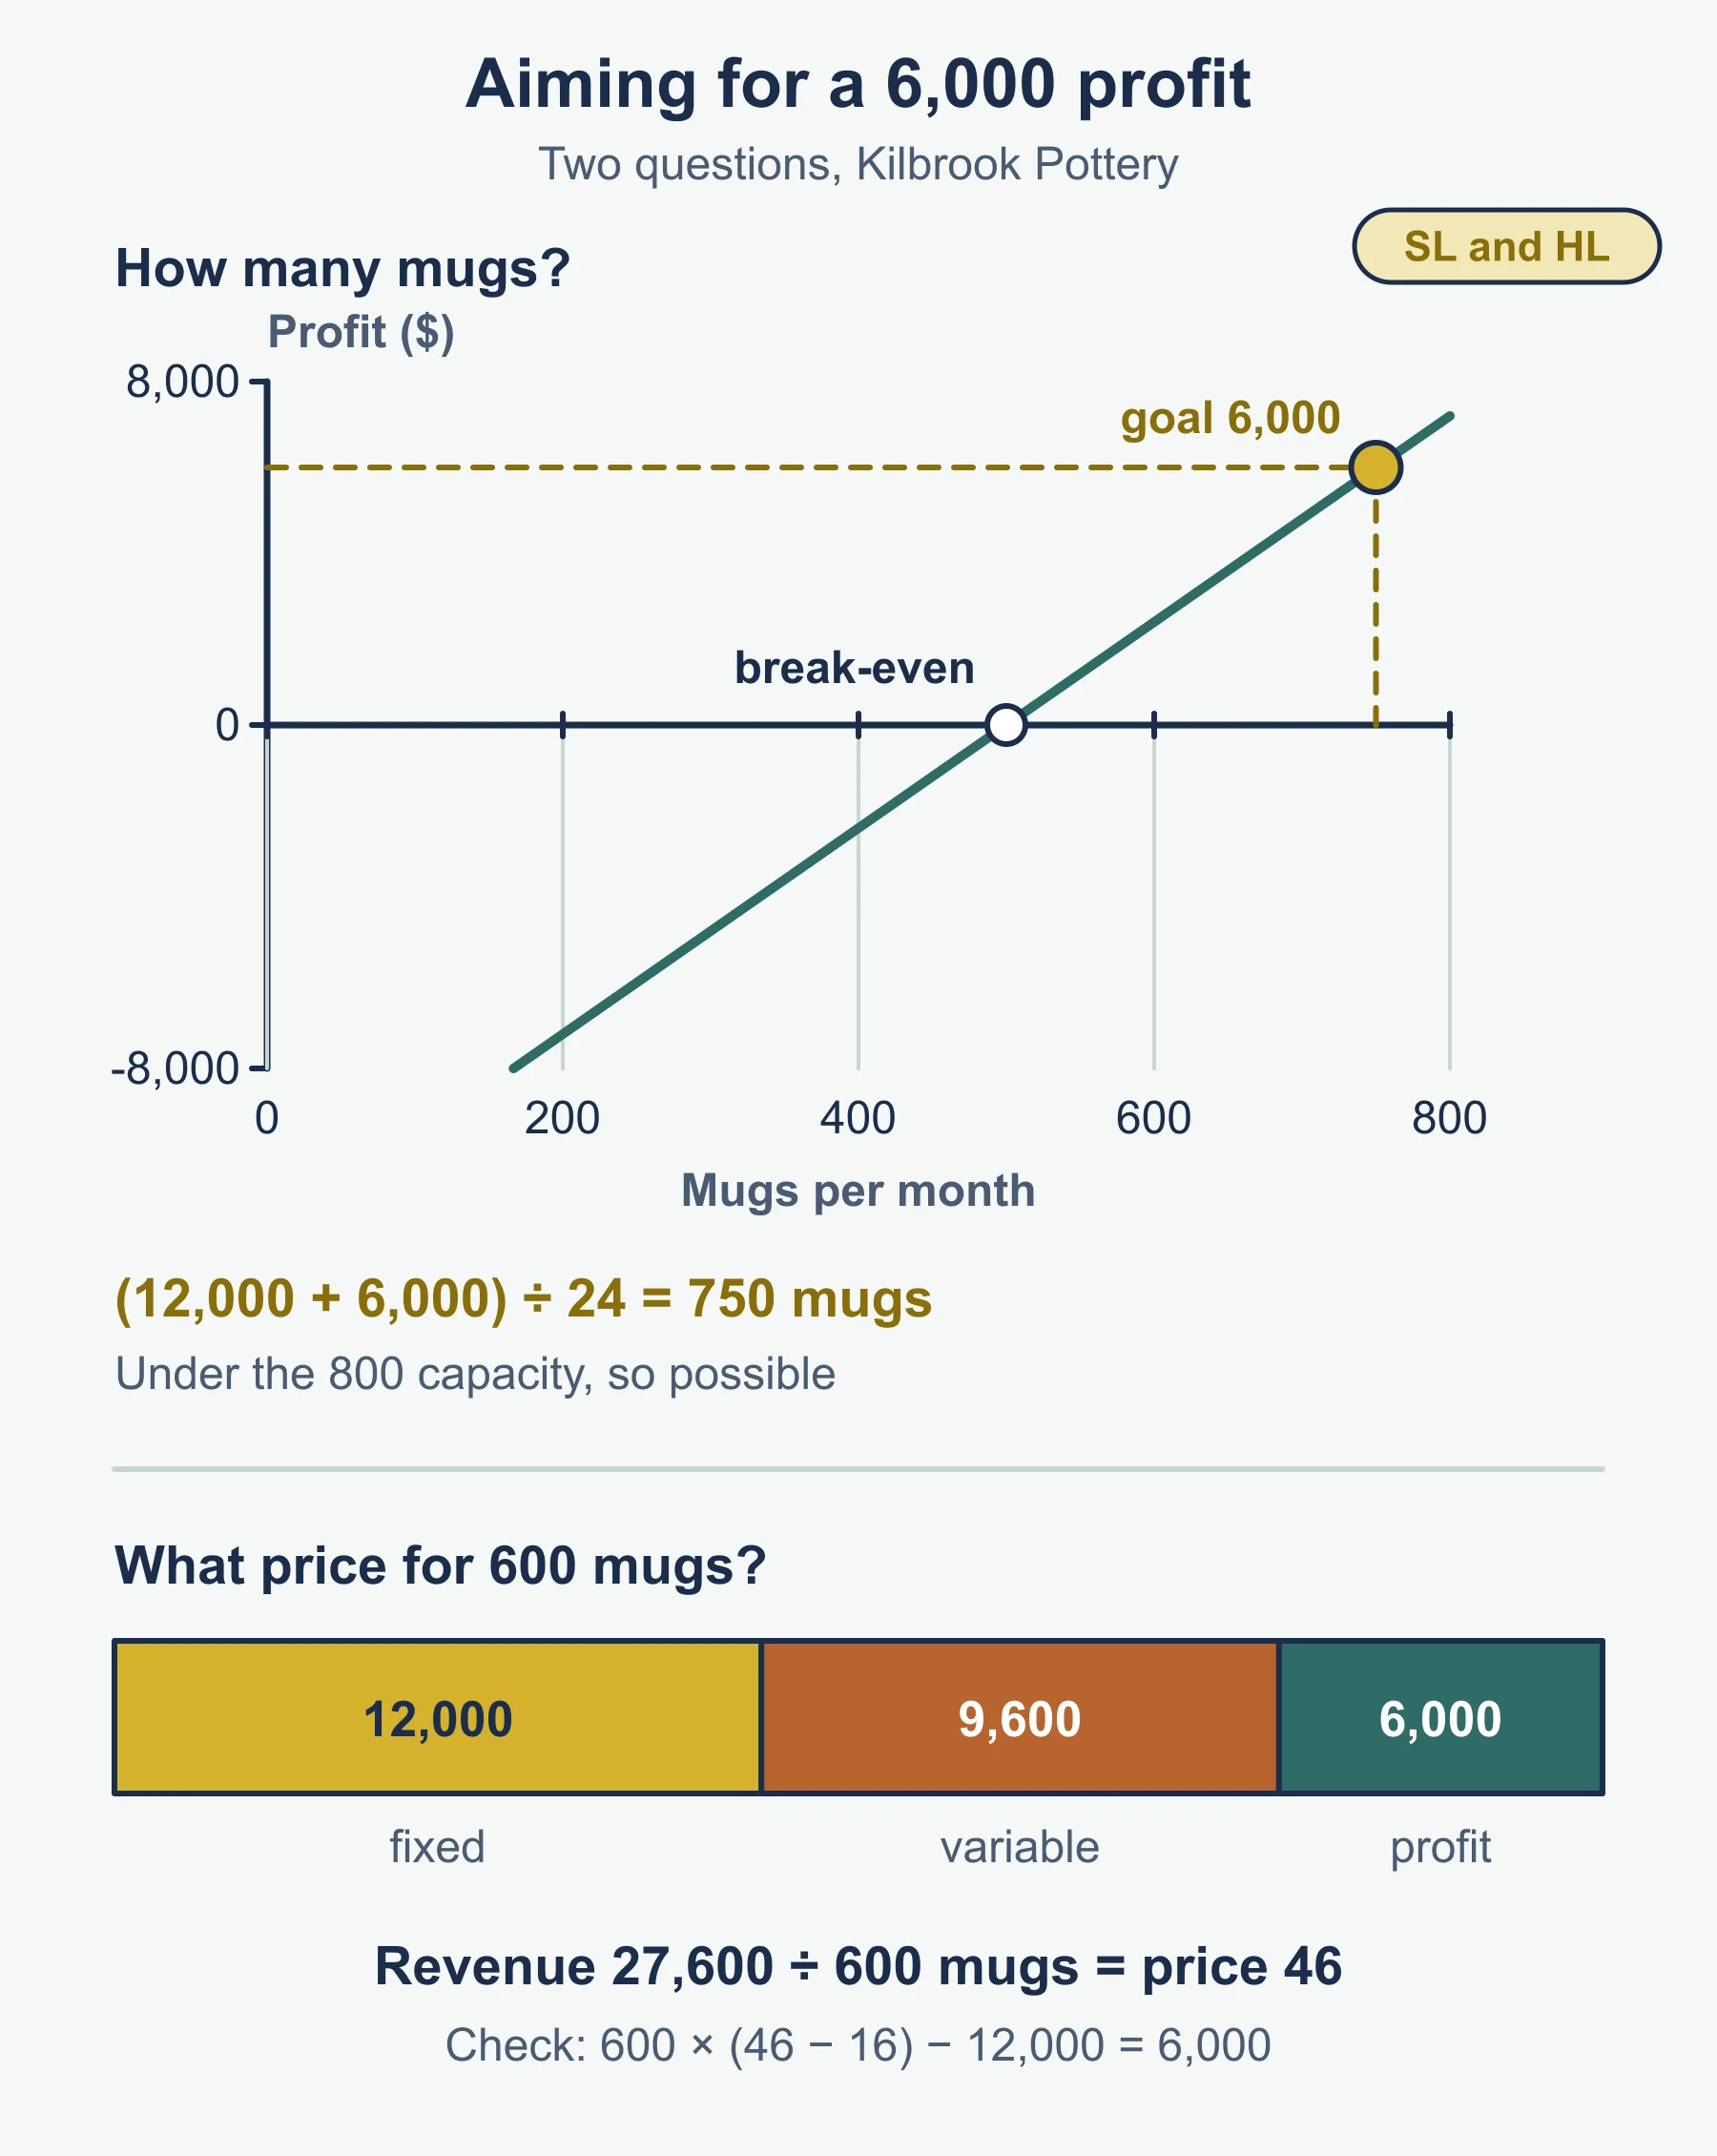
| Target profit output | (fixed costs + target profit) / contribution per unit | (9,000 + 4,500) / 15 = 900 |
| Target price | (fixed costs + variable costs + target profit) / output | (9,000 + 9,000 + 5,400) / 900 = 26 |
For the target price row, the output is 900 boxes, so variable costs are 900 × 10 = 9,000, and the target profit is 5,400.
Method in steps: any break-even question
- Write down price, variable cost per unit, fixed costs and output.
- Find contribution per unit.
- Find what is asked: break-even quantity, profit, margin of safety, target output or target price.
- Round the break-even quantity up to a whole unit if it is not whole.
- Add units and currency. State what the result means for the business in one sentence.
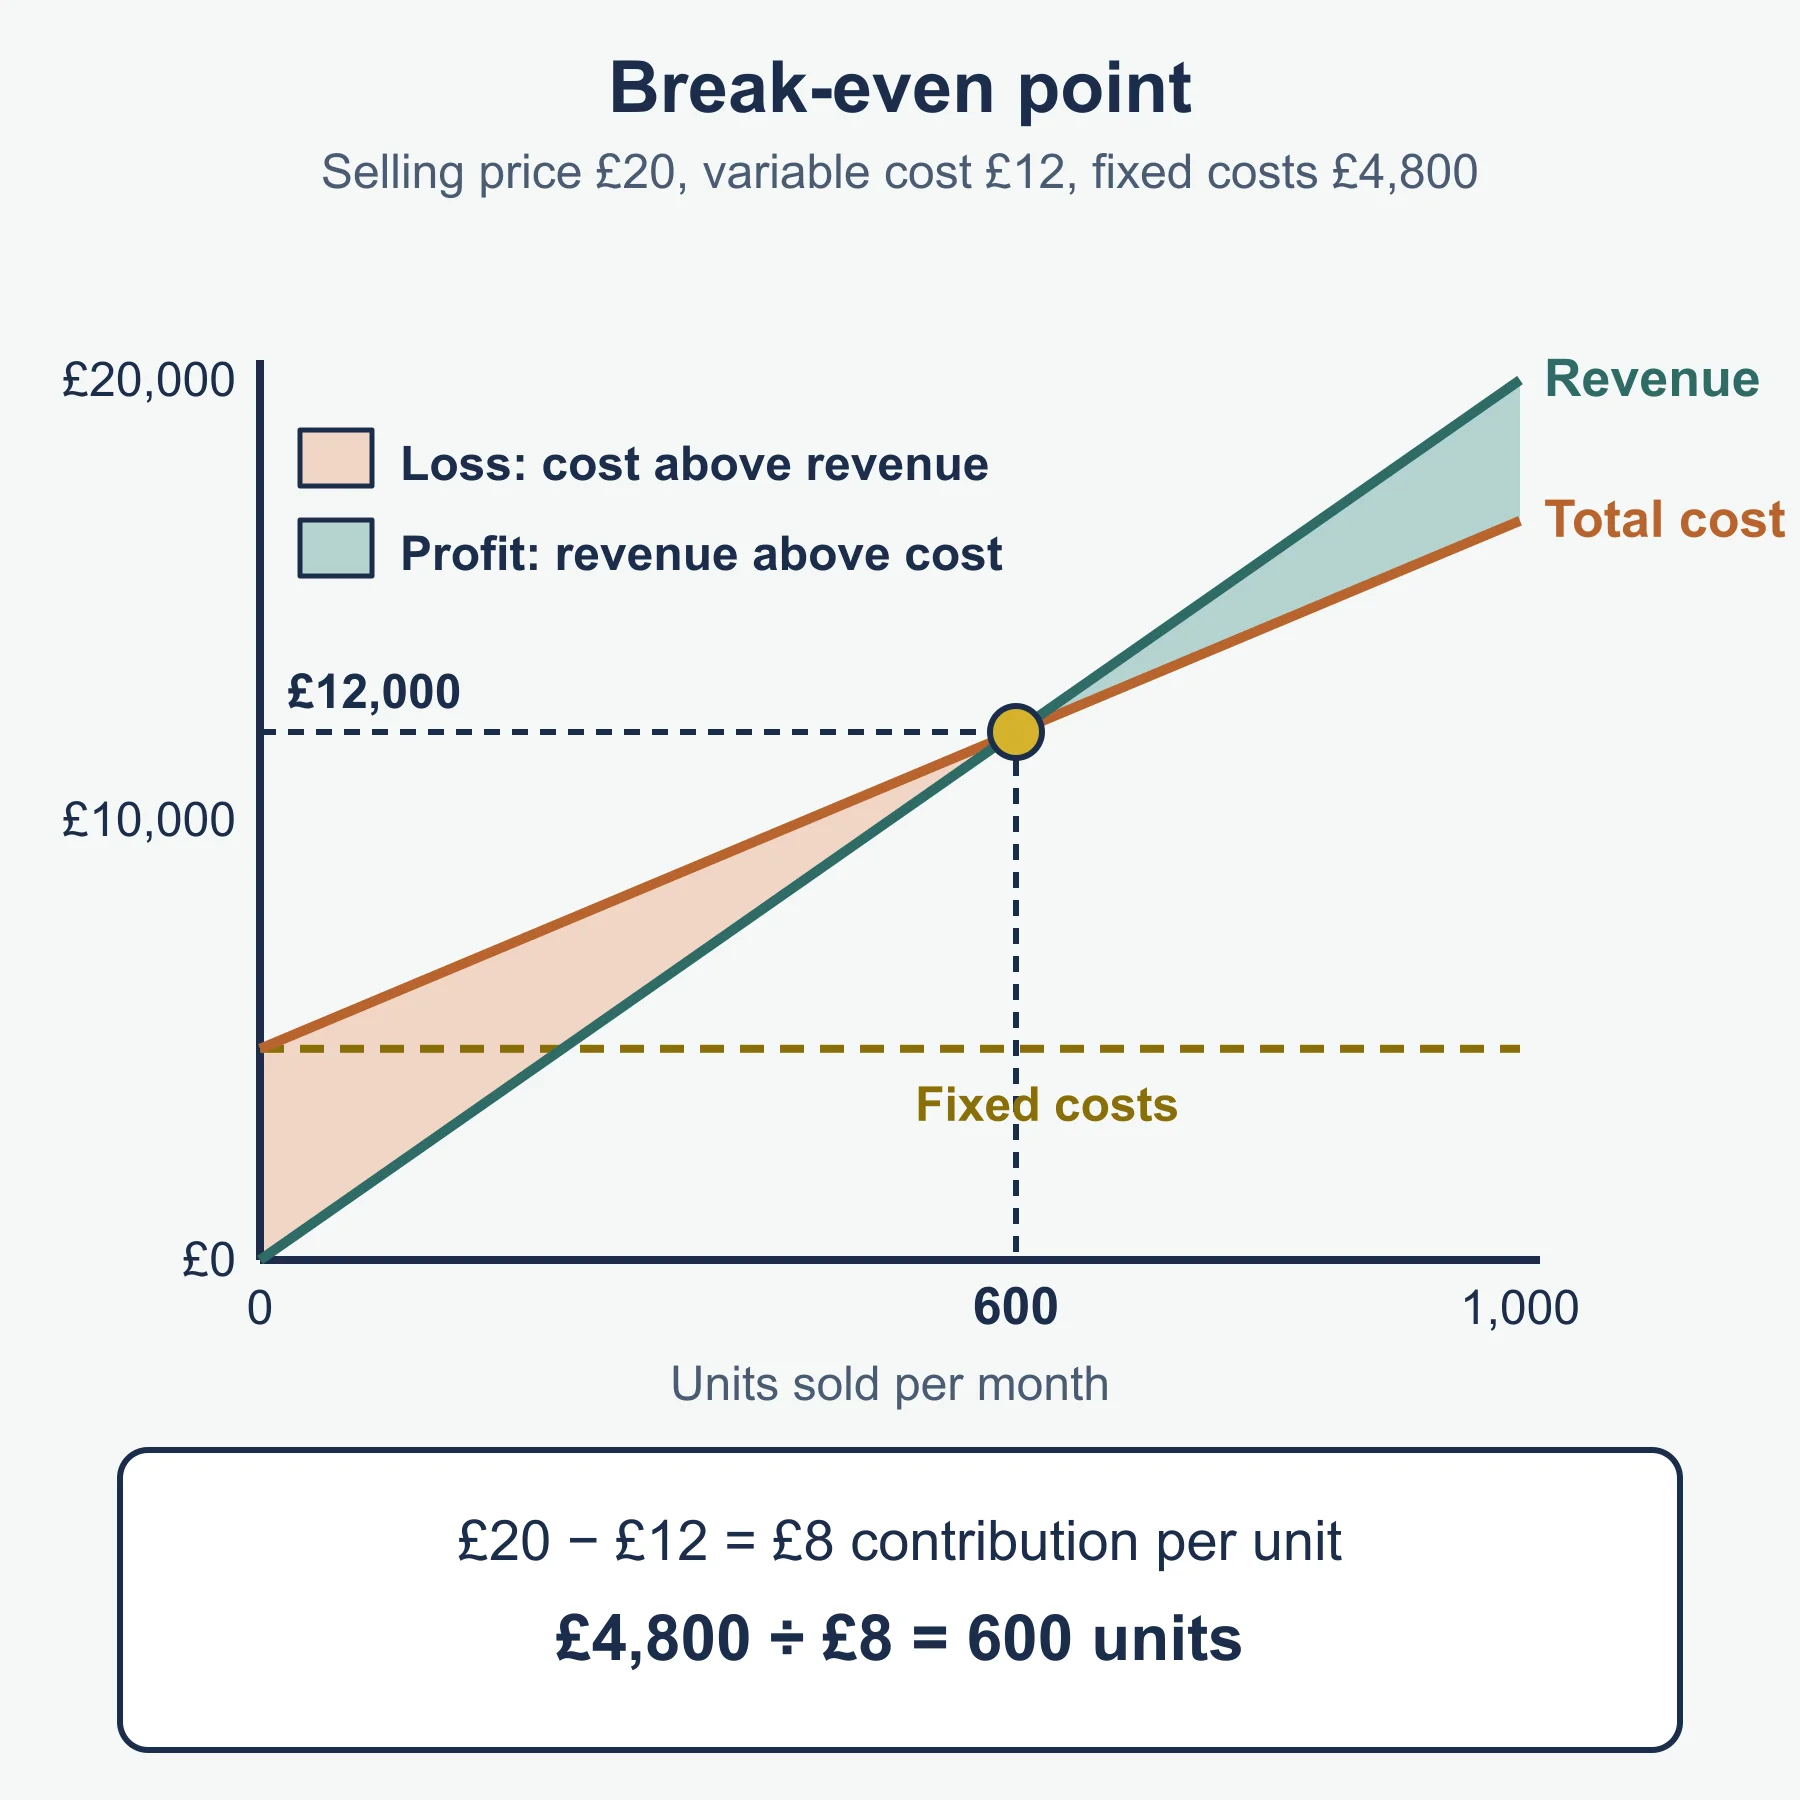
Drawing the chart
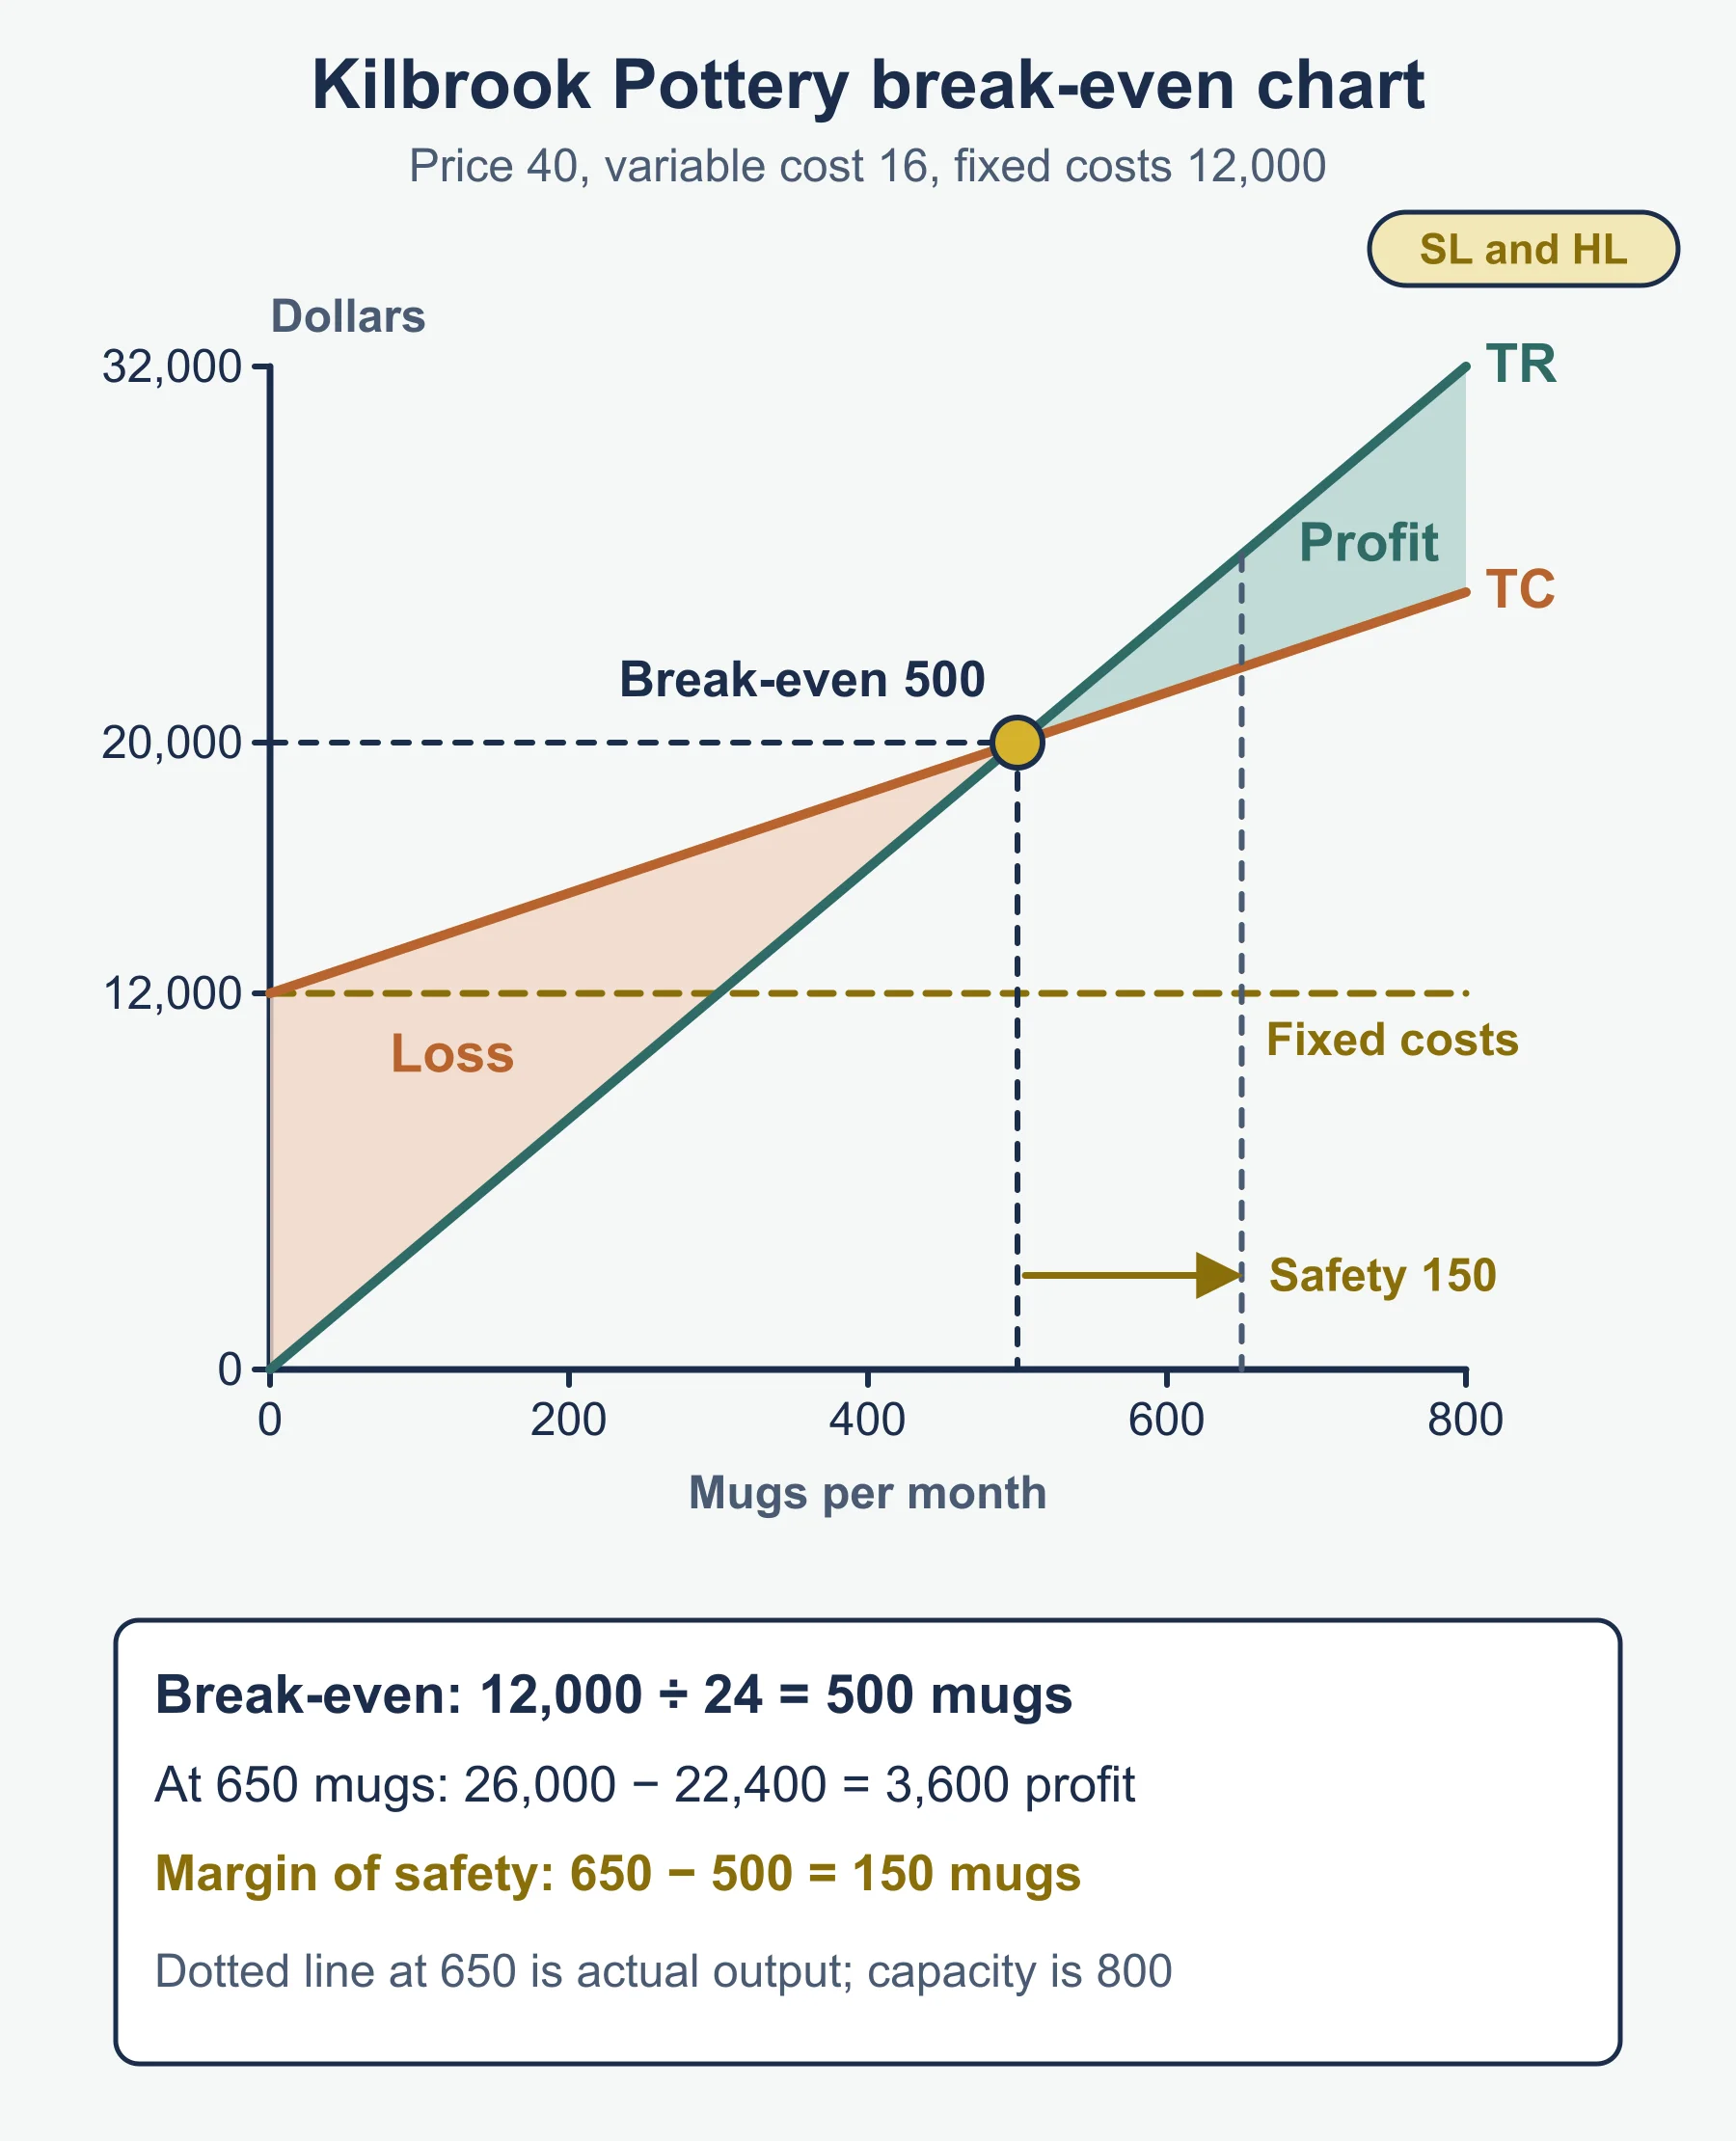
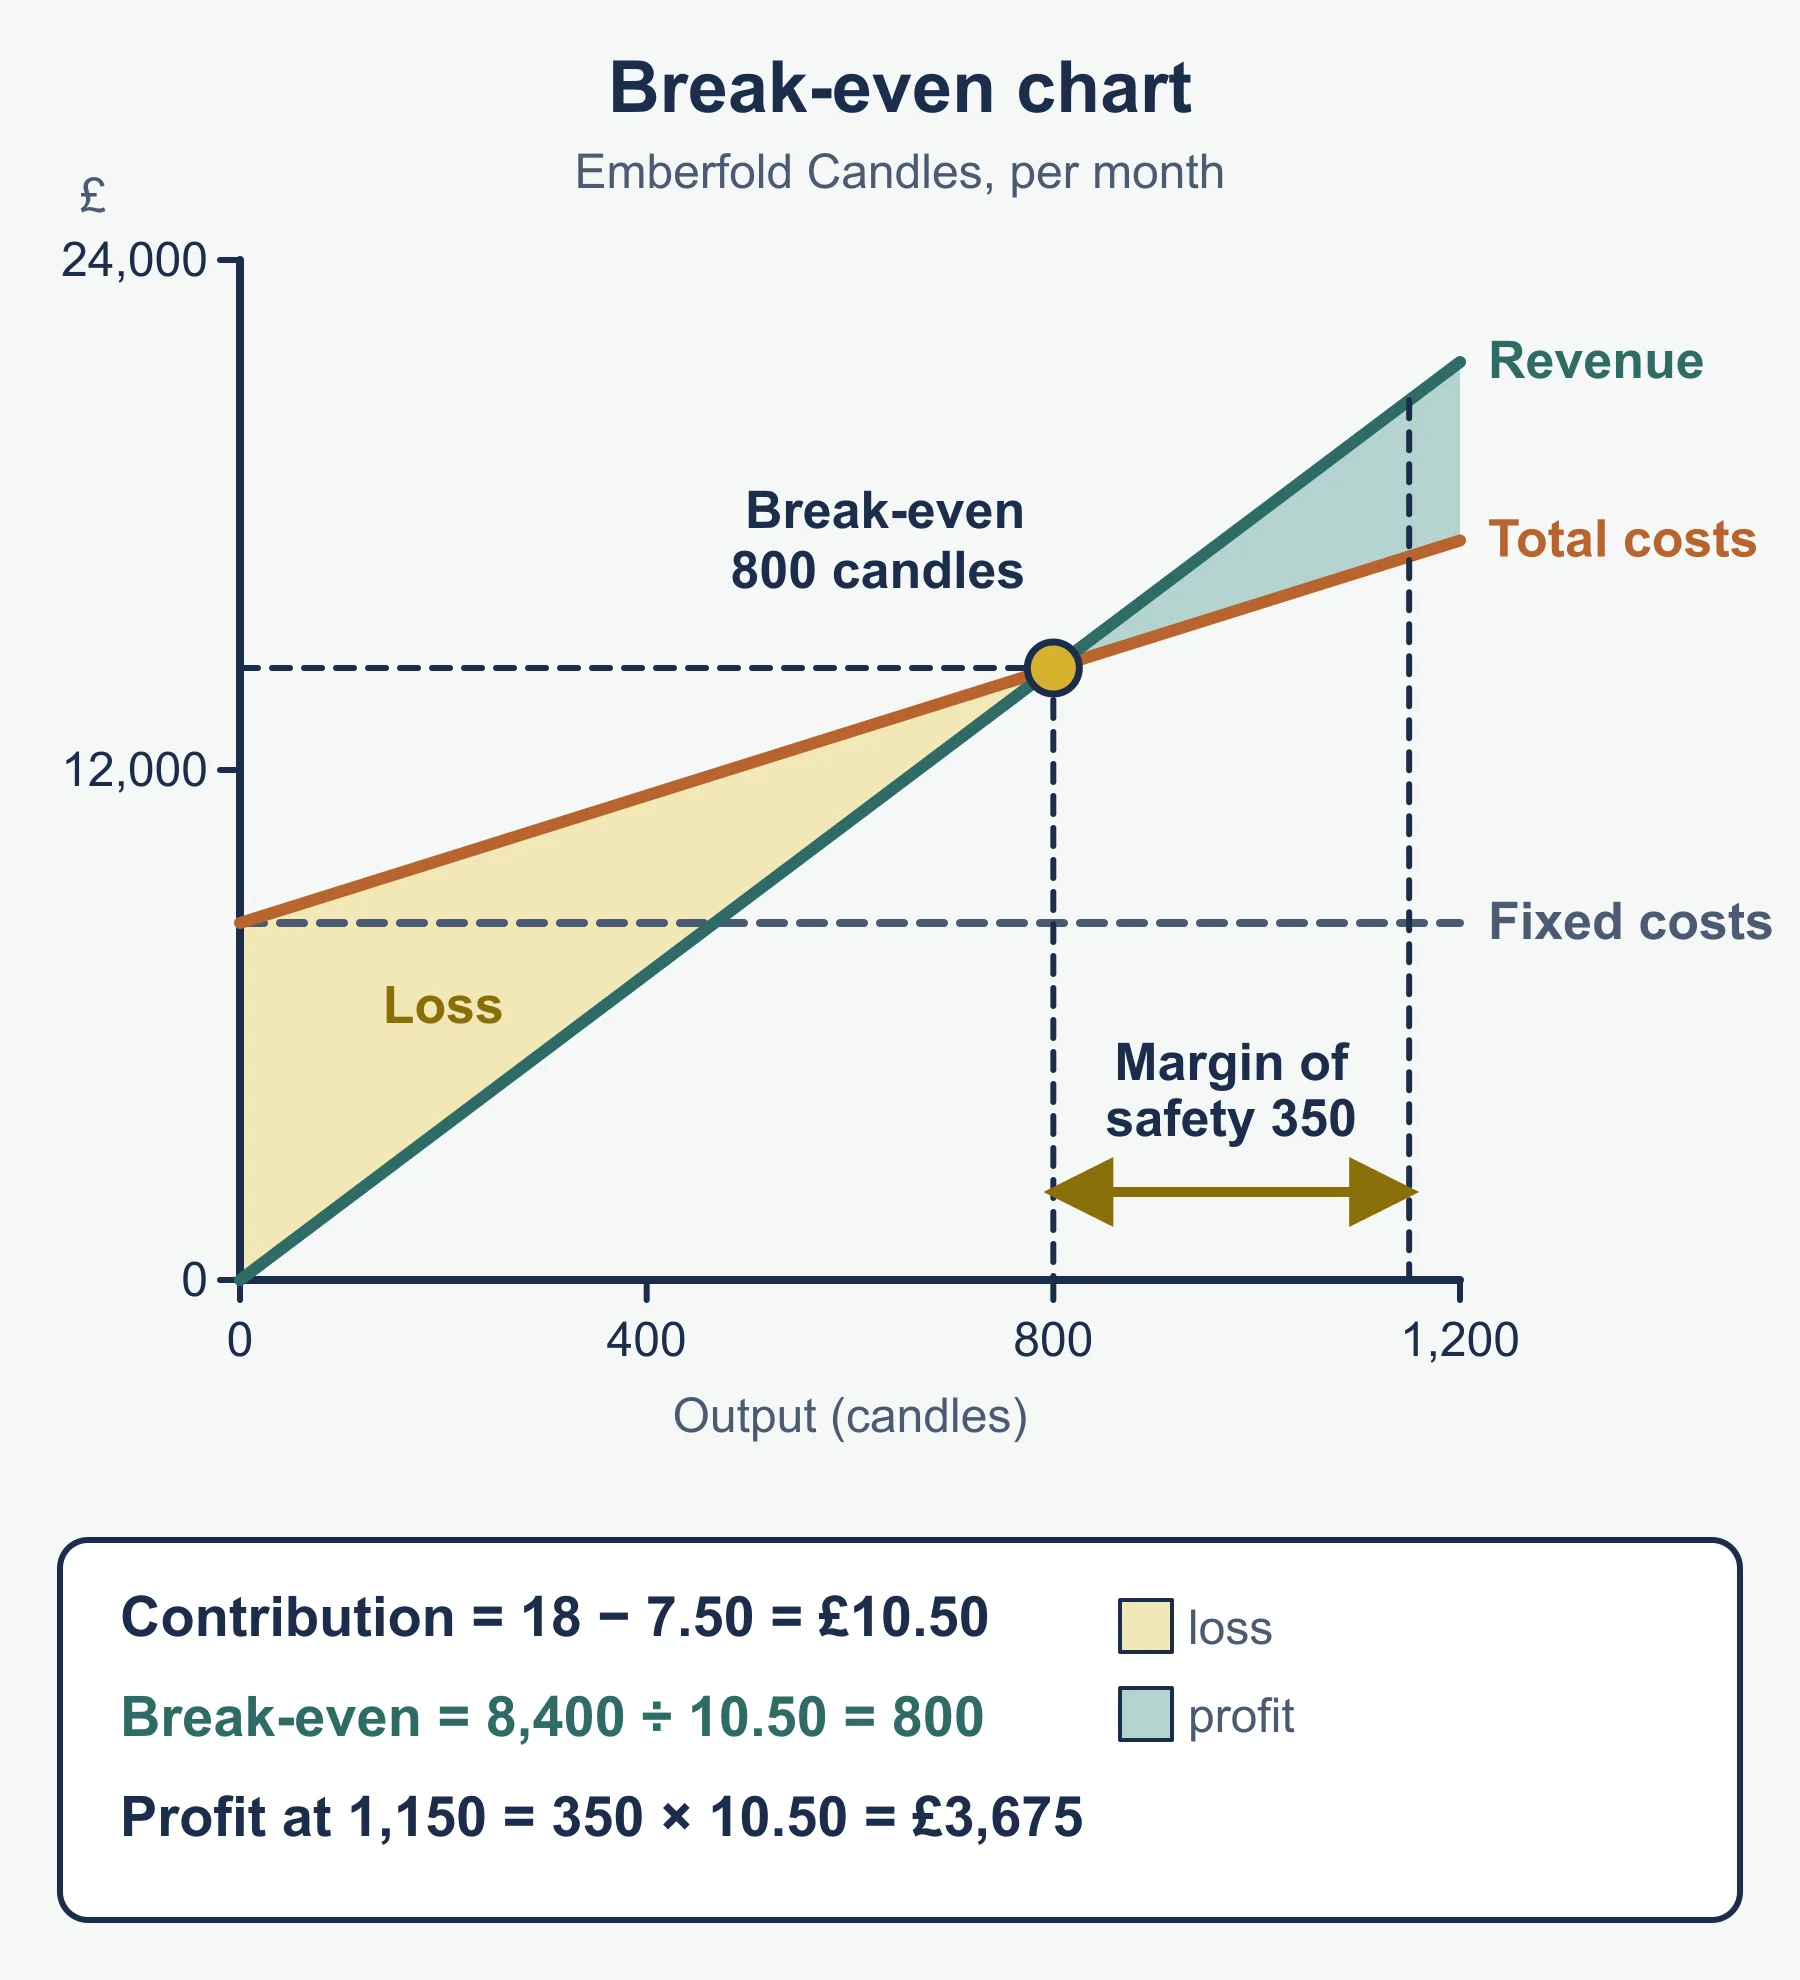
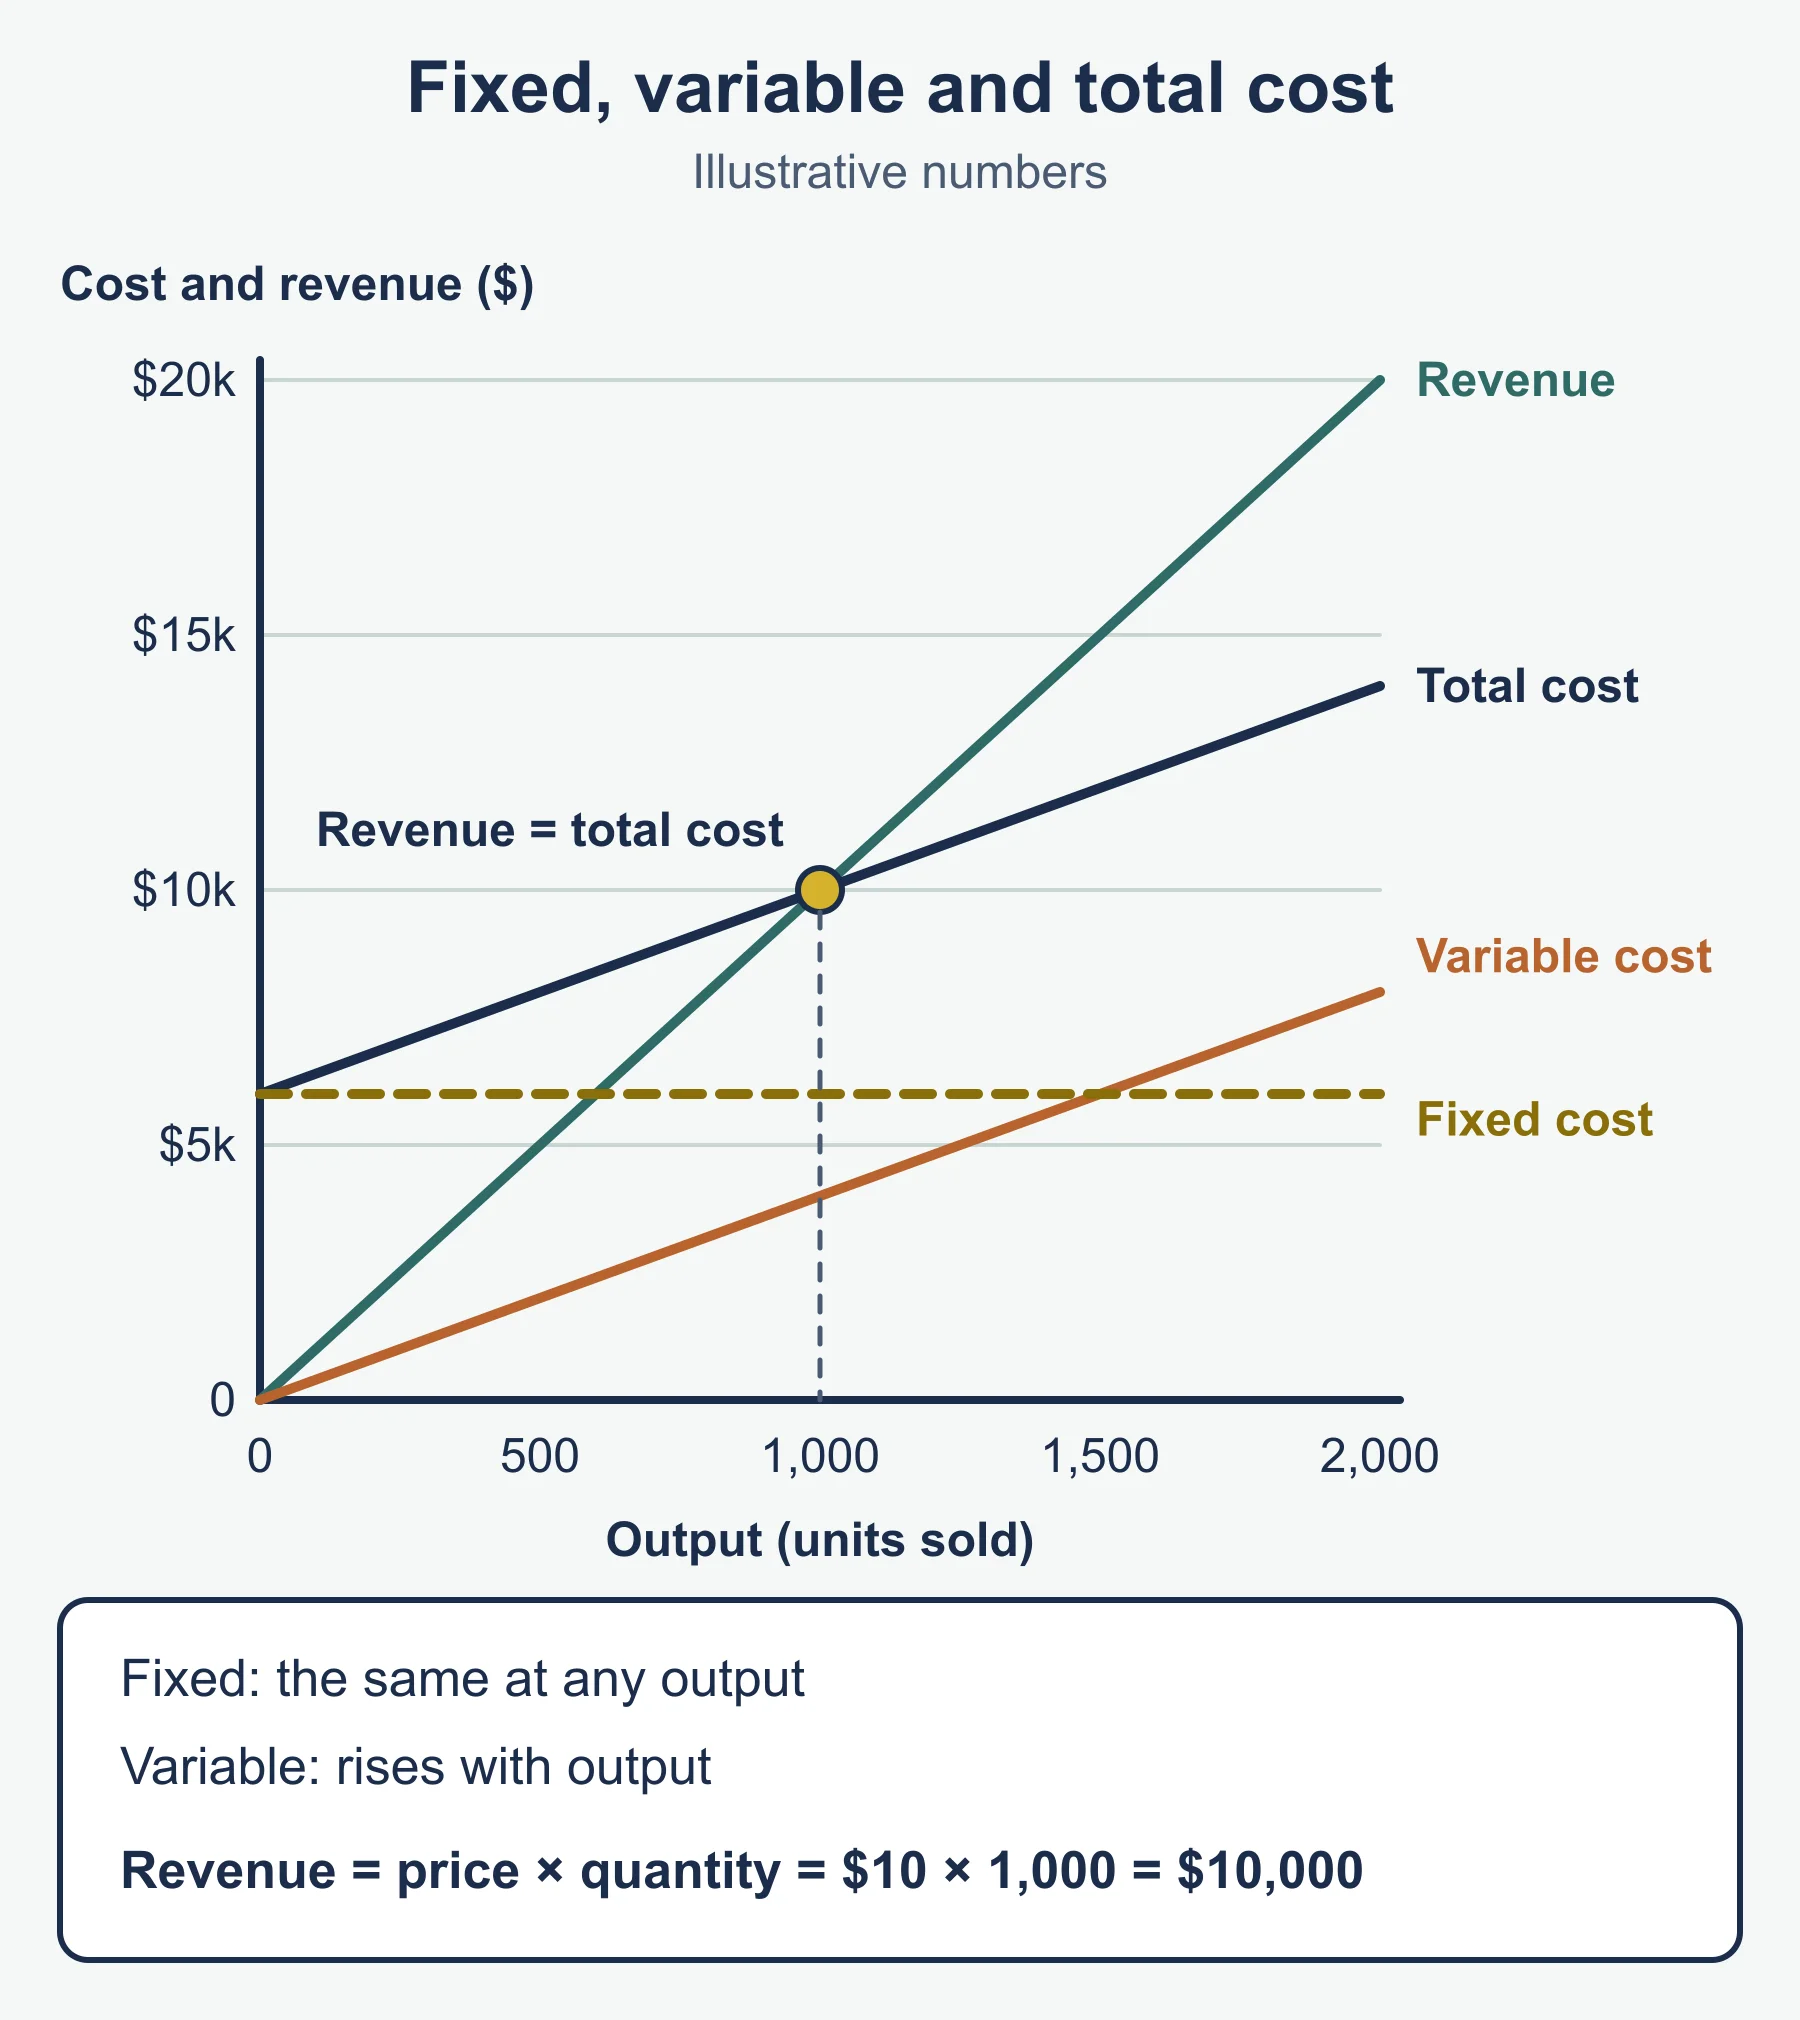
- Axes: output on the horizontal axis, money on the vertical axis.
- Fixed cost line: horizontal.
- Total cost line: begins level with the fixed costs, then climbs as output grows.
- Total revenue line: starts at zero and rises more steeply.
- Break-even point: where total revenue and total cost cross.
- Loss area: left of the crossing, between the lines. Profit area: right of the crossing, between the lines.
- Margin of safety: horizontal gap between break-even output and actual output.
Hobsfield Bakery points to plot: at 0 boxes, total cost 9,000 and revenue 0. At 600 boxes, both are 15,000. At 800 boxes, total cost is 17,000 and revenue is 20,000.
Effects of changes in price or cost
Starting from 800 boxes:
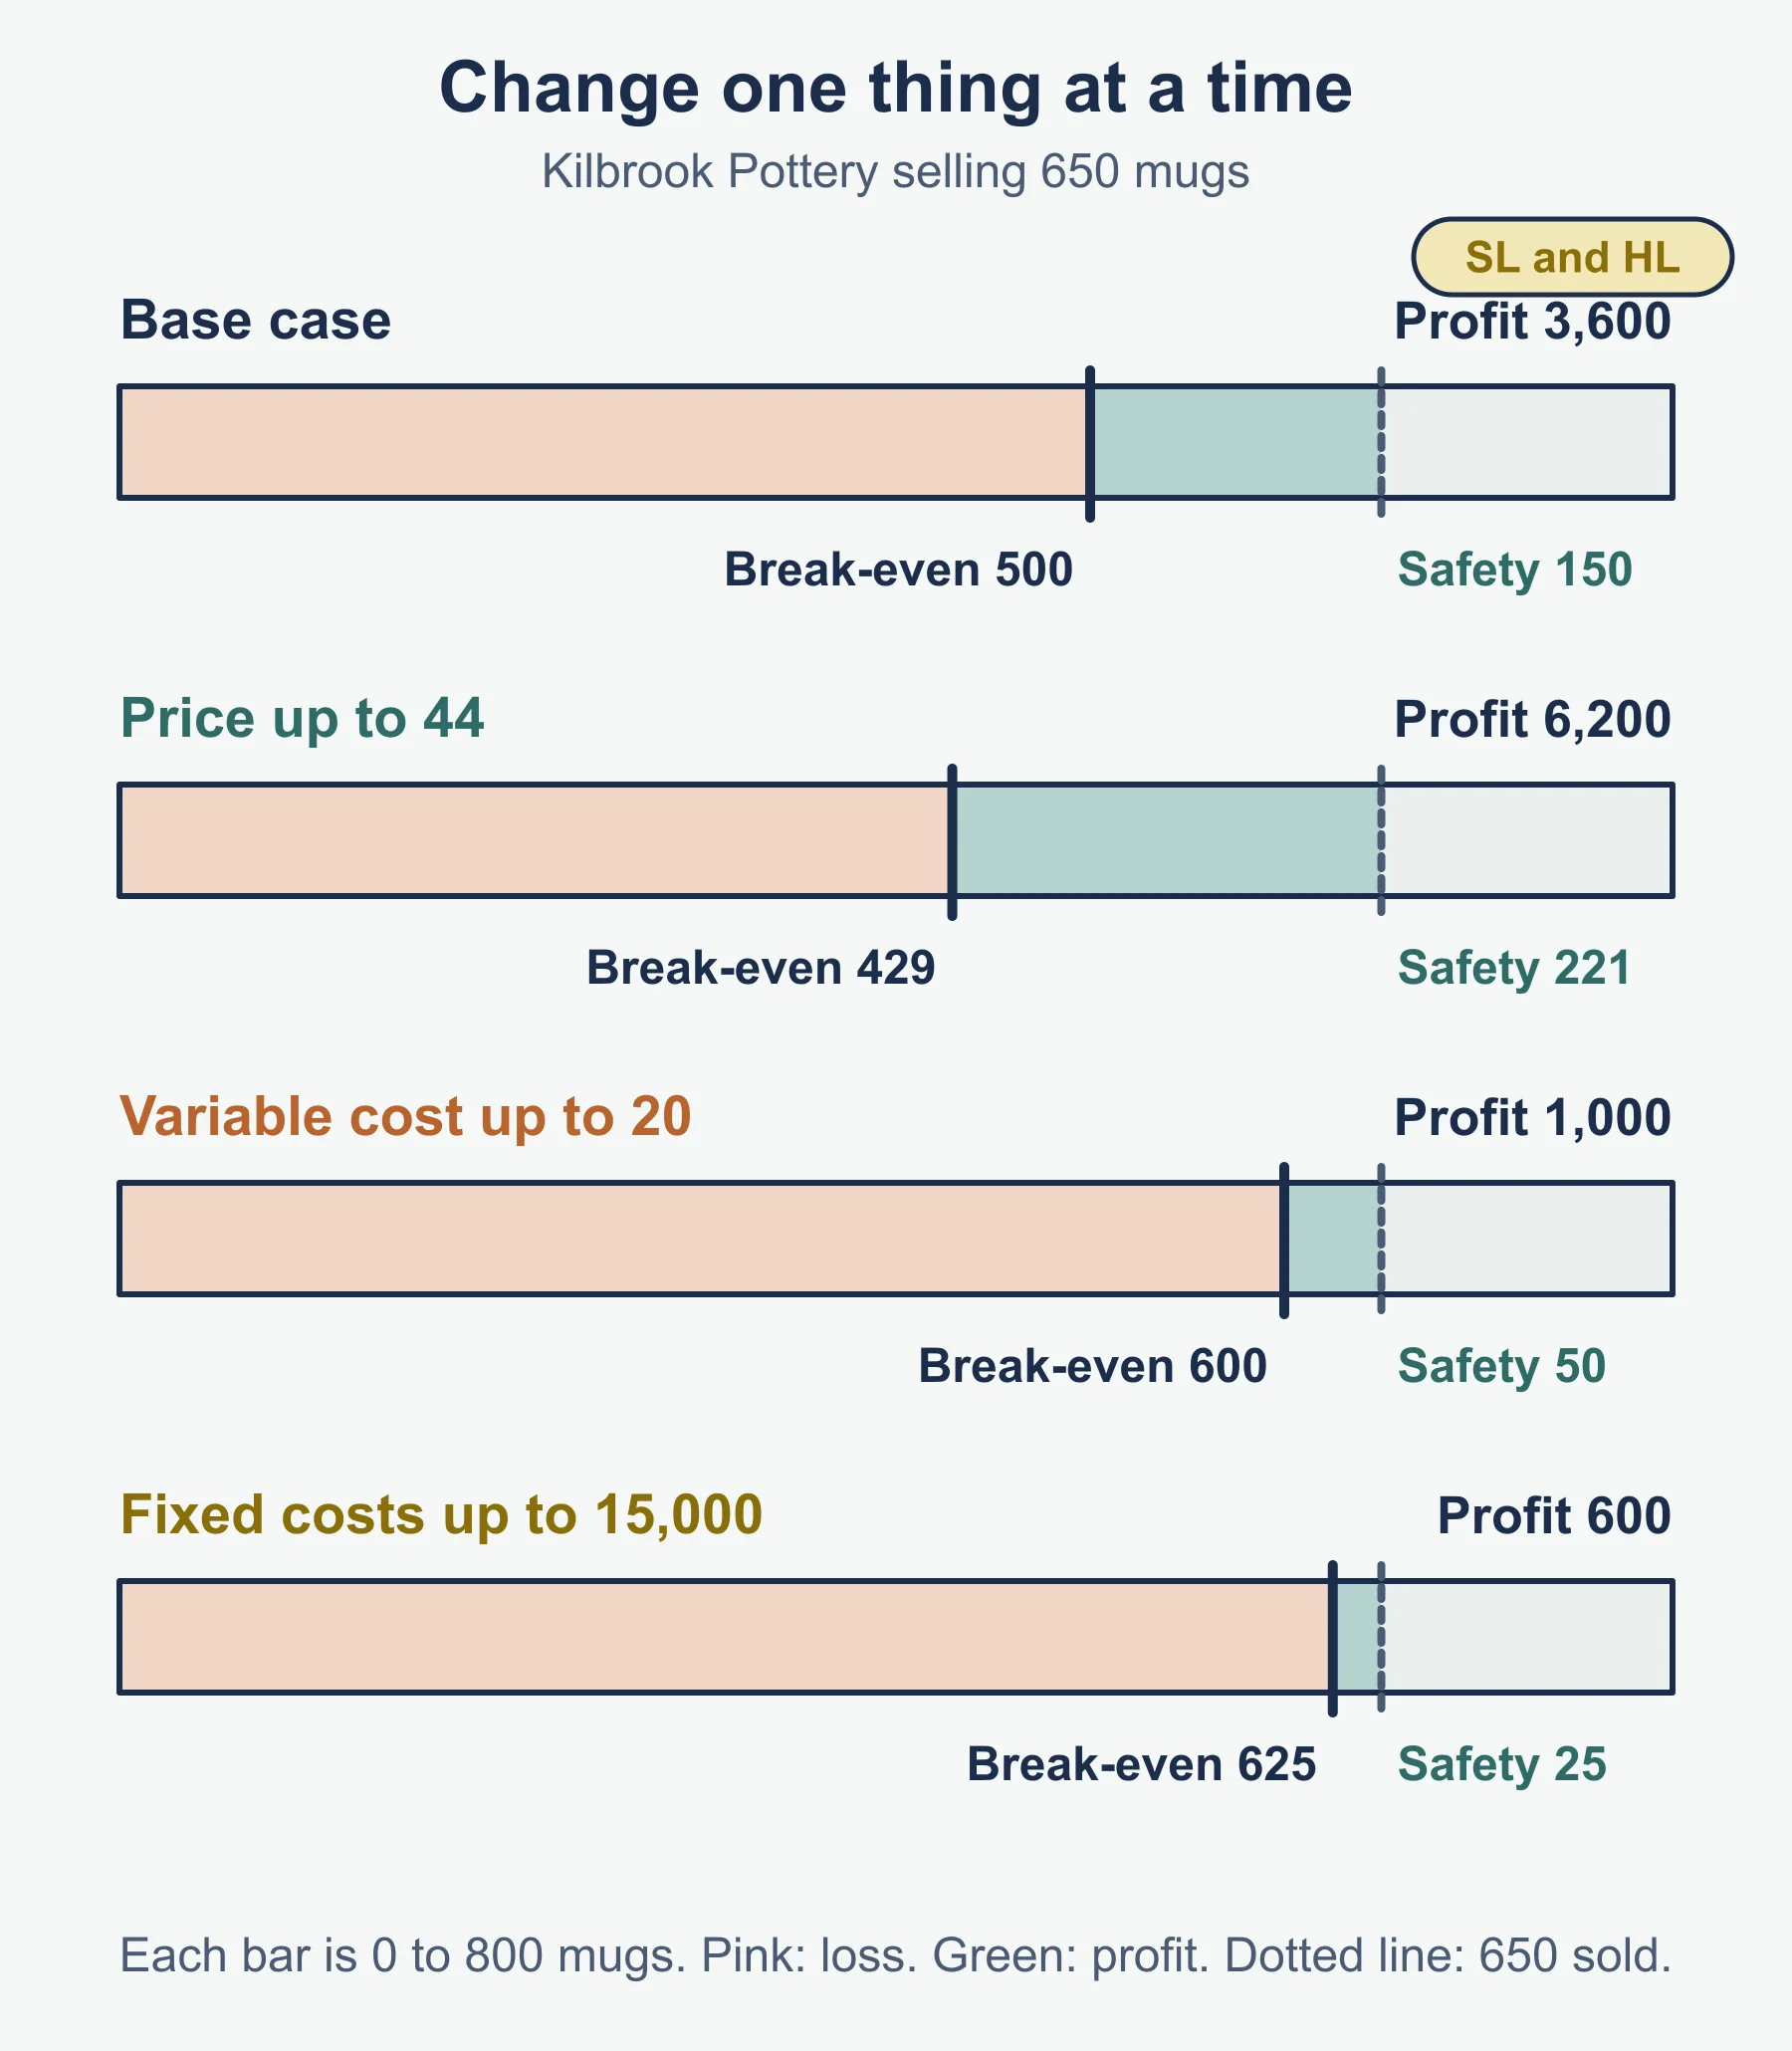
| Change | Break-even quantity | Profit at 800 | Margin of safety |
|---|---|---|---|
| Base case | 600 | 3,000 | 200 |
| Price falls to 23 | 692.3, so 693 | 1,400 | 107 |
| Variable cost rises to 12 | 692.3, so 693 | 1,400 | 107 |
| Fixed costs rise to 10,500 | 700 | 1,500 | 100 |
A price fall and a variable cost rise give the same figures here because each cuts contribution per unit to 13. They look different on the chart.
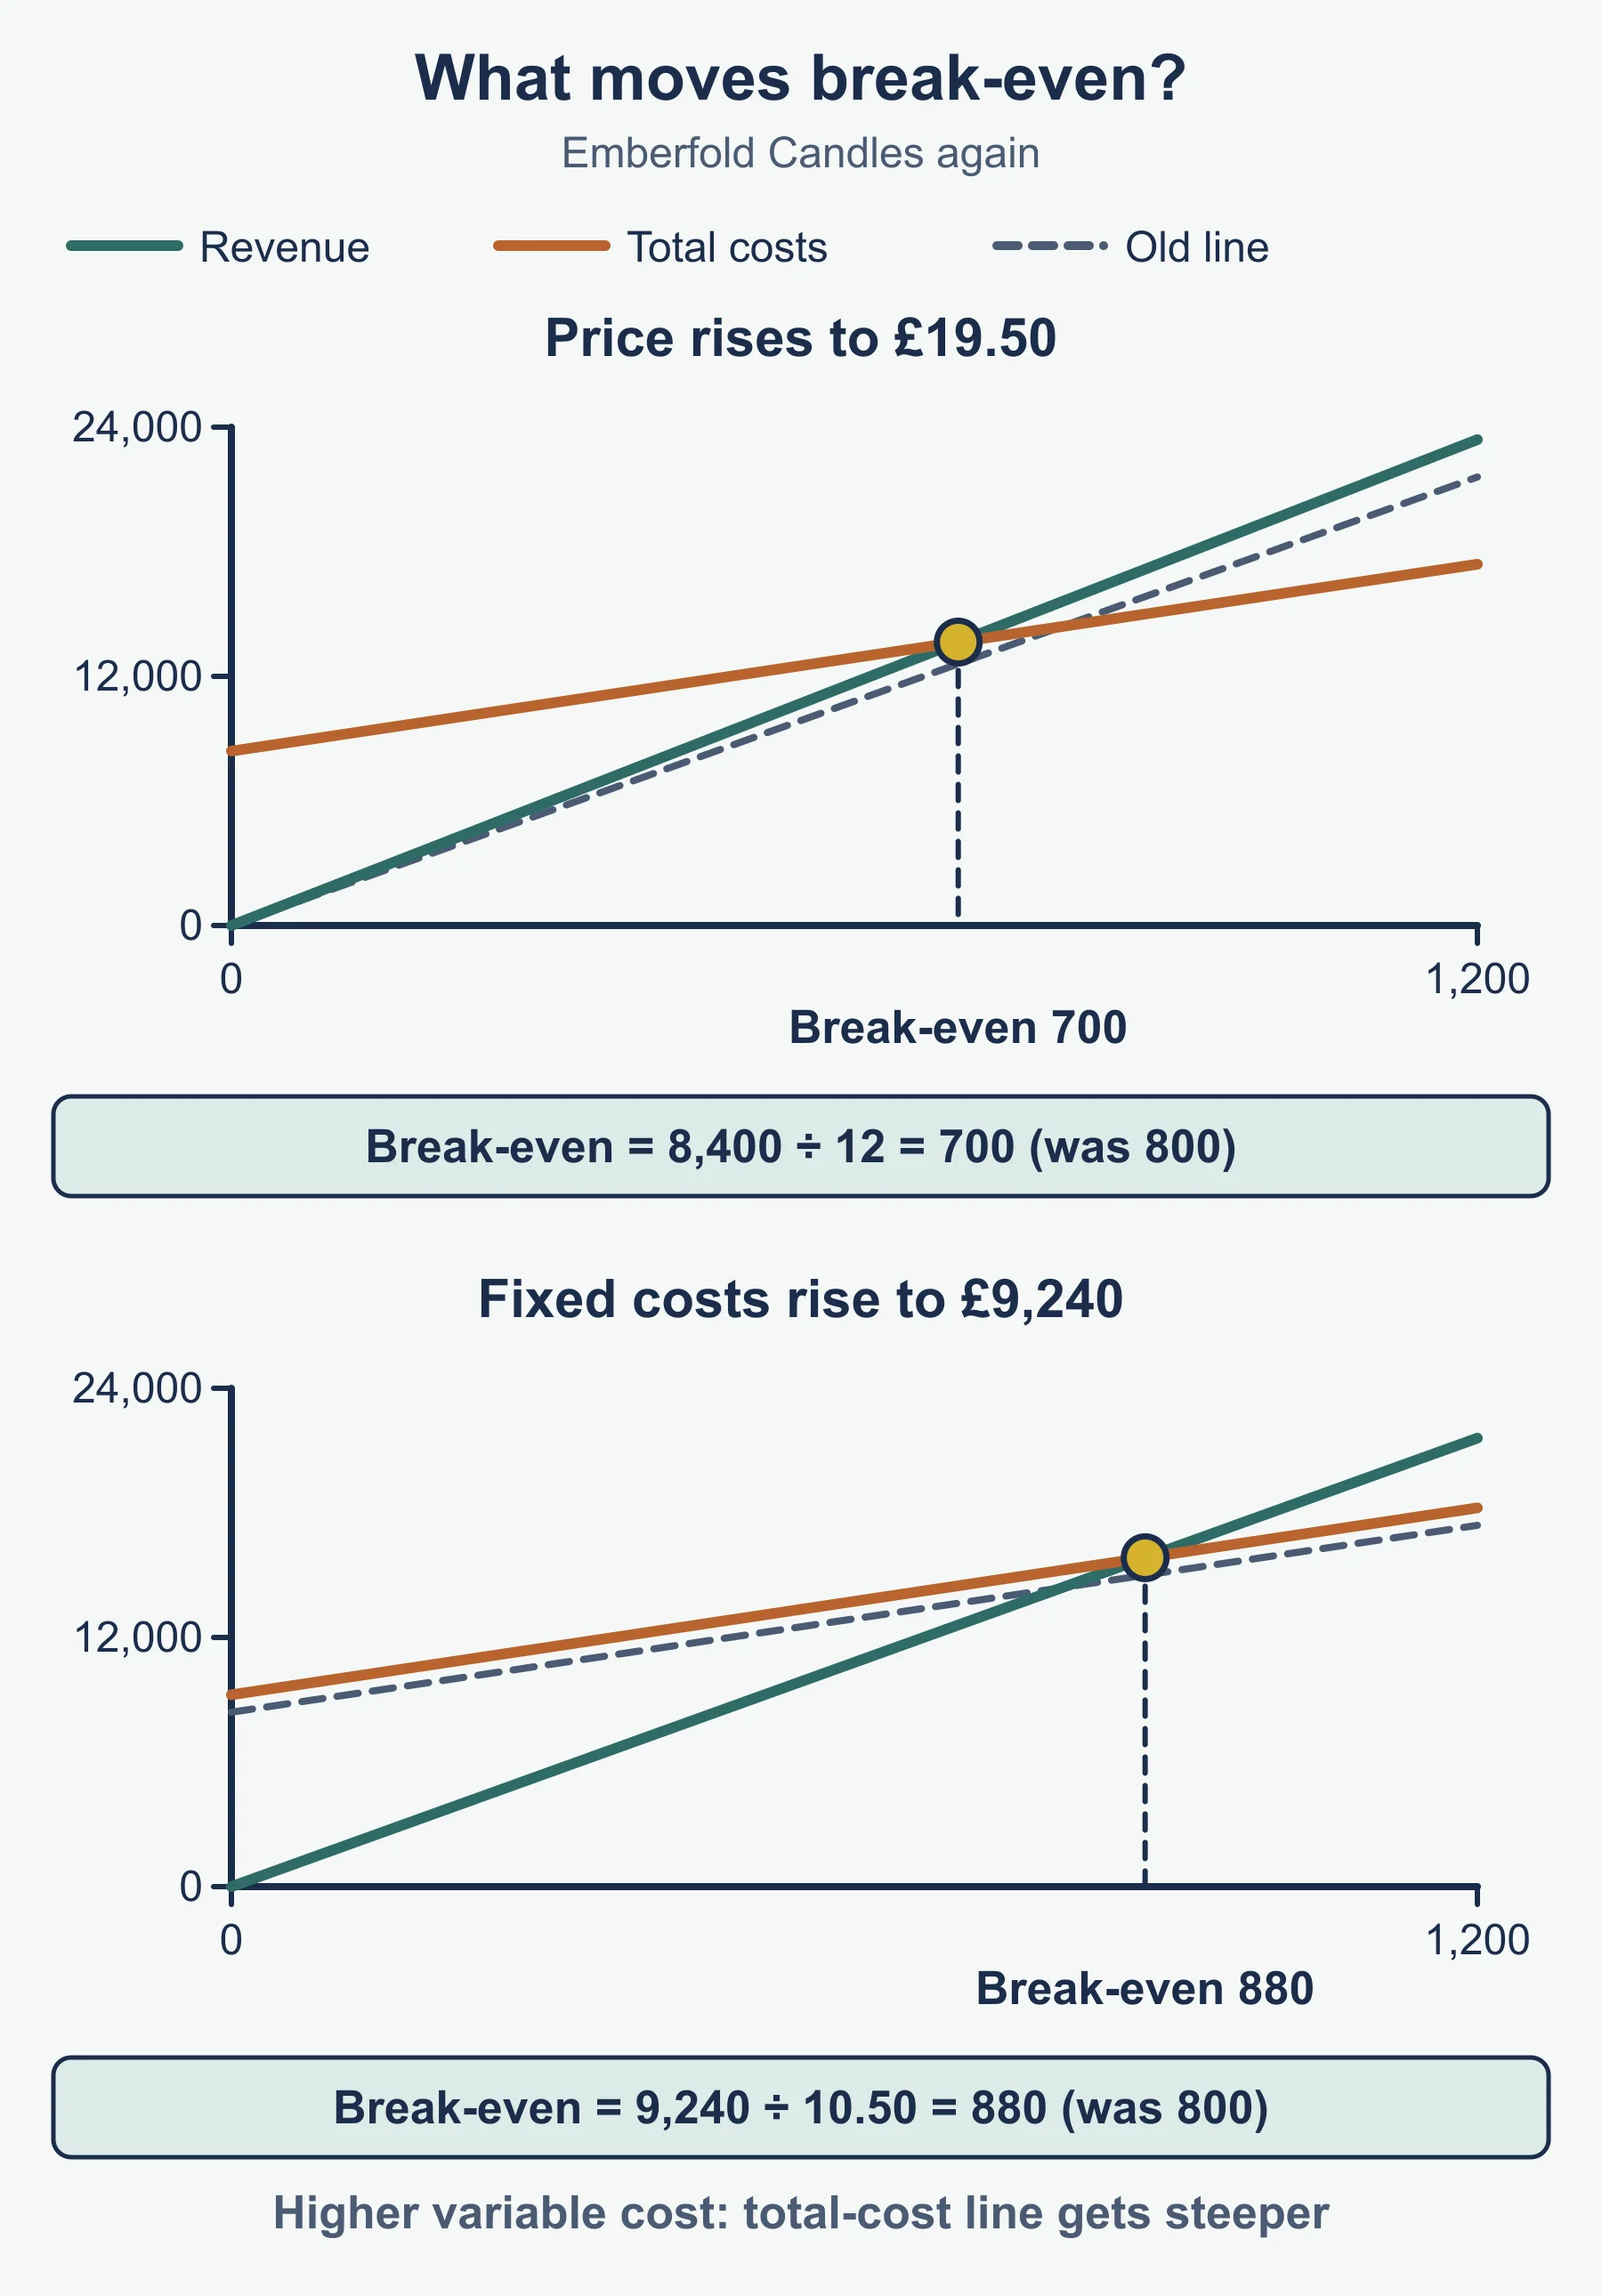
Chart movements:
- Price up: revenue line steeper, break-even point moves left.
- Price down: revenue line flatter, break-even point moves right.
- Variable cost up: total cost line steeper, break-even point moves right.
- Fixed costs up: total cost line shifts up with the same slope, break-even point moves right.
Worked reminder: keeping profit after a price cut
Hobsfield Bakery considers a price of 23 and wants to keep its profit of 3,000.
- New contribution per unit: 23 − 10 = 13.
- Output needed: (9,000 + 3,000) / 13 = 923.1, so 924 boxes.
- Check: 924 × 13 = 12,012, then 12,012 − 9,000 = 3,012, which is at least 3,000.
The cut means selling about 124 more boxes just to stand still. Whether demand will rise by that much is the judgement a good answer makes. This is also where the limitation “says nothing about demand” earns its place.
Reading values from a chart
- Break-even quantity: read down from the crossing point to the output axis.
- Break-even revenue: read across from the crossing point to the money axis.
- Profit at an output: go up from that output and measure the gap between the revenue line and the total cost line.
- Margin of safety: mark the actual output and the break-even output, then measure the gap between them.
Must-know distinctions
- Contribution per unit is for one unit. Total contribution is for all units sold.
- Contribution is not profit. Fixed costs must still be taken away.
- Break-even quantity is where profit is zero. Target profit output is where profit hits a chosen figure above zero.
- Target profit is the profit at a chosen output. Target profit output is the output for a chosen profit.
- Margin of safety is measured from actual output, not capacity.
Limitations of break-even
Learn at least five, with a reason each.
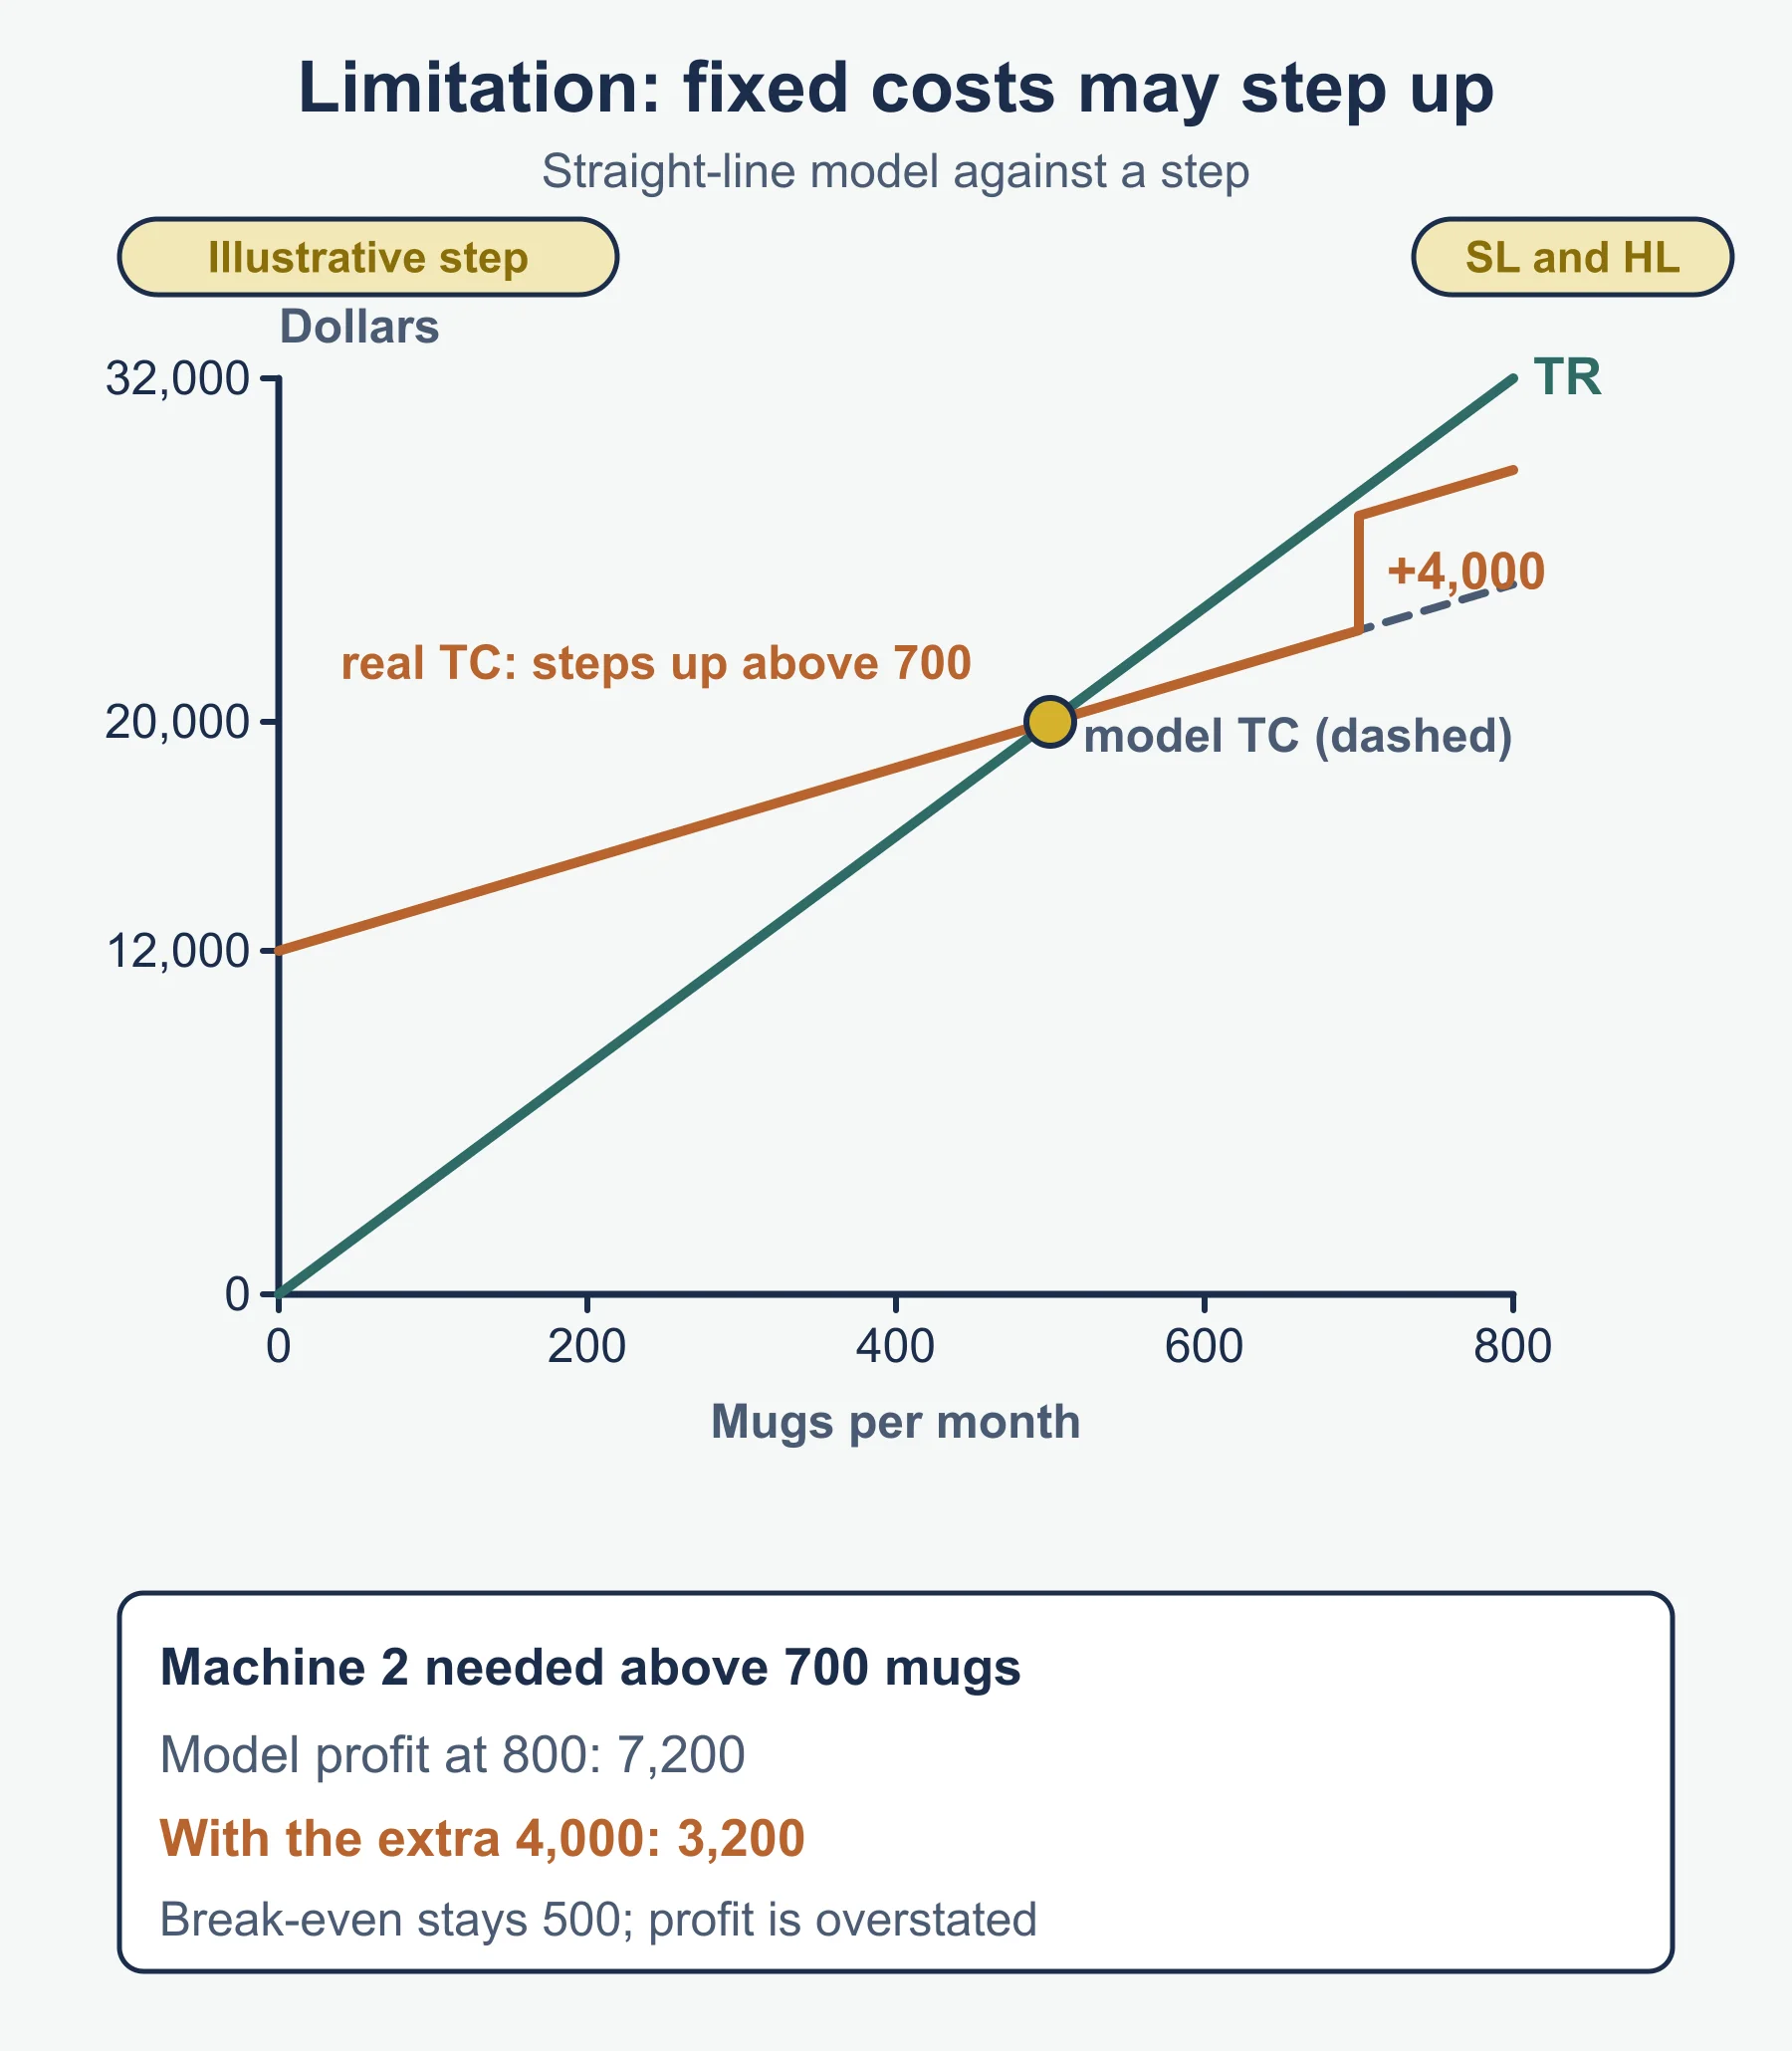
- Straight lines: price and unit cost may change with output.
- Fixed costs can step up if output grows a lot.
- Assumes all output is sold: unsold stock gives cost with no revenue.
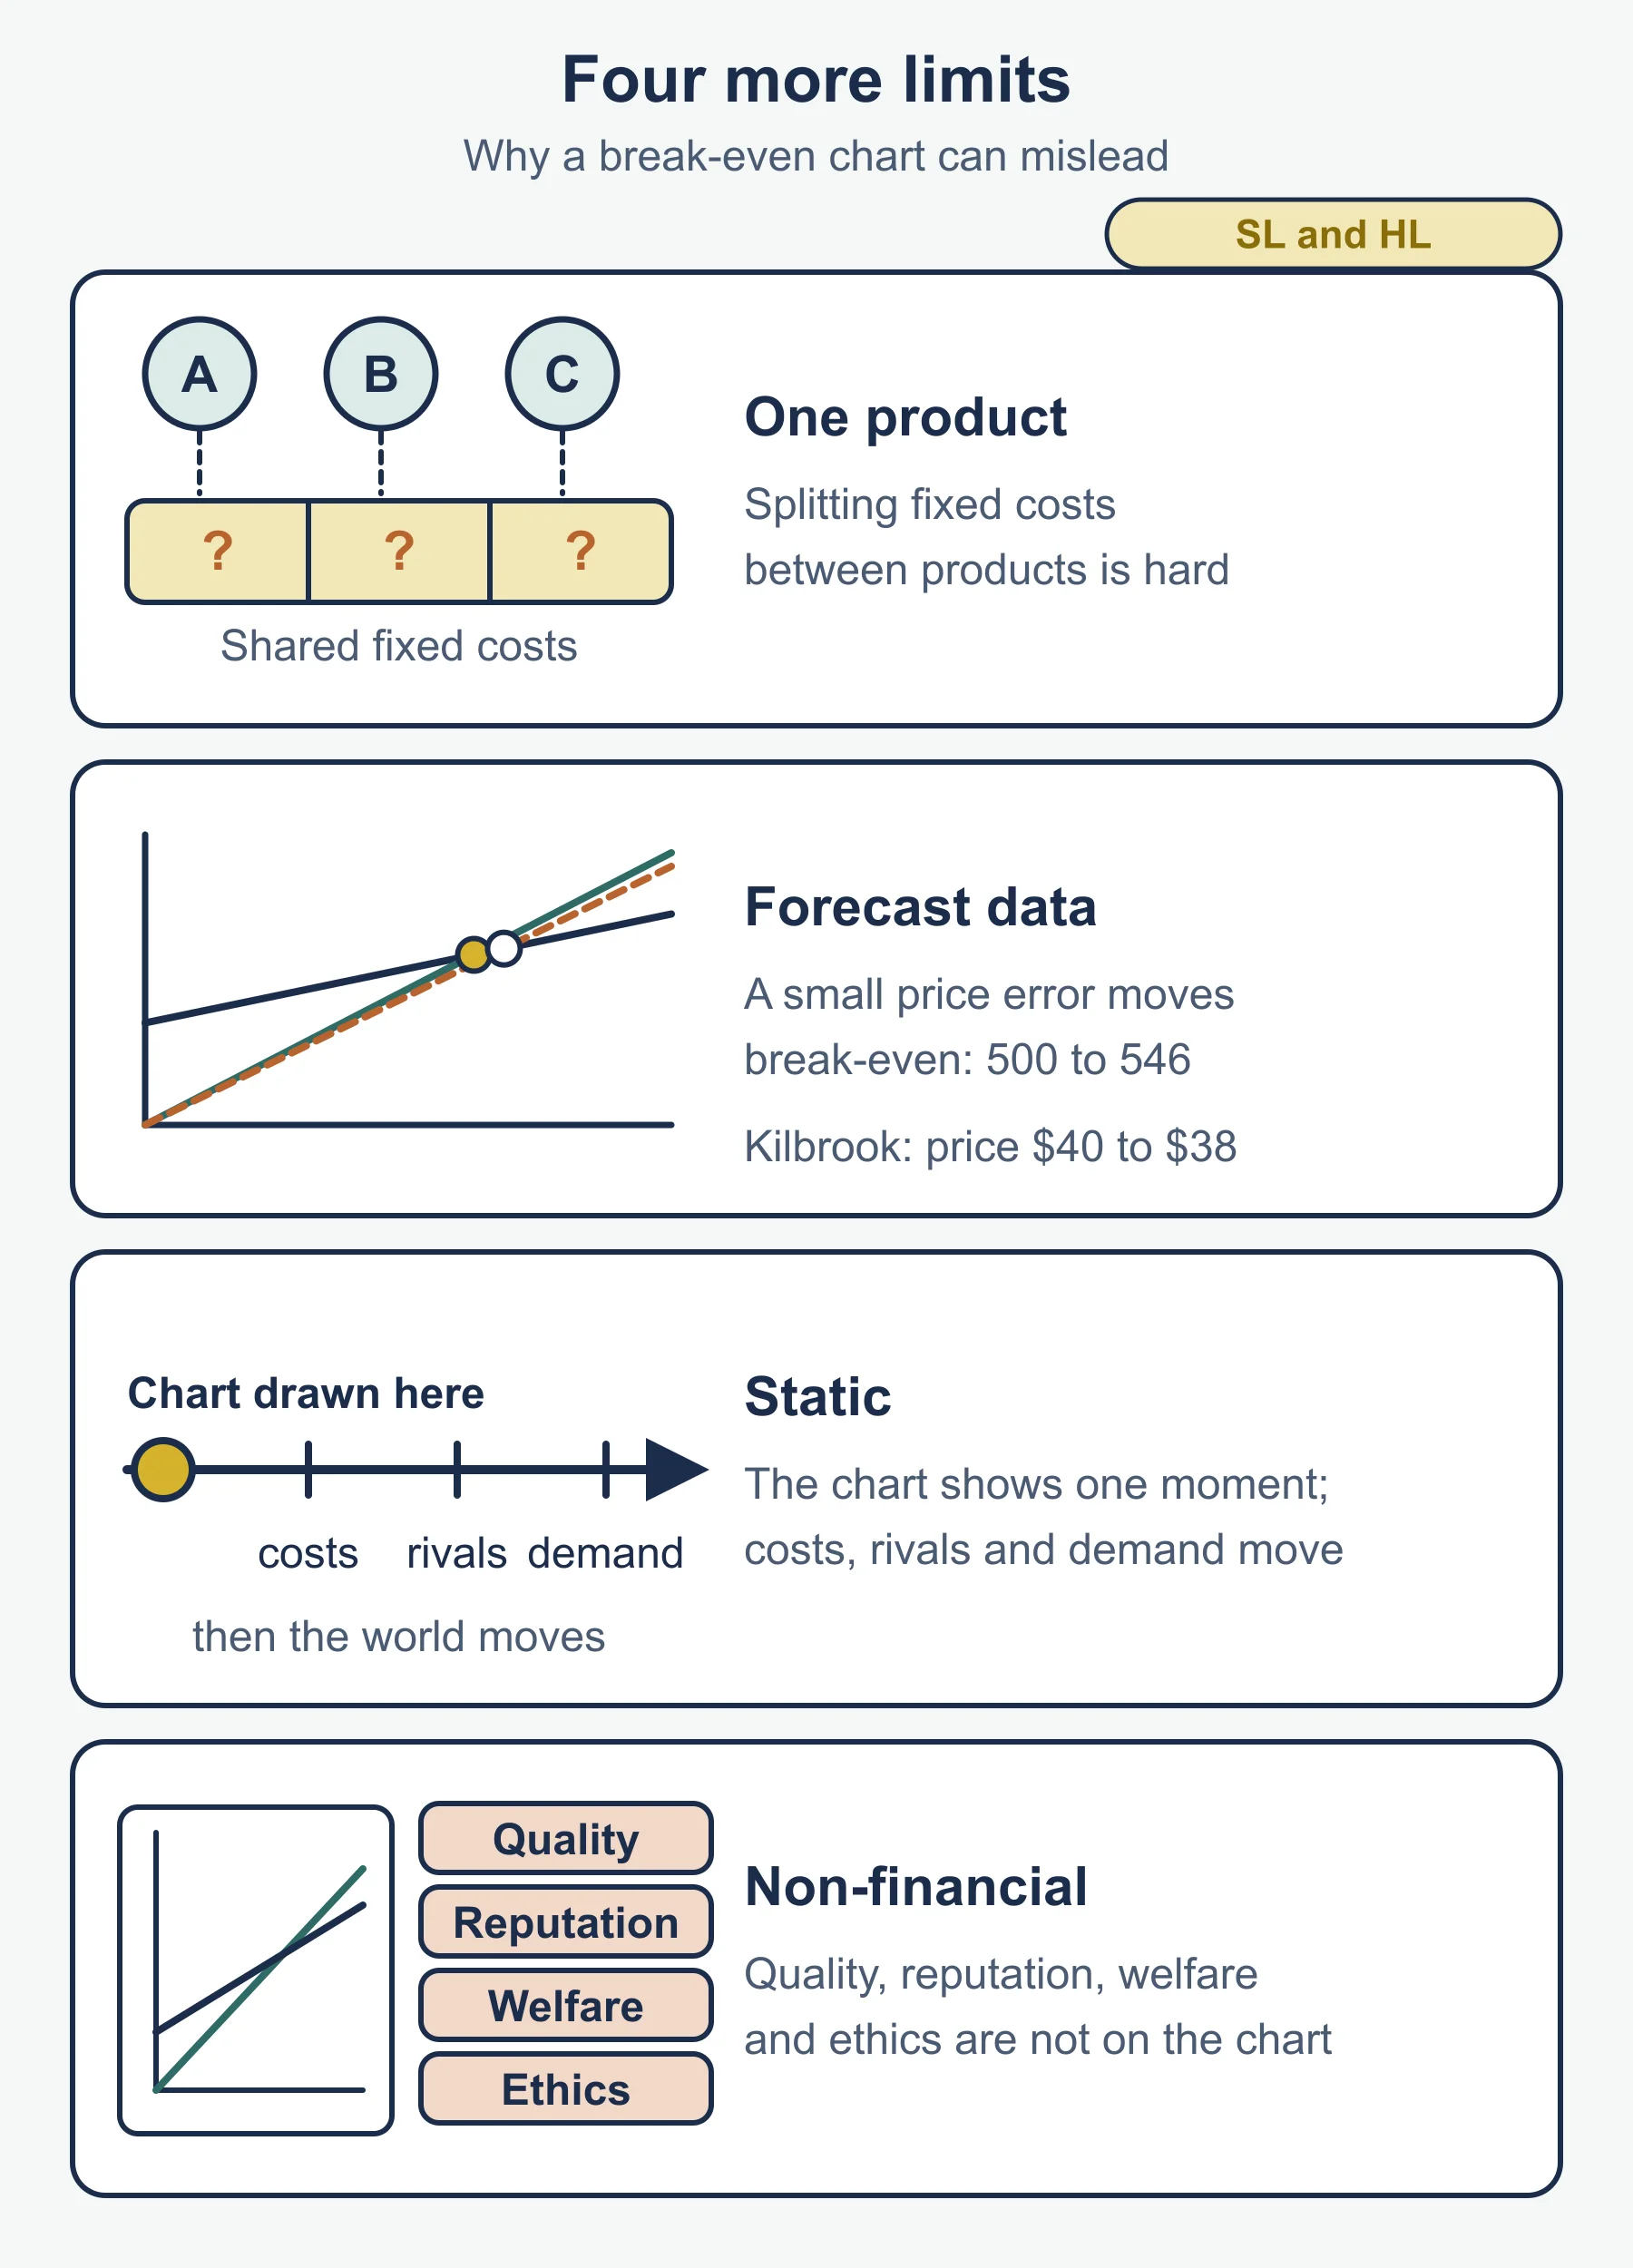
- One product assumed: hard to share fixed costs across a range.
- Relies on forecasts: small errors move the break-even point.
- Static: it is a snapshot while markets and costs keep changing.
- Ignores non-financial factors such as quality or reputation.
- Says nothing about whether customers will buy the break-even quantity.
For an AO3 answer, link one or two limitations to the business described, then give a judgement on how useful the tool is.
Quick self-test
- Write the formula for contribution per unit.
- Hobsfield Bakery raises its price to 28 with variable cost at 10. What is the new contribution per unit?
- Using the base case, what loss is made at 500 boxes?
- Using the base case, what is the margin of safety, as a share of the output sold?
- What output gives a target profit of 4,500 in the base case?
- Fixed costs rise to 10,500. What is the new break-even quantity?
- On the chart, which line moves when fixed costs rise, and how?
- What does the revenue line do on the chart if the price falls?
- Give two limitations of break-even analysis.
- Explain the difference between total contribution and contribution per unit.
- Using the base case, what price gives a profit of 5,400 at 900 boxes?
- Why might a business round its break-even quantity up?
Answers
- Price minus variable cost per unit.
- 28 − 10 = 18.
- 500 × 15 = 7,500, then 7,500 − 9,000 = −1,500, so a loss of 1,500.
- 200 / 800 × 100 = 25%.
- (9,000 + 4,500) / 15 = 900 boxes.
- 10,500 / 15 = 700 boxes.
- The total cost line (and the fixed cost line) shifts up, with the same slope for total costs.
- It becomes flatter, so the break-even point moves right.
- Any two: straight lines assumed, costs may not be fixed, all output assumed sold, forecasts may be wrong, non-financial factors ignored.
- Contribution per unit is the amount one sale adds towards fixed costs and profit. Total contribution is that amount multiplied by all units sold.
- The total needed is 9,000 + 9,000 + 5,400 = 23,400, and 23,400 / 900 = 26.
- A fraction of a unit cannot be sold, and selling 692 boxes would still leave a small loss.
Where marks are usually lost
- Using the selling price, not the contribution on each unit, as the divisor for fixed costs.
- Starting the total cost line at the origin.
- Giving margin of safety without saying whether it is units or a percentage.
- Mixing up target profit and target profit output.
- Forgetting to round the break-even quantity up.
- Describing a limitation generally without tying it to the business in the case.
- Stating the new break-even figure after a change but not saying what it means for profit and margin of safety.
- Leaving out units, currency or axis labels.
Frequently asked questions
How do you calculate break-even quantity in IB Business Management? Divide fixed costs by contribution per unit, where contribution per unit is selling price minus variable cost per unit. The IB guide gives no formulas for section 5.5, so this is the usual textbook form.
How do you calculate the margin of safety? Margin of safety is actual (or planned) output minus break-even quantity. If you give it as a percentage, state the base you used, such as actual output or capacity.
How do you calculate target price? Add fixed costs, variable costs at the expected output and the target profit, then divide by the expected output. Whether customers will pay that price is a separate question.
What is the difference between total contribution and contribution per unit? Contribution per unit is selling price minus variable cost per unit. Total contribution is contribution per unit multiplied by units sold, or total revenue minus total variable costs.
Official syllabus
International Baccalaureate Organization, Business management guide, first assessment 2024, section 5.5 Break-even analysis.
Get free revision emails (optional)
Occasional emails with practice questions, worked explanations and links to free resources for the qualification and subjects you choose. No spam, and you can unsubscribe from any email. The free tools on this site never need an email.
Related resources
-
Study guides
IB DP Business Management: Crisis management and contingency planning (HL only)
Study guide to IB DP Business Management 5.7 (HL only): crisis management, contingency planning, four success factors and their impact.
Business · International Baccalaureate · IB
Read guide -
Practice questions
IB DP Business Management: Crisis management and contingency planning (HL only) – Practice Questions
Original practice questions with worked answers on IB DP Business Management 5.7 (HL only): crisis management and contingency planning.
Business · International Baccalaureate · IB
Try questions -
Revision notes
IB DP Business Management: Crisis management and contingency planning (HL only) – Revision Notes
Condensed revision notes for IB DP Business Management 5.7 (HL only): definitions, the four factors, the four impacts and a self-test.
Business · International Baccalaureate · IB
Revise topic
Related articles
-
teaching
A Level tuition in Dubai: Cambridge or Pearson Edexcel International A Level?
Schools in Dubai and Abu Dhabi teach either Cambridge International AS & A Level or Pearson Edexcel International A Level. How the two are structured, why it matters for tuition, and how online classes from Lahore work.
9 October 2026
-
curriculum guides
Choosing subjects at IGCSE and A Level
How subject choices at 14 and 16 affect university options later, and how to keep pathways open without overloading a timetable.
28 July 2026
Studying this with a teacher
Working through Business IB?
This page is free and stays free. If you would rather be taught it, Marlbridge runs Business classes one-to-one, online in your own time zone. The first trial class is free. WhatsApp replies within an hour (8am–11pm Pakistan time, every day); email the same day.
IB Business teachers at Marlbridge

