
Study Guides
IB DP Geography: Option G: Urban environments – Study Guide
A study guide to the Urban environments option in IB DP Geography: variety of cities, changing urban systems, stresses and sustainable urban futures.
- Subject
- Geography
- Level
- IB
- Topic
- Topic 7: Option G: Urban environments
- Author
- Marlbridge Academic Team
- Updated
- Reviewed by
- Azam Siddique (what this means)
Aligned to International Baccalaureate IB Diploma Programme Geography (DP Geography), First assessments 2019. Official specification .
Syllabus page (what it covers and how it is assessed): IB Diploma Programme Geography.
Syllabus points this page covers
DP Geography
- 7.1 The variety of urban environments
- 7.2 Changing urban systems
- 7.3 Urban environmental and social stresses
- 7.4 Building sustainable urban systems for the future
This page covers all 4 subtopics recorded here in topic 7, Option G: Urban environments.
Urban environments is one of the teacher-selected options in the geographic themes part of IB Diploma Programme Geography. It examines how cities differ, how urban systems change, what stresses cities face and how they might become more sustainable. Check that your school teaches it. The IB DP Geography syllabus guide explains how options sit alongside the core, and the Global Climate core guide is relevant to urban climate vulnerability.
Where this fits in the course
Options are assessed in Paper 1, which expects you to apply concepts to real places. Choose at least one city from a higher-income and one from a lower- or middle-income setting and learn them well enough to discuss structure, change, problems and responses. If you cannot recall exact data, write in general terms rather than inventing figures.
7.1 The variety of urban environments
Urban areas vary in size, function, age, wealth and form. Key terms to define: urbanisation (growth in the share of population living in towns and cities), urban growth (increase in the size of urban population), city, conurbation, megacity (commonly a city of over 10 million people) and world or global city (a city with strong command over finance, trade and culture). Urbanisation has been fastest in recent decades in Asia and Africa, while many cities in high-income countries have more established urban systems, with some experiencing decline in older industrial areas.
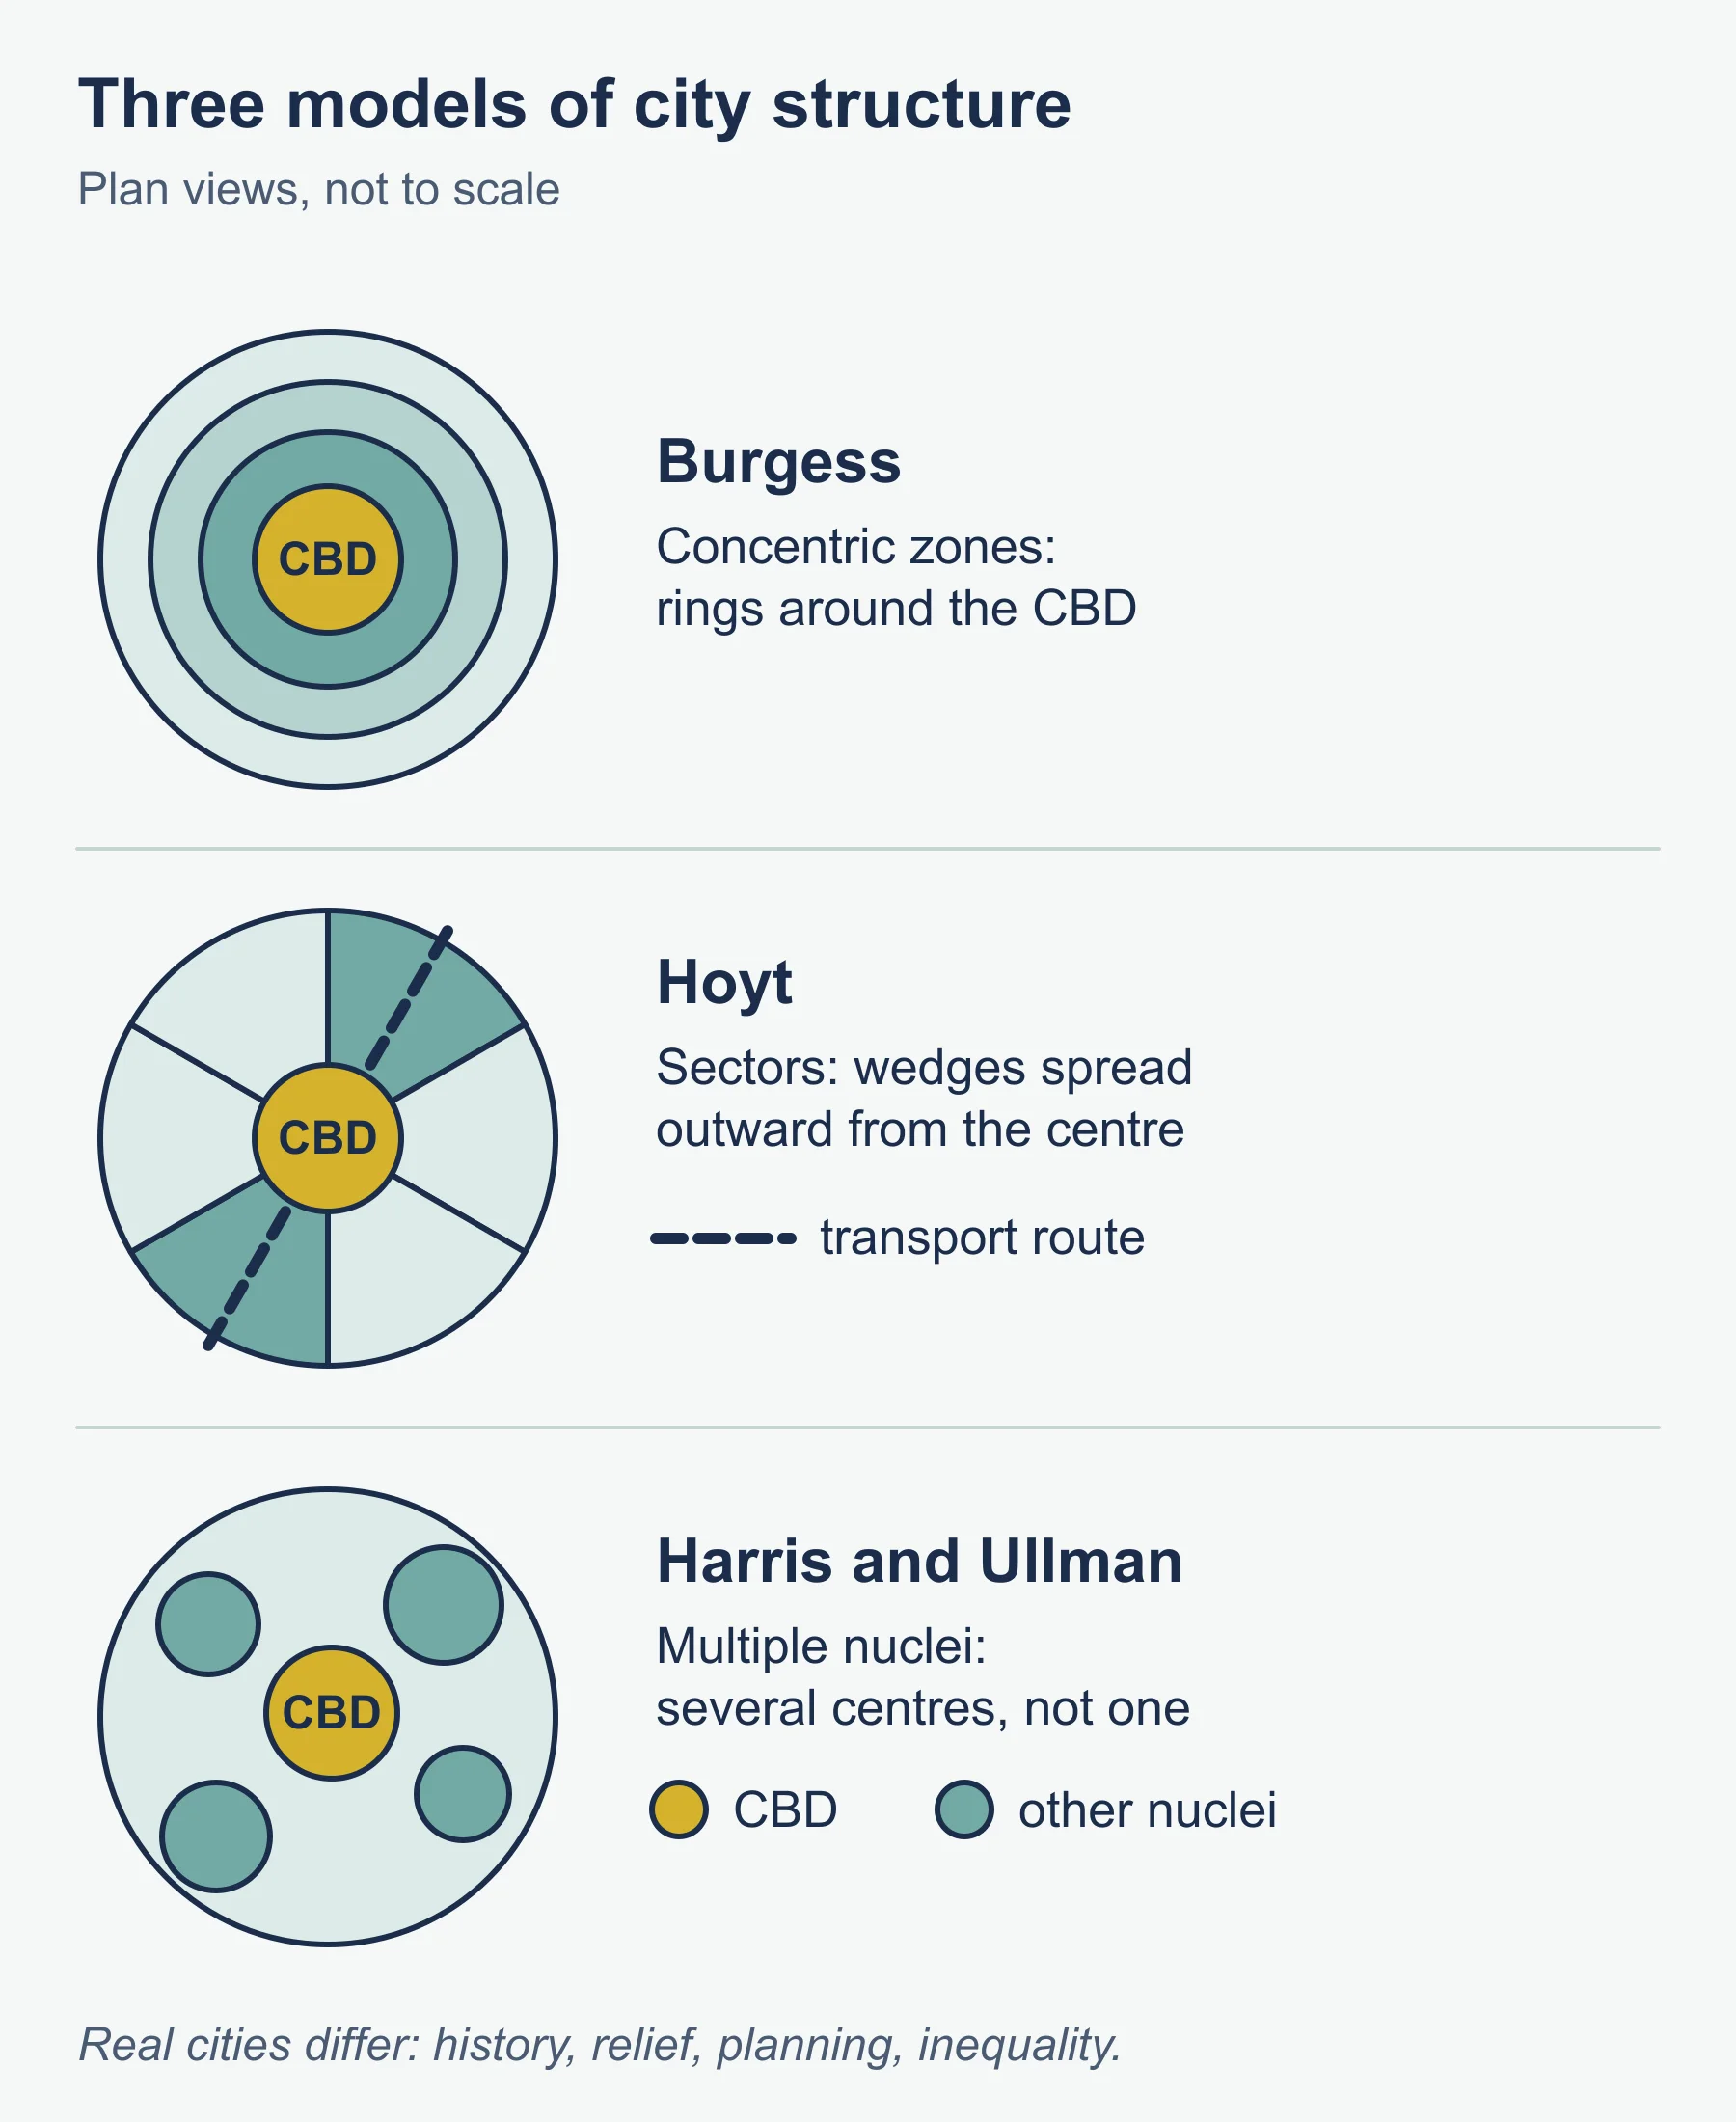
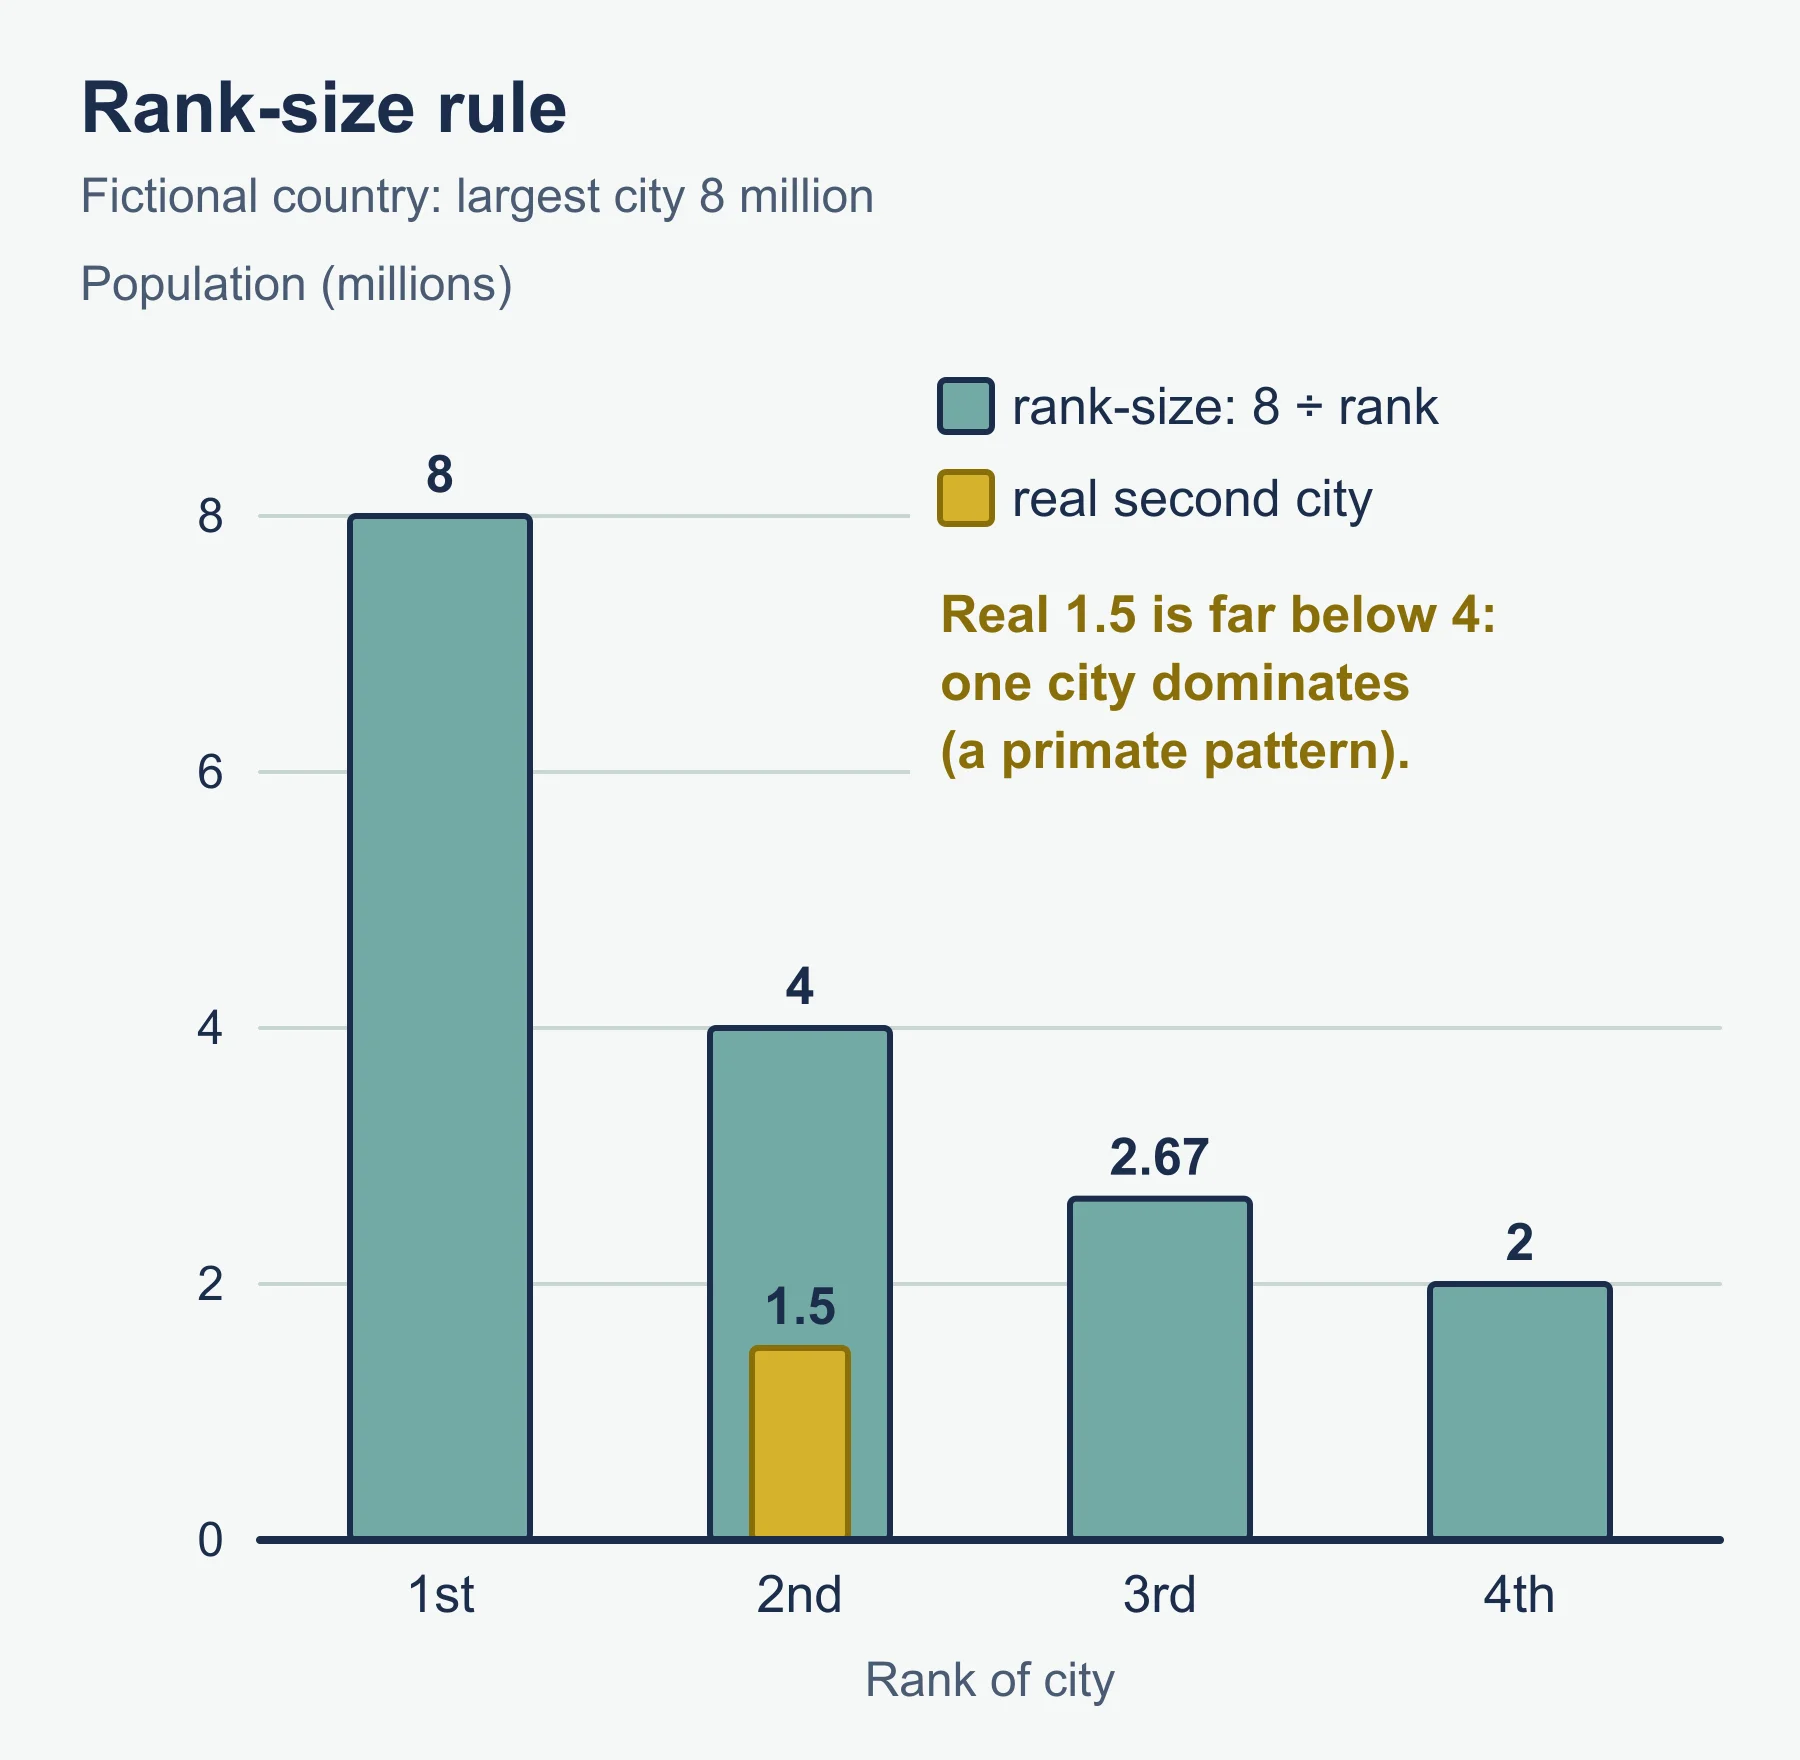
Cities are often compared through classic models of internal structure. The Burgess concentric zone model, Hoyt’s sector model and the Harris and Ullman multiple nuclei model each describe land use differently, and the Latin American and other models adapt ideas to different contexts. Learn what each predicts and where each fails, because real cities are shaped by history, topography, planning and inequality. The rank-size rule is a model of urban hierarchy in which the nth city has a population of 1/n times that of the largest. A primate city is far larger than the next, which breaks that pattern.
Characteristics worth knowing include land values (highest at the central business district), density gradients, functional zoning, accessibility and housing quality. Informal settlements are common in rapidly growing cities in lower-income countries, where housing may lack secure tenure and services.
7.2 Changing urban systems
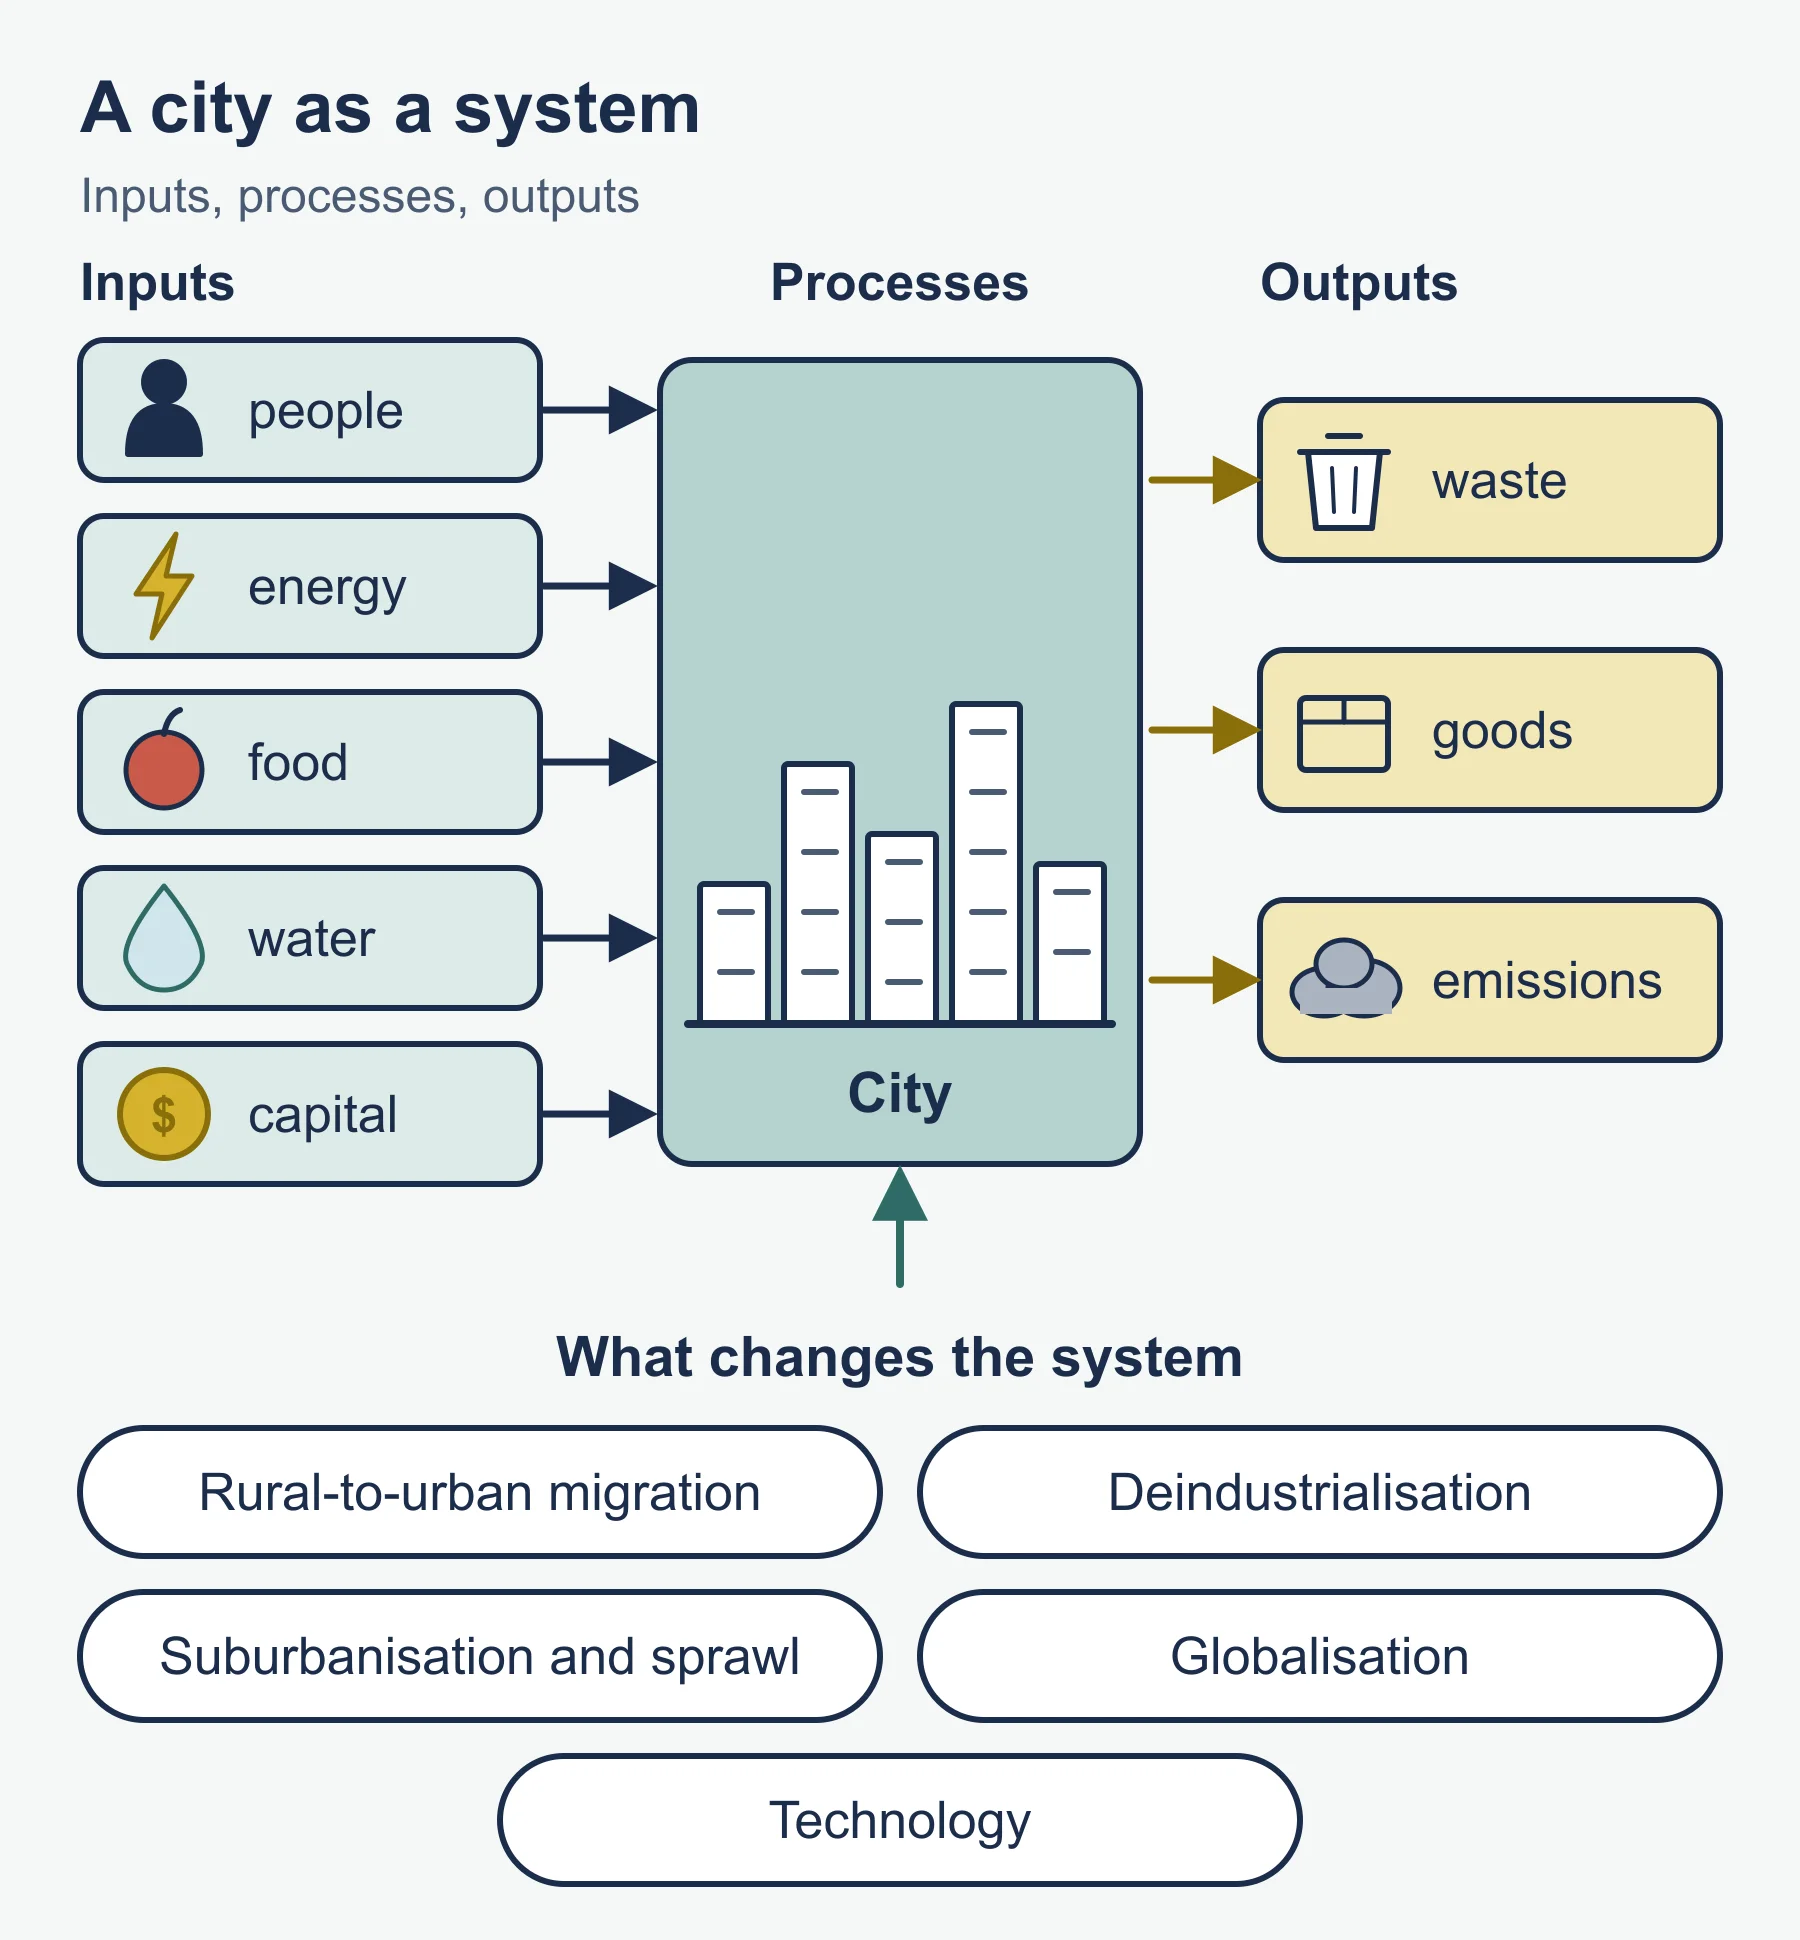
Cities can be treated as systems with inputs (people, energy, food, water, capital), processes and outputs (waste, goods, emissions). They change through demographic, economic and political processes.
Important changes include:
- Rural to urban migration, driven by push factors such as lack of jobs and pull factors such as perceived opportunity, together with natural increase.
- Deindustrialisation in many older industrial cities and growth of service industries, with regeneration and, in some districts, gentrification.
- Suburbanisation, counter-urbanisation and urban sprawl, with consequences for transport and land use.
- Globalisation and the rise of networks, in which cities compete for investment and connect through trade, finance and migration.
- Technology, including digital connectivity and the move toward so-called smart cities.
Be ready to analyse how change varies between places. A city in a lower-income country may be absorbing large numbers of migrants faster than services can expand, whereas a post-industrial city may be struggling with population loss or the need to reinvent its economy. Consider the role of planning and government policy and how different groups are affected differently.
7.3 Urban environmental and social stresses
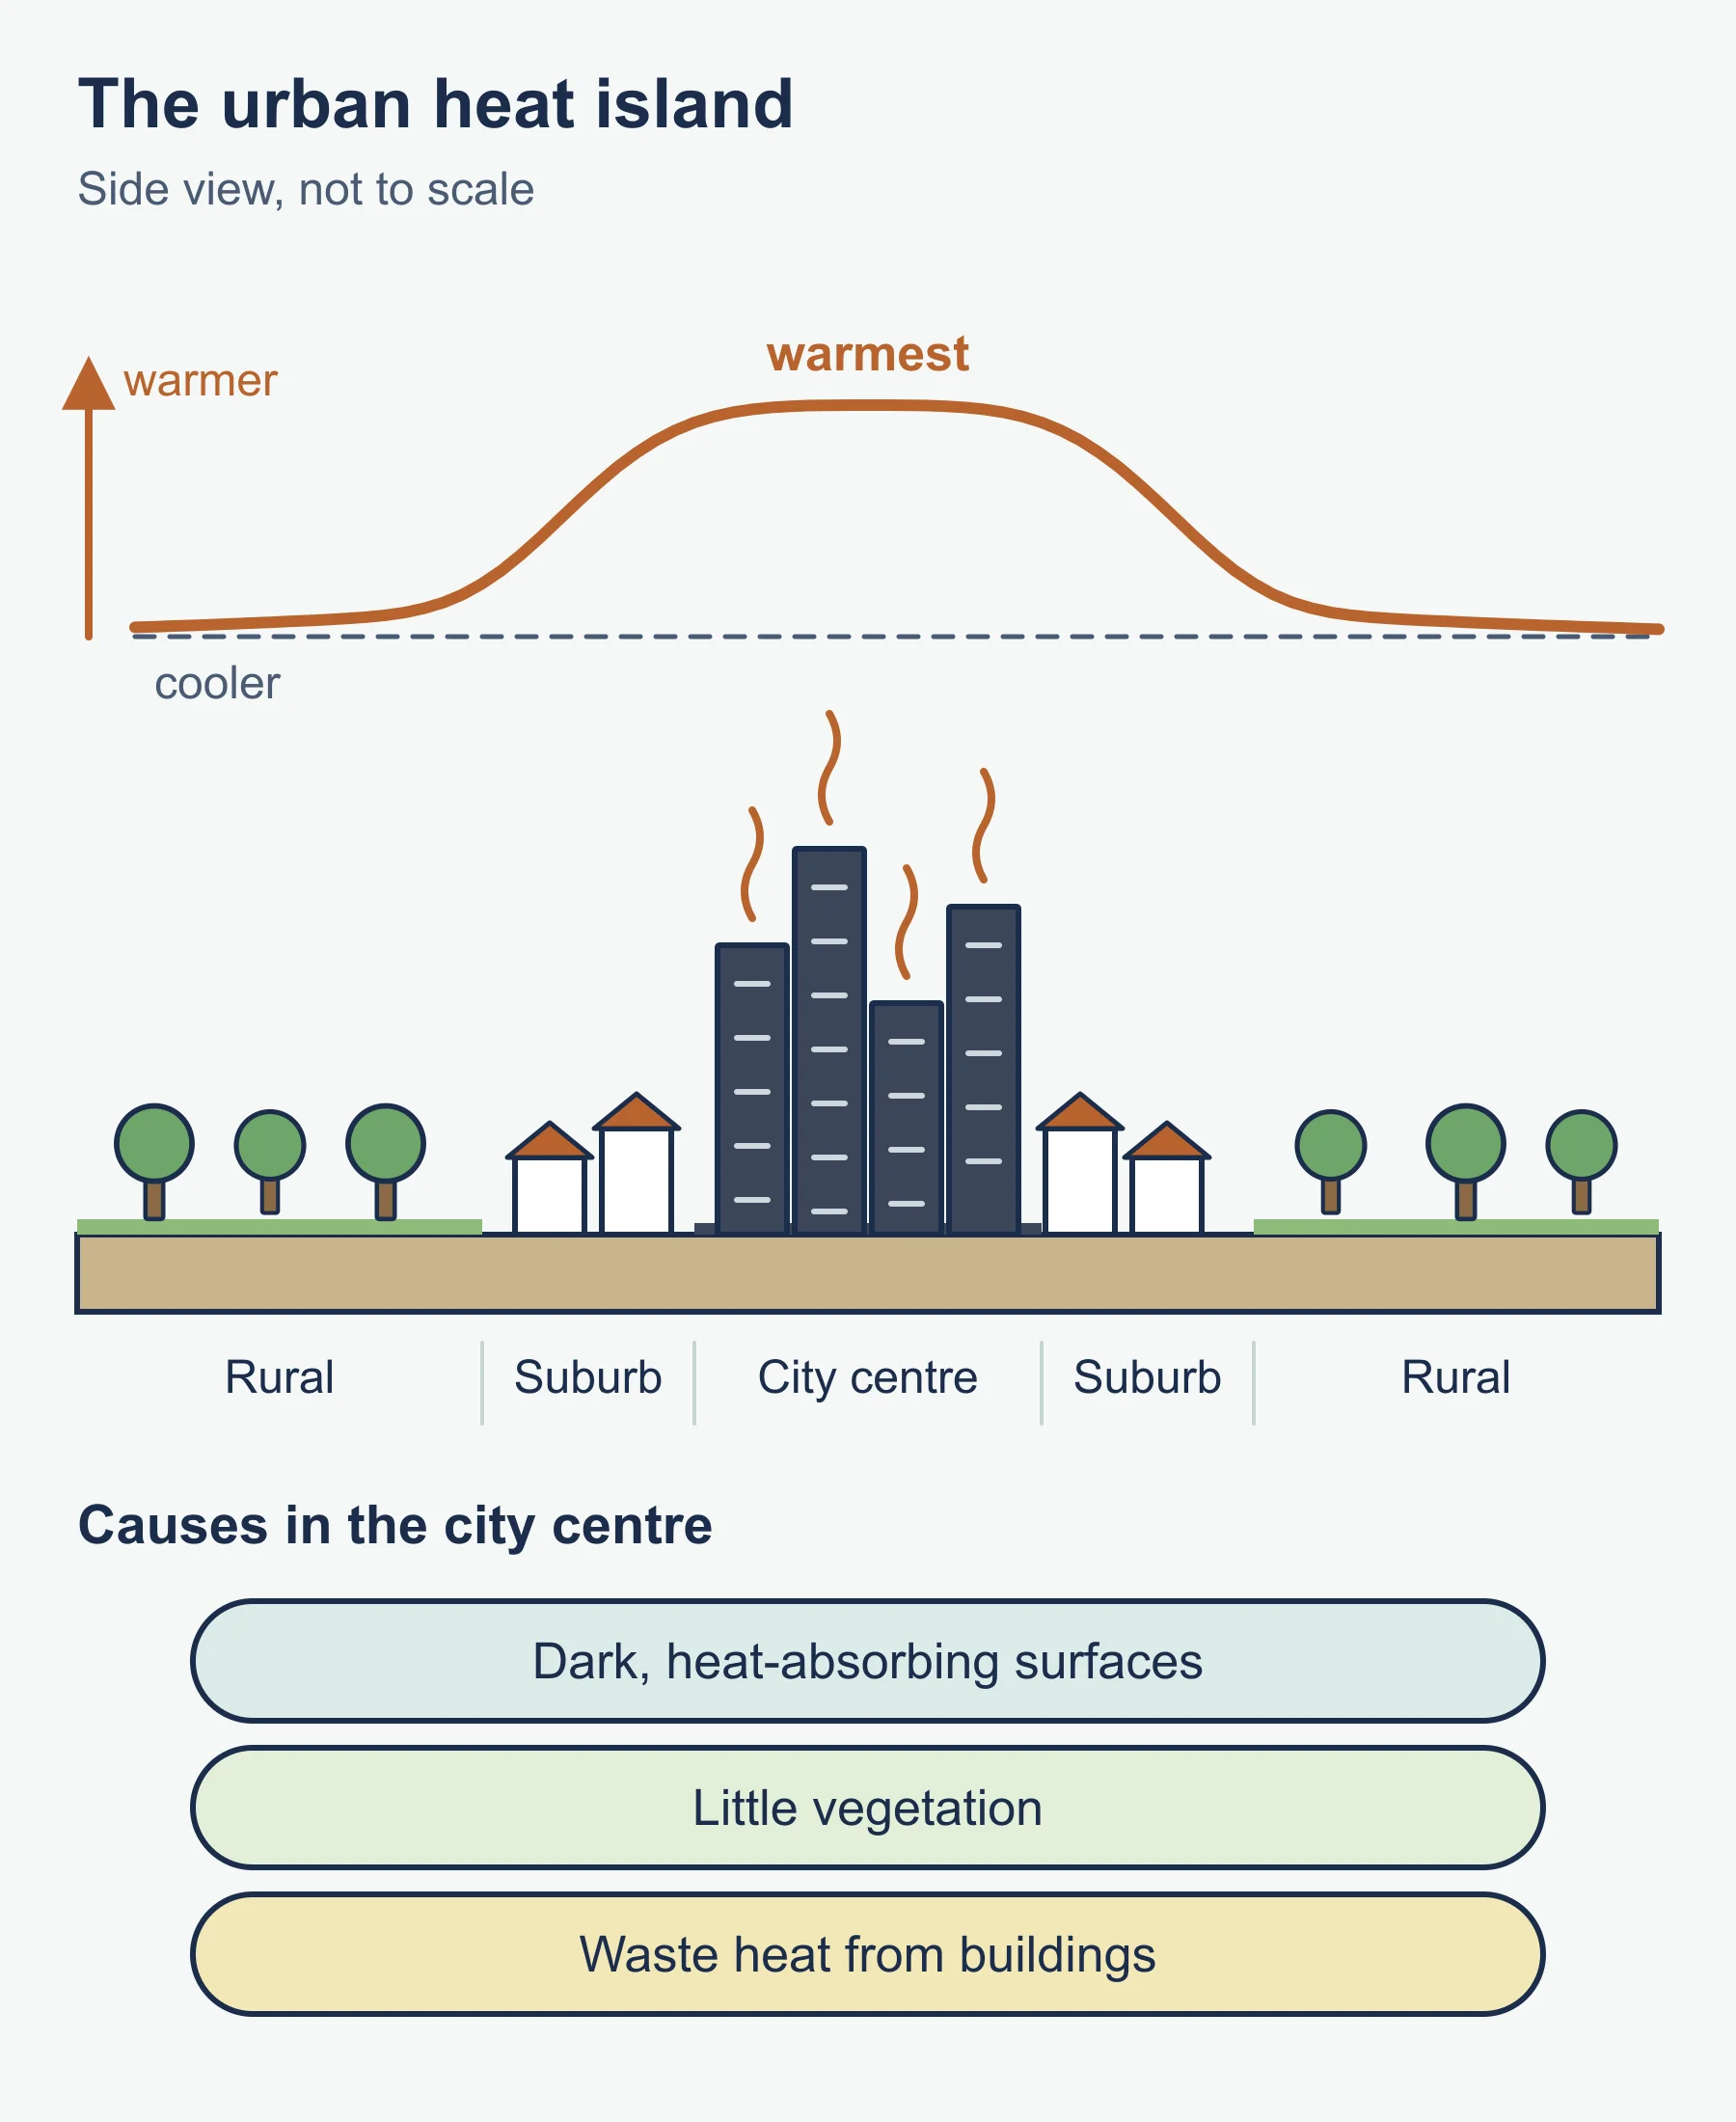
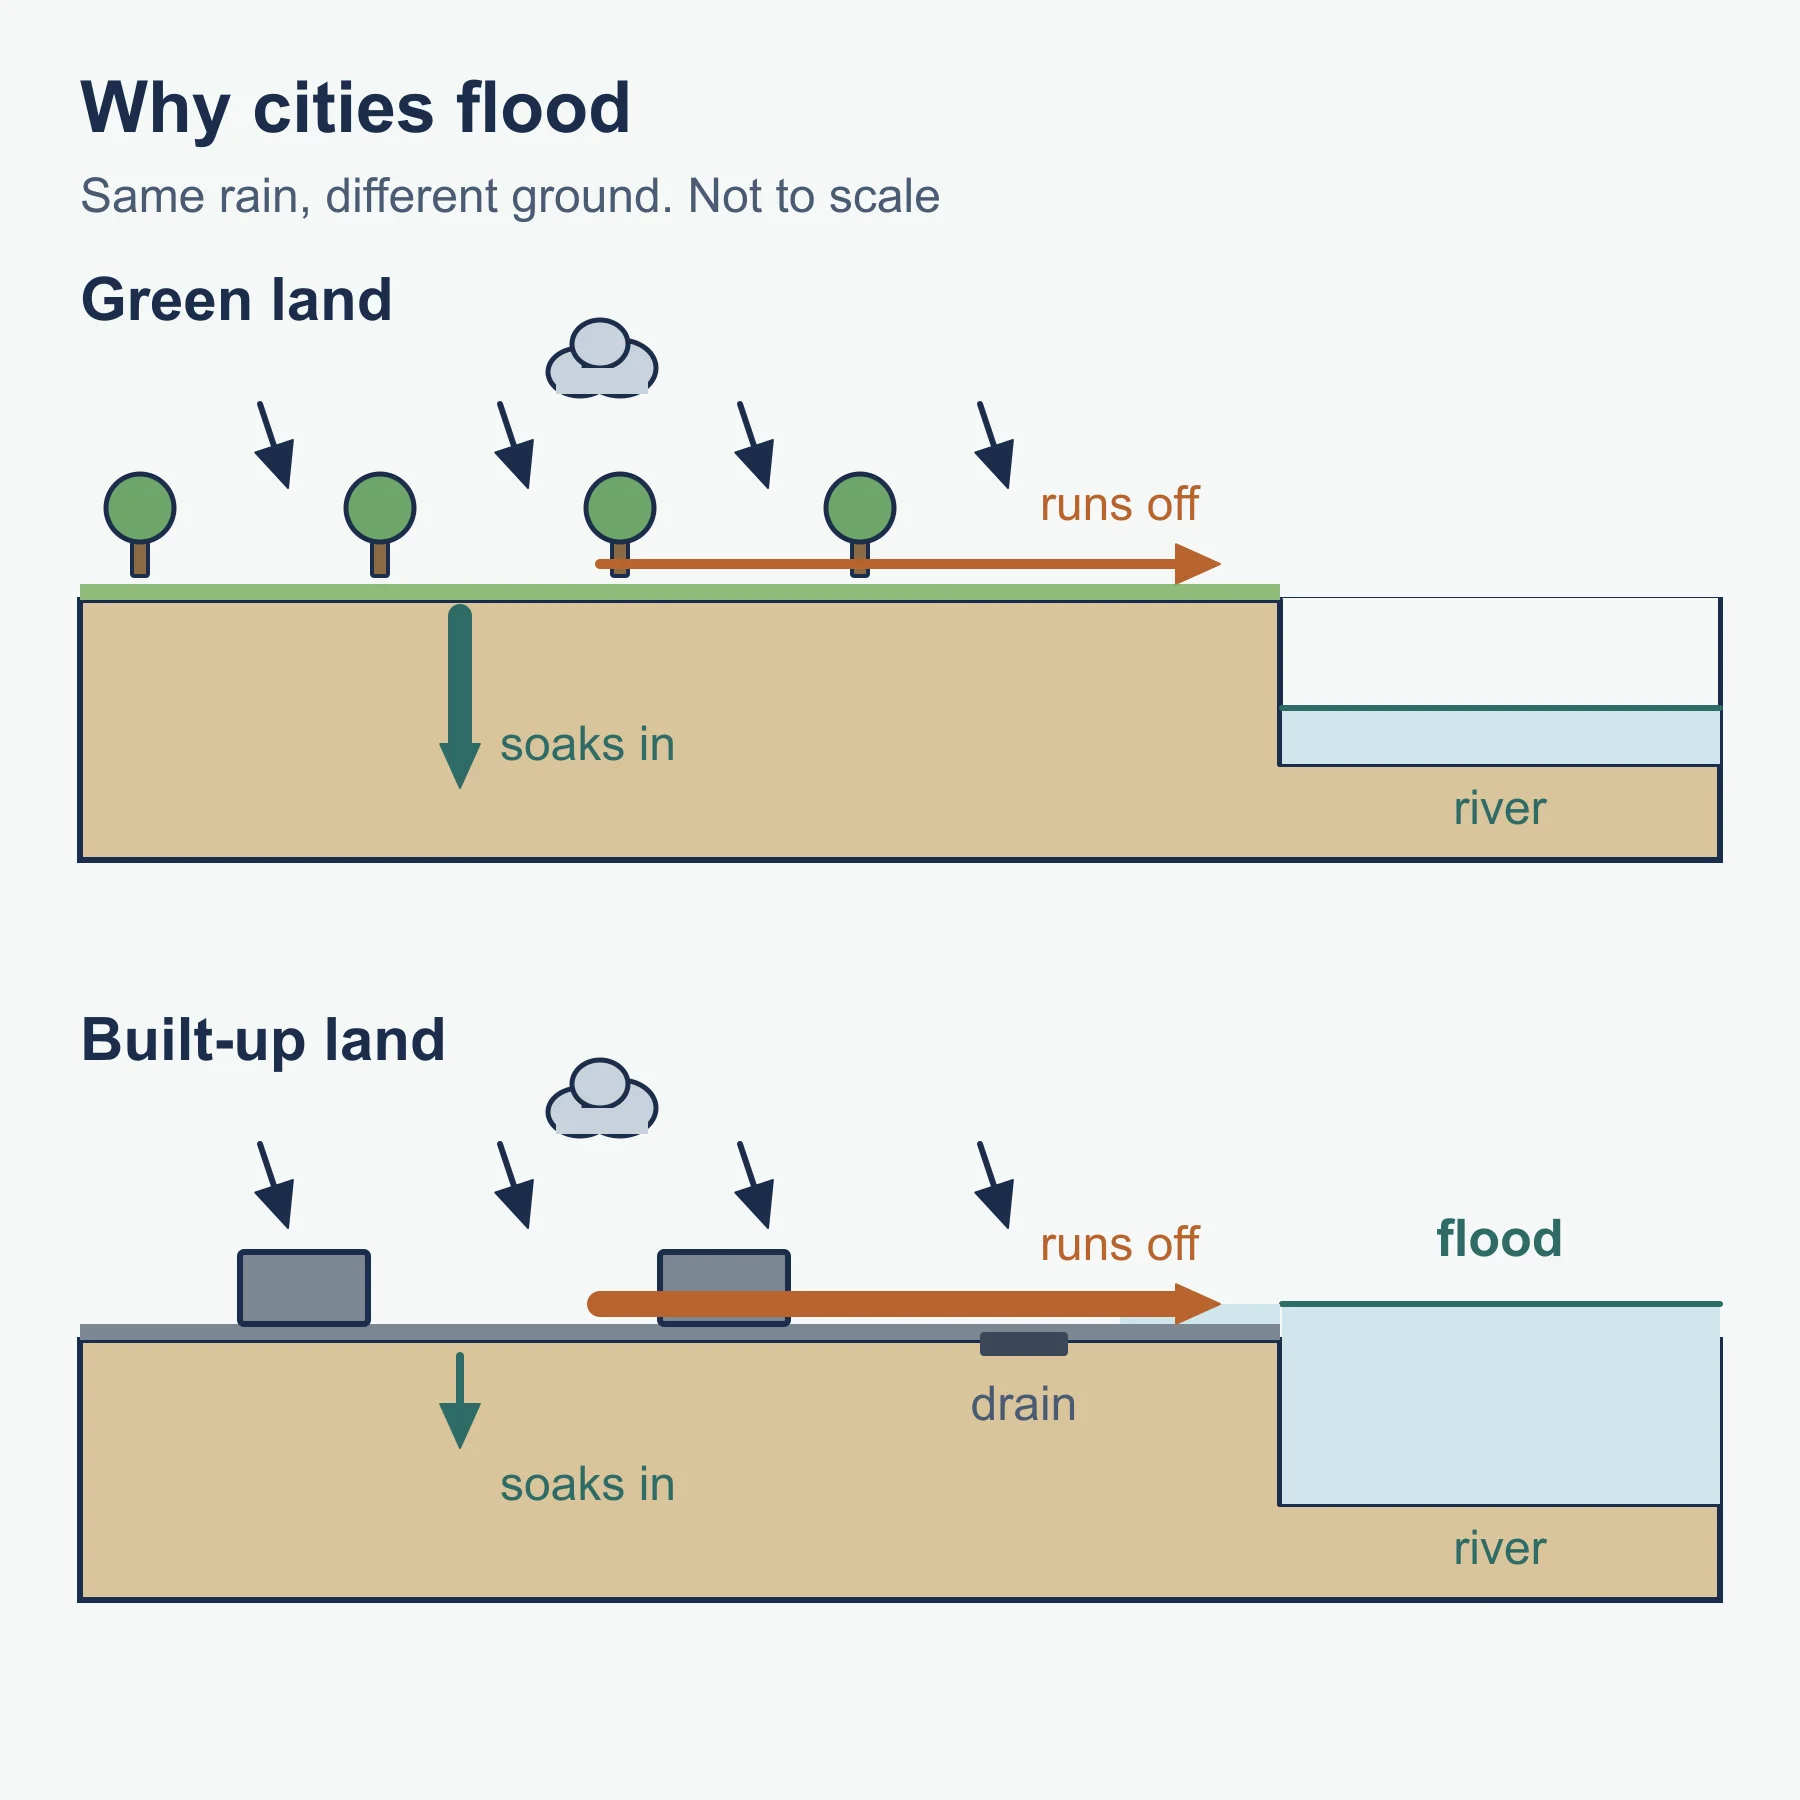
Cities concentrate environmental pressure. Common issues include air pollution from transport, industry and heating; waste generation; water supply and wastewater treatment; loss of green space; flooding where drainage is overloaded by impermeable surfaces; and the urban heat island, in which built-up areas are warmer than surroundings because of heat-absorbing materials, reduced vegetation and waste heat. Ecological footprint often far exceeds a city’s own area, because cities draw on resources from a wide hinterland.
Social stresses include inadequate or unaffordable housing, inequality and segregation, unemployment and informal work, crime, health problems linked to pollution or overcrowding, and uneven access to transport, education and health care. Congestion imposes economic and personal costs. Vulnerability to hazards is higher where people live in informal housing on unsafe land.
Evaluate responses such as improved public transport, low emission zones, upgrading rather than demolishing informal settlements, affordable housing programmes, waste recycling and green infrastructure. For each, ask who benefits, how long it lasts and whether it addresses root causes or only symptoms.
7.4 Building sustainable urban systems for the future
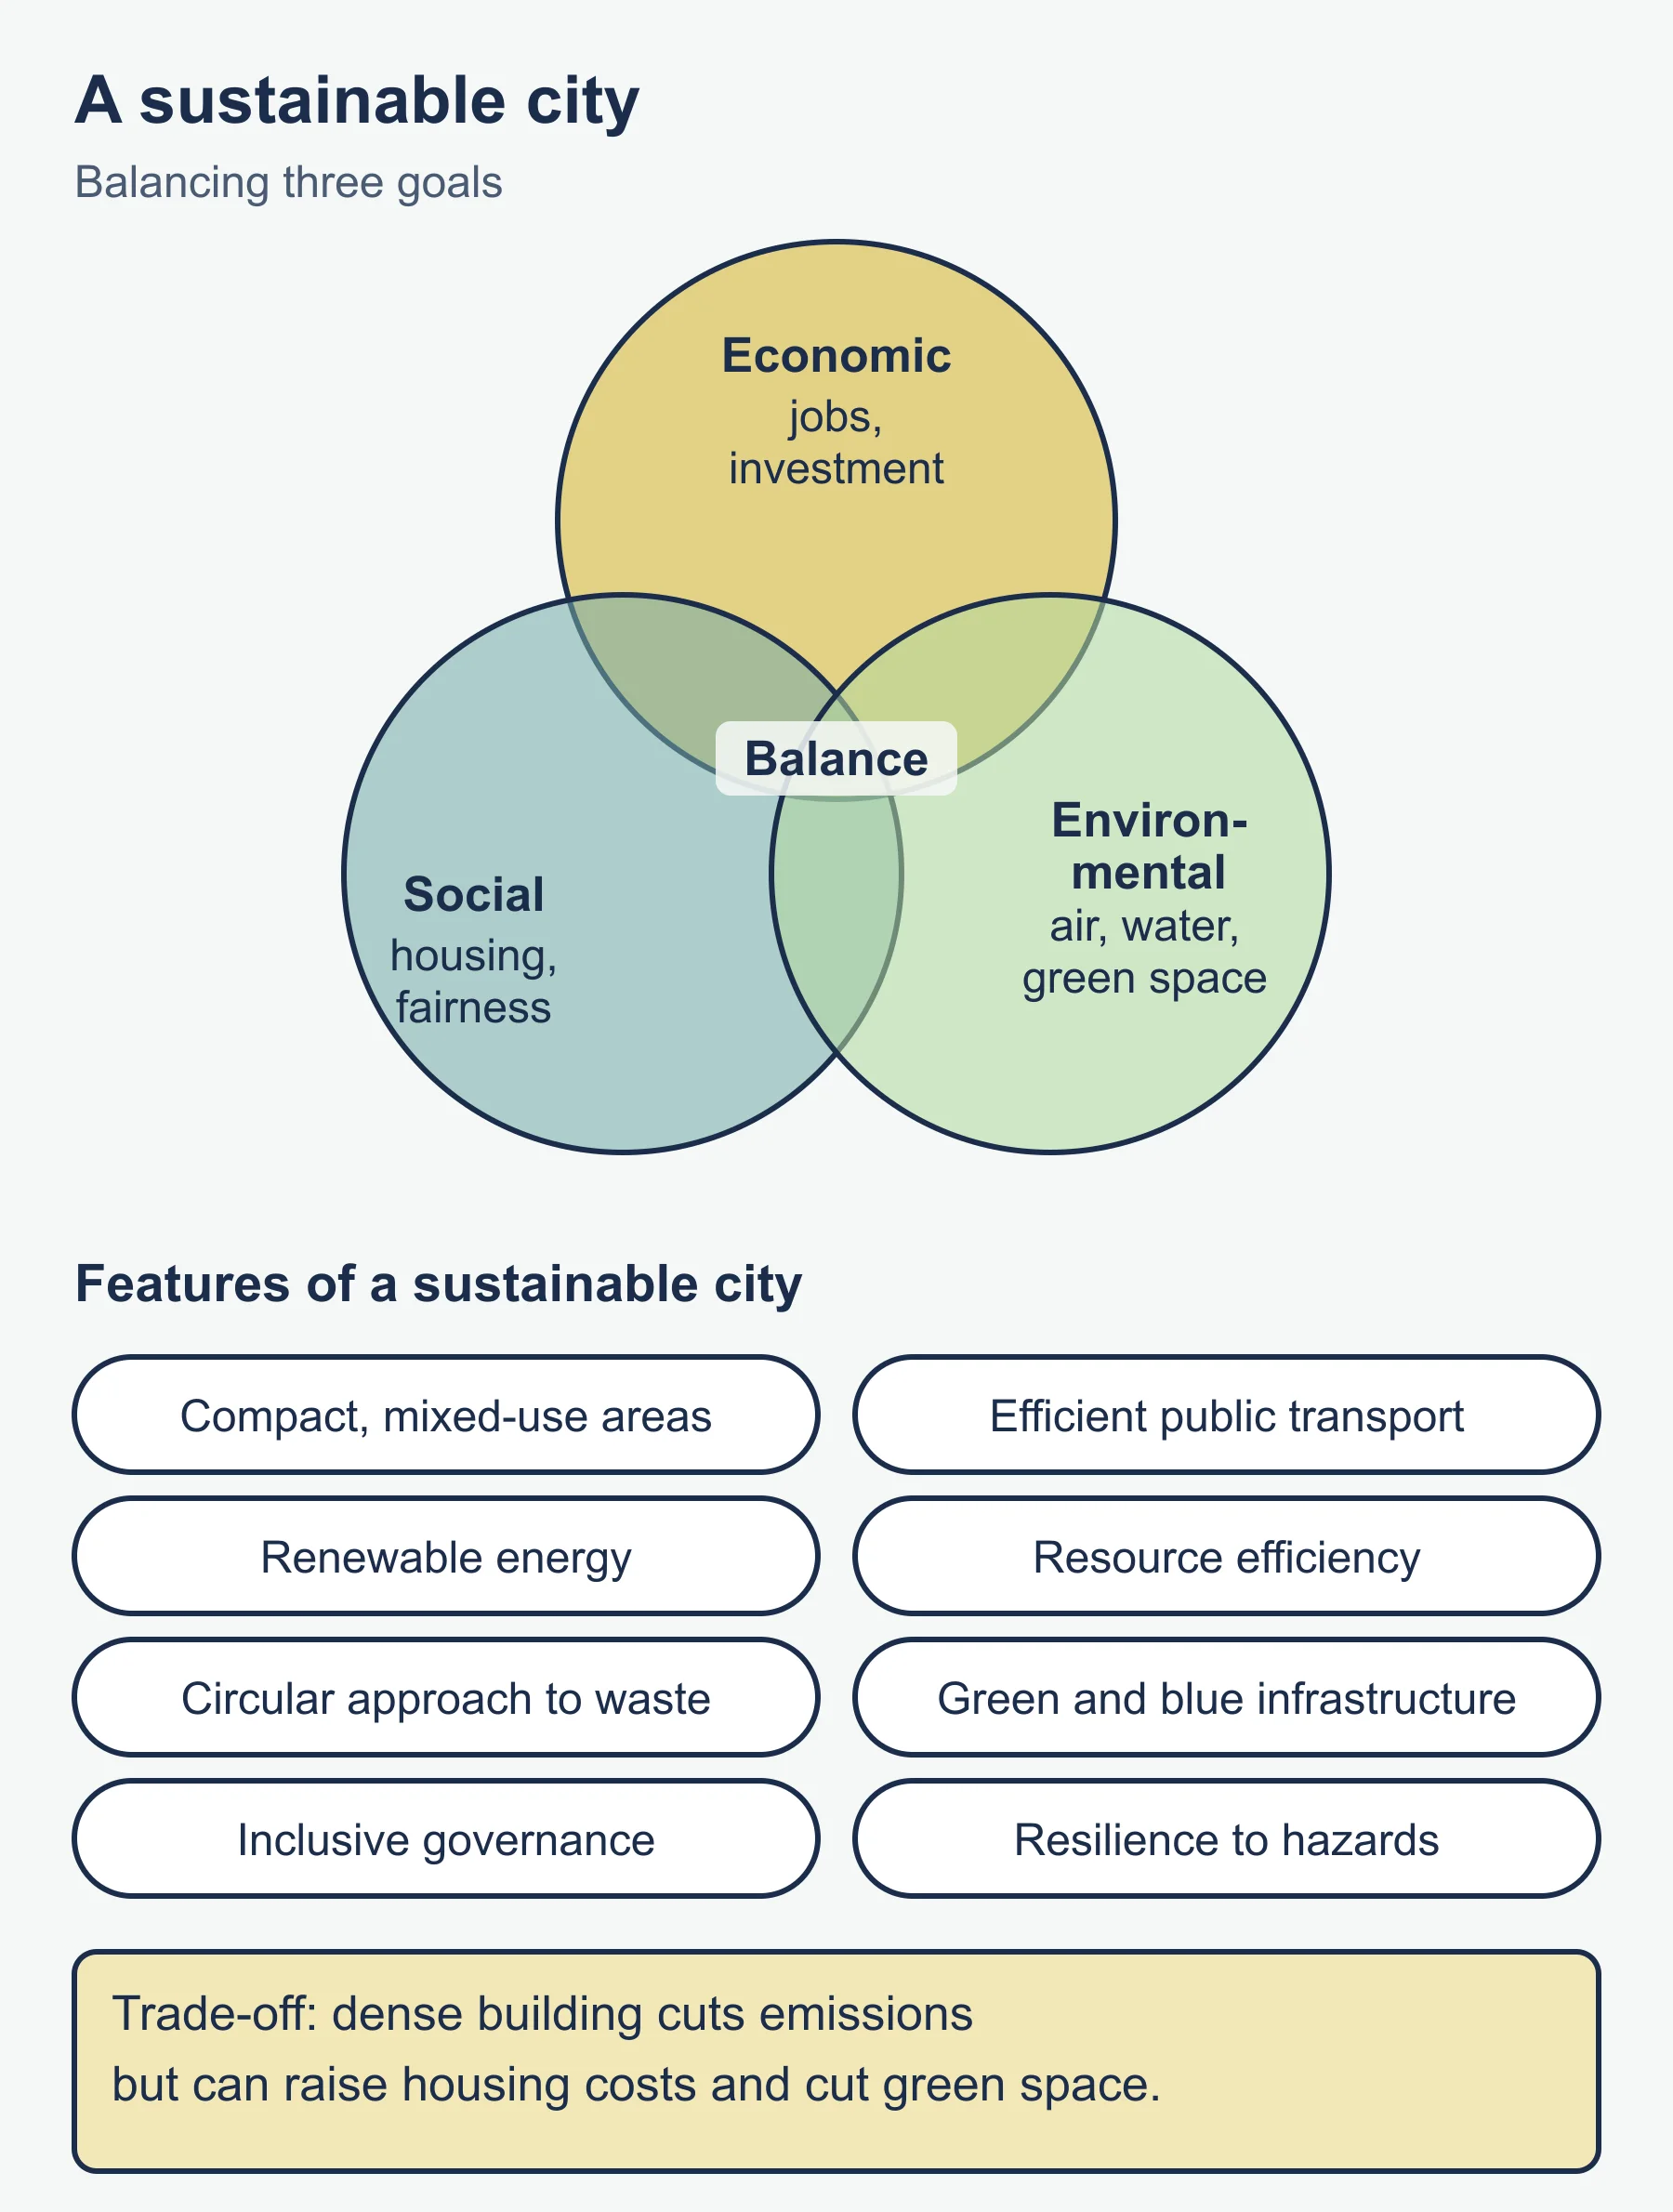
A sustainable city aims to meet present needs without harming the ability of future generations to do so, balancing economic, social and environmental goals. Features include compact, mixed-use development, efficient public transport, renewable energy, resource efficiency, circular approaches to waste, green and blue infrastructure, inclusive governance and resilience to climate and other hazards. Compare ideas such as new urbanism, transit-oriented development, eco-cities and smart-city technologies. Be critical: technology can improve efficiency, but may also raise concerns over privacy and who gets access.
International goals recognise the importance of inclusive, safe, resilient and sustainable cities. Stakeholders include national and city governments, planners, developers, businesses, community groups and residents. Participation matters, because top-down plans that ignore residents often fail. Consider future scenarios and the idea of resilience: how will a city cope with shocks such as extreme heat, floods or economic change? Strong answers weigh trade-offs, for example dense development that cuts emissions but raises housing costs or reduces green space.
Worked examples
Example 1: urban growth and doubling time
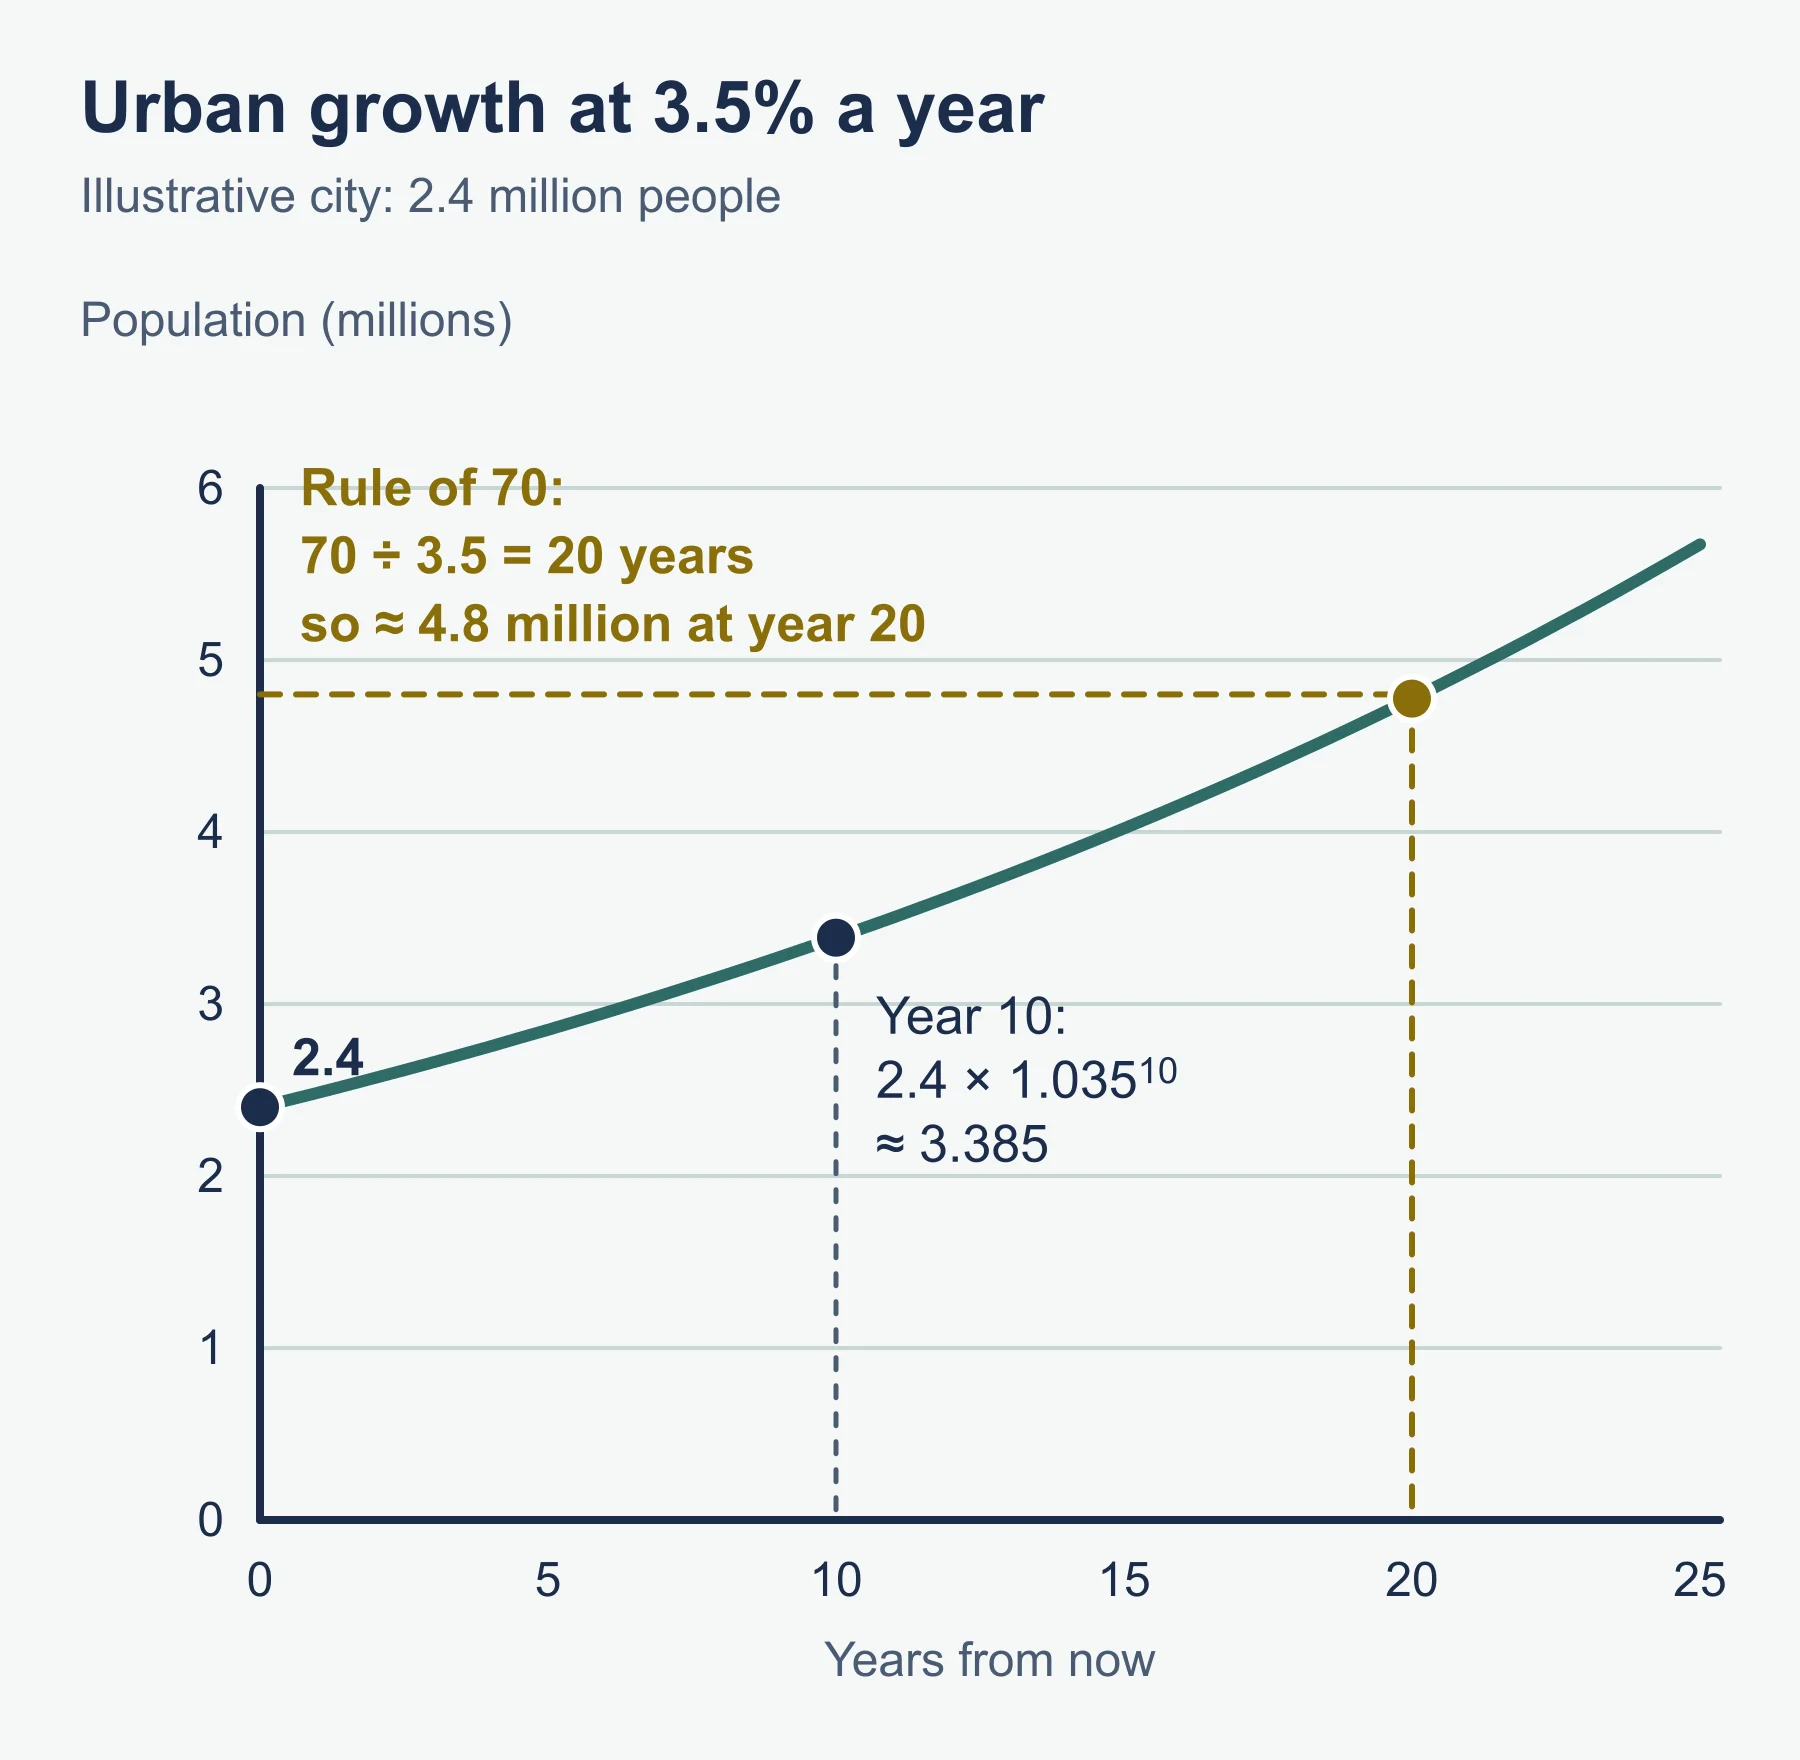
An illustrative city has 2.4 million people and grows at 3.5 per cent per year.
- Population after 10 years = 2.4 x (1.035)^10.
- (1.035)^10 is about 1.4106, so population is about 2.4 x 1.4106 = 3.385 million.
- A quick estimate of doubling time uses the rule of 70: 70 / 3.5 = 20 years.
So the city would have roughly 4.8 million people after 20 years if the rate stayed constant. In reality growth rates change, so treat this as a projection, not a forecast.
Example 2: rank-size rule
In a fictional country the largest city has 8 million people. Using the rank-size rule:
- Second city = 8 / 2 = 4 million.
- Third city = 8 / 3 = 2.67 million (to two decimal places).
- Fourth city = 8 / 4 = 2 million.
If the real second city has only 1.5 million, the country shows a primate pattern, which suggests that investment and function are concentrated in one place.
Common mistakes
- Using urbanisation and urban growth as synonyms.
- Describing models without evaluating where they do not fit.
- Treating informal settlements only as problems; they also reflect resourcefulness and need upgrading with residents.
- Presenting smart or green technology as a complete solution.
- Writing about a generic city instead of a specific place.
Exam technique
IB command terms matter: describe, explain, compare, evaluate and discuss each need different depth. Compare questions require both cities addressed together. For evaluate, set criteria such as effectiveness, cost, equity and sustainability, and reach a conclusion. Make use of any map, graph or table in the question and quote figures with units.
Check your understanding
- Define urbanisation. Answer: the increase in the proportion of a population living in towns and cities.
- State one prediction of Hoyt’s sector model. Answer: land uses develop in wedge-shaped sectors outward from the centre, often along transport routes.
- If the largest city has 6 million people, what does the rank-size rule predict for the third city? Answer: 6 / 3 = 2 million.
- Give two causes of the urban heat island. Answer: for example heat-absorbing surfaces and reduced vegetation.
- A city of 1.5 million grows 2 per cent annually. Approximate doubling time? Answer: 70 / 2 = 35 years.
- What is gentrification? Answer: the movement of wealthier residents into a formerly lower-income area, raising property prices and sometimes displacing existing residents.
- Name two features of a sustainable city. Answer: for example efficient public transport and green infrastructure.
- Why might top-down urban plans fail? Answer: they may ignore residents’ needs, lack local support or fail to address inequality.
Get free revision emails (optional)
Occasional emails with practice questions, worked explanations and links to free resources for the qualification and subjects you choose. No spam, and you can unsubscribe from any email. The free tools on this site never need an email.
Related resources
-
Revision notes
How DP Geography Is Assessed: Revision Notes
Condensed recall notes on the assessment structure at SL and HL – papers, weightings, timings and the fieldwork investigation – for IB Diploma Programme Geography.
Geography · International Baccalaureate · IB
Revise topic -
Exam preparation
IB DP Geography: Paper-by-Paper Exam Preparation
Paper-by-paper exam preparation for IB Diploma Programme Geography – timing strategy for each paper, confirming your school's optional themes, a worked resource-based question and a before/during-exam checklist.
Geography · International Baccalaureate · IB
Read guide -
Study guides
IB DP Geography Core: Global Climate – Vulnerability and Resilience
Causes, consequences and responses – including vulnerability, resilience, adaptation and mitigation – in the compulsory Global Climate core theme of IB Diploma Programme Geography, examined in Paper 2 for every student regardless of which options a school teaches.
Geography · International Baccalaureate · IB
Read guide
Related articles
-
teaching
A Level tuition in Dubai: Cambridge or Pearson Edexcel International A Level?
Schools in Dubai and Abu Dhabi teach either Cambridge International AS & A Level or Pearson Edexcel International A Level. How the two are structured, why it matters for tuition, and how online classes from Lahore work.
9 October 2026
-
curriculum guides
Choosing subjects at IGCSE and A Level
How subject choices at 14 and 16 affect university options later, and how to keep pathways open without overloading a timetable.
28 July 2026
Studying this with a teacher
Working through Geography IB?
This page is free and stays free. Marlbridge is not offering Geography classes at the moment, so there is no tuition to book for it. The free study resources stay open to everyone.