Study Guides
IGCSE Accounting: Calculating and interpreting accounting ratios (Cambridge 0452)
Study guide to calculating and interpreting the ten accounting ratios with a two-year worked example, for Cambridge IGCSE Accounting 0452, 6.1-6.2.
- Subject
- Accounting
- Level
- IGCSE, O LEVELS
- Topic
- Analysis and interpretation
- Author
- Marlbridge Academic Team
- Updated
- Reviewed by
- Javaid Iqbal Sabri (what this means)
Aligned to Cambridge IGCSE O Level Accounting (0452, 7707), 2027-2029. Official specification (IGCSE) ; Official specification (O Level) .
Syllabus page (what it covers and how it is assessed): Cambridge IGCSE Accounting; Cambridge O Level Accounting.
Syllabus points this page covers
0452
- 6.1 Calculation and understanding of accounting ratios
- 6.2 Interpretation of accounting ratios
7707
- 6.1 Calculation and understanding of accounting ratios
- 6.2 Interpretation of accounting ratios
Found an error? Report a correction.
Want a teacher for this? Marlbridge teaches Accounting online. Request a free trial class.
Syllabus edition note. This resource follows the Cambridge IGCSE Accounting 0452 syllabus (and Cambridge O Level Accounting 7707, which has the same subject content for the same series) for exams in 2027, 2028 and 2029 (version 1), first examined in the March 2027 series in India and the June 2027 series elsewhere. If you sit 0452 in November 2026, you sit the 2026 syllabus (version 2), which differs: Paper 1 has 35 multiple-choice marks in 1 hour 15 minutes, not 40 marks in 1 hour 30 minutes; Topic 7 is “Accounting principles and policies”, without 7.2 Ethical considerations or 7.3 Technology and sustainability; 4.4 is “Irrecoverable debts and provision for doubtful debts”; income statements are named instead of statements of profit or loss; three-column running balance accounts are not required; Clubs and societies is 5.4 and Manufacturing accounts 5.5; and 6.3 is “Inter-firm comparison”. For this topic, the 2026 syllabus lists eight ratios without inventory turnover in days (mark-up appears only in its ratio appendix), names ROCE’s numerator “net profit before interest”, lists interested parties as owners, managers, trade payables, banks, investors, club members and others such as governments and tax authorities, and gives the limitations of accounting statements as historic cost, difficulties of definition and non-financial aspects. If you sit in November 2026, work from the 2026 syllabus on the Cambridge International website.
This guide covers syllabus sections 6.1 (Calculation and understanding of accounting ratios) and 6.2 (Interpretation of accounting ratios) of the Cambridge IGCSE Accounting syllabus (0452, version 1) for exams in 2027, 2028 and 2029. The syllabus text divides no content by tier. It adds a new worked example to the wider Analysis and interpretation guide, which also covers 6.3 to 6.5. Use it with the revision notes, the practice questions, the free diagnostics, the course hub and the printable checklist.
Where each syllabus point is taught
| Syllabus point | Section below |
|---|---|
| 6.1 The ten ratios and their formulas | 1 and 2 |
| 6.2 Statements comparing different years | 3 |
| 6.2 Interpreting the 6.1 ratios | 4 |
| 6.2 Suggestions for profitability, liquidity and working capital | 5 |
| 6.2 Profit indicators; what changes gross profit and profit | 6 |
| 6.2 Reasons for the difference between cash and profit | 7 |
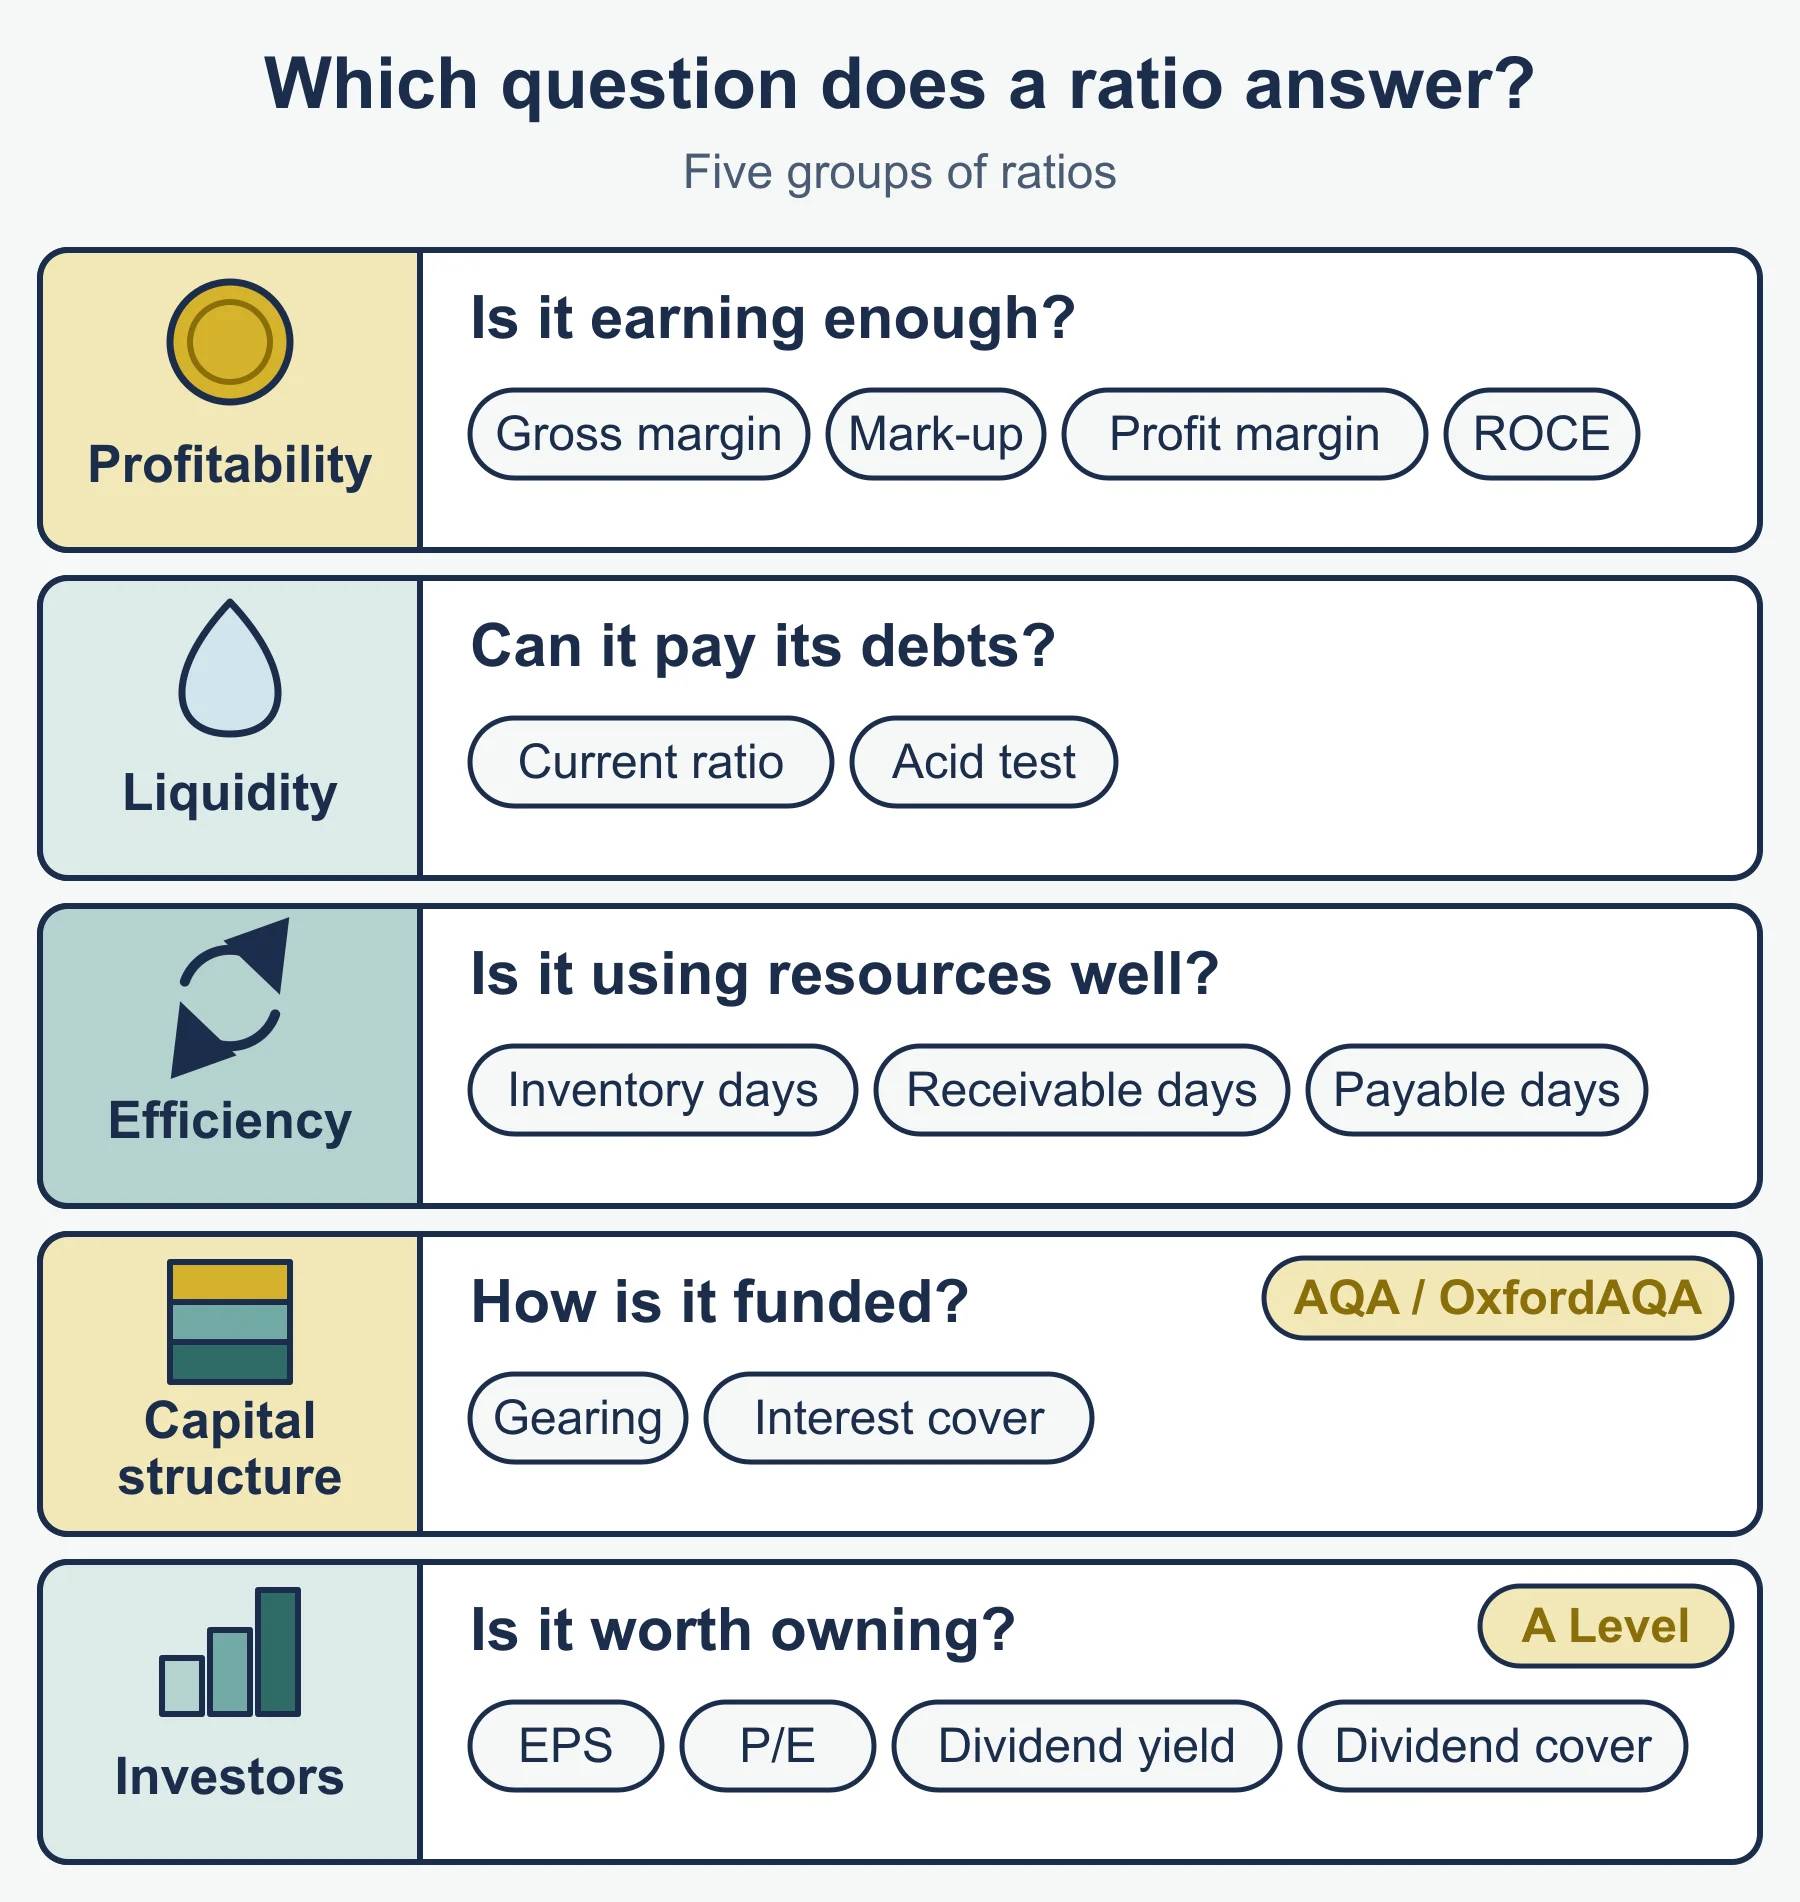
1. The ten ratios
The syllabus says the formulas in its ratio list are the only ones accepted in answers, so learn them exactly.
| Ratio | Formula | Show the answer as |
|---|---|---|
| Gross profit margin | gross profit / revenue x 100 | % |
| Mark-up | gross profit / cost of sales x 100 | % |
| Profit margin | profit for the year / revenue x 100 | % |
| ROCE (return on capital employed) | profit for the year before interest / capital employed x 100 | % |
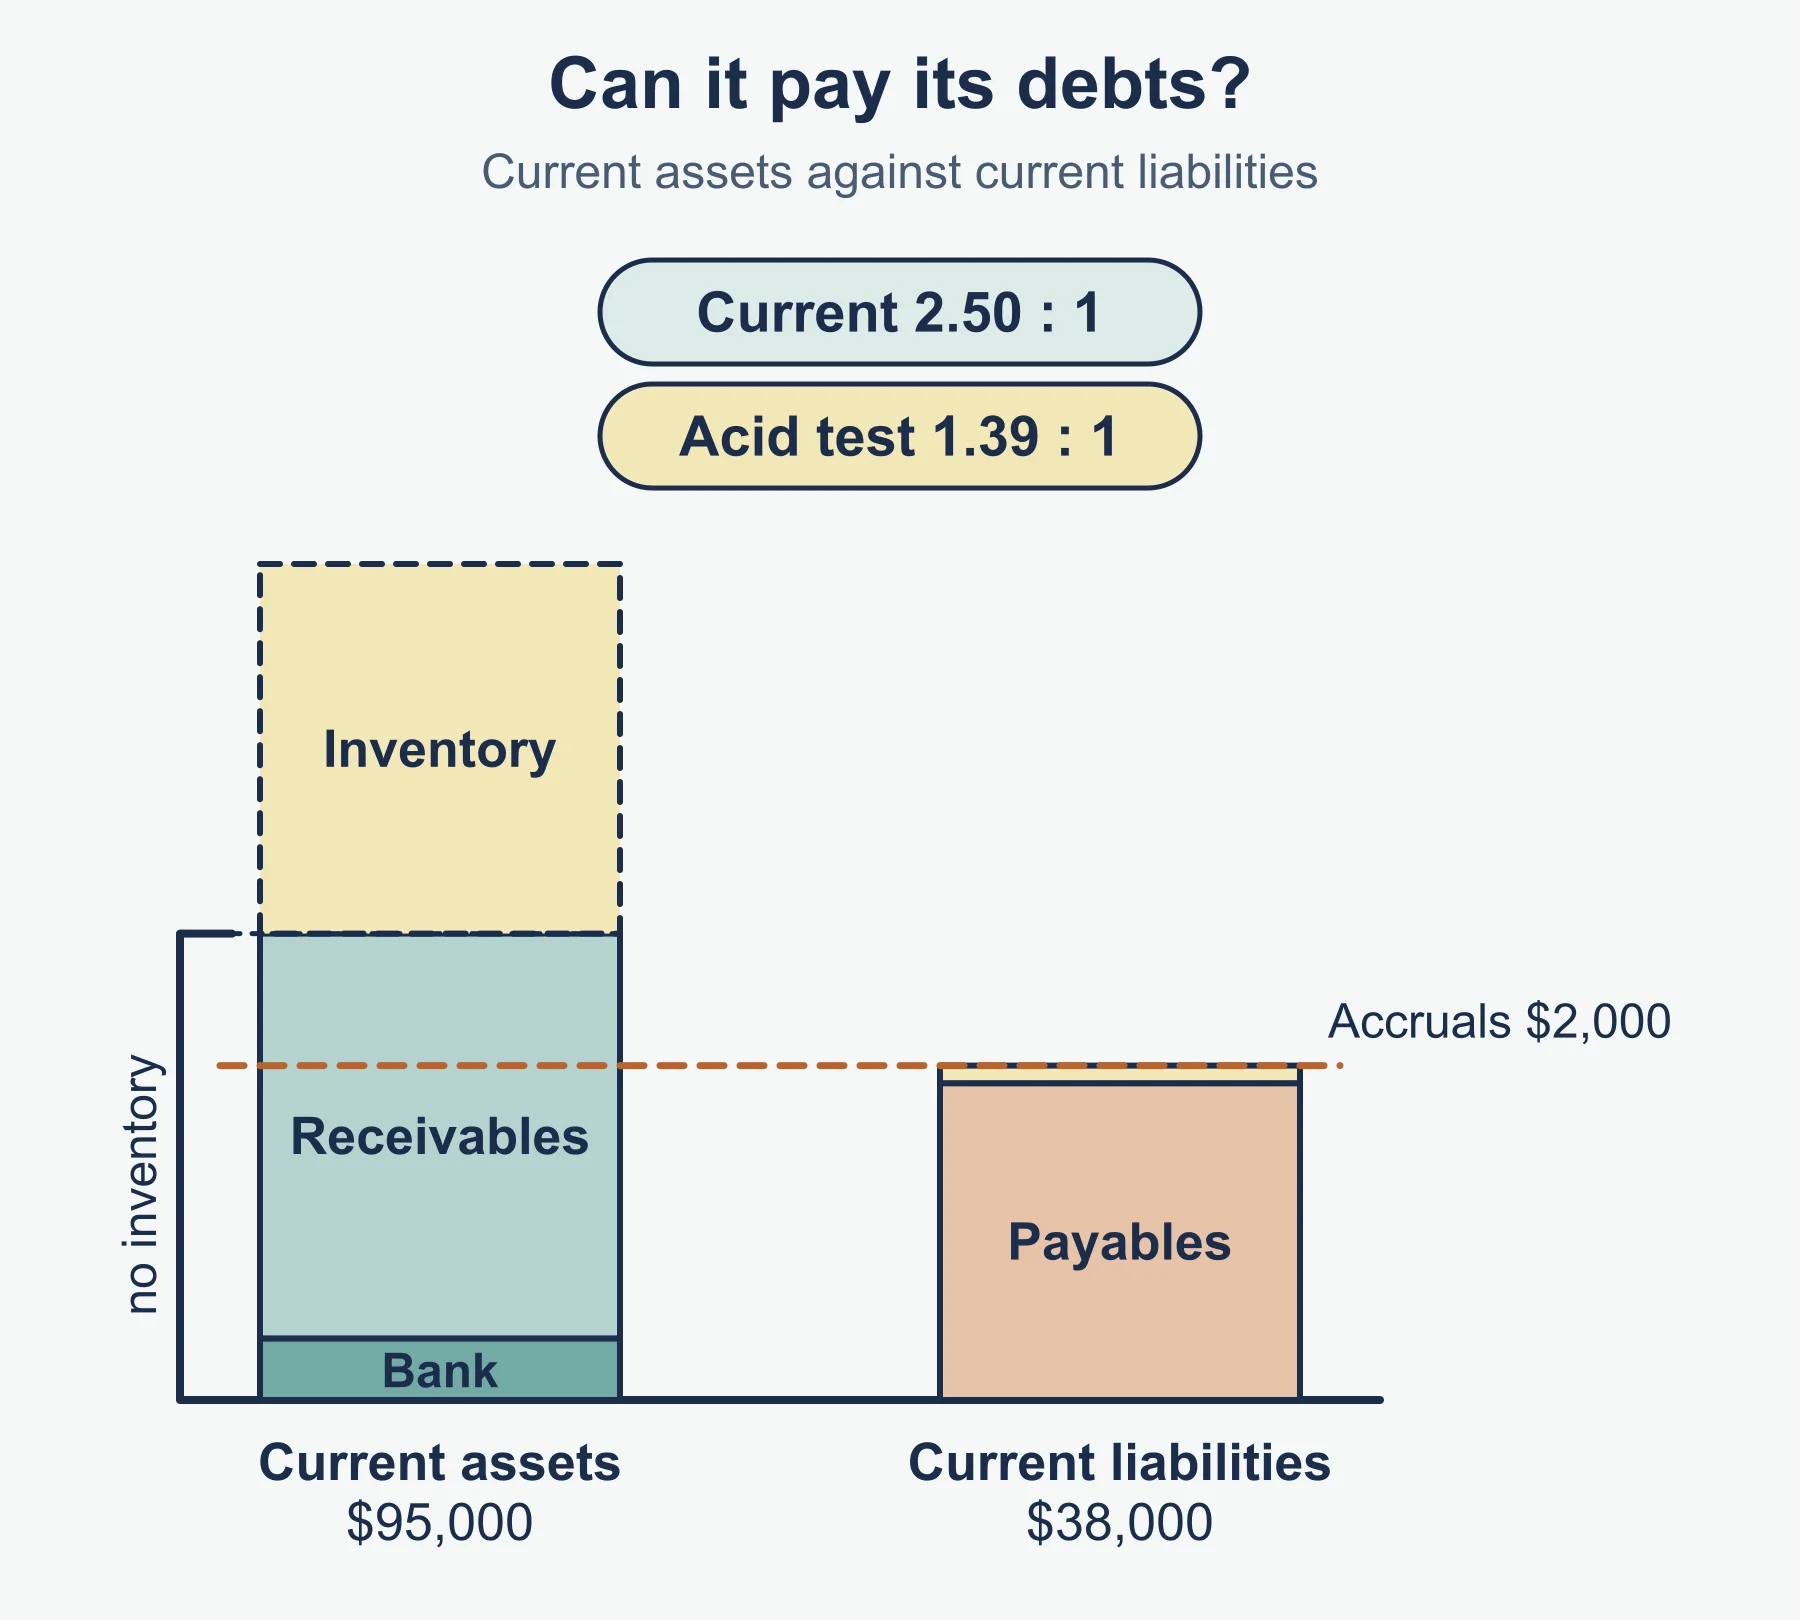
| Current (working capital) ratio | current assets : current liabilities | a ratio, such as 2.50 : 1 |
| Acid test (liquid) ratio | (current assets - inventory) : current liabilities | a ratio |
| Rate of inventory turnover | cost of sales / average inventory | times |
| Inventory turnover | average inventory / cost of sales x 365 | days |
| Trade receivables turnover | trade receivables / credit sales x 365 | days |
| Trade payables turnover | trade payables / credit purchases x 365 | days |
- Average inventory is opening inventory plus closing inventory, divided by 2. Both inventory ratios use it.
- Credit figures. If a question gives total revenue and cash sales, subtract to find credit sales. Do the same for purchases.
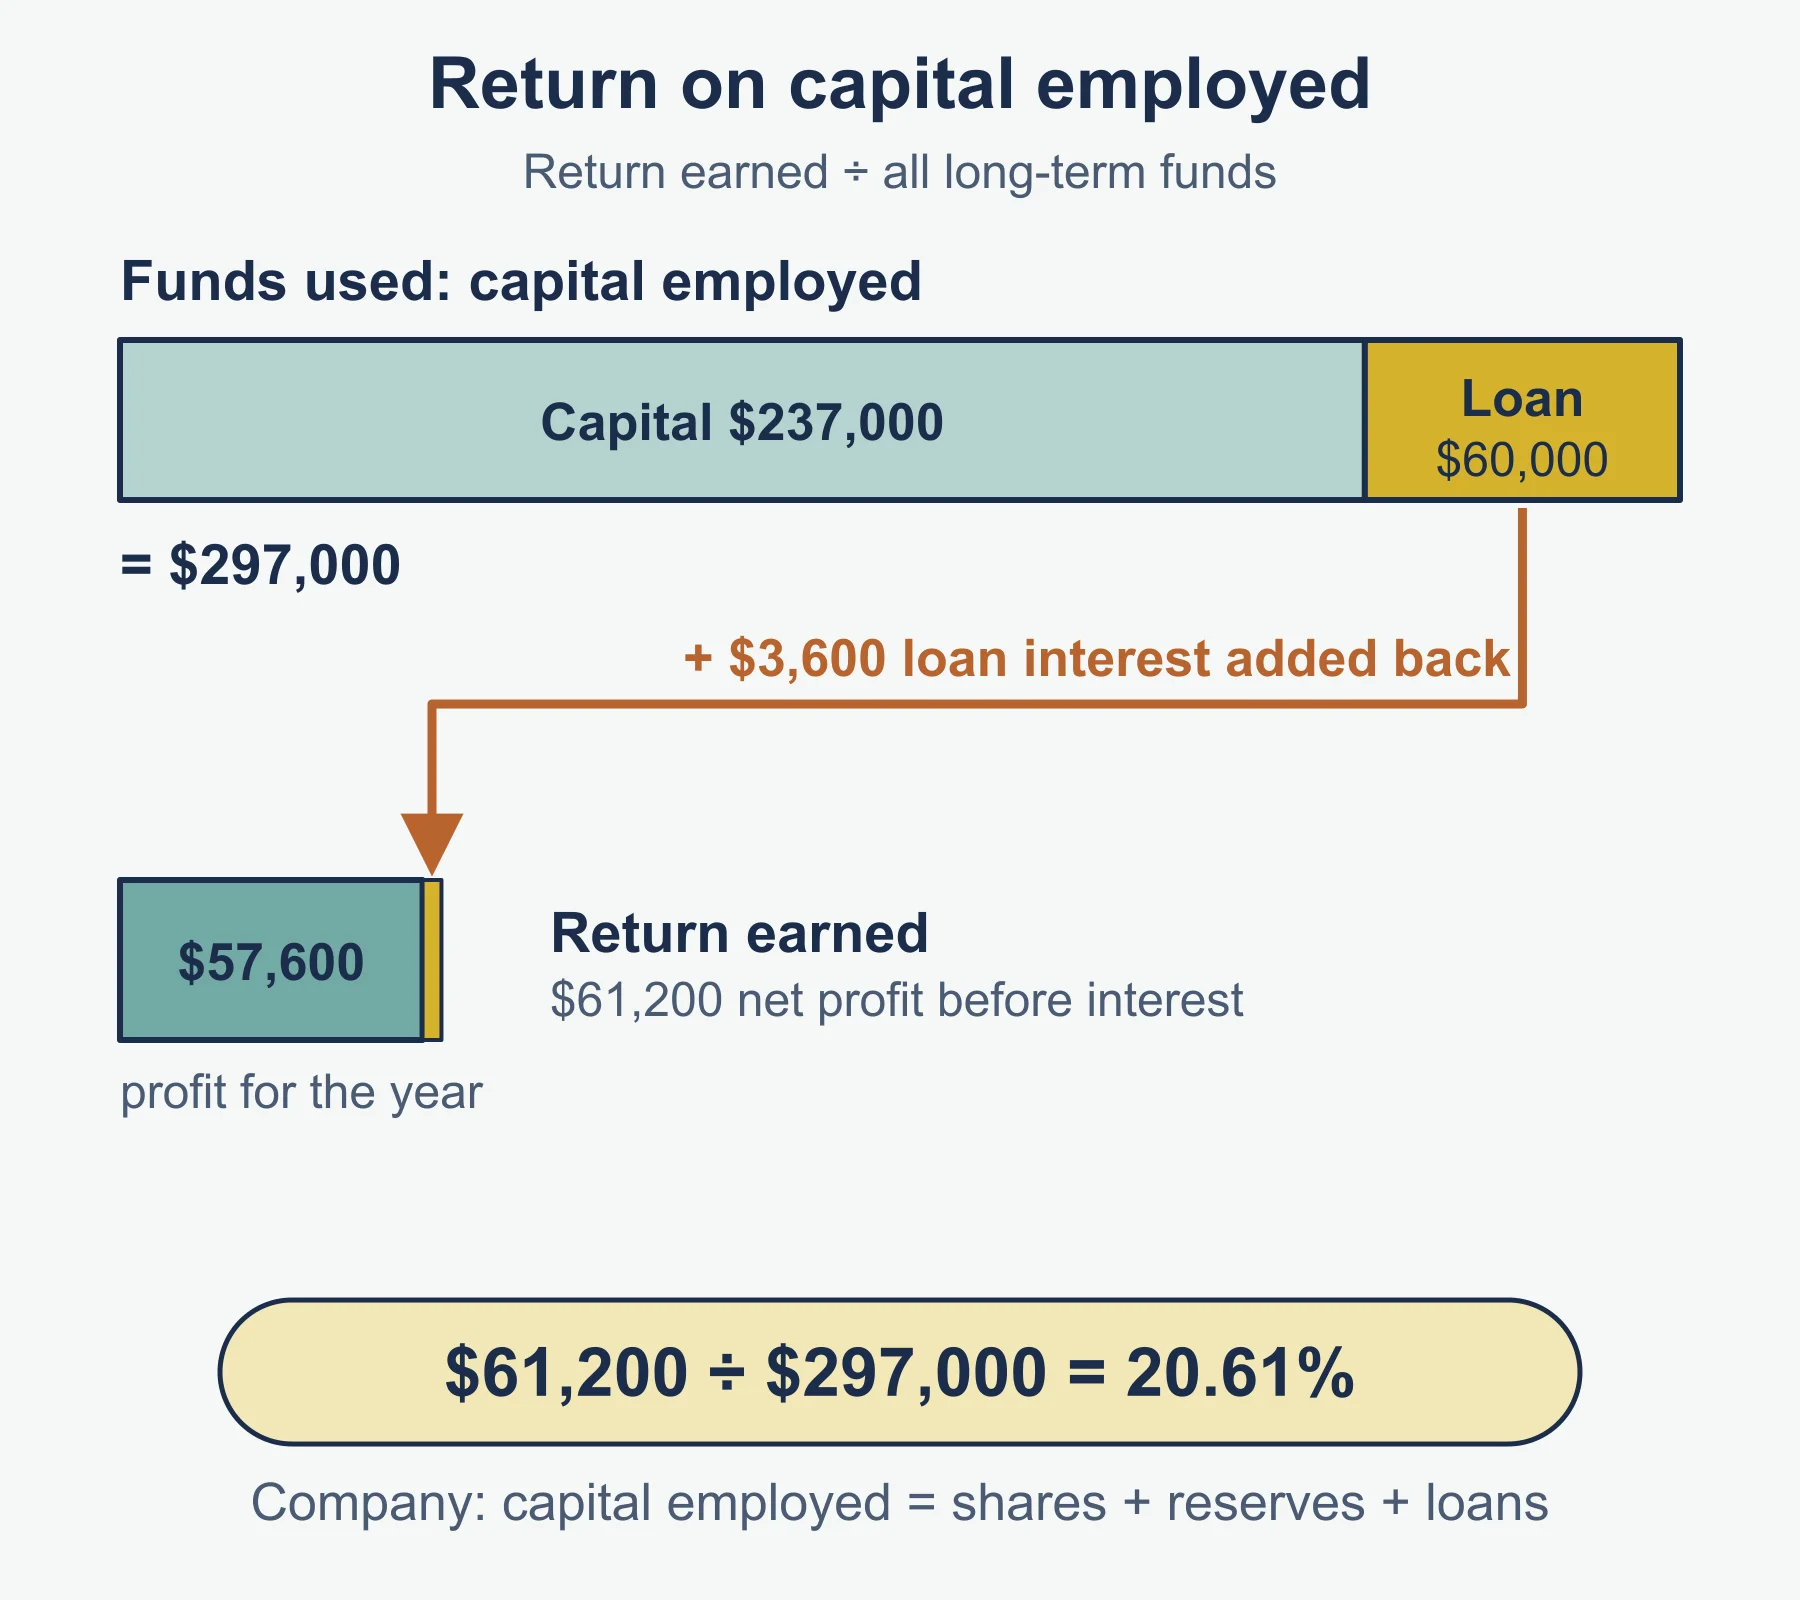
- Capital employed is issued shares plus reserves plus non-current liabilities. Reserves include a general reserve and retained earnings. As a check, it equals total assets less current liabilities.
- ROCE adds interest on the non-current liabilities back to profit for the year, because the lenders’ capital is in the denominator.
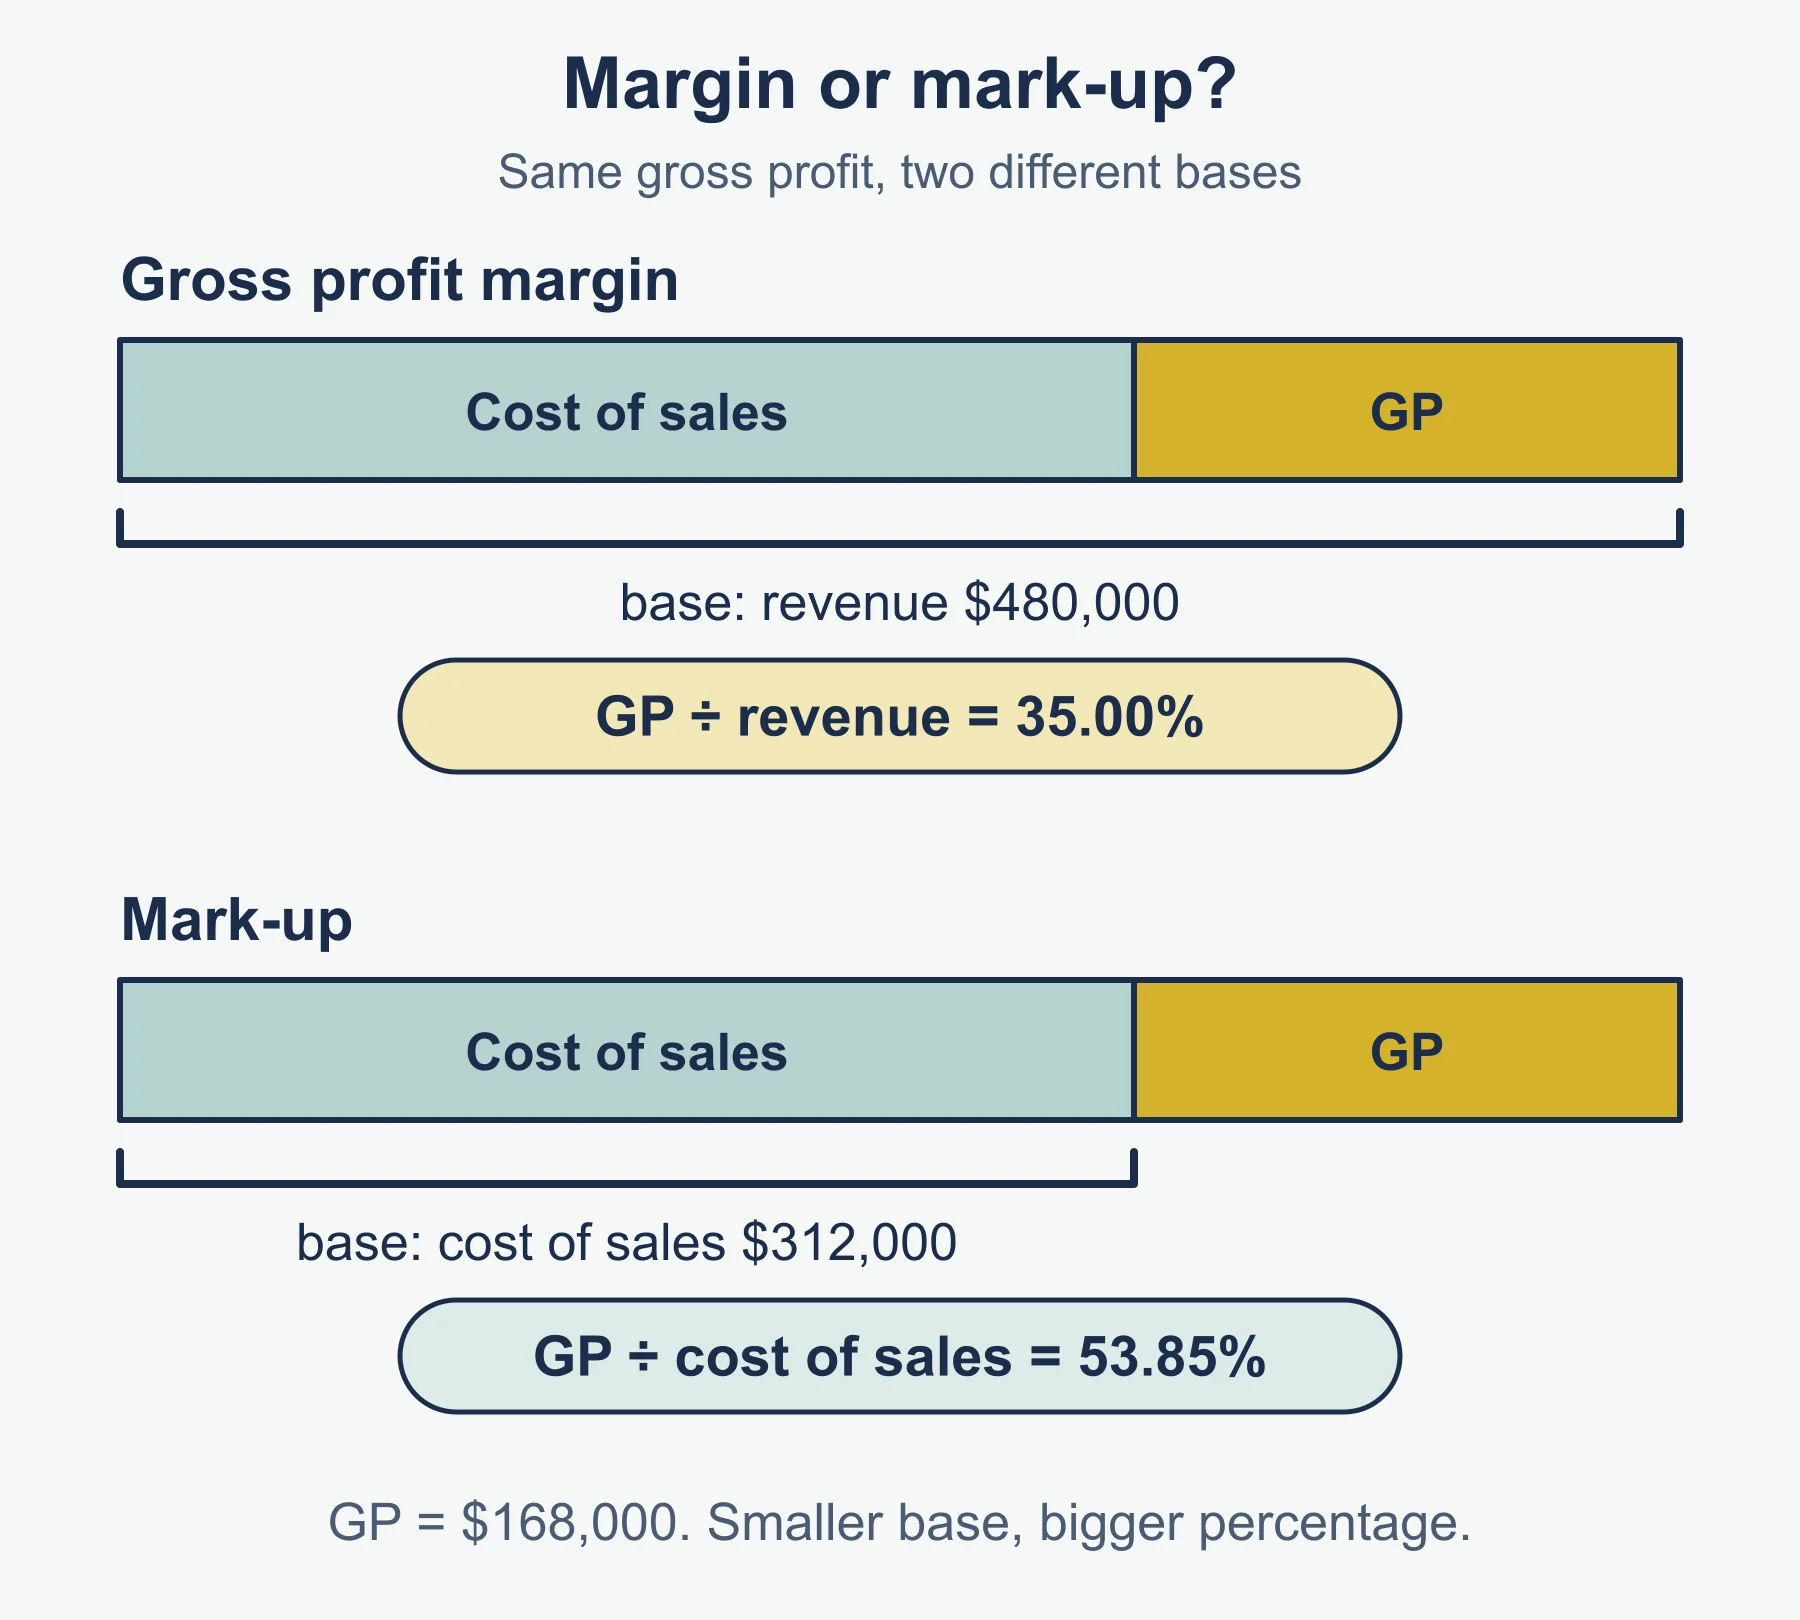
- Margin and mark-up share one gross profit but divide by different figures. Cost of sales is smaller than revenue, so mark-up is the larger percentage.
This guide gives every answer to 2 decimal places.
2. Worked example: Ferndale Paints Limited
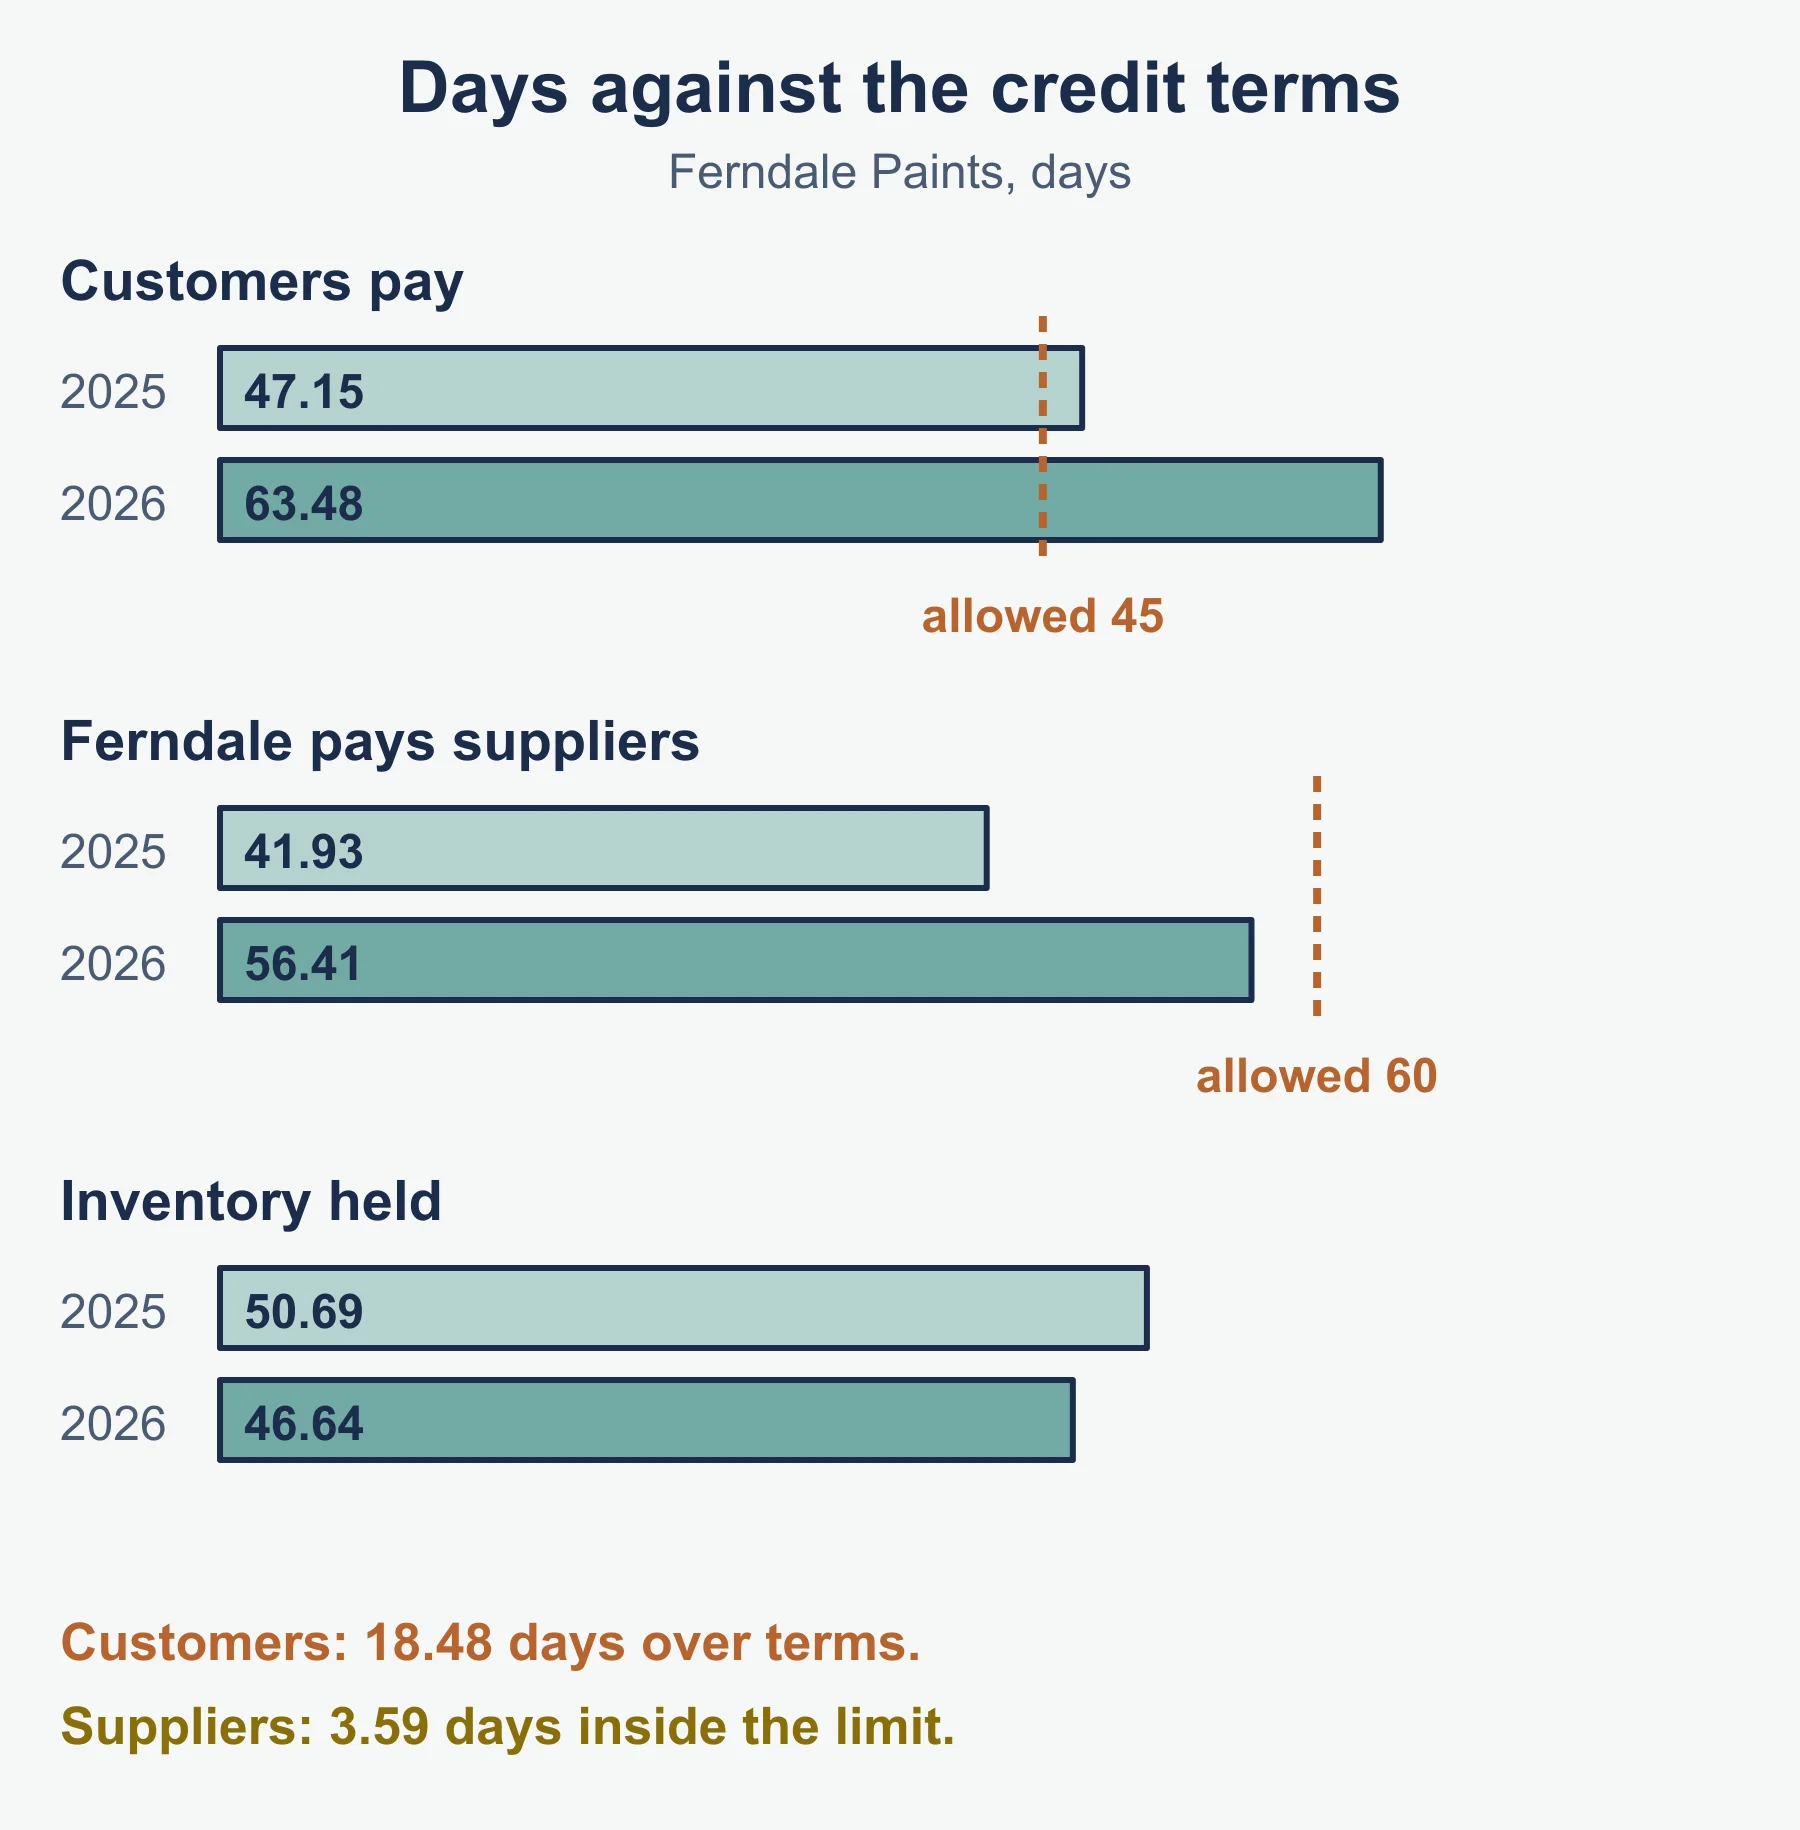
Ferndale Paints Limited is a paint wholesaler with a 30 September year end. From October 2025 it won lower prices from its main supplier, kept selling prices unchanged, opened an online shop and tightened inventory control. It allows trade customers 45 days to pay and receives 60 days’ credit from suppliers. Credit sales were 480,000 (2025) and 552,000 (2026); credit purchases were 296,000 and 330,000. In 2026 it borrowed a further 40,000 at 7%, bought vehicles and equipment, and paid dividends of 25,000. Depreciation of 45,000 is included in the 2026 expenses. All figures are in $.
Statement of profit or loss, year ended 30 September
                                      2025        2026
Revenue                            600,000     690,000
Opening inventory                   45,000      55,000
Purchases                          370,000     396,000
Closing inventory                  (55,000)    (48,000)
Cost of sales                      360,000     403,000
Gross profit                       240,000     287,000
Other income                         6,000       6,000
Expenses                          (168,000)   (214,000)
Loan interest                       (5,600)     (8,400)
Profit for the year                 72,400      70,600

Statement of financial position at 30 September
Non-current assets                 330,000     411,200
Inventory                           55,000      48,000
Trade receivables                   62,000      96,000
Other receivables                    3,000       4,000
Bank                                14,000       9,000
Current assets                     134,000     157,000
Trade payables                      34,000      51,000
Other payables                       6,400       8,000
Current liabilities                 40,400      59,000
Net current assets                  93,600      98,000
7% bank loan (non-current)          80,000     120,000
Net assets                         343,600     389,200
Ordinary shares                    250,000     250,000
General reserve                     40,000      40,000
Retained earnings                   53,600      99,200
Equity                             343,600     389,200
The ratios, with the working shown:
Ratio                 2025                                2026
Gross profit margin   240,000/600,000 x 100 = 40.00%      287,000/690,000 x 100 = 41.59%
Mark-up               240,000/360,000 x 100 = 66.67%      287,000/403,000 x 100 = 71.22%
Profit margin         72,400/600,000 x 100 = 12.07%       70,600/690,000 x 100 = 10.23%
ROCE                  (72,400+5,600)/423,600 x 100        (70,600+8,400)/509,200 x 100
                      = 78,000/423,600 = 18.41%           = 79,000/509,200 = 15.51%
Capital employed      250,000+93,600+80,000 = 423,600     250,000+139,200+120,000 = 509,200
Current ratio         134,000 : 40,400 = 3.32 : 1         157,000 : 59,000 = 2.66 : 1
Acid test             79,000 : 40,400 = 1.96 : 1          109,000 : 59,000 = 1.85 : 1
Average inventory     (45,000+55,000)/2 = 50,000          (55,000+48,000)/2 = 51,500
Inventory turns       360,000/50,000 = 7.20 times         403,000/51,500 = 7.83 times
Inventory days        50,000/360,000 x 365 = 50.69        51,500/403,000 x 365 = 46.64
Receivables days      62,000/480,000 x 365 = 47.15        96,000/552,000 x 365 = 63.48
Payables days         34,000/296,000 x 365 = 41.93        51,000/330,000 x 365 = 56.41
3. Comparing different years
Put the years side by side with the change in each line.
| Item | 2025 | 2026 | Change | % change |
|---|---|---|---|---|
| Revenue | 600,000 | 690,000 | +90,000 | +15.00% |
| Cost of sales | 360,000 | 403,000 | +43,000 | +11.94% |
| Gross profit | 240,000 | 287,000 | +47,000 | +19.58% |
| Other income | 6,000 | 6,000 | 0 | 0.00% |
| Expenses | 168,000 | 214,000 | +46,000 | +27.38% |
| Loan interest | 5,600 | 8,400 | +2,800 | +50.00% |
| Profit for the year | 72,400 | 70,600 | -1,800 | -2.49% |
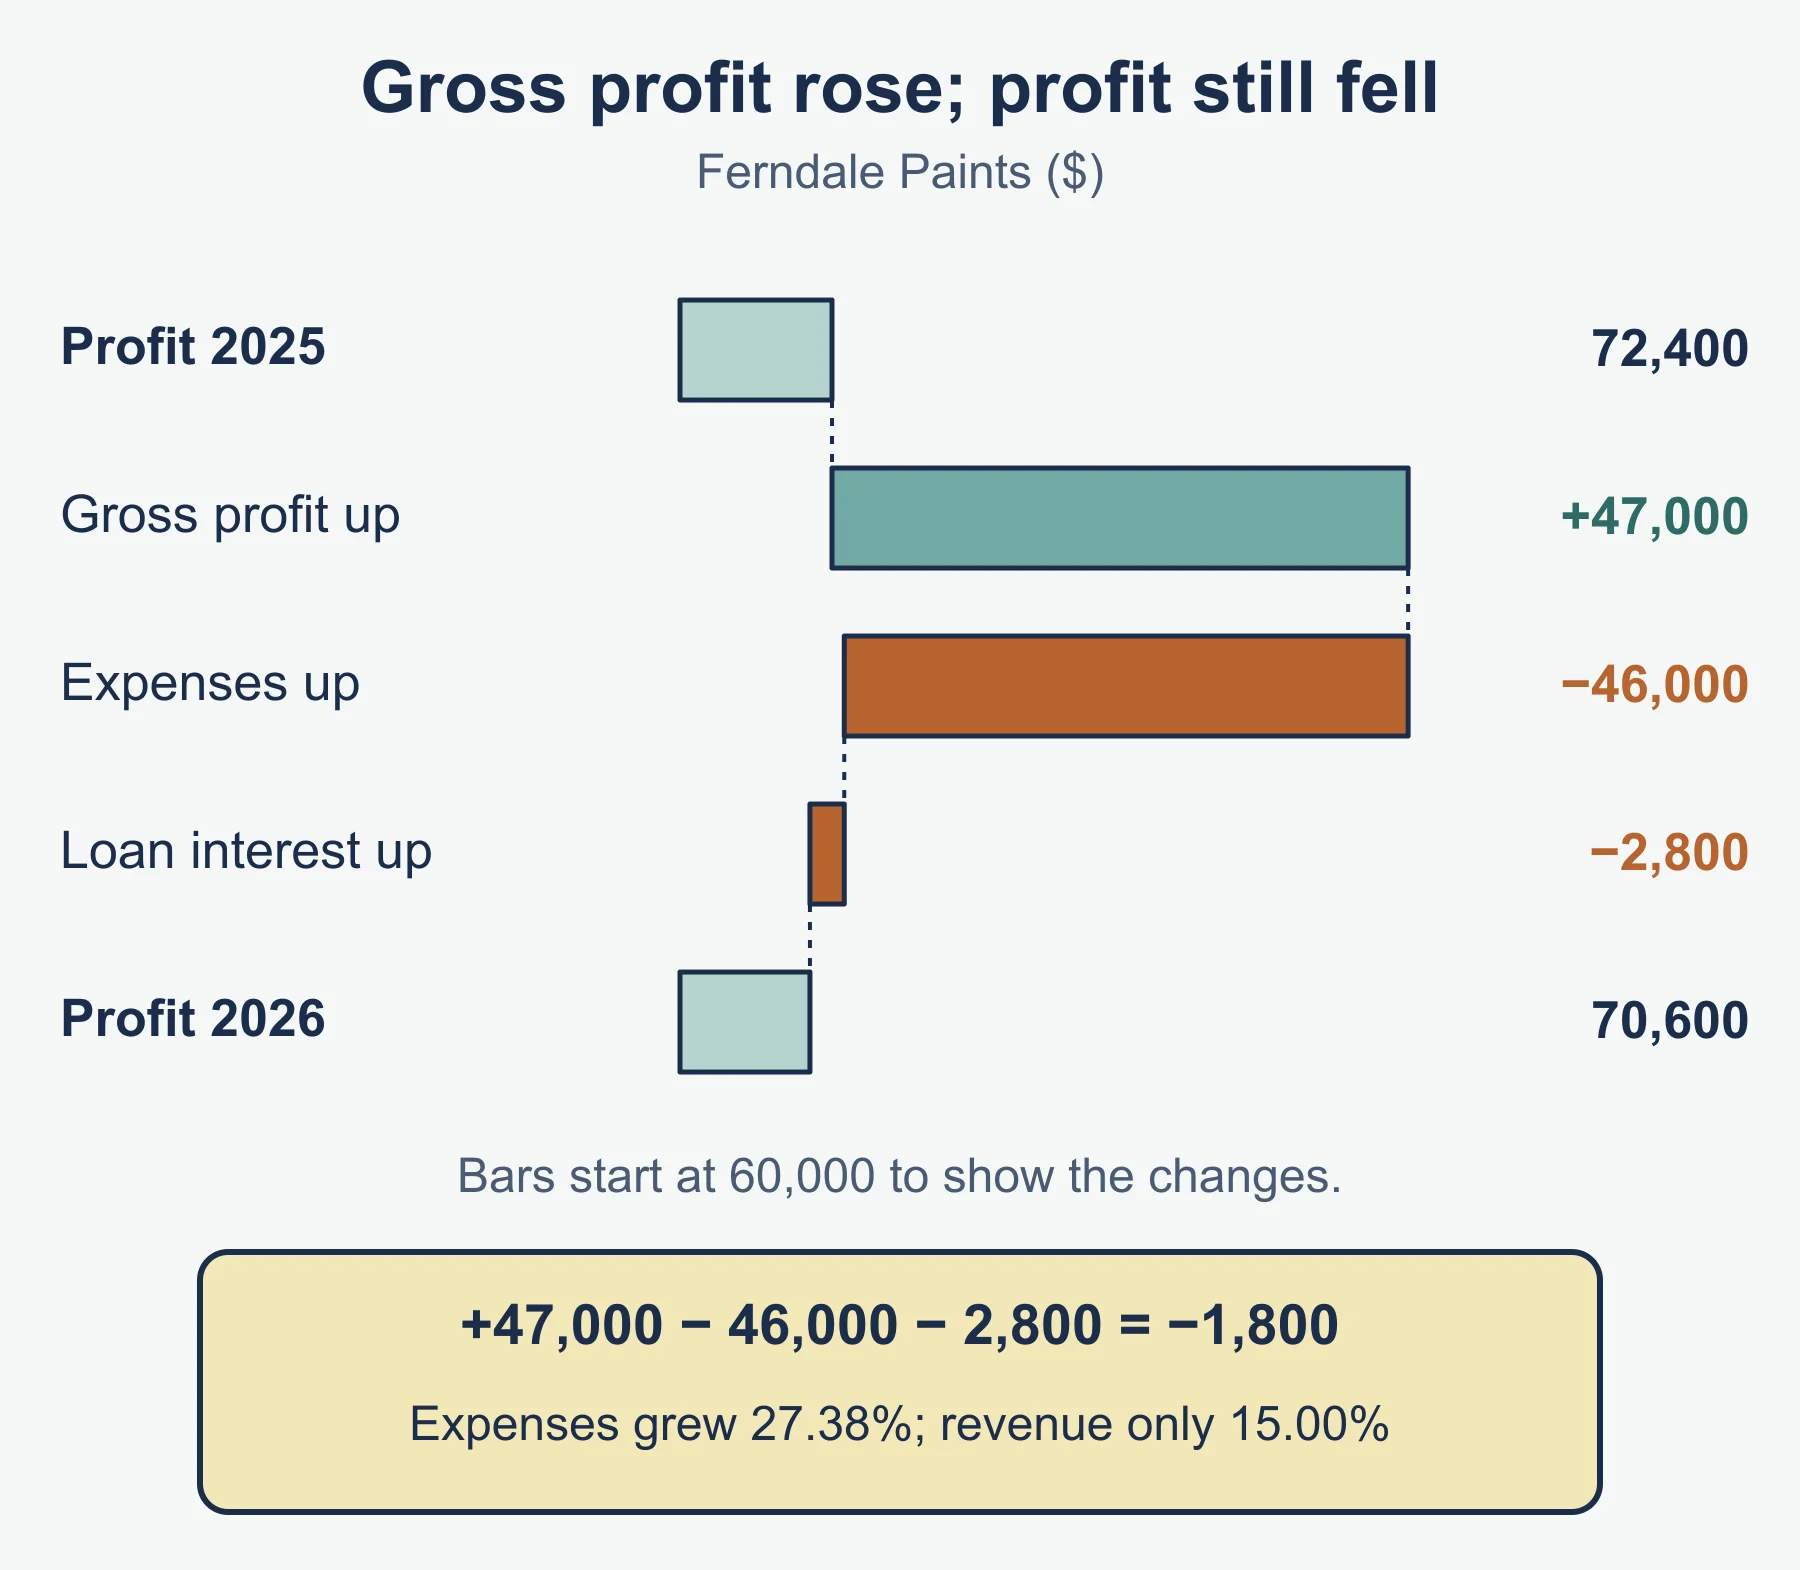
Profit for the year fell by 1,800 even though gross profit rose by 47,000: 47,000 + 0 - 46,000 - 2,800 = -1,800.
4. Interpreting the ratios
Write each comment in three parts: the ratio with both figures, the reason from the scenario, and what it means for the business.
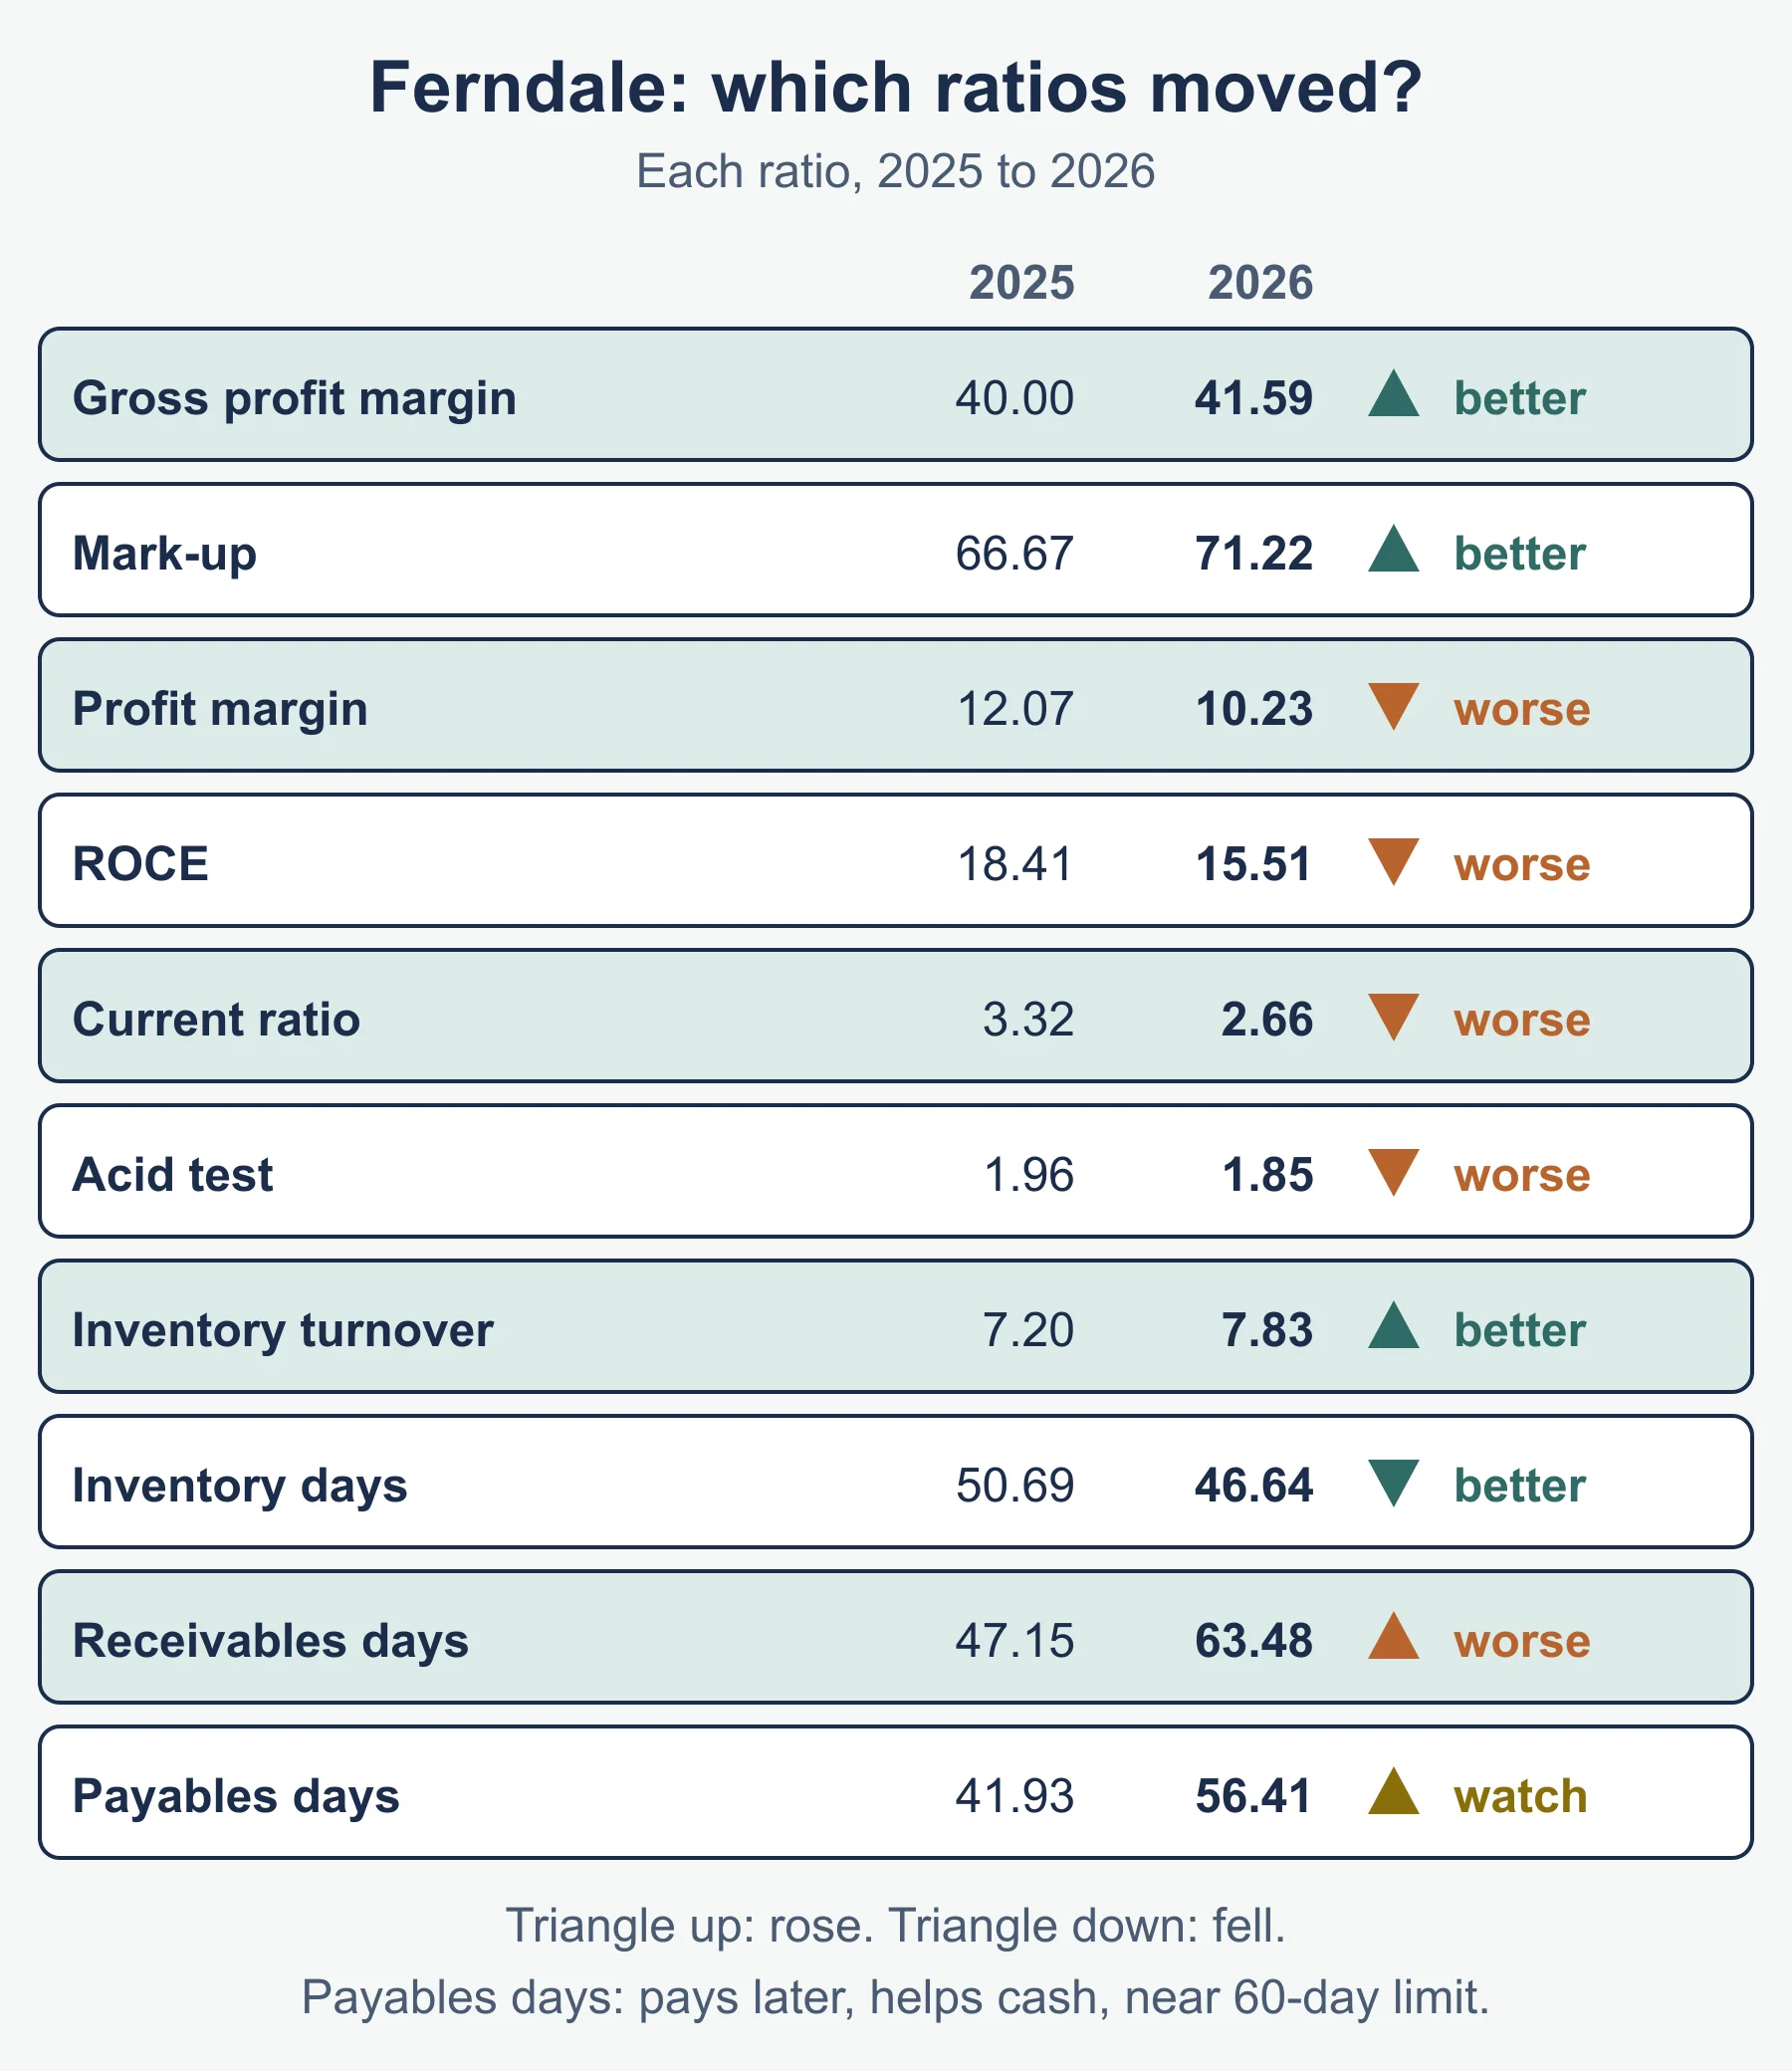
- Gross profit margin and mark-up rose from 40.00% to 41.59% and from 66.67% to 71.22%. Selling prices were unchanged but purchase prices fell, so each $100 of revenue left more gross profit.
- Profit margin fell from 12.07% to 10.23%. Expenses rose from 28.00% to 31.01% of revenue, which absorbed the better gross profit.
- ROCE fell from 18.41% to 15.51%. Profit before interest rose by only 1,000 while capital employed rose by 85,600 (20.21%). The new loan and retained profit have not yet earned a matching return.
- Current ratio and acid test fell from 3.32 : 1 to 2.66 : 1 and from 1.96 : 1 to 1.85 : 1. Current liabilities rose by 46.04% and current assets by less. Both still cover current liabilities, but the direction is downward.
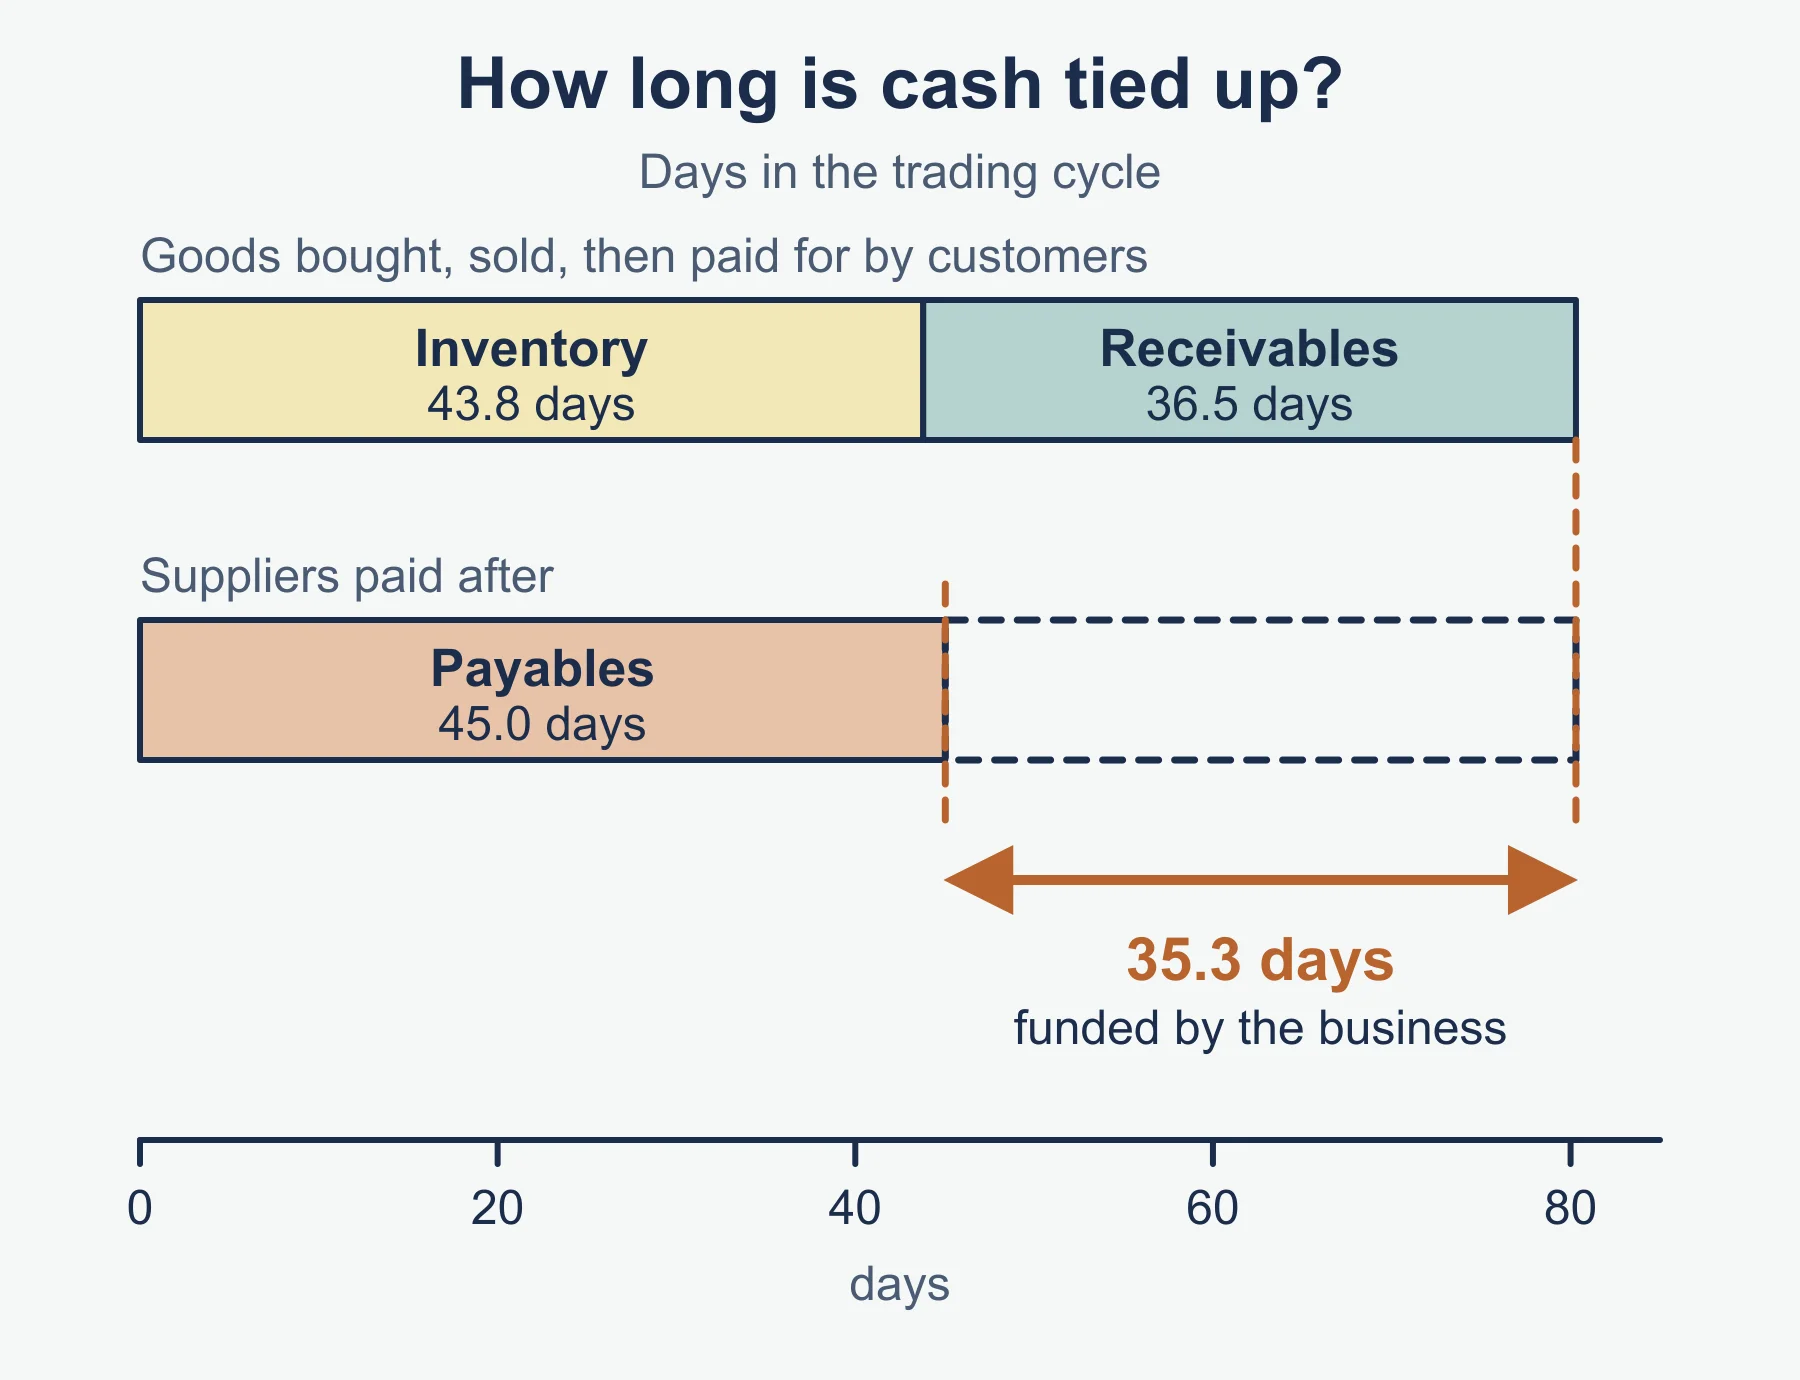
- Inventory turnover rose from 7.20 to 7.83 times, and inventory days fell from 50.69 to 46.64. Inventory is sold faster, so less cash is tied up. Tighter control is working.
- Trade receivables days rose from 47.15 to 63.48, against 45 allowed. Customers are 18.48 days over the terms.
- Trade payables days rose from 41.93 to 56.41, against 60 allowed. Ferndale is paying later, which helps cash, but it is now close to the limit.
5. Suggestions and recommendations
Match each suggestion to the weak ratio and say what it should change.
- Profitability. Expenses grew 27.38% against revenue growth of 15.00%. Review the online shop’s advertising and delivery costs, charge for delivery and keep the supplier’s lower prices. Raising prices on popular lines lifts the gross profit margin.
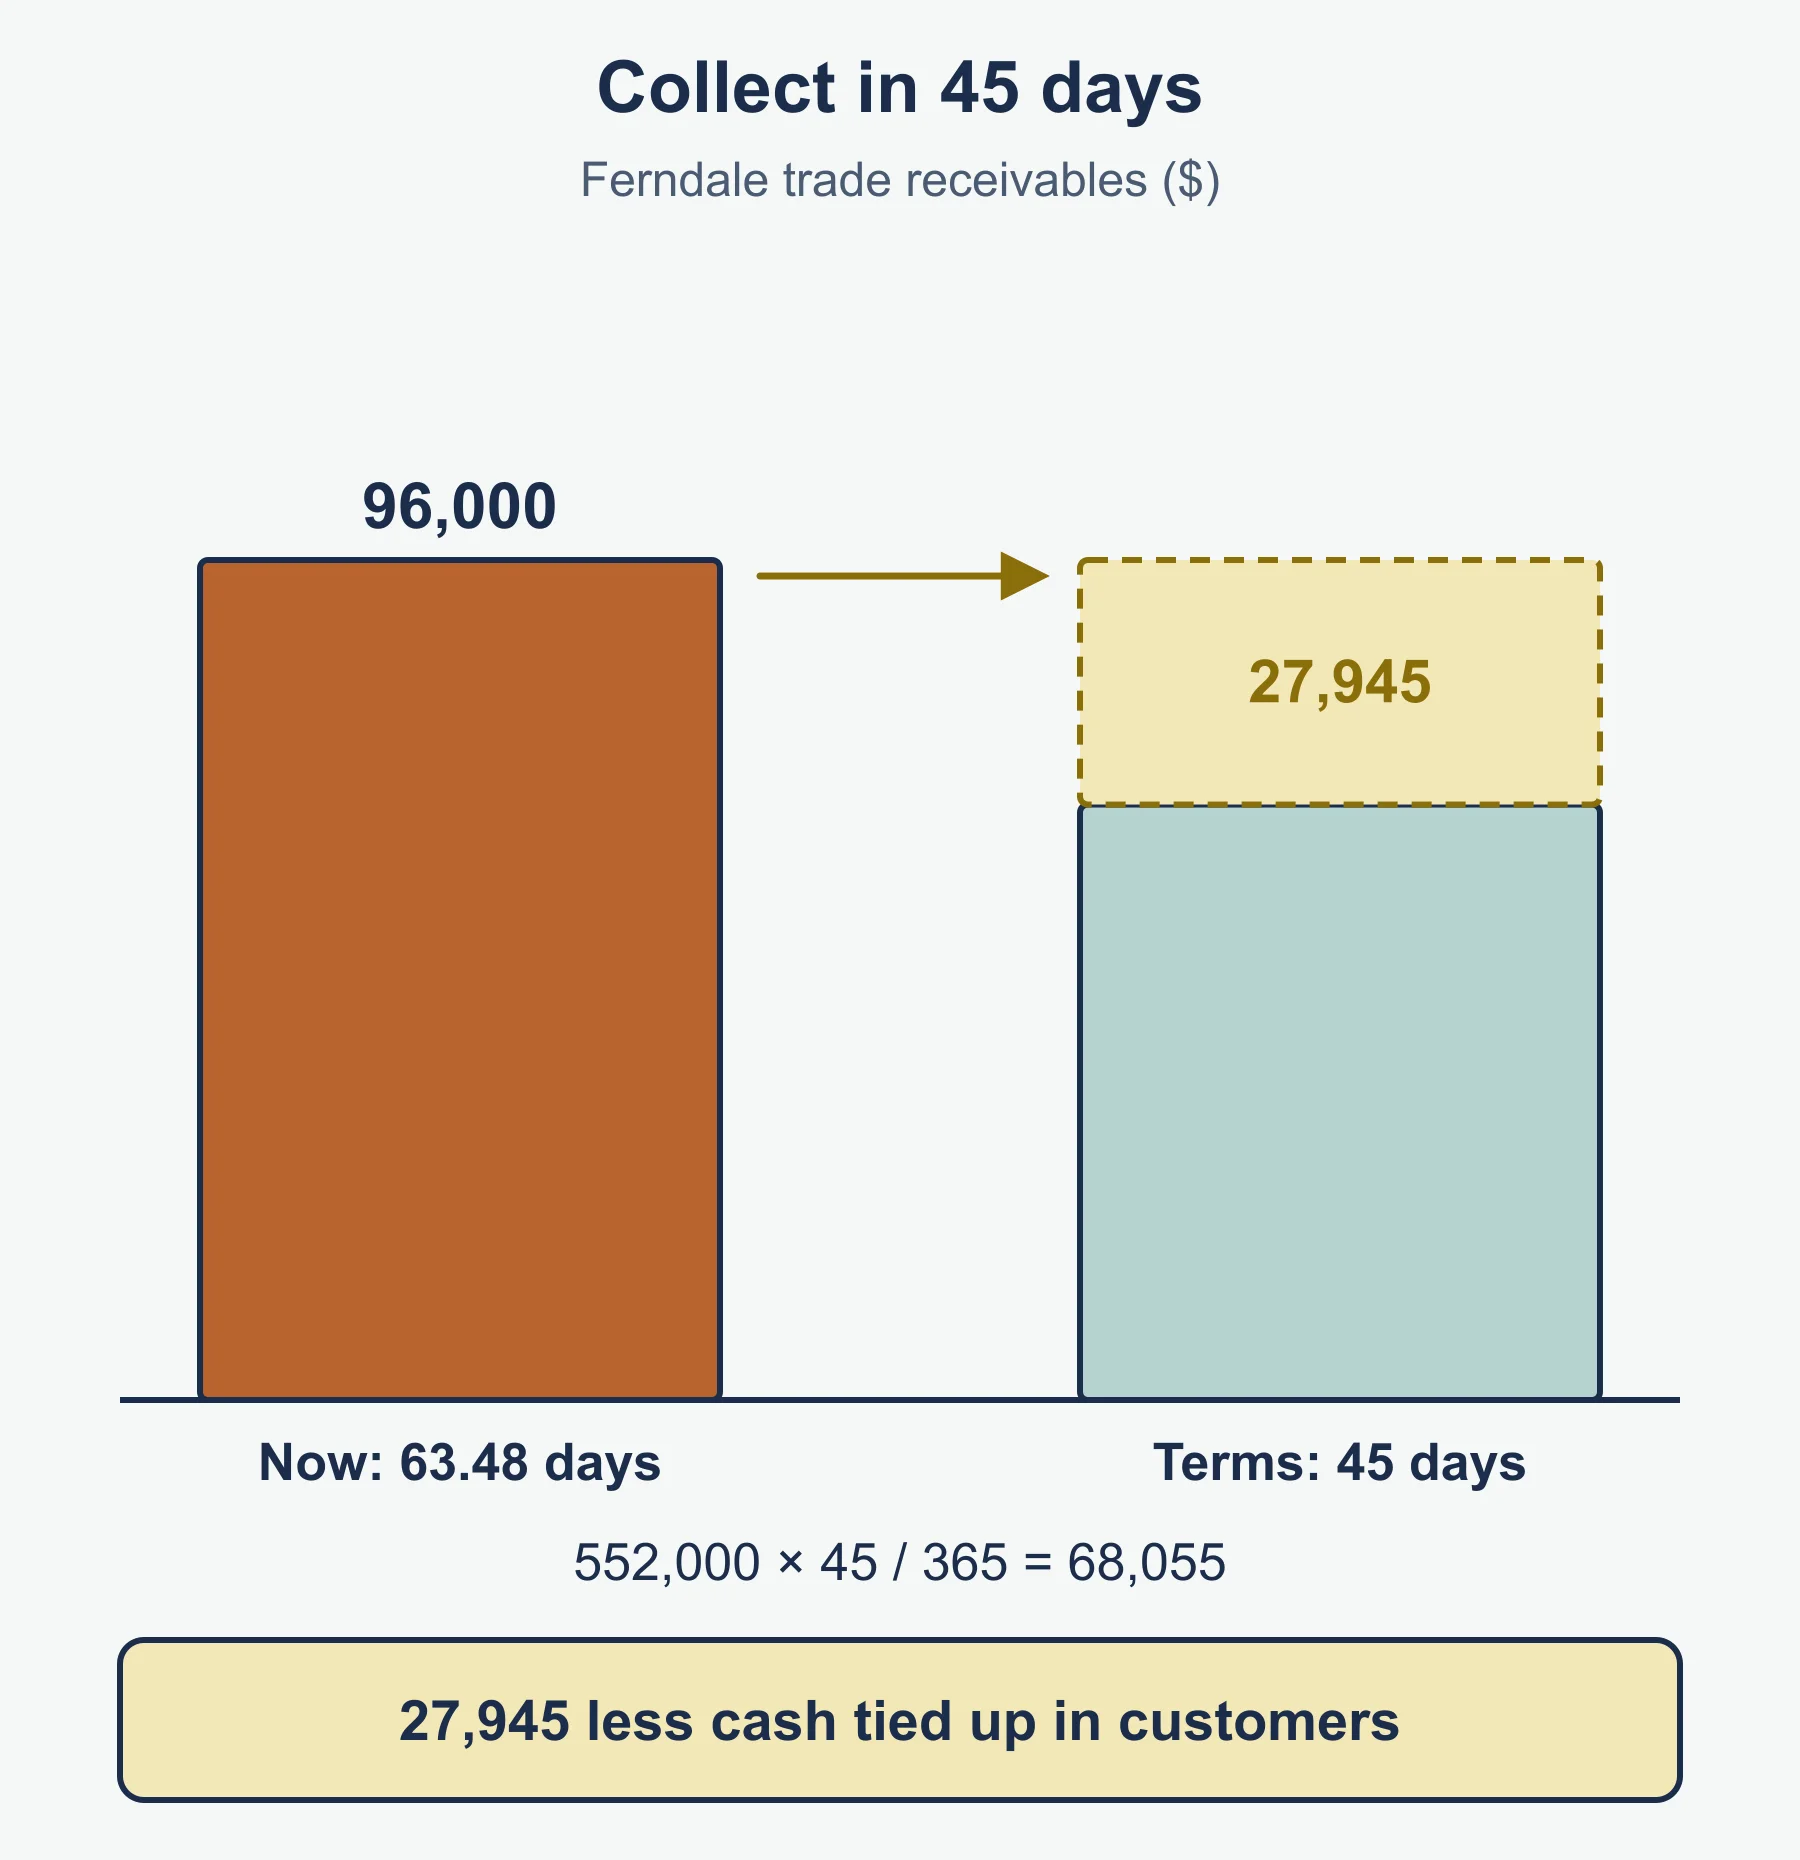
- Liquidity. Collect from customers within 45 days: send statements promptly, chase accounts that are overdue and offer a cash discount for early payment. At 45 days, trade receivables would be about 68,055, which is 27,945 less than 96,000.
- Working capital. Keep inventory low by ordering what sells. Pay suppliers within the 60 days, not earlier, but not so late that they withdraw credit.
6. Profit indicators: what changes gross profit and profit for the year
The gross profit margin shows the trading result before expenses; the profit margin shows what remains after expenses, other income and interest. A steady first margin with a falling second points to expenses. A falling first points to prices, purchase costs or inventory.
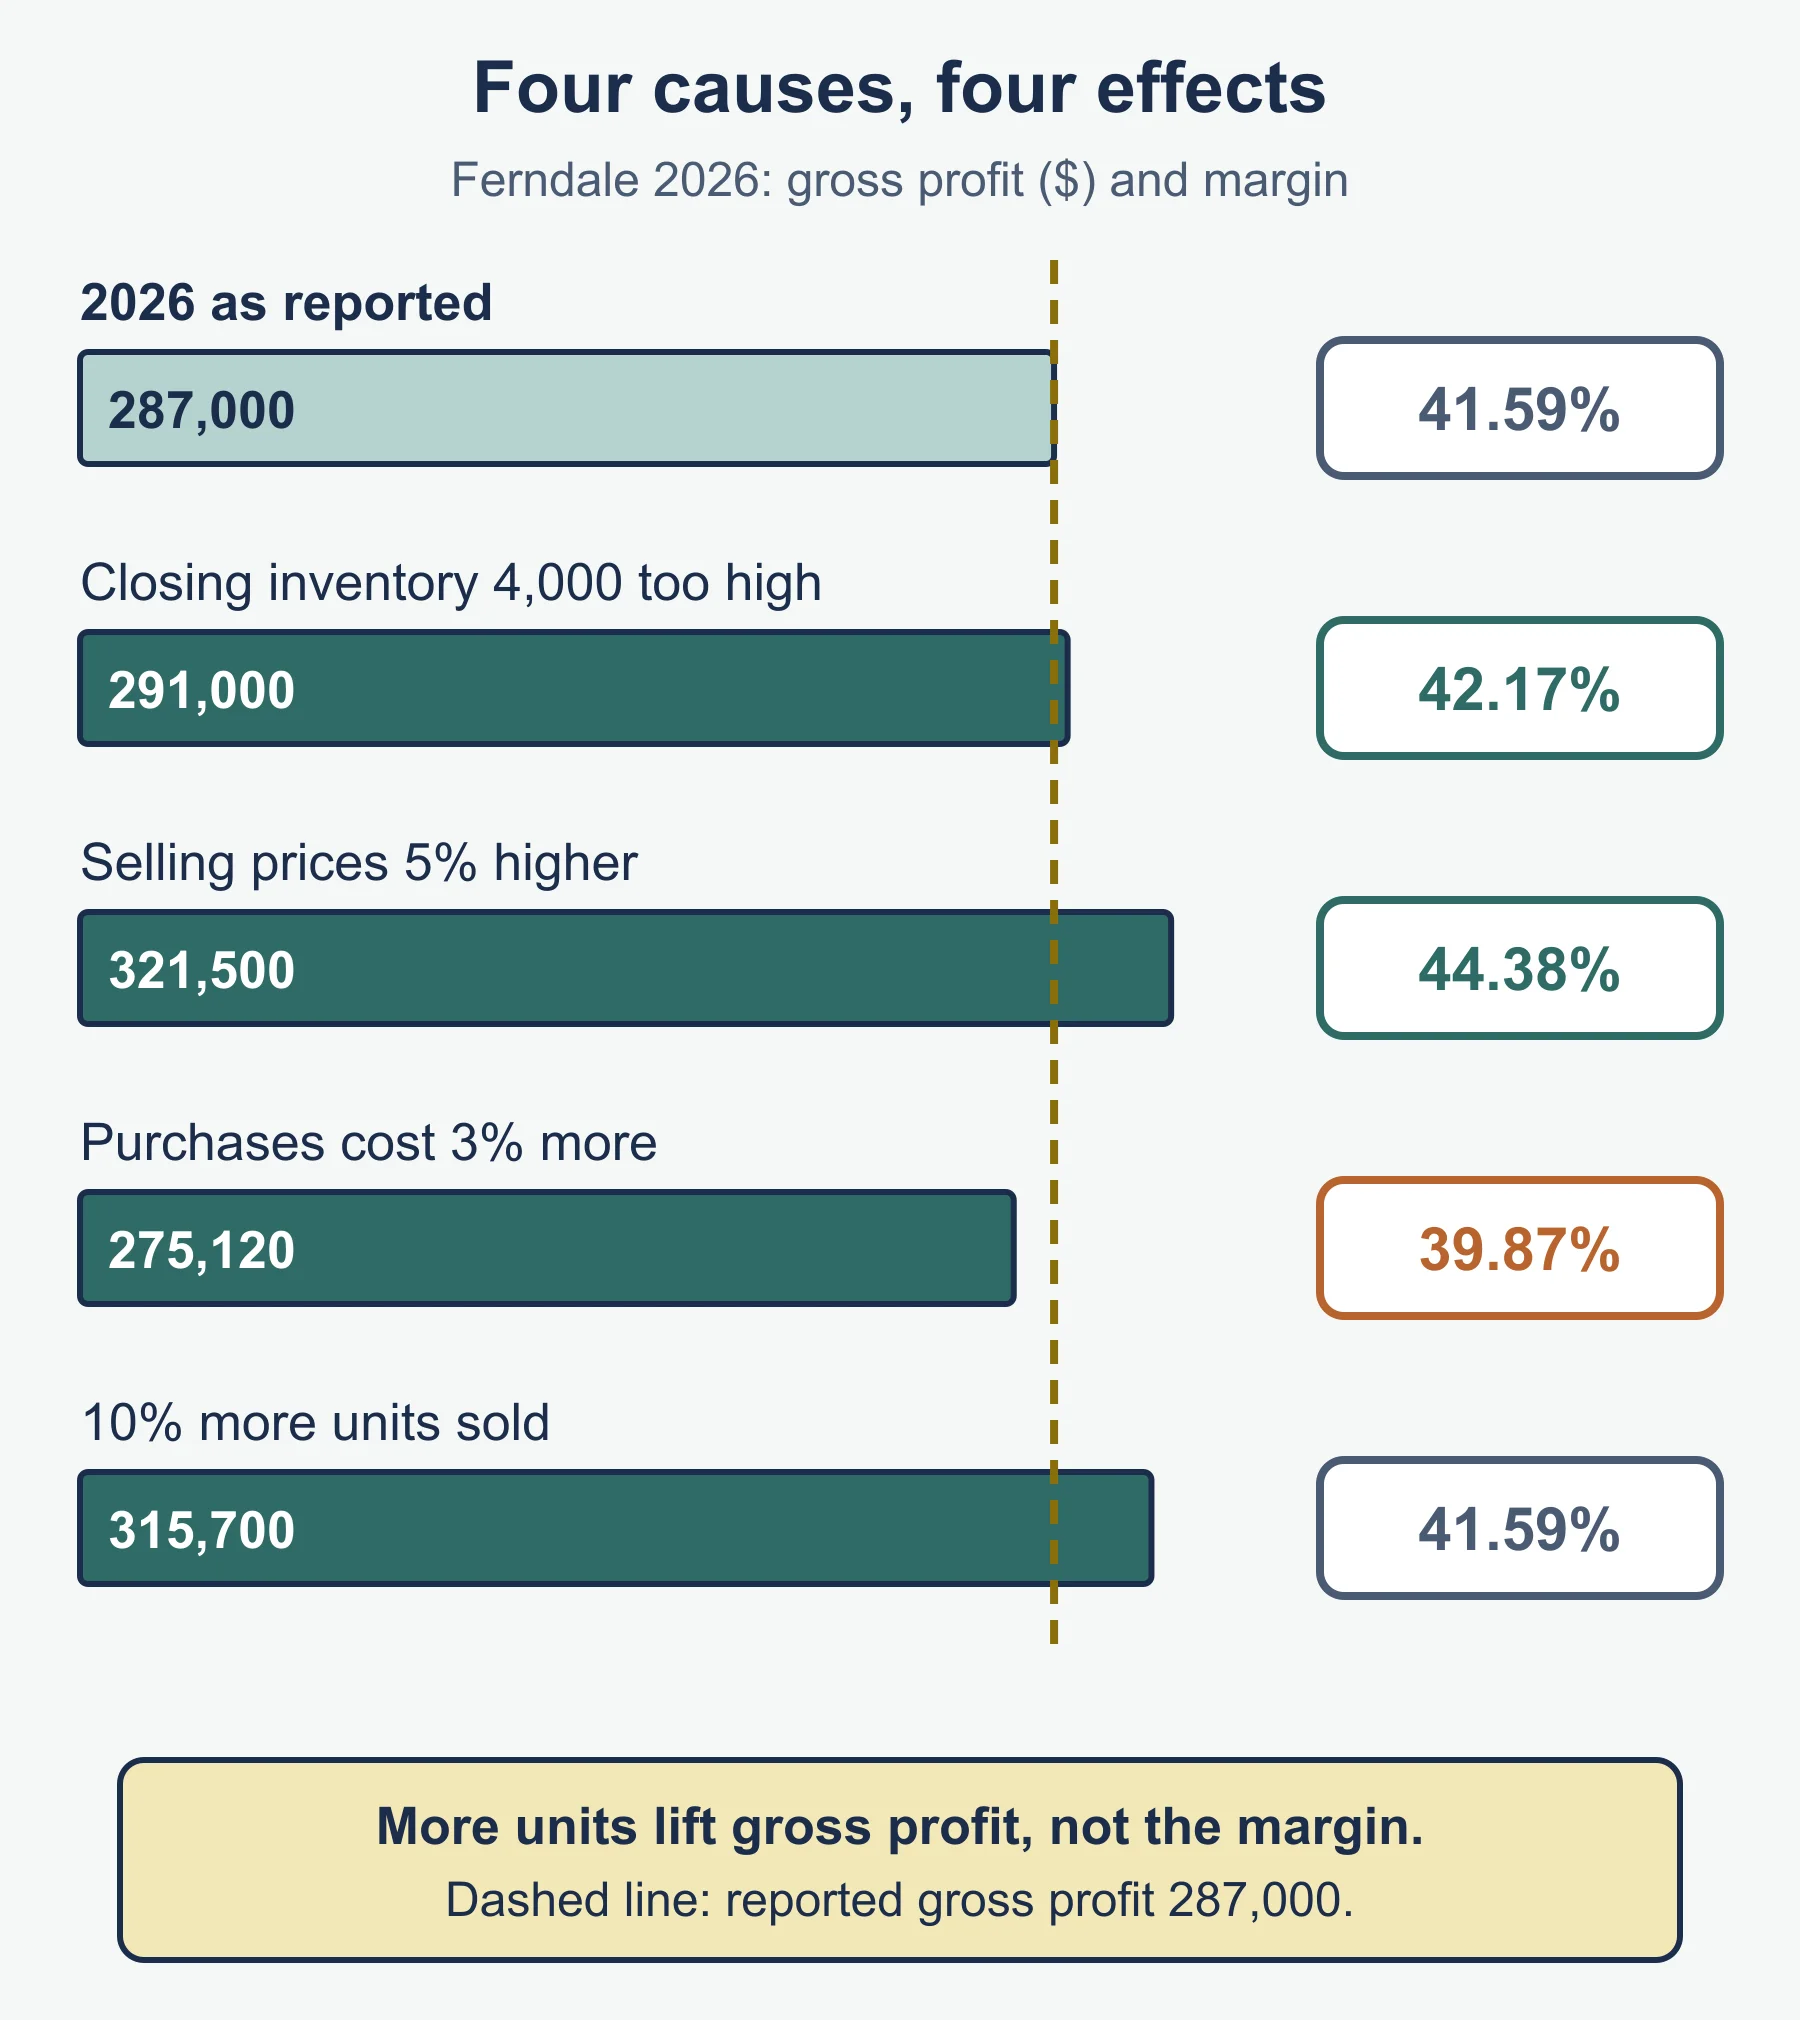
Starting from Ferndale’s 2026 figures, four causes change gross profit as follows.
| Cause | Revenue | Cost of sales | Gross profit | Gross profit margin |
|---|---|---|---|---|
| 2026 as reported | 690,000 | 403,000 | 287,000 | 41.59% |
| Closing inventory overvalued by 4,000 | 690,000 | 399,000 | 291,000 | 42.17% |
| Selling prices 5% higher, same units | 724,500 | 403,000 | 321,500 | 44.38% |
| Purchases cost 3% more (inventory values unchanged) | 690,000 | 414,880 | 275,120 | 39.87% |
| 10% more units, same prices and costs | 759,000 | 443,300 | 315,700 | 41.59% |
Closing inventory reduces cost of sales, so an overvalued figure inflates gross profit and profit for the year equally. More units raise gross profit, not the margin. Profit for the year = gross profit + other income - expenses - interest, so it can fall while gross profit rises, as at Ferndale.
7. Why cash and profit differ
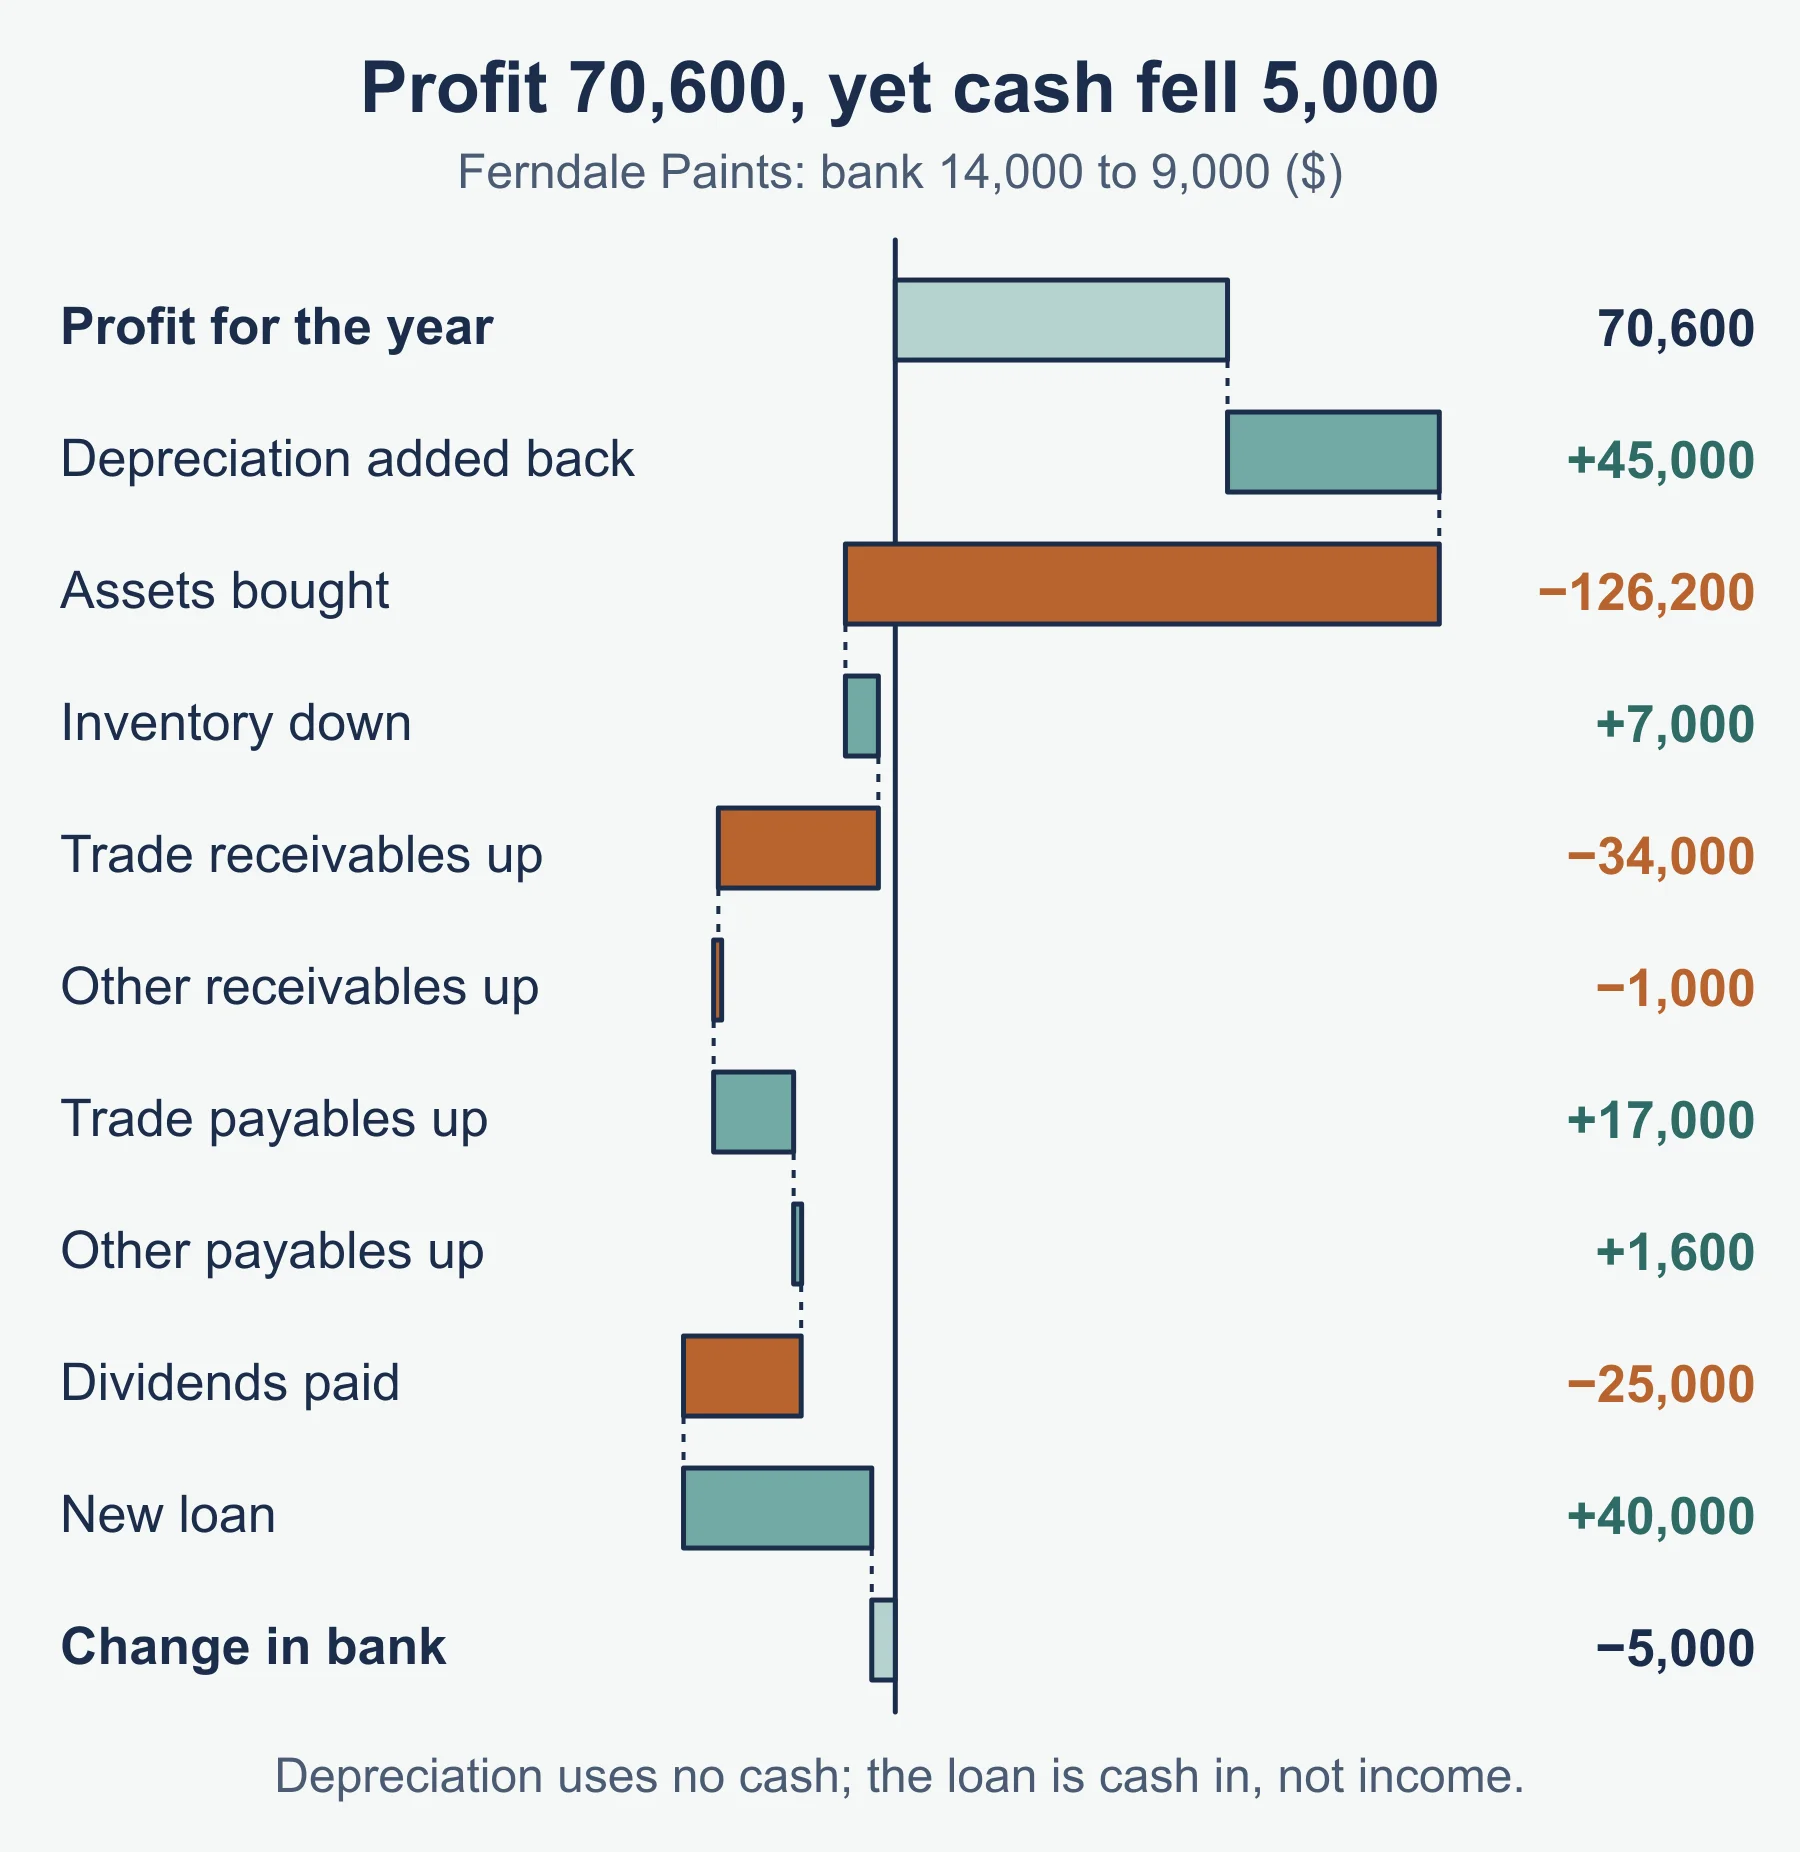
Ferndale made a profit for the year of 70,600, but its bank balance fell from 14,000 to 9,000.
Profit for the year                                70,600
Depreciation (expense, no cash paid)              +45,000
Non-current assets bought (cash, not an expense) -126,200
Decrease in inventory                               +7,000
Increase in trade receivables                      -34,000
Increase in other receivables                       -1,000
Increase in trade payables                         +17,000
Increase in other payables                          +1,600
Dividends paid                                     -25,000
New loan received (cash in, not income)            +40,000
Change in bank balance                              -5,000
Other reasons include capital introduced, drawings, irrecoverable debts and expenses or income paid or received in a different year.
Common errors
- Giving a current ratio as a percentage, or without the “to 1”.
- Using profit for the year after interest in ROCE.
- Using closing inventory instead of average inventory.
- Using total revenue for receivables days when credit sales are given.
- Stating a change with no reason from the scenario.
Frequently asked questions
How is average inventory calculated for Cambridge IGCSE Accounting 0452 ratios? Average inventory is opening inventory plus closing inventory, divided by 2. Both the rate of inventory turnover and inventory turnover in days use it, so using closing inventory alone is an error.
How do you find credit sales if a question gives total revenue and cash sales? Subtract cash sales from total revenue to find credit sales, and do the same for purchases. Trade receivables and trade payables turnover in days use the credit figures.
Why is mark-up always higher than gross profit margin? Both ratios use the same gross profit, but mark-up divides by cost of sales and margin divides by revenue. Cost of sales is smaller than revenue, so mark-up is the larger percentage.
How should you write a comment on a ratio? Write it in three parts: the ratio with both years’ figures, the reason from the scenario, and what it means for the business. For example, a rise in trade receivables days above the credit period allowed means customers are paying late.
Why can a business make a profit but have less cash in the bank? Profit and cash differ because of items such as depreciation, buying non-current assets, loan repayments, changes in inventory, receivables and payables, and drawings or dividends. A profitable business can therefore see its bank balance fall.
Official syllabus
Cambridge IGCSE Accounting syllabus (0452, version 1) for exams in 2027, 2028 and 2029, published by Cambridge University Press & Assessment: sections 6.1 and 6.2 and the Accounting ratios list at the end of the topic.
Get free revision emails (optional)
Occasional emails with practice questions, worked explanations and links to free resources for the qualification and subjects you choose. No spam, and you can unsubscribe from any email. The free tools on this site never need an email.
Related resources
-
Revision notes
IGCSE Accounting: Analysis and Interpretation — Revision Notes
Quick recall for Cambridge IGCSE Accounting 0452 Topic 6: ten ratios, reading them, profit versus cash, comparing businesses, users and statement limits.
Accounting · Cambridge · IGCSE, O Level
Revise topic -
Practice questions
IGCSE Accounting: Calculating and interpreting accounting ratios (Cambridge 0452) – Practice Questions
Original practice questions with worked answers on calculating and interpreting accounting ratios, for Cambridge IGCSE Accounting 0452 sections 6.1-6.2.
Accounting · Cambridge · IGCSE, O Level
Try questions -
Revision notes
IGCSE Accounting: Calculating and interpreting accounting ratios (Cambridge 0452) – Revision Notes
Condensed revision notes on the ten accounting ratios, interpreting them and profit versus cash, for Cambridge IGCSE Accounting 0452 sections 6.1-6.2.
Accounting · Cambridge · IGCSE, O Level
Revise topic
Related articles
-
teaching
A Level tuition in Dubai: Cambridge or Pearson Edexcel International A Level?
Schools in Dubai and Abu Dhabi teach either Cambridge International AS & A Level or Pearson Edexcel International A Level. How the two are structured, why it matters for tuition, and how online classes from Lahore work.
9 October 2026
-
curriculum guides
Choosing subjects at IGCSE and A Level
How subject choices at 14 and 16 affect university options later, and how to keep pathways open without overloading a timetable.
28 July 2026
Studying this with a teacher
Working through Accounting IGCSE, O LEVELS?
This page is free and stays free. If you would rather be taught it, Marlbridge runs Accounting classes one-to-one and in small groups of up to 15, online in your own time zone. The first trial class is free. WhatsApp replies within an hour (8am–11pm Pakistan time, every day); email the same day.
Cambridge Accounting teachers at Marlbridge