
Study Guides
IGCSE Business: Costs, scale of production and break-even analysis (Cambridge 0264)
A full study guide to Cambridge IGCSE Business 0264 section 4.4: classifying costs, economies of scale and break-even analysis, with worked examples.
- Subject
- Business
- Level
- IGCSE
- Topic
- Operations management
- Author
- Marlbridge Academic Team
- Updated
- Reviewed by
- Salman Ahmad (what this means)
Aligned to Cambridge IGCSE Business (0264), For examination in 2027, 2028 and 2029. Official specification .
Syllabus page (what it covers and how it is assessed): Cambridge IGCSE Business.
Syllabus points this page covers
0264
- 4.4 Costs, scale of production and break-even analysis
Found an error? Report a correction.
Need help with this topic? Request a free trial class for IGCSE Business (0450 / 0264).
This guide covers section 4.4, Costs, scale of production and break-even analysis, of the Cambridge IGCSE Business 0264 syllabus for examination in 2027, 2028 and 2029. It follows the three sub-sections the syllabus lists: 4.4.1 identify and classify costs, 4.4.2 economies and diseconomies of scale, and 4.4.3 break-even analysis. The syllabus does not split this content into tiers. Every business in the examples is invented, and money is written in pounds; any currency works the same way.
Use it with the revision notes and the practice questions. The course hub and the printable checklist track your progress, and the free diagnostics show where to start.
What the syllabus asks you to do
| Section | What you must be able to do |
|---|---|
| 4.4.1 | Classify and calculate costs (fixed, variable, average, total). Use cost data to make simple decisions: which product to produce, whether to continue or stop production, what price to set, which supplier to choose |
| 4.4.2 | Explain economies of scale (purchasing, marketing, financial, managerial, technical) and diseconomies of scale (poor communication, lack of commitment or loyalty from employees, weak coordination, lack of control) |
| 4.4.3 | Explain the concept of break-even. Complete or amend a simple break-even chart and interpret it. Calculate break-even output. Define, calculate and interpret the margin of safety. Use break-even analysis to judge changes in price, fixed costs and variable cost per unit. State the limitations |
The syllabus lists the production formulas in its “Formulas and ratios” section. They are used in this guide exactly as written there.
4.4.1 Identify and classify costs
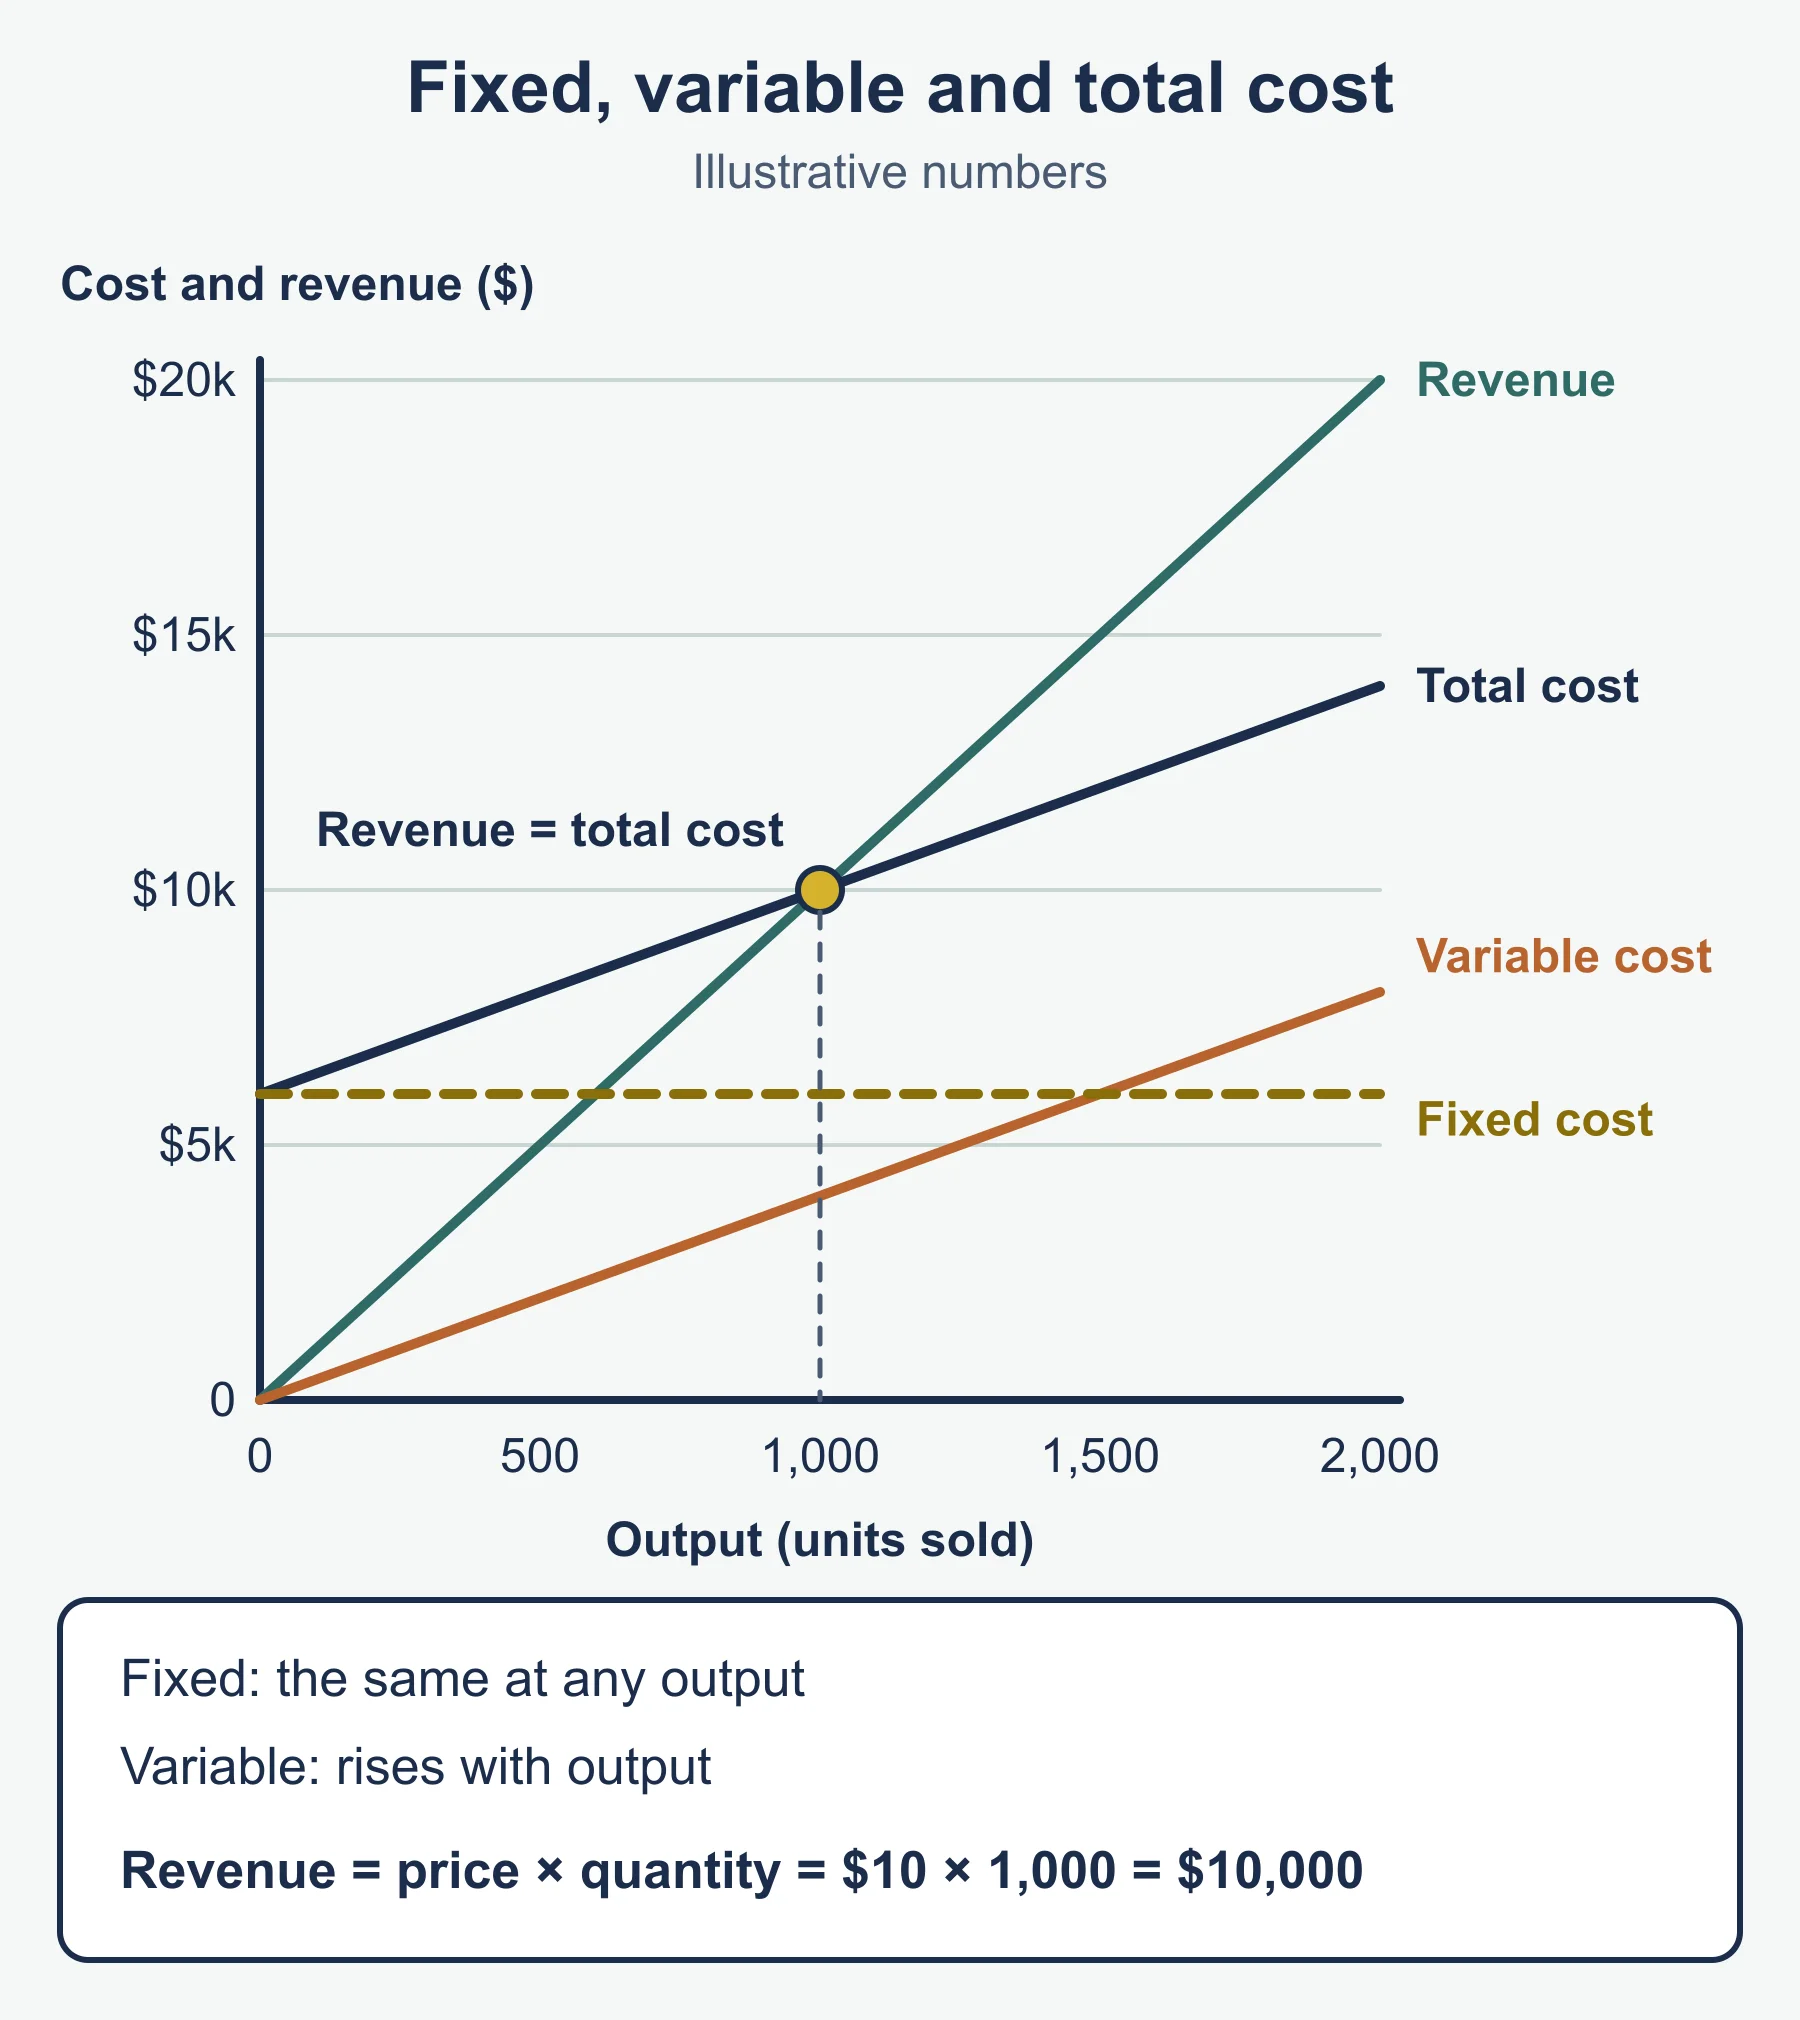
Fixed costs do not change when output changes, within the range a business normally works in. Rent, insurance and managers’ salaries are typical. Variable costs change directly with output: raw materials, packaging and, where pay depends on units made, production wages.
Two other measures combine them.
| Measure | Formula |
|---|---|
| Total variable cost | variable cost per unit × number of units |
| Variable cost per unit | total variable cost ÷ number of units |
| Total cost | total fixed costs + total variable costs |
| Average cost | total cost ÷ number of units |
Worked example: classifying and calculating
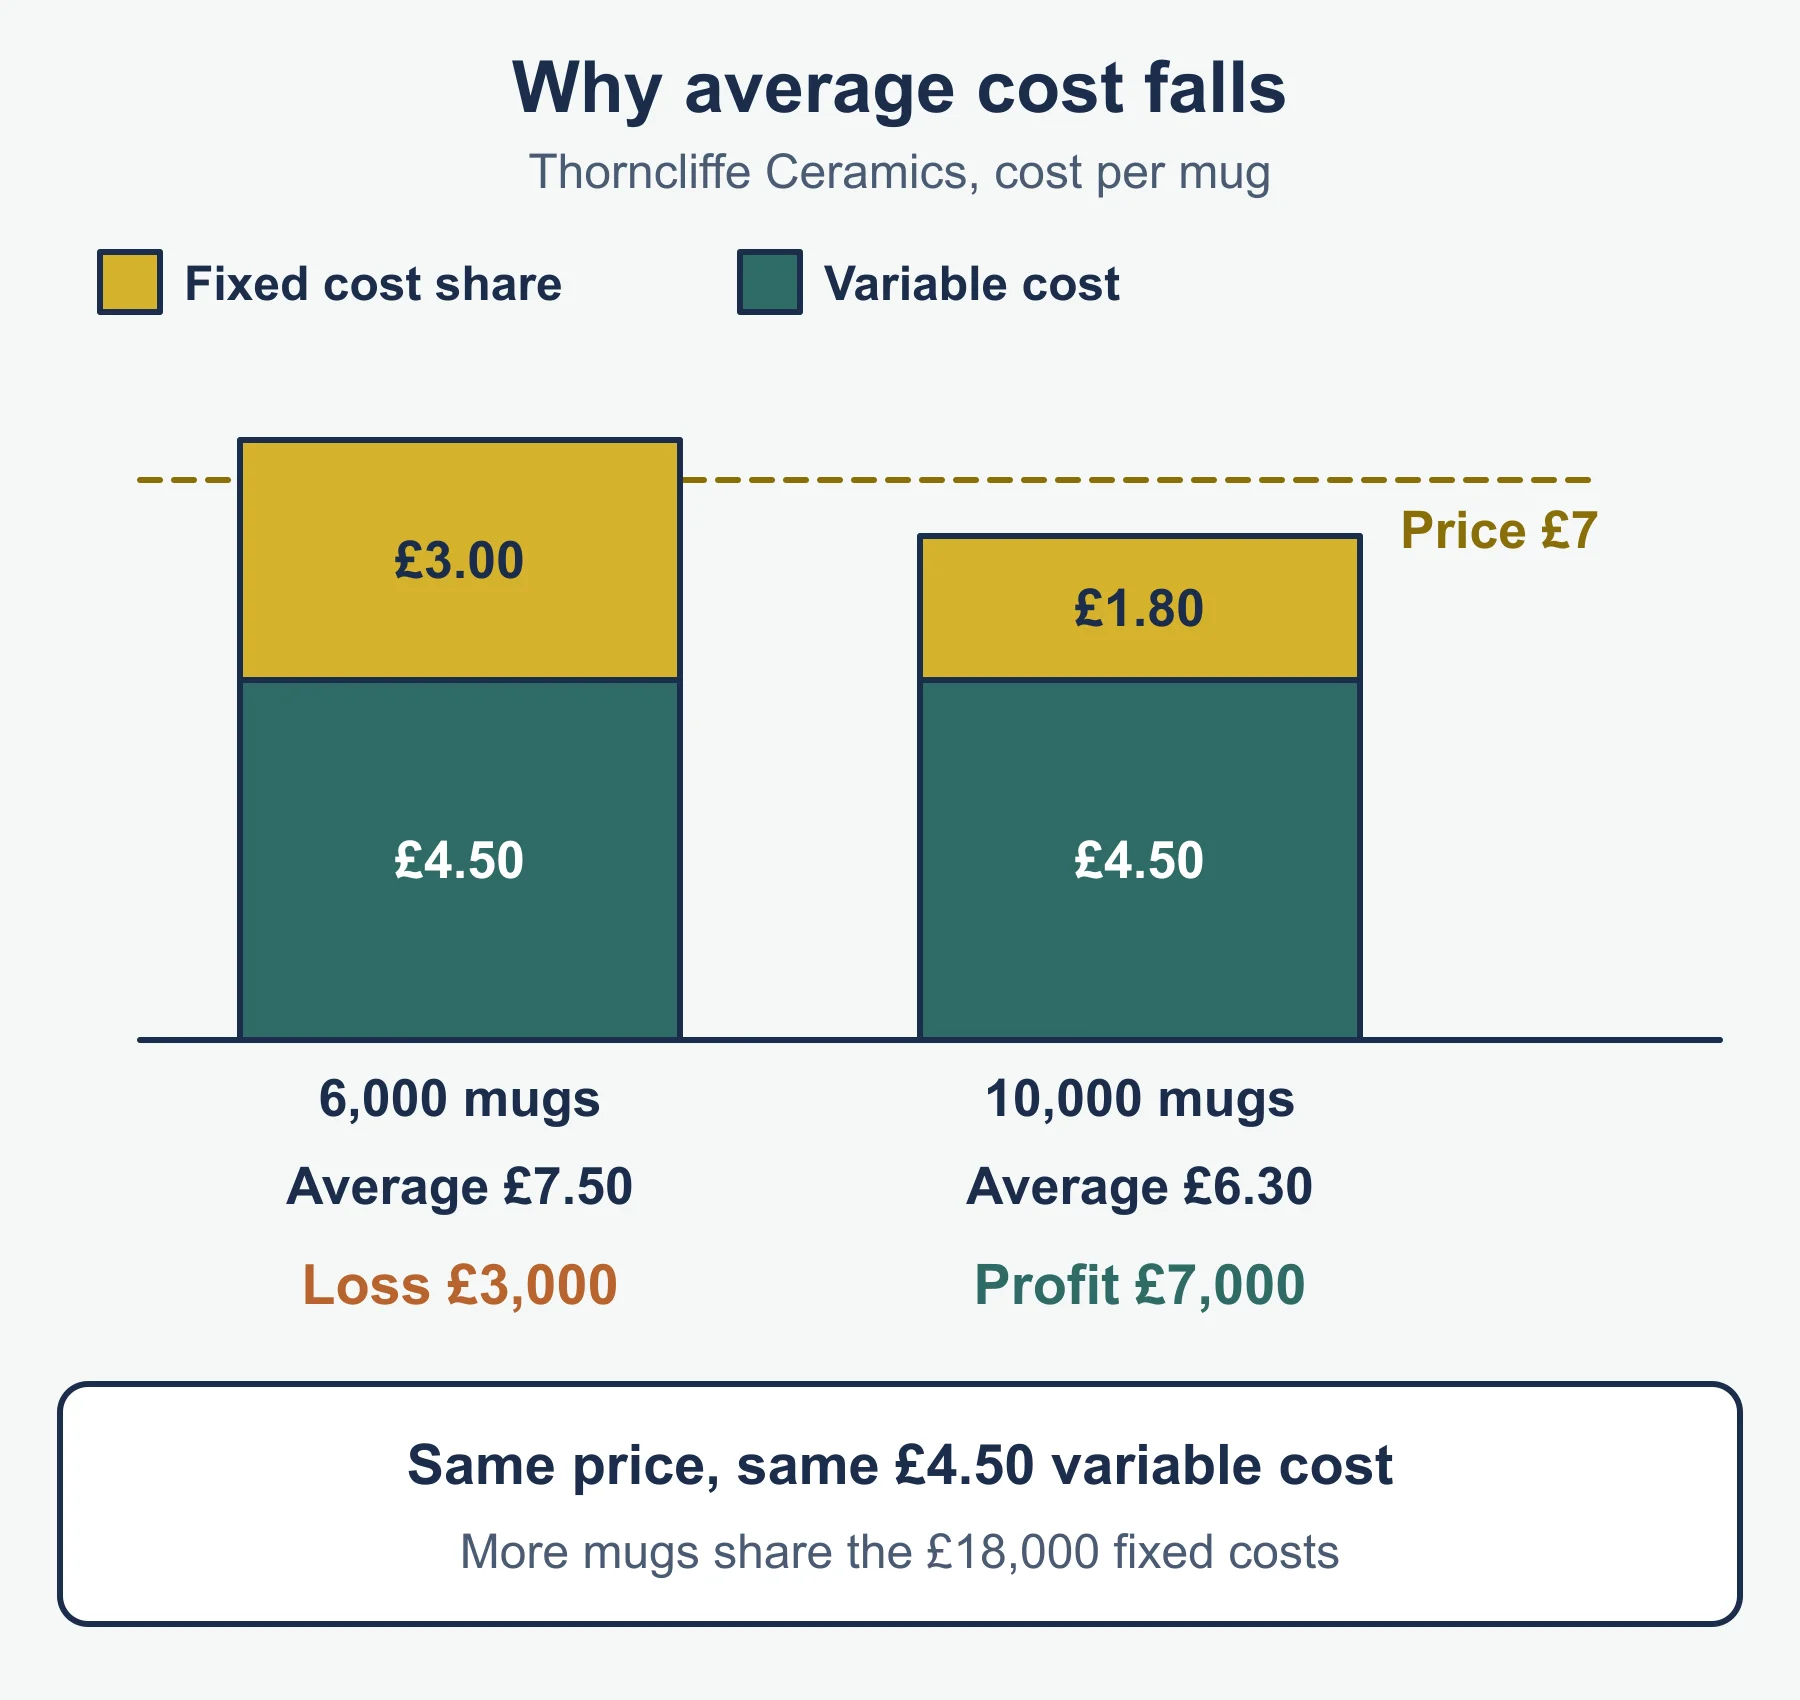
Thorncliffe Ceramics makes hand-finished mugs. Each month it pays rent of £9,000, insurance of £3,000 and supervisors’ salaries of £6,000. Clay, glaze and packaging cost £4.50 per mug.
- Fixed costs: 9,000 + 3,000 + 6,000 = £18,000 a month.
- At 6,000 mugs, total variable cost = 4.50 × 6,000 = £27,000.
- Total cost = 18,000 + 27,000 = £45,000.
- Average cost = 45,000 ÷ 6,000 = £7.50 per mug.
Now raise output to 10,000 mugs. Total variable cost is £45,000, total cost is £63,000 and average cost is £6.30. Average cost falls because the same £18,000 of fixed costs is shared between more mugs. Variable cost per unit stays at £4.50.
Using cost data to make simple decisions
The syllabus gives four example decisions. In each, compare cost data with revenue, then check non-cost factors.
What price to set. Price must at least cover average cost for the business to avoid a loss. If Thorncliffe sells each mug for £7, a month of 6,000 mugs gives revenue of £42,000 against a total cost of £45,000, a loss of £3,000. At 10,000 mugs, revenue is £70,000 against £63,000, a profit of £7,000. The same price makes a loss or a profit depending on output, because average cost changes.
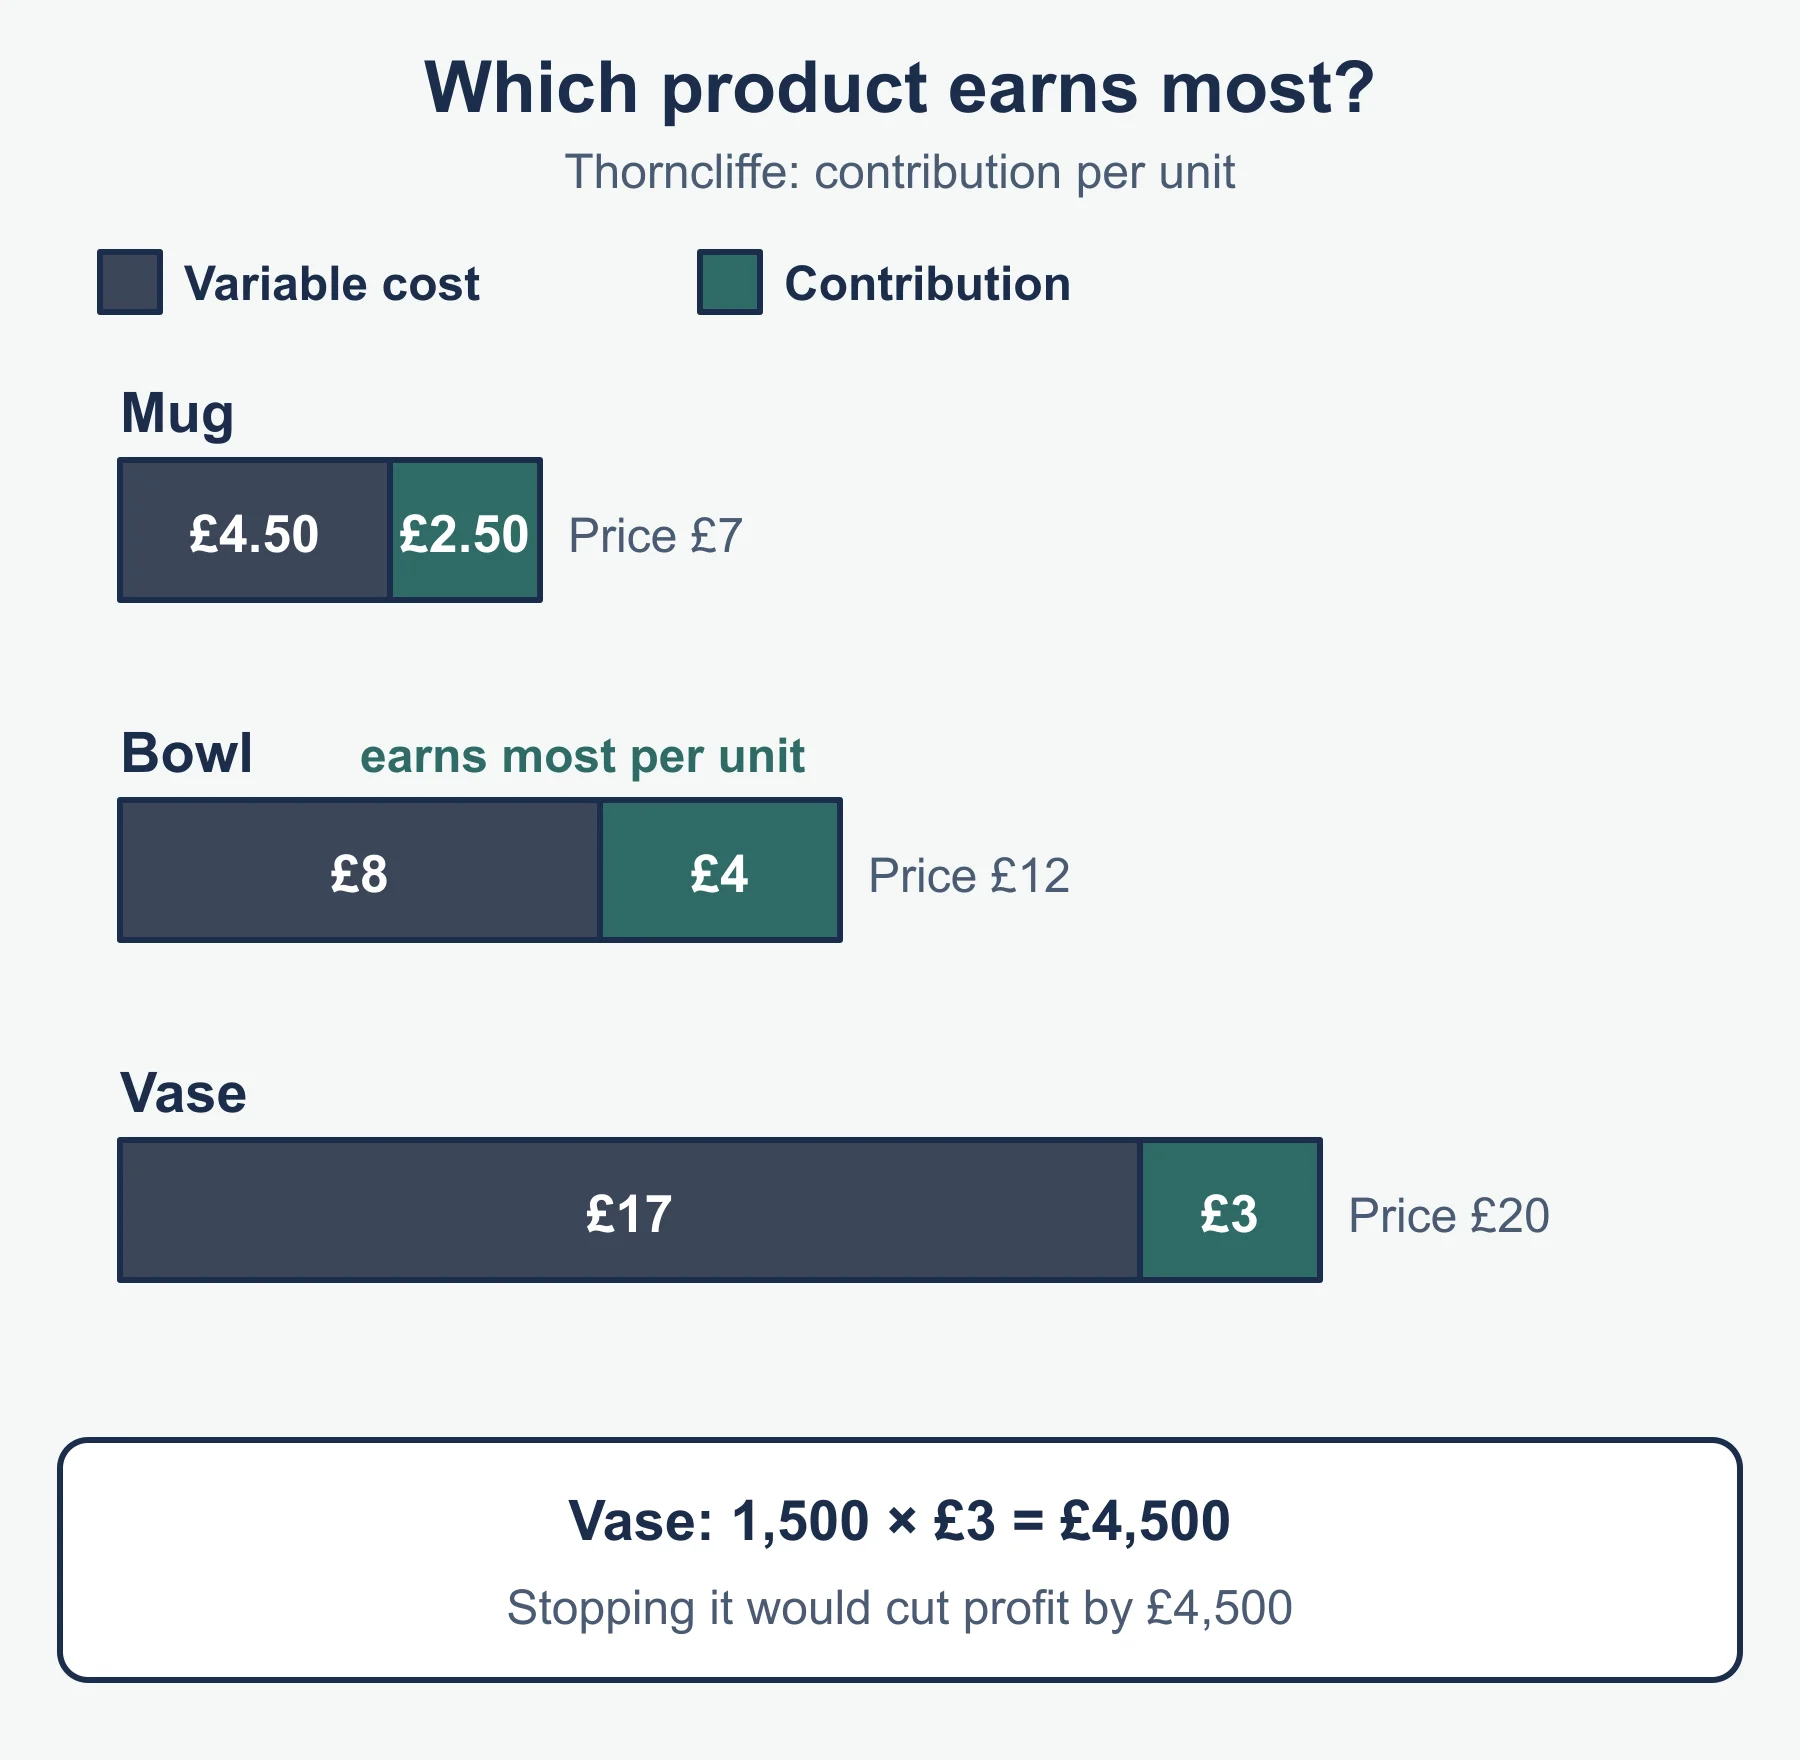
Which product to produce. Contribution per unit is selling price per unit minus variable cost per unit. Thorncliffe compares three products:
| Product | Price | Variable cost | Contribution per unit |
|---|---|---|---|
| Mug | £7 | £4.50 | £2.50 |
| Bowl | £12 | £8 | £4 |
| Vase | £20 | £17 | £3 |
The bowl earns the most towards fixed costs per unit sold. Demand and production time also matter.
Whether to continue or stop production. Suppose Thorncliffe makes 1,500 vases a month. They contribute 1,500 × 3 = £4,500 towards fixed costs. If rent and salaries continue whether or not vases are made, stopping the vase would cut monthly profit by £4,500, so there is a cost-based case for continuing. That case weakens if the machine time could earn more on another product, or if vases harm the brand.
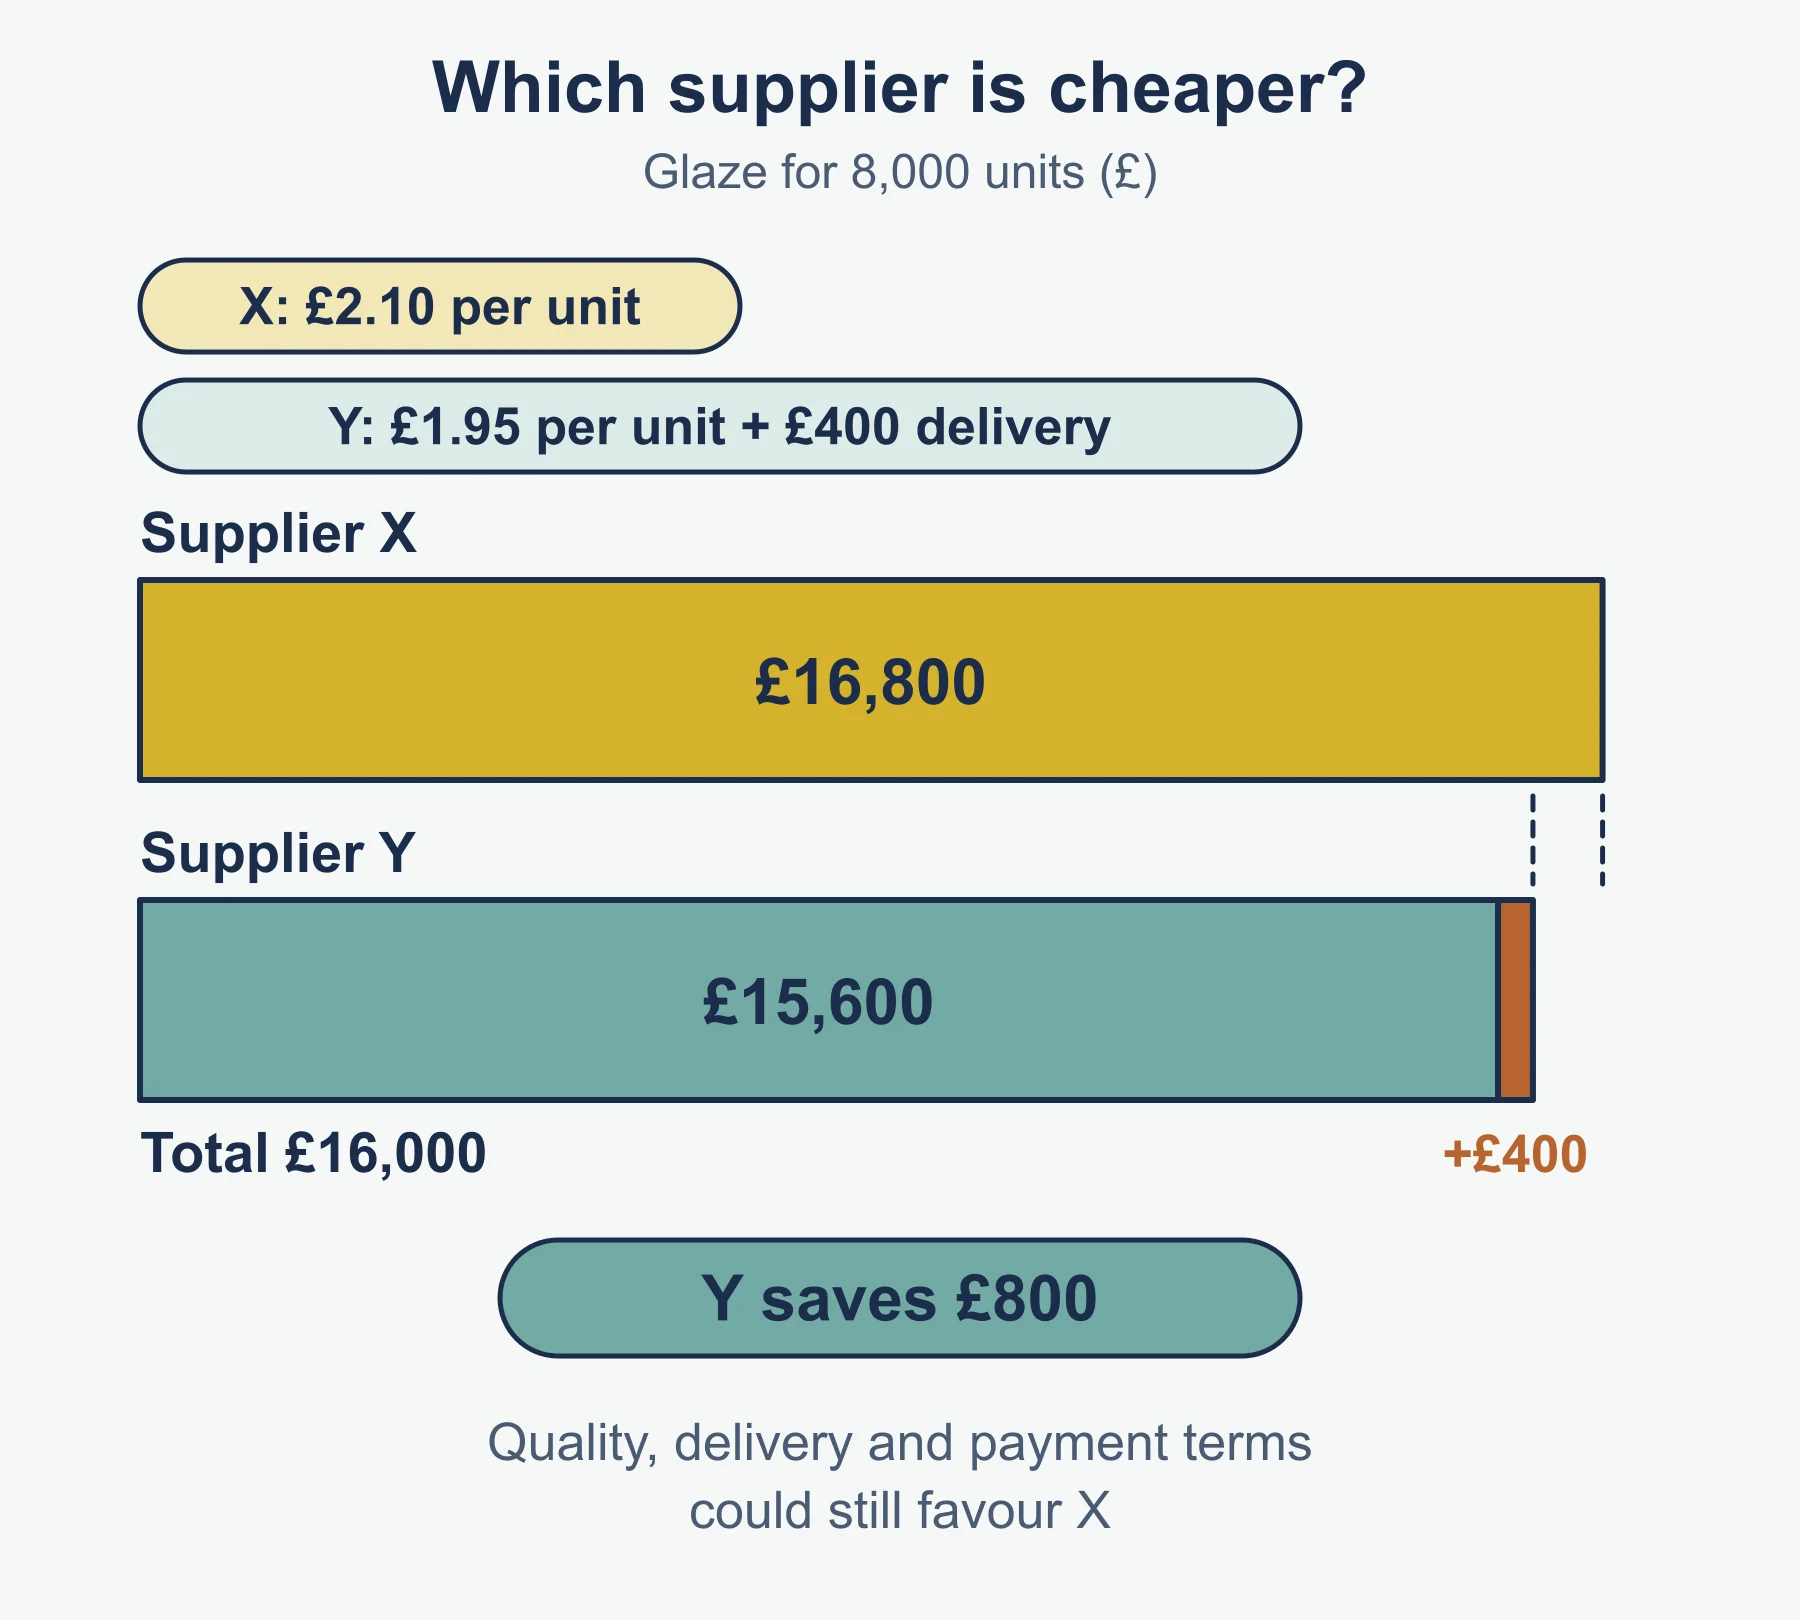
Which supplier to choose. Supplier X charges £2.10 per unit of glaze. Supplier Y charges £1.95 per unit plus a £400 delivery fee. For 8,000 units X costs 16,800 and Y costs 15,600 + 400 = 16,000, so Y saves £800. Quality, reliability of delivery and payment terms could still favour X.
4.4.2 Economies and diseconomies of scale
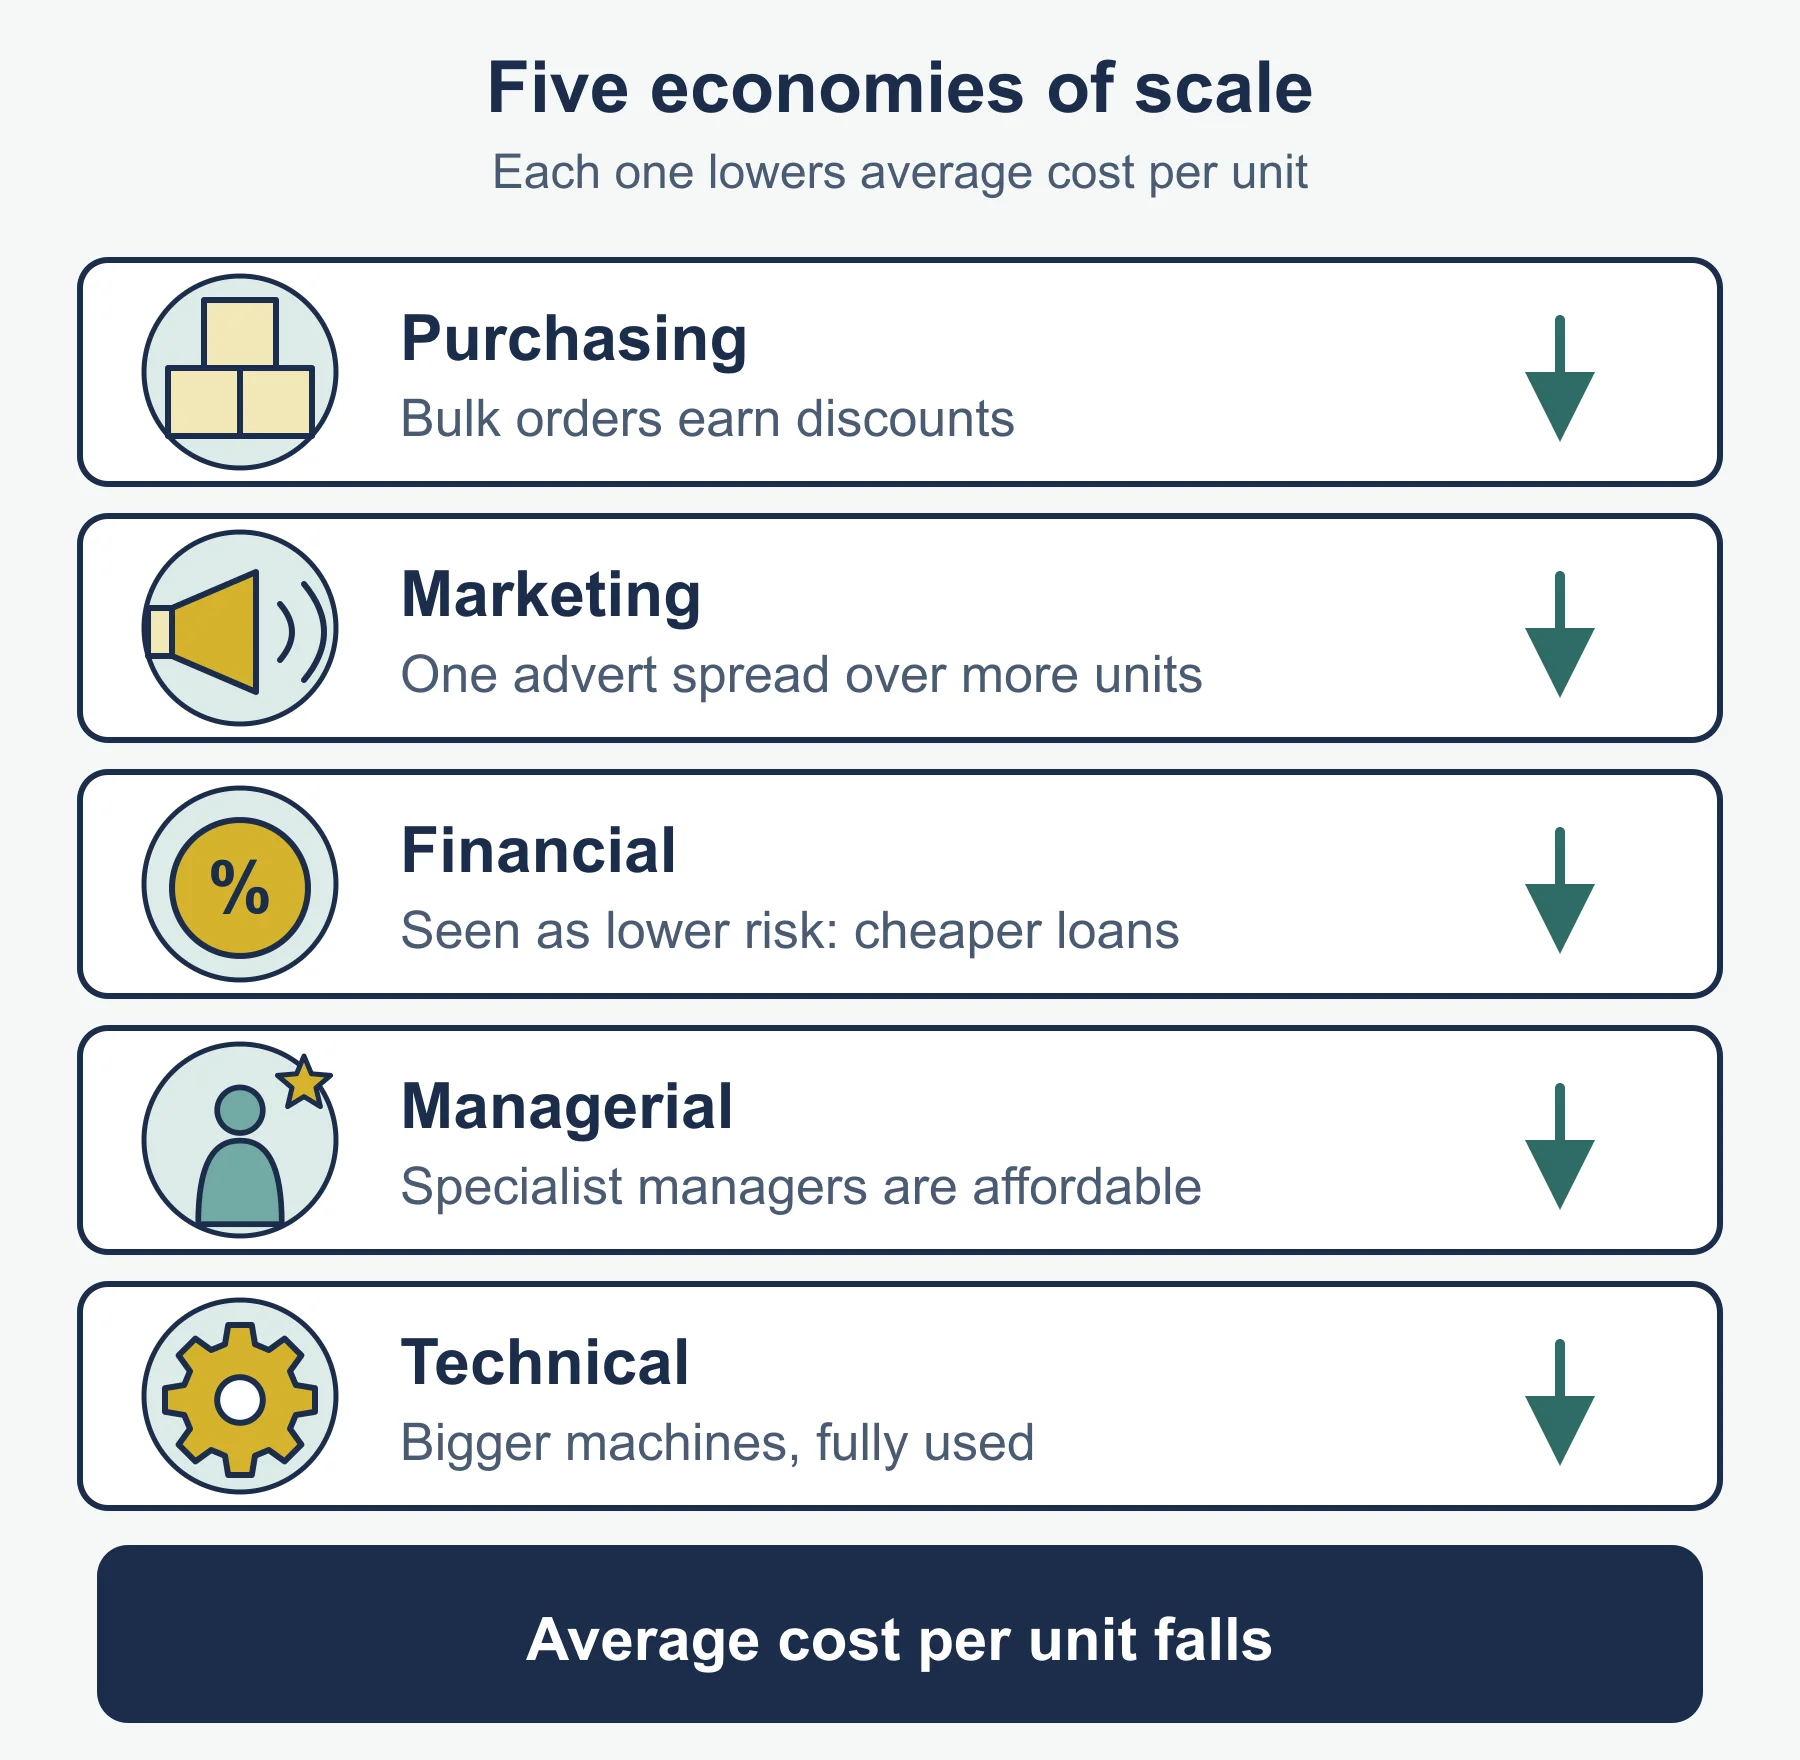
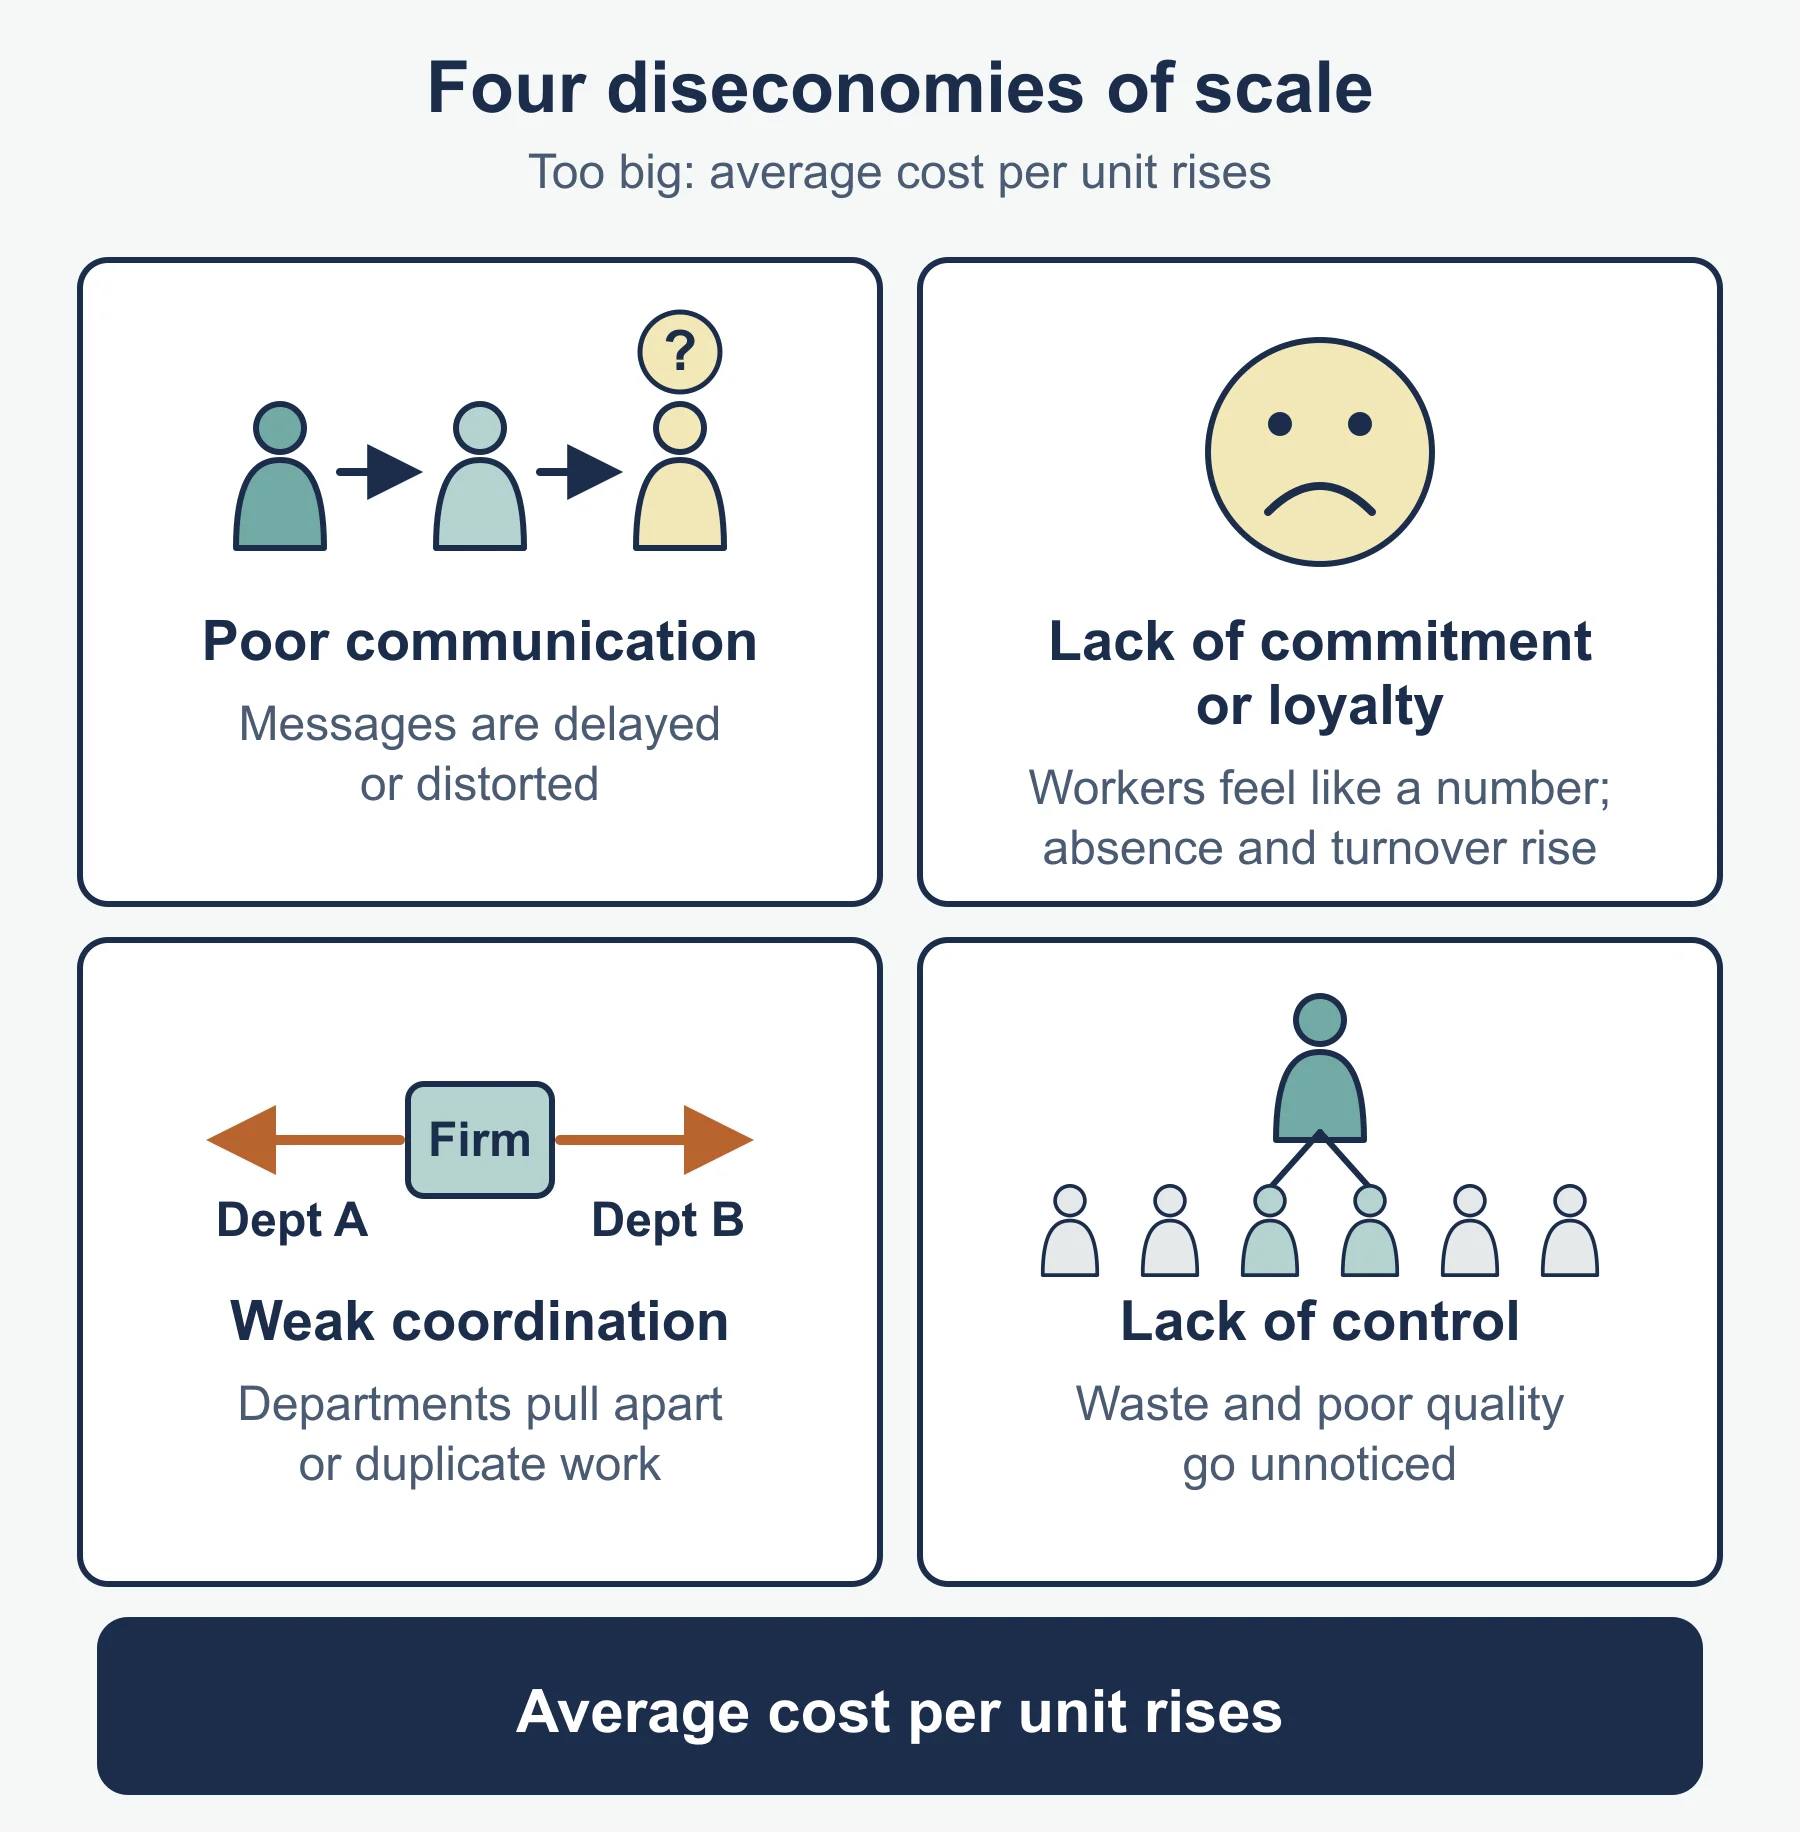
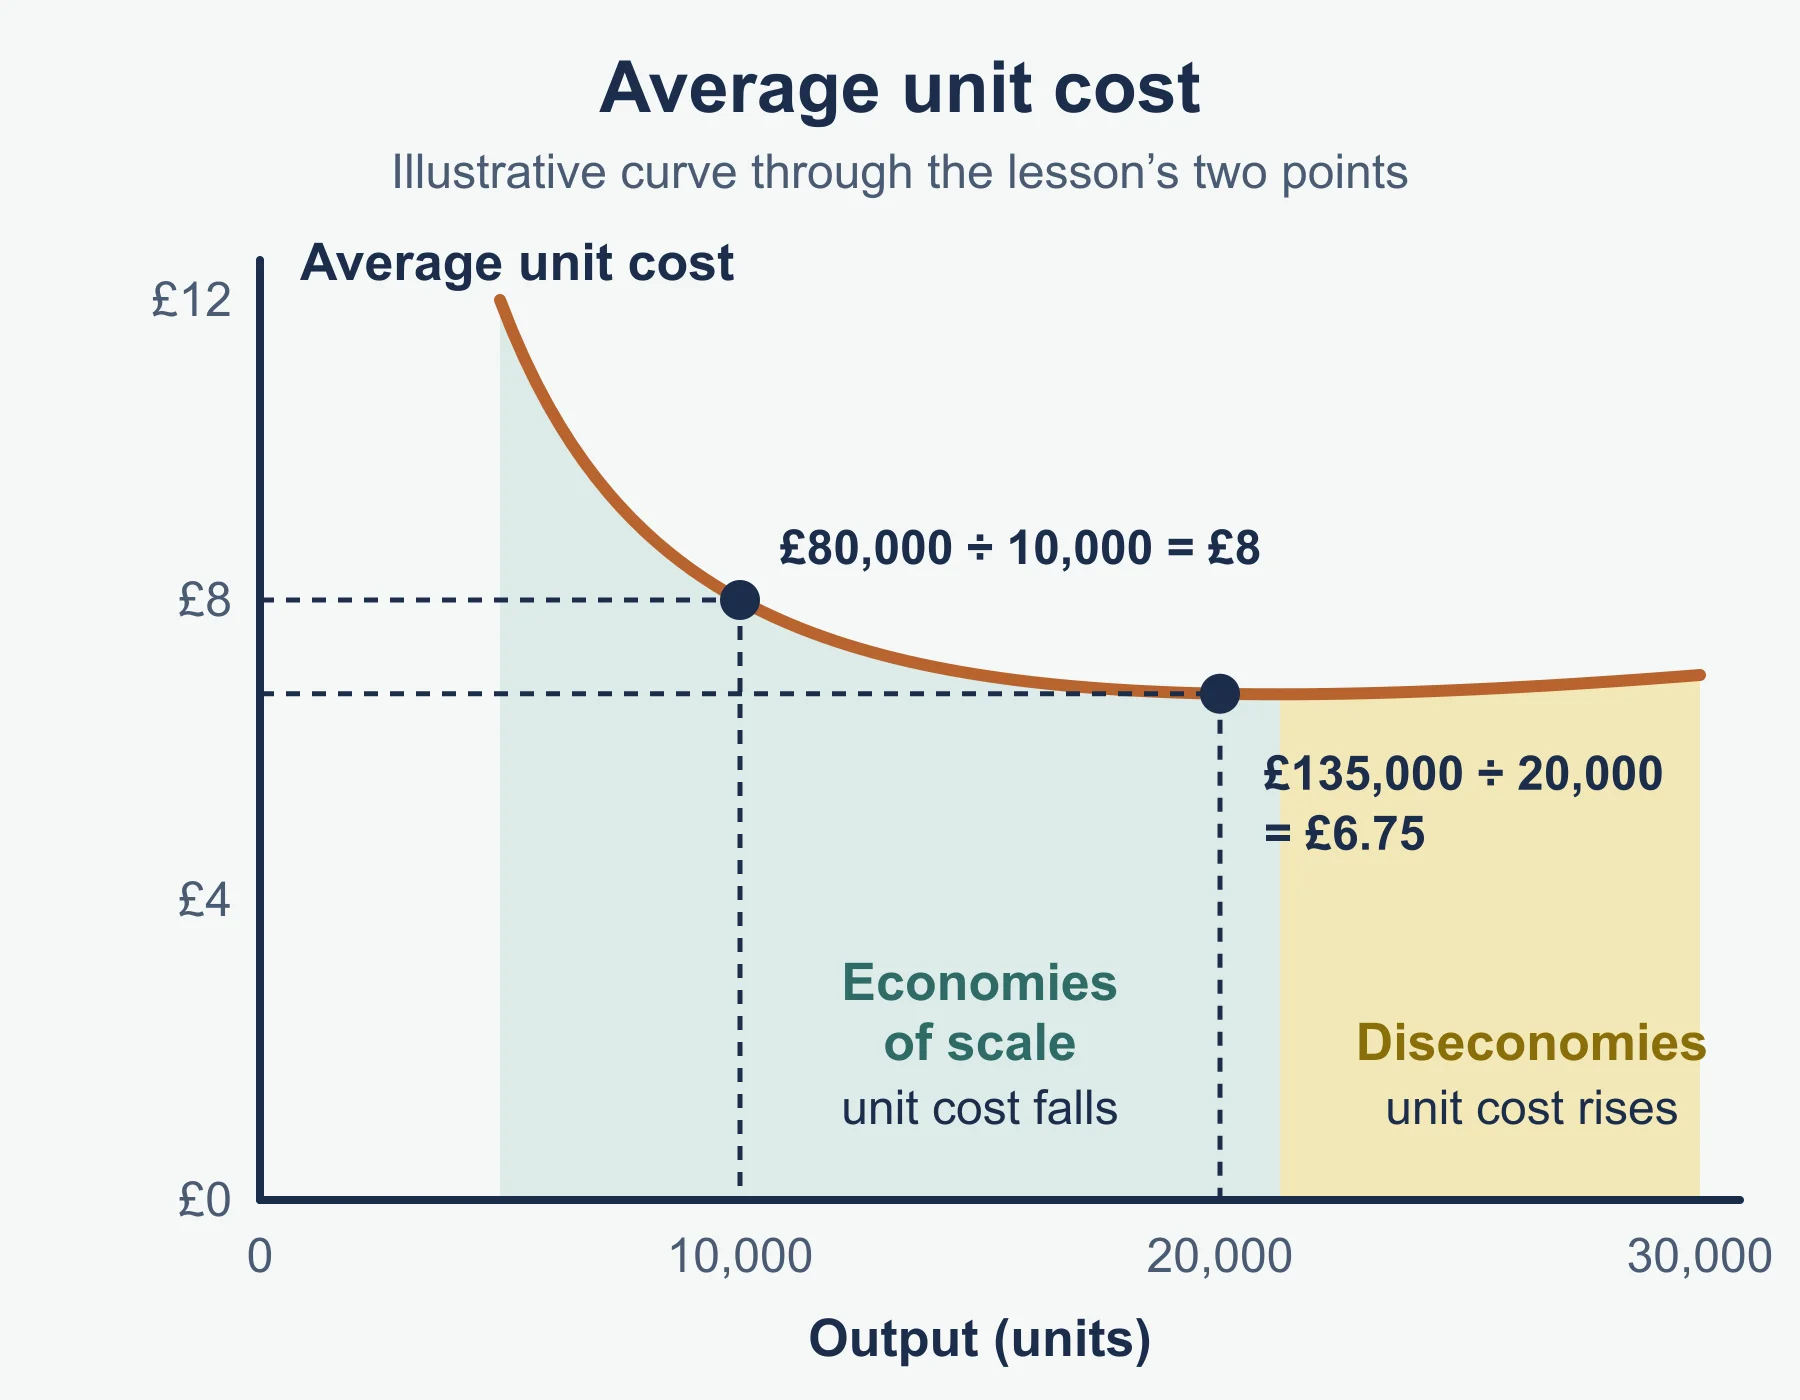
Economies of scale are the cost advantages a business gains as it increases its scale of production, so that average cost falls. Diseconomies of scale are the disadvantages of becoming too large, so that average cost rises.
Economies of scale
| Type | How average cost falls |
|---|---|
| Purchasing | Large orders of materials earn bulk discounts, so the price per unit falls |
| Marketing | One advertising campaign or sales team is spread over many more units |
| Financial | Large, established businesses are seen as lower risk, so lenders may charge a lower rate of interest |
| Managerial | A large business can afford specialist managers, such as a full-time finance manager, who run each function more effectively |
| Technical | Larger, more efficient machinery and mass-production methods are affordable and fully used |
Diseconomies of scale
| Type | What goes wrong |
|---|---|
| Poor communication | Messages pass through many layers and are delayed or distorted |
| Lack of commitment or loyalty from employees | Workers feel like a number, motivation falls, and absence, mistakes and staff turnover rise |
| Weak coordination | Departments and sites pull in different directions or duplicate work |
| Lack of control | Managers cannot supervise everyone, so waste and poor quality go unnoticed |
Worked example: the average cost curve
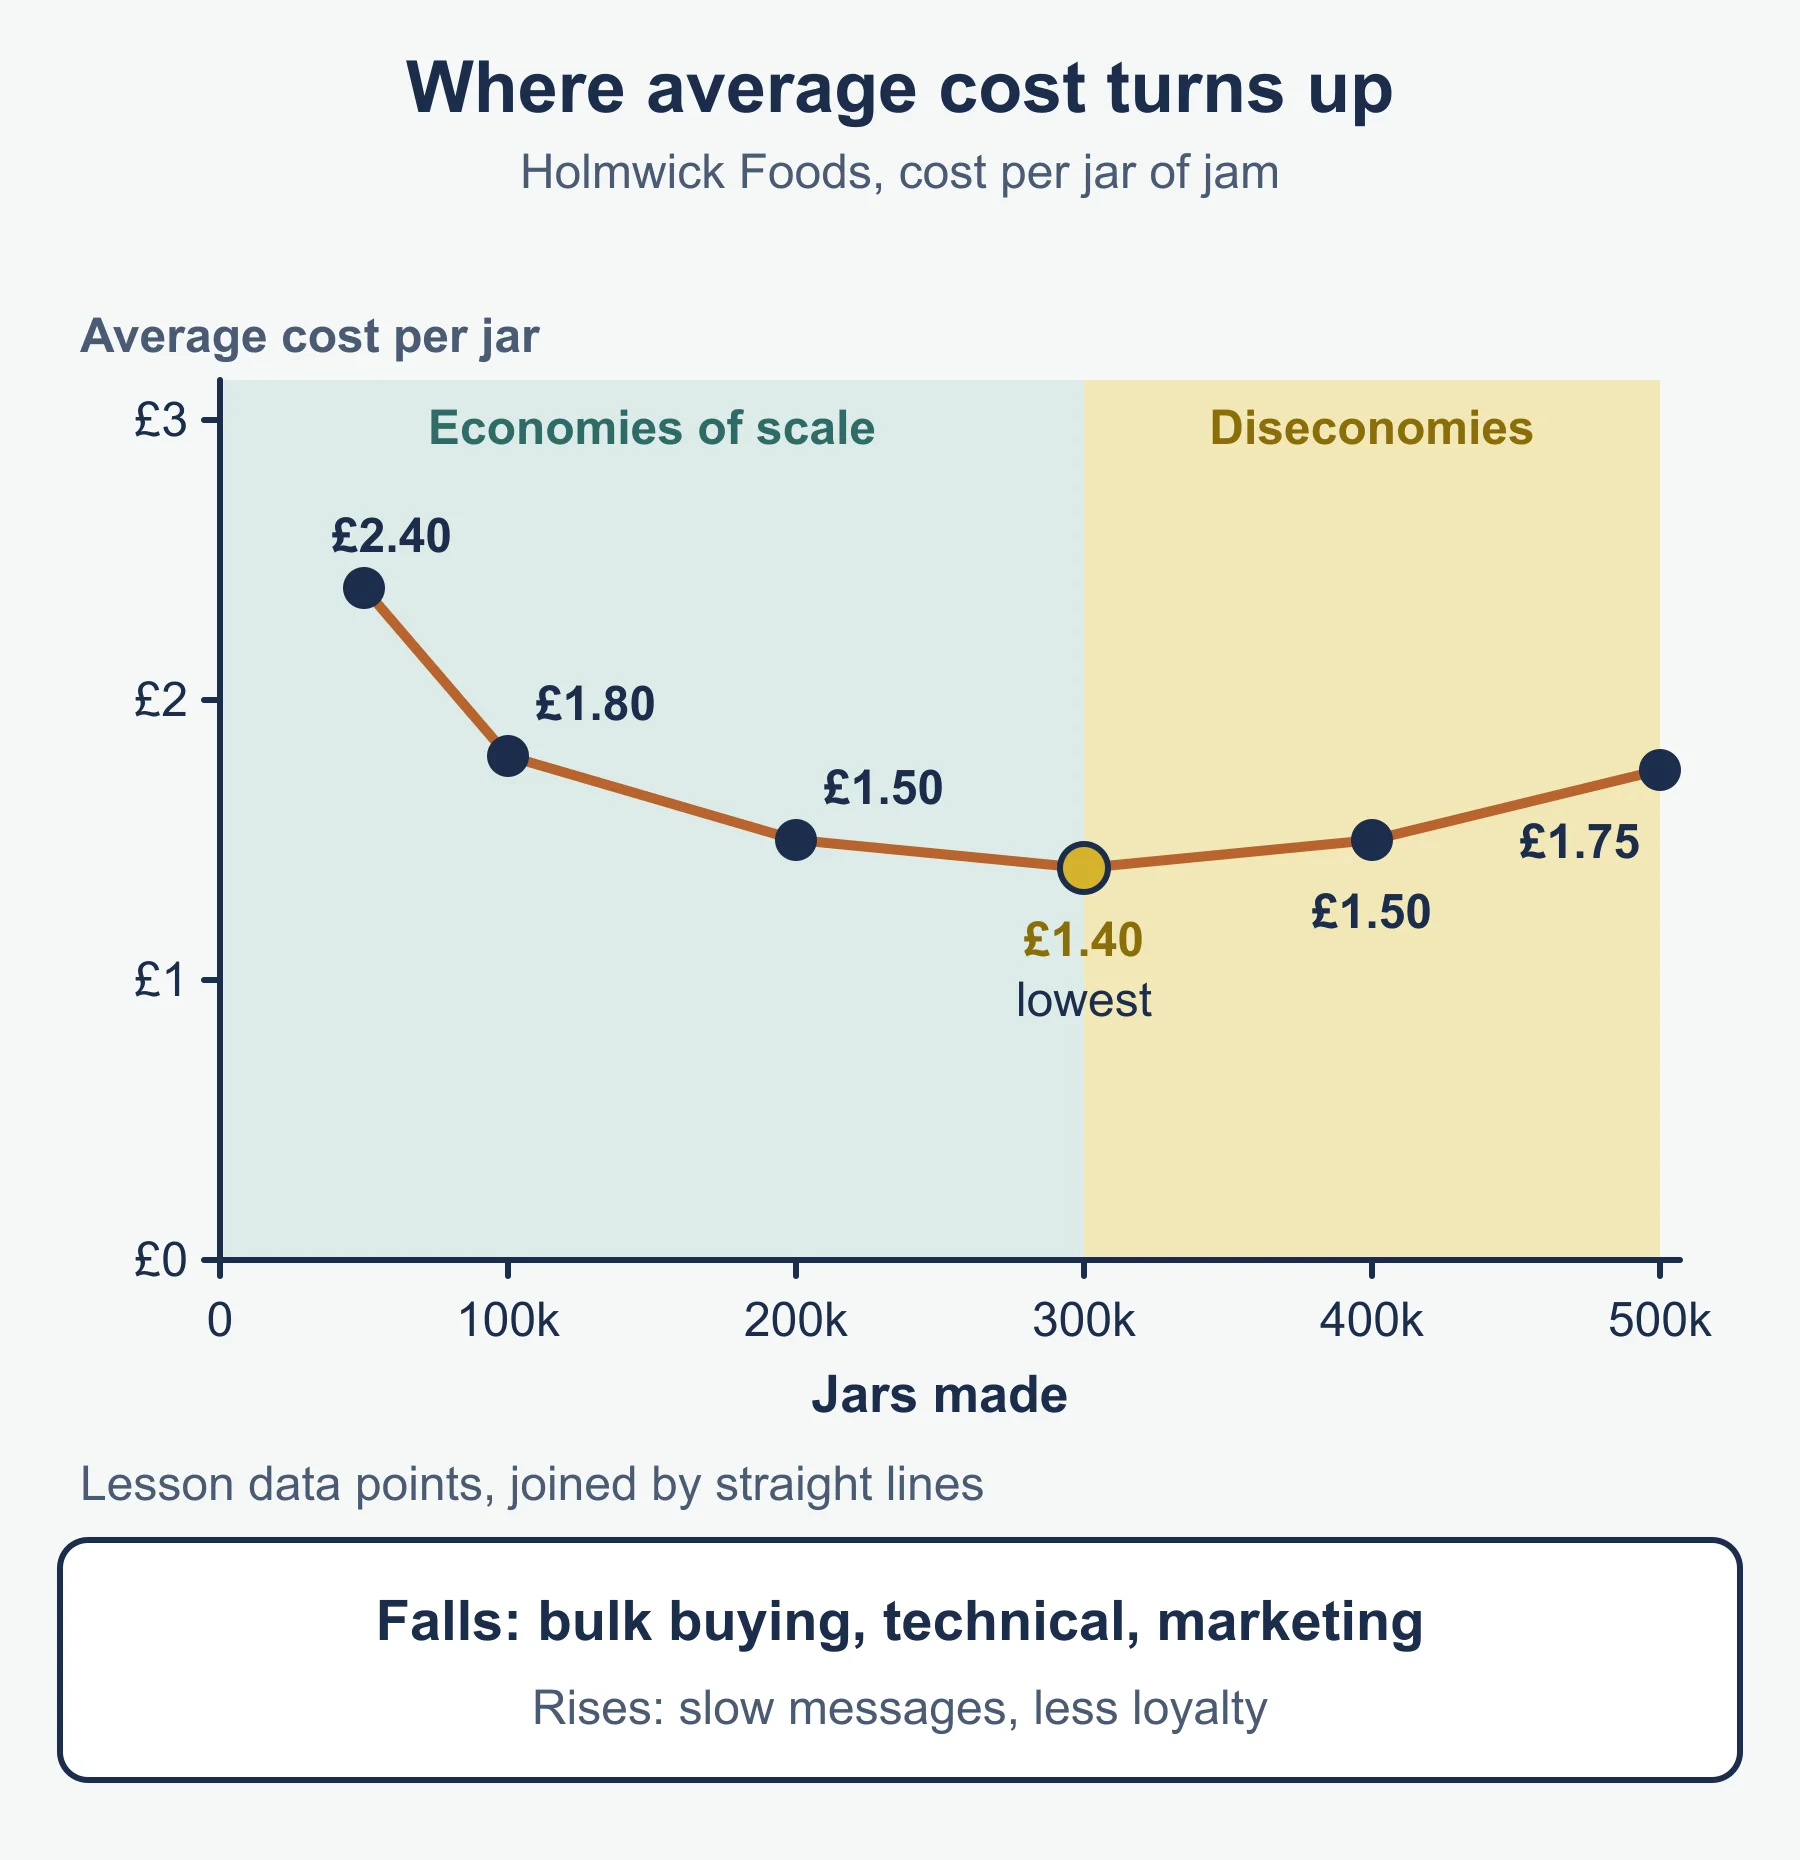
Holmwick Foods makes jam. Its average cost per jar at different output levels is:
| Output (jars) | 50,000 | 100,000 | 200,000 | 300,000 | 400,000 | 500,000 |
|---|---|---|---|---|---|---|
| Average cost | £2.40 | £1.80 | £1.50 | £1.40 | £1.50 | £1.75 |
| Total cost | £120,000 | £180,000 | £300,000 | £420,000 | £600,000 | £875,000 |
Total cost is average cost × output. Average cost falls until 300,000 jars, because Holmwick buys fruit and sugar in bulk (purchasing), uses one line for a bigger run (technical) and shares its advertising over more jars (marketing). Beyond 300,000 it rises. A typical explanation is that instructions between three factory sites arrive late (poor communication) and staff on the new site feel no loyalty to the firm (lack of commitment).
When you answer, name the type, say how it lowers average cost and tie it to the business in the question.
4.4.3 Break-even analysis
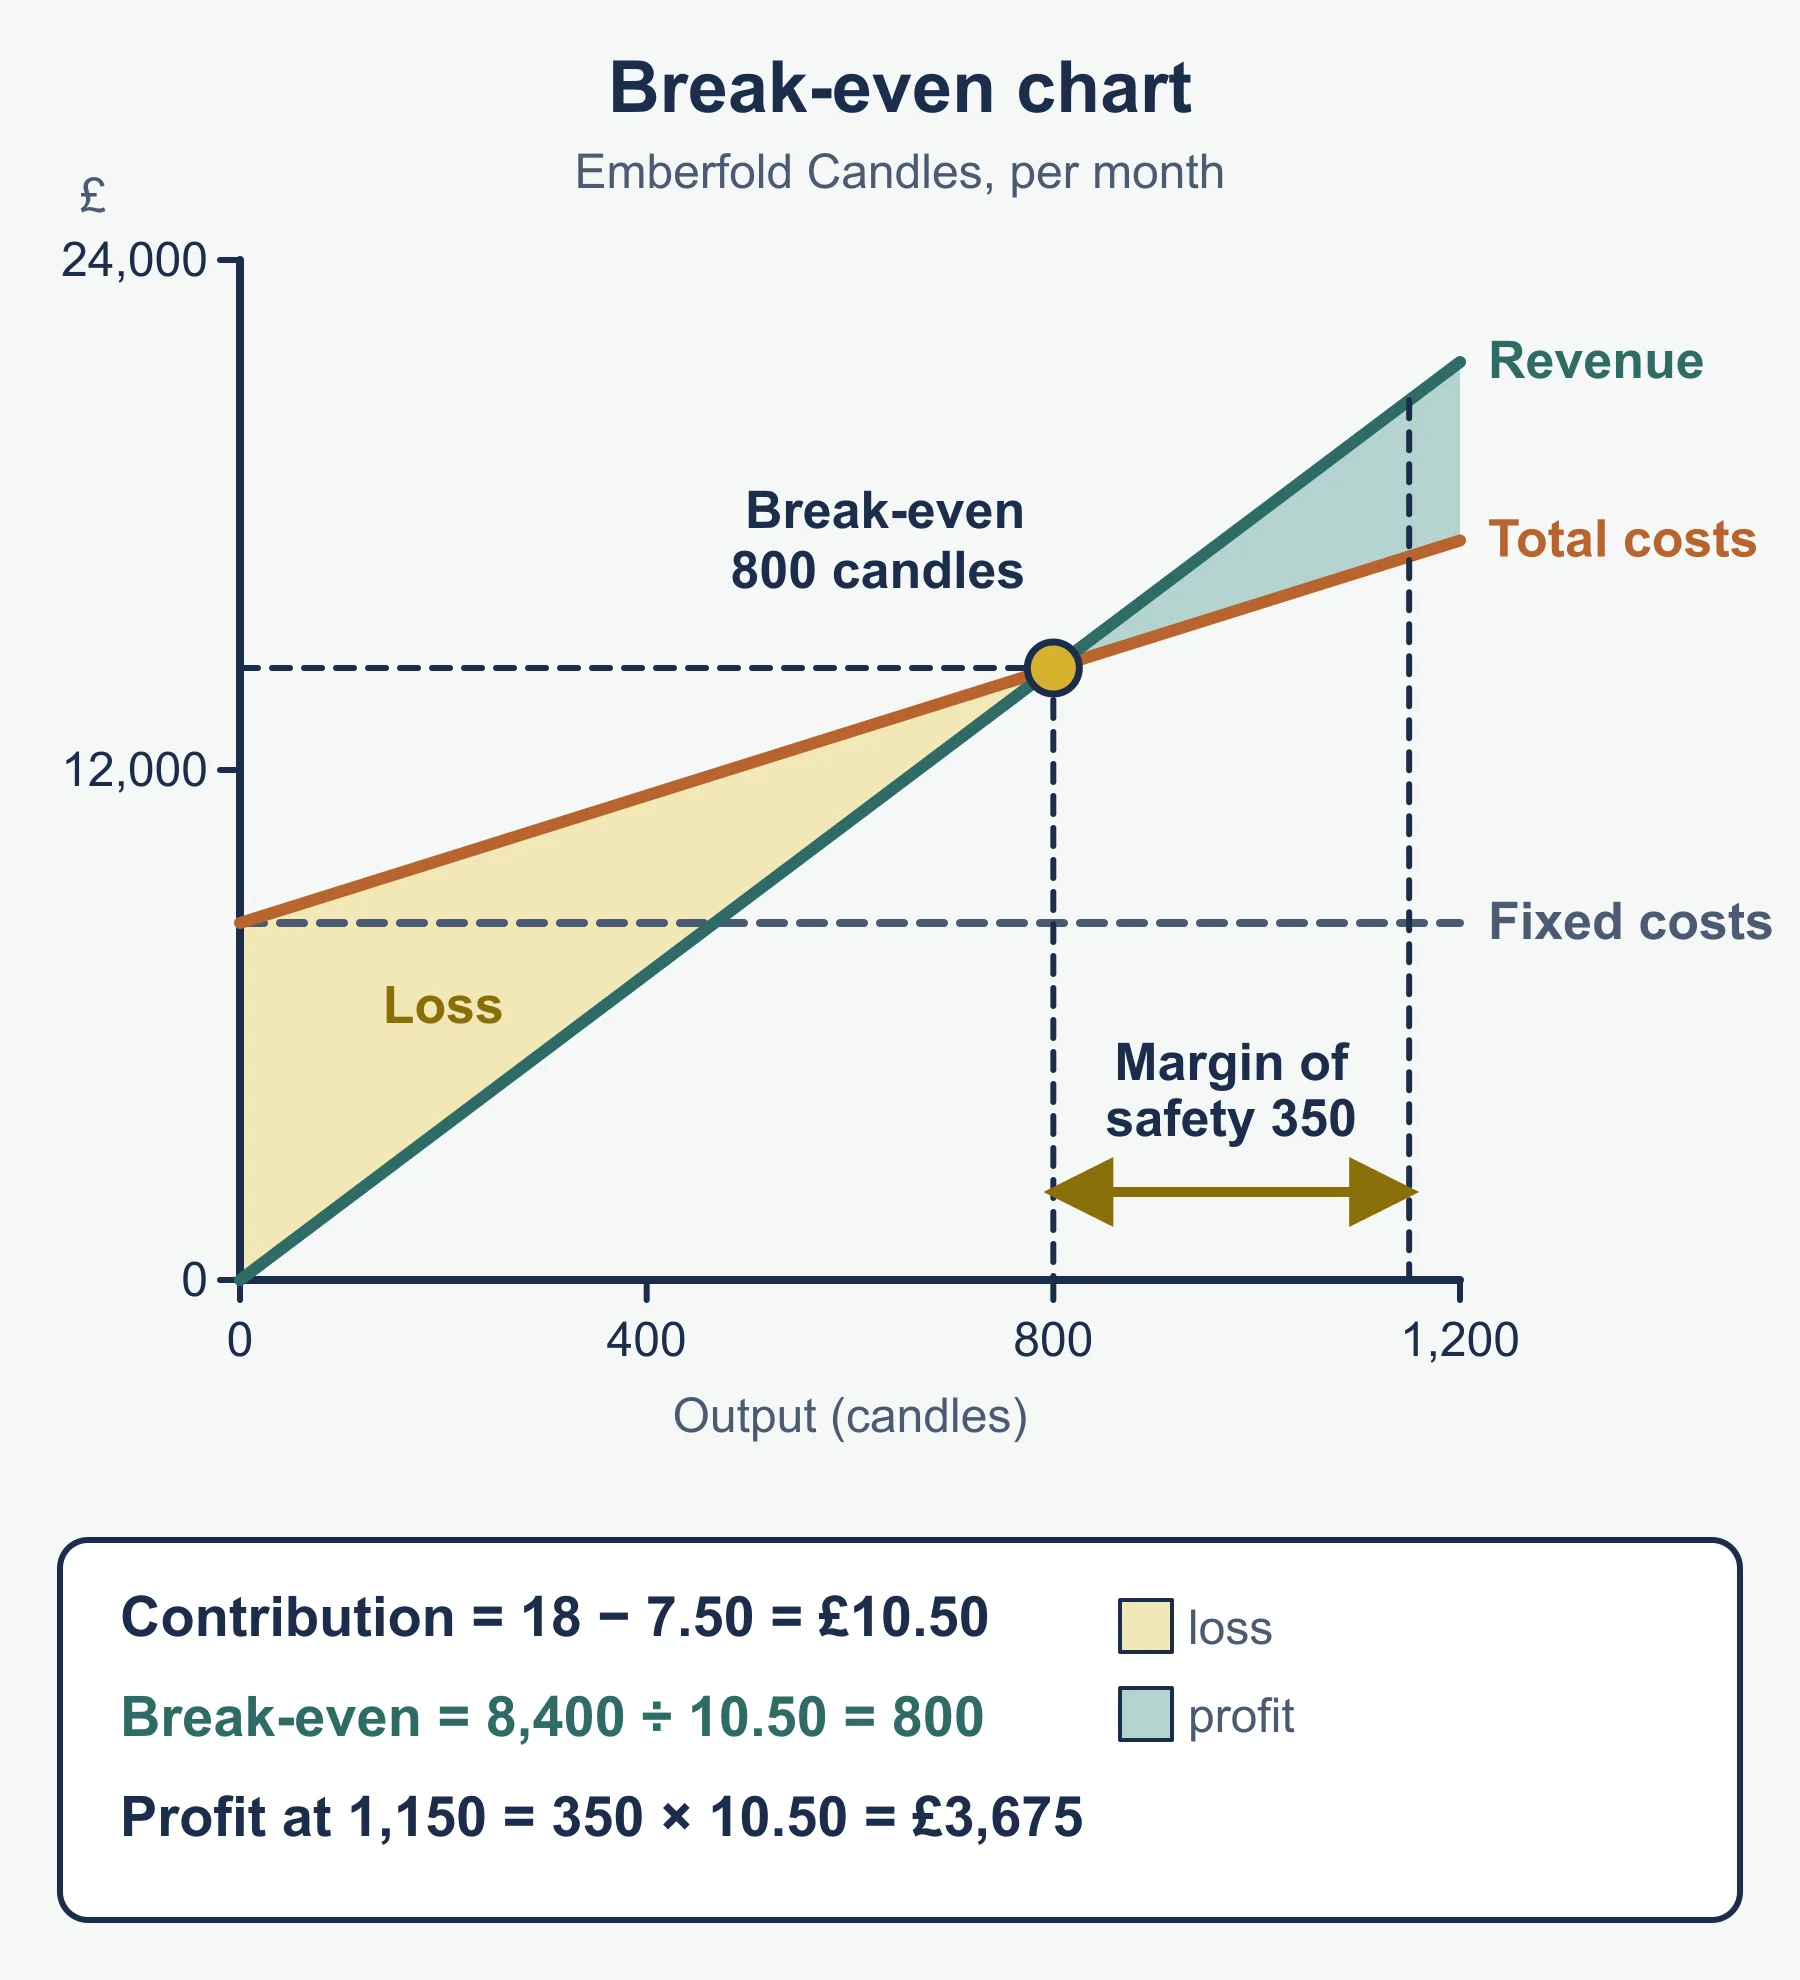
Break-even is the level of output at which total revenue equals total cost, so the business makes neither a profit nor a loss. Below that output it makes a loss. Above it, a profit.
| Term | Formula |
|---|---|
| Contribution per unit | selling price per unit − variable cost per unit |
| Break-even output | fixed costs ÷ contribution per unit (in units) |
| Margin of safety | actual number of sales − break-even number of sales (in units) |
The margin of safety shows the drop in sales, in units, the business can absorb while still avoiding a loss. A larger margin means a safer position.
Worked example: calculating
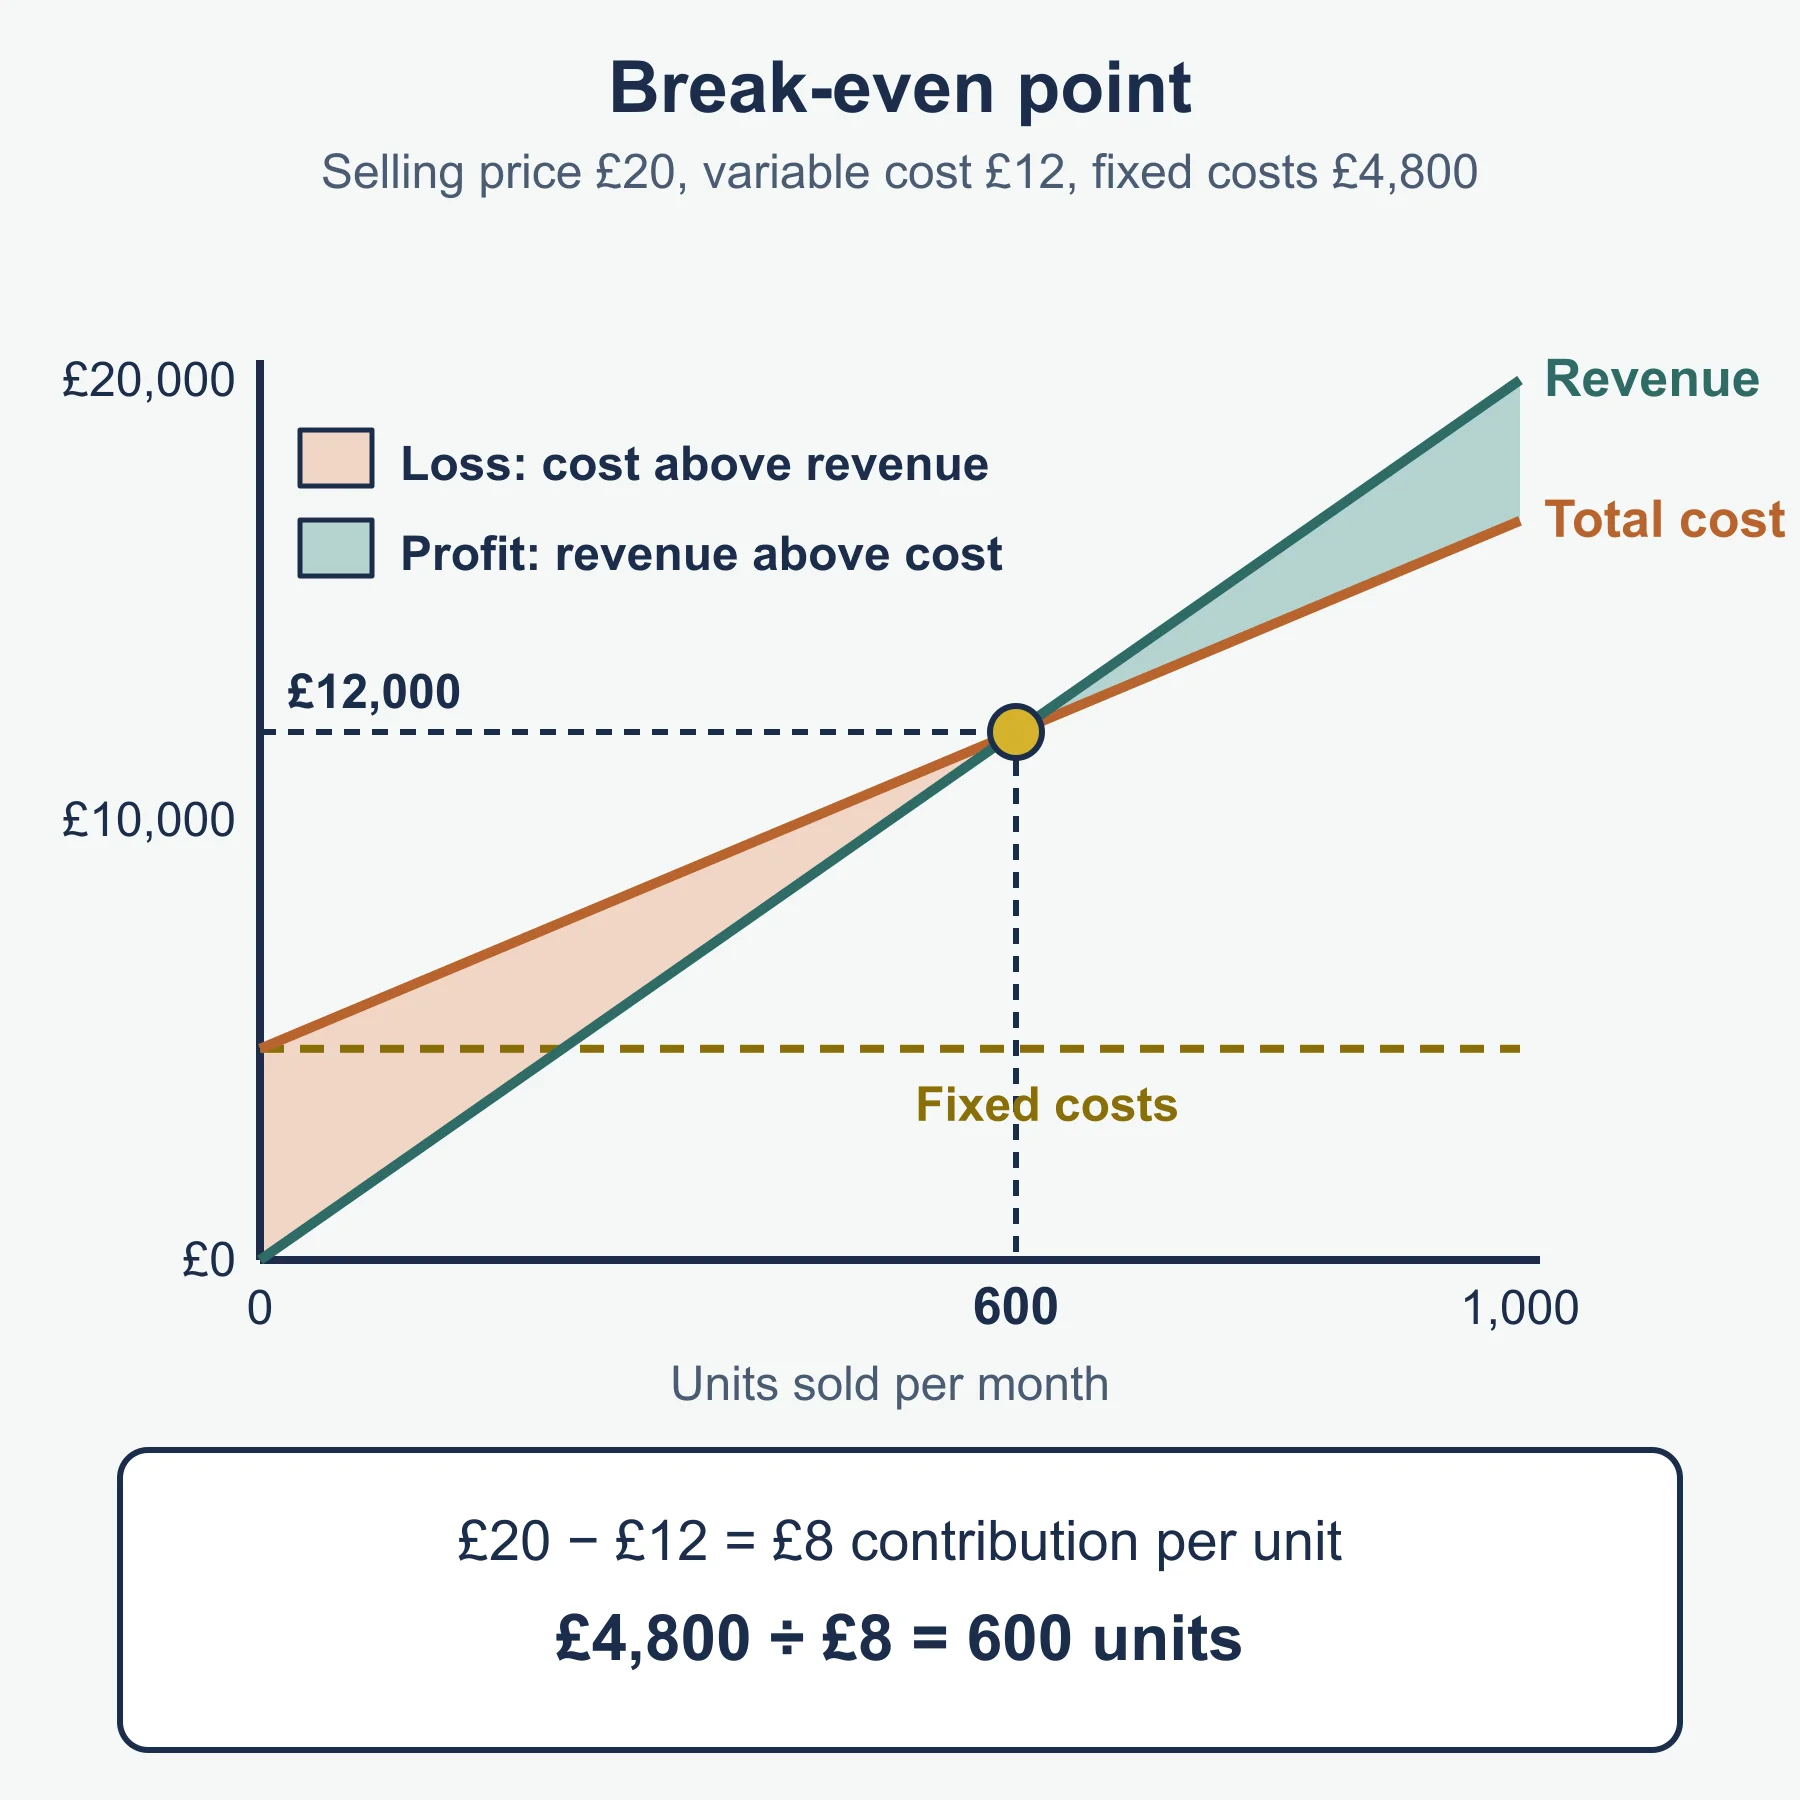
Rowanbank Cycles sells a bike for £250. Variable cost per bike is £100 and fixed costs are £30,000 a month.
- Contribution per unit = 250 − 100 = £150.
- Break-even output = 30,000 ÷ 150 = 200 bikes.
- Actual sales are 260 bikes, so margin of safety = 260 − 200 = 60 bikes.
- Profit at 260 bikes = 260 × 150 − 30,000 = £9,000.
If break-even output does not come out as a whole number, round up to the next whole unit, because the business must sell a full unit to cover its costs.
Drawing and reading a break-even chart
Output is on the horizontal axis and money on the vertical axis. Three lines are drawn: fixed costs (horizontal), total costs (starting at the fixed-cost level on the vertical axis and rising by the variable cost of each unit) and total revenue (starting at the origin). Rowanbank’s points are:
| Output (bikes) | 0 | 100 | 200 | 300 | 400 |
|---|---|---|---|---|---|
| Total revenue | 0 | 25,000 | 50,000 | 75,000 | 100,000 |
| Fixed costs | 30,000 | 30,000 | 30,000 | 30,000 | 30,000 |
| Total costs | 30,000 | 40,000 | 50,000 | 60,000 | 70,000 |
A rough sketch of the chart, money (in thousands) against output:
 100 |                          / revenue
  75 |                    .  /
  50 |              X   / .   total cost
  30 |--------------/---------- fixed costs
  25 |        /  .
   0 +----------------------------
       0    100   200   300   400
The lines cross at X, at 200 bikes and £50,000. To interpret the chart:
- The break-even point is where revenue and total cost cross.
- To the left, total cost is above revenue, so there is a loss. At 120 bikes revenue is 30,000 and total cost 42,000, a loss of £12,000.
- To the right, revenue is above total cost, so there is a profit.
- The margin of safety is the gap between actual output and the break-even output on the horizontal axis.
- Measured upwards at a given output, the space separating revenue from total cost shows the profit or loss.
Completing a chart. If the total cost line is missing, plot the fixed cost level at zero output, calculate total cost at one other output, and join the points with a straight line. Check that it starts at the fixed cost level.
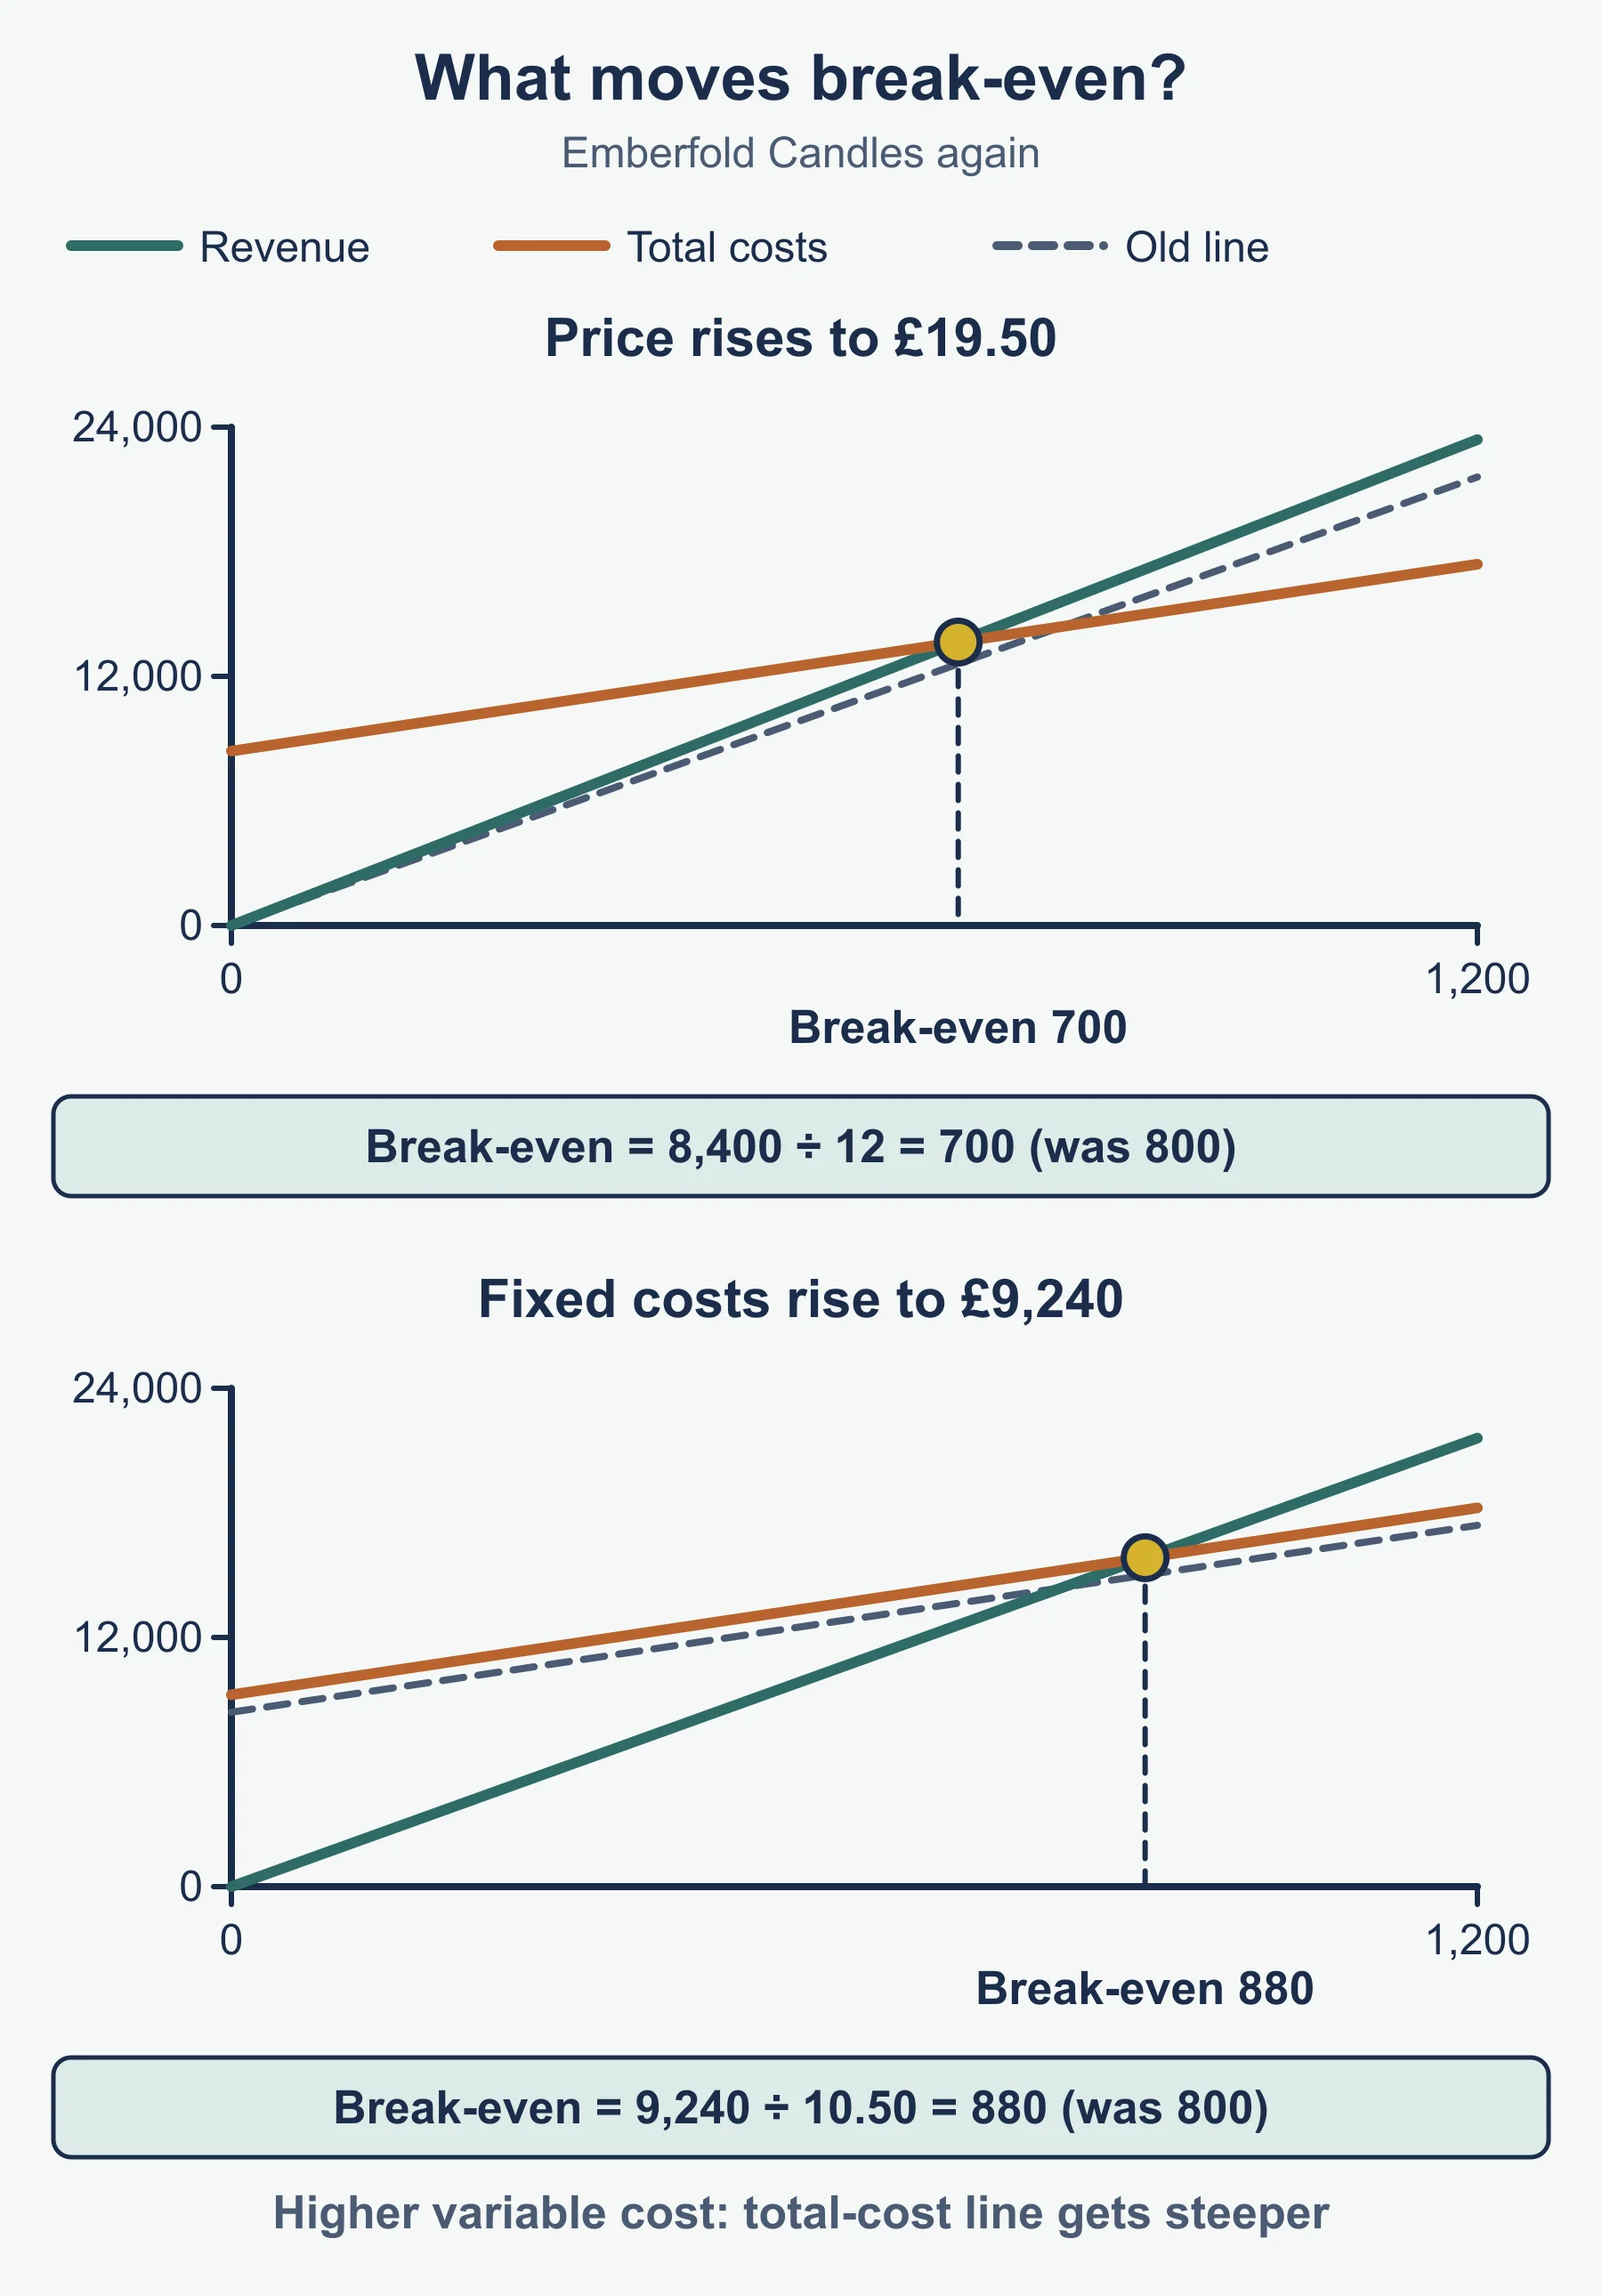
Amending a chart. A change to the inputs moves a line:
| Change | Effect on the chart |
|---|---|
| Higher selling price | The revenue line becomes steeper, so break-even moves left |
| Higher fixed costs | The fixed cost line and the total cost line both move up, so break-even moves right |
| Higher variable cost per unit | The total cost line becomes steeper, so break-even moves right |
Using break-even analysis to help decisions
Recalculate break-even output with the new figures, then compare it with expected sales.
| Rowanbank change | Working | New break-even output |
|---|---|---|
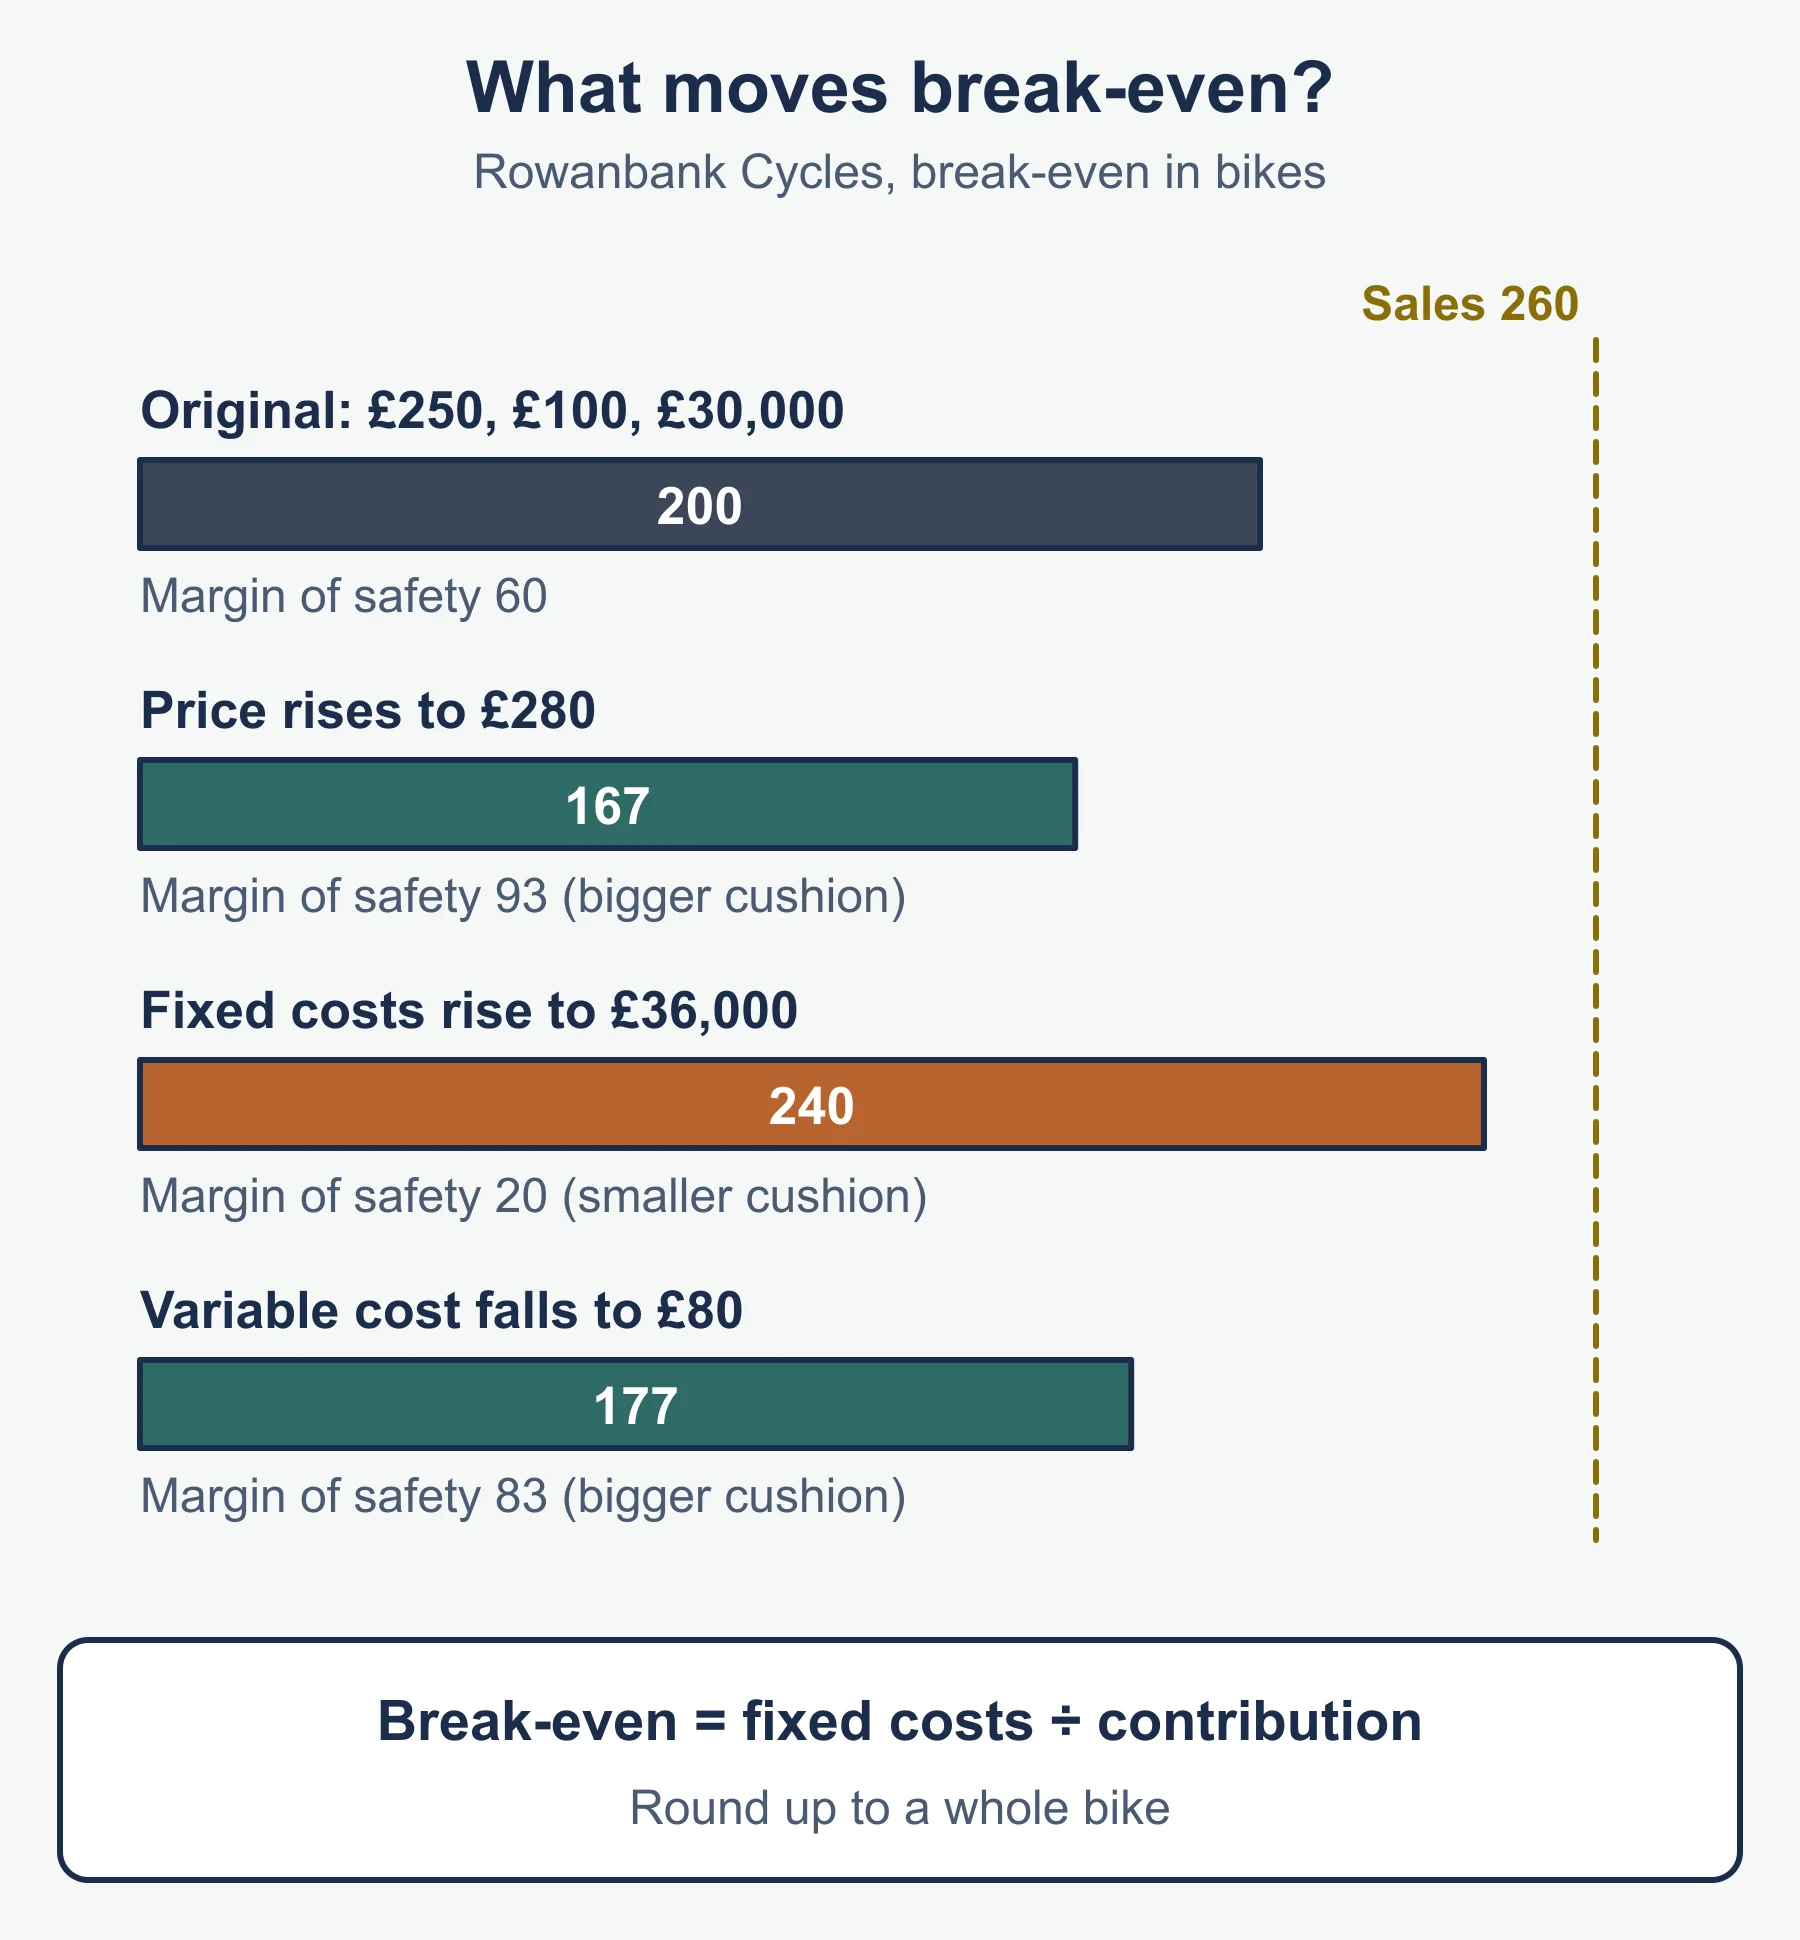
| Price rises to £280 | 30,000 ÷ (280 − 100) = 30,000 ÷ 180 | 167 bikes (166.7 rounded up) |
| Fixed costs rise to £36,000 | 36,000 ÷ 150 | 240 bikes |
| Variable cost falls to £80 | 30,000 ÷ (250 − 80) = 30,000 ÷ 170 | 177 bikes (176.5 rounded up) |
A higher price lowers break-even output, but it may also cut the number of bikes people buy. With a £280 price and sales still at 260, the margin of safety would be 260 − 167 = 93 bikes. If sales fell to 150 because of the price rise, the business would sit below break-even. The calculation shows the target; judging demand is a separate task.
Limitations of break-even analysis
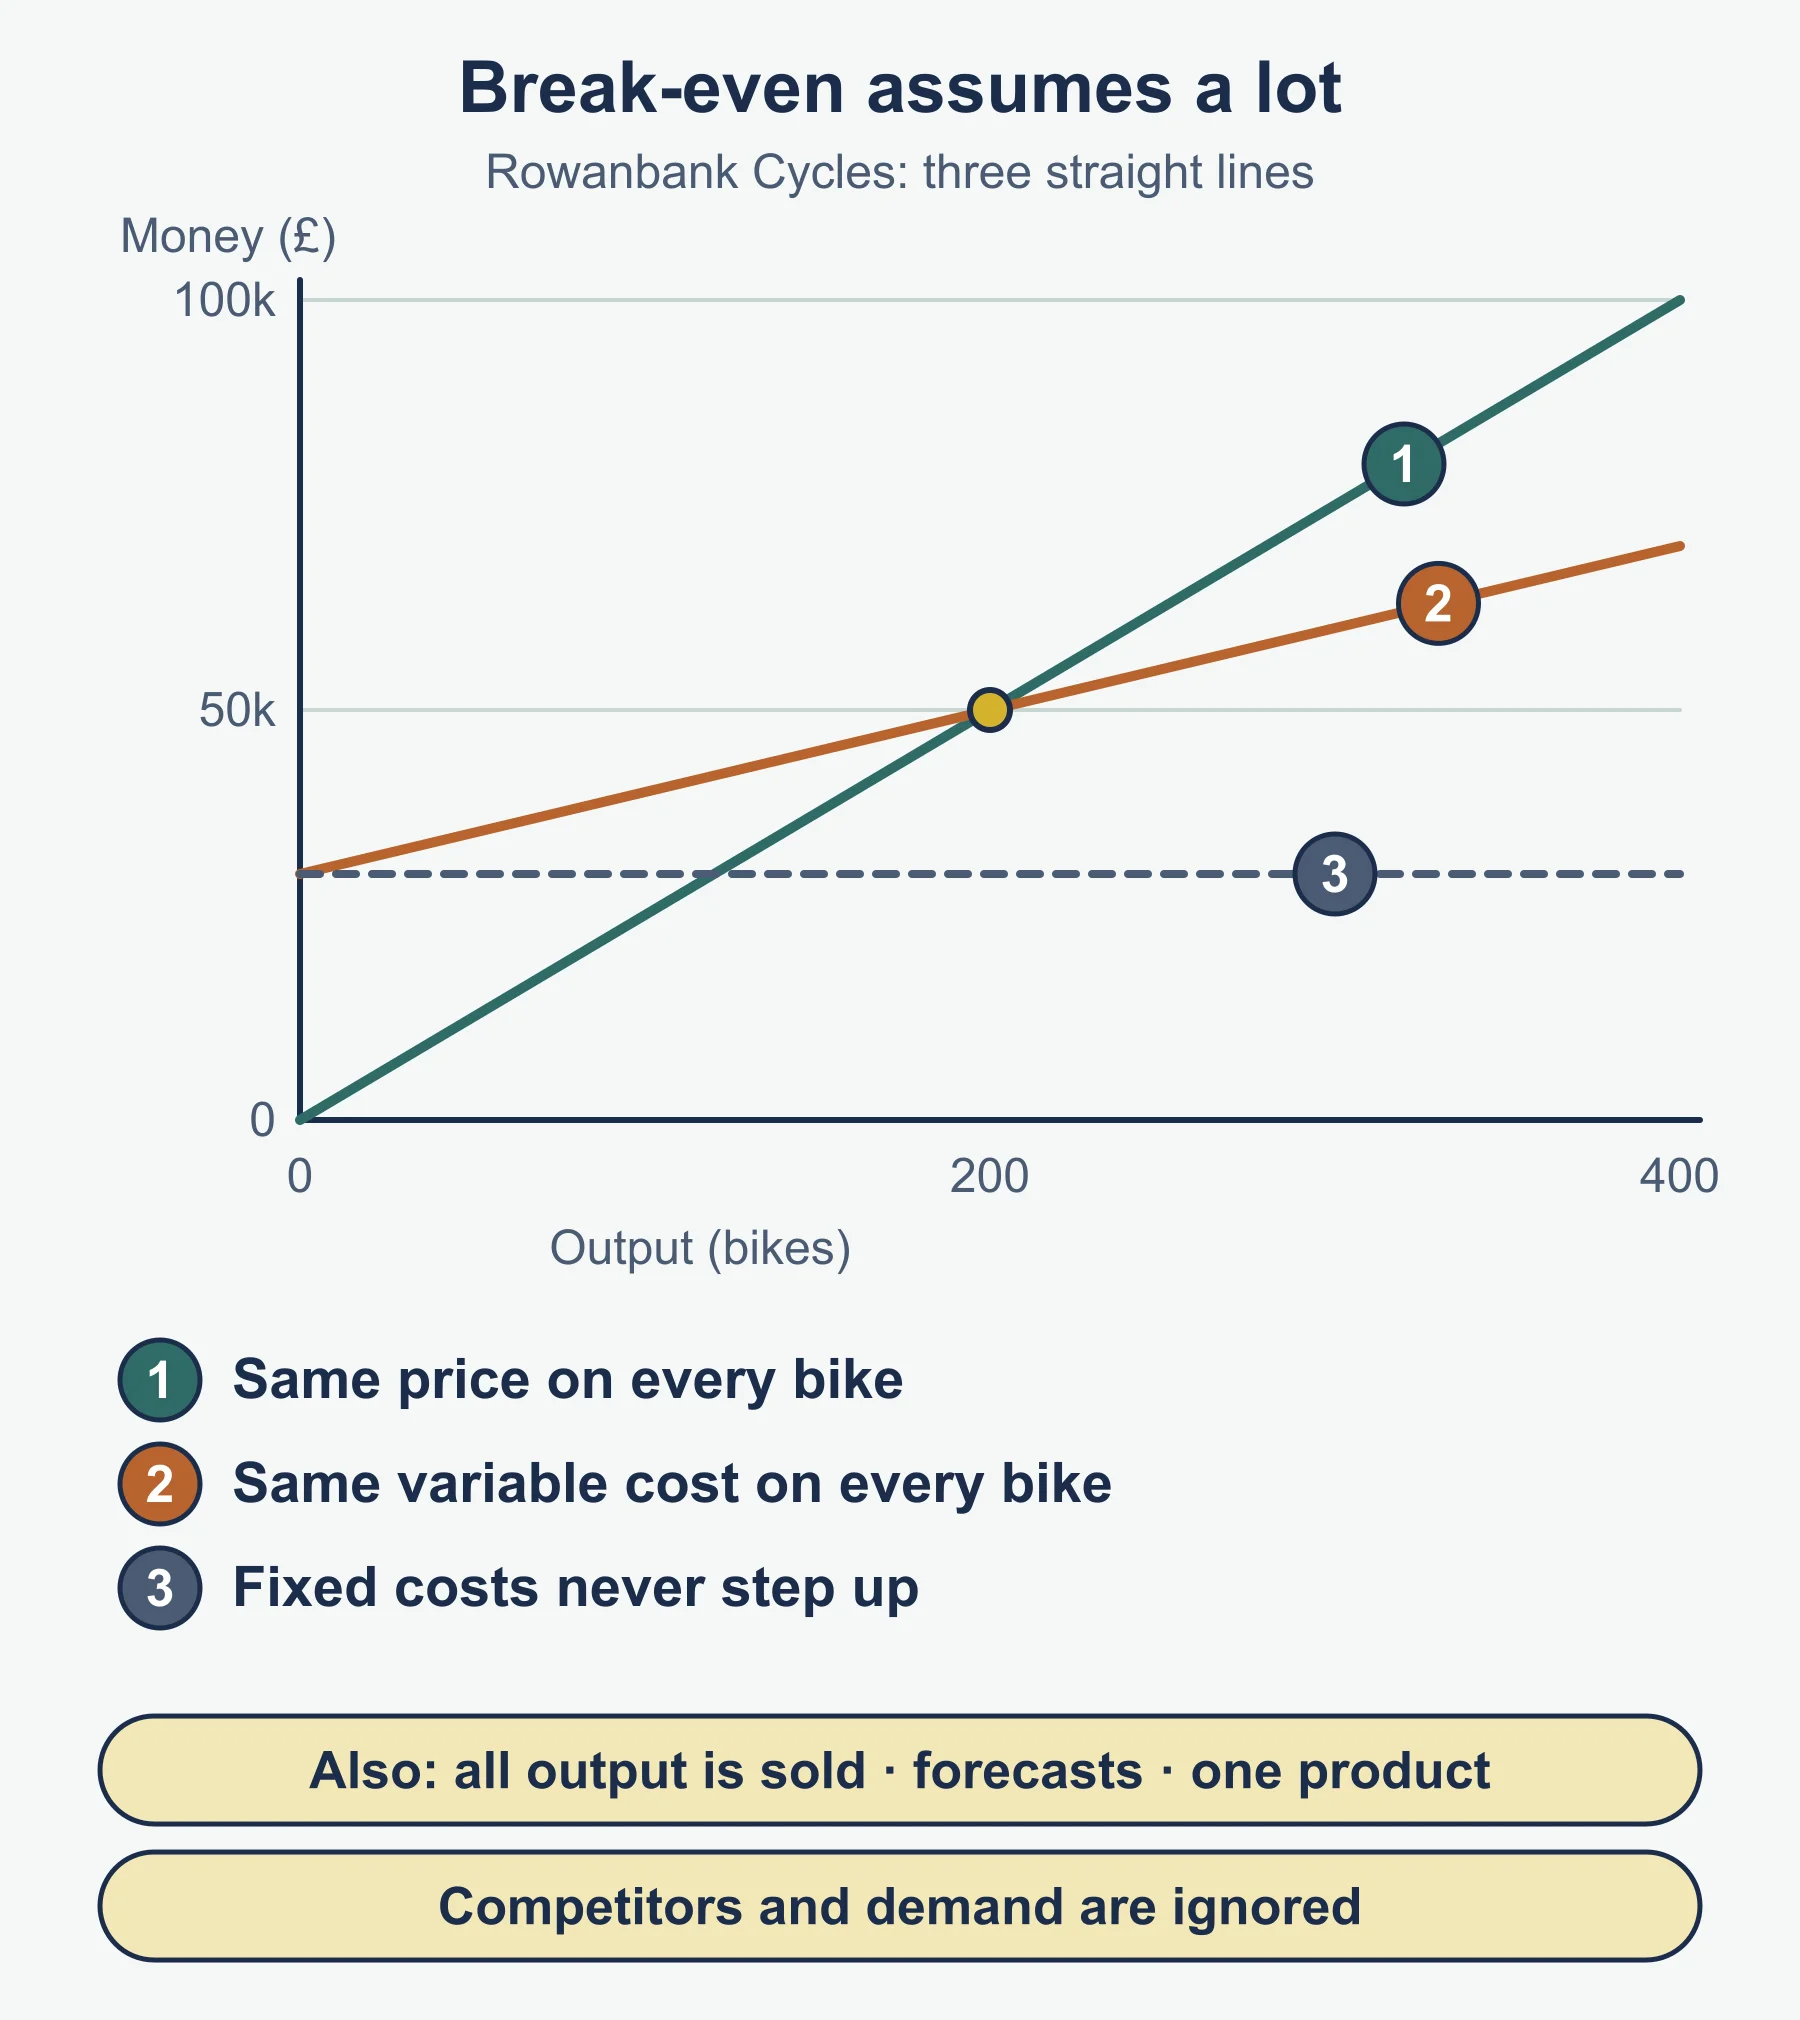
- It assumes everything made is sold. Unsold stock adds cost without revenue.
- It assumes a constant selling price. Discounts and special offers are ignored.
- It assumes variable cost per unit stays the same. Bulk discounts on materials, or overtime, change it.
- It assumes fixed costs stay fixed. A big rise in output may need a bigger factory.
- It suits one product; sharing costs across many products is difficult.
- It uses forecasts, which may be wrong.
- It ignores the market: competitors, changing demand and the economy.
Common errors
- Mixing up variable cost per unit and average cost.
- Writing contribution as revenue minus fixed costs. Contribution per unit uses variable cost per unit.
- Leaving out units. Break-even output and margin of safety are in units, not money.
- Starting the total cost line at the origin.
- Listing a type of economy of scale without saying how it reduces average cost.
Command words
The syllabus defines Justify as support a case with evidence or argument. For a justify question about cost data, give a reason on each side before your decision.
Frequently asked questions
What is the difference between fixed and variable costs? Fixed costs do not change when output changes, within the range a business normally works at, such as rent. Variable costs change directly with output, such as materials.
What are economies of scale? Economies of scale are the cost advantages a business gains as it increases its scale of production, so average cost falls. Diseconomies of scale are when average cost rises as the business grows.
How can cost data help a business make decisions? The syllabus gives four example decisions: what price to set, which product to produce, whether to continue or stop production, and which supplier to choose. Compare the cost data with revenue in each case.
What does break-even mean? Break-even is the level of output at which total revenue equals total cost, so the business makes neither a profit nor a loss.
Official syllabus
Cambridge IGCSE Business 0264 syllabus for examination in 2027, 2028 and 2029, Cambridge University Press & Assessment, section 4.4 and the Formulas and ratios section.
Get free revision emails (optional)
Occasional emails with practice questions, worked explanations and links to free resources for the qualification and subjects you choose. No spam, and you can unsubscribe from any email. The free tools on this site never need an email.
Related resources
-
Practice questions
IGCSE Business: Costs, scale of production and break-even analysis (Cambridge 0264) – Practice Questions
Twelve original practice questions with worked answers on Cambridge IGCSE Business 0264 section 4.4: costs, economies of scale and break-even.
Business · Cambridge · IGCSE
Try questions -
Revision notes
IGCSE Business: Costs, scale of production and break-even analysis (Cambridge 0264) – Revision Notes
Condensed revision notes for Cambridge IGCSE Business 0264 section 4.4: cost formulas, economies of scale, break-even and margin of safety.
Business · Cambridge · IGCSE
Revise topic -
Study guides
IGCSE Business: Production of goods and services (Cambridge 0264)
Study guide to Cambridge IGCSE Business 0264 section 4.1: labour productivity, efficiency, lean production, inventory and job, batch and flow production.
Business · Cambridge · IGCSE
Read guide
Related articles
-
teaching
A Level tuition in Dubai: Cambridge or Pearson Edexcel International A Level?
Schools in Dubai and Abu Dhabi teach either Cambridge International AS & A Level or Pearson Edexcel International A Level. How the two are structured, why it matters for tuition, and how online classes from Lahore work.
9 October 2026
-
curriculum guides
Choosing subjects at IGCSE and A Level
How subject choices at 14 and 16 affect university options later, and how to keep pathways open without overloading a timetable.
28 July 2026
Studying this with a teacher
Working through Business IGCSE?
This page is free and stays free. If you would rather be taught it, Marlbridge runs Business classes one-to-one and in small groups of up to 15, online in your own time zone. The first trial class is free. WhatsApp replies within an hour (8am–11pm Pakistan time, every day); email the same day.
Cambridge Business teachers at Marlbridge

