
Revision Notes
IGCSE Business: Costs, scale of production and break-even analysis (Cambridge 0264) – Revision Notes
Condensed revision notes for Cambridge IGCSE Business 0264 section 4.4: cost formulas, economies of scale, break-even and margin of safety.
- Subject
- Business
- Level
- IGCSE
- Topic
- Operations management
- Author
- Marlbridge Academic Team
- Updated
- Reviewed by
- Salman Ahmad (what this means)
Aligned to Cambridge IGCSE Business (0264), For examination in 2027, 2028 and 2029. Official specification .
Syllabus page (what it covers and how it is assessed): Cambridge IGCSE Business.
Syllabus points this page covers
0264
- 4.4 Costs, scale of production and break-even analysis
Found an error? Report a correction.
Need help with this topic? Request a free trial class for IGCSE Business (0450 / 0264).
These notes condense section 4.4, Costs, scale of production and break-even analysis, of the Cambridge IGCSE Business 0264 syllabus for examination in 2027, 2028 and 2029. They cover 4.4.1 costs, 4.4.2 economies and diseconomies of scale and 4.4.3 break-even analysis. For full explanations and longer worked examples, read the study guide first, then test yourself with the practice questions. The course hub, the checklist lets you tick off progress, and the free diagnostics show weak spots. All businesses below are invented and money is in pounds.
Key definitions
| Term | Meaning |
|---|---|
| Fixed costs | Costs that do not change with output (rent, insurance, managers’ salaries) |
| Variable costs | Costs that change directly with output (materials, packaging) |
| Total cost | Total fixed costs + total variable costs |
| Average cost | Total cost ÷ number of units |
| Contribution per unit | Selling price per unit − variable cost per unit |
| Break-even | Output at which total revenue equals total cost: no profit and no loss |
| Margin of safety | Actual number of sales − break-even number of sales |
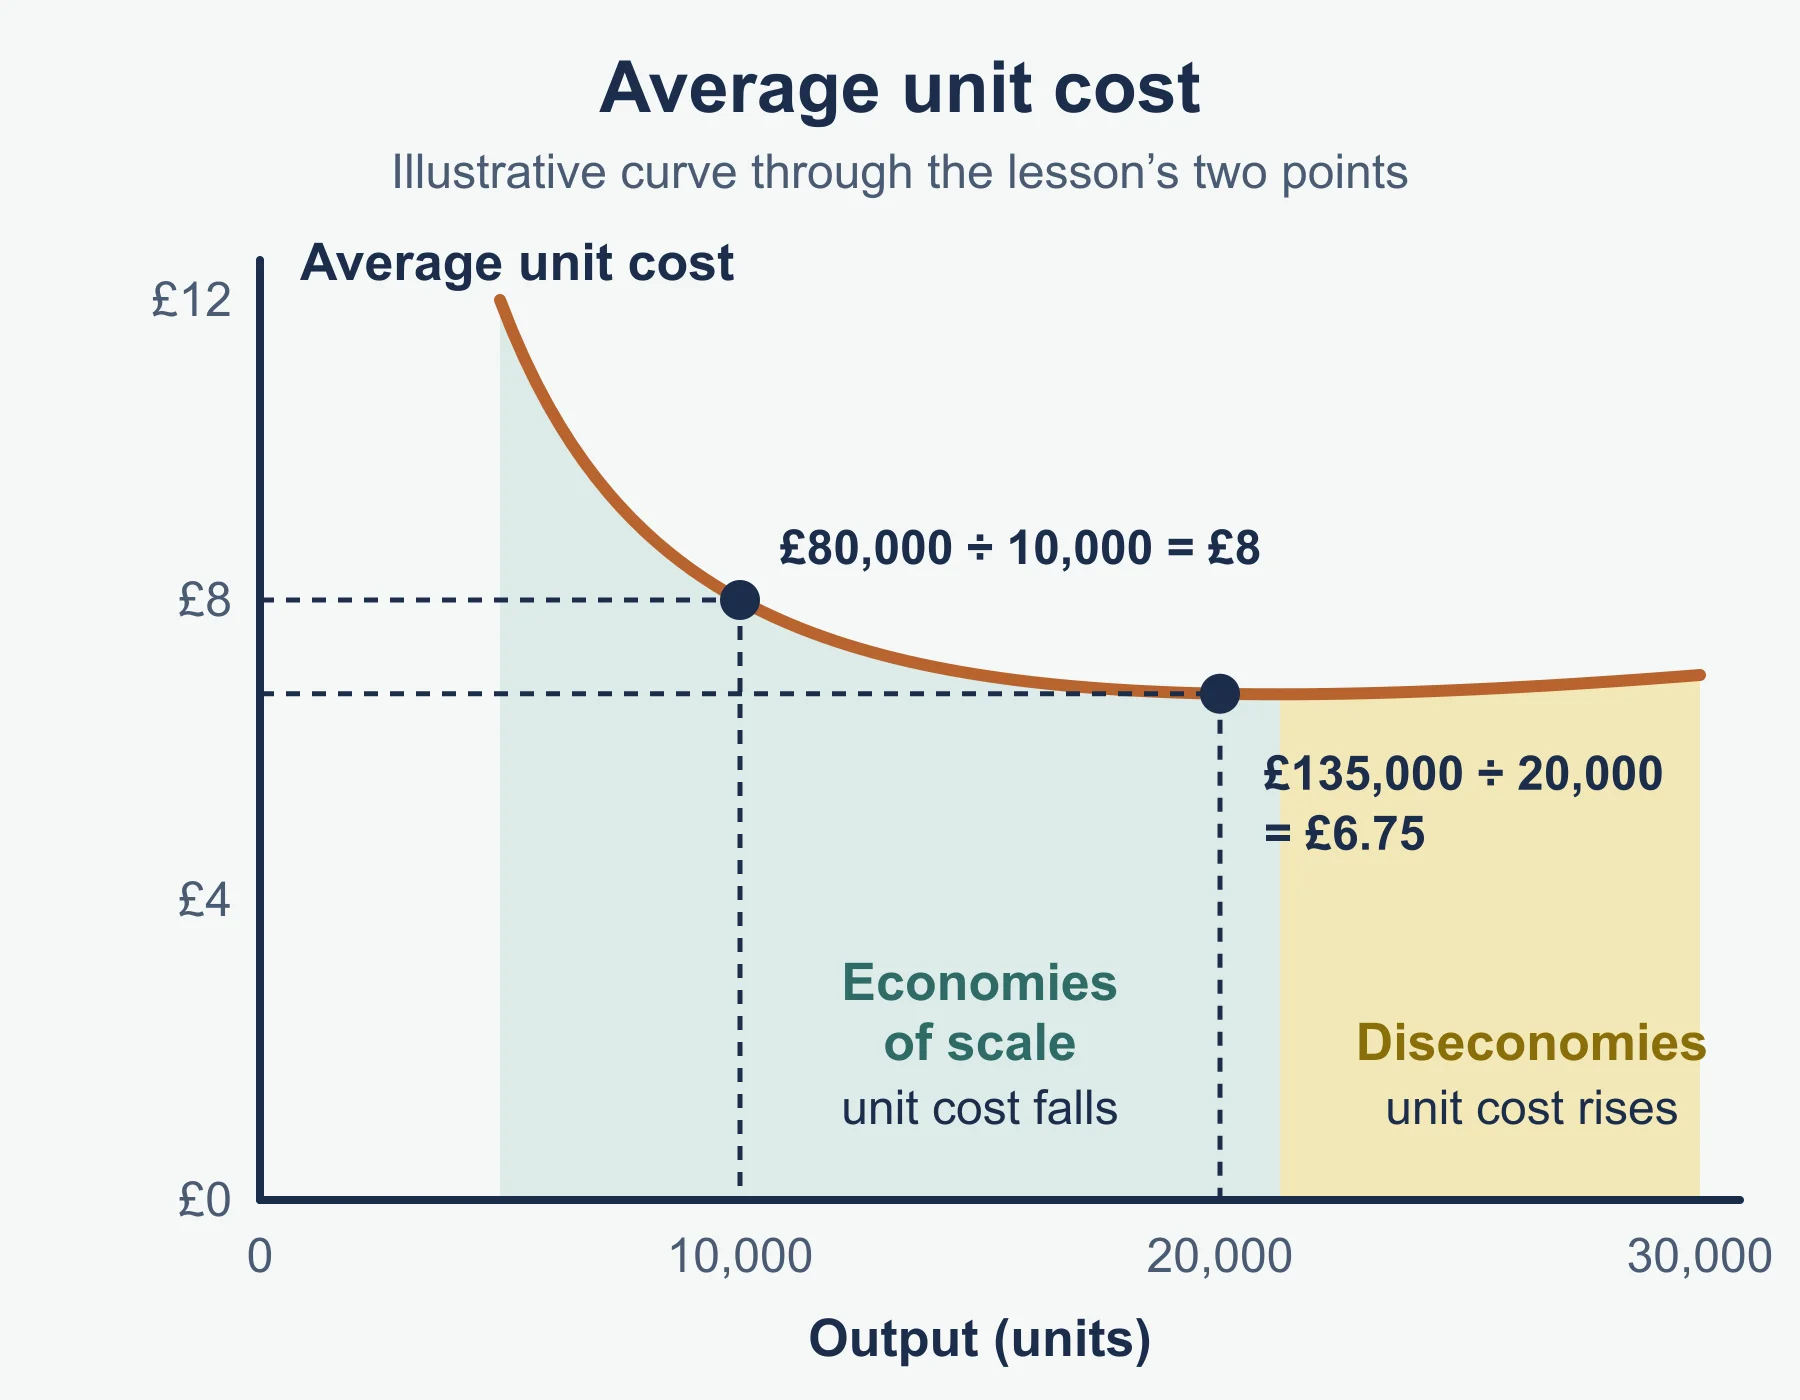
| Economies of scale | Falling average cost as a business increases its scale of production |
| Diseconomies of scale | Rising average cost because a business has become too large |
Formulas
| Calculation | Formula | Unit |
|---|---|---|
| Total variable cost | variable cost per unit × number of units | money |
| Variable cost per unit | total variable cost ÷ number of units | money |
| Total cost | total fixed costs + total variable costs | money |
| Average cost | total cost ÷ number of units | money per unit |
| Break-even output | fixed costs ÷ contribution per unit | units |
| Margin of safety | actual sales − break-even sales | units |
These are the forms given in the syllabus’s “Formulas and ratios” section. Revenue is selling price per unit × number of units sold, and profit is total revenue − total costs.
Costs in steps
- Sort each cost: does it change as output changes? If not, it is fixed. If so, it is variable.
- Total variable cost = variable cost per unit × units.
- Total cost = fixed + total variable.
- Average cost = total cost ÷ units.
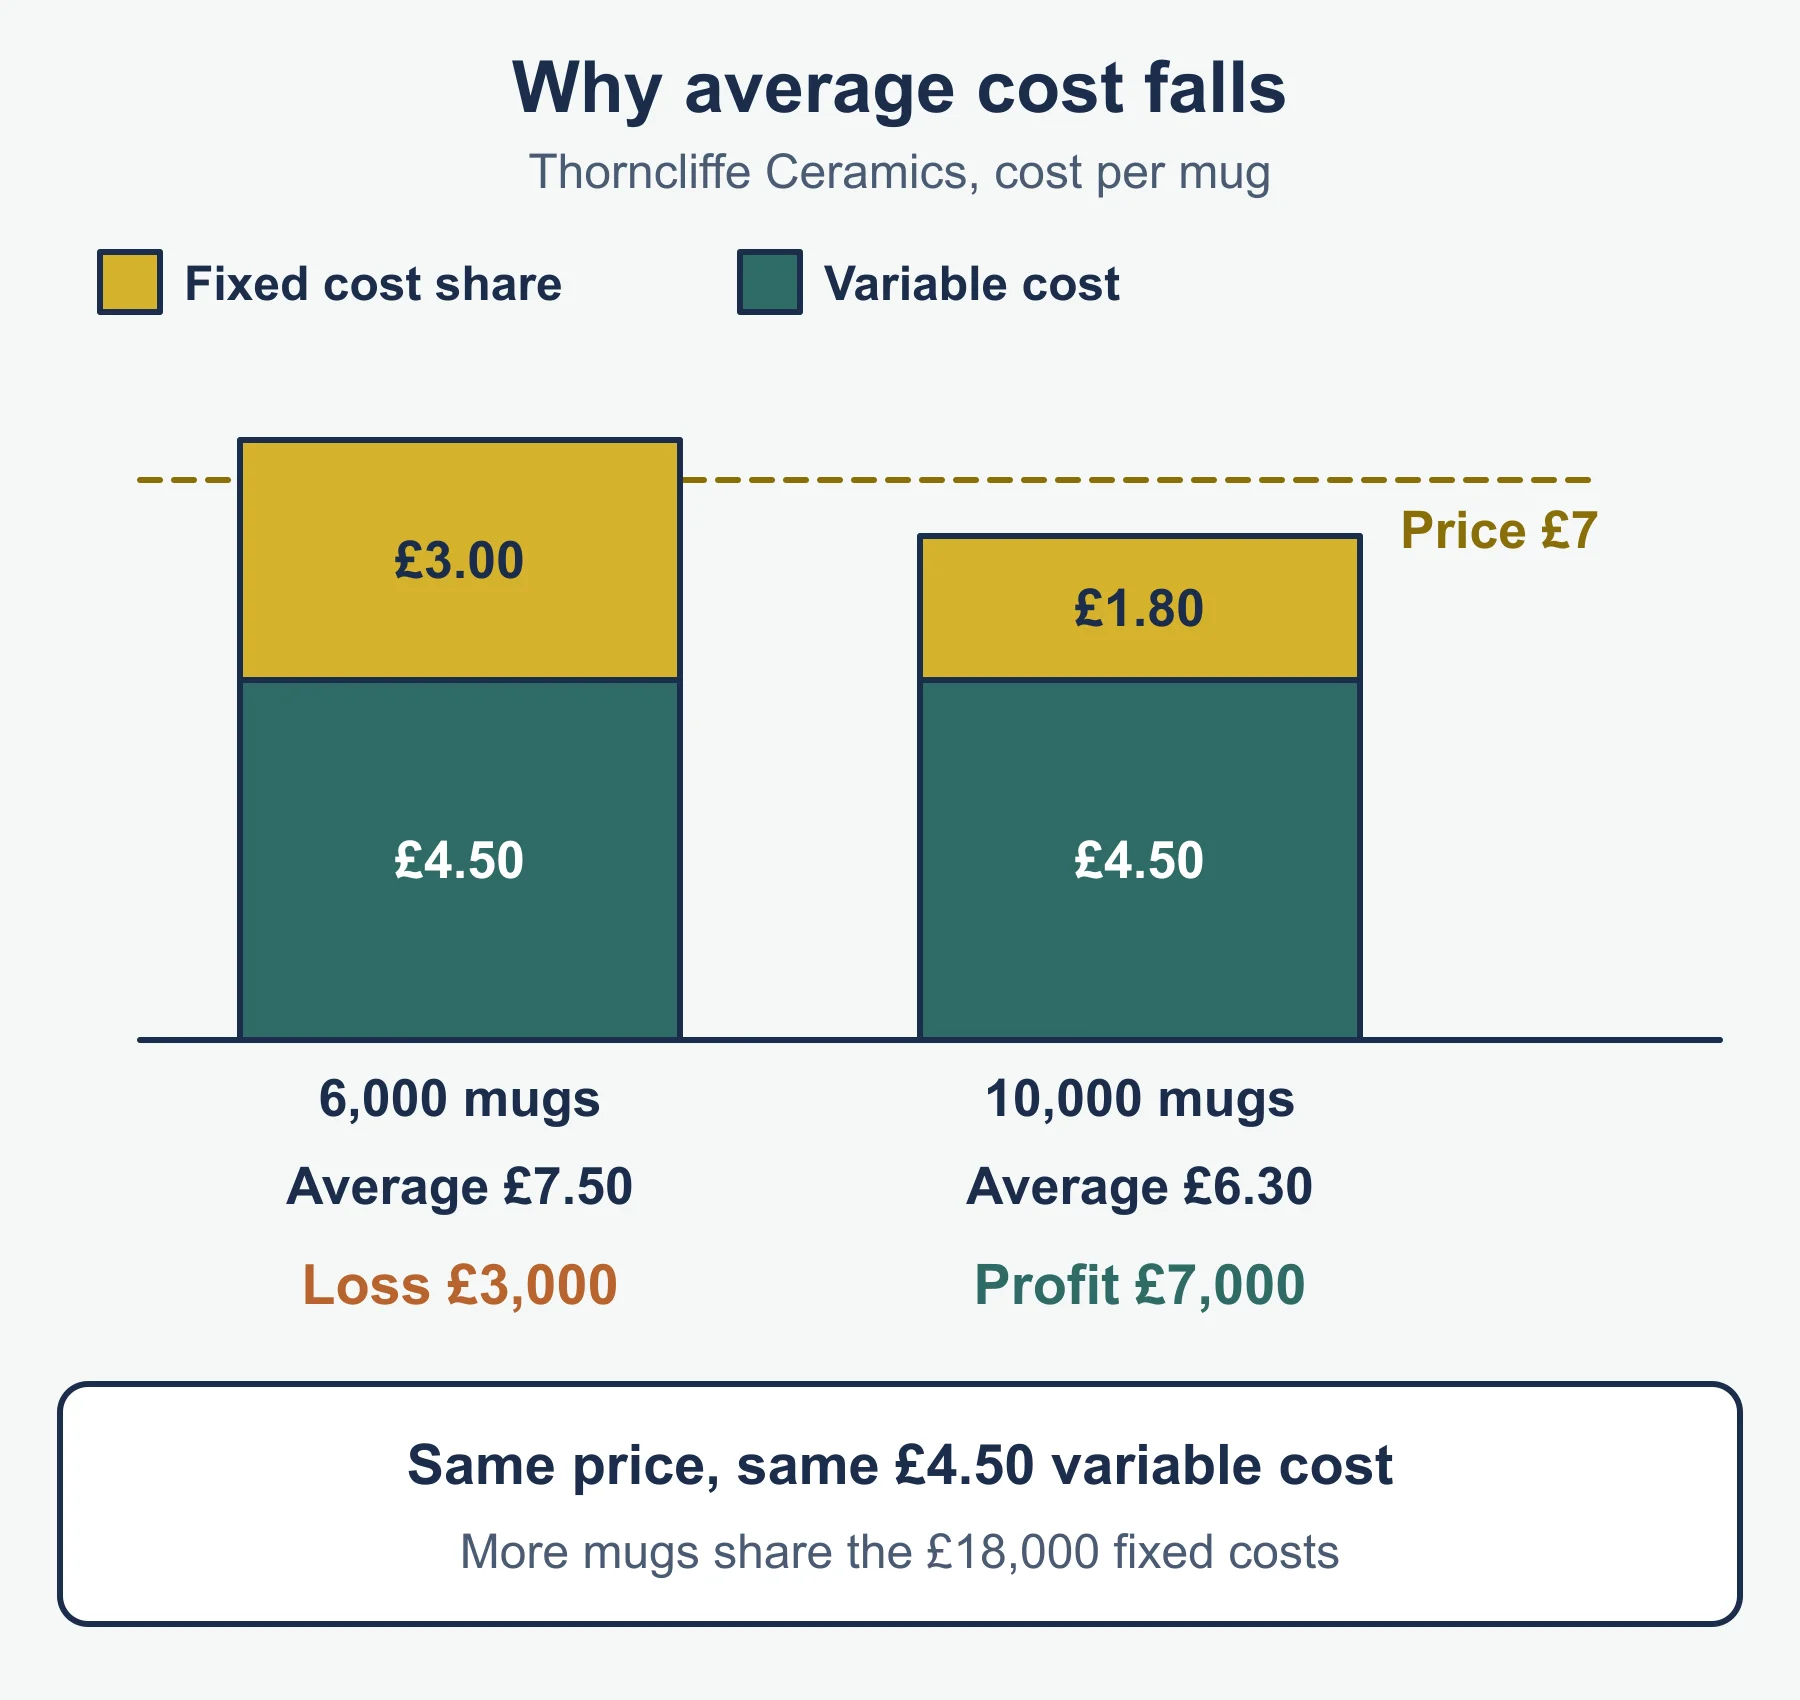
Worked reminder. Voxley Candles has fixed costs of £12,000 a month and variable costs of £3 per candle. At 4,000 candles: total variable cost = 3 × 4,000 = £12,000, total cost = 12,000 + 12,000 = £24,000, average cost = 24,000 ÷ 4,000 = £6. Average cost falls as output rises because fixed costs are spread over more units.
Cost data and simple decisions
| Decision | What the cost data tells you | What else to check |
|---|---|---|
| Price to set | Price must exceed average cost at the expected output for a profit | Rivals’ prices, customers’ willingness to pay |
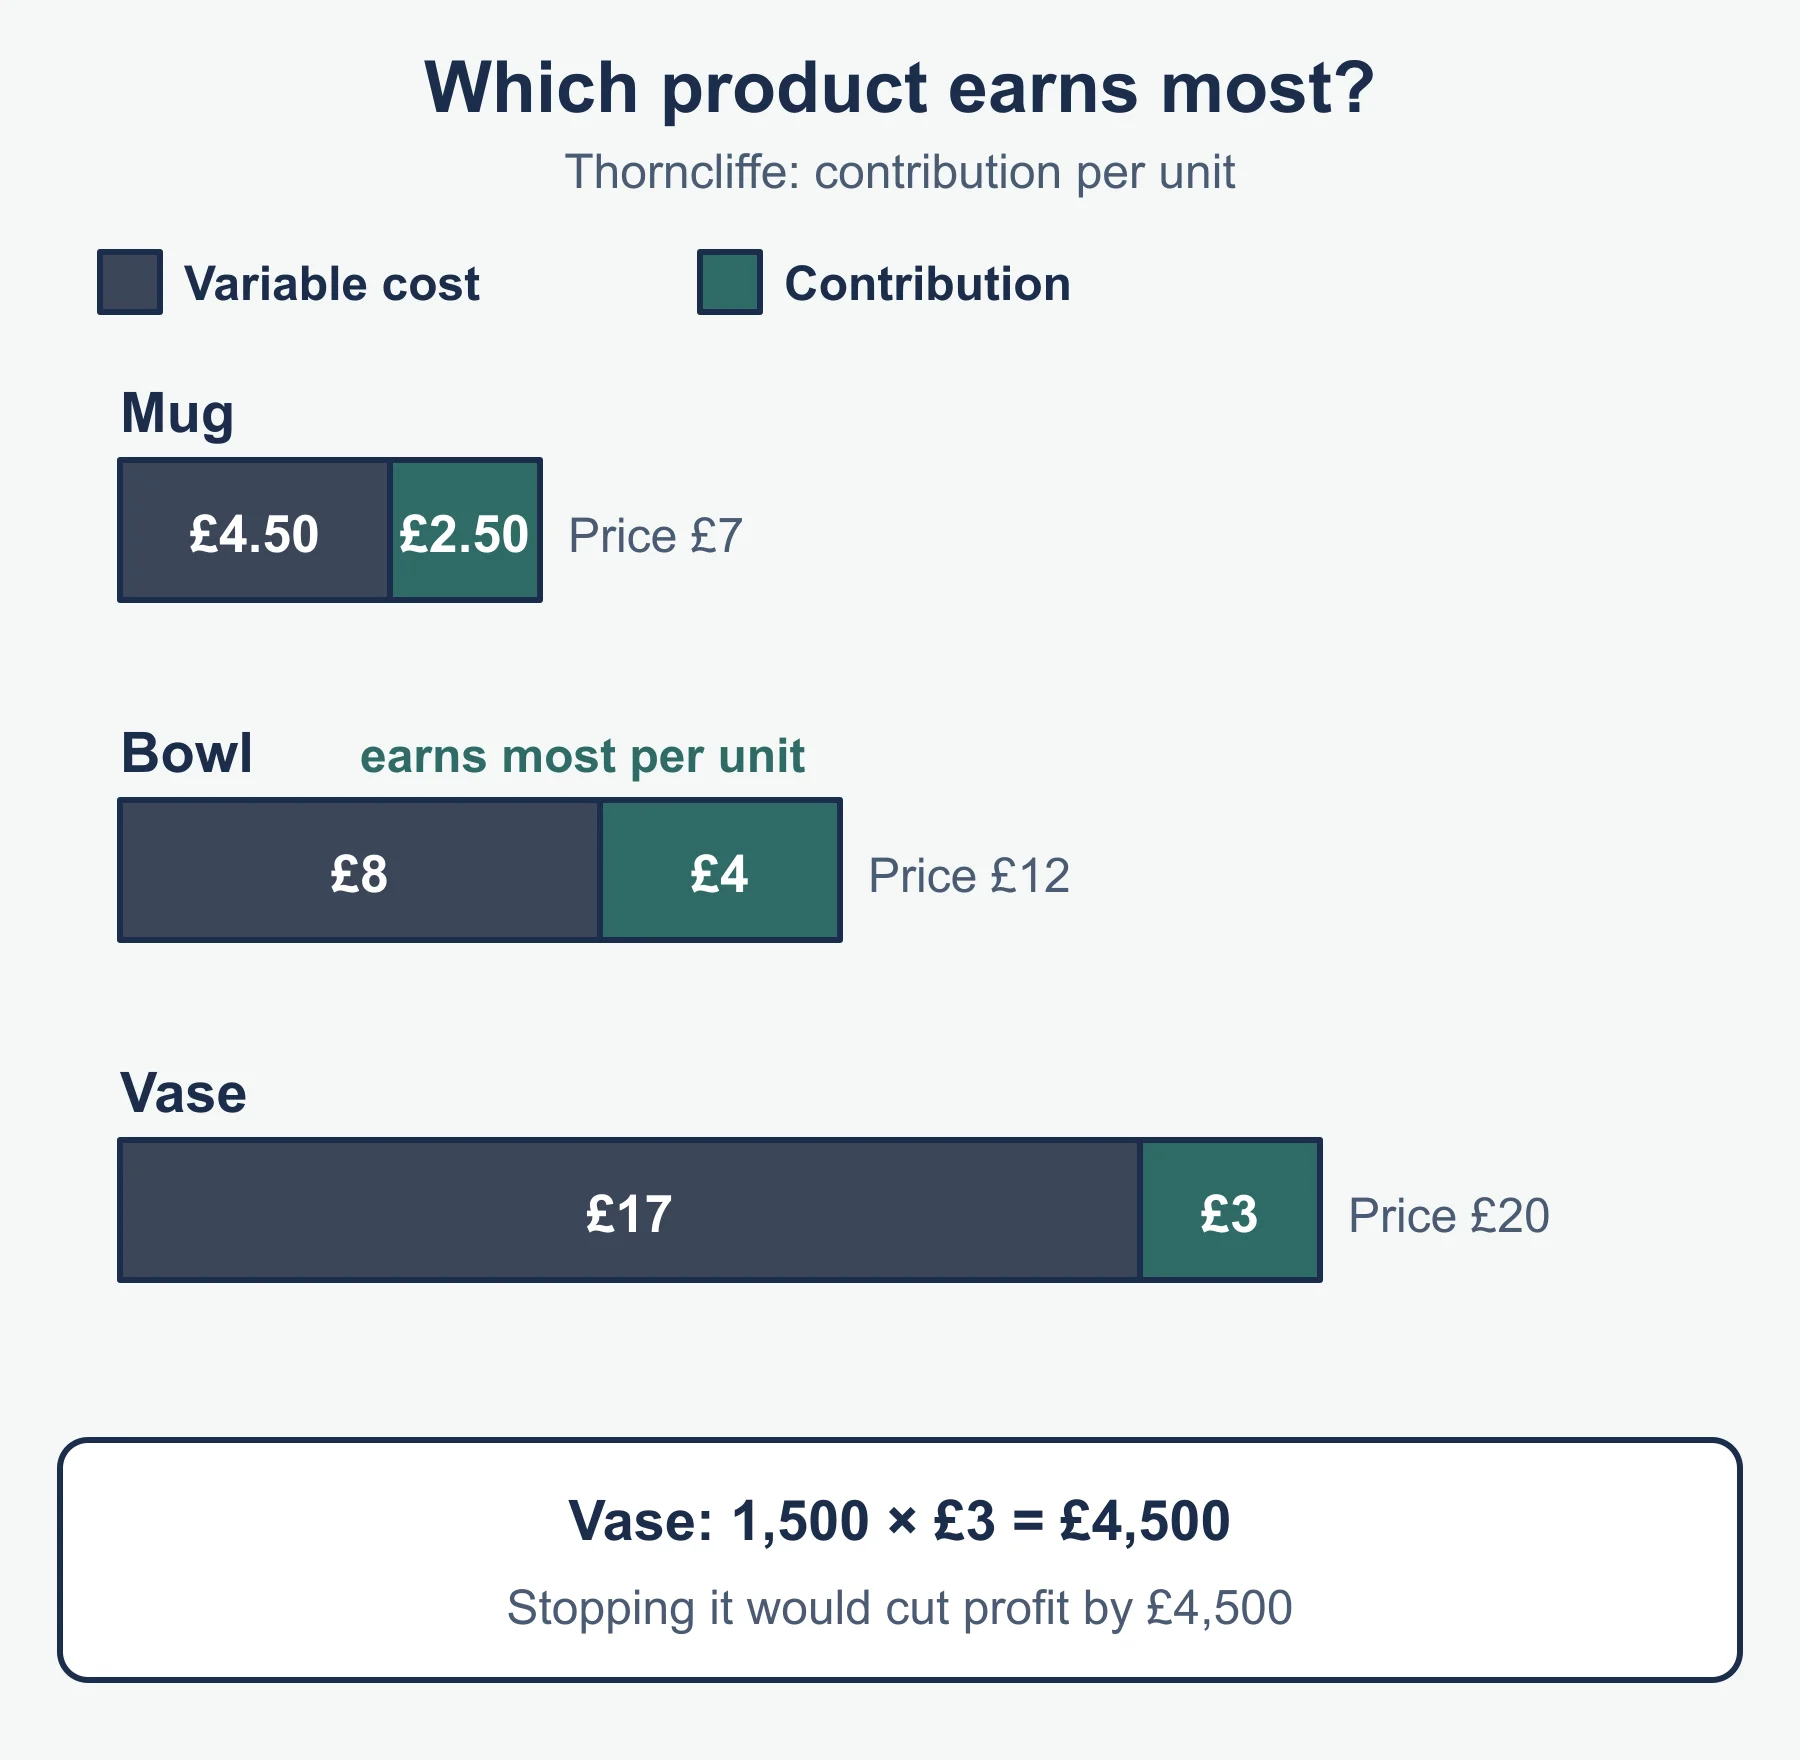
| Which product to produce | Compare contribution per unit | Demand, production time, brand image |
| Continue or stop a product | Does it still contribute towards fixed costs that will continue anyway? | Whether the resources could earn more elsewhere |
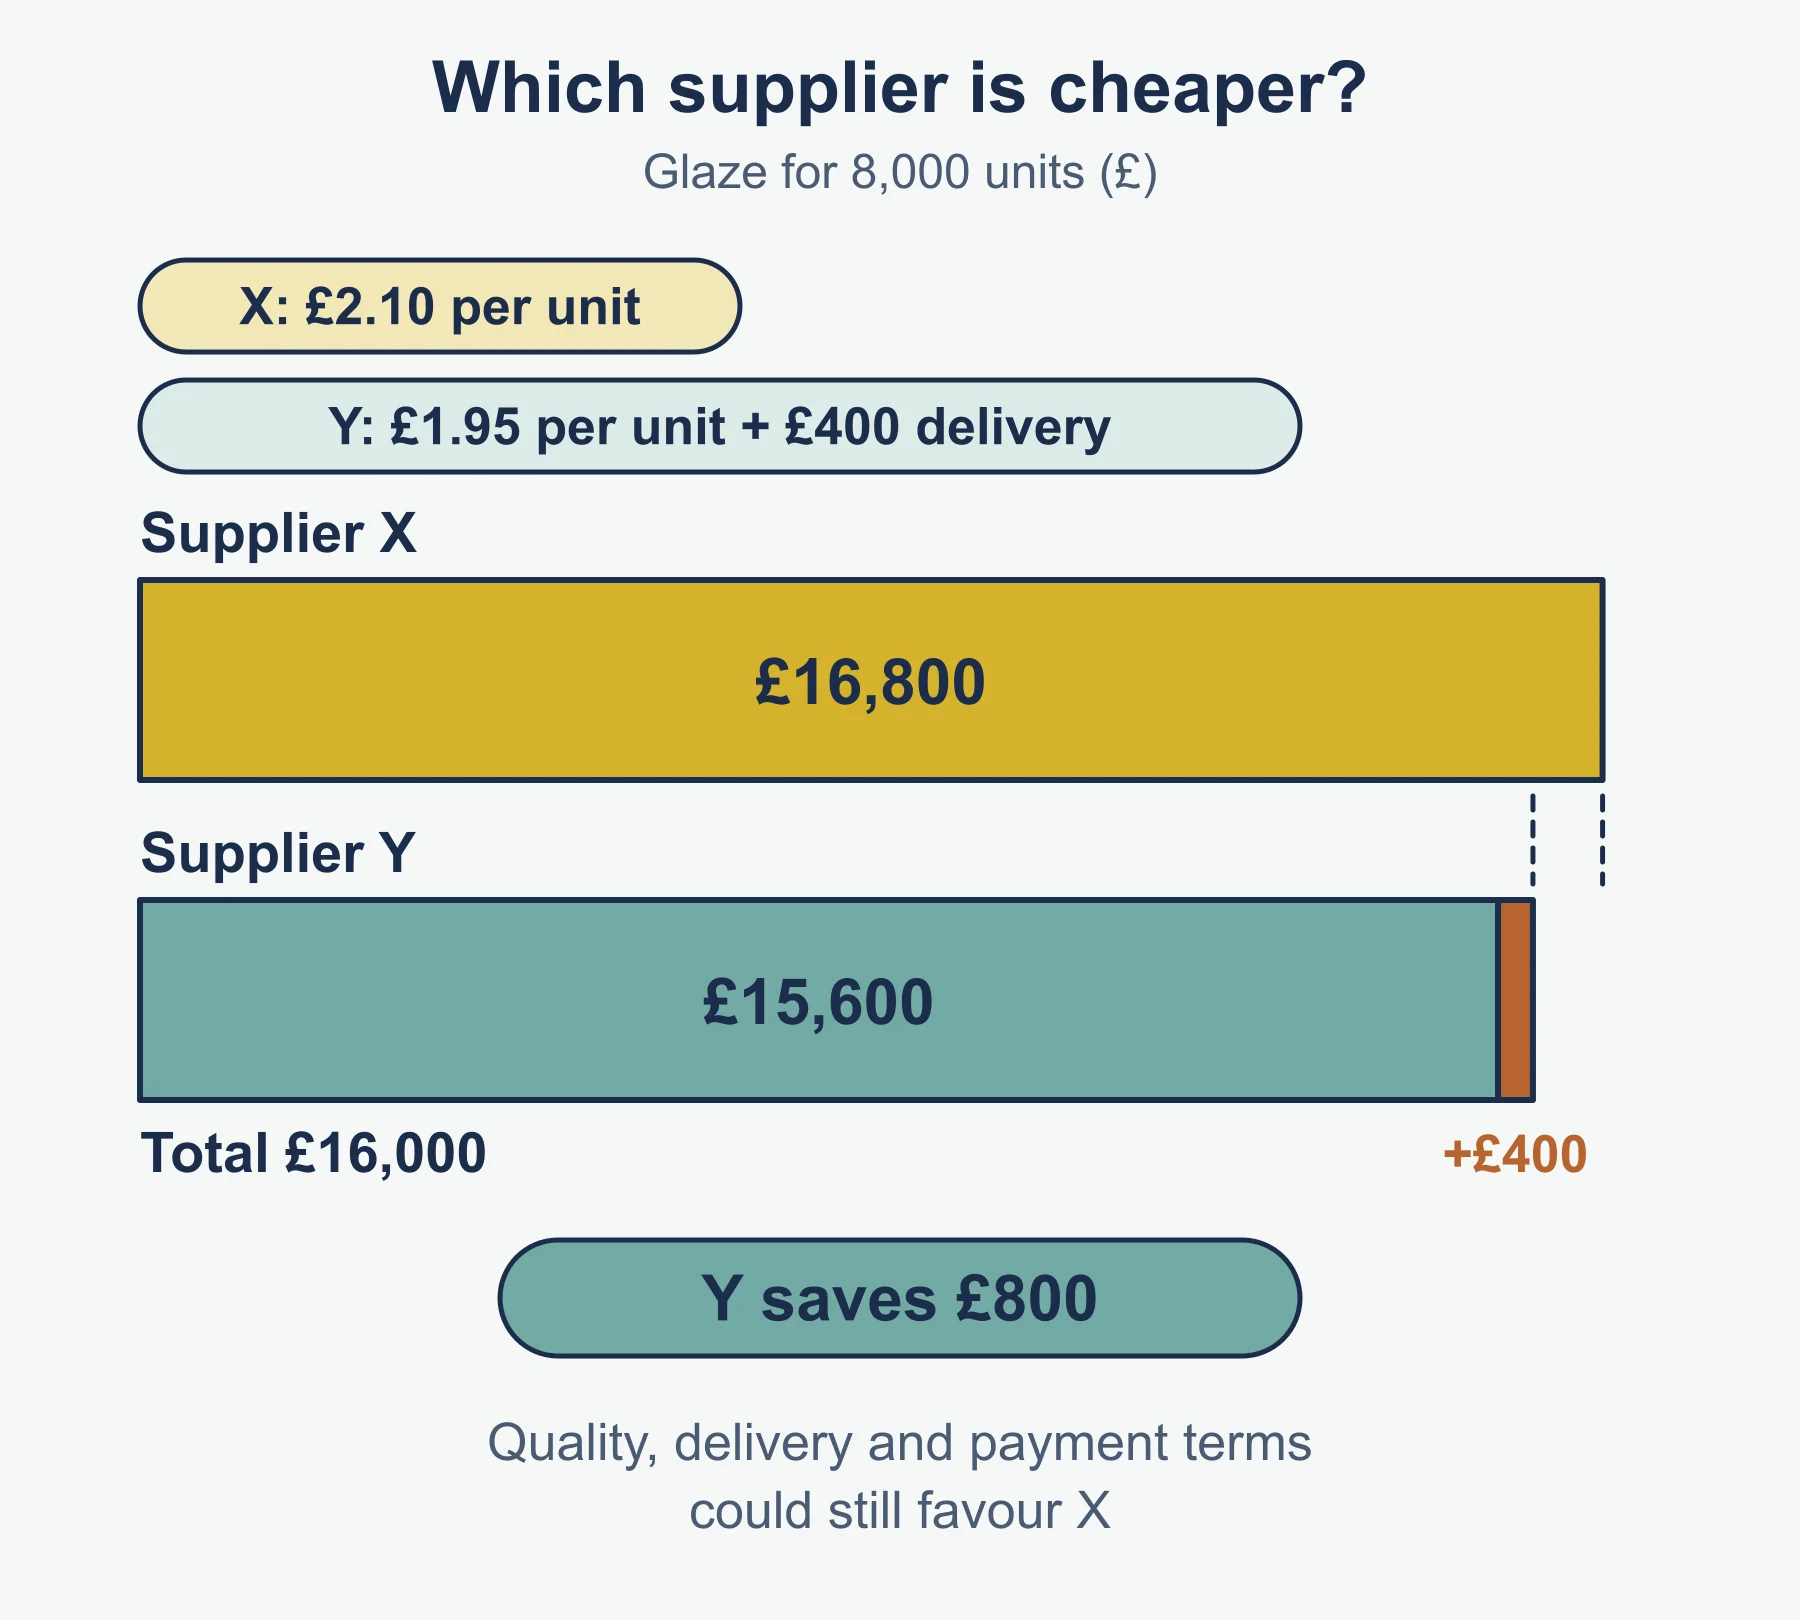
| Choose a supplier | Compare total cost for the quantity needed, including fees | Quality, reliability, payment terms |
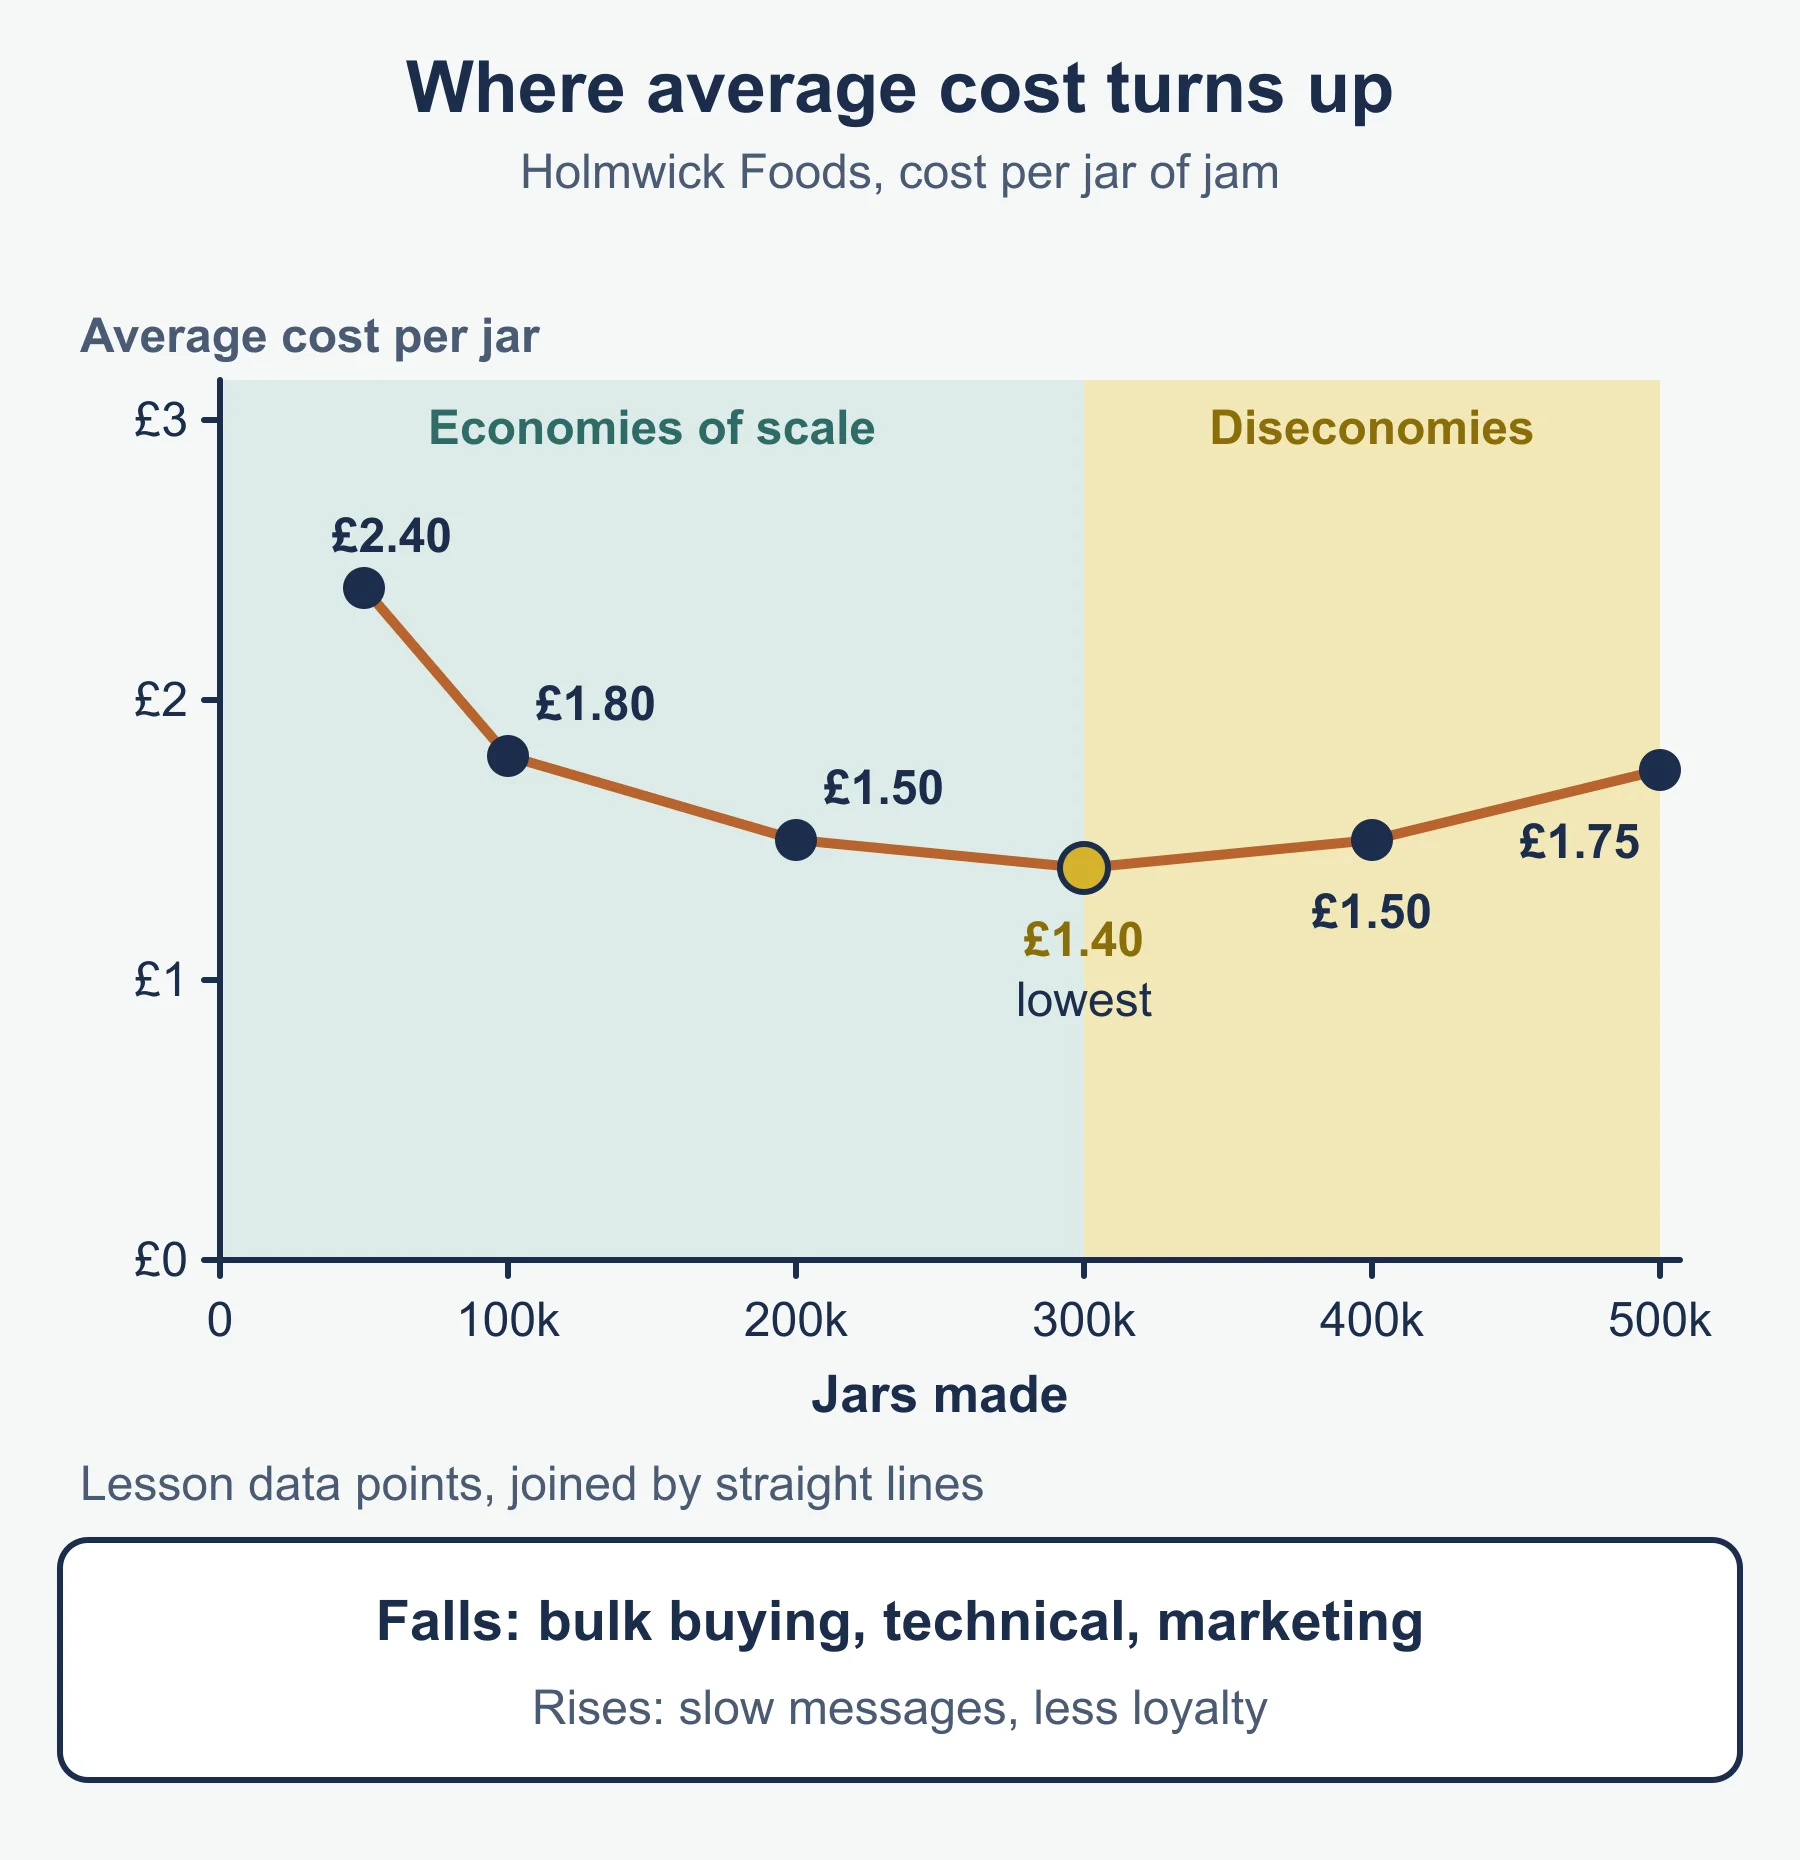
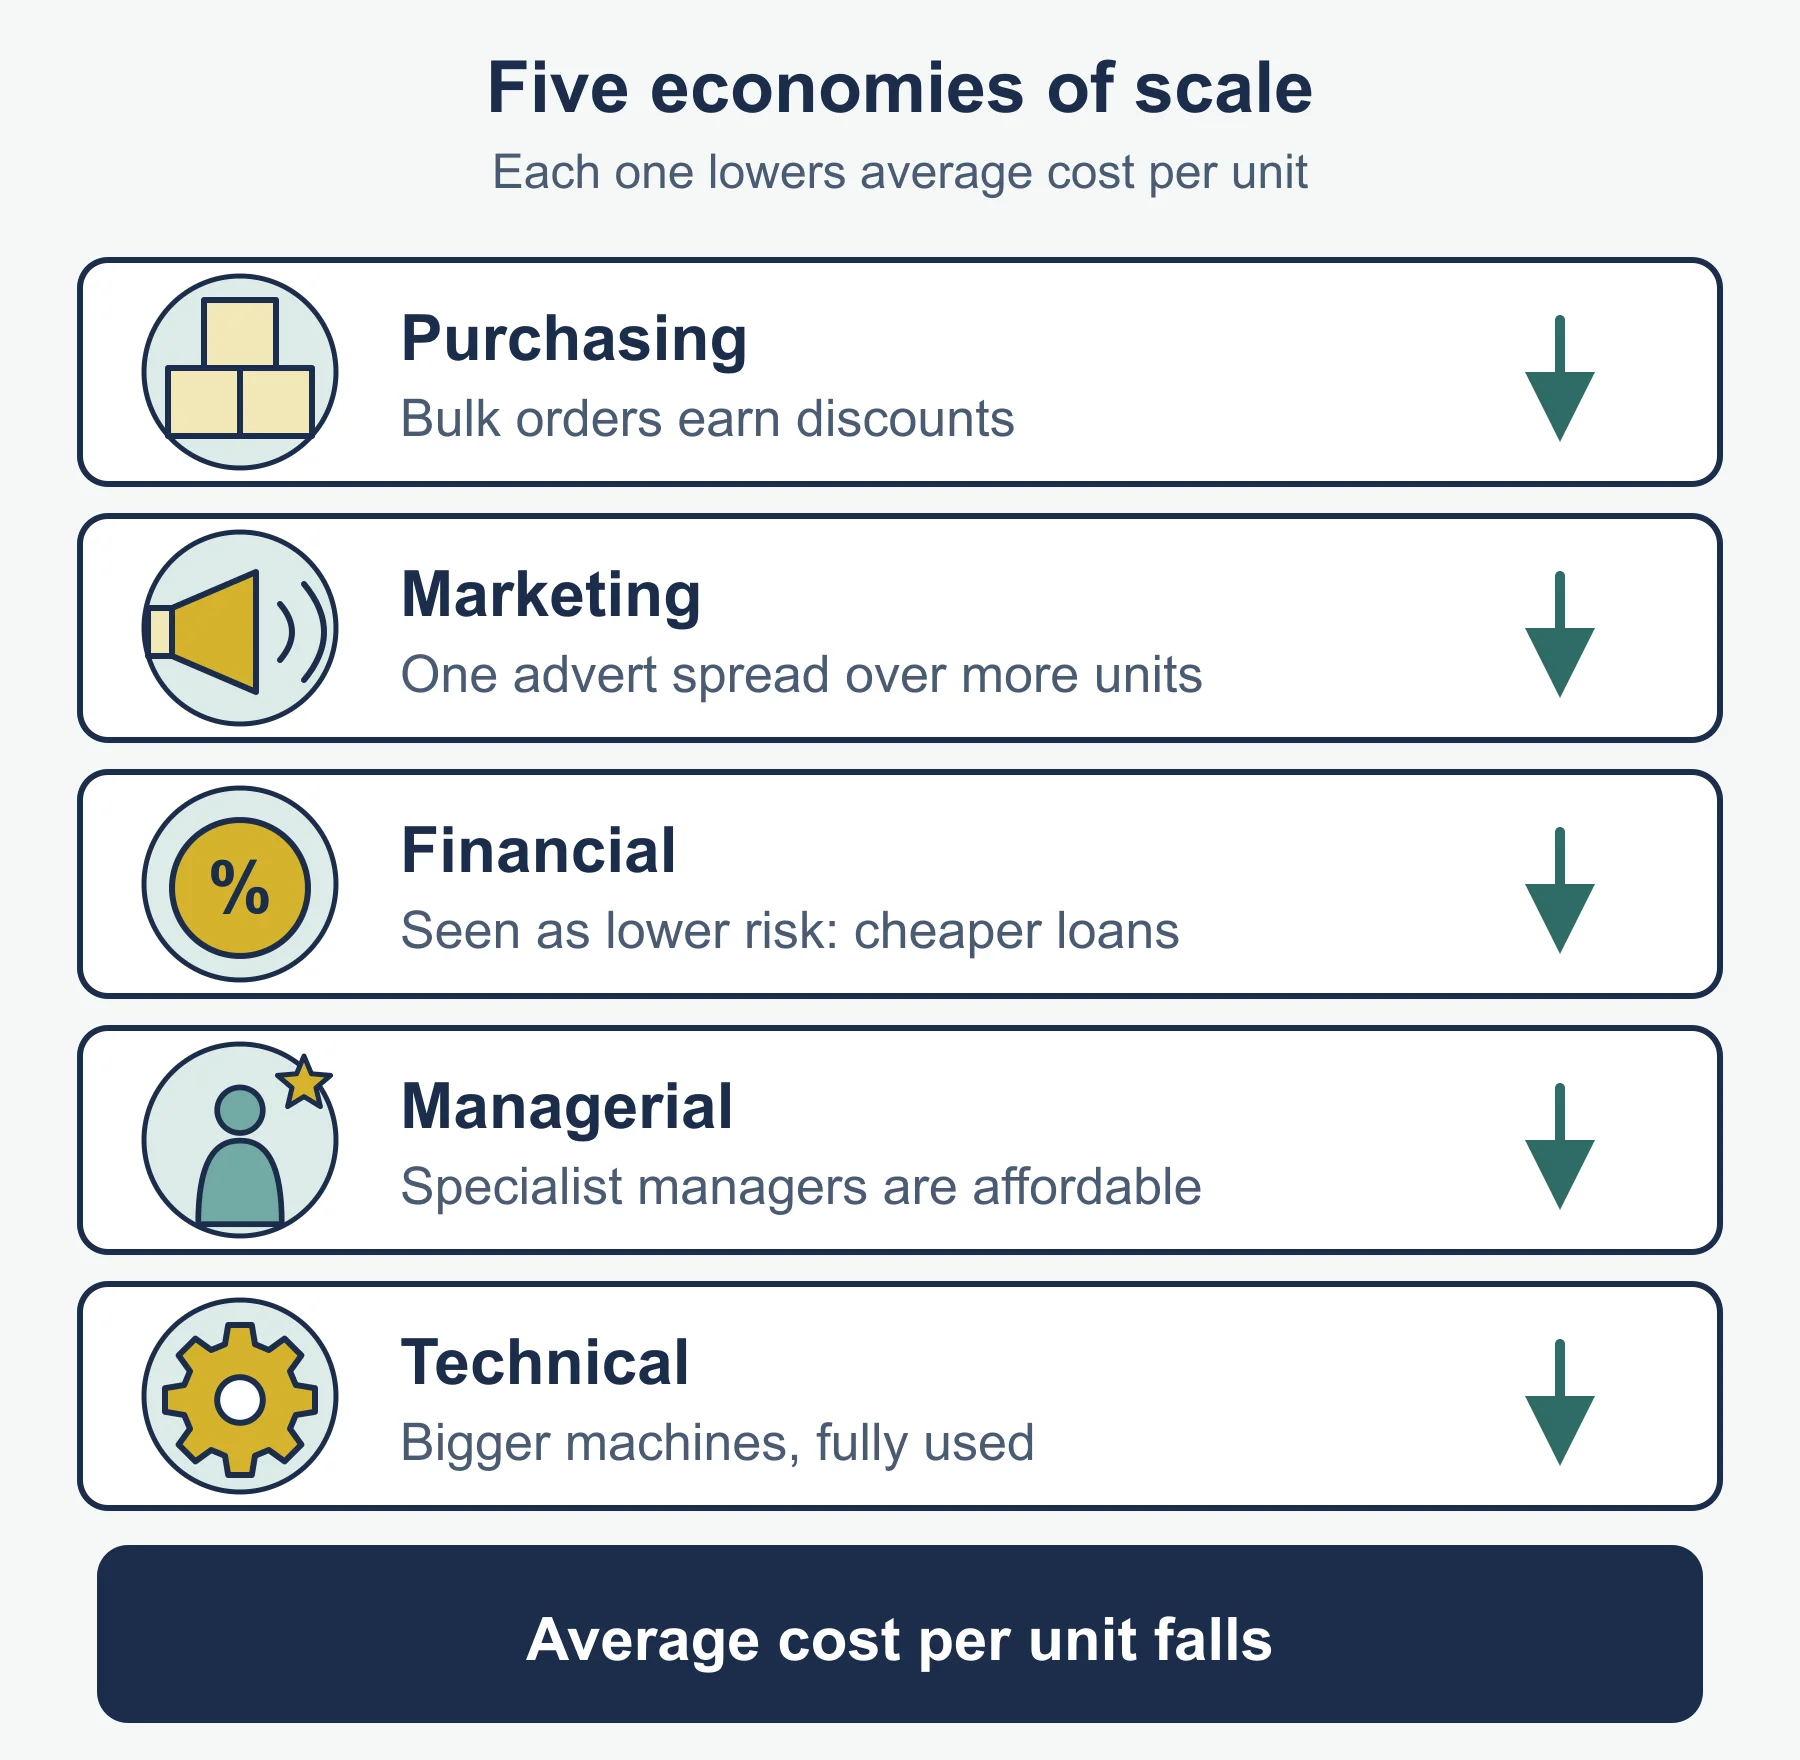
Economies of scale (average cost falls)
| Type | Memory hook |
|---|---|
| Purchasing | Bulk buying earns discounts |
| Marketing | Advertising spread over more units |
| Financial | Bigger firms borrow at lower interest |
| Managerial | Can afford specialist managers |
| Technical | Large, efficient machines and mass production |
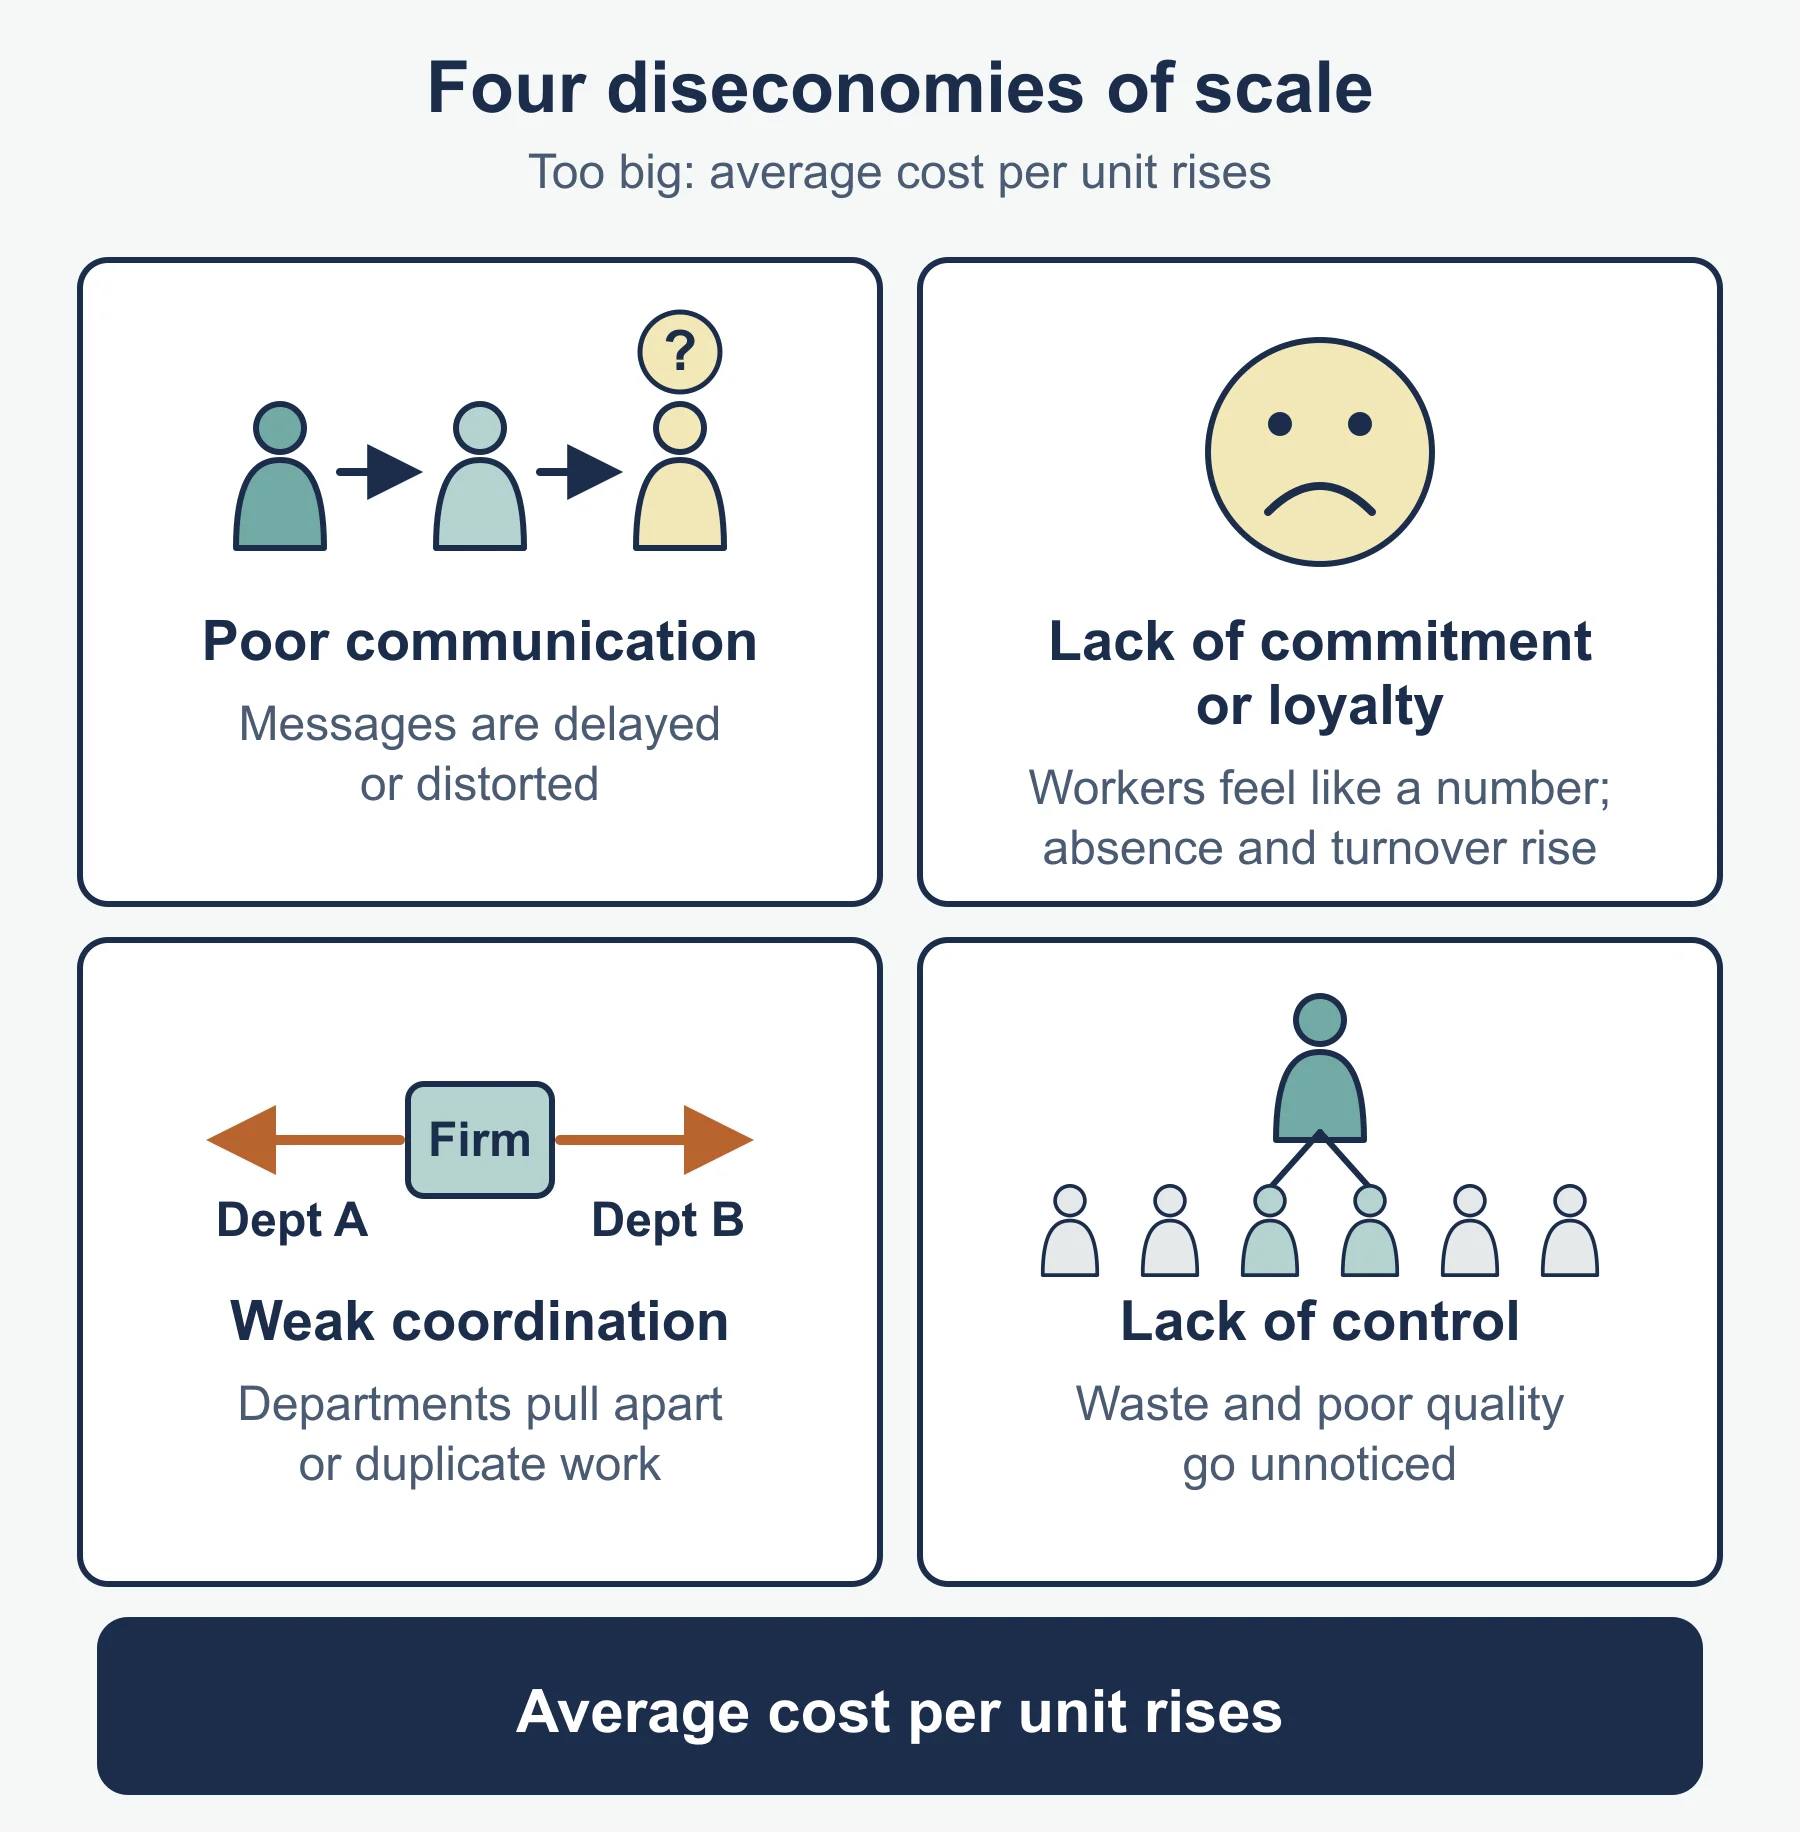
Diseconomies of scale (average cost rises)
| Type | Memory hook |
|---|---|
| Poor communication | Long chains of command, slow or distorted messages |
| Lack of commitment or loyalty | Workers feel unimportant, so motivation and effort fall |
| Weak coordination | Sites and departments out of step |
| Lack of control | Managers cannot supervise everything |
Distinction to hold on to. Average cost falling or rising with the scale of production is different from a rise in total cost. Total cost almost always rises with output. What matters is whether it rises faster or slower than output.
Break-even in steps
- Contribution per unit = selling price − variable cost per unit.
- Break-even output = fixed costs ÷ contribution per unit. Round up to a whole unit.
- Margin of safety = actual sales − break-even output.
- Profit at a level of output = contribution per unit × units − fixed costs.
Worked reminder. Voxley sells candles at £9. Contribution = 9 − 4 = £5 when variable cost is £4 and fixed costs are £20,000. Break-even output = 20,000 ÷ 5 = 4,000 candles. With sales of 5,100, margin of safety = 1,100 candles and profit = 5,100 × 5 − 20,000 = £5,500.
Effect of changes (same Voxley figures)
| Change | Calculation | New break-even output |
|---|---|---|
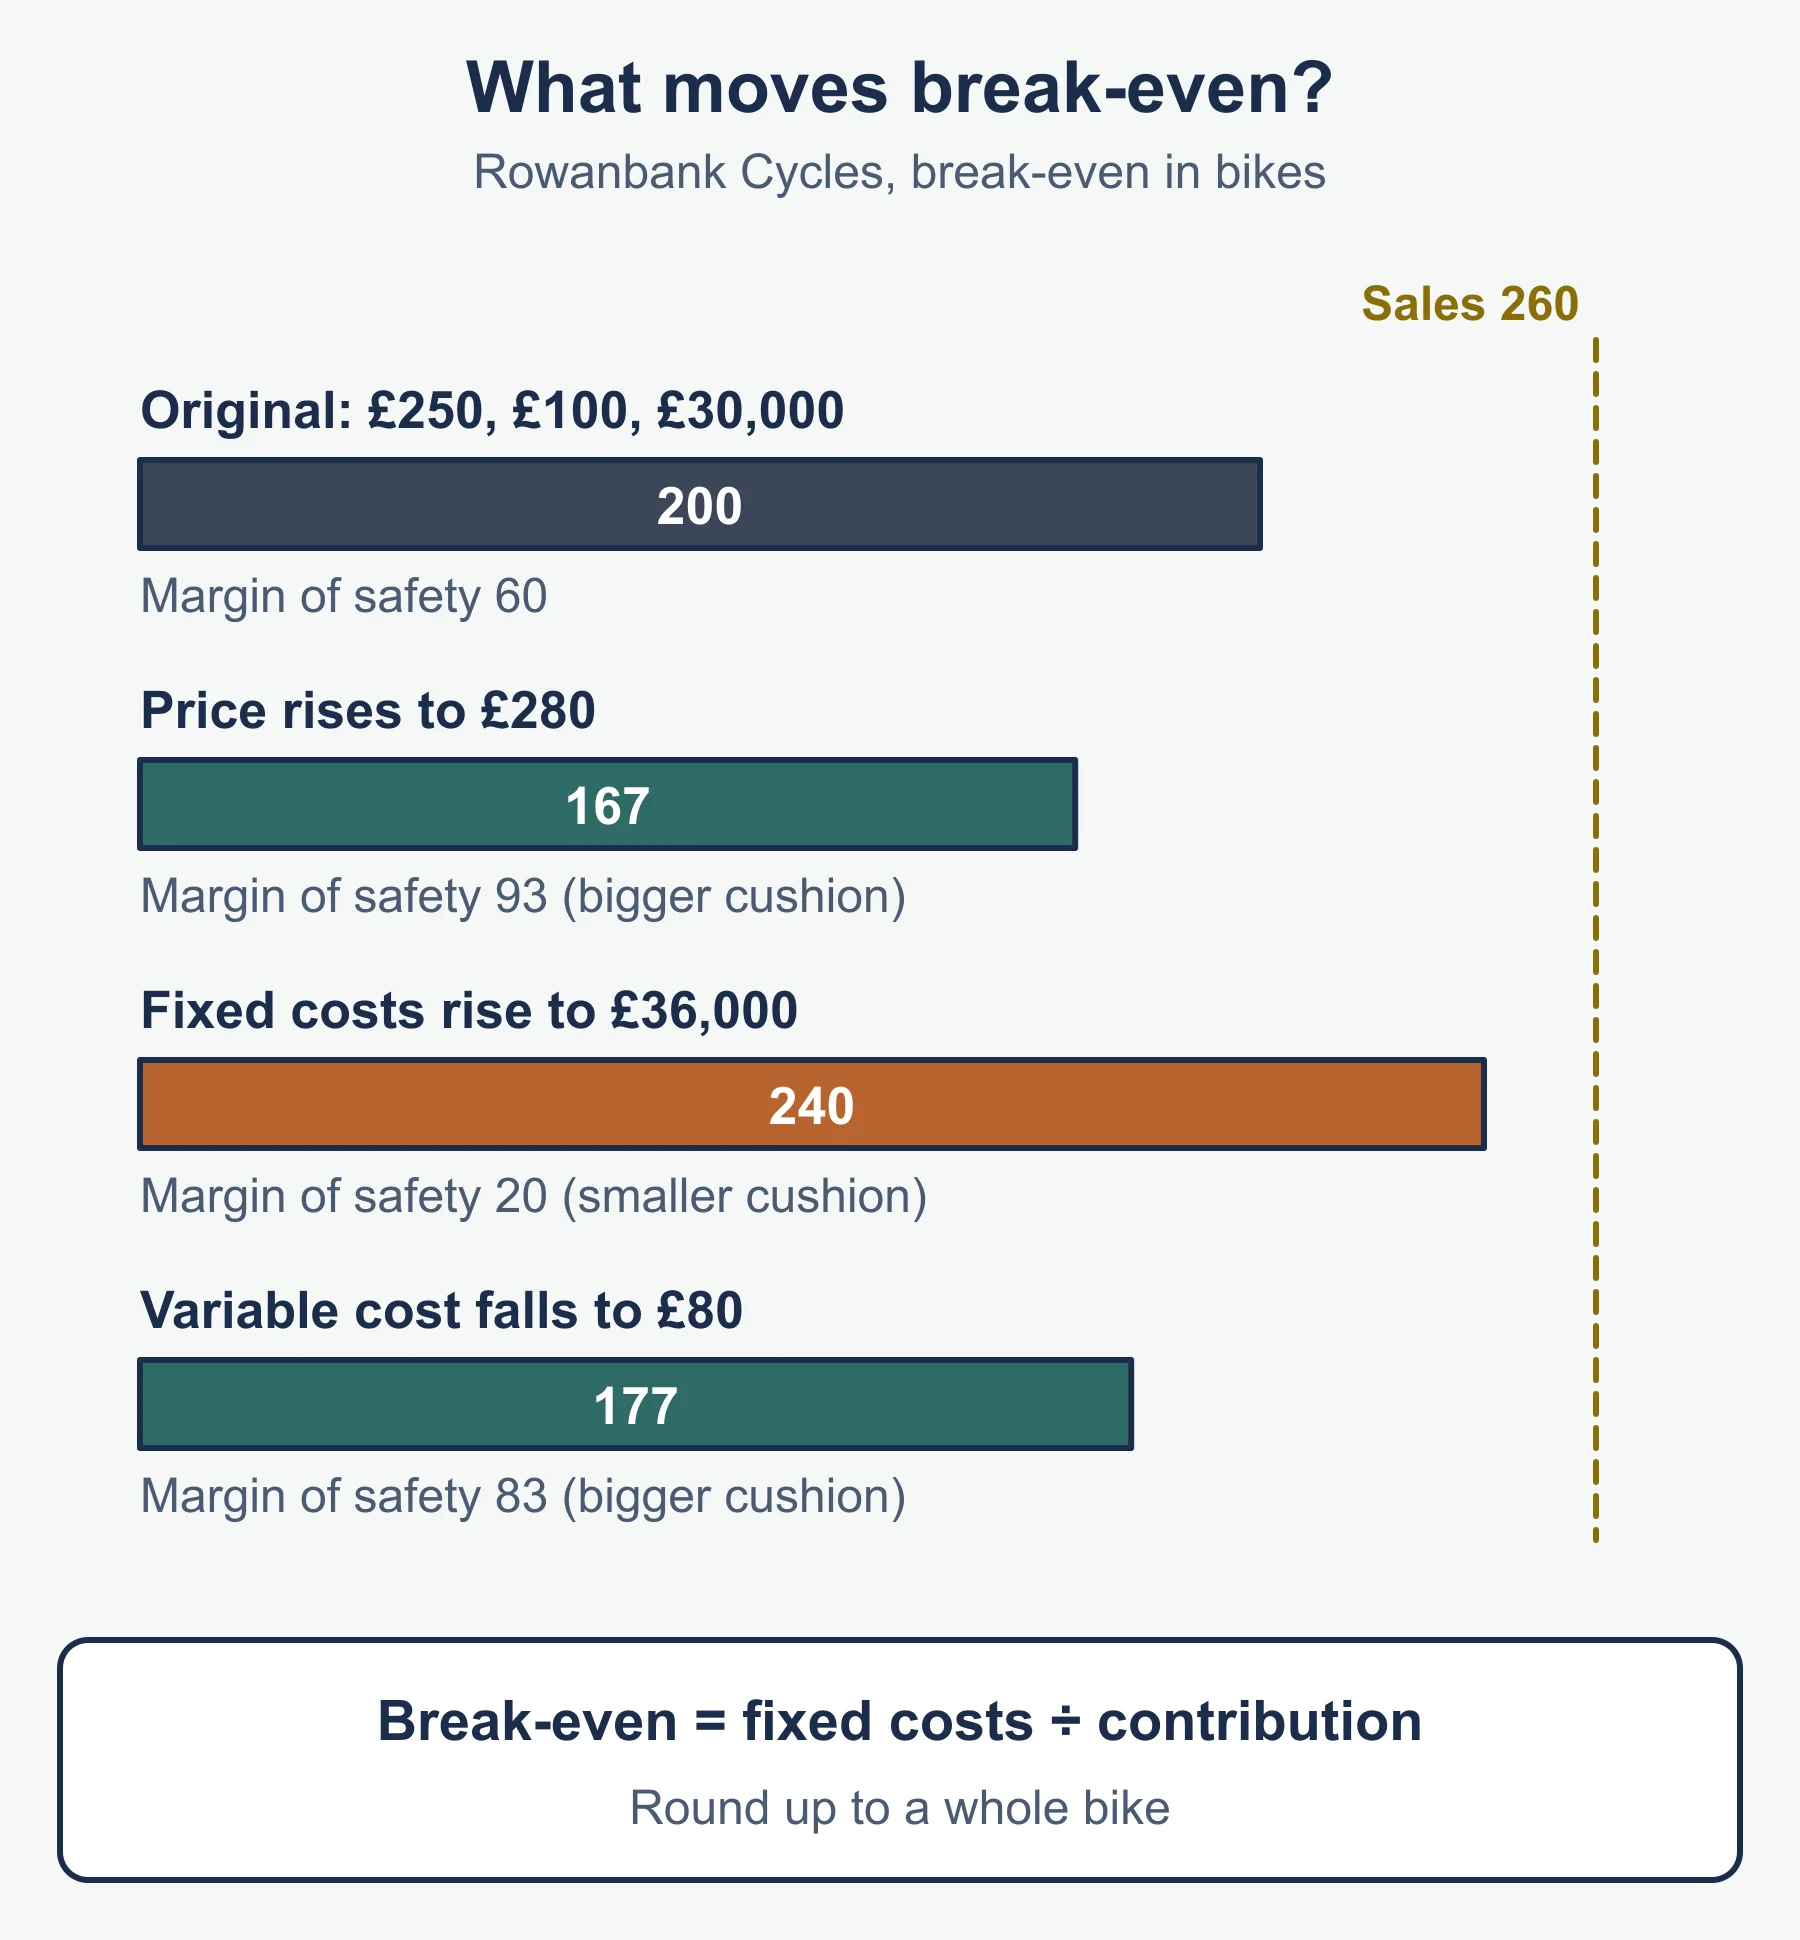
| Price up to £10 | 20,000 ÷ (10 − 4) = 20,000 ÷ 6 | 3,334 candles |
| Fixed costs up to £24,000 | 24,000 ÷ 5 | 4,800 candles |
| Variable cost down to £3.50 | 20,000 ÷ (9 − 3.50) = 20,000 ÷ 5.50 | 3,637 candles |
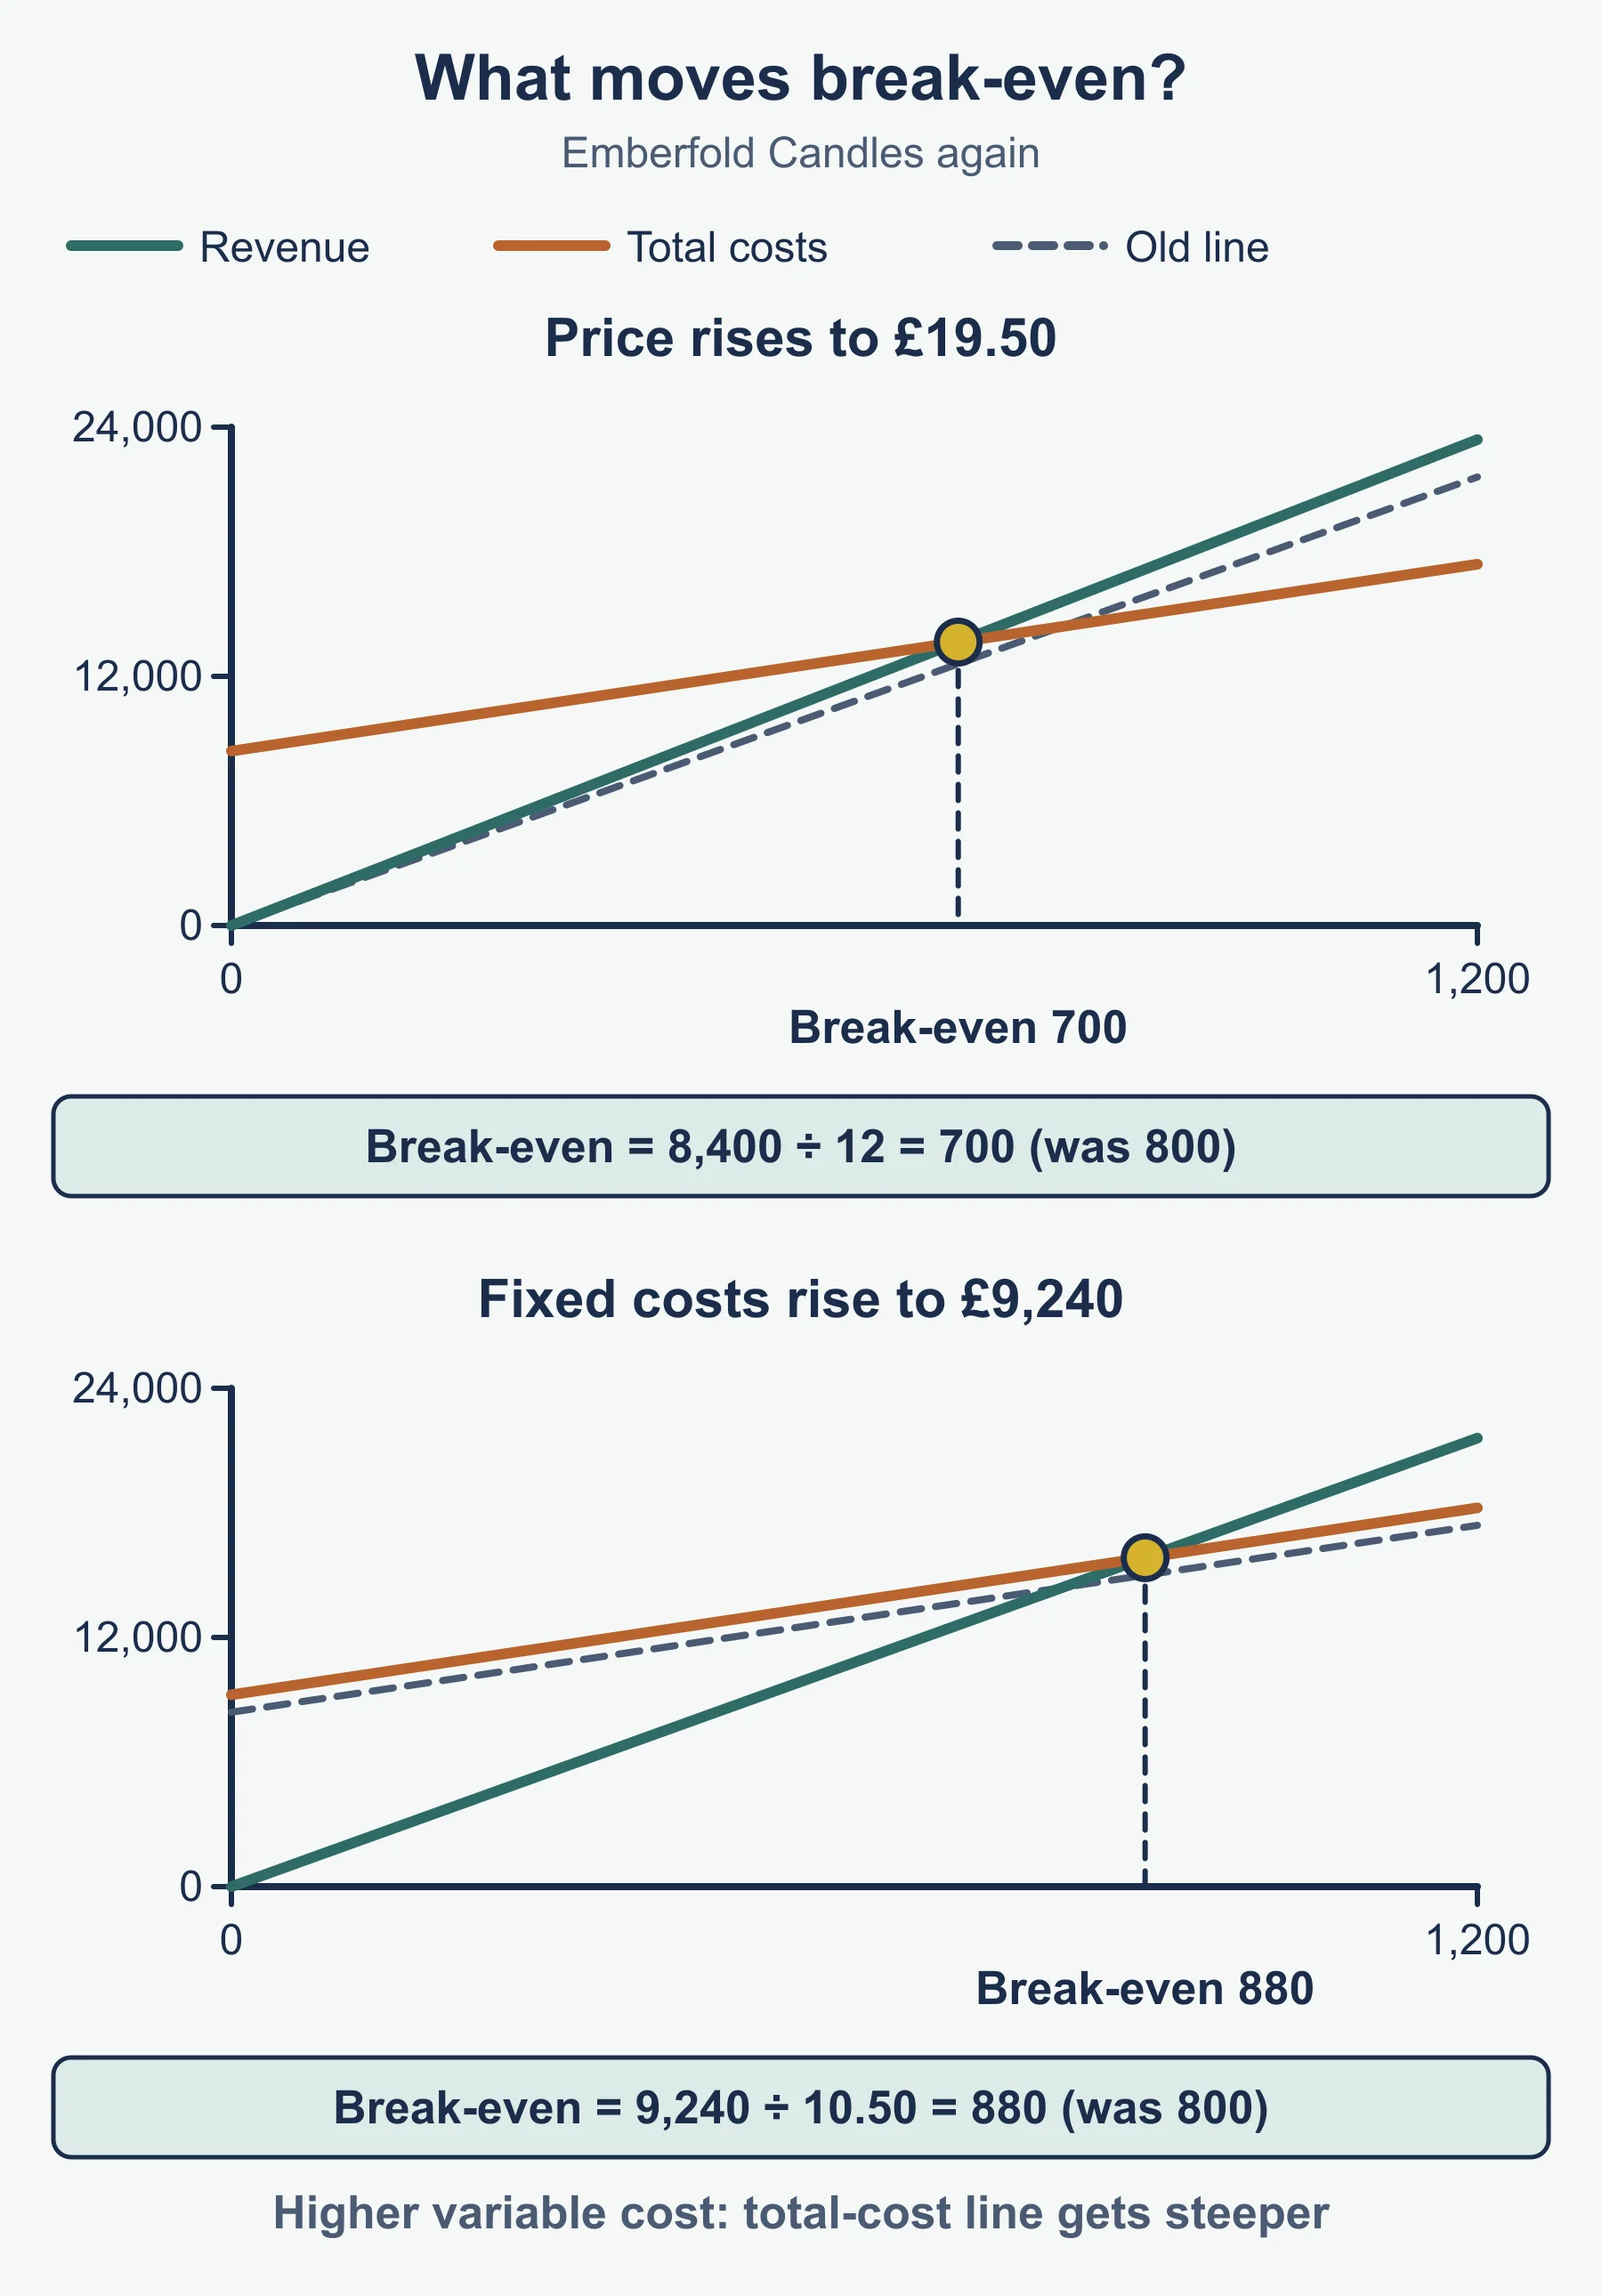
The direction rule: a higher price or lower costs move break-even down (left on the chart). A lower price or higher costs move it up (right). Always re-check the margin of safety against expected sales.
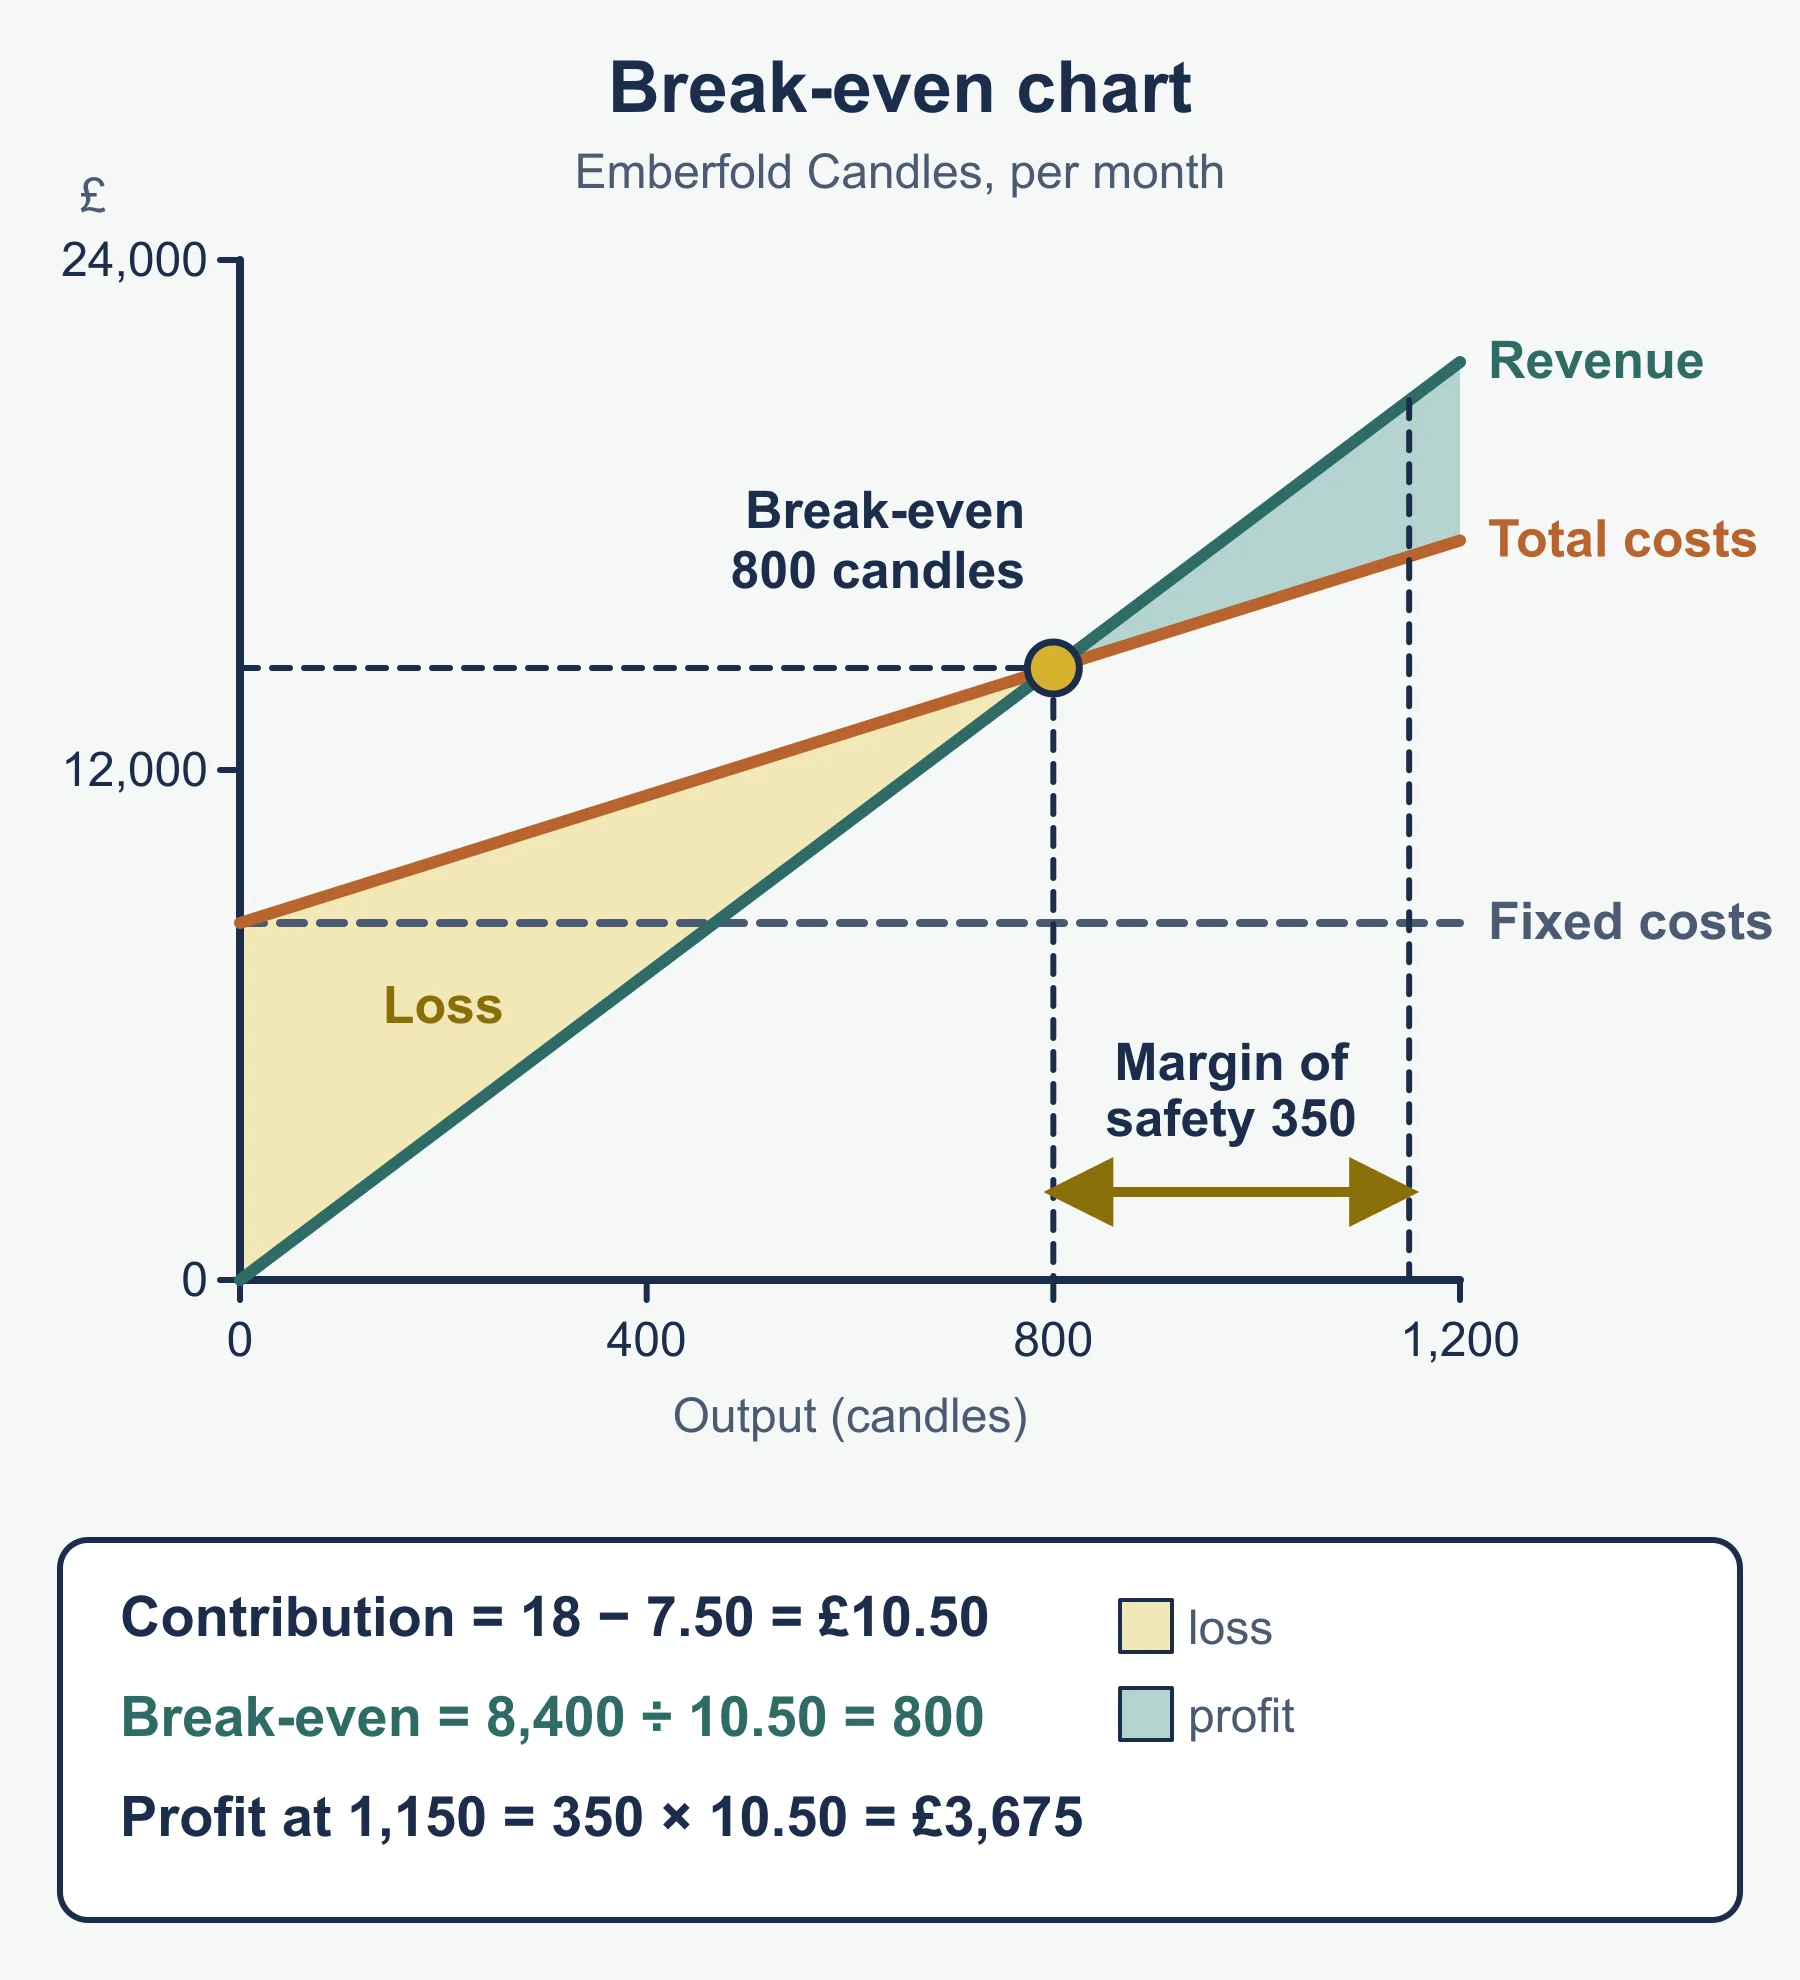
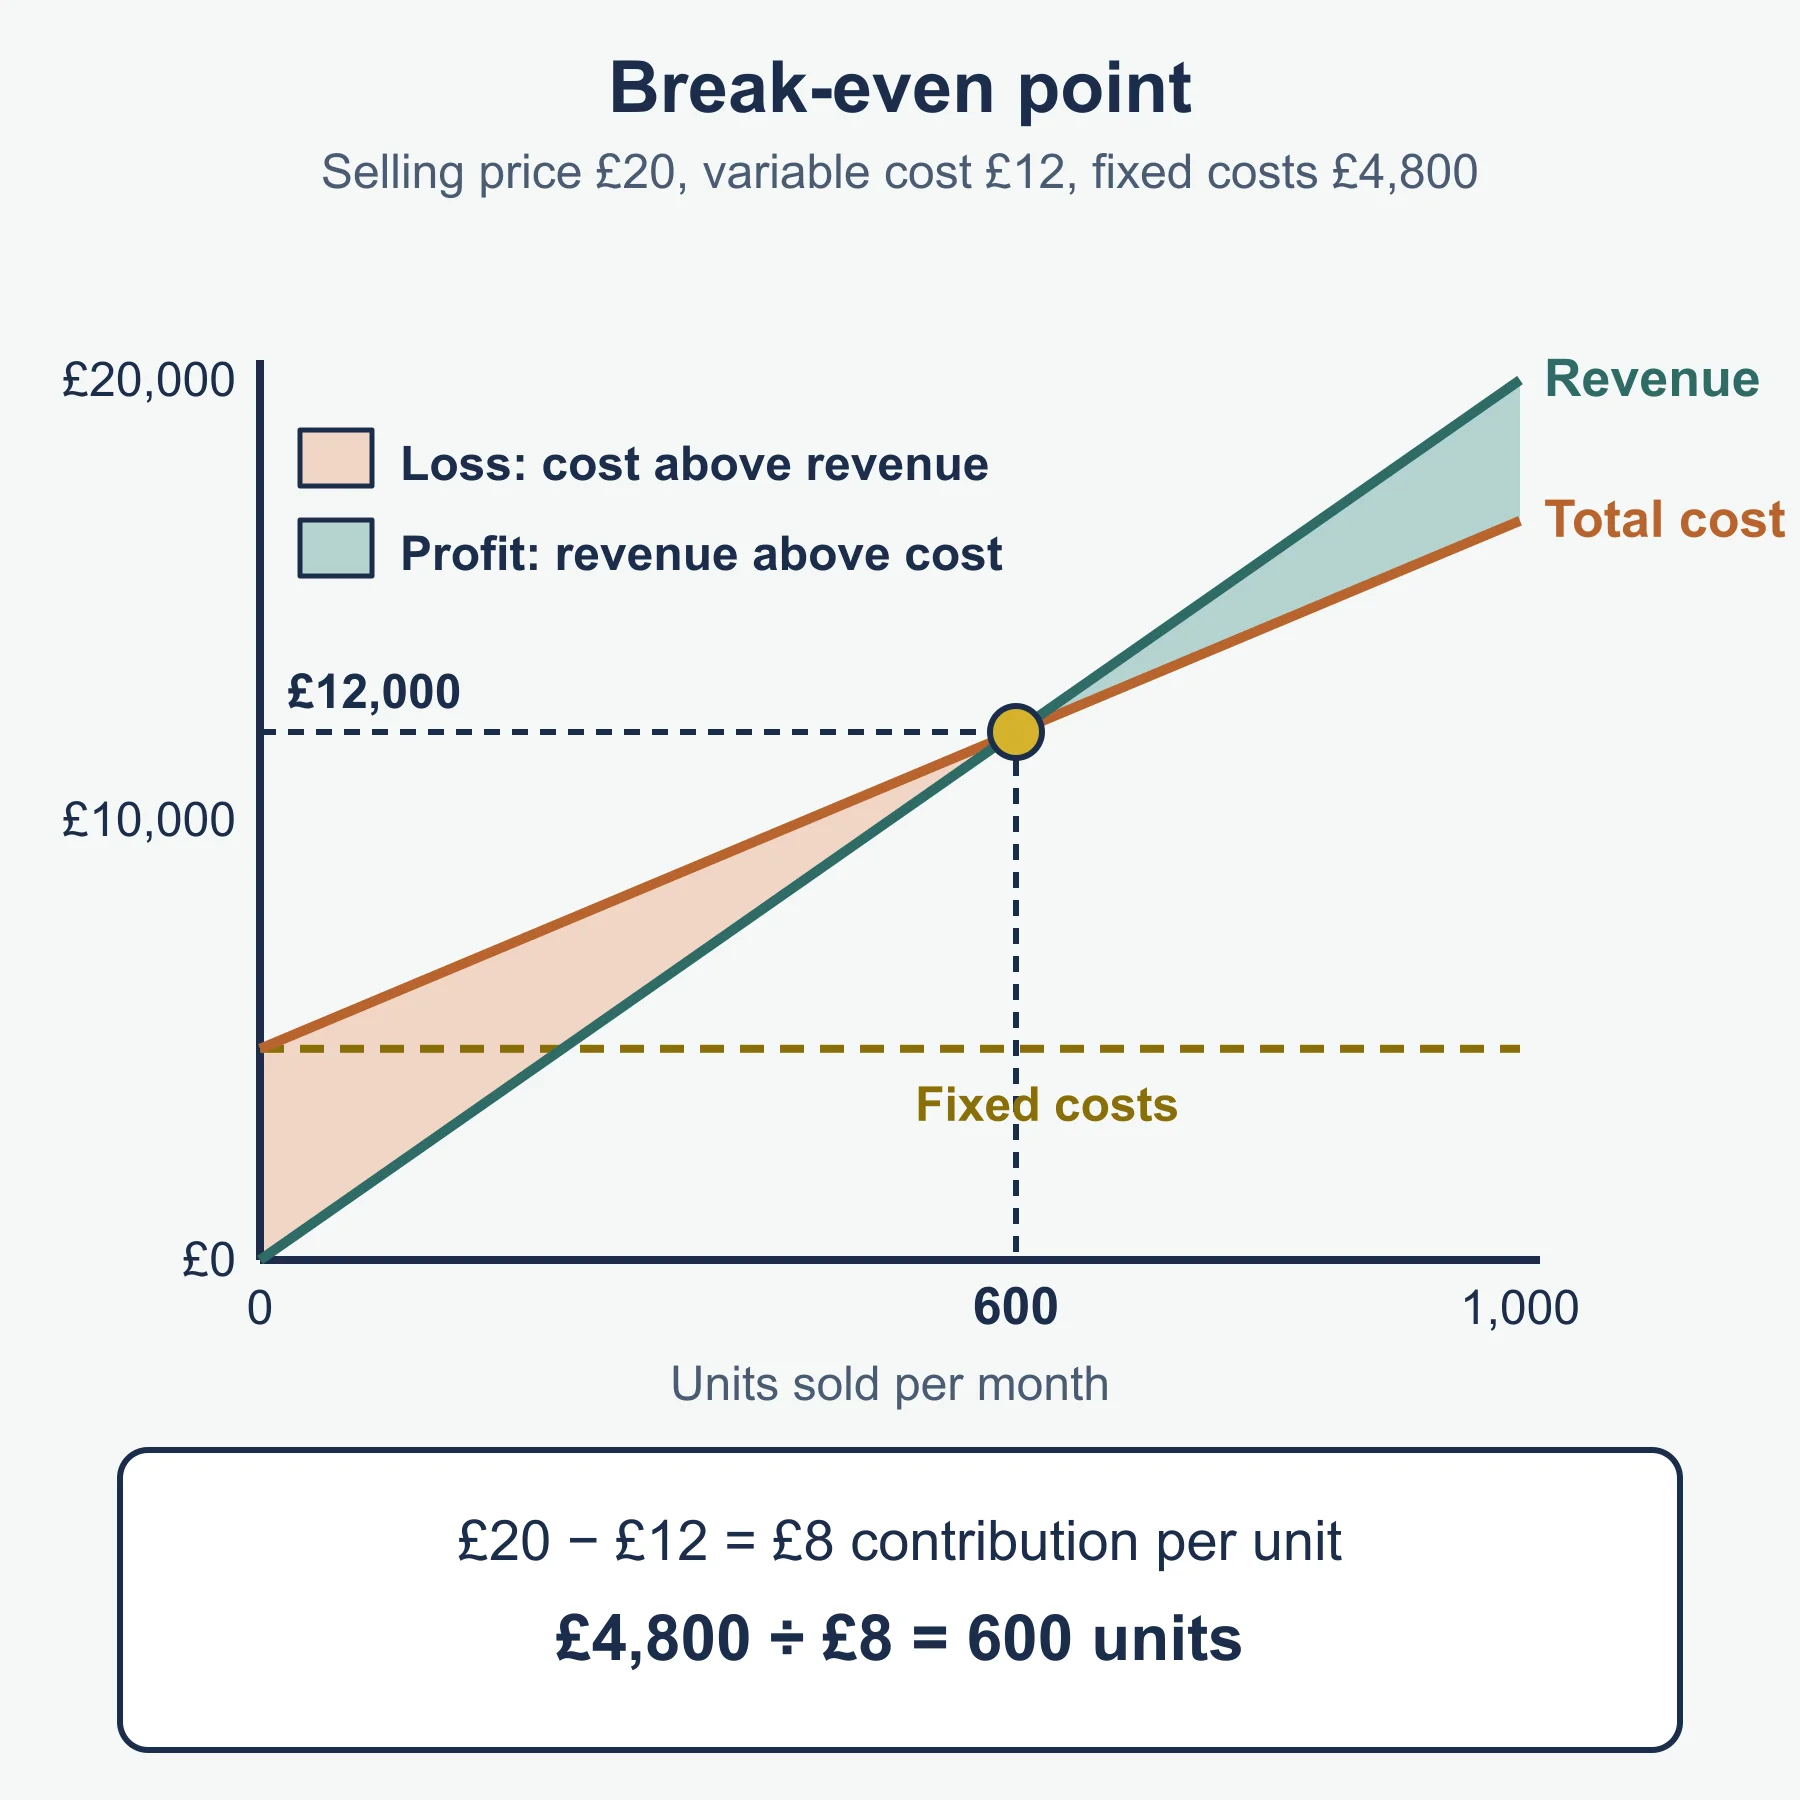
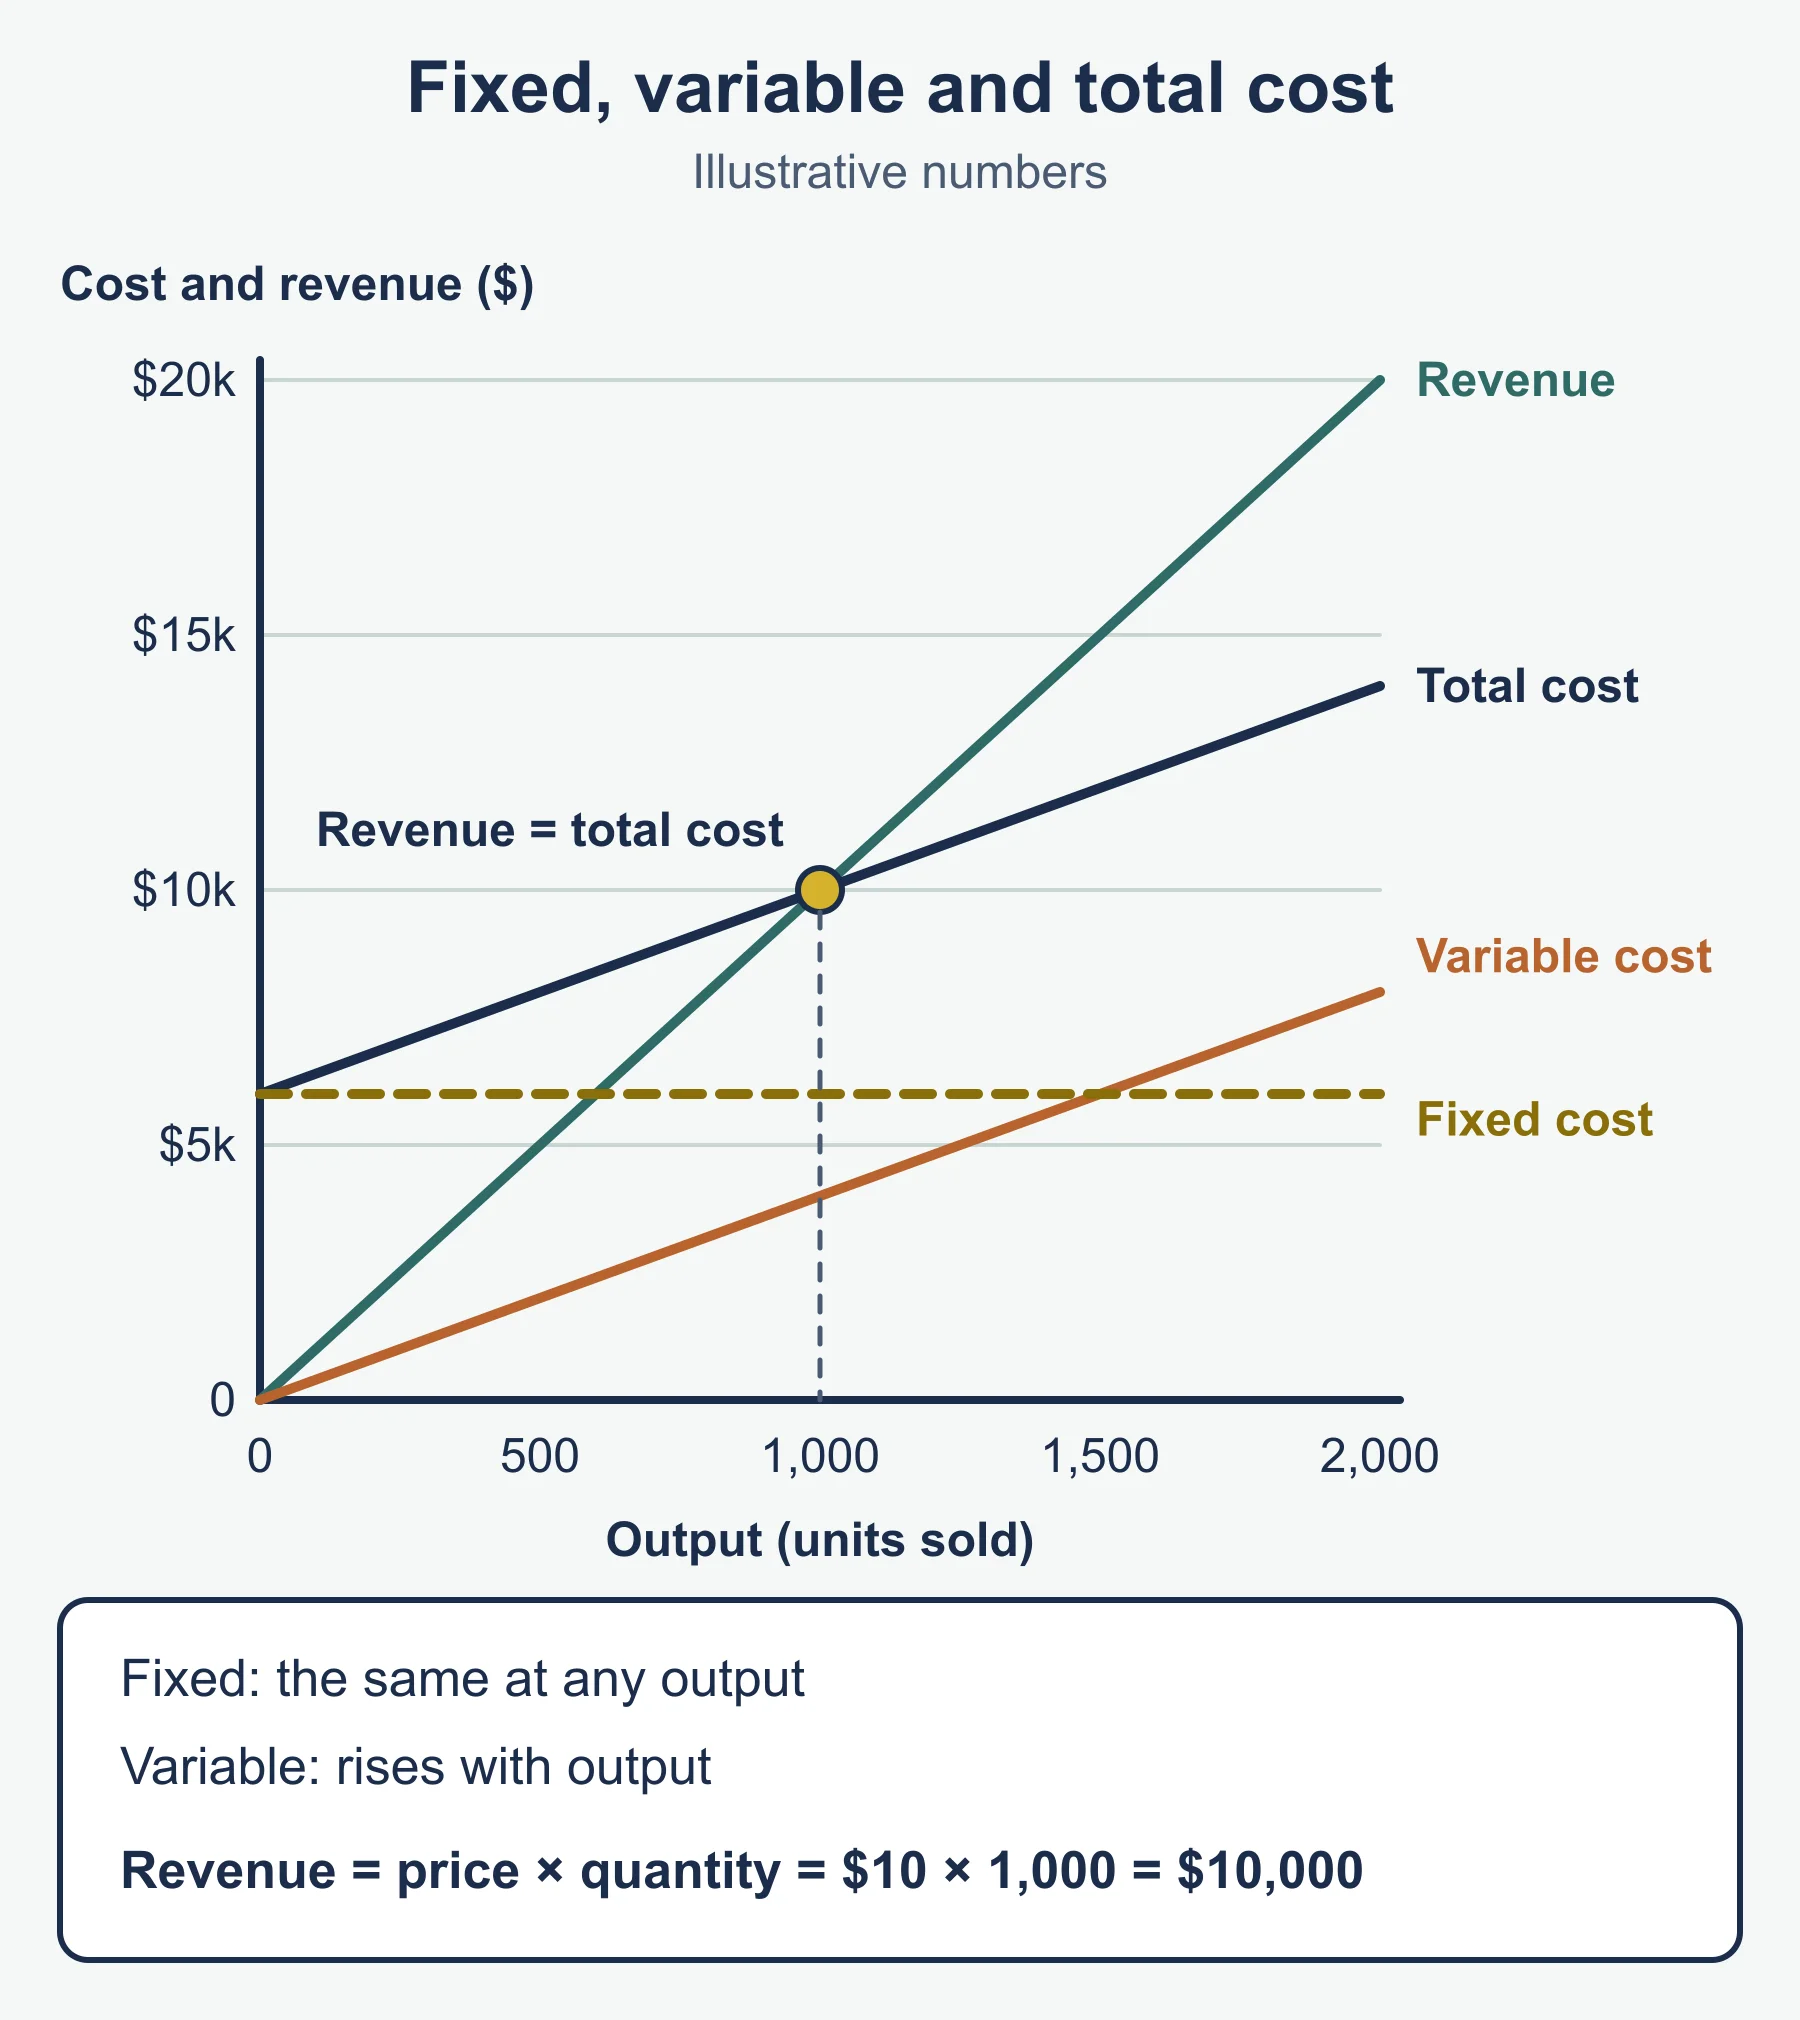
Break-even chart: what to draw and read
- Horizontal axis: output. Vertical axis: money (revenue and costs).
- Fixed costs: a horizontal line.
- Total costs: starts at the fixed cost level on the vertical axis, then rises.
- Total revenue: starts at the origin.
- Break-even point: where total revenue and total costs cross. Read the output down to the horizontal axis.
- Profit: the gap to the right, with revenue above total cost. Loss: the gap to the left, with revenue below total cost.
- Margin of safety: the horizontal distance between actual output and break-even output.
| Amend the chart for | What moves |
|---|---|
| Higher price | Revenue line steeper |
| Higher fixed costs | Fixed cost and total cost lines both shift up |
| Higher variable cost per unit | Total cost line steeper |
To complete a missing line, plot two points (one at zero output) and join them with a ruler.
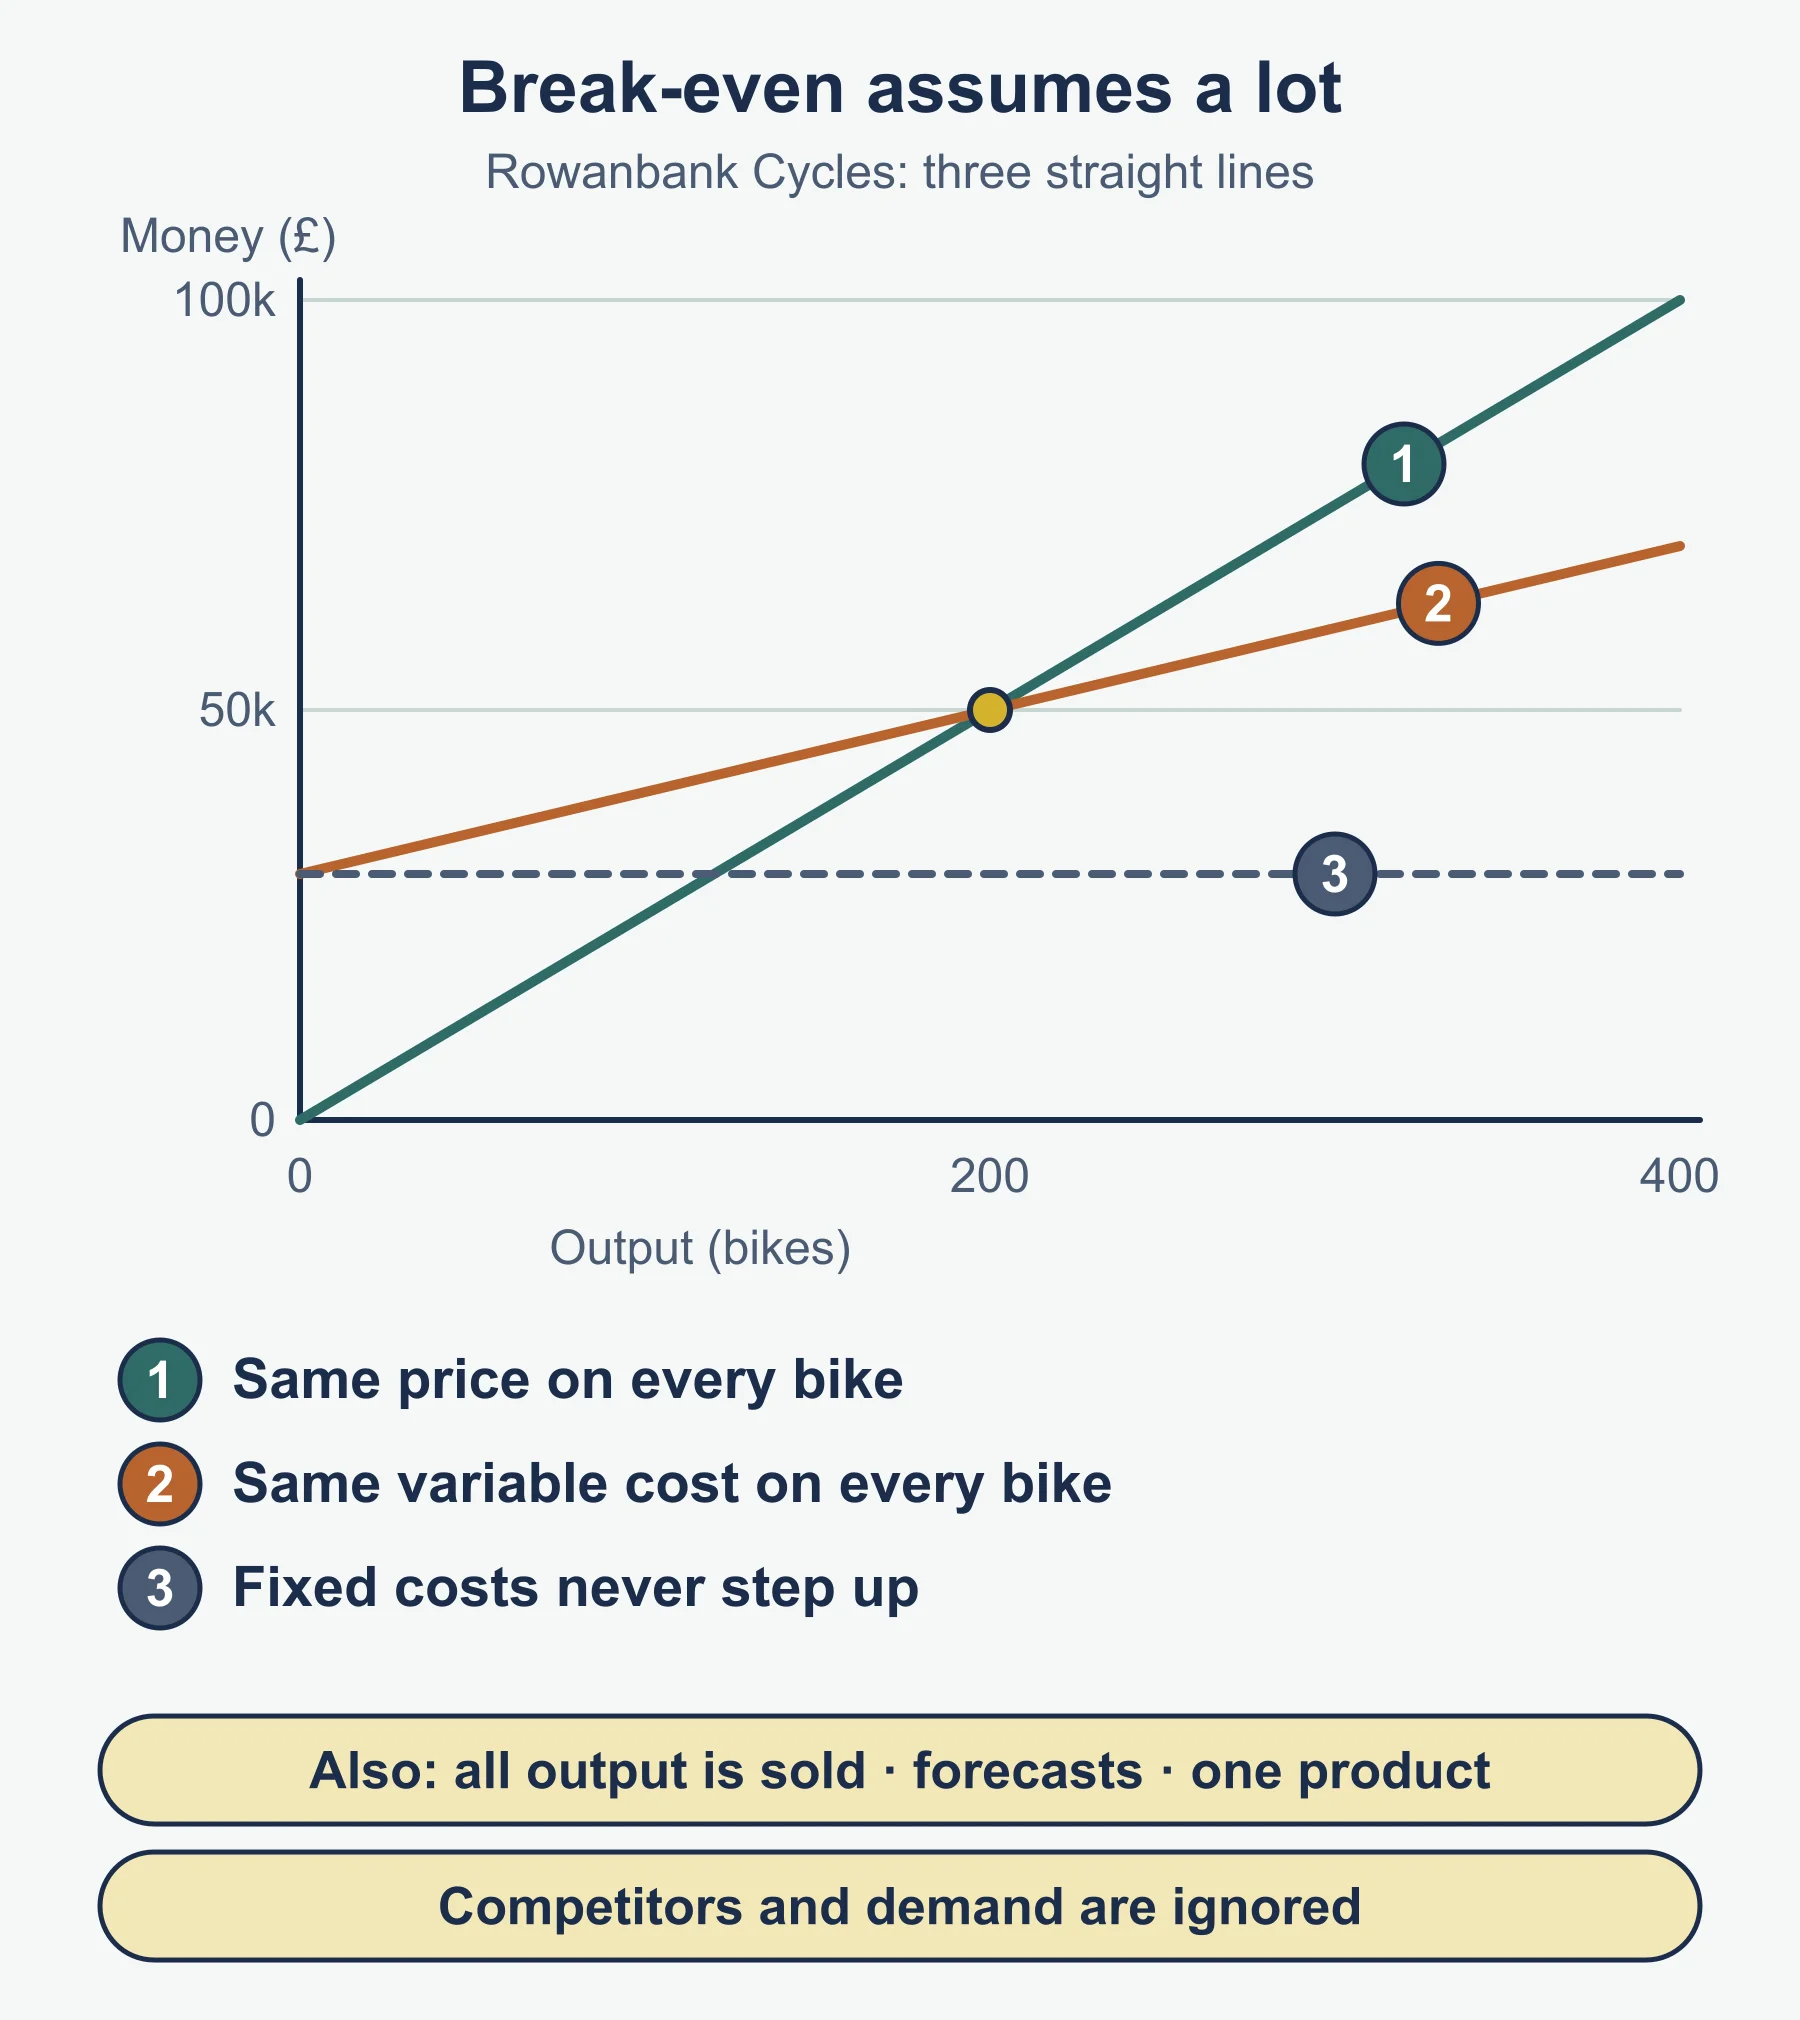
Limitations of break-even analysis
Assumes all output is sold, price and variable cost per unit stay constant, fixed costs stay fixed at all output levels, and costs and revenue can be forecast accurately. Works best for one product. Ignores competitors and changes in demand. A chart shows where break-even is, but does not say whether the business will reach it.
Answering in the exam
- Calculate: write the formula, substitute the figures, give the answer with its unit (units, or money).
- Define and State: a short, precise statement is enough.
- Explain: give the point, then the reason, then link it to the business in the question.
- Justify: support a decision with evidence and set out a reason against it too, then decide. For a break-even decision, quote the new break-even output, compare it with expected sales and comment on whether customers will really buy at that level.
Quick self-test
- Define fixed costs.
- A firm has total fixed costs of £15,000 and variable costs of £6.20 per unit. Calculate its total cost and average cost at 2,500 units.
- Elmbridge Bags sells a bag for £40. Variable cost is £28 and fixed costs are £36,000. Calculate break-even output.
- Elmbridge sells 3,400 bags. Calculate the margin of safety.
- Calculate Elmbridge’s profit at 3,400 bags.
- State two types of economy of scale.
- State two causes of diseconomies of scale.
- A product sells for £15 and has variable costs of £9 per unit. Fixed costs are £18,000. Calculate break-even output.
- Explain why a price rise lowers break-even output.
- State one limitation of break-even analysis.
Answers
- Costs that do not change when output changes, such as rent.
- Total variable cost = 6.20 × 2,500 = £15,500. Total cost = 15,000 + 15,500 = £30,500. Average cost = 30,500 ÷ 2,500 = £12.20.
- Contribution = 40 − 28 = £12. Break-even = 36,000 ÷ 12 = 3,000 bags.
- 3,400 − 3,000 = 400 bags.
- 3,400 × 12 − 36,000 = 40,800 − 36,000 = £4,800.
- Any two from purchasing, marketing, financial, managerial, technical.
- Any two from poor communication, lack of commitment or loyalty from employees, weak coordination, lack of control.
- Contribution = 6. Break-even = 18,000 ÷ 6 = 3,000 units.
- Each unit then contributes more towards fixed costs, so fewer units are needed to cover them.
- For example: it assumes everything made is sold at a constant price.
Where marks are usually lost
- Dividing fixed costs by selling price instead of contribution per unit.
- Writing break-even output in money instead of units.
- Using actual sales as the break-even figure when finding margin of safety, or subtracting the wrong way round.
- Calling variable cost per unit the “average cost”.
- Starting the total cost line at the origin on a chart.
- Naming an economy of scale but never saying how average cost falls.
- Saying “bigger firms are better” without any diseconomies of scale.
- Judging a price change from break-even output alone, with no comment on demand.
- Listing limitations in general terms, not linked to the business in the question.
Frequently asked questions
How do you draw a break-even chart? Put output on the horizontal axis and money on the vertical axis. Draw fixed costs as a horizontal line, start total costs at the fixed cost level and total revenue at the origin; break-even is where total revenue and total costs cross.
What happens to break-even output if the price rises? A higher price, or lower costs, moves break-even output down. A lower price or higher costs move it up, but a price change may also change how many units customers buy.
What are the limitations of break-even analysis? It assumes all output is sold, the price and variable cost per unit stay constant and fixed costs stay fixed. It suits one product, uses forecasts that may be wrong and ignores the market.
Is variable cost per unit the same as average cost? No. Average cost is total cost divided by output, so it includes a share of fixed costs. Calling variable cost per unit the “average cost” is a common error.
Official syllabus
Cambridge IGCSE Business 0264 syllabus for examination in 2027, 2028 and 2029, Cambridge University Press & Assessment, section 4.4 and the Formulas and ratios section.
Get free revision emails (optional)
Occasional emails with practice questions, worked explanations and links to free resources for the qualification and subjects you choose. No spam, and you can unsubscribe from any email. The free tools on this site never need an email.
Related resources
-
Study guides
IGCSE Business: Production of goods and services (Cambridge 0264)
Study guide to Cambridge IGCSE Business 0264 section 4.1: labour productivity, efficiency, lean production, inventory and job, batch and flow production.
Business · Cambridge · IGCSE
Read guide -
Practice questions
IGCSE Business: Production of goods and services (Cambridge 0264) – Practice Questions
Twelve original practice questions with worked answers on Cambridge IGCSE Business 0264 section 4.1: productivity, lean production and production methods.
Business · Cambridge · IGCSE
Try questions -
Revision notes
IGCSE Business: Production of goods and services (Cambridge 0264) – Revision Notes
Condensed revision notes for Cambridge IGCSE Business 0264 section 4.1: productivity, efficiency, lean production, inventory and production methods.
Business · Cambridge · IGCSE
Revise topic
Related articles
-
teaching
A Level tuition in Dubai: Cambridge or Pearson Edexcel International A Level?
Schools in Dubai and Abu Dhabi teach either Cambridge International AS & A Level or Pearson Edexcel International A Level. How the two are structured, why it matters for tuition, and how online classes from Lahore work.
9 October 2026
-
curriculum guides
Choosing subjects at IGCSE and A Level
How subject choices at 14 and 16 affect university options later, and how to keep pathways open without overloading a timetable.
28 July 2026
Studying this with a teacher
Working through Business IGCSE?
This page is free and stays free. If you would rather be taught it, Marlbridge runs Business classes one-to-one and in small groups of up to 15, online in your own time zone. The first trial class is free. WhatsApp replies within an hour (8am–11pm Pakistan time, every day); email the same day.
Cambridge Business teachers at Marlbridge

