
Study Guides
O Level Business: Marketing, competition and the customer and Market research (Cambridge 7115)
Study guide to the customer, competition, niche and mass marketing, segmentation and market research for Cambridge O Level Business Studies 7115.
- Subject
- Business
- Level
- O LEVELS
- Topic
- Marketing
- Author
- Marlbridge Academic Team
- Updated
- Reviewed by
- Salman Ahmad (what this means)
Aligned to Cambridge O Level Business (7115), For examination in 2026. Official specification .
Syllabus page (what it covers and how it is assessed): Cambridge O Level Business.
Syllabus points this page covers
7115
- 3.1 Marketing, competition and the customer
- 3.2 Market research
Found an error? Report a correction.
Need help with this topic? Request a free trial class for O Level Business (7115).
This guide follows the Cambridge O Level Business Studies (7115) syllabus for examination in 2026. It covers sections 3.1 (Marketing, competition and the customer) and 3.2 (Market research) of Topic 3, Marketing. Both papers, Paper 1 and Paper 2, last 1 hour 30 minutes and carry 50% each, and either can test this content. Section 3.3 (marketing mix) and 3.4 (marketing strategy) are separate.
Use it with the revision notes and the practice set. For short skill drills across the whole topic, try the Marketing practice questions. Check progress against the course hub and the printable checklist, and test yourself with the free diagnostics.
What you must be able to do
| Section | Content |
|---|---|
| 3.1.1 | Role of marketing: identify and satisfy customer needs, maintain loyalty, build relationships |
| 3.1.2 | Market changes: why spending patterns change, changing needs, why markets become more competitive, how businesses respond |
| 3.1.3 | Niche marketing and mass marketing: benefits and limitations of both |
| 3.1.4 | Market segmentation: how and why, benefits, recommending and justifying a method |
| 3.2.1 | Role of market research and methods: uses, primary and secondary research, primary methods, sampling, secondary methods, accuracy |
| 3.2.2 | Analysing research data shown in graphs, charts and diagrams and drawing simple conclusions |
3.1.1 The role of marketing
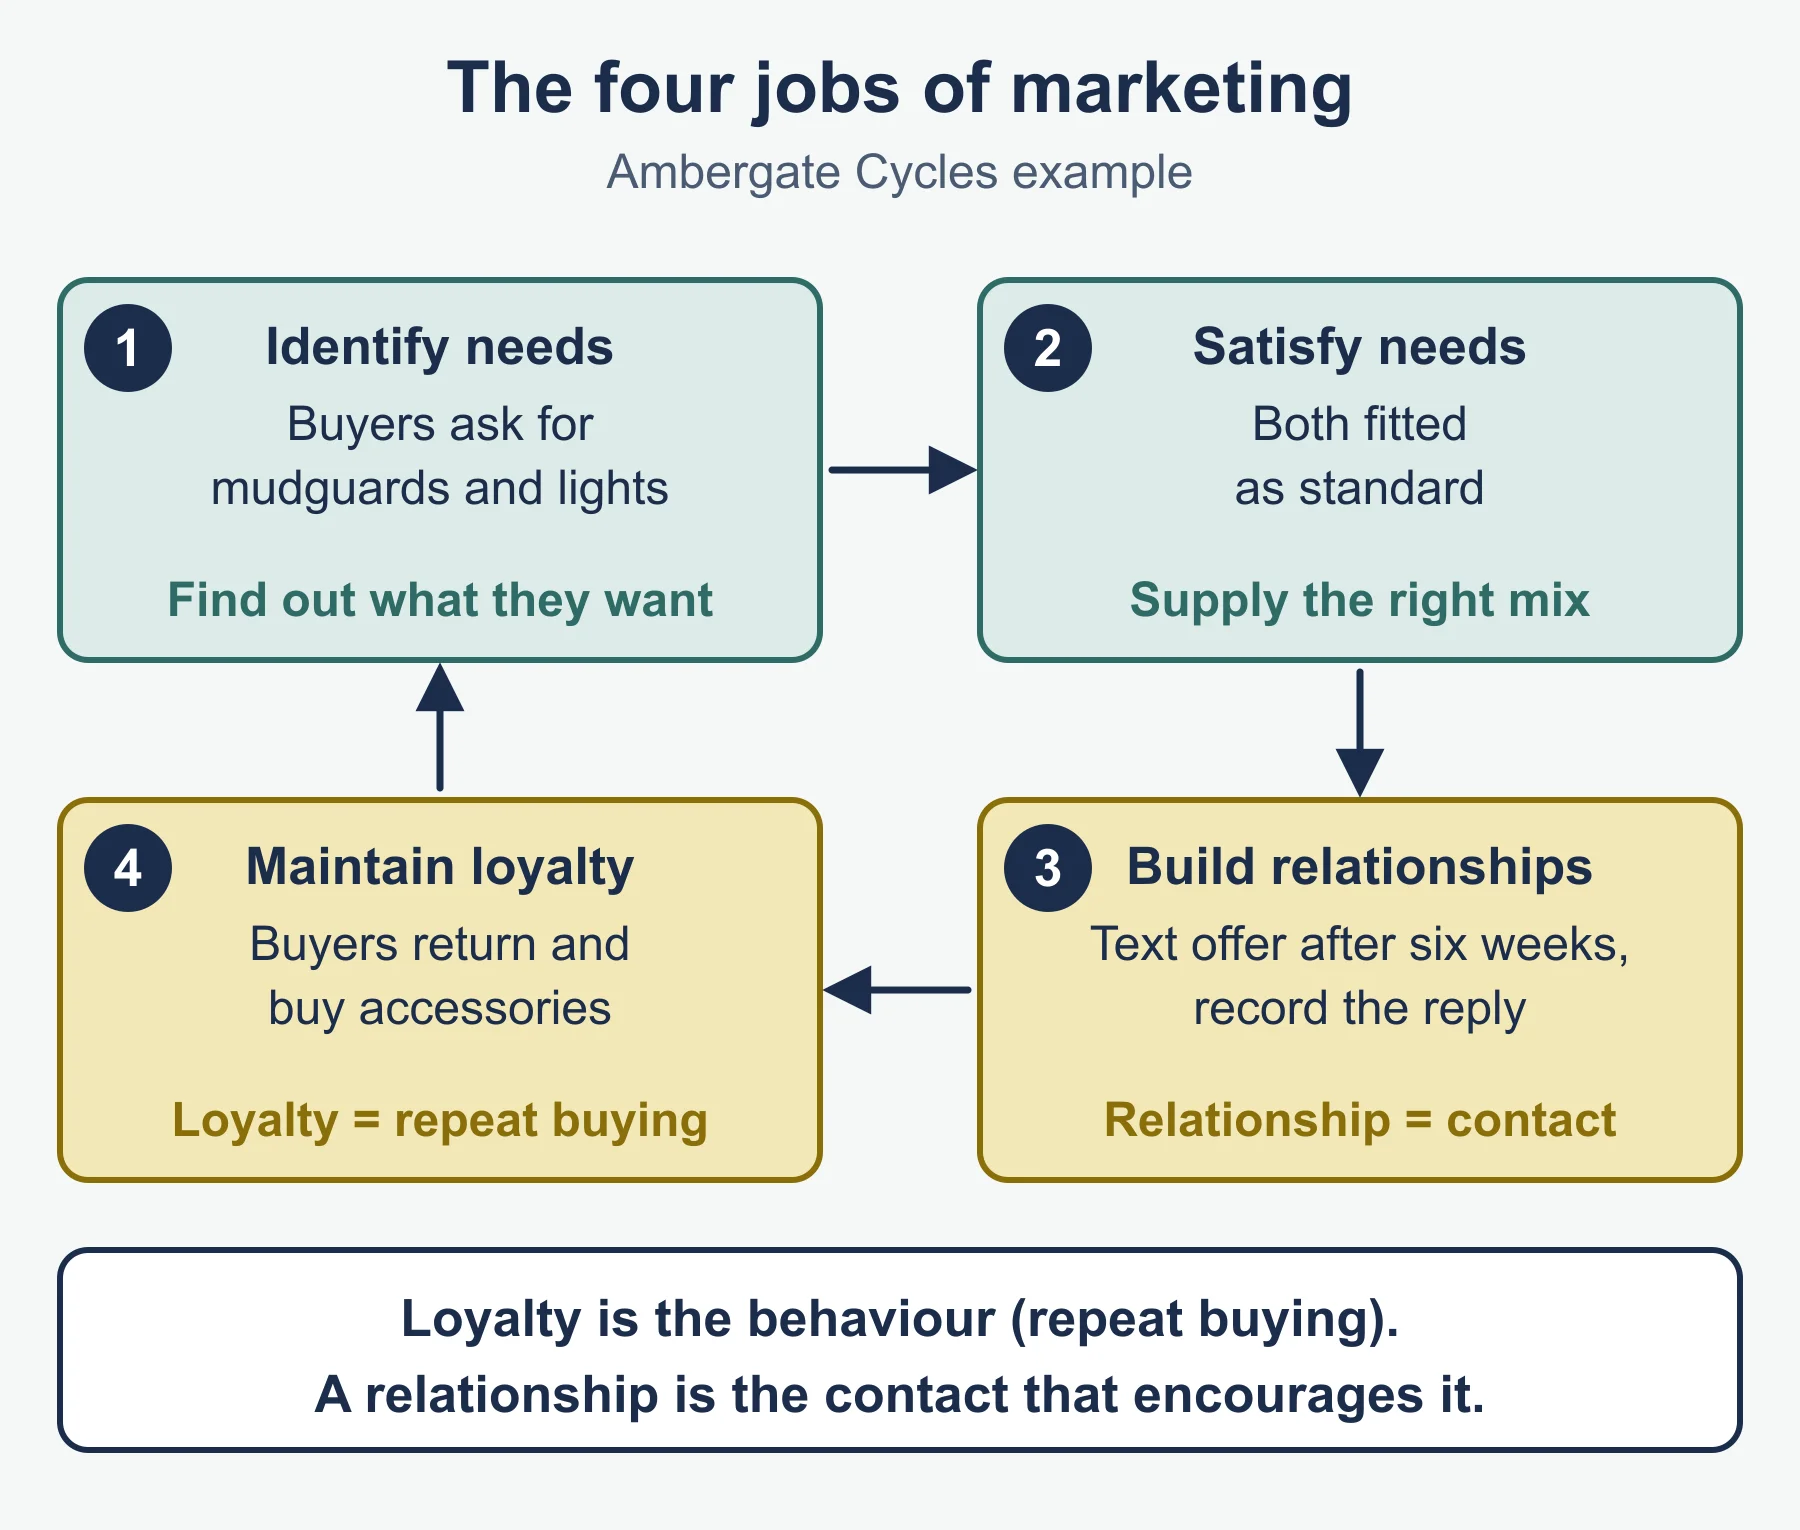
Marketing is the management activity that links a business to its customers. The syllabus lists four jobs.
- Identifying customer needs. A business cannot sell what nobody wants. It finds out what customers want, what they will pay and what they currently buy from rivals.
- Satisfying customer needs. It then supplies the right product, at the right price, in the right place, with the right promotion. A product that matches the need sells more and is returned less.
- Maintaining customer loyalty. Loyal customers buy again and cost less to win than new ones. Methods include discount cards, points schemes, consistent quality and quick handling of complaints.
- Building customer relationships. Two-way contact, such as asking for feedback, sending useful reminders and remembering regular buyers, makes customers feel valued and more likely to recommend the business.
Loyalty and relationships overlap but are not the same. Loyalty is the behaviour (repeat buying). A relationship is the contact that encourages it.
Worked example. Ambergate Cycles sells commuter bicycles. Staff notice that many buyers ask for mudguards and lights. The firm now fits both as standard (identifying and satisfying needs). It texts each buyer a free adjustment offer after six weeks and records their reply (building a relationship). Buyers who return for the adjustment often buy accessories (loyalty). Each action is tied to one of the four jobs, which is how to structure an answer.
3.1.2 Market changes
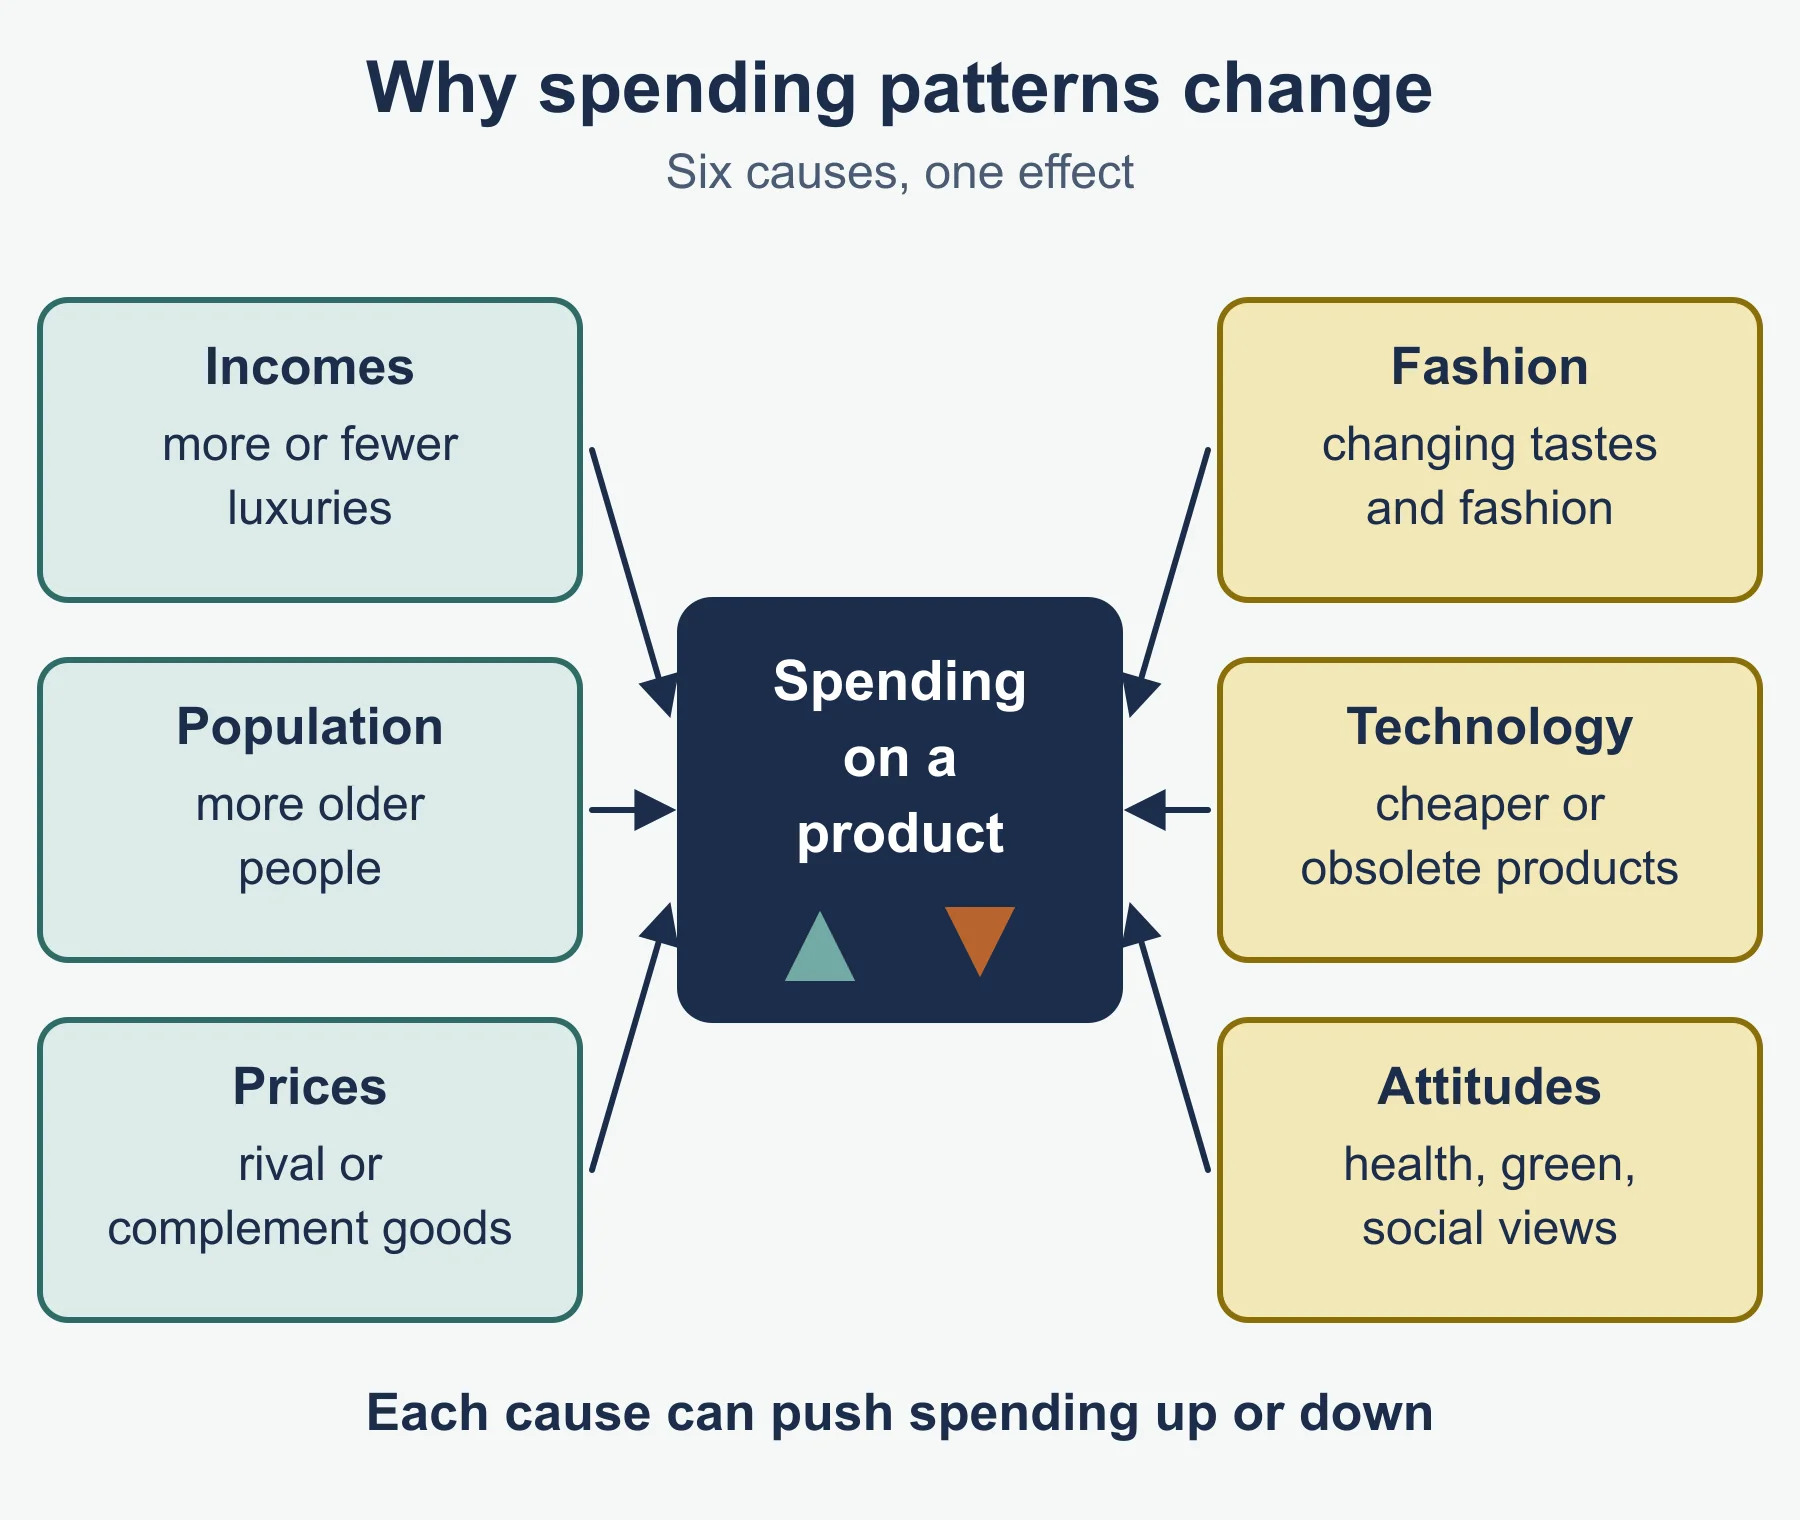
Why spending patterns change. Spending on a product can rise or fall because of:
- changes in incomes (people buy more or fewer luxuries)
- changes in tastes and fashion
- changes in population, such as more older people
- new technology that makes products cheaper or obsolete
- changes in prices of rival or complementary goods
- health, environmental or social attitudes.
Why changing needs matter. A business that does not notice changing needs sells products nobody wants. It loses revenue, has unsold stock and may lose customers to rivals who adapted earlier.
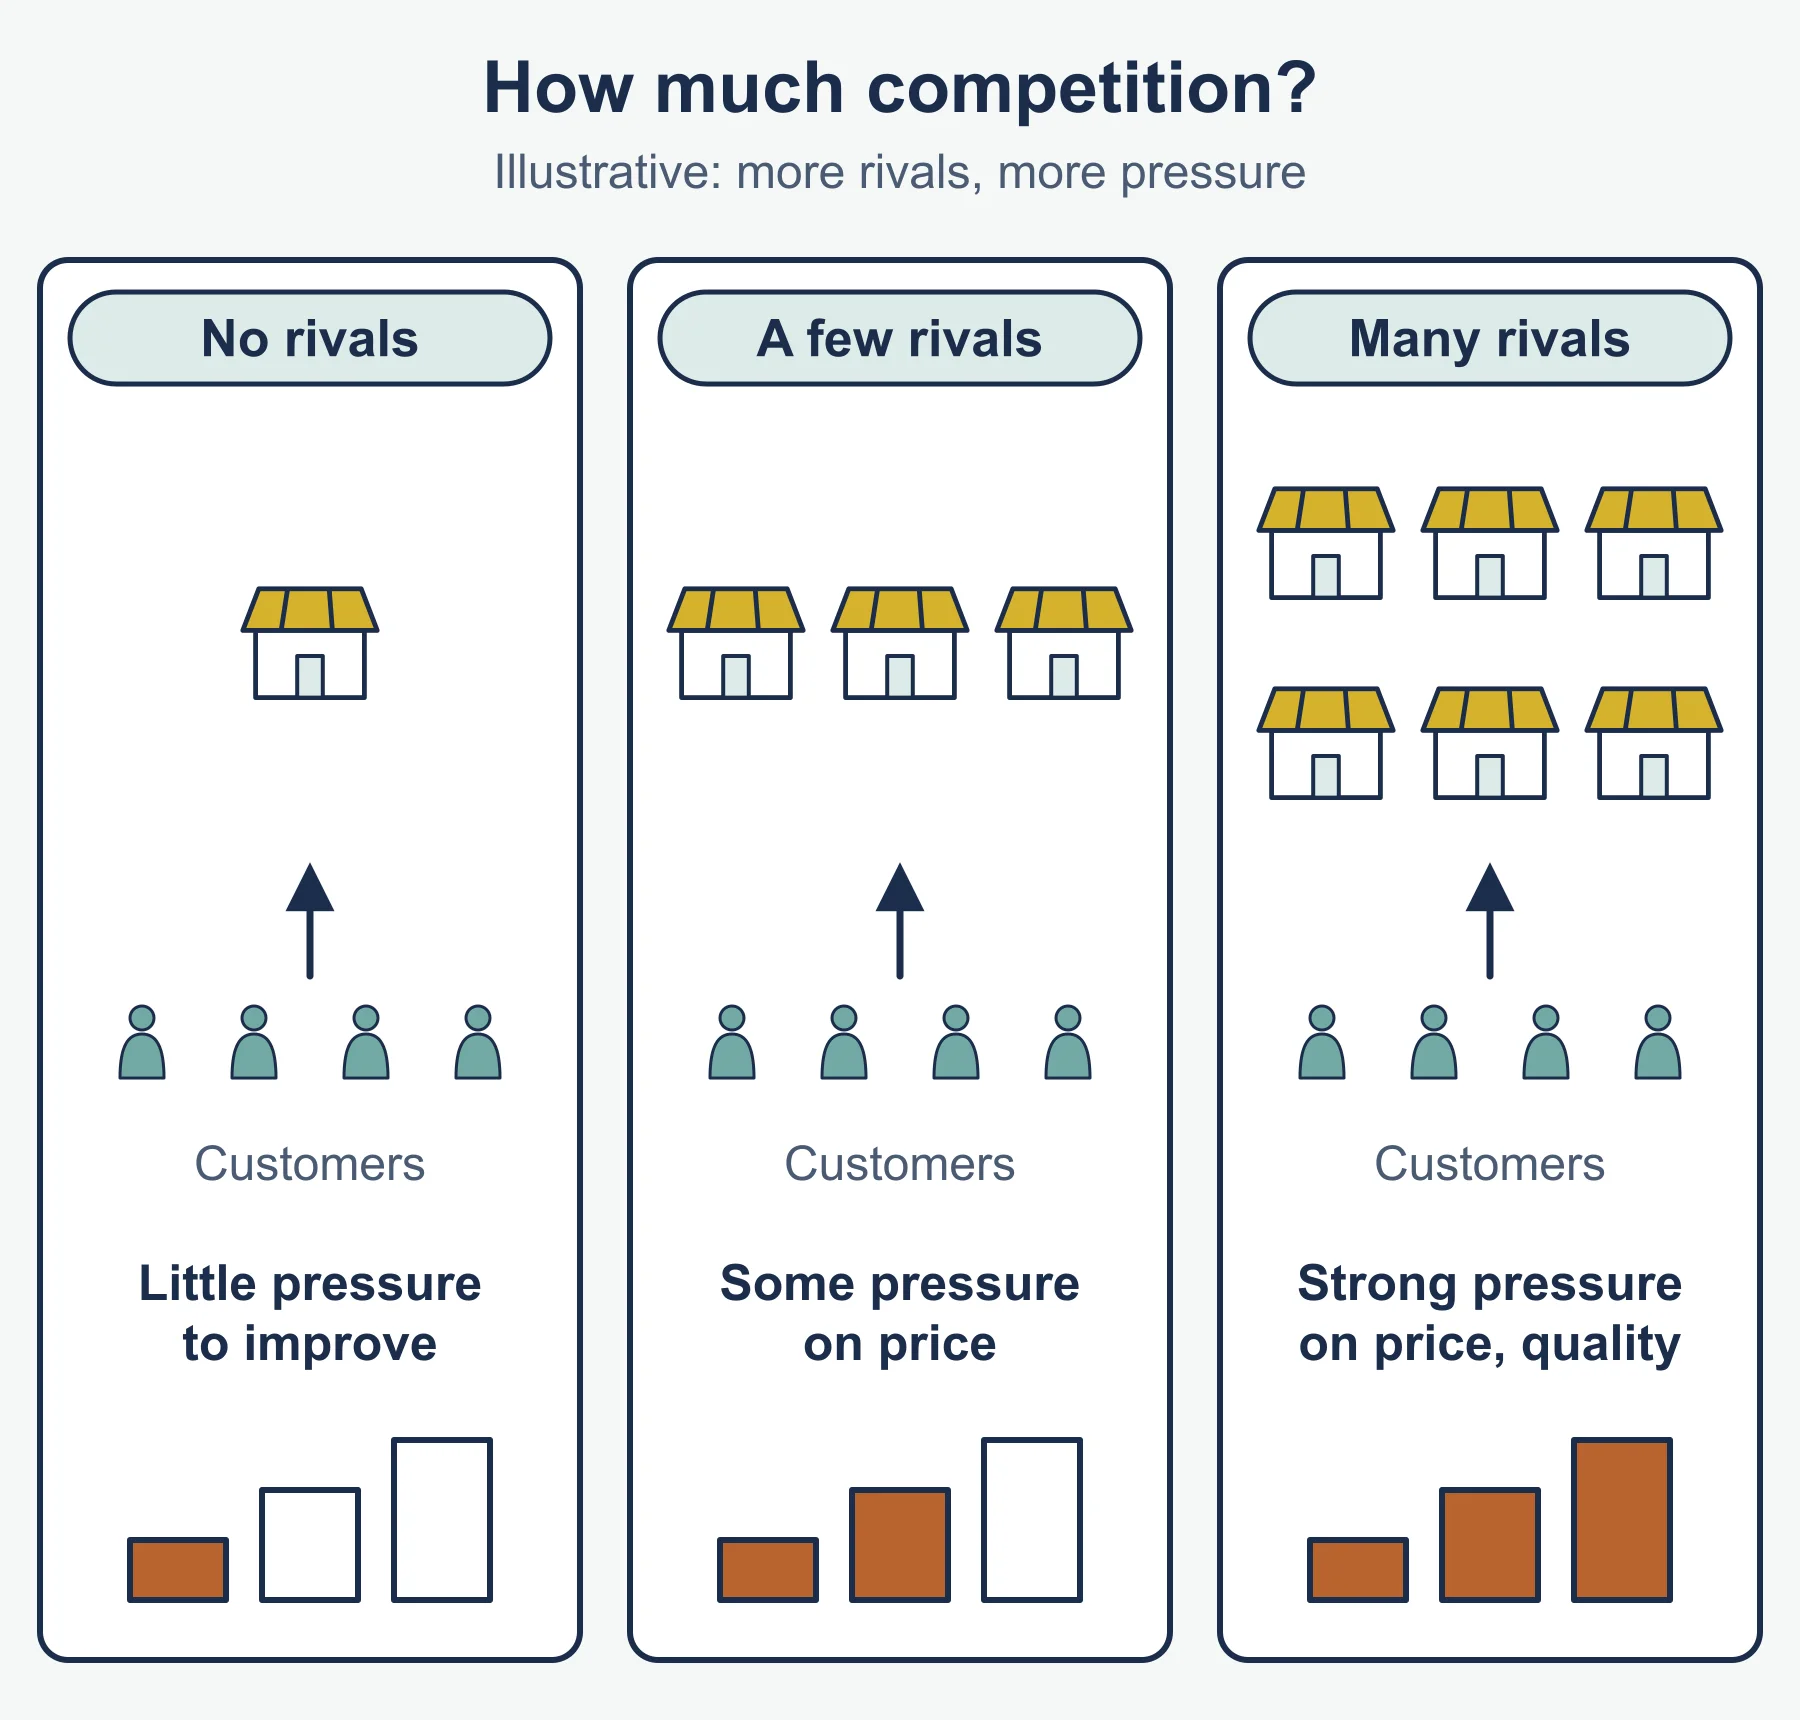
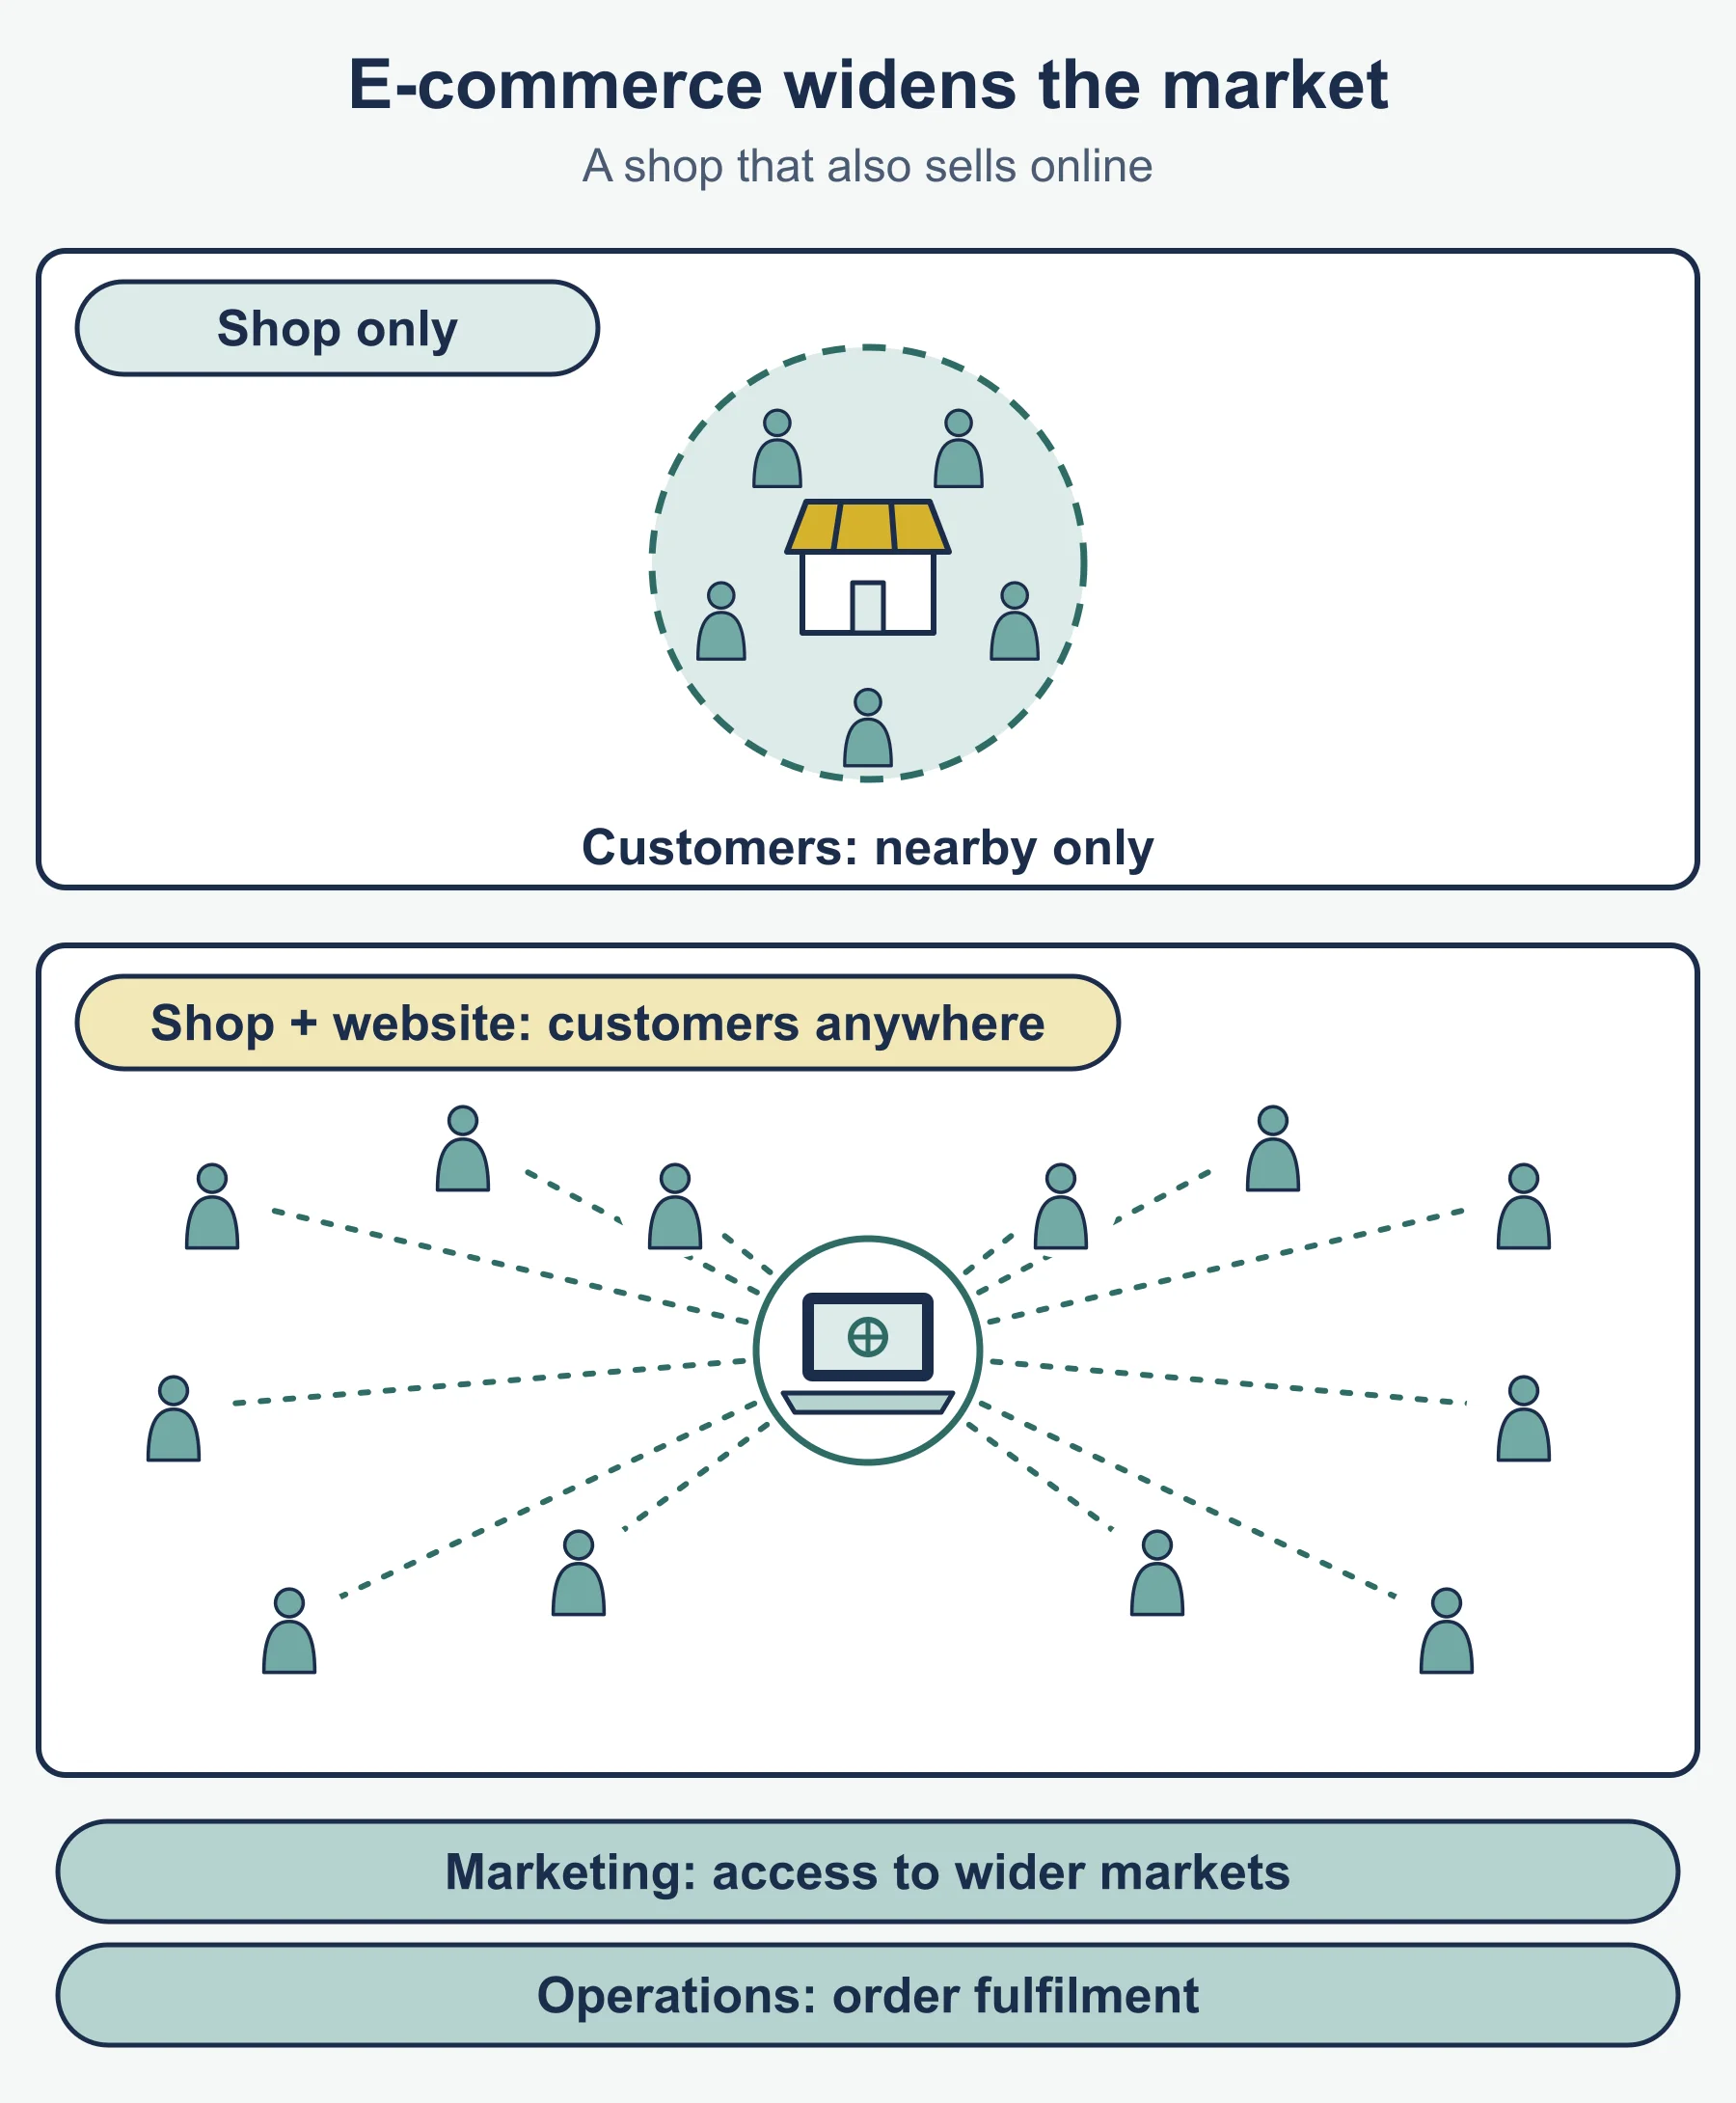
Why some markets have become more competitive. More firms may enter because starting is easier. Online selling lets distant rivals reach your customers. Global competitors, price comparison websites and better-informed customers all increase pressure on prices.
How businesses respond. Common responses are to research customers more often, change or add products, adjust prices, improve service or quality, promote more strongly, find new customer groups, or cut costs so lower prices remain profitable.
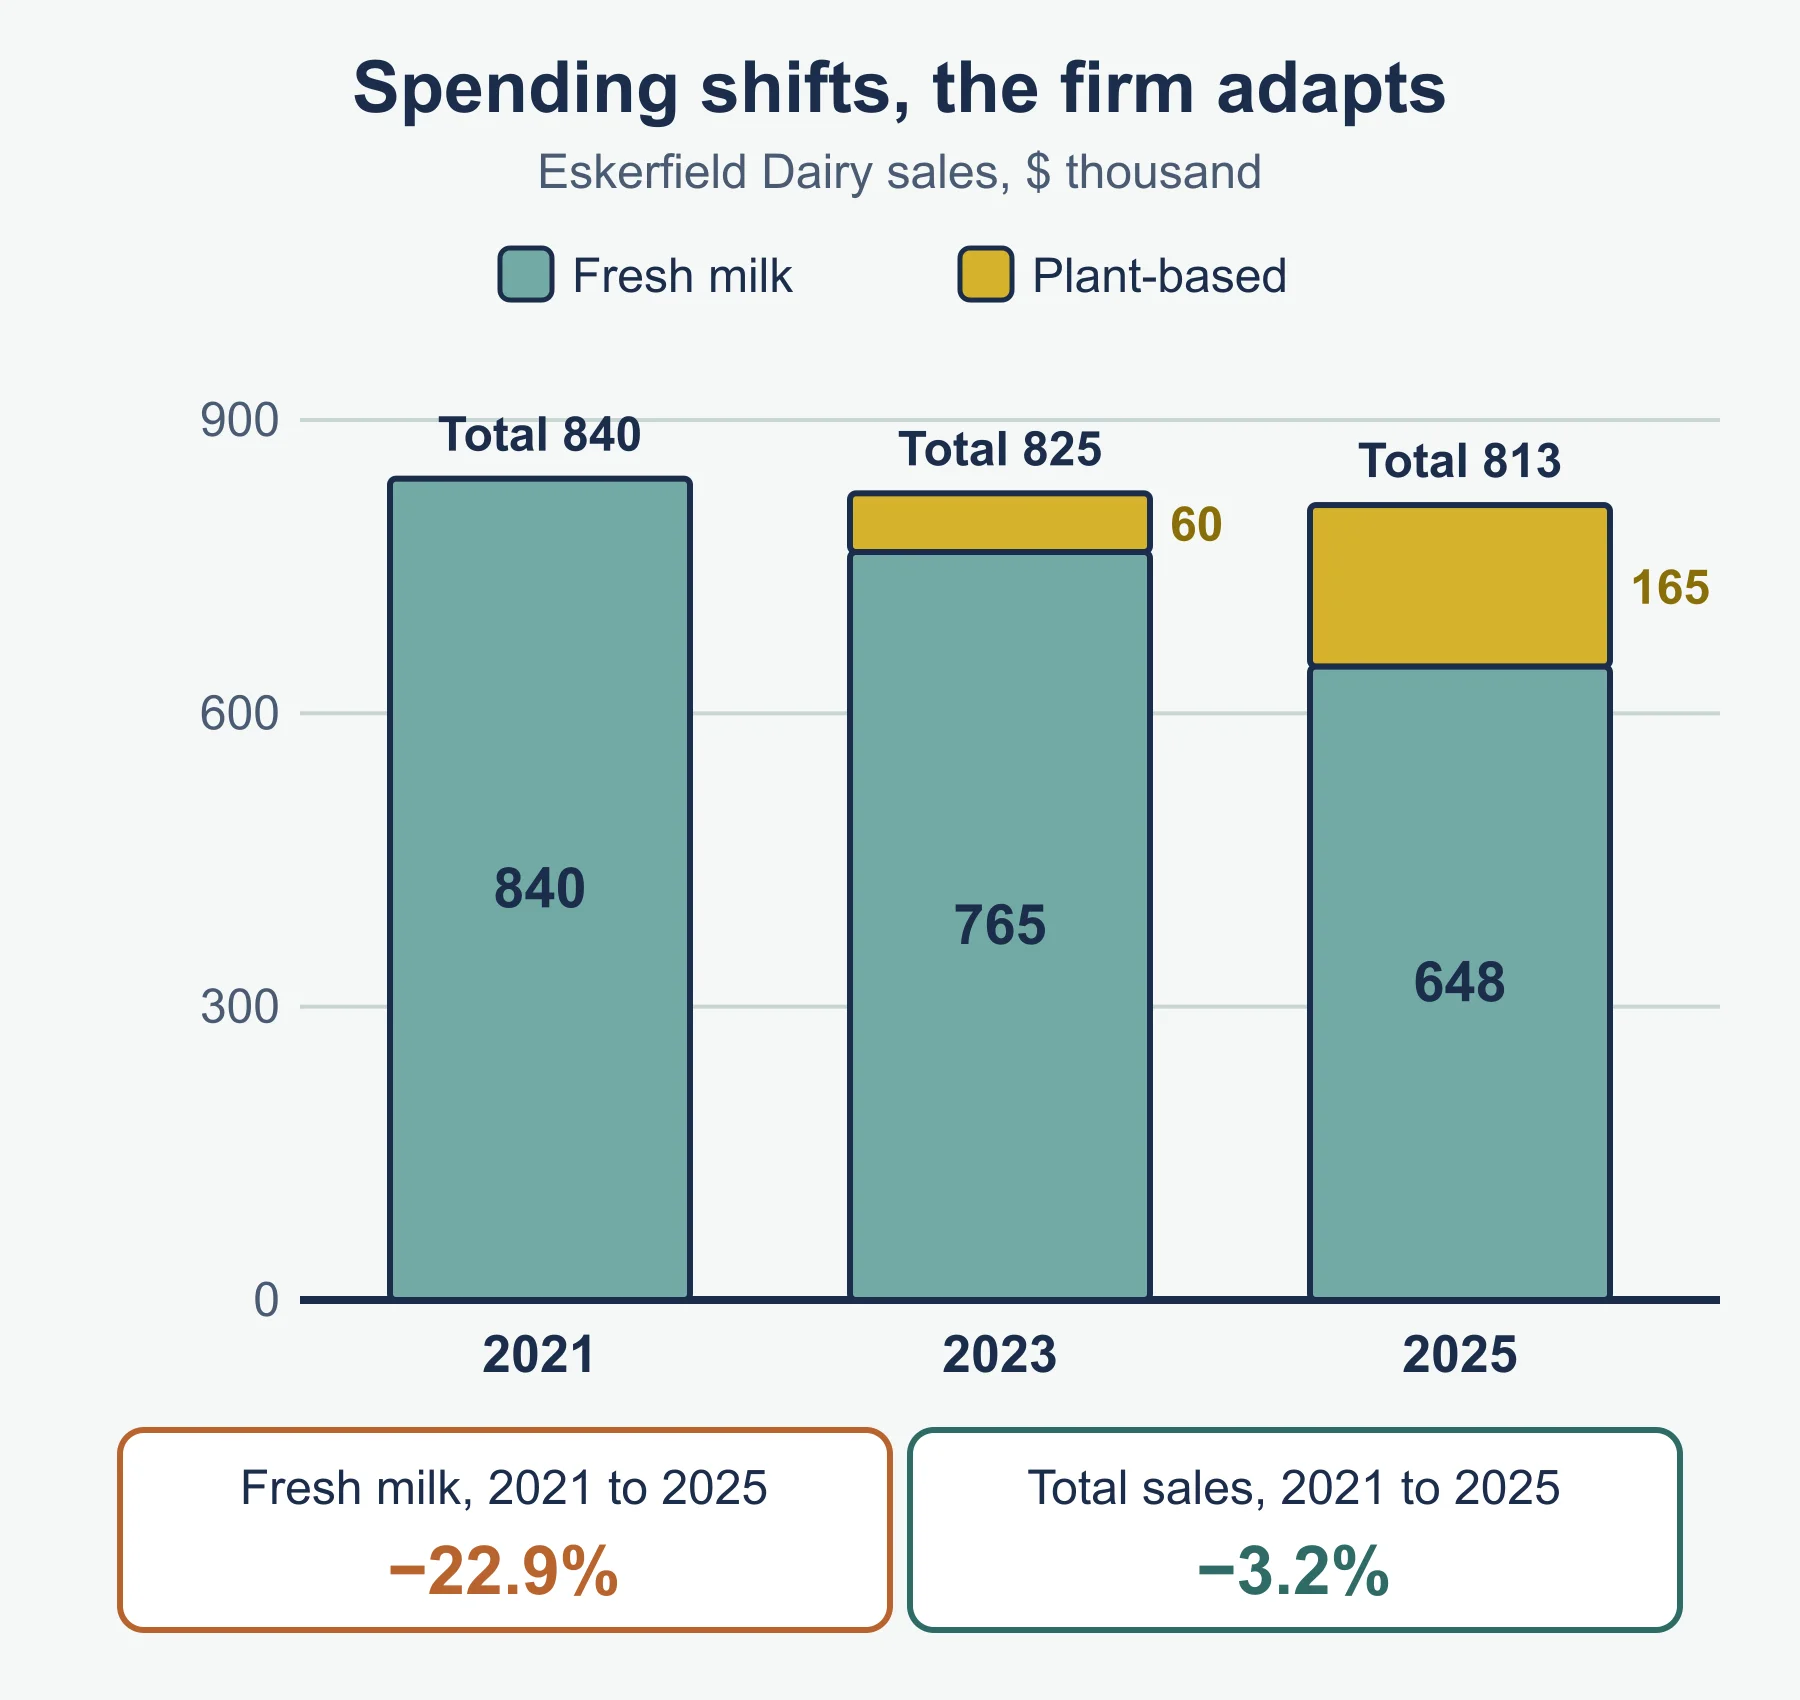
Worked example. Eskerfield Dairy’s sales of fresh milk and a new plant-based range, in thousands of dollars, were:
| Year | Fresh milk | Plant-based | Total |
|---|---|---|---|
| 2021 | 840 | 0 | 840 |
| 2023 | 765 | 60 | 825 |
| 2025 | 648 | 165 | 813 |
Fresh milk fell by 192 between 2021 and 2025, a change of (648 − 840) ÷ 840 × 100 = −22.9%. The total fell only 3.2% ((813 − 840) ÷ 840 × 100) because the new range replaced part of the lost sales. Conclusion: spending has shifted away from milk, and the dairy responded by changing its product range. A fuller answer would add that it should keep researching, because the shift may continue.
3.1.3 Niche marketing and mass marketing
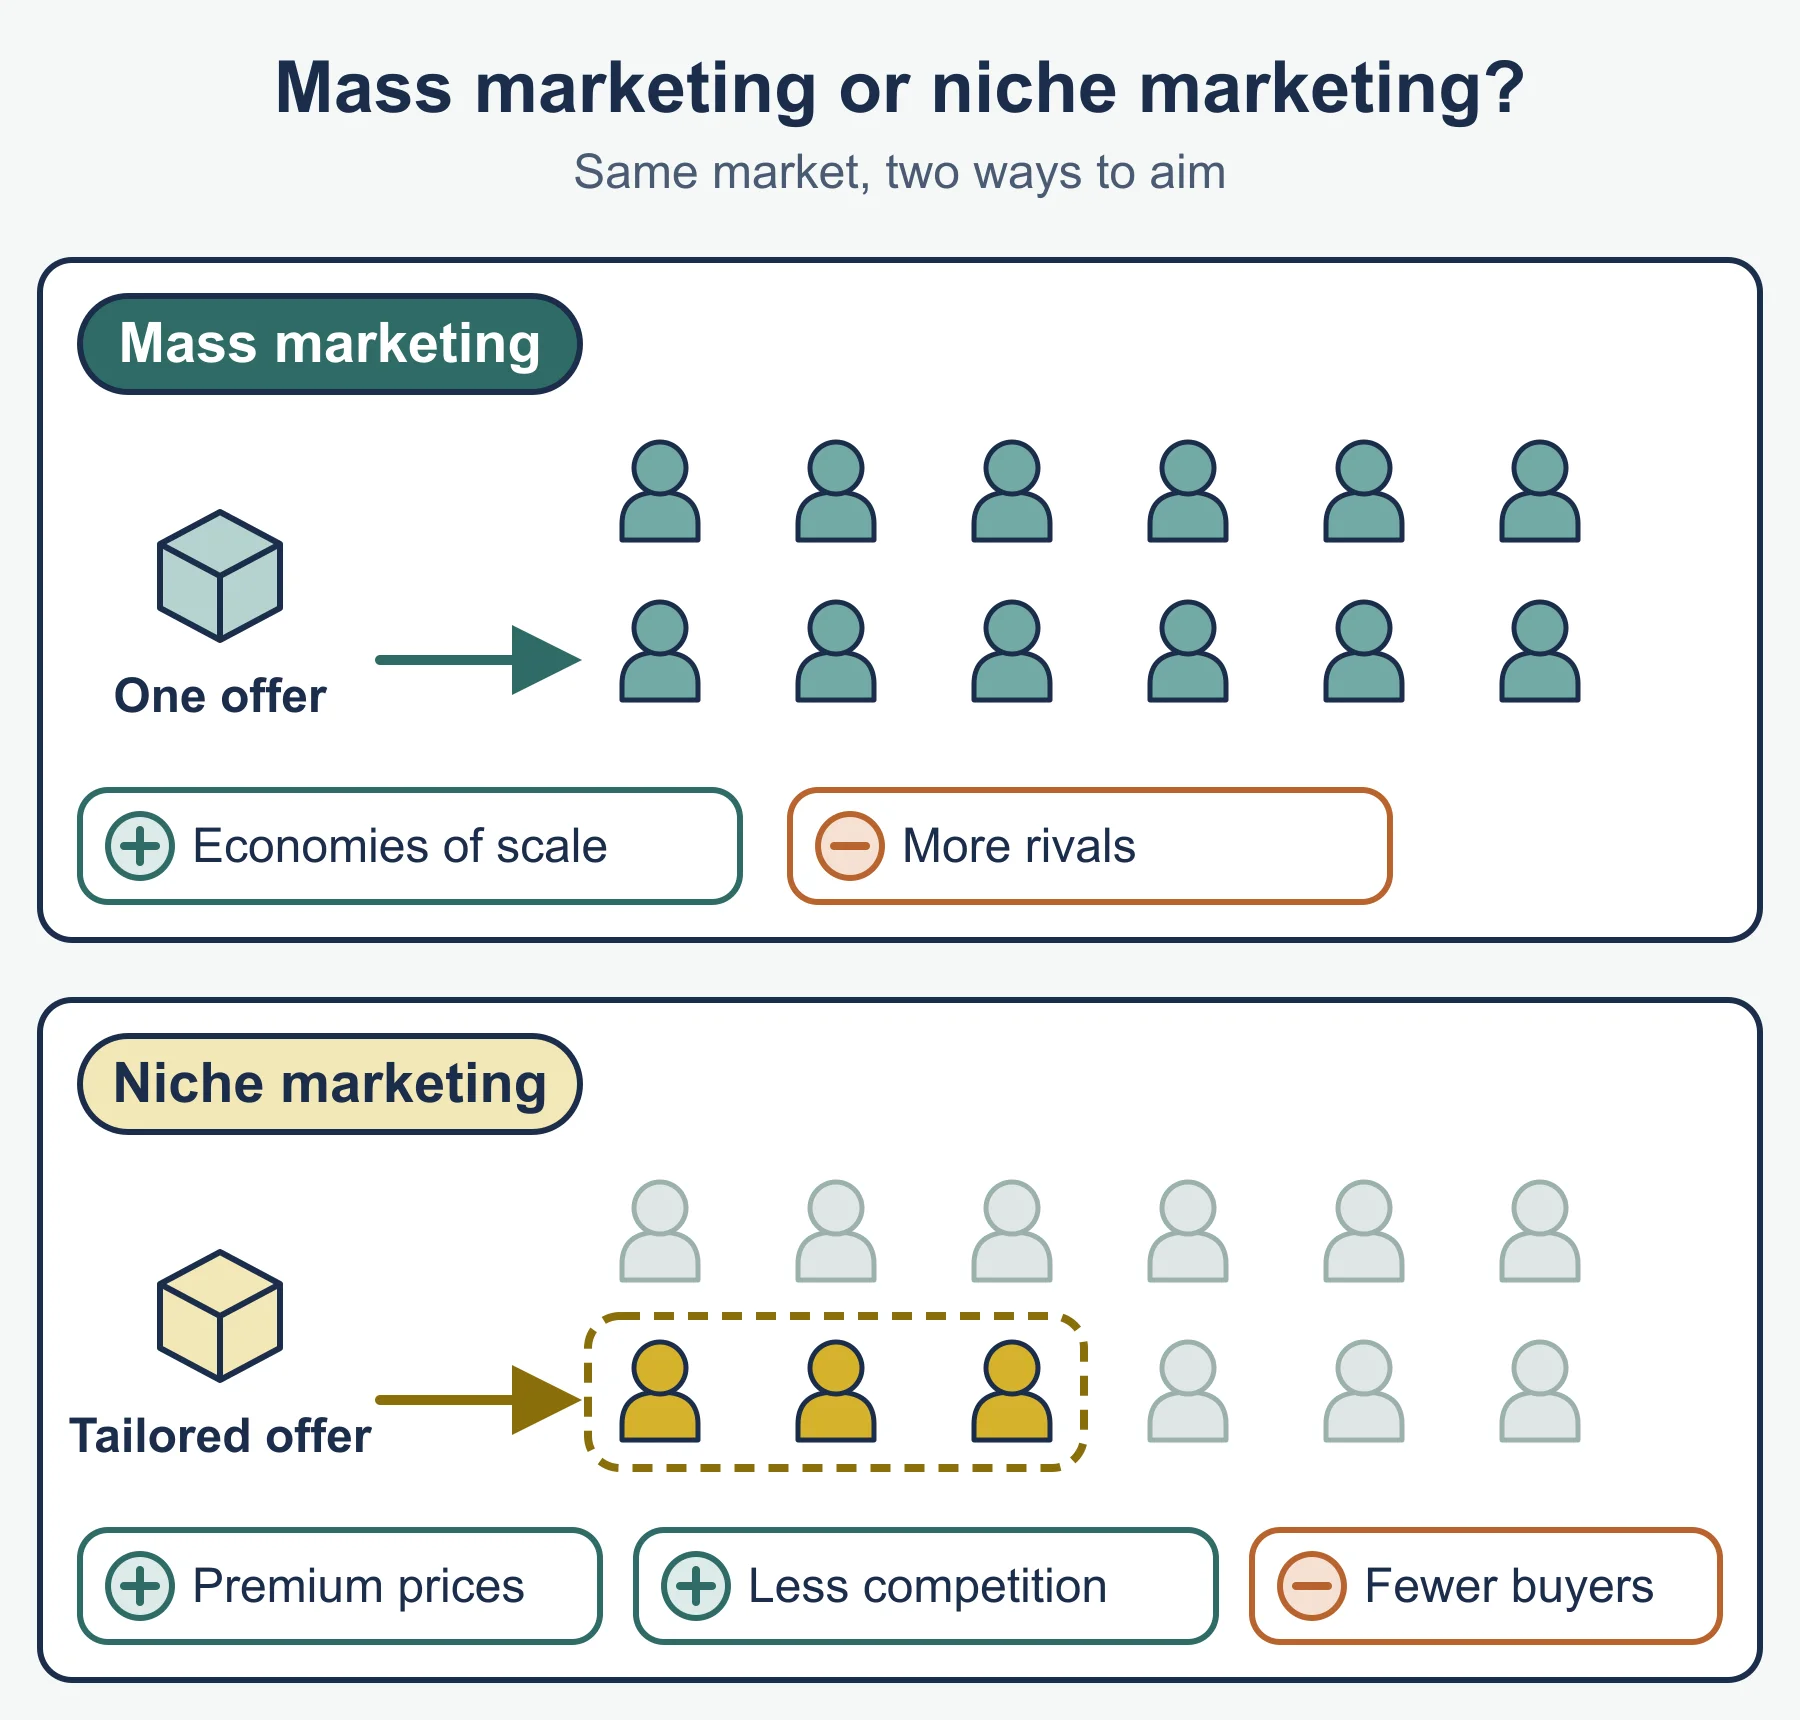
Mass marketing sells one product to a large, wide market with little variation. Niche marketing sells a specialist product to a small, specific part of a market.
| Benefits | Limitations | |
|---|---|---|
| Mass | Large sales volumes; lower unit costs when making and promoting in bulk; wide customer base spreads risk | Many rivals; price competition; products may not suit anyone exactly; heavy promotion costs |
| Niche | Fewer rivals; customers may pay higher prices for a specialist product; strong loyalty | Small market limits sales and growth; risky if tastes change; larger firms may enter |
Worked example. Valcrest Foods makes one white loaf and sells it through every supermarket in the country. It gains from high volume, but it competes mainly on price with other mass producers. Duskmere Fitness runs one gym for women who want strength training only. It charges more and keeps members for years, but there are only so many such members in the town. When writing evaluation, say which approach fits the business described (its size, product and market), not which is better in general.
3.1.4 Market segmentation
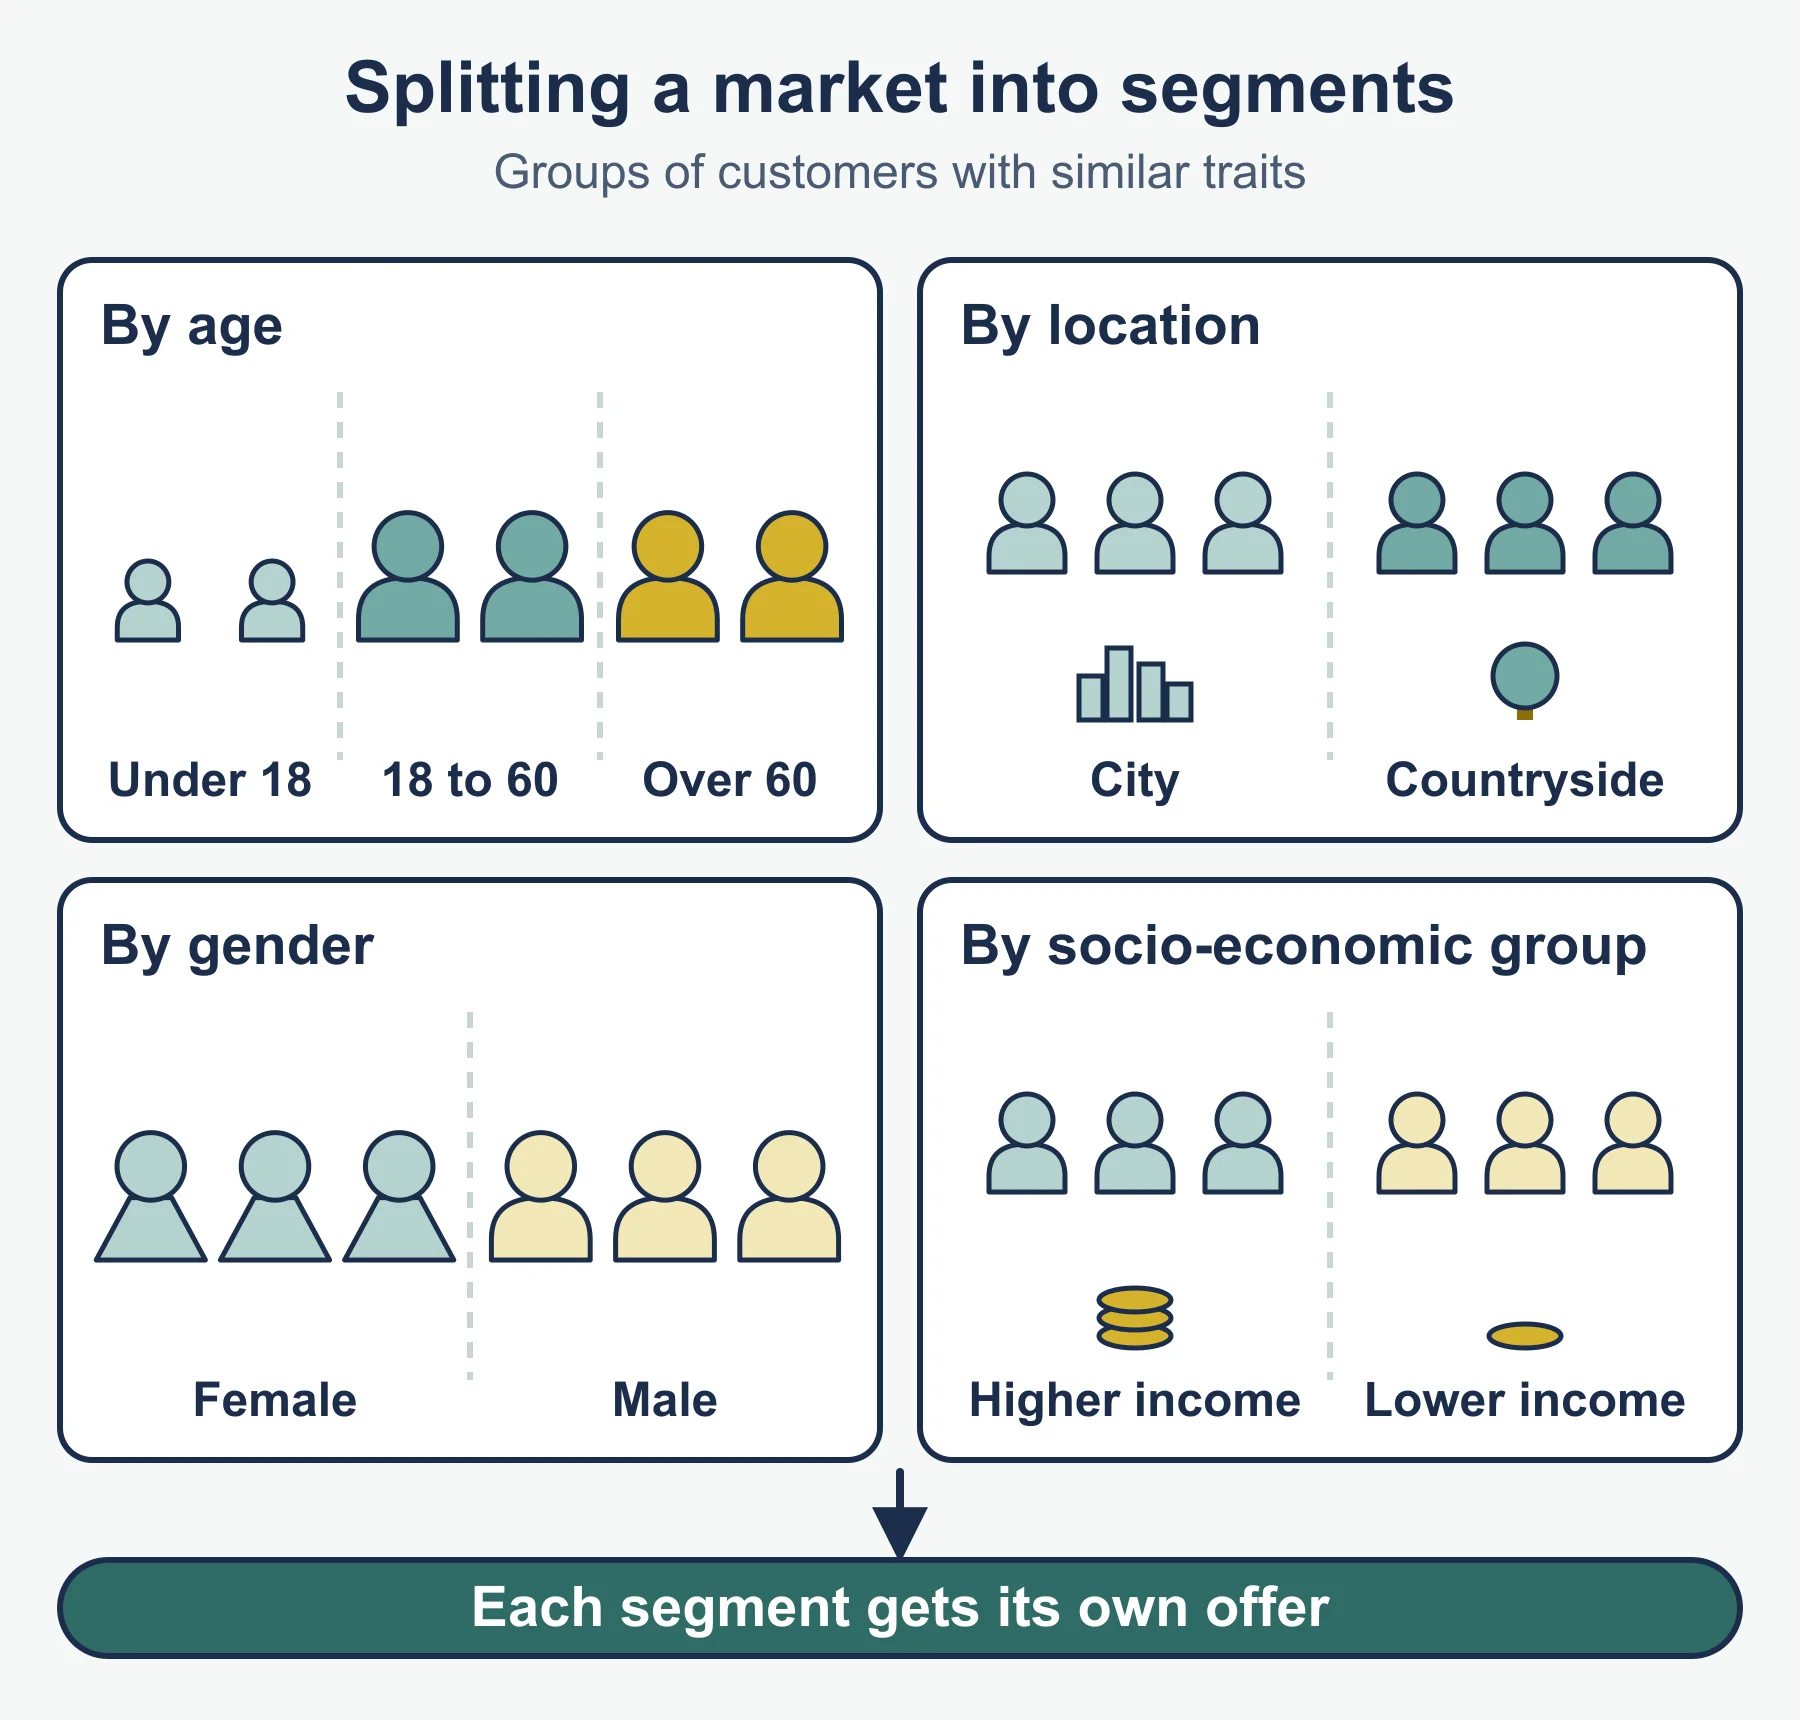
Market segmentation means dividing a market into groups of customers with similar characteristics or needs. The syllabus examples are:
- age (children, teenagers, adults, older people)
- socio-economic grouping (a classification of people by occupation and income)
- location (region, city or rural, country)
- gender.
Benefits to a business. It can aim products, prices and promotion at each group, avoid wasting money on people unlikely to buy, spot gaps in the market and match what each group wants, which can raise sales and loyalty.
Recommending and justifying a method. You may be asked to pick the most suitable basis. Choose the characteristic that best explains differences in buying in the case, then give a reason and (for justify) a short counter-argument.
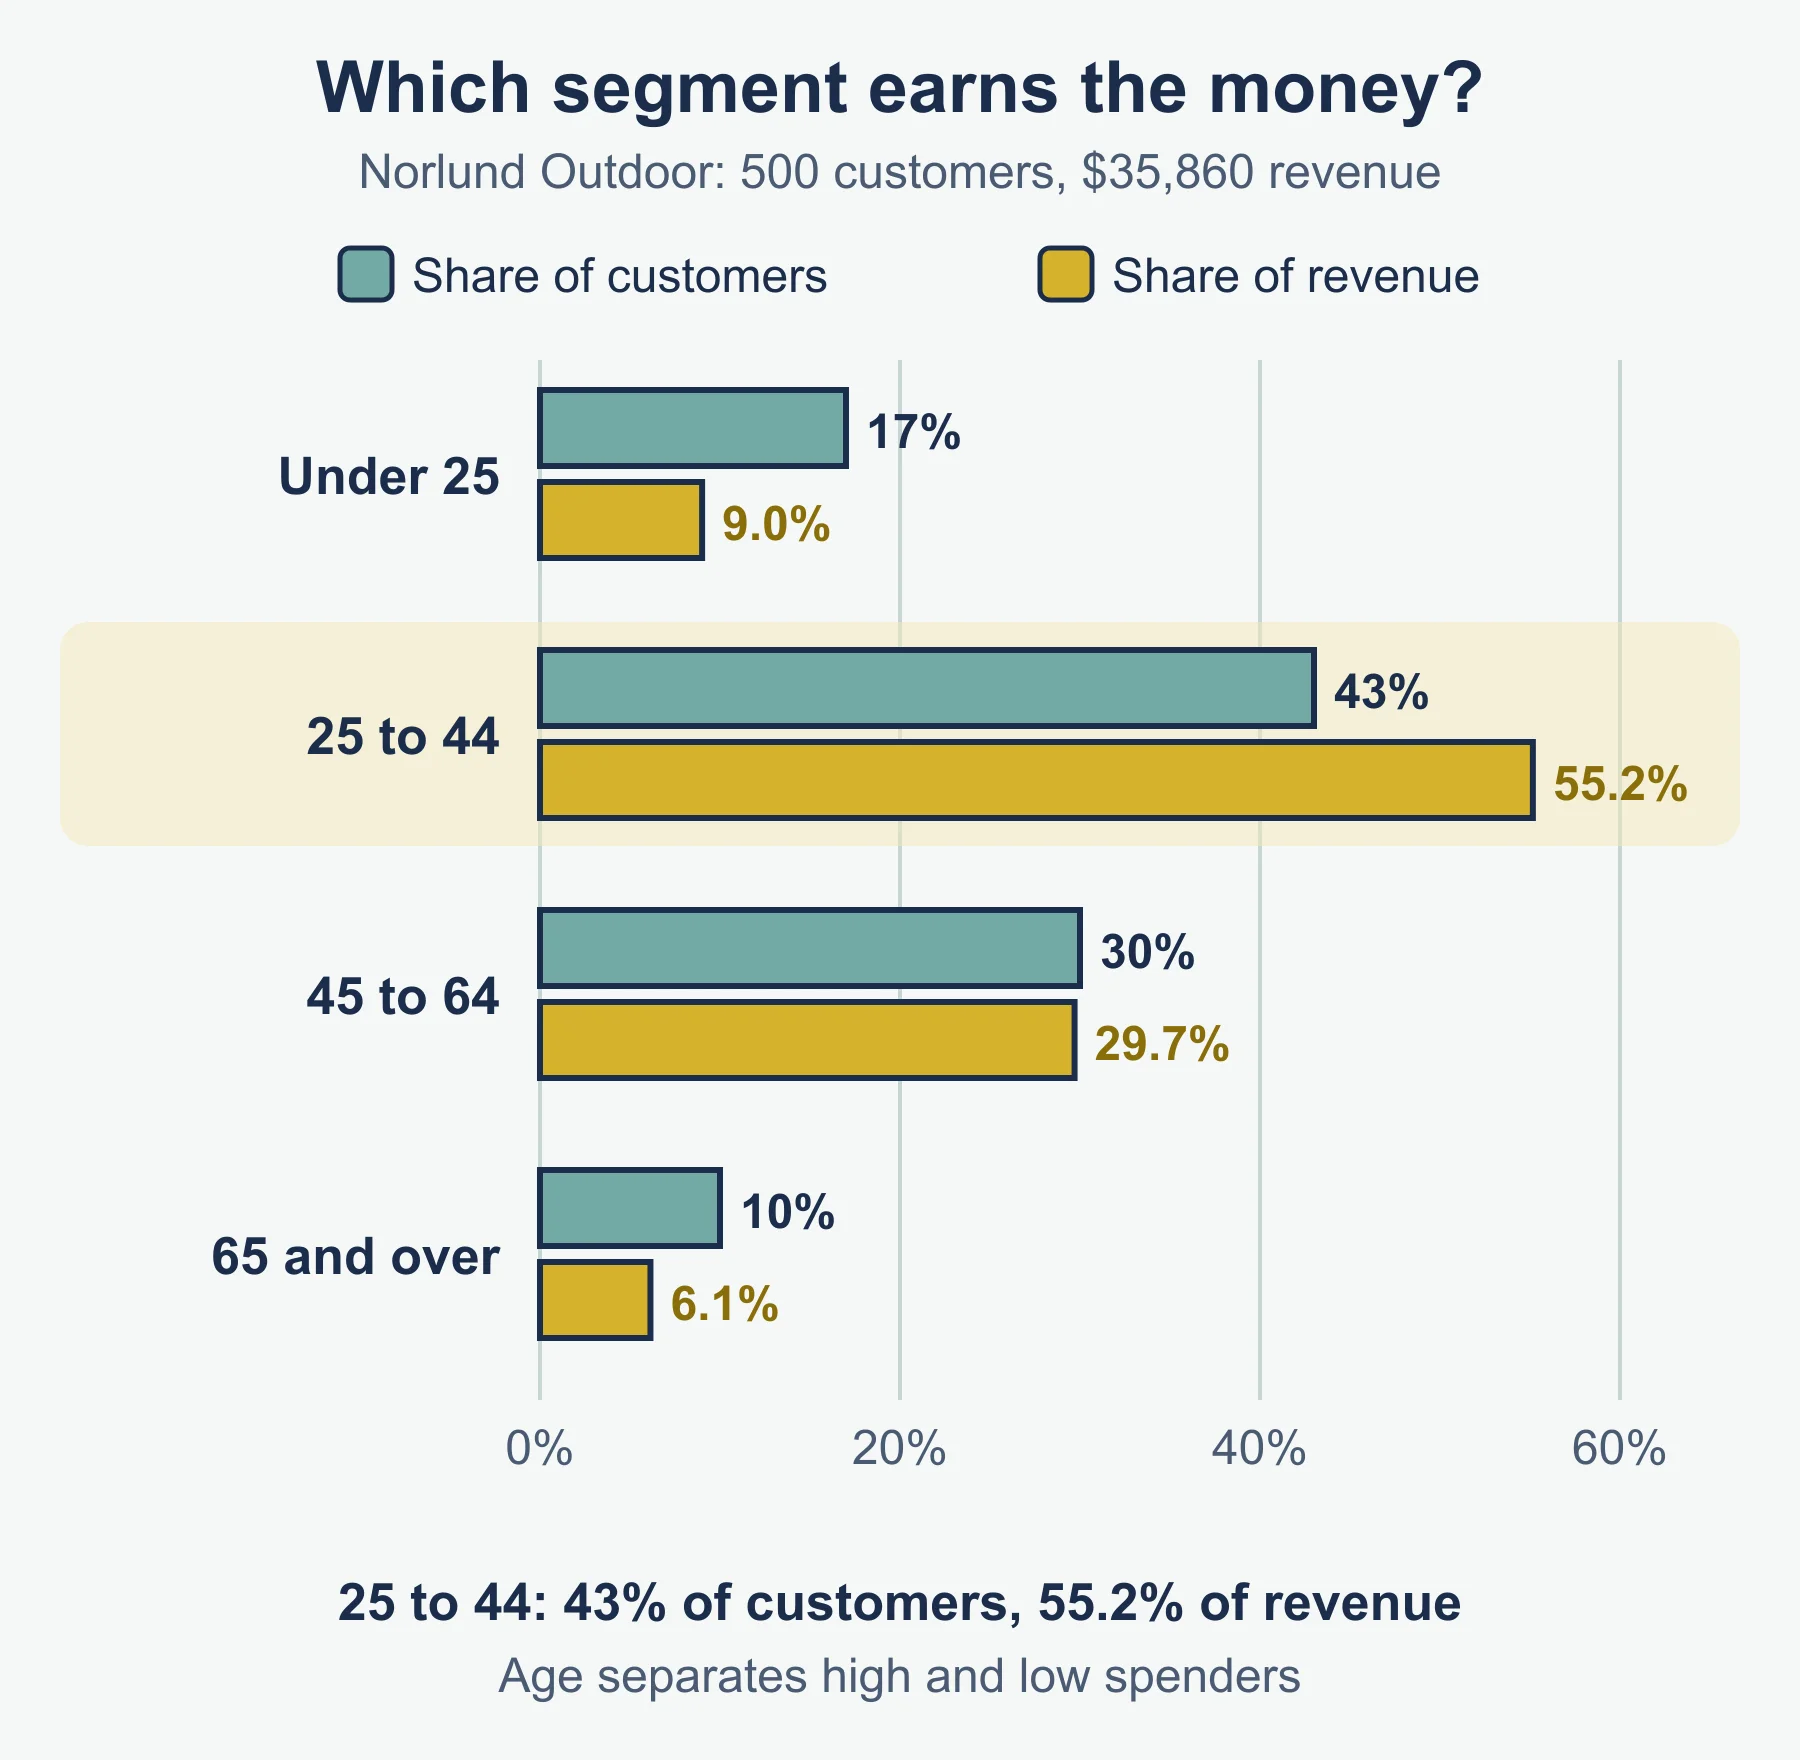
Worked example. Norlund Outdoor has 500 customers, 64% of whom live in the city. Mean spend per customer in a year is:
| Age | Customers | Mean spend ($) |
|---|---|---|
| Under 25 | 85 | 38 |
| 25 to 44 | 215 | 92 |
| 45 to 64 | 150 | 71 |
| 65 and over | 50 | 44 |
Revenue is customers × mean spend: 3,230 + 19,780 + 10,650 + 2,200 = 35,860. The 25 to 44 group is 43% of customers but 55.2% of revenue (19,780 ÷ 35,860). Age is therefore a sensible basis: spending differs sharply between groups, so products and promotion can target 25 to 44 year olds. Location is less useful here, because 64% of customers live in the city and nothing in the data shows that city and rural buyers behave differently. Say what extra data would change your mind.
3.2.1 Market research
Uses. A market-orientated business designs its products around what research says customers want. Research information helps it to:
- identify customer needs and changing tastes
- estimate likely demand and the size of the market
- decide features, prices and promotion
- learn about rivals’ products and prices
- reduce the risk of launching a product that fails.
Primary and secondary research
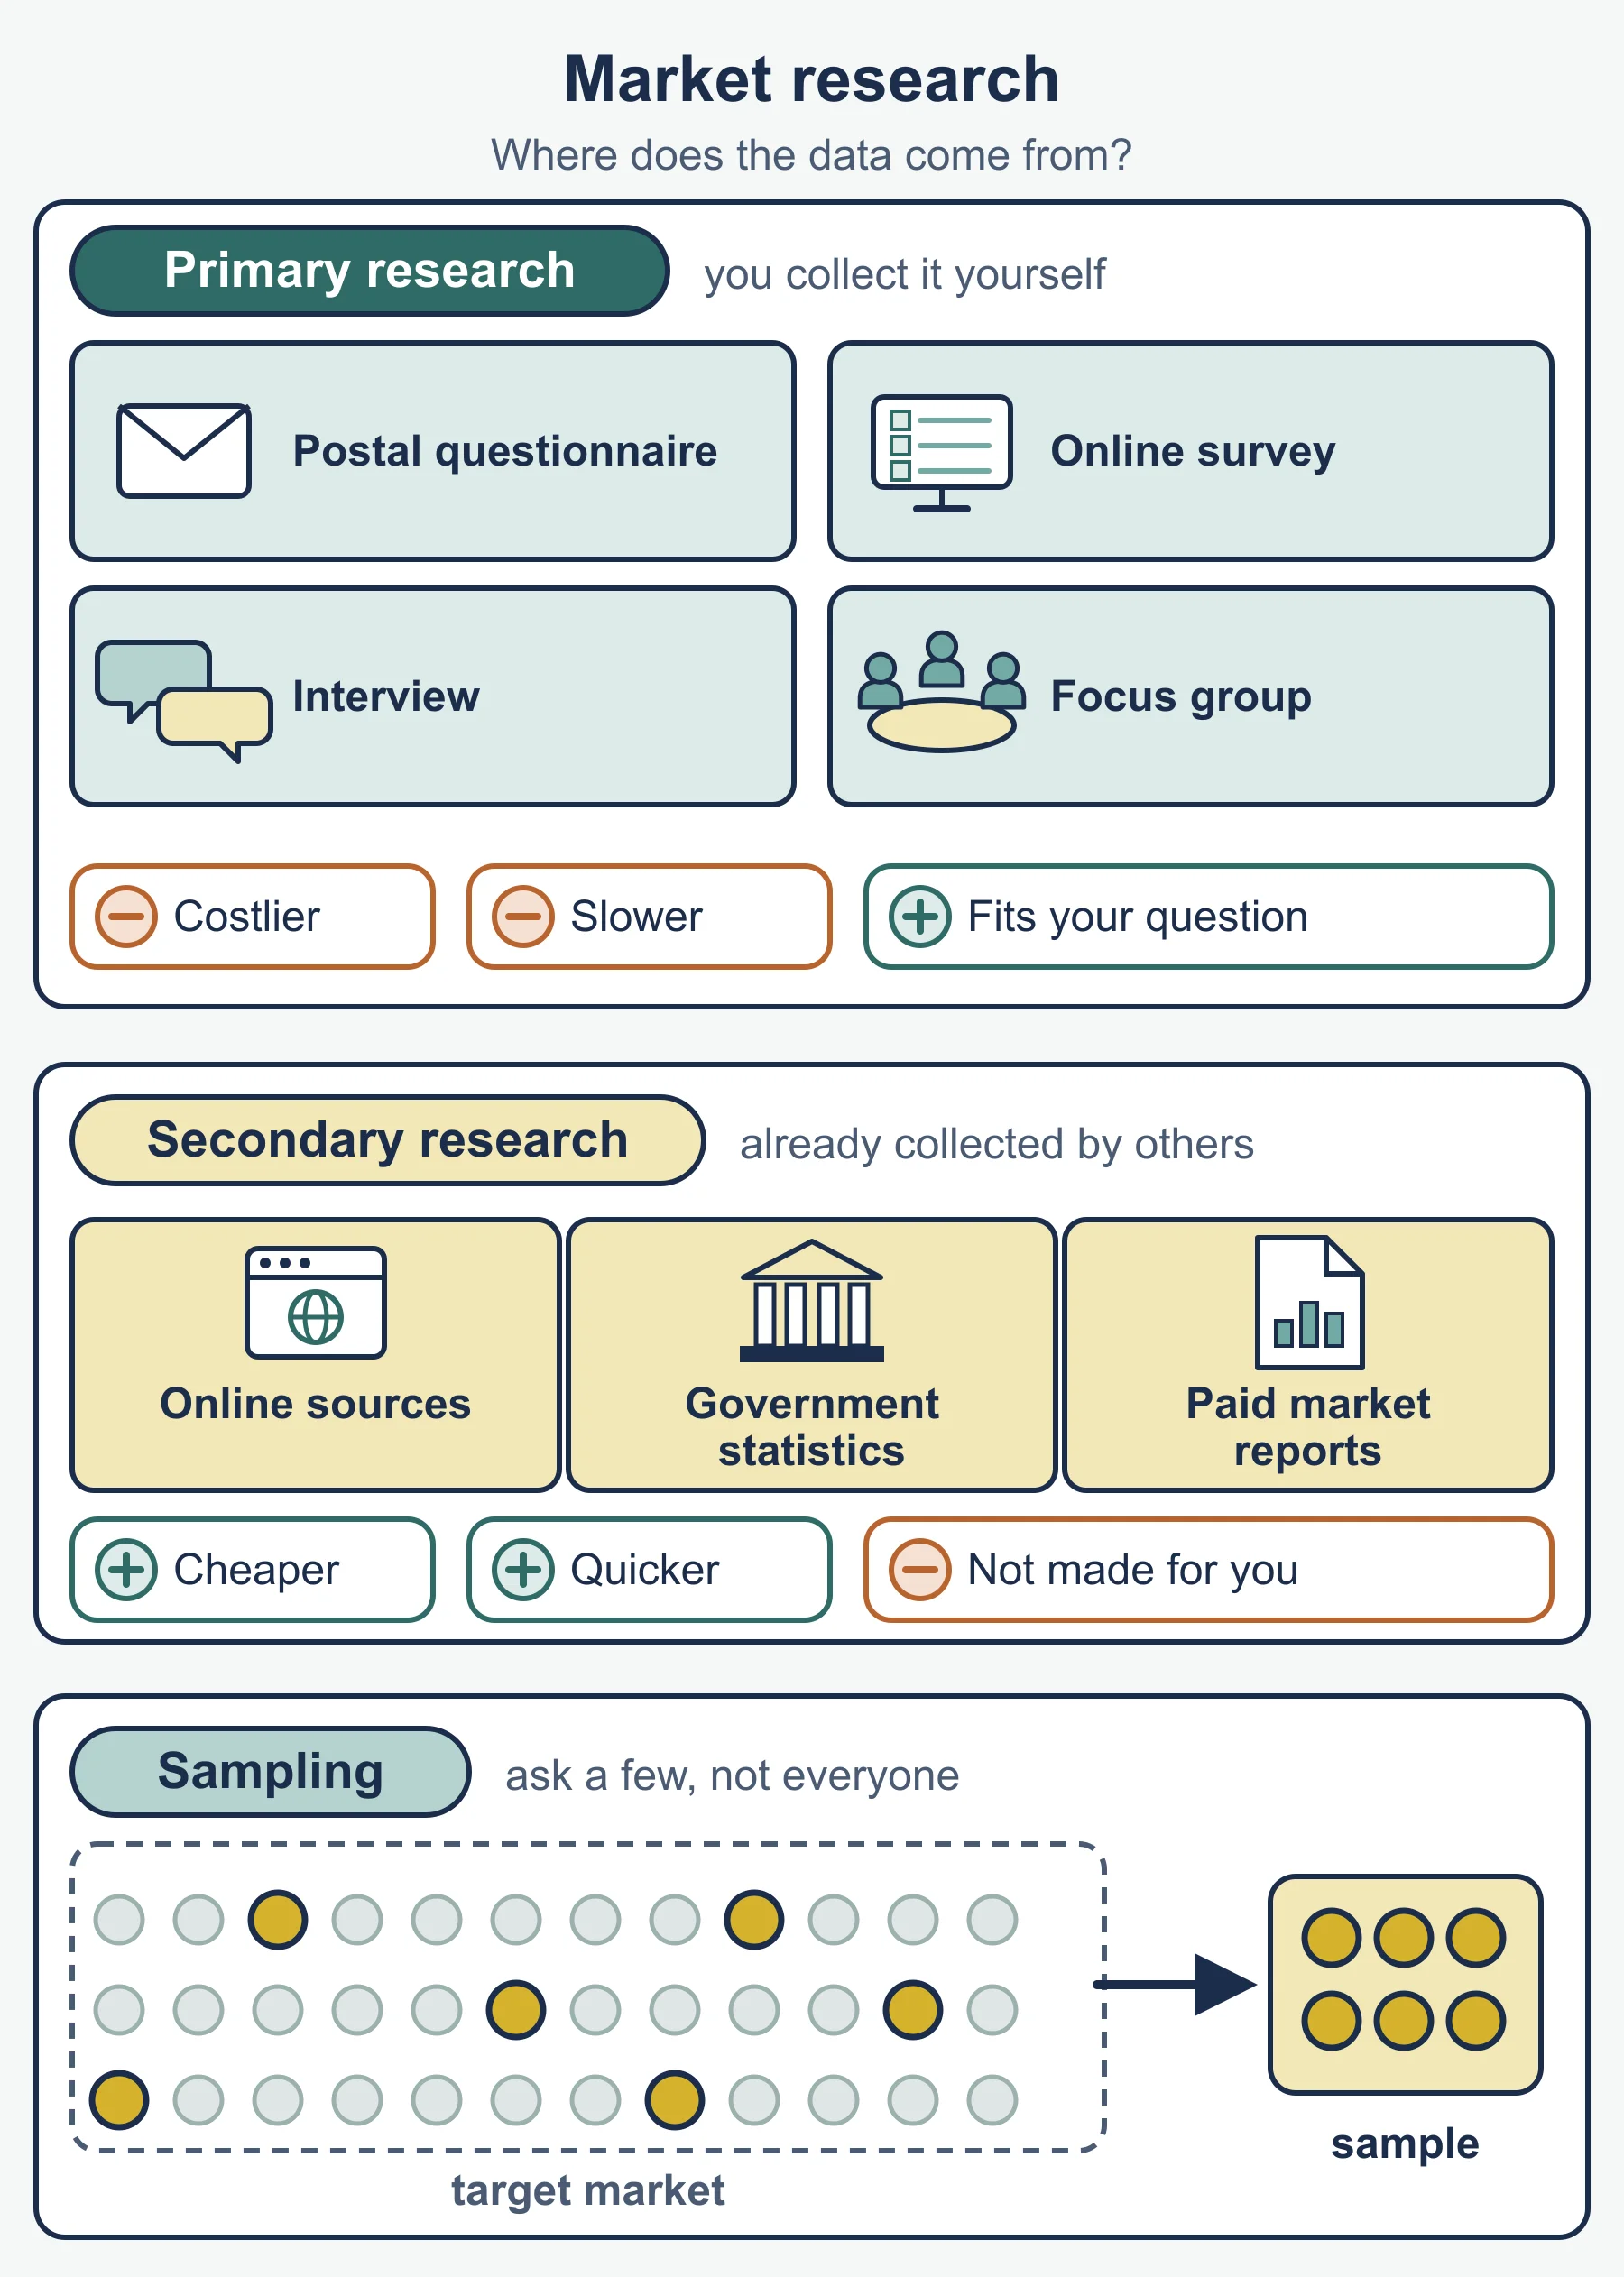
Primary research is new data collected first-hand for the business’s own purpose. Secondary research uses data that already exists, collected by someone else.
| Benefits | Limitations | |
|---|---|---|
| Primary | Specific to the question; up to date; owned by the business, so rivals cannot see it | Can be slow and costly; needs skill to design; may be biased by who answers |
| Secondary | Usually cheaper and quicker; large amounts available | May be out of date; may not fit the business’s needs; others have the same information |
Methods of primary research (the syllabus examples):
- Postal questionnaire: reaches people in many places, but replies are slow and often few.
- Online survey: fast and cheap to run and analyse, but only reaches people who go online and respond.
- Interviews: allow deeper answers and follow-up questions, but take time and the interviewer may influence answers.
- Focus groups: a small group discusses a product and gives opinions, which reveal attitudes, but a few strong voices can dominate and the group is small.
Methods of secondary research: searching online (websites, rivals’ pages, news), government sources (for example population and income statistics) and paying for commercial market research reports, which are detailed but can be expensive.
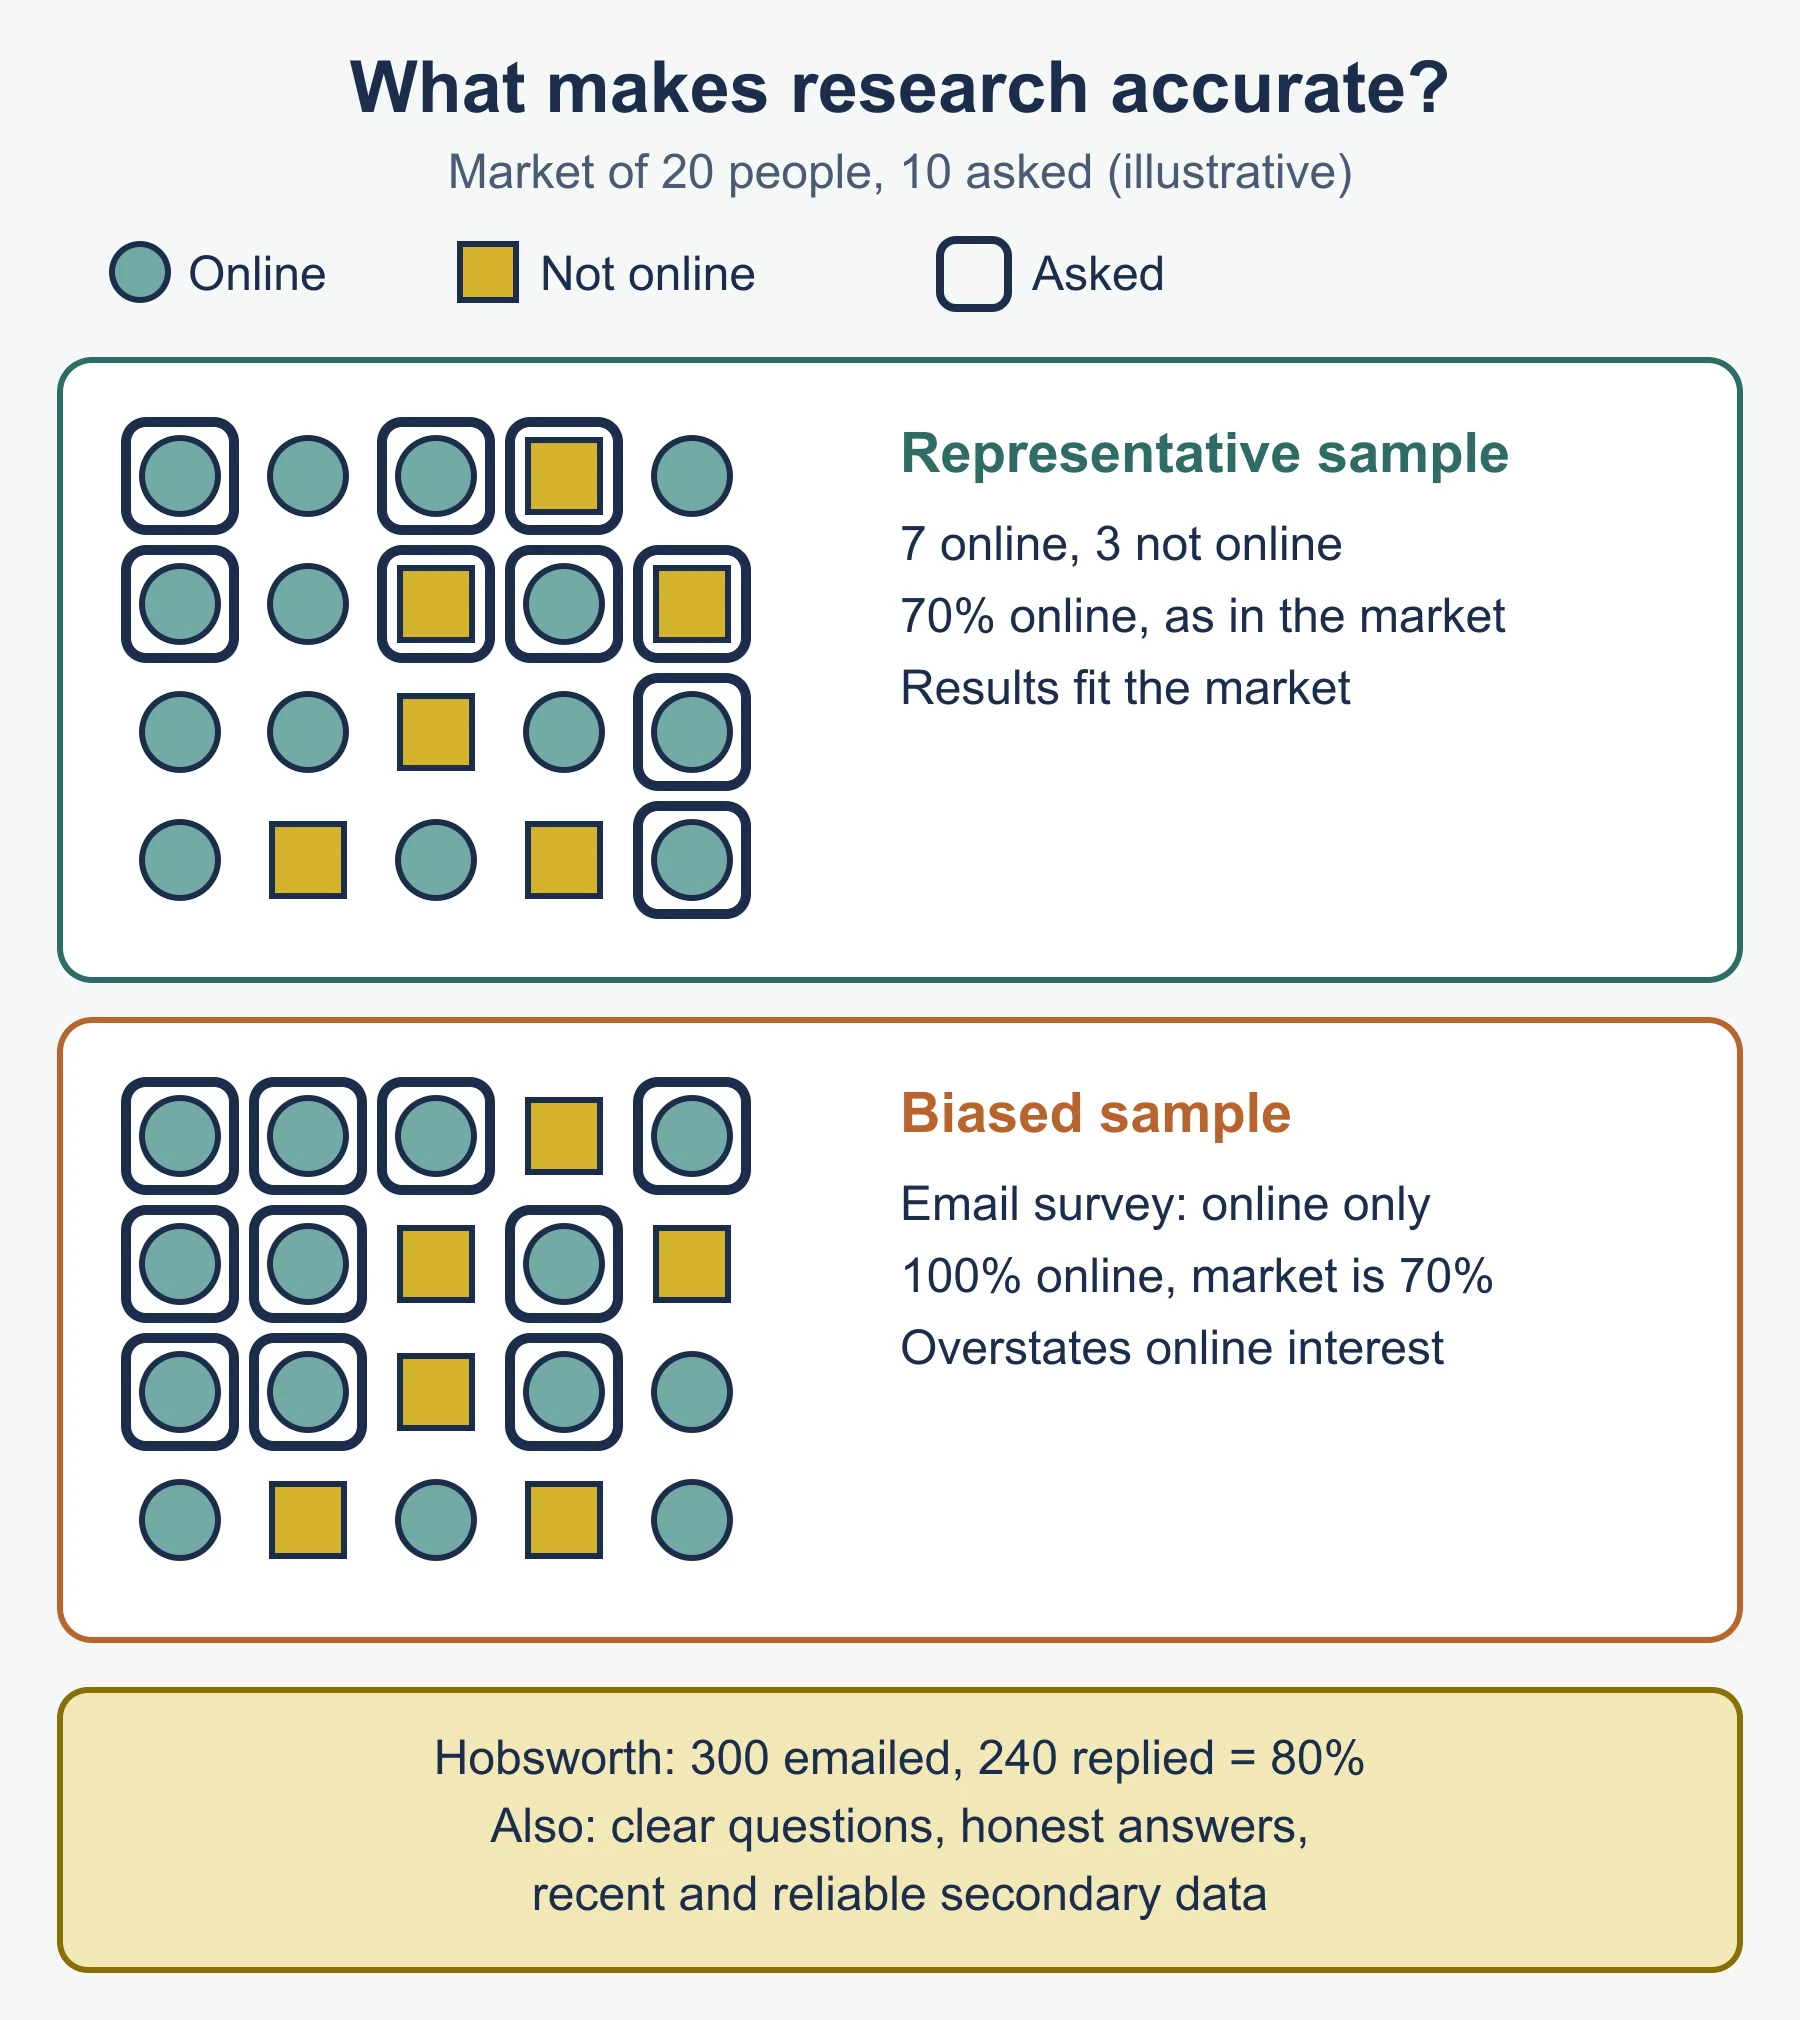
The need for sampling. Asking every customer is usually too slow and costly, so a business questions a sample, a smaller group chosen to represent the whole market. The bigger and more representative the sample, the more reliable the results.
Factors influencing accuracy. Data is more accurate when:
- the sample is large enough and representative of the target market
- questions are clear and not leading
- the researcher and respondents are honest and unbiased
- secondary data is recent and from a reliable source
- people respond truthfully and enough of them respond.
Worked example. Hobsworth Stationers wants to know whether to open a school-supplies website. It emails an online survey to 300 customers drawn from its whole loyalty list, not only those in one shop, and 240 reply. The sample is a reasonable size and covers different customers. However, customers who never use email are missed, so the results may overstate interest in online buying. A good answer states the strength, the weakness and what to do (for example, add some short interviews in store).
3.2.2 Presentation and use of results
Market research results are shown in tables, bar charts, pie charts, line graphs and diagrams. To analyse them:
- read the title, labels, units and scale
- find the largest, smallest and any change over time
- calculate percentages or differences if useful
- state a conclusion that answers the business’s question
- note limits, such as sample size or date.
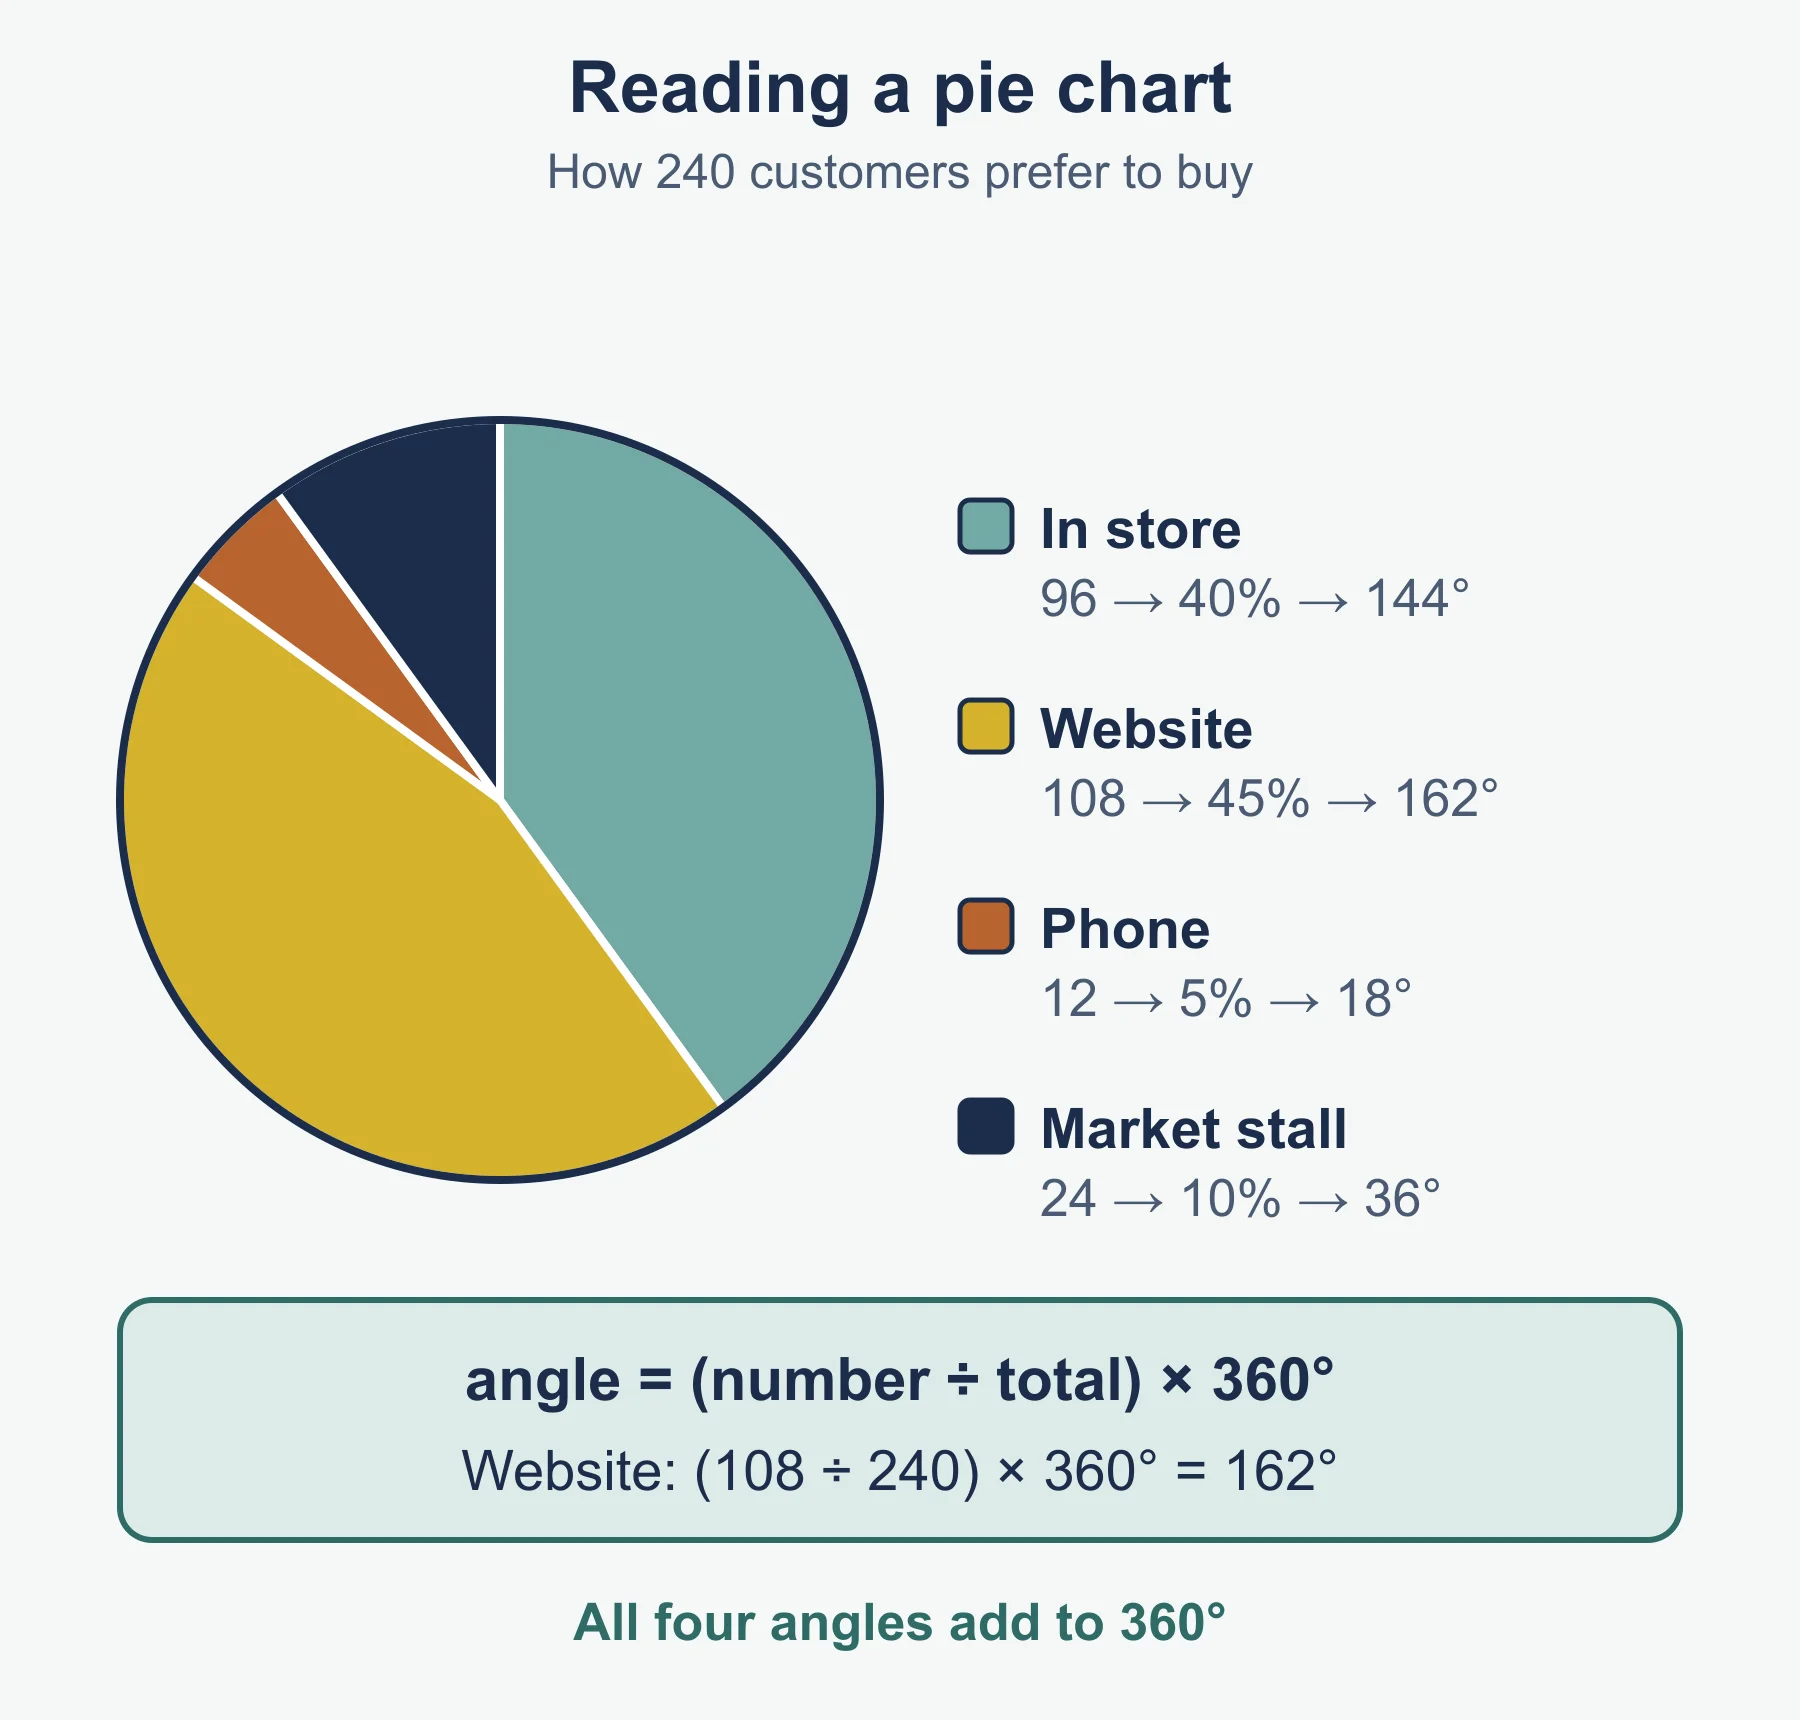
For a pie chart, angle = (number ÷ total) × 360 degrees. This is the standard form.
Worked example. Hobsworth asked its 240 respondents how they prefer to buy:
| Method | Respondents | Share | Pie angle |
|---|---|---|---|
| In store | 96 | 40% | 144° |
| Website | 108 | 45% | 162° |
| Phone | 12 | 5% | 18° |
| Market stall | 24 | 10% | 36° |
The angles add to 360°. The website is the most popular single method (45%), but 55% still prefer another method, so closing the shops would be unwise. A simple conclusion is that a website would suit nearly half the sample, while shops still matter.
Common errors
- Writing “customers like it” without linking to the business in the question.
- Treating loyalty and relationships as identical; use both ideas separately.
- Saying niche marketing is always better because competition is lower; a small market limits sales.
- Segmenting by a characteristic that the data does not link to buying behaviour.
- Calling secondary research cheap without noting that it may not match the business’s needs.
- Forgetting that a large sample can still be biased if the wrong people are asked.
- Stating a percentage with no unit, or reading a chart without checking its scale.
Frequently asked questions
What is the difference between primary and secondary research? Primary research is new data collected first-hand for the business’s own purpose, such as questionnaires, interviews and focus groups. Secondary research uses data that already exists, collected by someone else, such as government statistics.
Why do businesses use samples in market research? Asking every customer is usually too slow and costly, so a business questions a sample chosen to represent the whole market. The bigger and more representative the sample, the more reliable the results.
How do you calculate a pie chart angle from survey results? Angle = (number ÷ total) × 360 degrees, which is the standard form. Check that the angles add up to 360°.
Is niche marketing always better because there is less competition? No. A niche faces fewer rivals, but its small market limits sales, so judge it against the business and its market.
What is a market-orientated business? A market-orientated business designs its products around what market research says customers want, using research to identify needs, estimate demand and reduce the risk of a product failing.
Official syllabus
Cambridge O Level Business Studies (7115) syllabus for examination in 2026, published by Cambridge University Press & Assessment (Cambridge International Education), Subject content, sections 3.1.1 to 3.1.4 and 3.2.1 to 3.2.2.
Get free revision emails (optional)
Occasional emails with practice questions, worked explanations and links to free resources for the qualification and subjects you choose. No spam, and you can unsubscribe from any email. The free tools on this site never need an email.
Related resources
-
Practice questions
O Level Business: Marketing, competition and the customer and Market research (Cambridge 7115) – Practice Questions
Twelve original questions with worked answers on customers, niche and mass marketing, segmentation and market research for Cambridge O Level Business 7115.
Business · Cambridge · O Level
Try questions -
Revision notes
O Level Business: Marketing, competition and the customer and Market research (Cambridge 7115) – Revision Notes
Condensed revision notes on customer needs, market changes, niche and mass marketing, segmentation and research for Cambridge O Level Business 7115.
Business · Cambridge · O Level
Revise topic -
Study guides
O Level Business: Marketing mix (Cambridge 7115)
Study guide to the marketing mix for Cambridge O Level Business 7115: product, price, place, promotion and technology, with worked examples.
Business · Cambridge · O Level
Read guide
Related articles
-
teaching
A Level tuition in Dubai: Cambridge or Pearson Edexcel International A Level?
Schools in Dubai and Abu Dhabi teach either Cambridge International AS & A Level or Pearson Edexcel International A Level. How the two are structured, why it matters for tuition, and how online classes from Lahore work.
9 October 2026
-
curriculum guides
Choosing subjects at IGCSE and A Level
How subject choices at 14 and 16 affect university options later, and how to keep pathways open without overloading a timetable.
28 July 2026
Studying this with a teacher
Working through Business O LEVELS?
This page is free and stays free. If you would rather be taught it, Marlbridge runs Business classes one-to-one and in small groups of up to 15, online in your own time zone. The first trial class is free. WhatsApp replies within an hour (8am–11pm Pakistan time, every day); email the same day.
Cambridge Business teachers at Marlbridge

