
Study Guides
OCR A Level Biology A: Enzymes (H420)
OCR A Level Biology A (H420) 2.1.4 study guide: enzyme mechanism, induced fit, pH and temperature, the temperature coefficient, cofactors, inhibitors and PAG4.
- Subject
- Biology
- Level
- A LEVELS
- Topic
- Enzymes
- Author
- Marlbridge Academic Team
- Updated
- Reviewed by
- Hina Mogul (what this means)
Aligned to OCR A Level Biology (H420), Version 4.1 (April 2026), for first assessment in 2025. Official specification .
Syllabus page (what it covers and how it is assessed): OCR A Level Biology.
Syllabus points this page covers
H420
- 2.1.4 Enzymes
Found an error? Report a correction.
Need help with this topic? Request a free trial class for A Level Biology (H420).
Enzymes are globular proteins that act as biological catalysts: they speed up metabolic reactions by lowering the activation energy, without being used up. For OCR A Level Biology A (H420) section 2.1.4 you must explain how enzymes work (lock and key and induced fit), how pH, temperature, enzyme concentration and substrate concentration change their activity, calculate the temperature coefficient, and explain the roles of cofactors, coenzymes and inhibitors, including the practical work in PAG4.
This guide covers learning outcomes 2.1.4(a) to (f) of the OCR A Level Biology A specification, Version 4.1 (April 2026), first assessment 2025. It sits in Module 2, Foundations in biology, which is assessed across all three A Level papers. Use the enzymes revision notes for quick recall and the enzymes practice questions to test yourself. Protein structure, which explains why enzymes are specific, is in the proteins, inorganic ions and biochemical tests study guide, and industrial uses are in the immobilised enzymes study guide. Course hub: OCR A Level Biology.
What 2.1.4 asks for
| Outcome | What you must be able to do |
|---|---|
| 2.1.4(a) | Explain the role of enzymes in catalysing reactions that affect metabolism at cell and whole-organism level, including that enzymes affect both structure and function |
| 2.1.4(b) | Explain intracellular and extracellular enzyme reactions, using catalase and amylase as examples |
| 2.1.4(c) | Explain the mechanism of enzyme action: tertiary structure, specificity, active site, lock and key, induced fit, enzyme-substrate and enzyme-product complexes, lowering of activation energy |
| 2.1.4(d)(i) | Explain the effects of pH, temperature, enzyme concentration and substrate concentration on activity, including the temperature coefficient |
| 2.1.4(d)(ii) | Carry out and analyse practical investigations of these factors (PAG4), including serial dilutions |
| 2.1.4(e) | Explain the need for cofactors and coenzymes, including chloride ions for amylase and vitamins as sources of coenzymes |
| 2.1.4(f) | Explain the effects of competitive and non-competitive, reversible and non-reversible inhibitors, and end-product inhibition |
Why do organisms need enzymes? (a) and (b)
Metabolism is the sum of all the reactions in an organism. At body temperature most of these reactions would be far too slow without catalysts. Enzymes control both structure (for example, enzymes build the polymers that make cell walls and collagen) and function (for example, enzymes in respiration release energy).
| Intracellular enzyme | Extracellular enzyme | |
|---|---|---|
| Where it acts | Inside the cell that made it | Outside the cell that made it |
| OCR example | Catalase, which breaks down toxic hydrogen peroxide into water and oxygen | Amylase, secreted in saliva and by the pancreas, which hydrolyses starch to maltose |
How do enzymes work? (c)
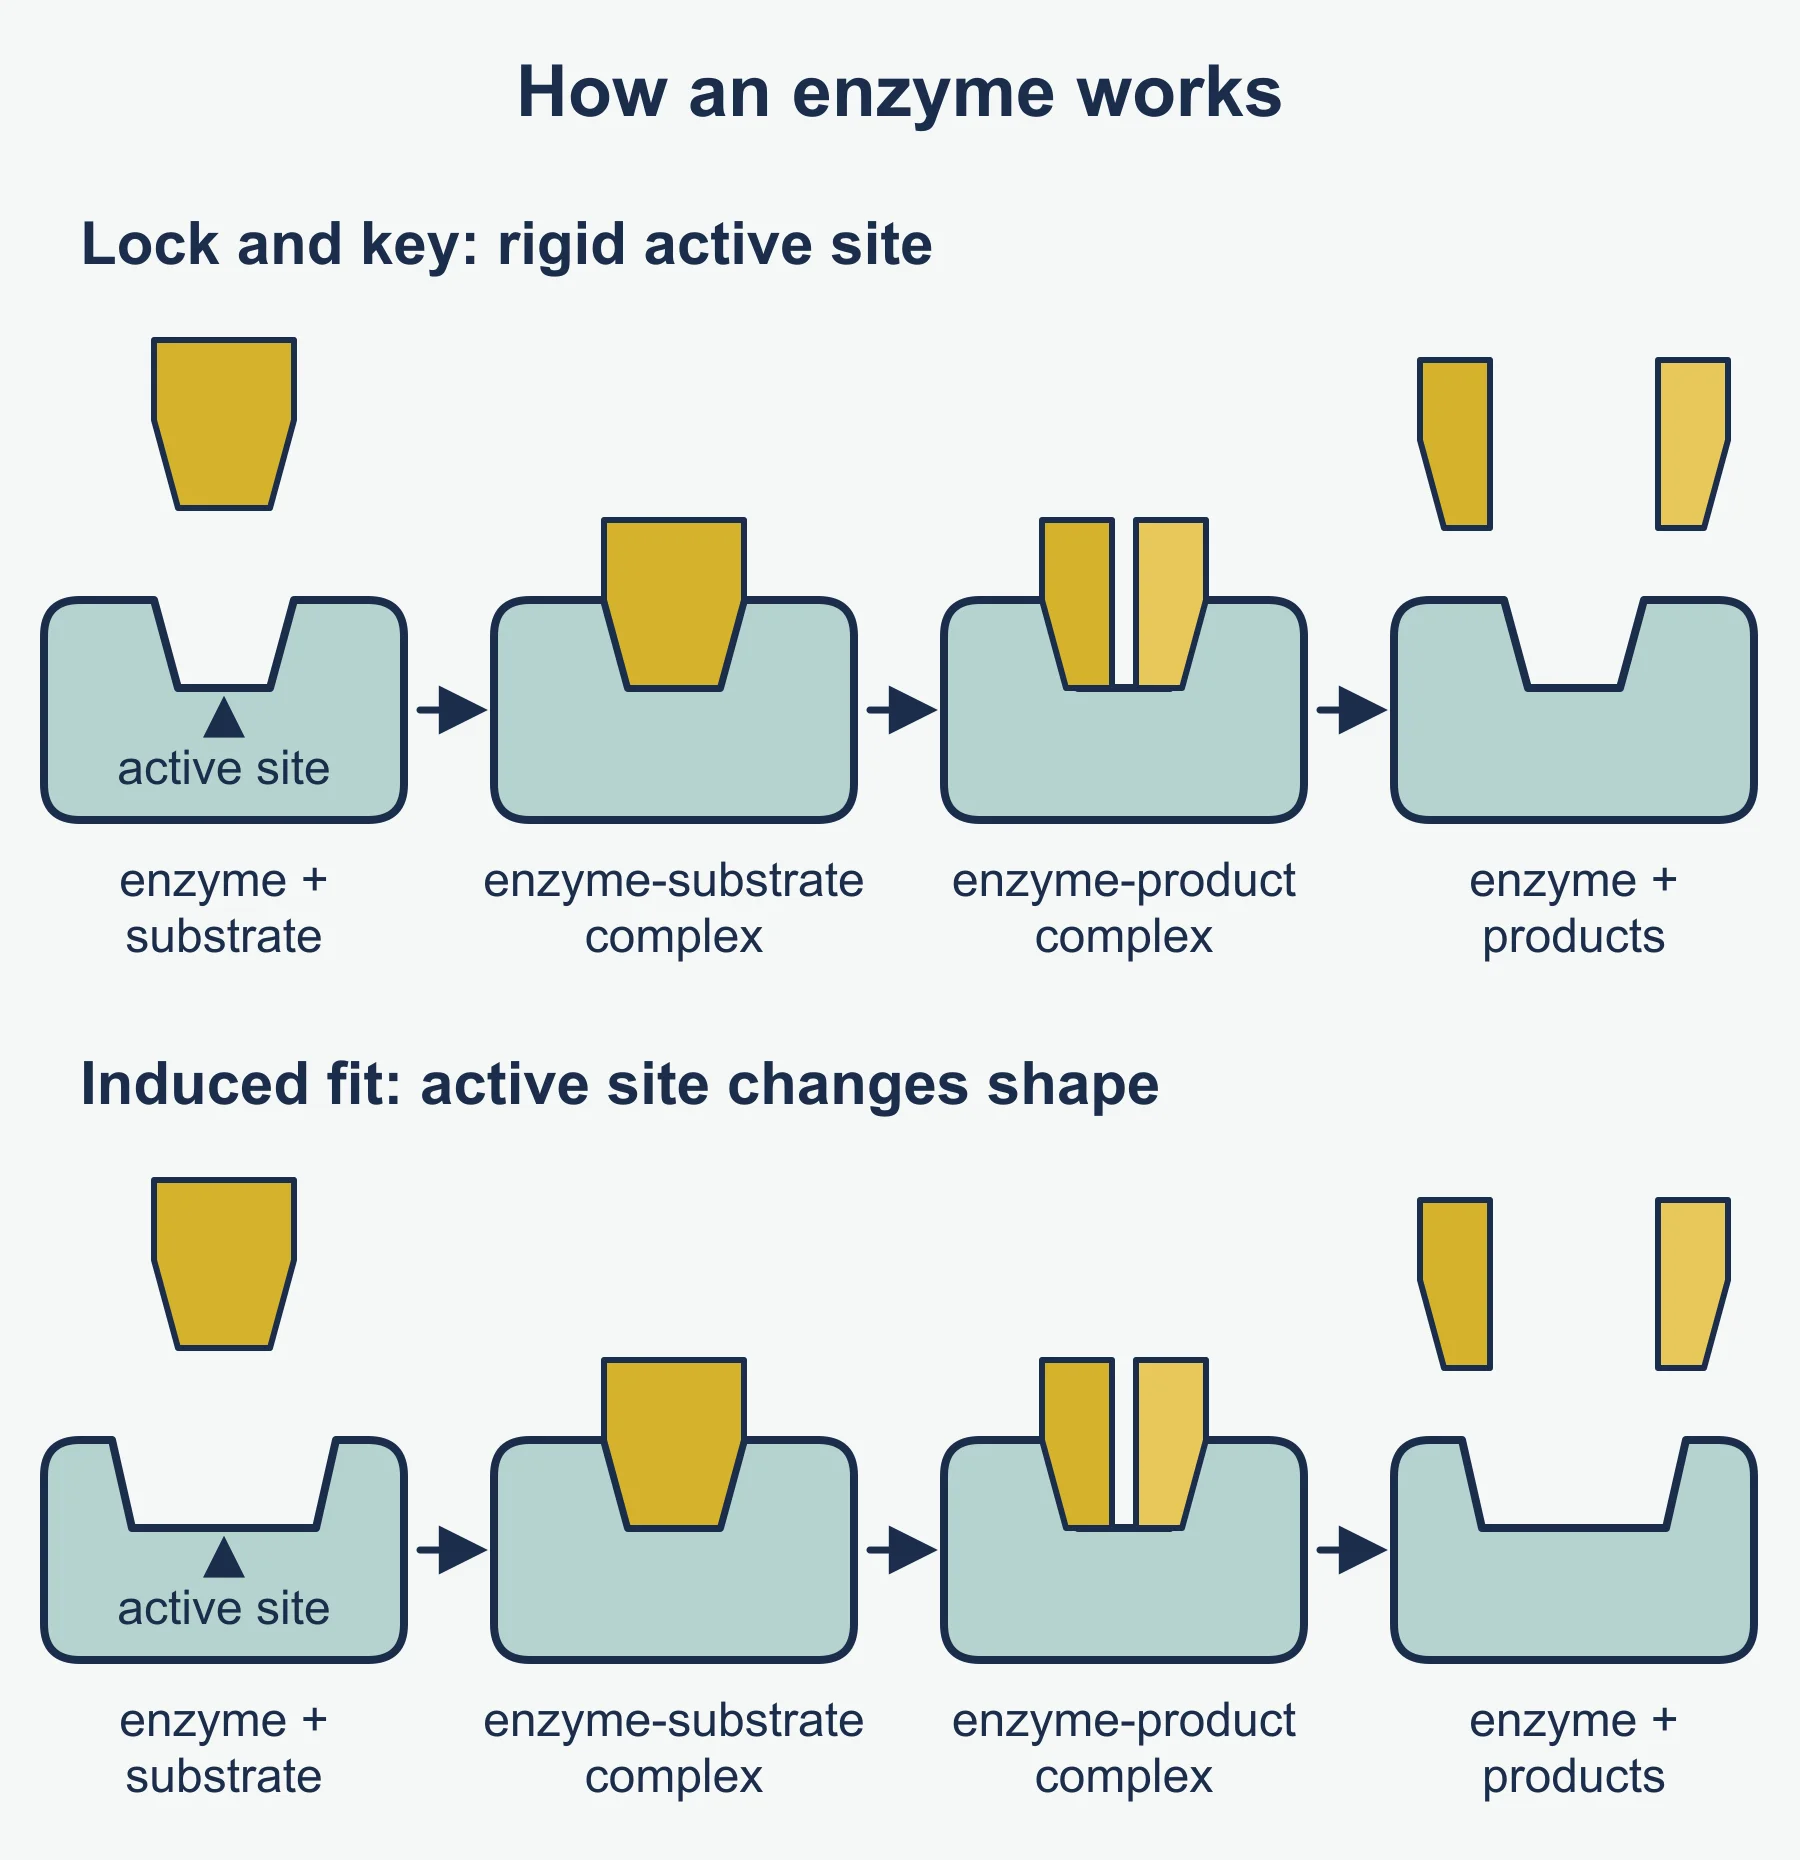
Each enzyme has a specific tertiary structure that forms an active site, a small region with a shape complementary to its substrate. This gives enzymes their specificity.
- Lock and key hypothesis. The substrate fits exactly into a rigid active site, like a key in a lock.
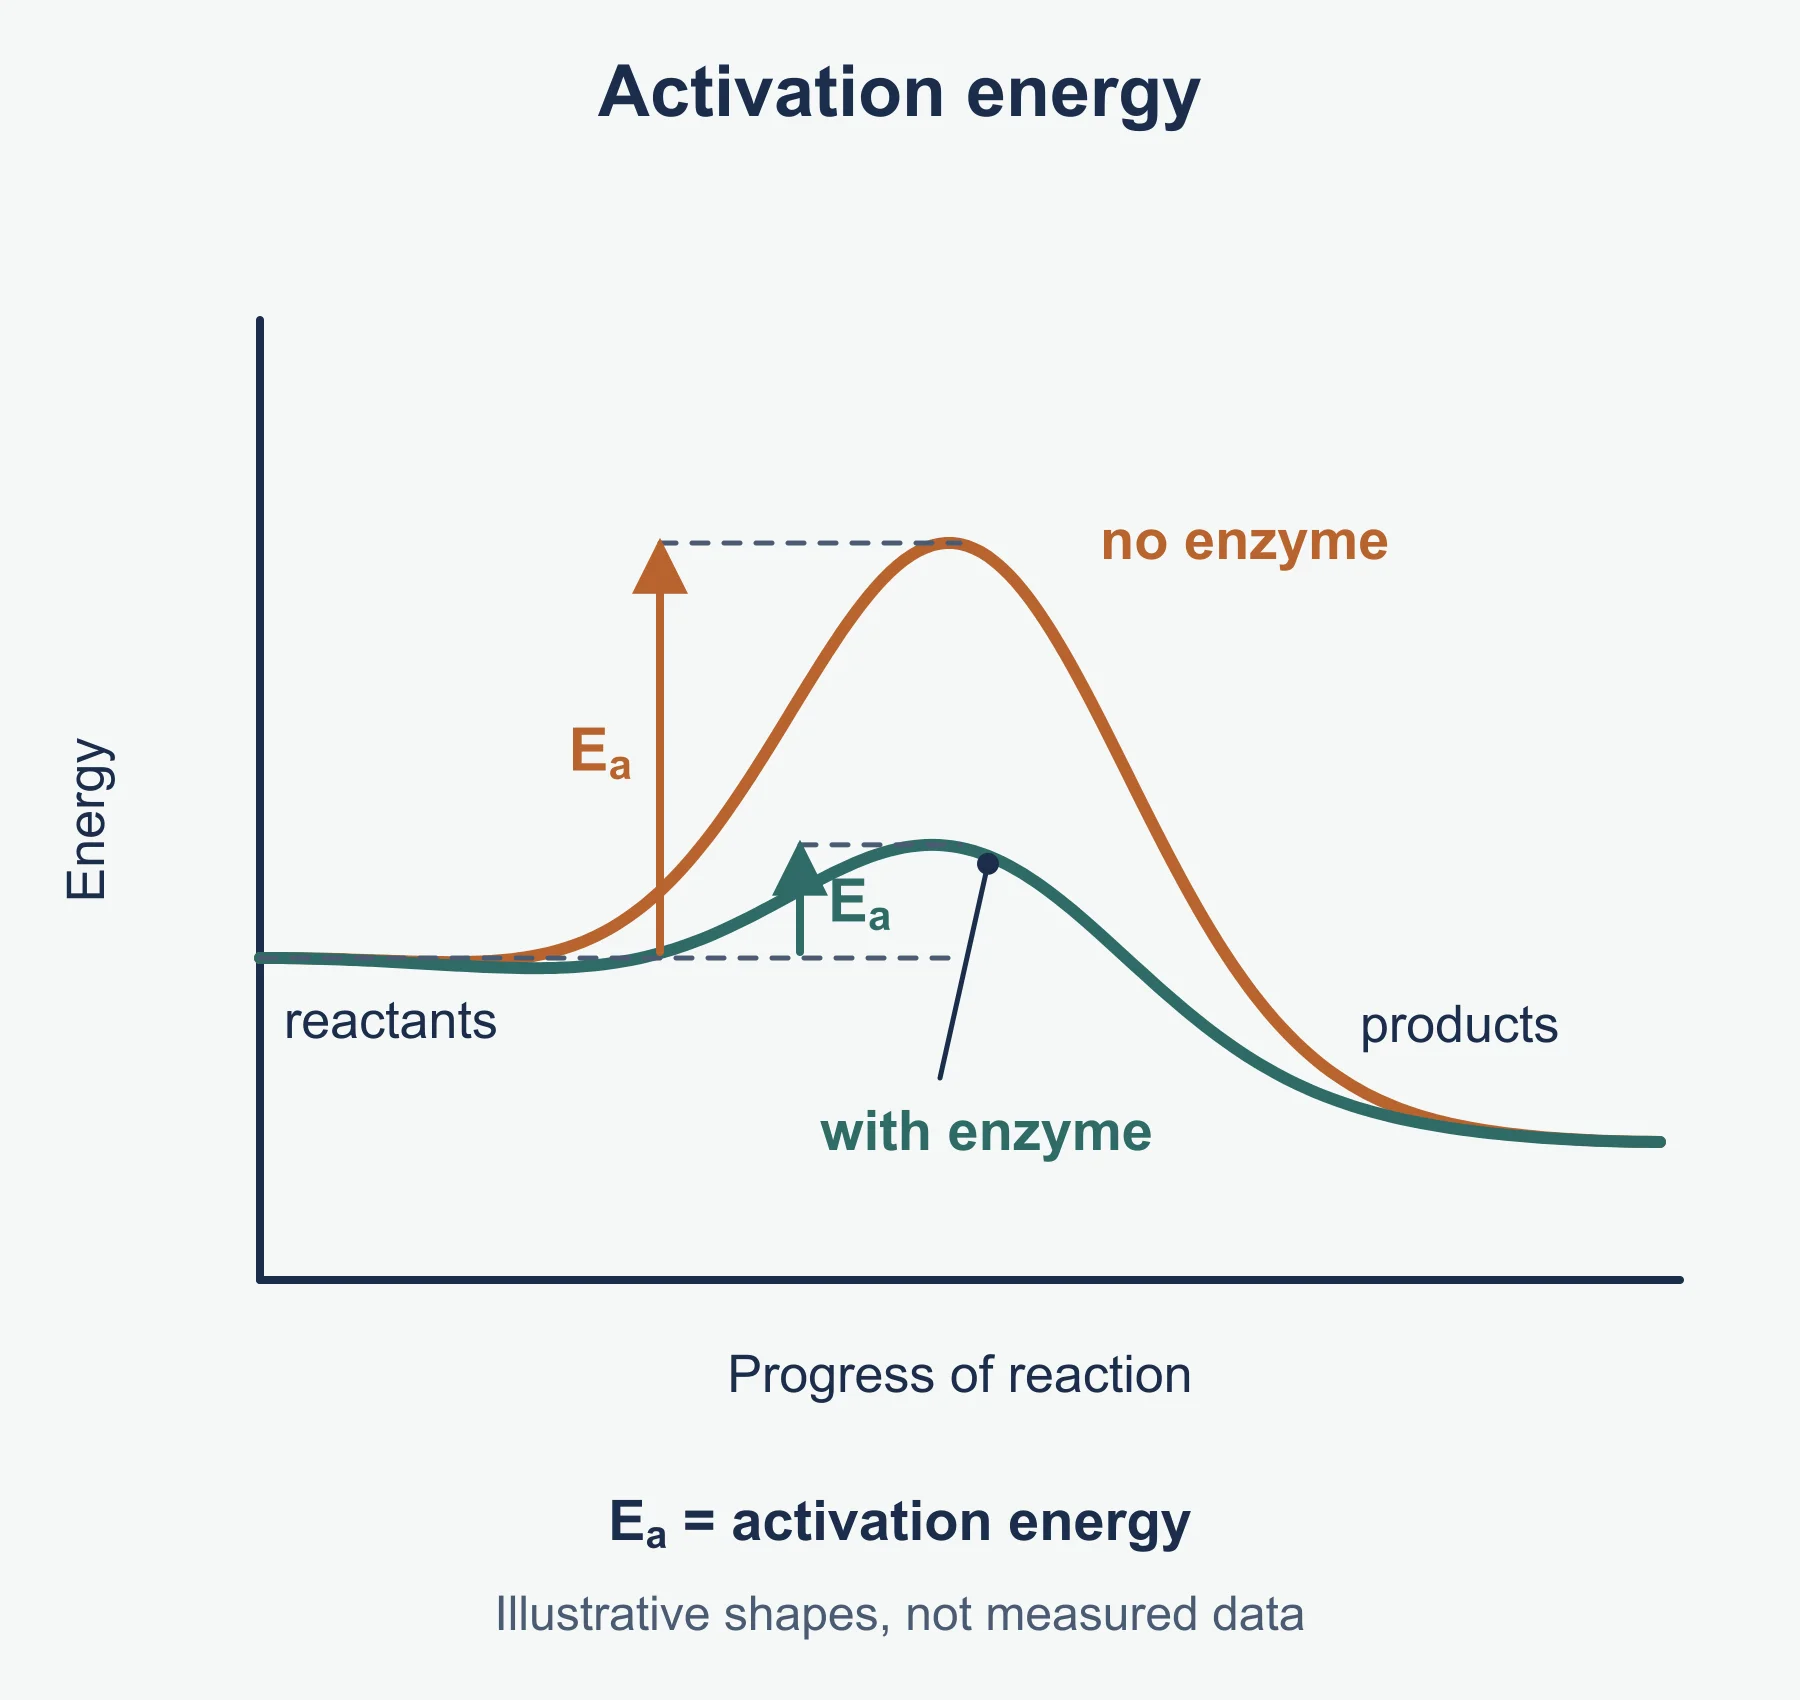
- Induced-fit hypothesis. The active site is not exactly complementary at first. As the substrate binds, the active site changes shape slightly to fit more closely. This puts strain on bonds in the substrate, lowering the activation energy. Induced fit is the currently accepted model because it explains why some enzymes can bind slightly different substrates and how bonds are strained.
The sequence is: enzyme + substrate, then enzyme-substrate complex, then enzyme-product complex, then enzyme
- product. The enzyme is unchanged and can be reused. Enzymes speed up reactions by providing a pathway with a lower activation energy.
How do temperature and pH affect enzymes? (d)(i)
Temperature
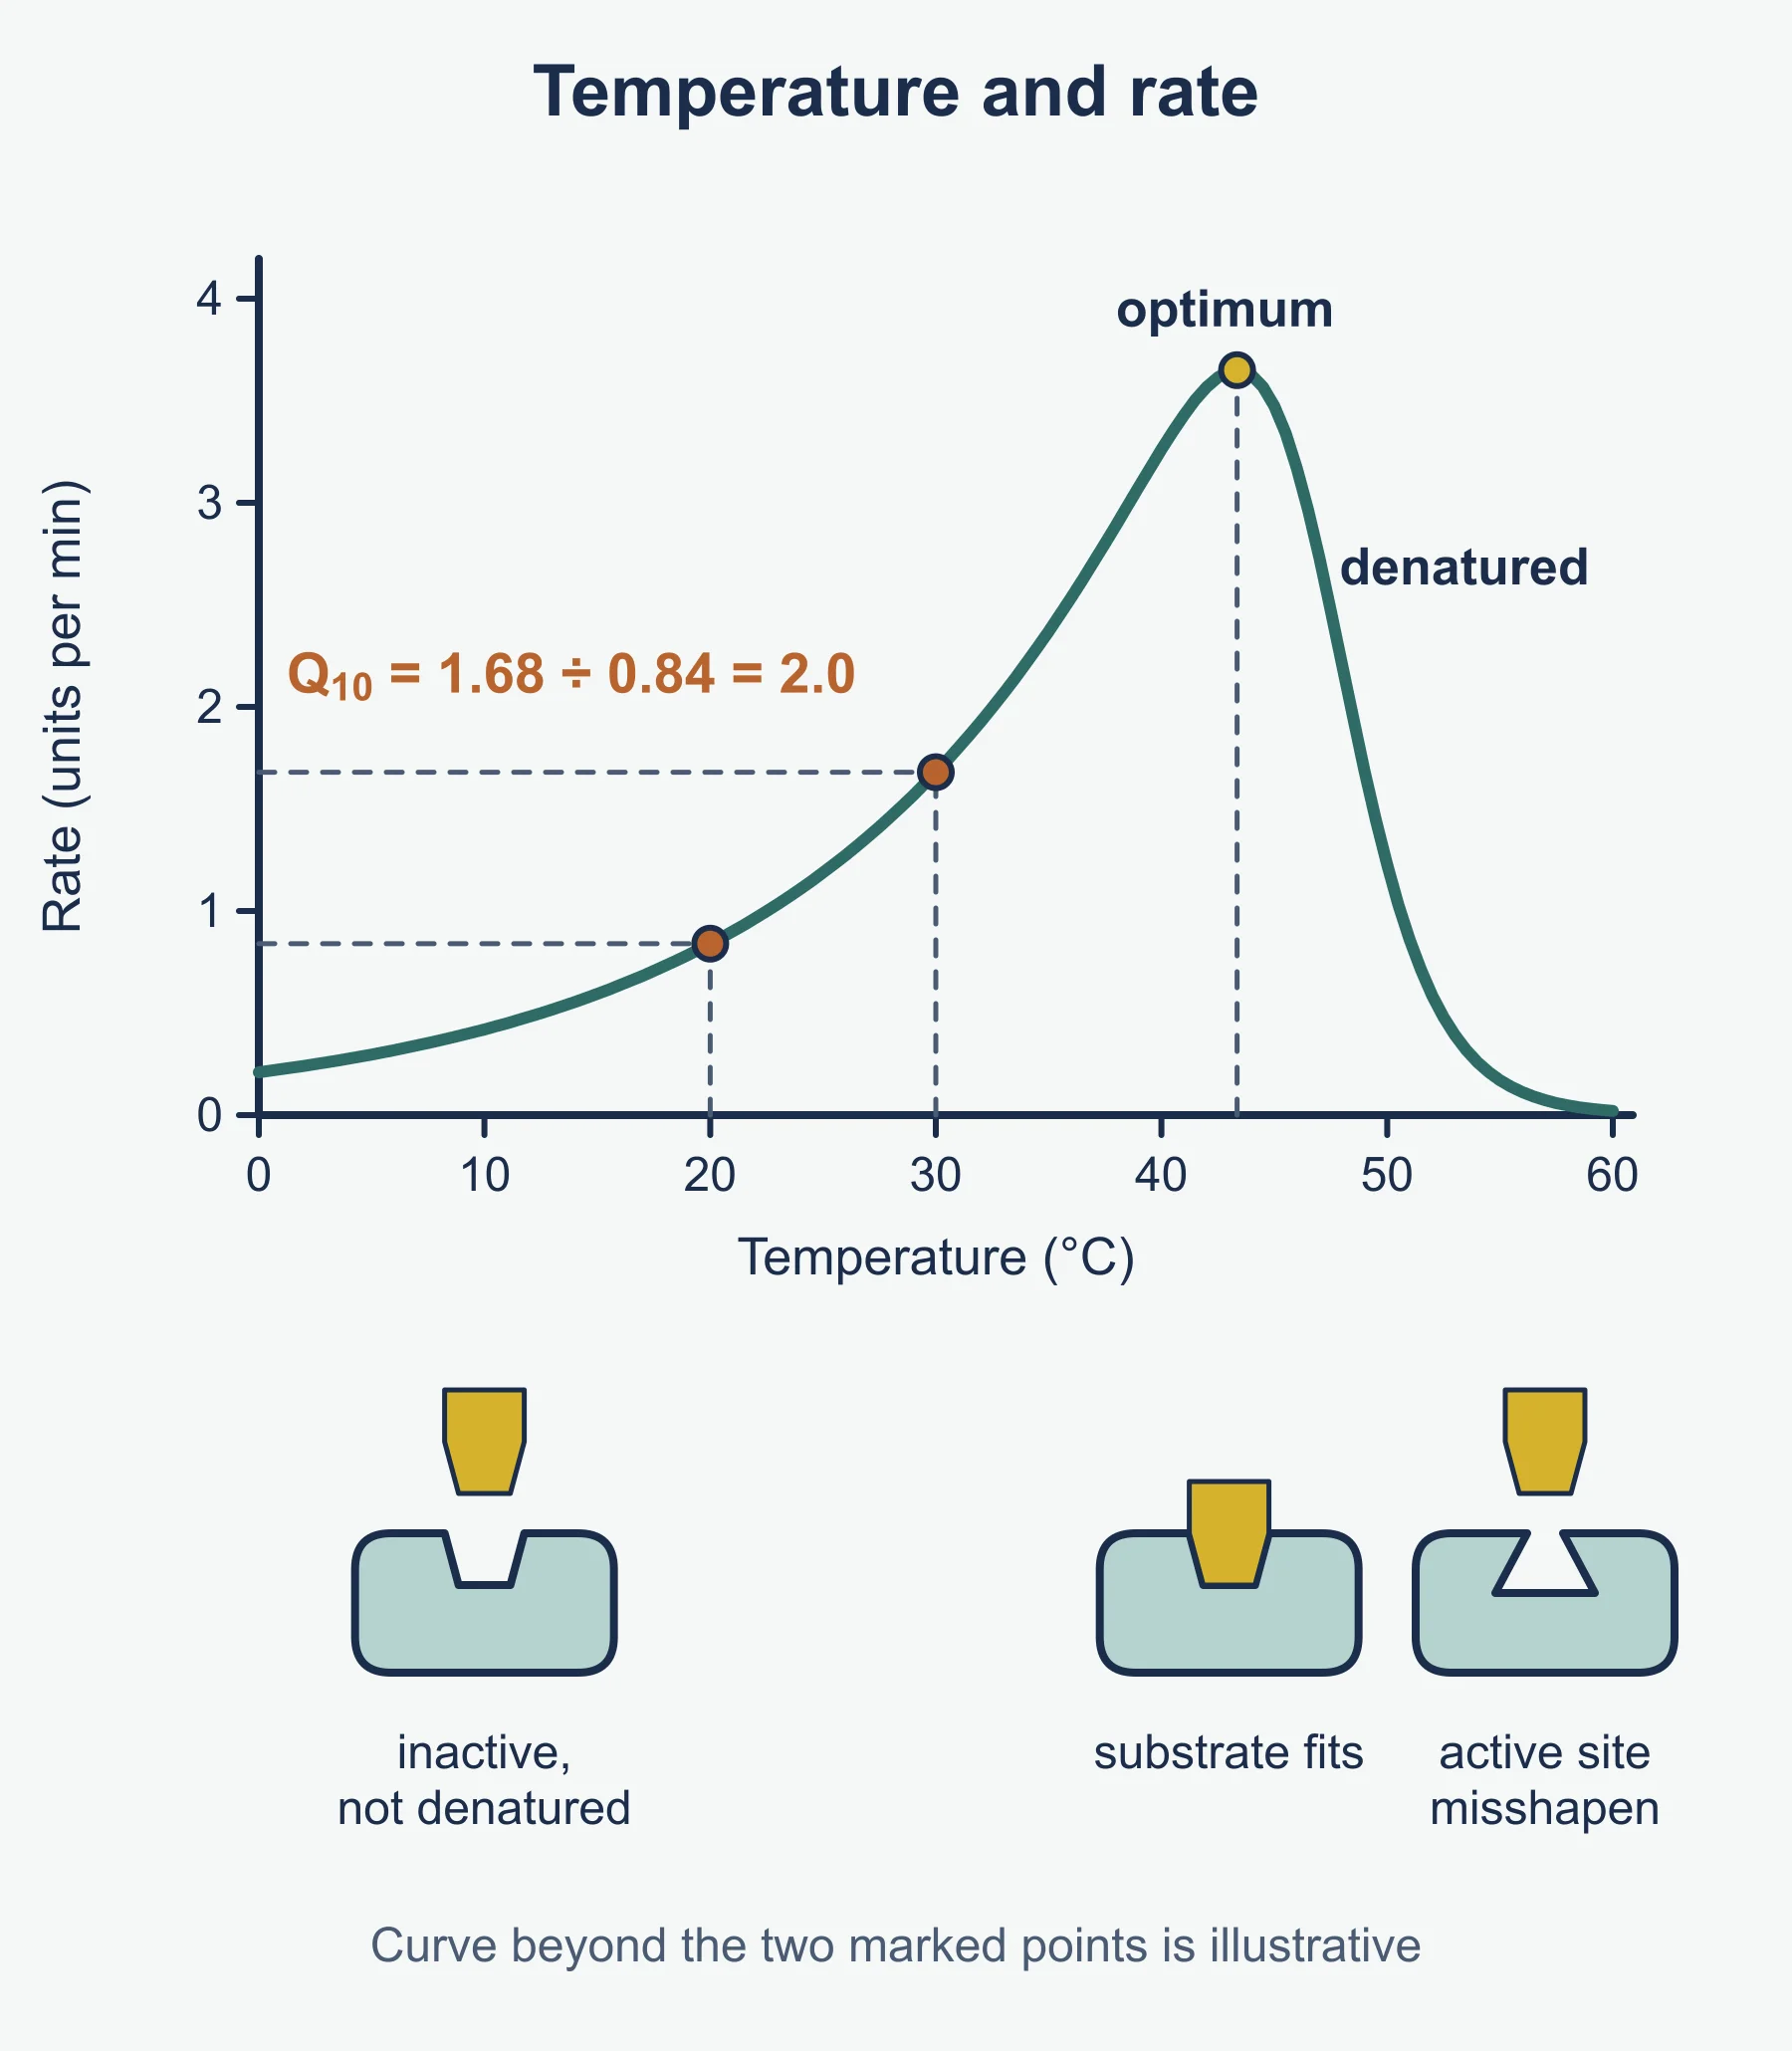
As temperature rises, enzyme and substrate molecules gain kinetic energy, so they collide more often and more enzyme-substrate complexes form per second: the rate increases. Above the optimum, vibrations break hydrogen bonds and ionic bonds that hold the tertiary structure, so the active site changes shape and the substrate no longer fits. The enzyme is denatured, and the rate falls steeply. At low temperatures enzymes are inactive but not denatured.
The temperature coefficient
The temperature coefficient (Q₁₀) compares the rate of a reaction at two temperatures 10 degrees Celsius apart:
Q₁₀ = R2 / R1
R2 = rate at (T + 10) degrees Celsius
R1 = rate at T degrees Celsius
Worked example 1. An enzyme-controlled reaction has a rate of 0.84 units per minute at 20 degrees Celsius and 1.68 units per minute at 30 degrees Celsius. Q₁₀ = 1.68 / 0.84 = 2.0, so the rate doubles for a 10 degree rise. For many enzyme-controlled reactions below the optimum, the value is around 2. Above the optimum, the value falls below 1 because denaturation reduces the rate.
pH
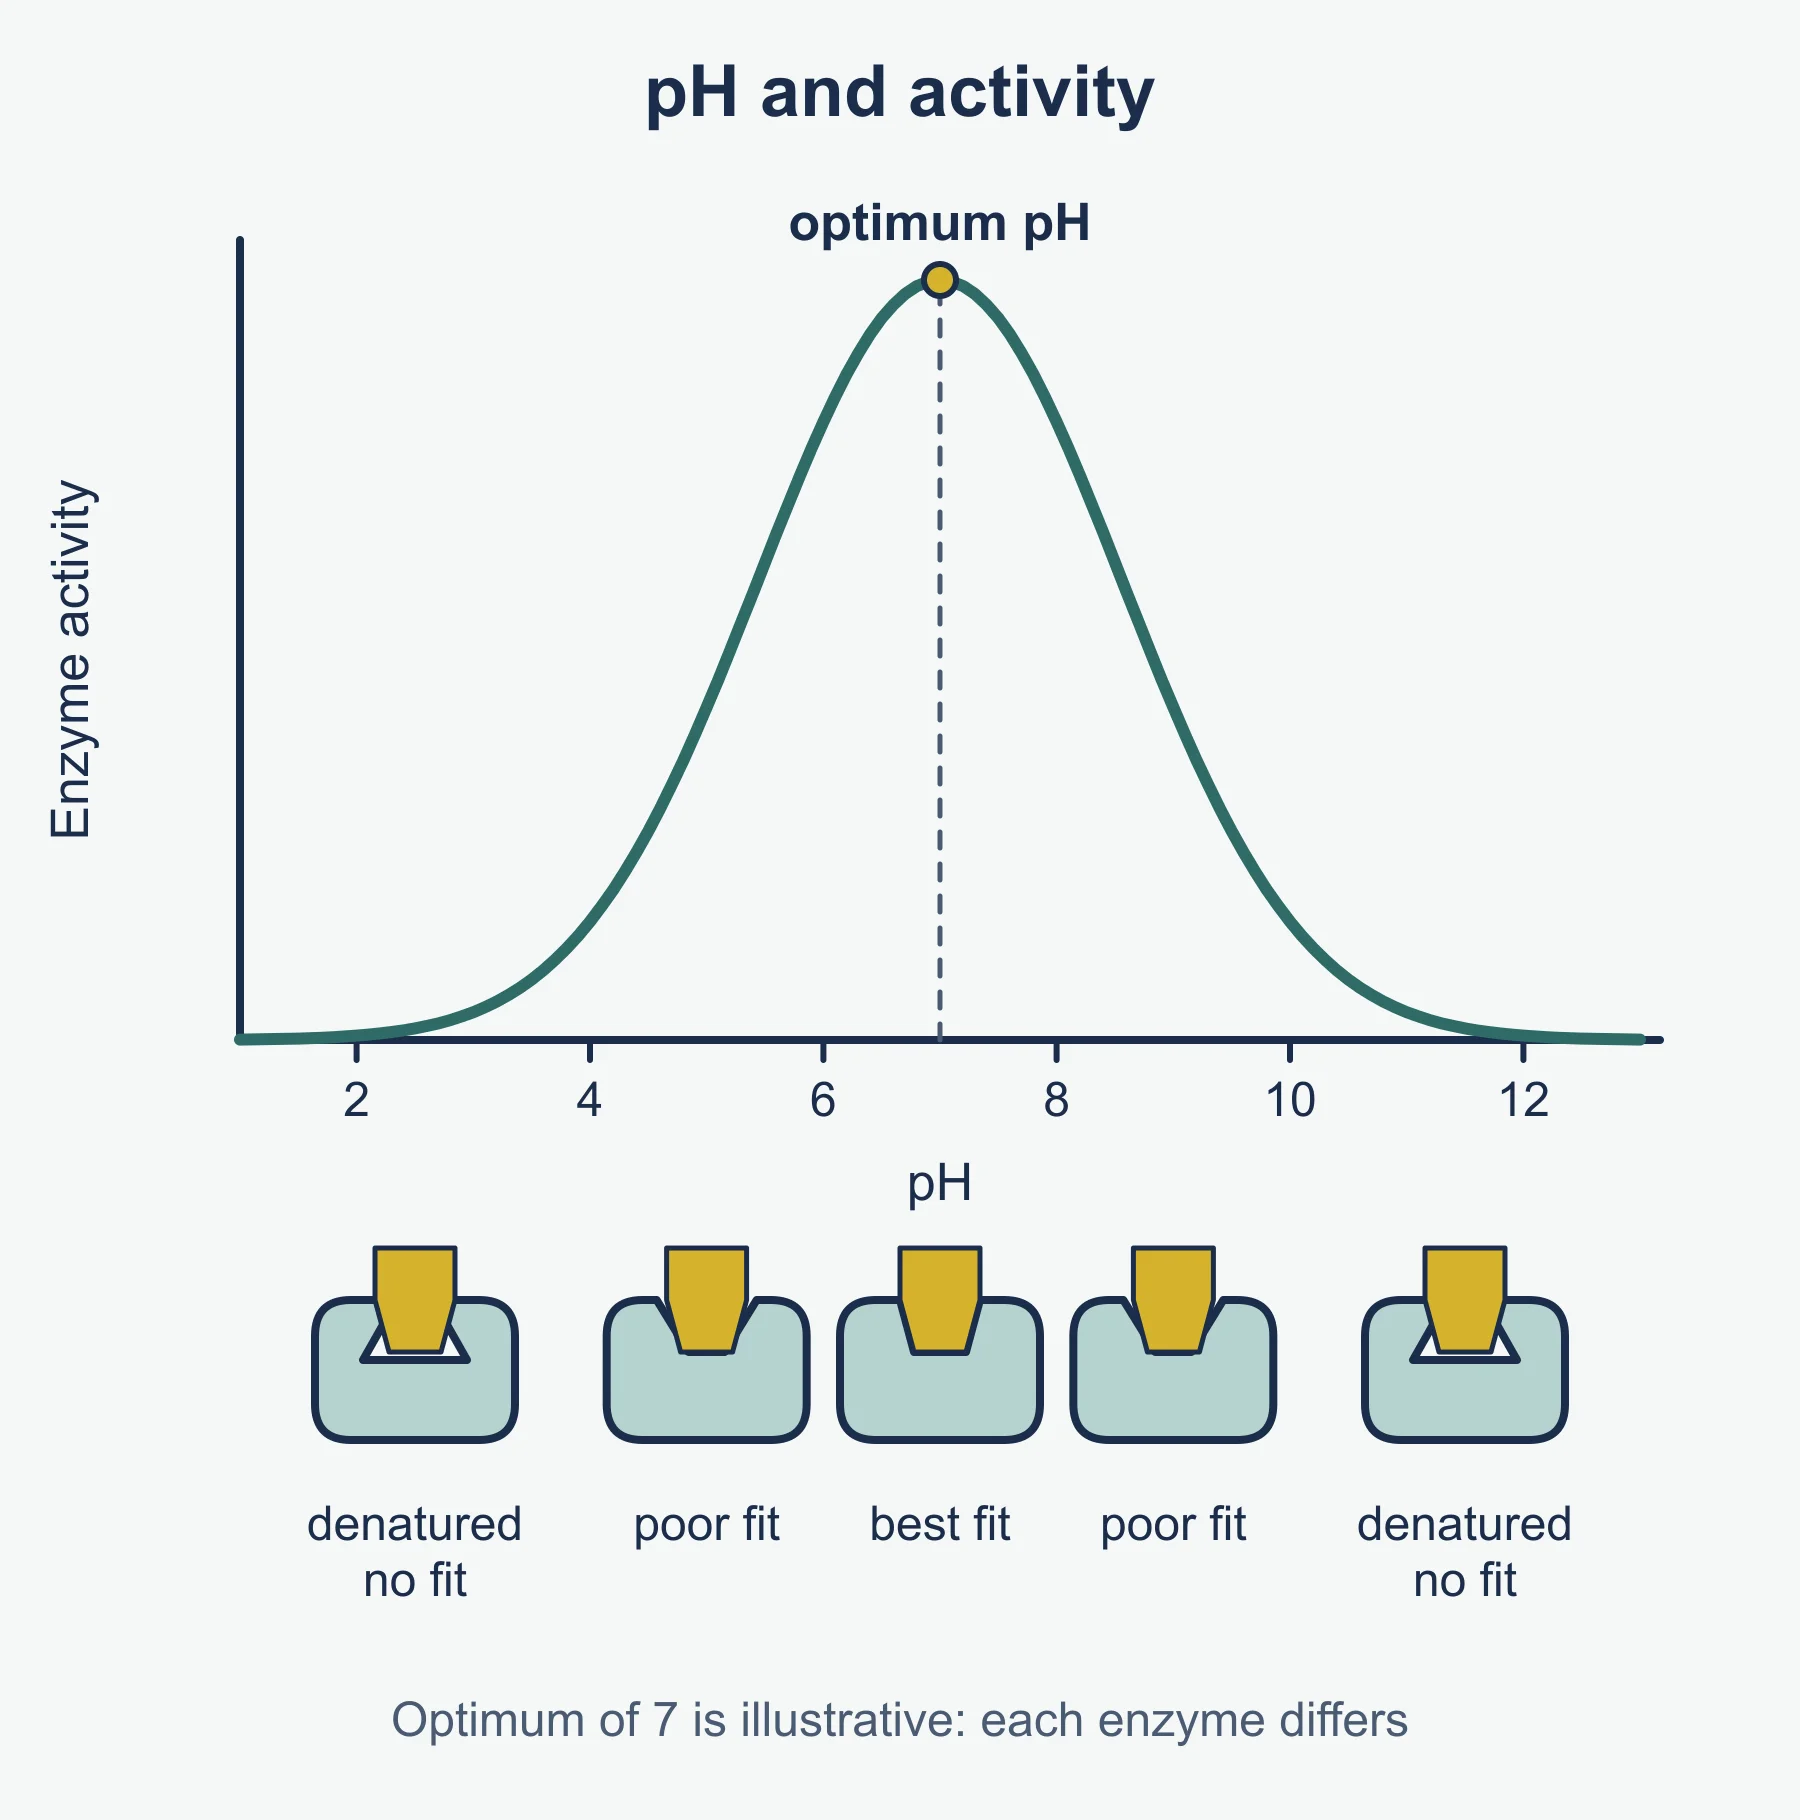
Each enzyme has an optimum pH. Hydrogen ions and hydroxide ions interact with the charged R groups of amino acids, disrupting ionic bonds and hydrogen bonds in the tertiary structure. Small changes from the optimum reduce activity because the charges in the active site change and the substrate binds less well; large changes denature the enzyme.
How do enzyme and substrate concentration affect the rate?
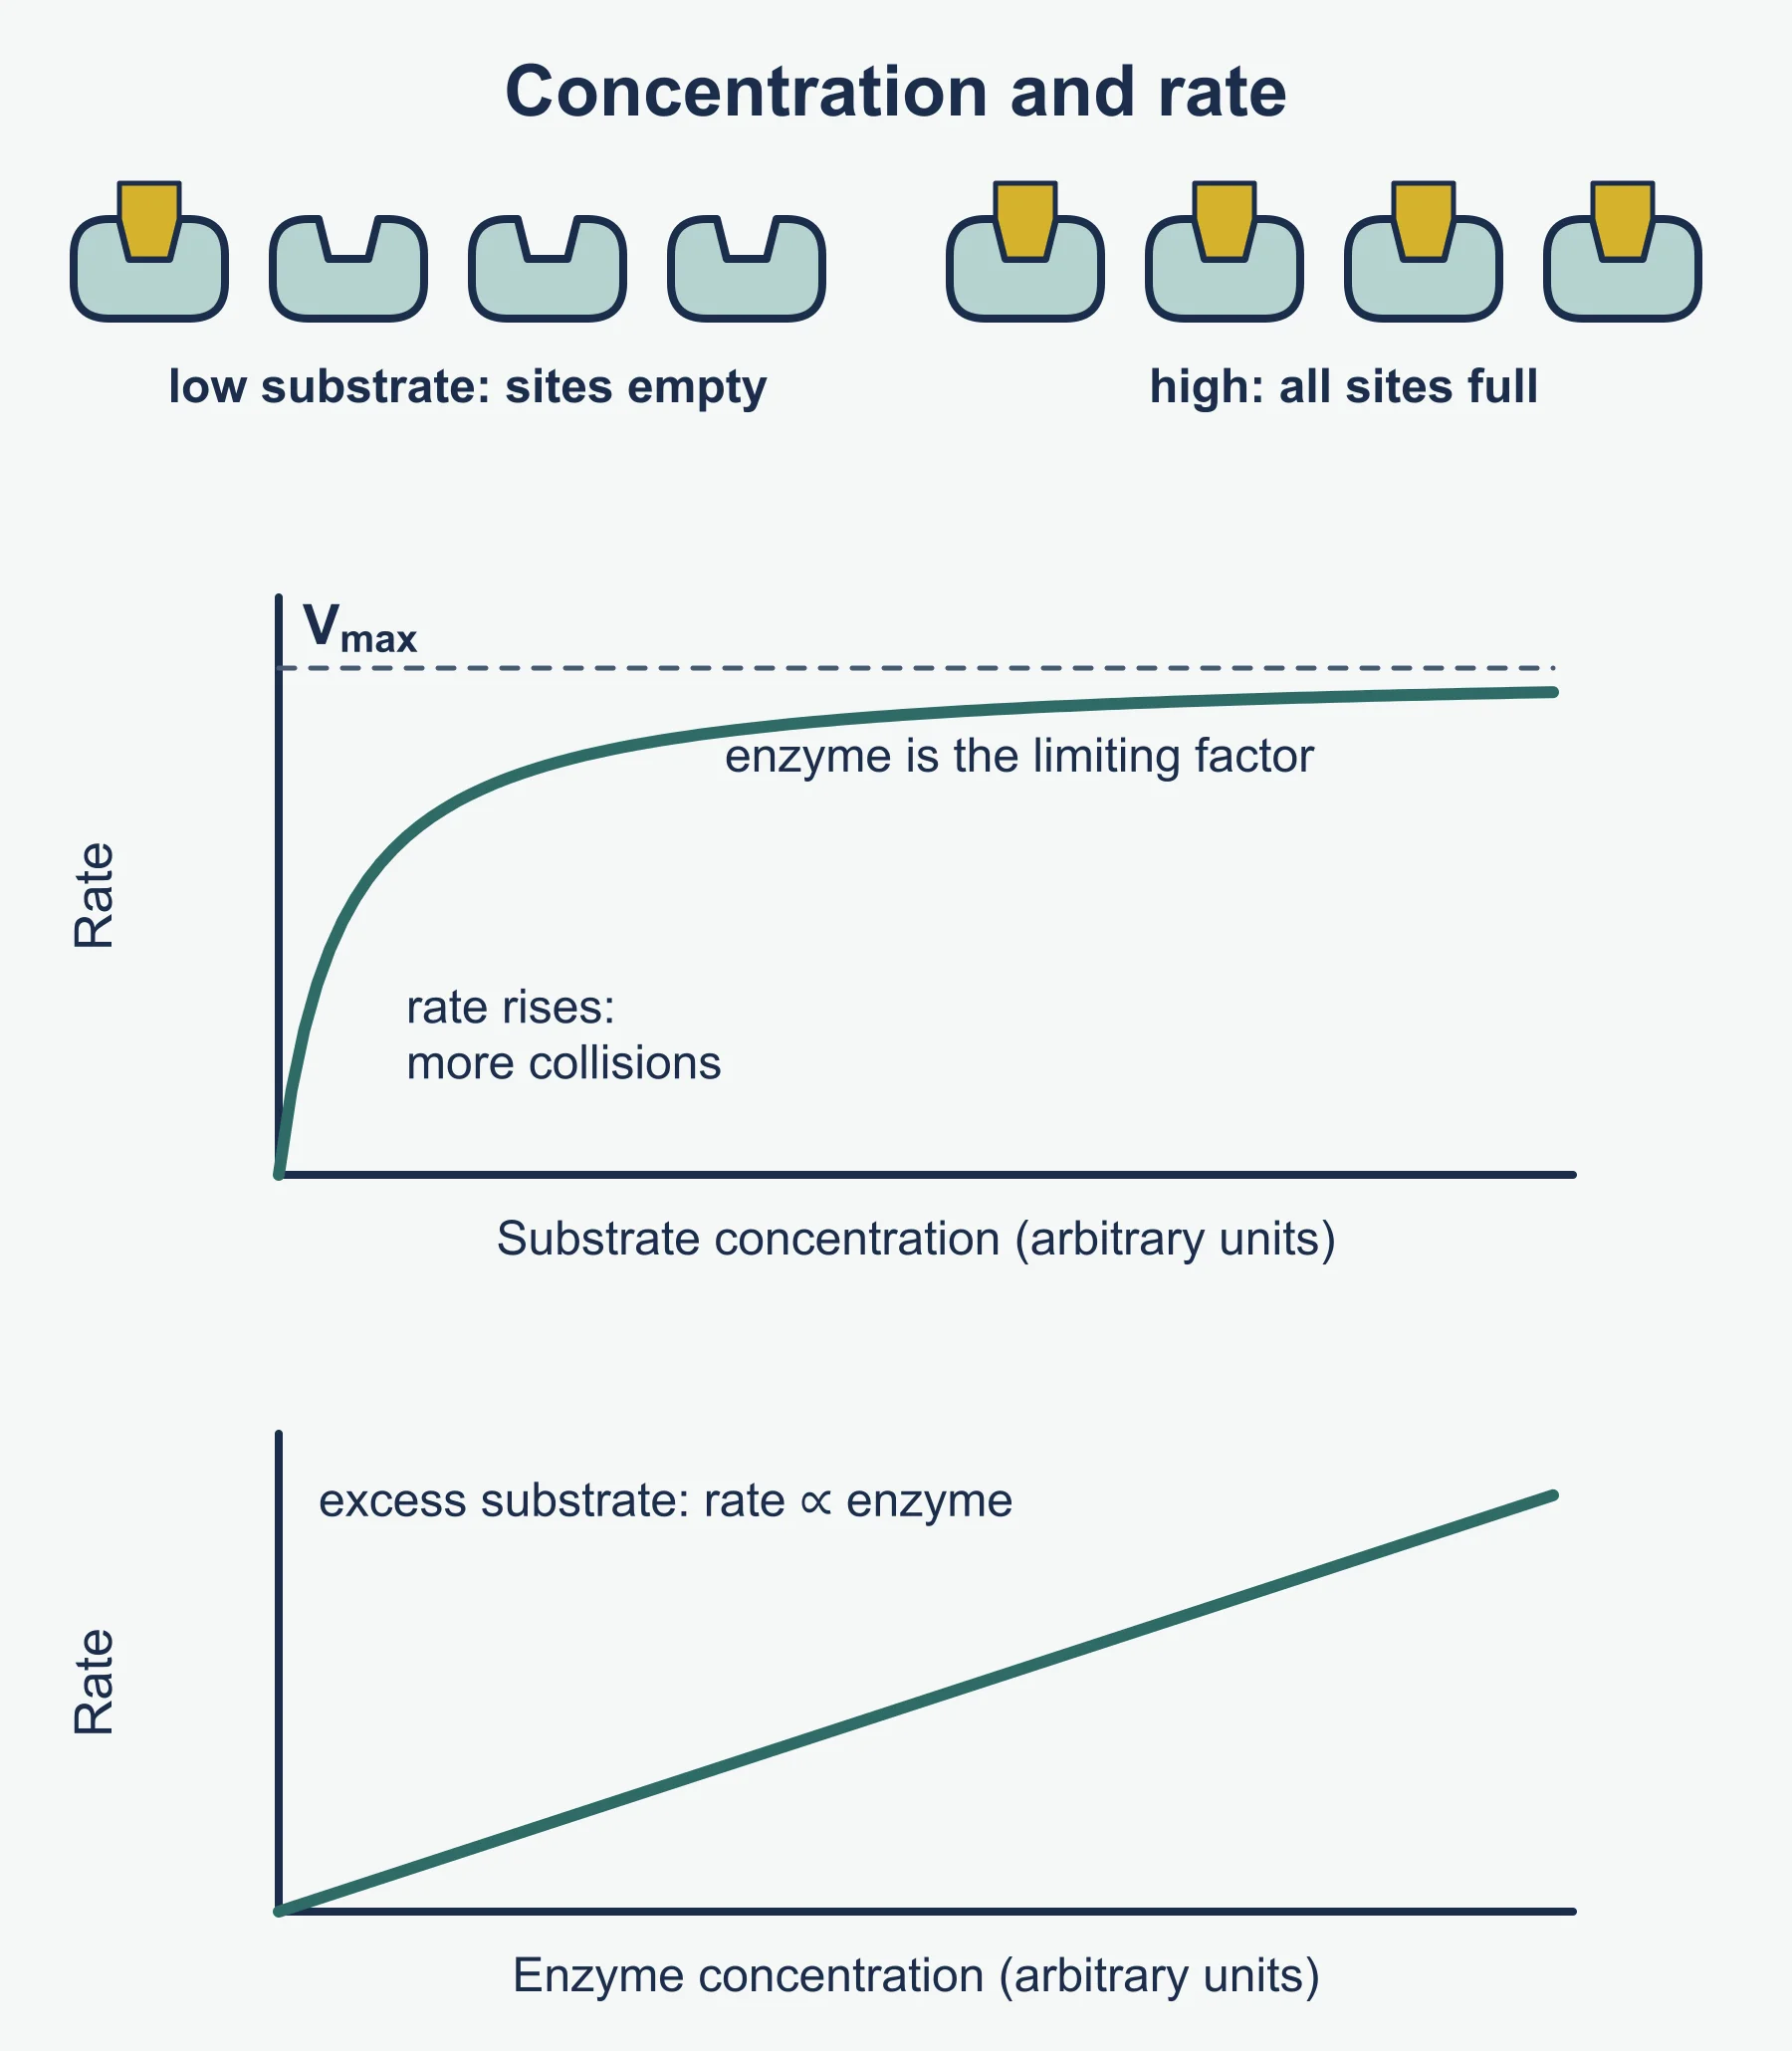
- Substrate concentration. As substrate concentration rises, the rate increases because more collisions form enzyme-substrate complexes. Eventually all active sites are occupied at any moment (the enzyme is saturated), so the rate levels off at a maximum (Vmax). Enzyme concentration is then the limiting factor.
- Enzyme concentration. With excess substrate, the rate is proportional to enzyme concentration, because more active sites are available. If substrate is limited, adding more enzyme eventually has no effect.
How do you investigate enzyme activity? (d)(ii) and PAG4
Typical PAG4 investigations use catalase (from yeast or potato) with hydrogen peroxide, measuring the volume of oxygen in a gas syringe or upturned measuring cylinder, or amylase with starch, timing how long until a sample no longer turns iodine solution blue-black.
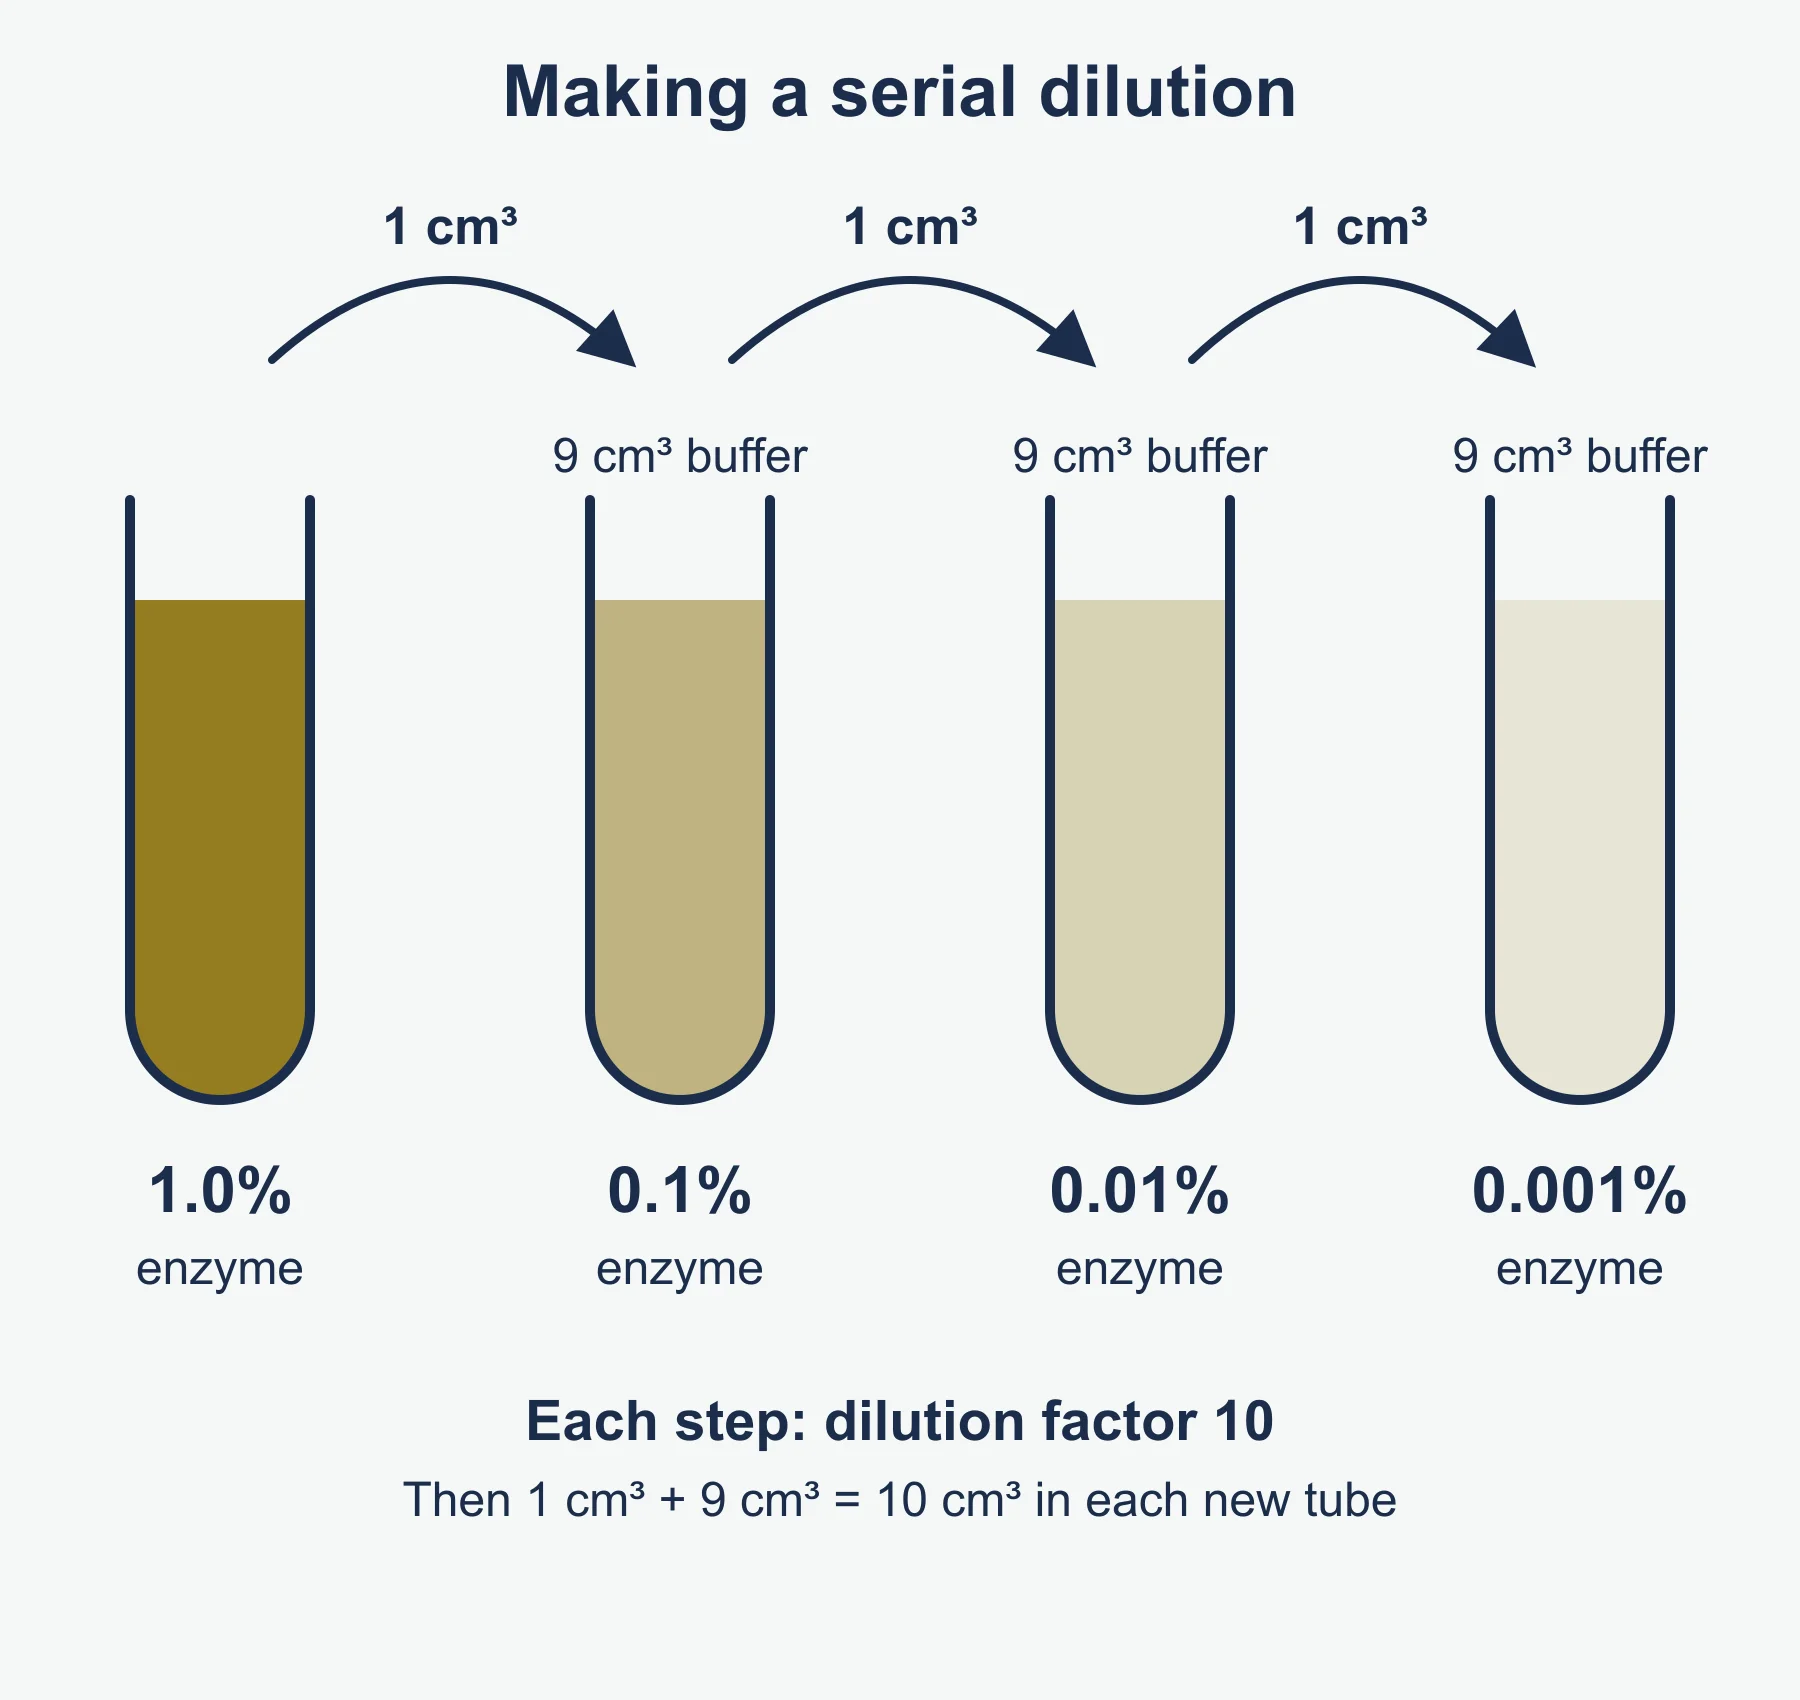
Serial dilutions. To make a range of concentrations, each solution is diluted by the same factor from the one before. For a tenfold series, mix 1 cm cubed of 1.0% enzyme with 9 cm cubed of buffer to make 0.1%, then 1 cm cubed of that with 9 cm cubed of buffer to make 0.01%, and so on.
Worked example 2 (initial rate). In a catalase experiment, 24 cm cubed of oxygen is collected in the first 30 s, when the curve is still a straight line. Initial rate = 24 / 30 = 0.8 cm cubed per second. On a curved graph, draw a tangent at time zero and use its gradient.
Worked example 3 (rate from time). If the starch in an amylase experiment disappears after 40 s, a relative rate is 1 / time = 1 / 40 = 0.025 per second.
Control variables include the volume and concentration of the other reactant, pH (using a buffer) and temperature (using a water bath). A control with boiled (denatured) enzyme shows that the enzyme is responsible.
Why do some enzymes need cofactors and coenzymes? (e)
Some enzymes only work when another non-protein substance is present.
| Term | What it is | Example |
|---|---|---|
| Cofactor | An inorganic ion that helps the enzyme–substrate complex form or makes the active site the right shape | Chloride ions for amylase |
| Coenzyme | A small organic molecule, often derived from a vitamin, that carries chemical groups or atoms between enzymes | NAD, derived from the vitamin niacin |
| Prosthetic group | A cofactor permanently (tightly) bound to the enzyme | Zinc ions in carbonic anhydrase |
How do inhibitors affect enzyme action? (f)
| Type | Where it binds | Effect | Overcome by more substrate? |
|---|---|---|---|
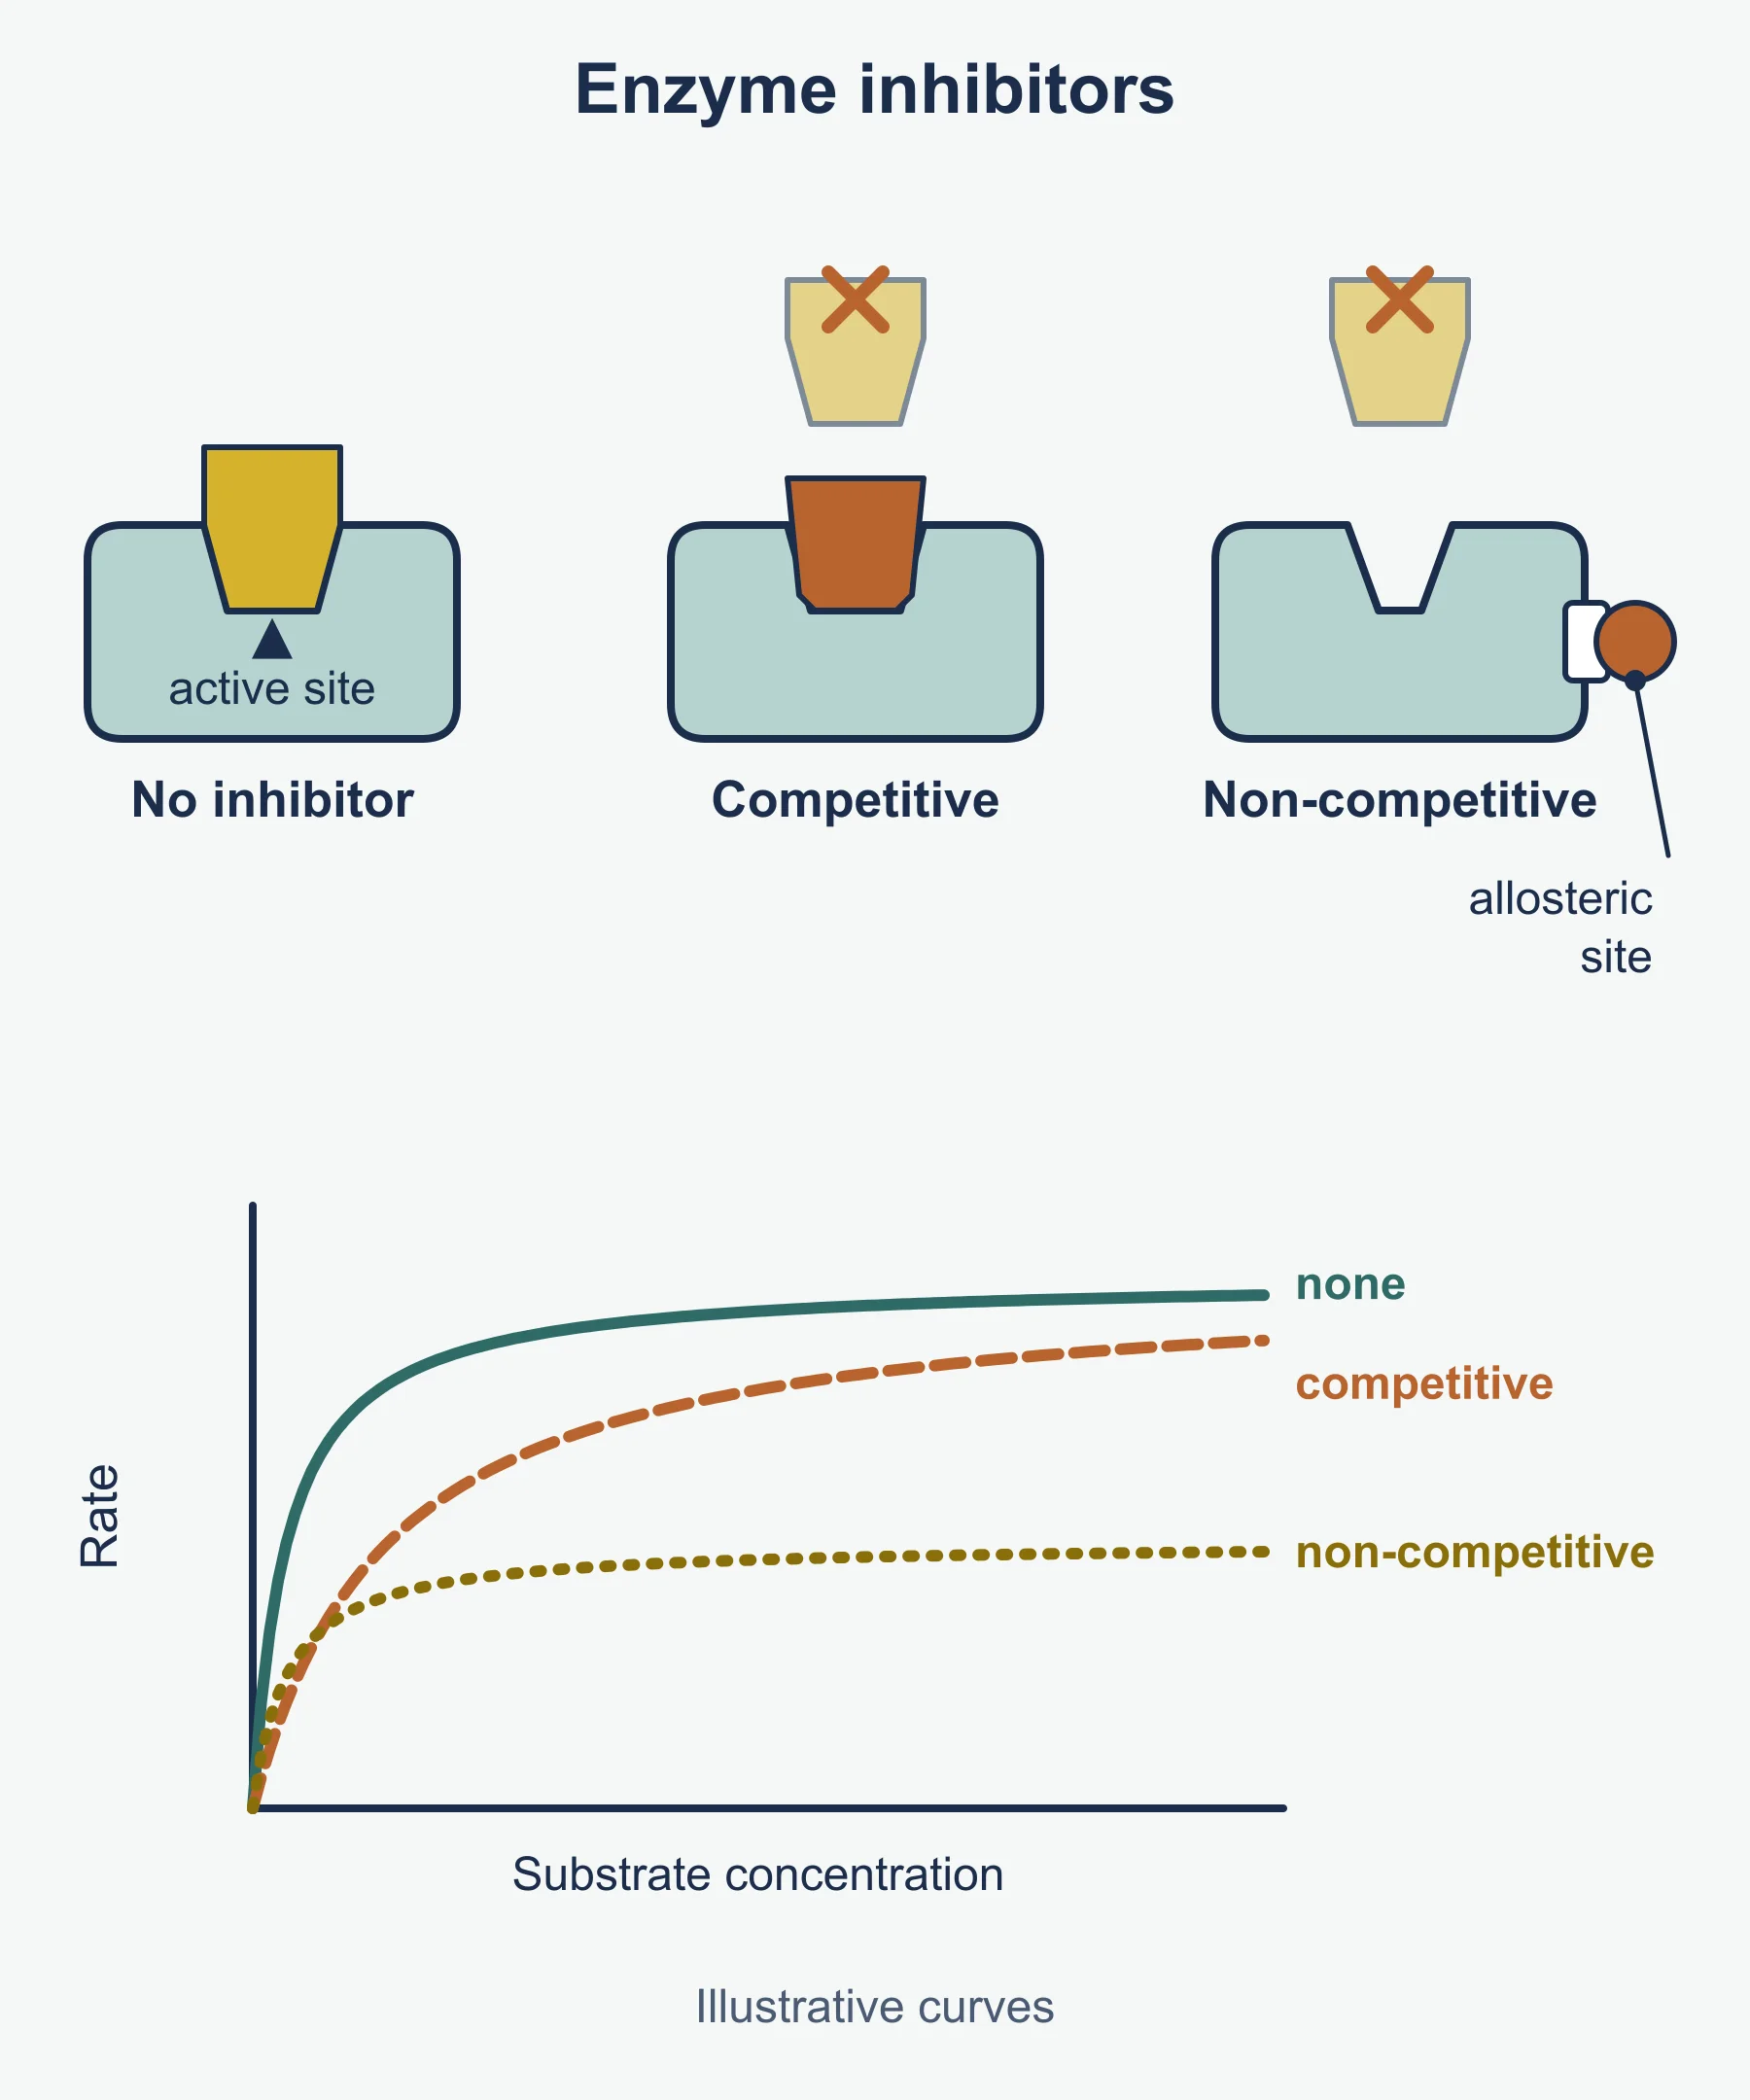
| Competitive | The active site; its shape is similar to the substrate | Fewer enzyme–substrate complexes form | Yes: at high substrate concentration the rate approaches the uninhibited maximum |
| Non-competitive | An allosteric site, away from the active site | Changes the tertiary structure, so the active site changes shape | No: the maximum rate is lowered |
| Reversible | Held by weak bonds (for example hydrogen or ionic bonds) | The inhibitor can leave, so activity returns | Depends on type |
| Non-reversible | Held by strong (covalent) bonds | Enzyme permanently inactivated | No |
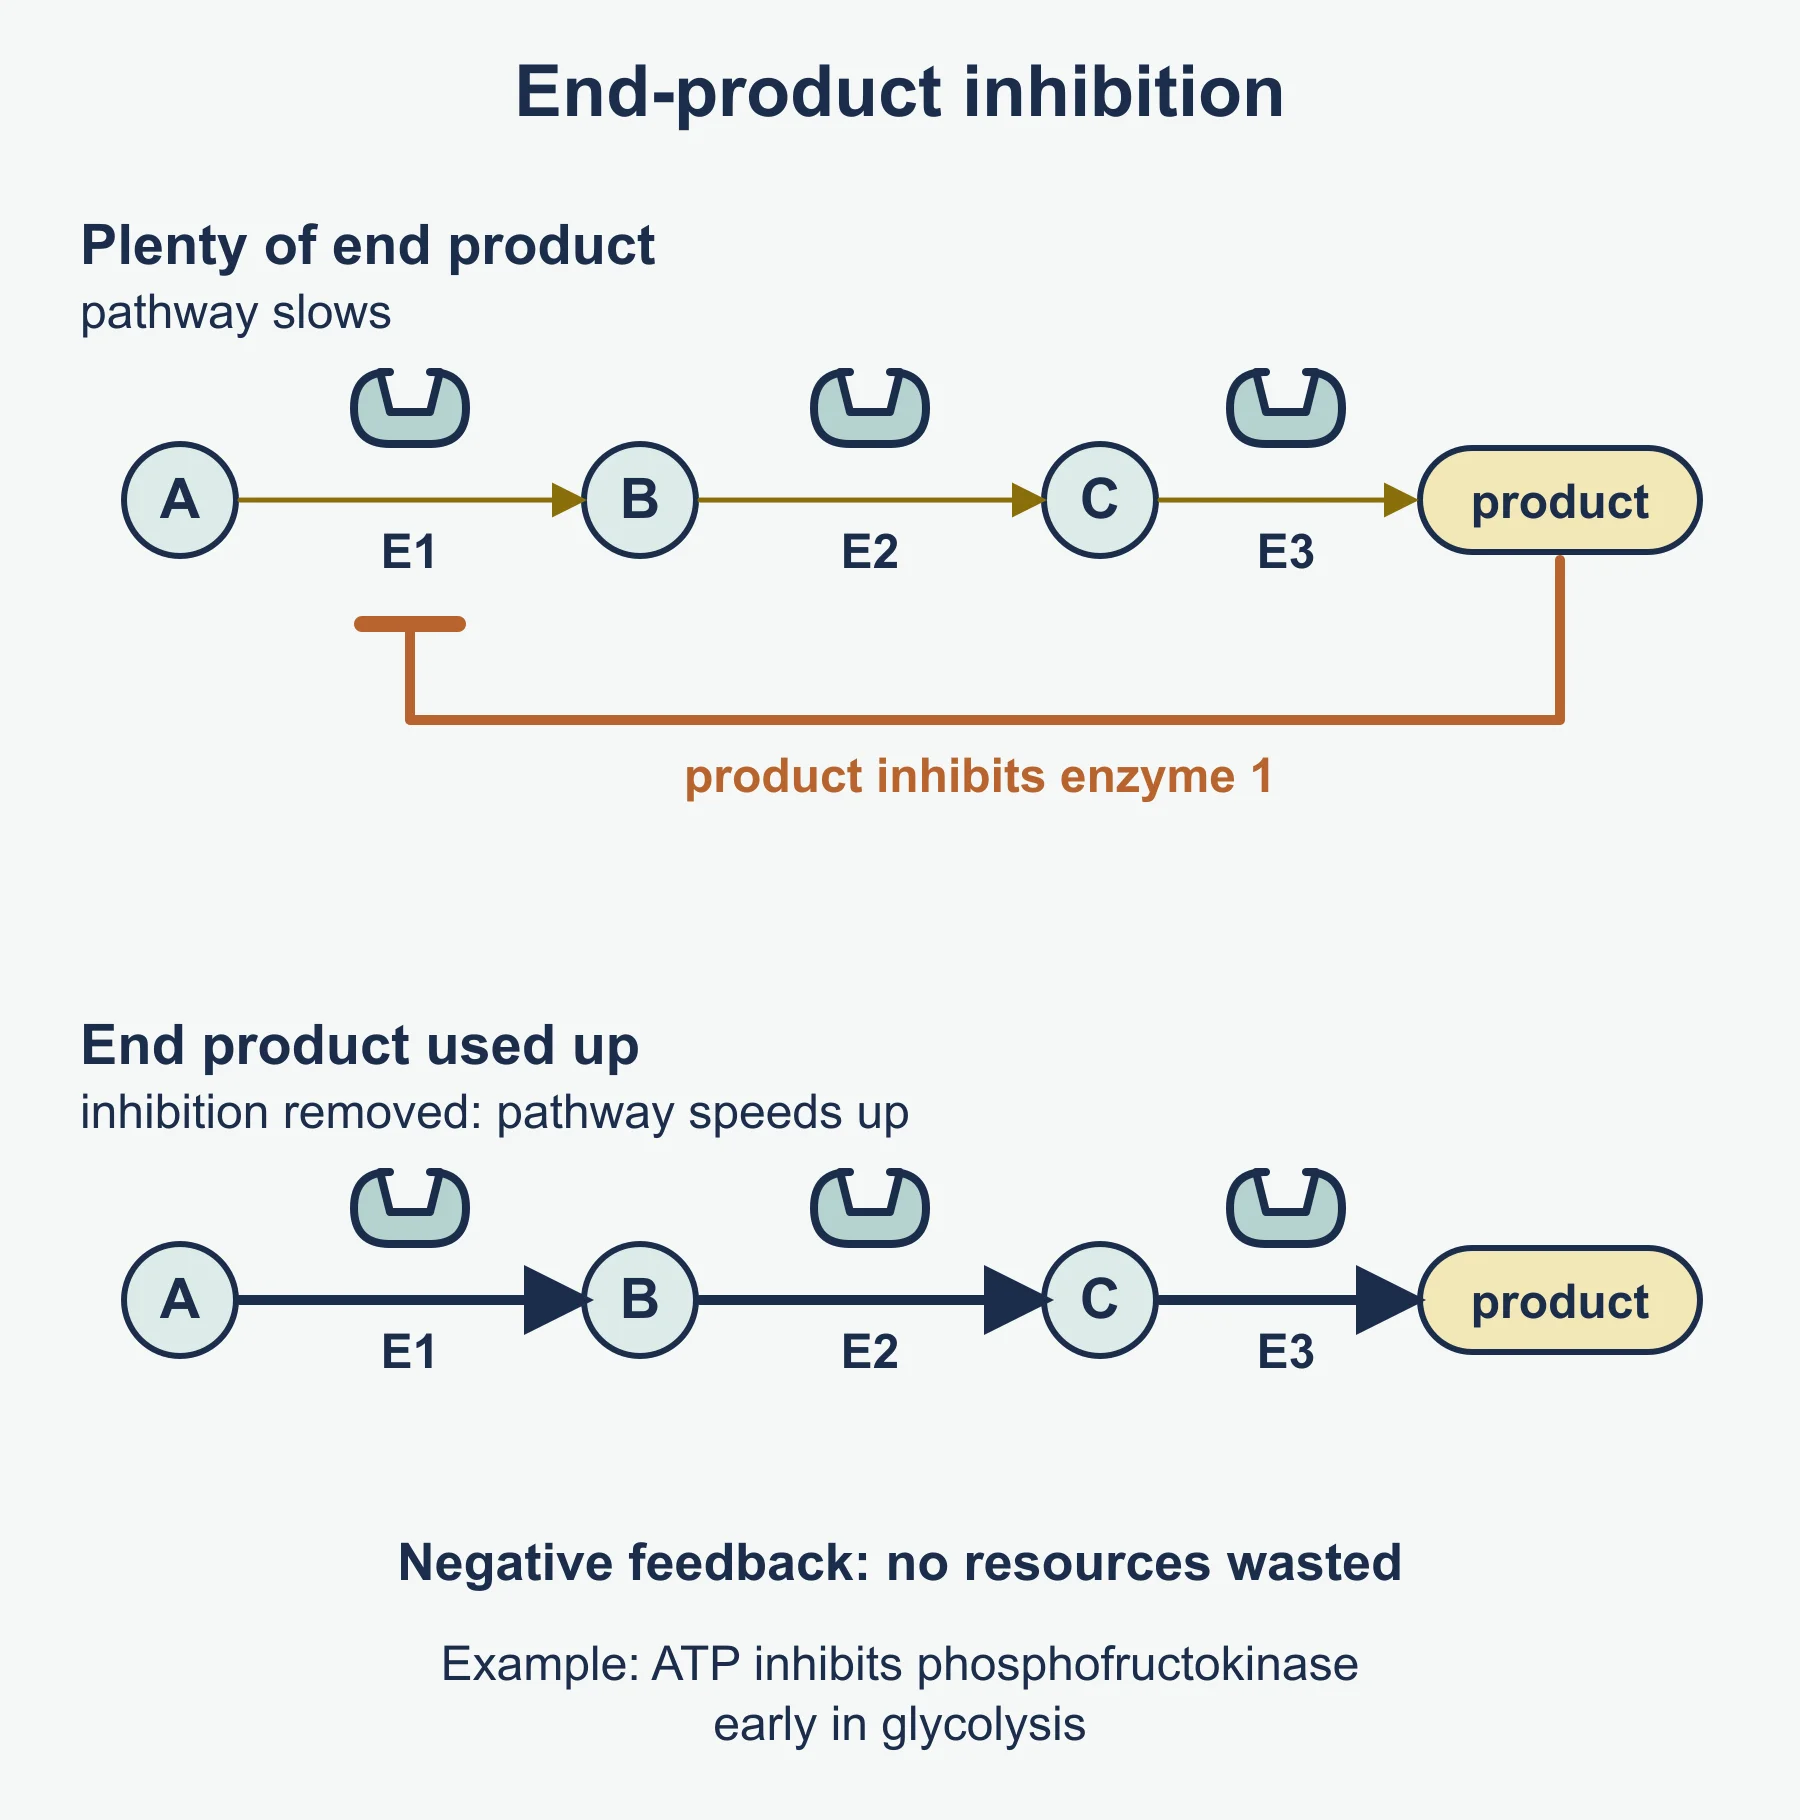
End-product inhibition. In a metabolic pathway, the final product inhibits an enzyme early in the pathway. When there is plenty of product, the pathway slows; when product is used up, the inhibition is removed. This is negative feedback and stops resources being wasted. For example, ATP inhibits phosphofructokinase, an enzyme early in glycolysis.
Frequently asked questions
Why is the induced-fit model preferred to lock and key? It explains how binding strains the substrate’s bonds and lowers activation energy, and why the active site can change shape. The lock and key model treats the active site as rigid.
What is the difference between a cofactor and a coenzyme? A cofactor is an inorganic ion, such as chloride for amylase. A coenzyme is an organic molecule, often made from a vitamin, that carries atoms or groups between reactions.
How do I calculate the temperature coefficient? Divide the rate at the higher temperature by the rate at a temperature 10 degrees Celsius lower. A value of 2 means the rate doubles.
Why does the rate level off at high substrate concentration? All active sites are occupied at any one time, so the enzyme concentration limits the rate.
Common mistakes
- Saying enzymes are “killed” at high temperature; they are denatured.
- Saying the active site is the “same shape” as the substrate; it is complementary.
- Explaining denaturation without naming the bonds broken in the tertiary structure.
- Saying a competitive inhibitor lowers the maximum rate permanently.
- Reading a rate from the end of a curve instead of the initial gradient.
- Forgetting to use a buffer to control pH in a temperature investigation.
Official syllabus
OCR A Level Biology A (H420) specification, Version 4.1 (April 2026), first assessment 2025, Module 2 Foundations in biology, section 2.1.4 Enzymes, learning outcomes (a) to (f), with PAG4.
Get free revision emails (optional)
Occasional emails with practice questions, worked explanations and links to free resources for the qualification and subjects you choose. No spam, and you can unsubscribe from any email. The free tools on this site never need an email.
Related resources
-
Practice questions
OCR A Level Biology A: Enzymes (H420) – Practice Questions
Original OCR A Level Biology A (H420) 2.1.4 questions with answers: induced fit, temperature and pH, temperature coefficient, serial dilutions and inhibitors.
Biology · OCR · A Level
Try questions -
Revision notes
OCR A Level Biology A: Enzymes (H420) – Revision Notes
Revision notes on enzyme action, rate factors, Q₁₀, cofactors, coenzymes, inhibitors and PAG4 enzyme practicals for OCR A Level Biology A (H420), section 2.1.4.
Biology · OCR · A Level
Revise topic -
Exam preparation
OCR A Level Biology A: Preparing for Two 100-Mark Papers and a Synoptic Third
How OCR A Level Biology A (H420) is assessed: two 100-mark papers, a synoptic Paper 3, the separate Practical Endorsement and a routine for unfamiliar data.
Biology · OCR · A Level
Read guide
Related articles
-
study skills
How to revise for a science examination
Most science revision fails because it rereads notes instead of retrieving them. A practical method for revising physics, chemistry and biology in the weeks before a paper.
14 July 2026
-
teaching
A Level tuition in Dubai: Cambridge or Pearson Edexcel International A Level?
Schools in Dubai and Abu Dhabi teach either Cambridge International AS & A Level or Pearson Edexcel International A Level. How the two are structured, why it matters for tuition, and how online classes from Lahore work.
9 October 2026
Studying this with a teacher
Working through Biology A LEVELS?
This page is free and stays free. If you would rather be taught it, Marlbridge runs Biology classes one-to-one, online in your own time zone. One-to-one only for this course: Rs 6,000 per class in Pakistan, with other currencies on the fees page. The first trial class is free. WhatsApp replies within an hour (8am–11pm Pakistan time, every day); email the same day.
OCR Biology teachers at Marlbridge


