
Revision Notes
OCR A Level Business: Ansoff's matrix and Conflicts in business decision making (H431) – Revision Notes
Condensed revision notes on Ansoff's matrix and on why decision making tools conflict, for the strategy area of OCR A Level Business.
- Subject
- Business
- Level
- A LEVELS
- Topic
- Business objectives and strategic decisions
- Author
- Marlbridge Academic Team
- Updated
- Reviewed by
- Salman Ahmad (what this means)
Aligned to OCR A Level Business (H431), Version 2.1 (January 2026), for first assessment in 2017; final assessment summer 2027. Official specification .
Syllabus page (what it covers and how it is assessed): OCR A Level Business.
Syllabus points this page covers
H431
- 1.15 Ansoff's matrix
- 1.16 Conflicts in business decision making
Found an error? Report a correction.
Need help with this topic? Request a free trial class for A Level Business (H431).
Quick recall notes for Ansoff’s matrix and Conflicts in business decision making in OCR A Level Business (H431), following the Version 2.1 (January 2026) specification. For full explanations and worked examples, read the study guide. Test yourself with the practice questions, tick off topics on the checklist, find the course hub at OCR A Level Business, and find weak spots with the free diagnostics. The wider unit is in the Objectives and Strategic Decisions revision notes.
Ansoff’s matrix in one page
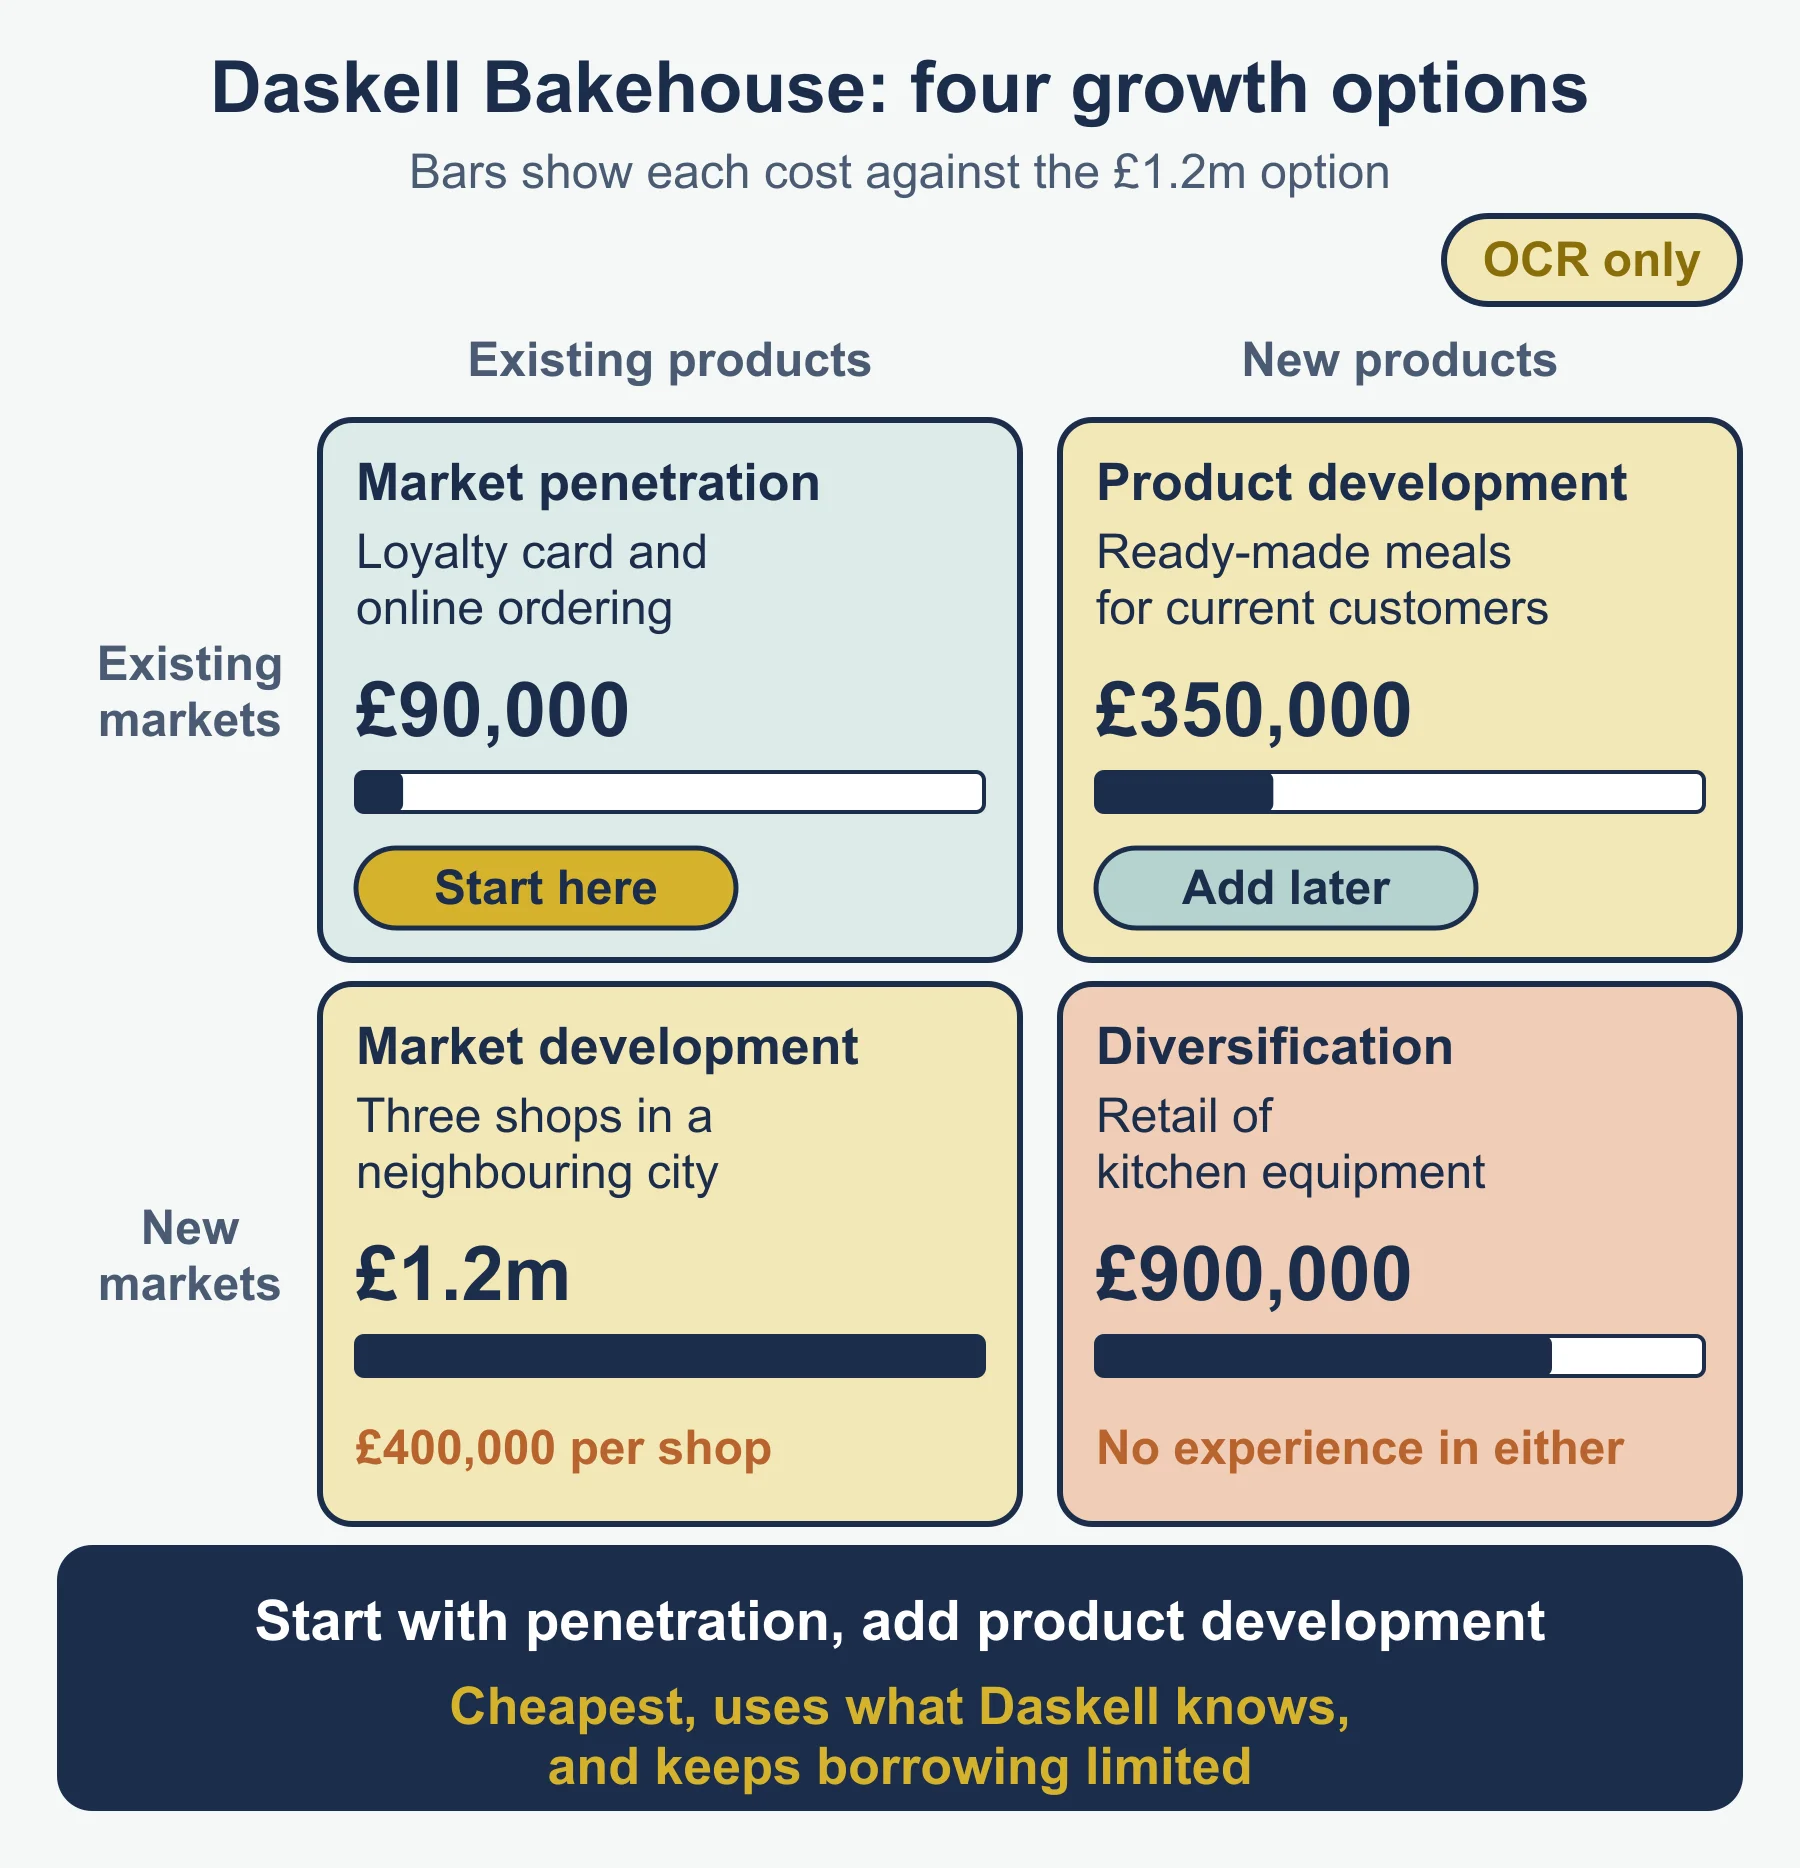
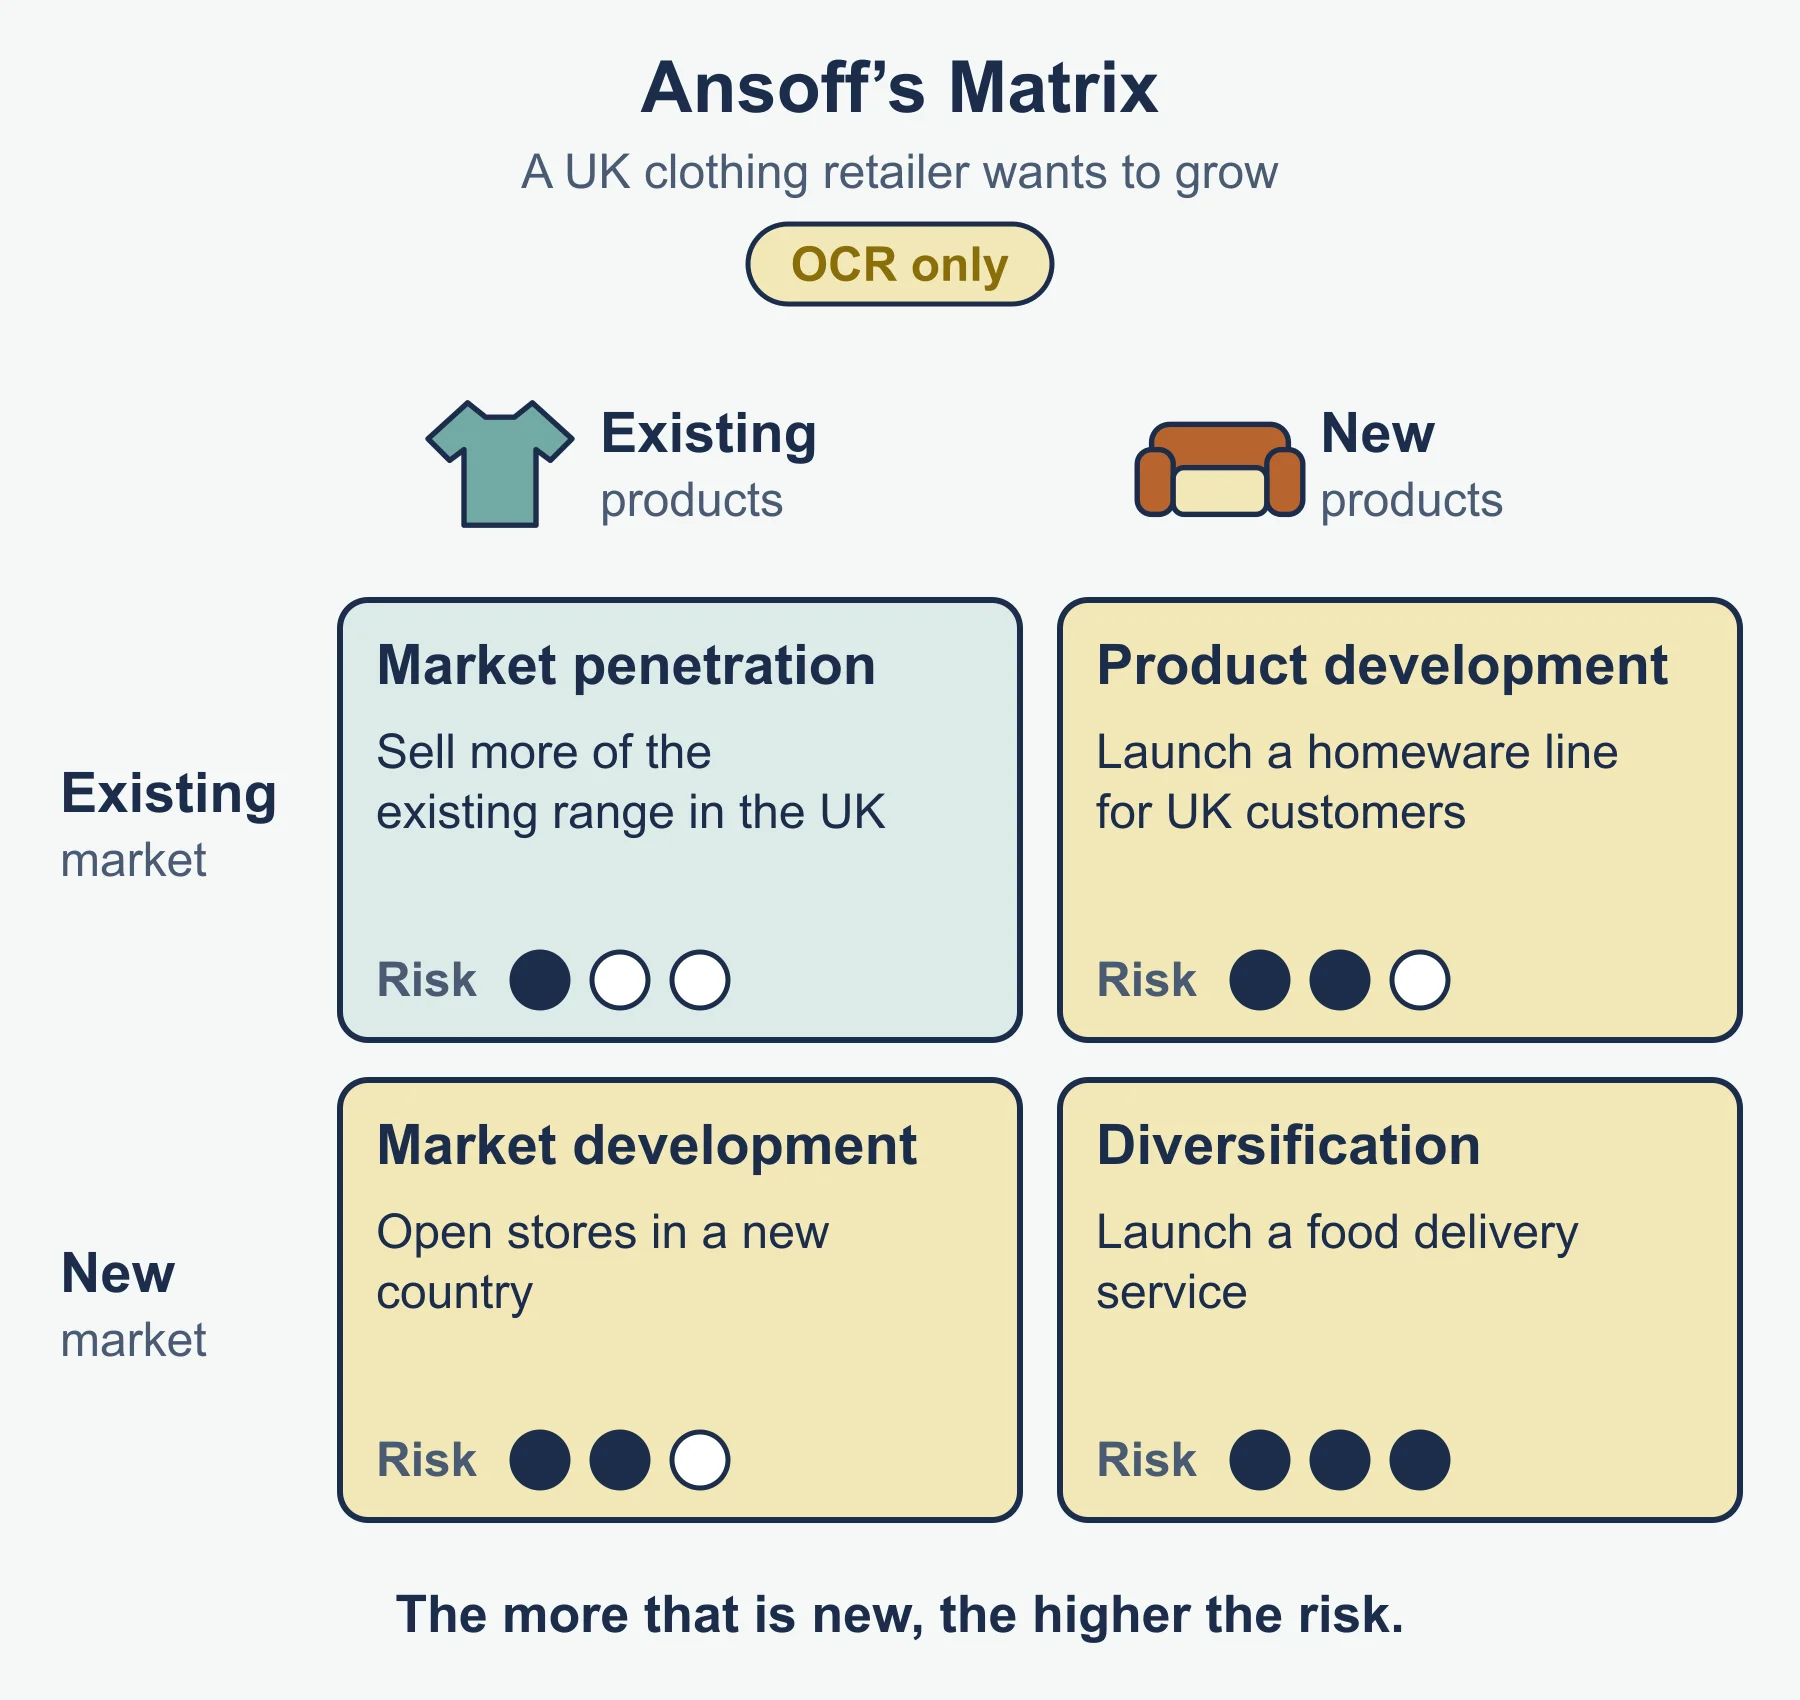
Nature and purpose. A model that classifies growth strategies by whether the product and the market are new or existing, so that managers can compare the options and the risk of each.
| Existing products | New products | |
|---|---|---|
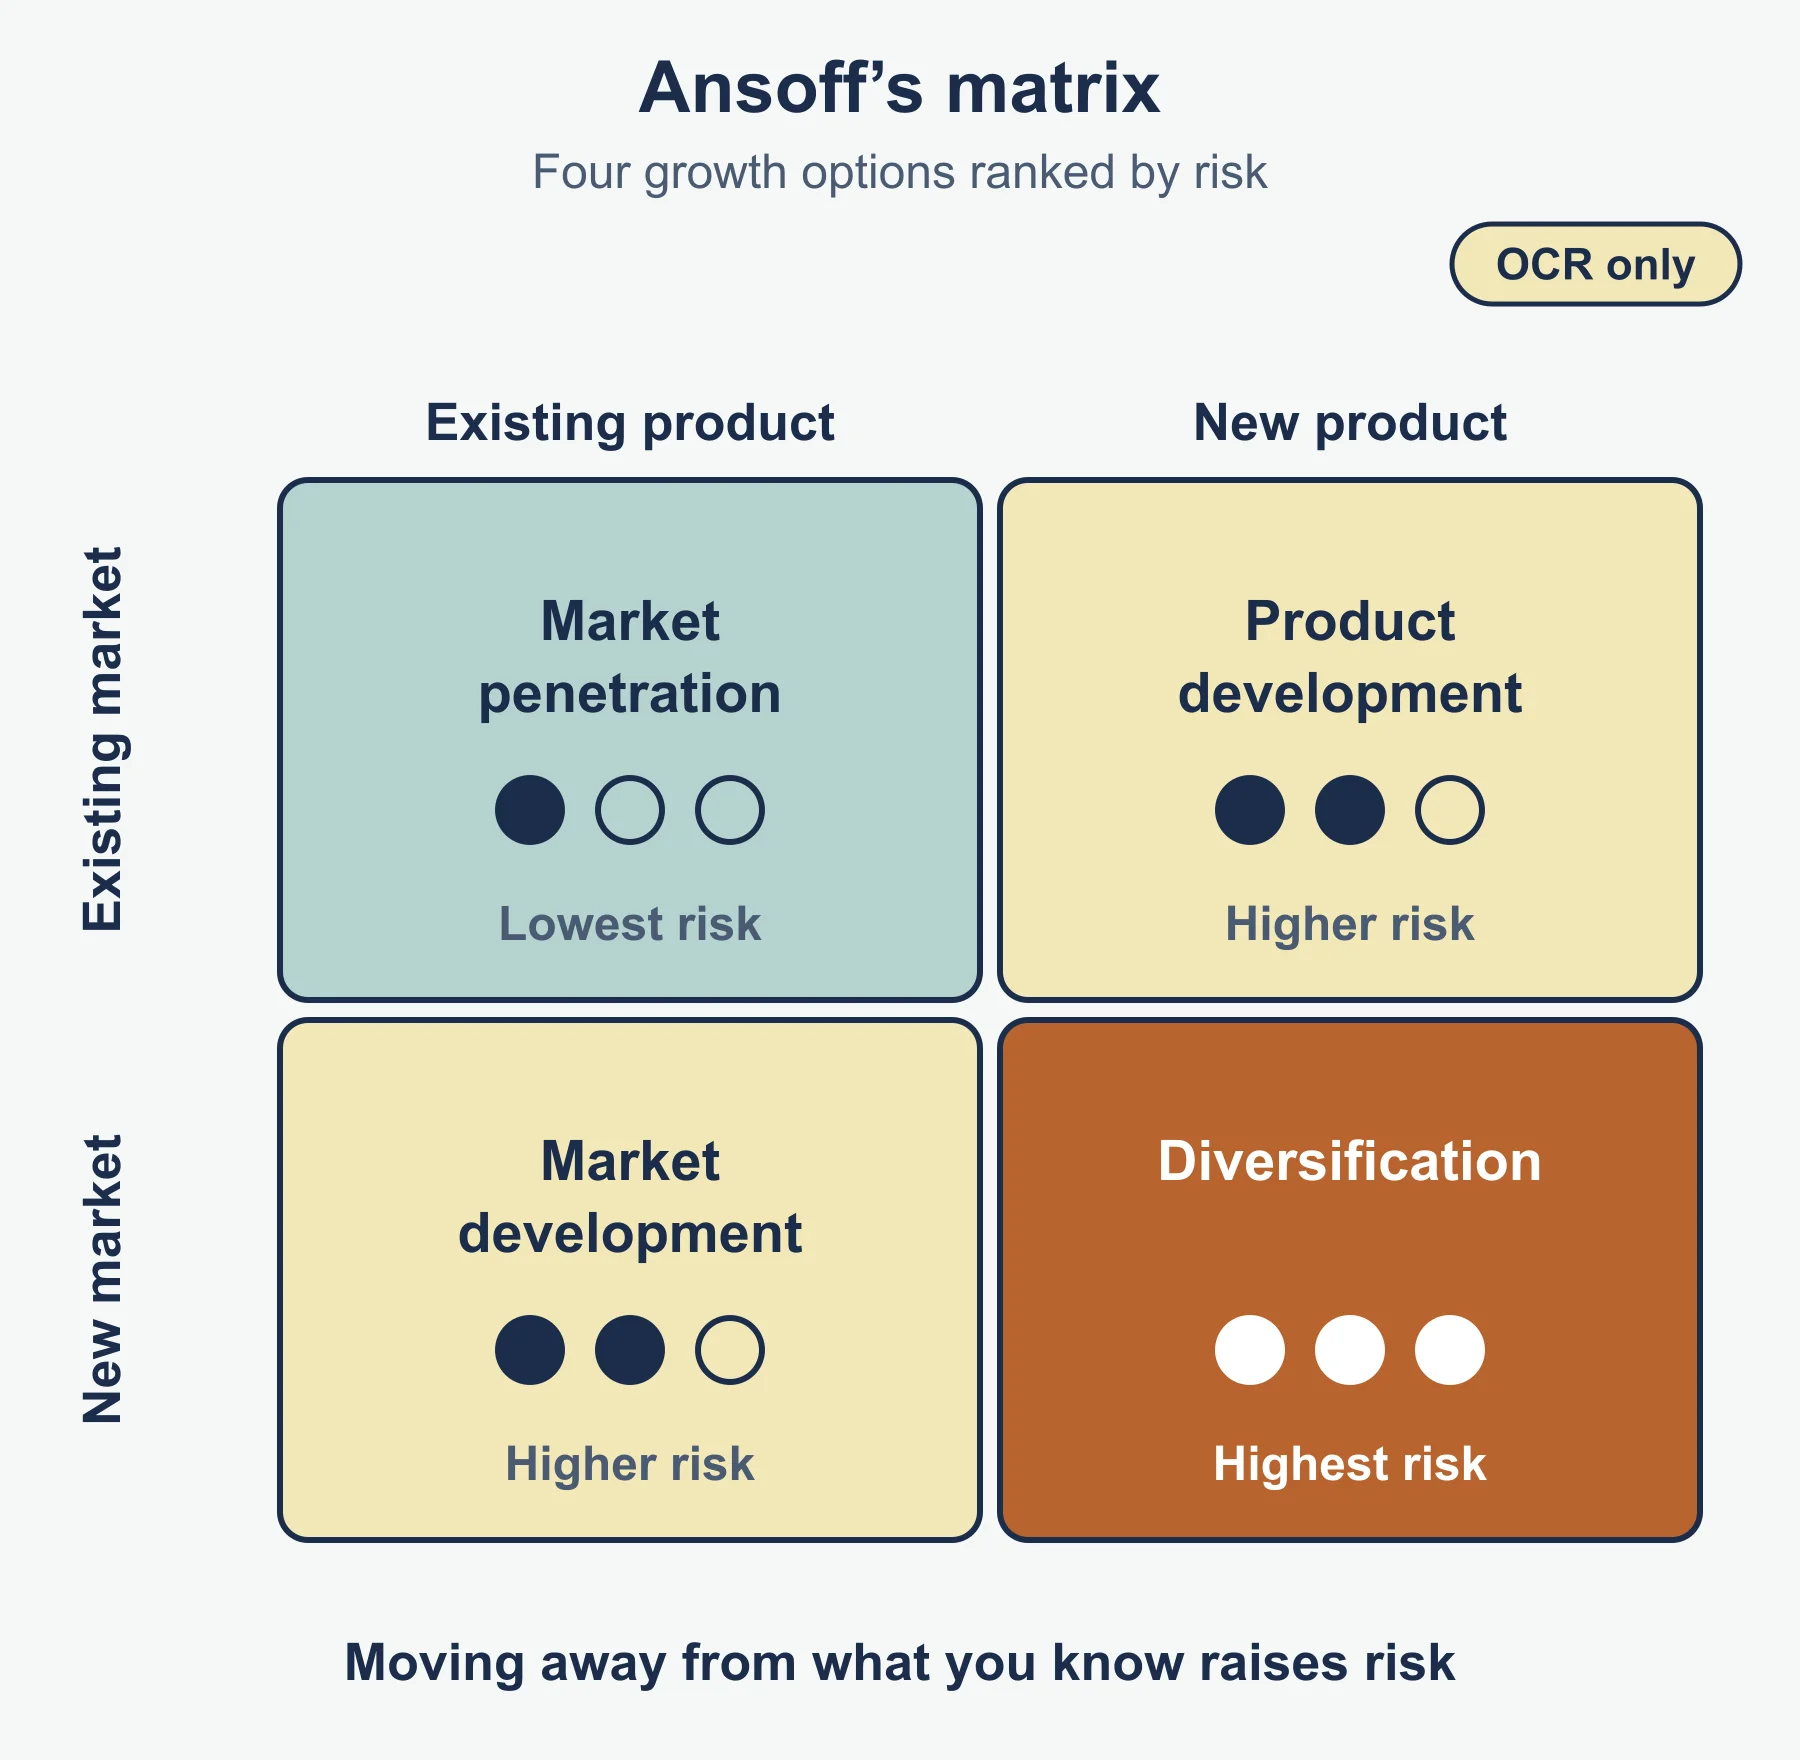
| Existing markets | Market penetration | Product development |
| New markets | Market development | Diversification |
Distinguish the quadrants by changing one thing at a time.
| Quadrant | What is new | Typical strategies | Usual risk |
|---|---|---|---|
| Market penetration | Nothing | Promotion, price cuts, loyalty schemes, buying a rival | Lowest |
| Market development | The market | New region, new customer segment, new use, export | Medium |
| Product development | The product | New model, improved quality, new service for current customers | Medium |
| Diversification | Both | New products in new markets; related or unrelated | Highest |
Why risk rises. Each step away from current products and customers adds uncertainty and usually more cost. Diversification combines both uncertainties.
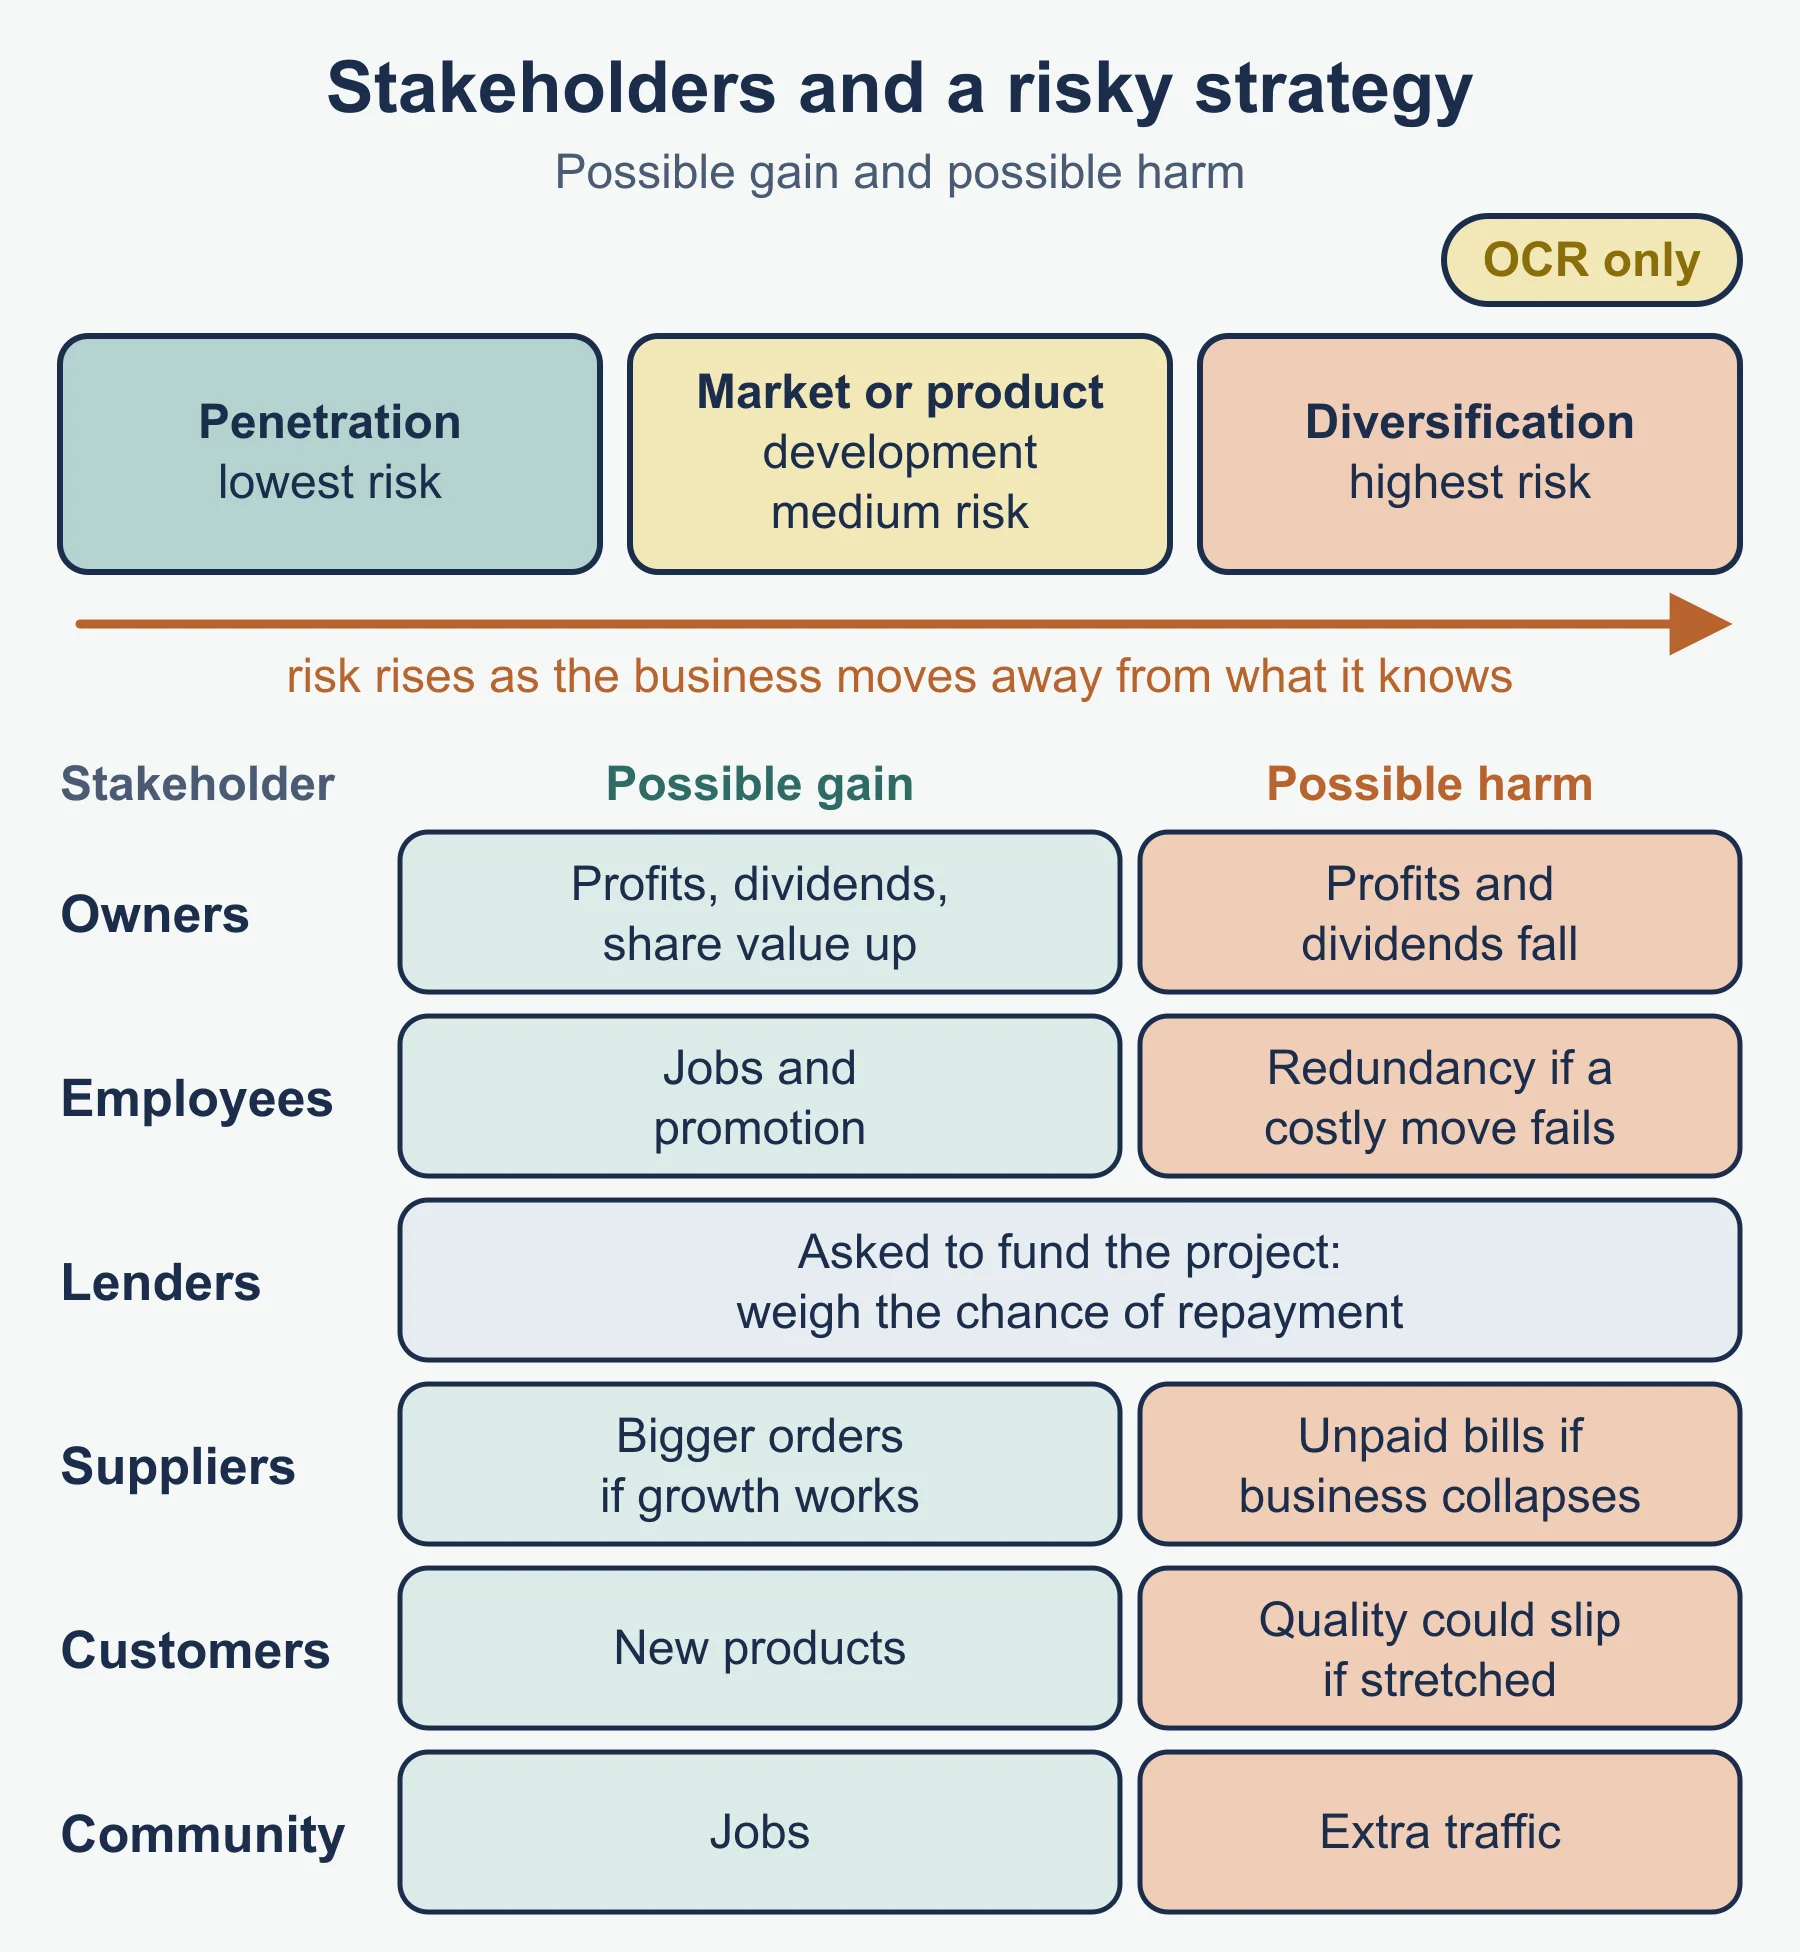
Risk for stakeholders (use them in evaluation).
| Stakeholder | If the strategy works | If it fails |
|---|---|---|
| Owners and shareholders | Higher profit and share value | Lost investment, lower dividends |
| Employees | Jobs, promotion, training | Redundancy, pay freezes |
| Lenders | Repayment secure | Default risk |
| Suppliers | Larger orders | Late or unpaid bills |
| Customers | New products or better service | Weaker quality, higher prices |
| Local community | Jobs, spending | Closures, traffic, unemployment |
Method: recommend and justify a strategy
- Identify the objective (growth, profit, market share, survival).
- Place each option in its quadrant.
- Judge risk and cost for the business and its stakeholders.
- Check resources, skills, market conditions and timing.
- Choose one, give the reason, and say why the others are weaker.
- State what would change your mind.
Usefulness of the matrix
| Strengths | Limitations |
|---|---|
| Simple and clear | No financial figures |
| Shows every growth option | Ignores the size of reward |
| Links strategy to risk | Ignores resources and competitors’ reactions |
| Starts a discussion | Real strategies may mix quadrants |
Verdict: useful as a first screen, weak as the only basis for a decision. Pair it with numbers and qualitative judgement.
Conflicts in business decision making
Why one tool’s result can conflict with another’s.
- They measure different things (speed, average profit, value of cash).
- They treat time differently (payback and ARR do not discount; NPV does).
- They depend on estimates that may be wrong or biased.
- Quantitative tools leave out qualitative factors.
- They cover different time horizons.
Standard forms of the investment appraisal tools
These are standard forms. The specification names the methods; check your textbook for the layout your teacher prefers.
| Tool | Standard form | Strength | Limitation |
|---|---|---|---|
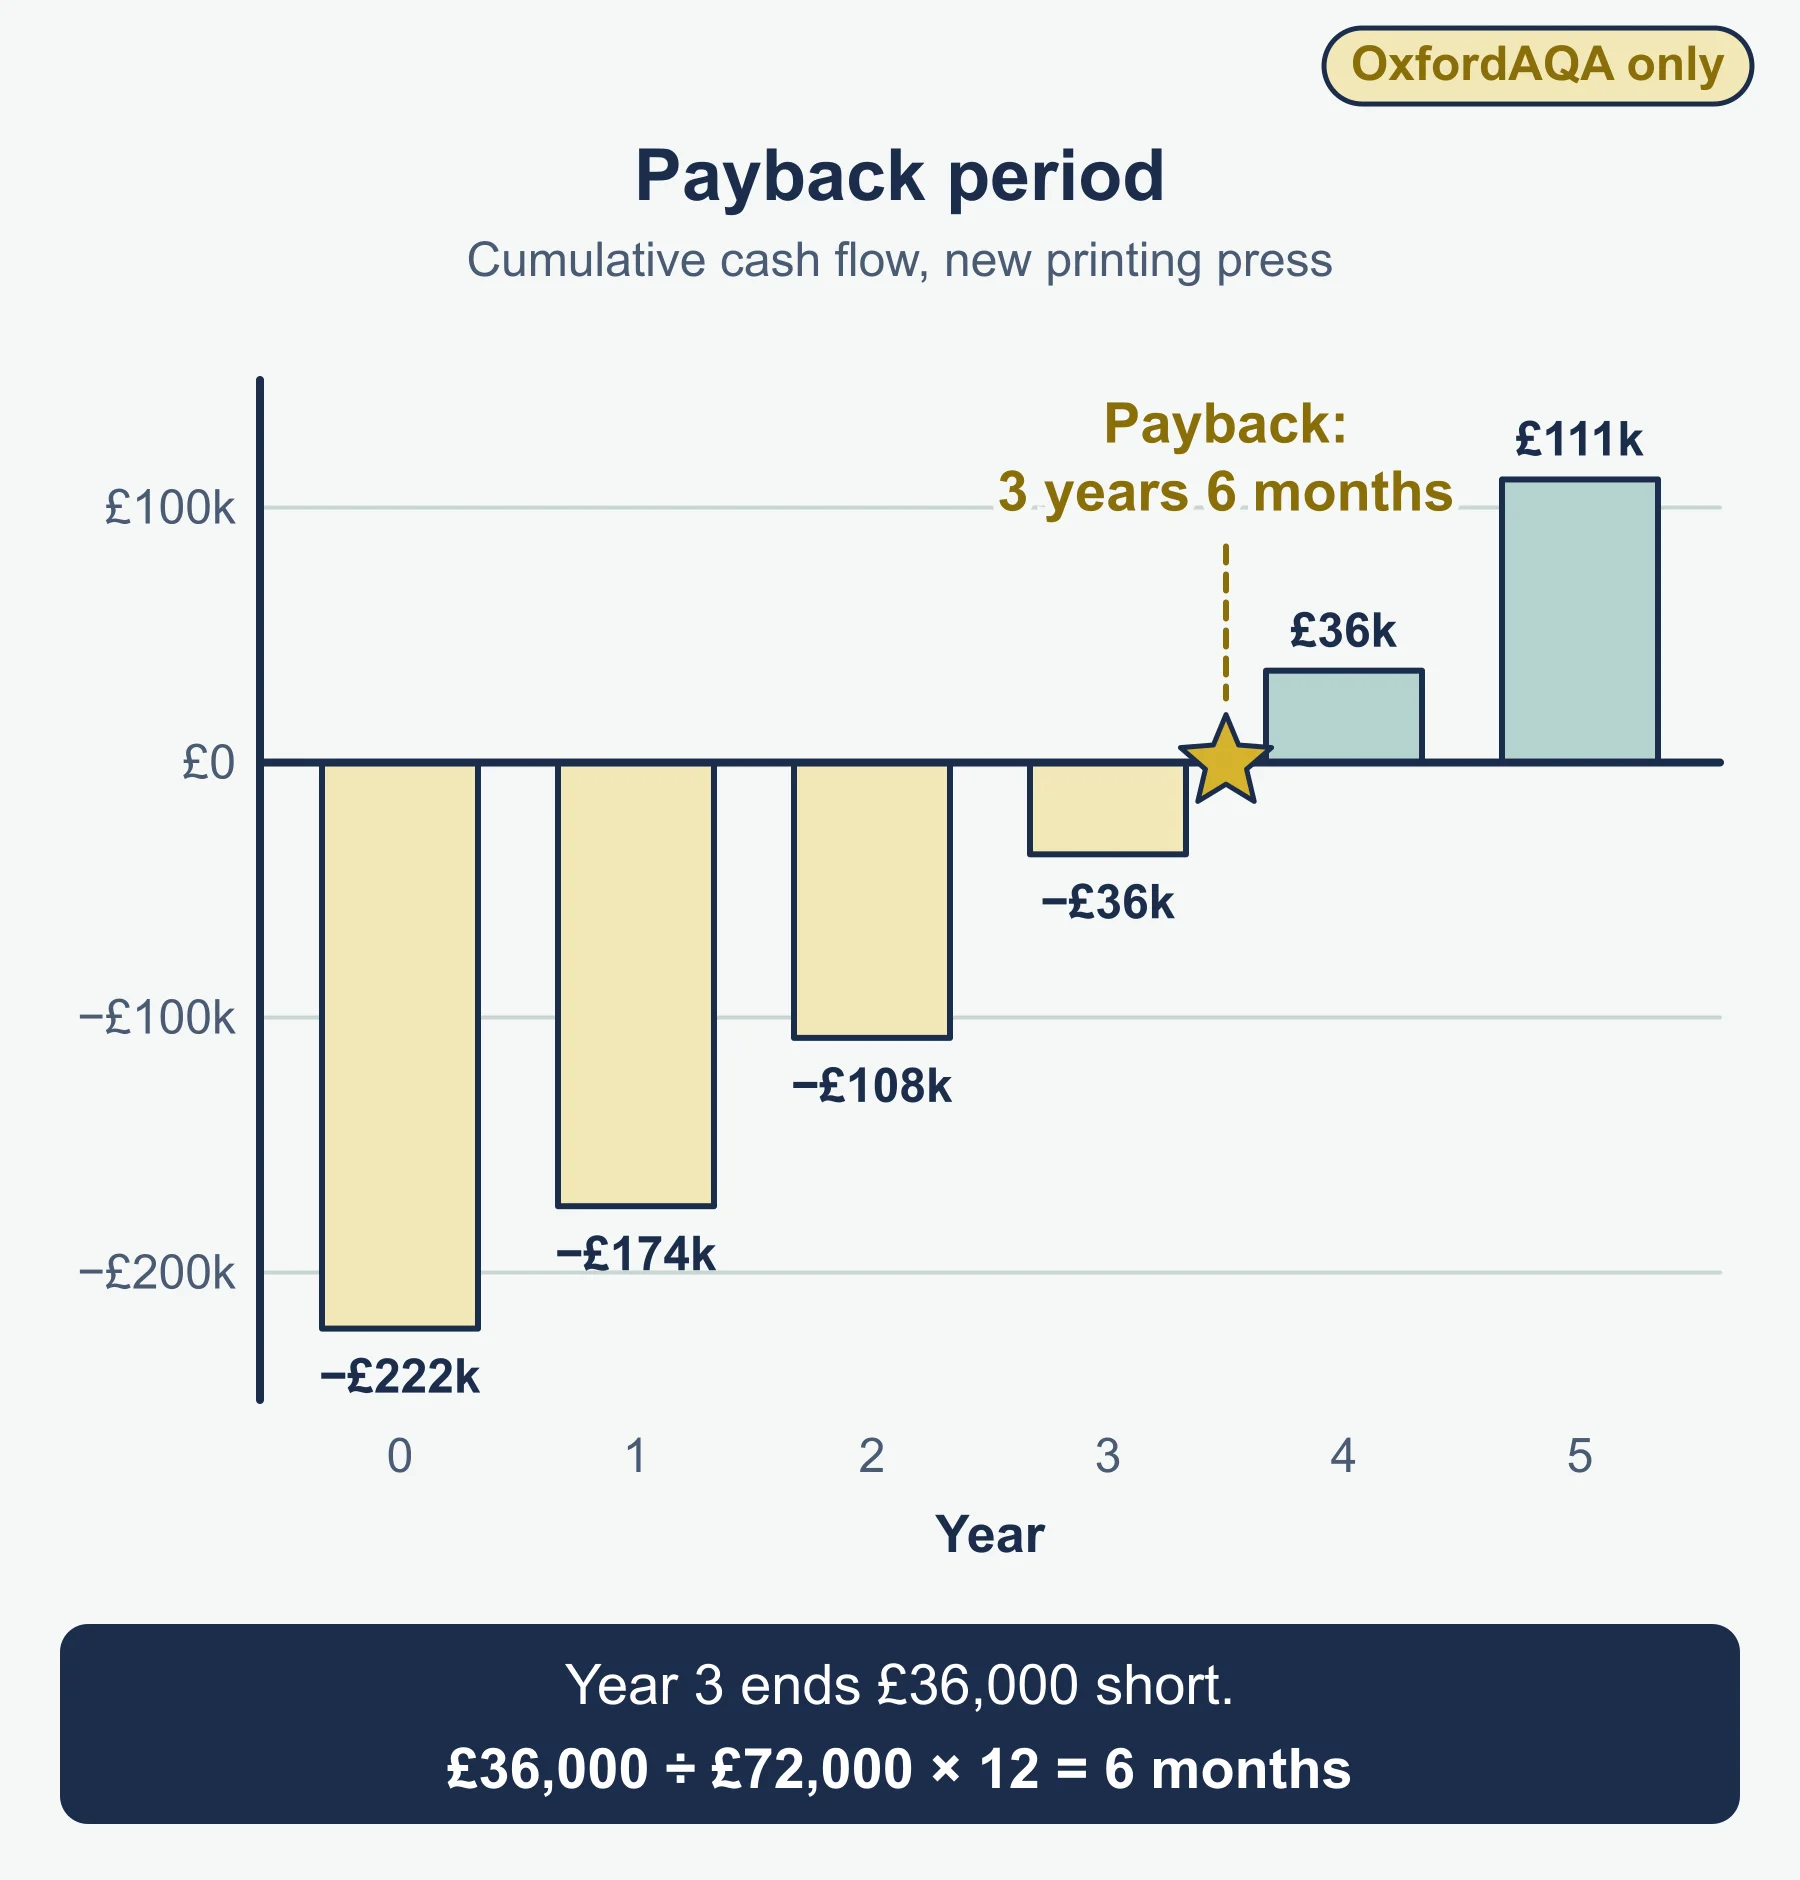
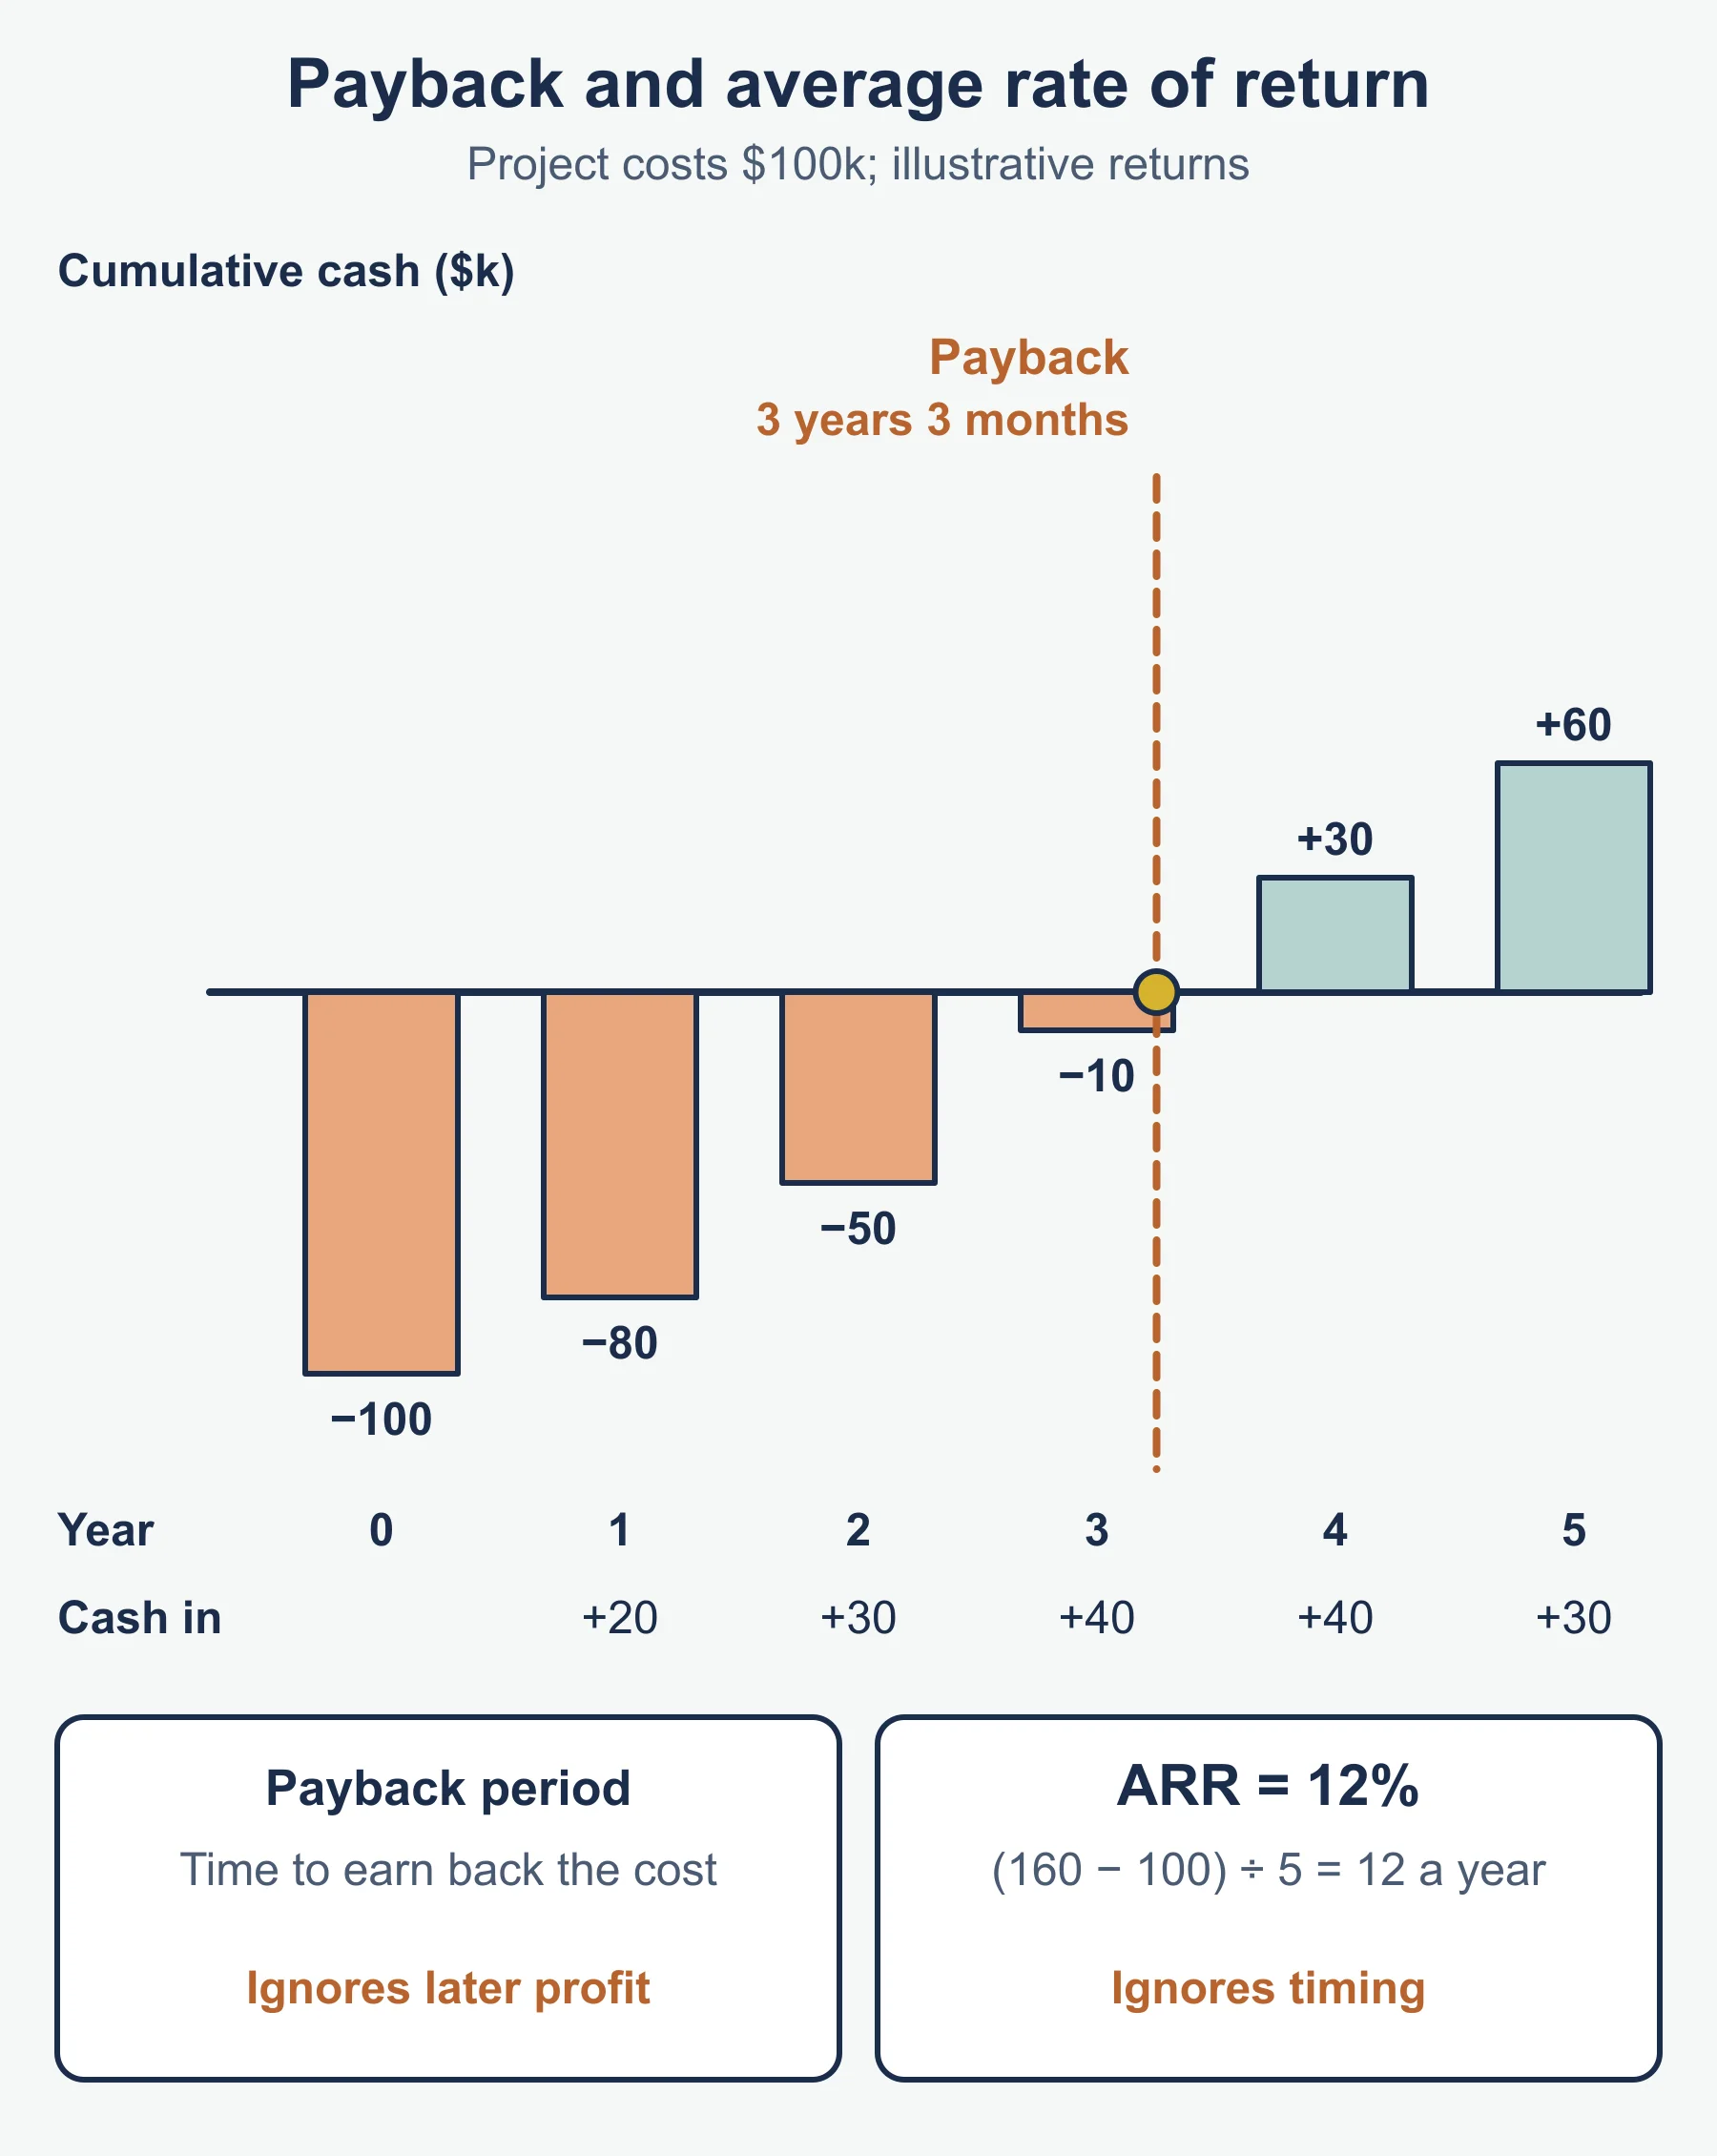
| Payback period | Time for cumulative net cash inflows to equal the initial cost | Simple; shows risk and liquidity | Ignores cash after payback and timing |
| ARR | Average annual profit divided by initial cost, as a percentage | Uses the whole project; easy to compare with a target | Ignores timing of cash |
| NPV | Sum of discounted cash inflows minus the initial cost | Uses time value of money | Needs a discount rate; harder to explain |
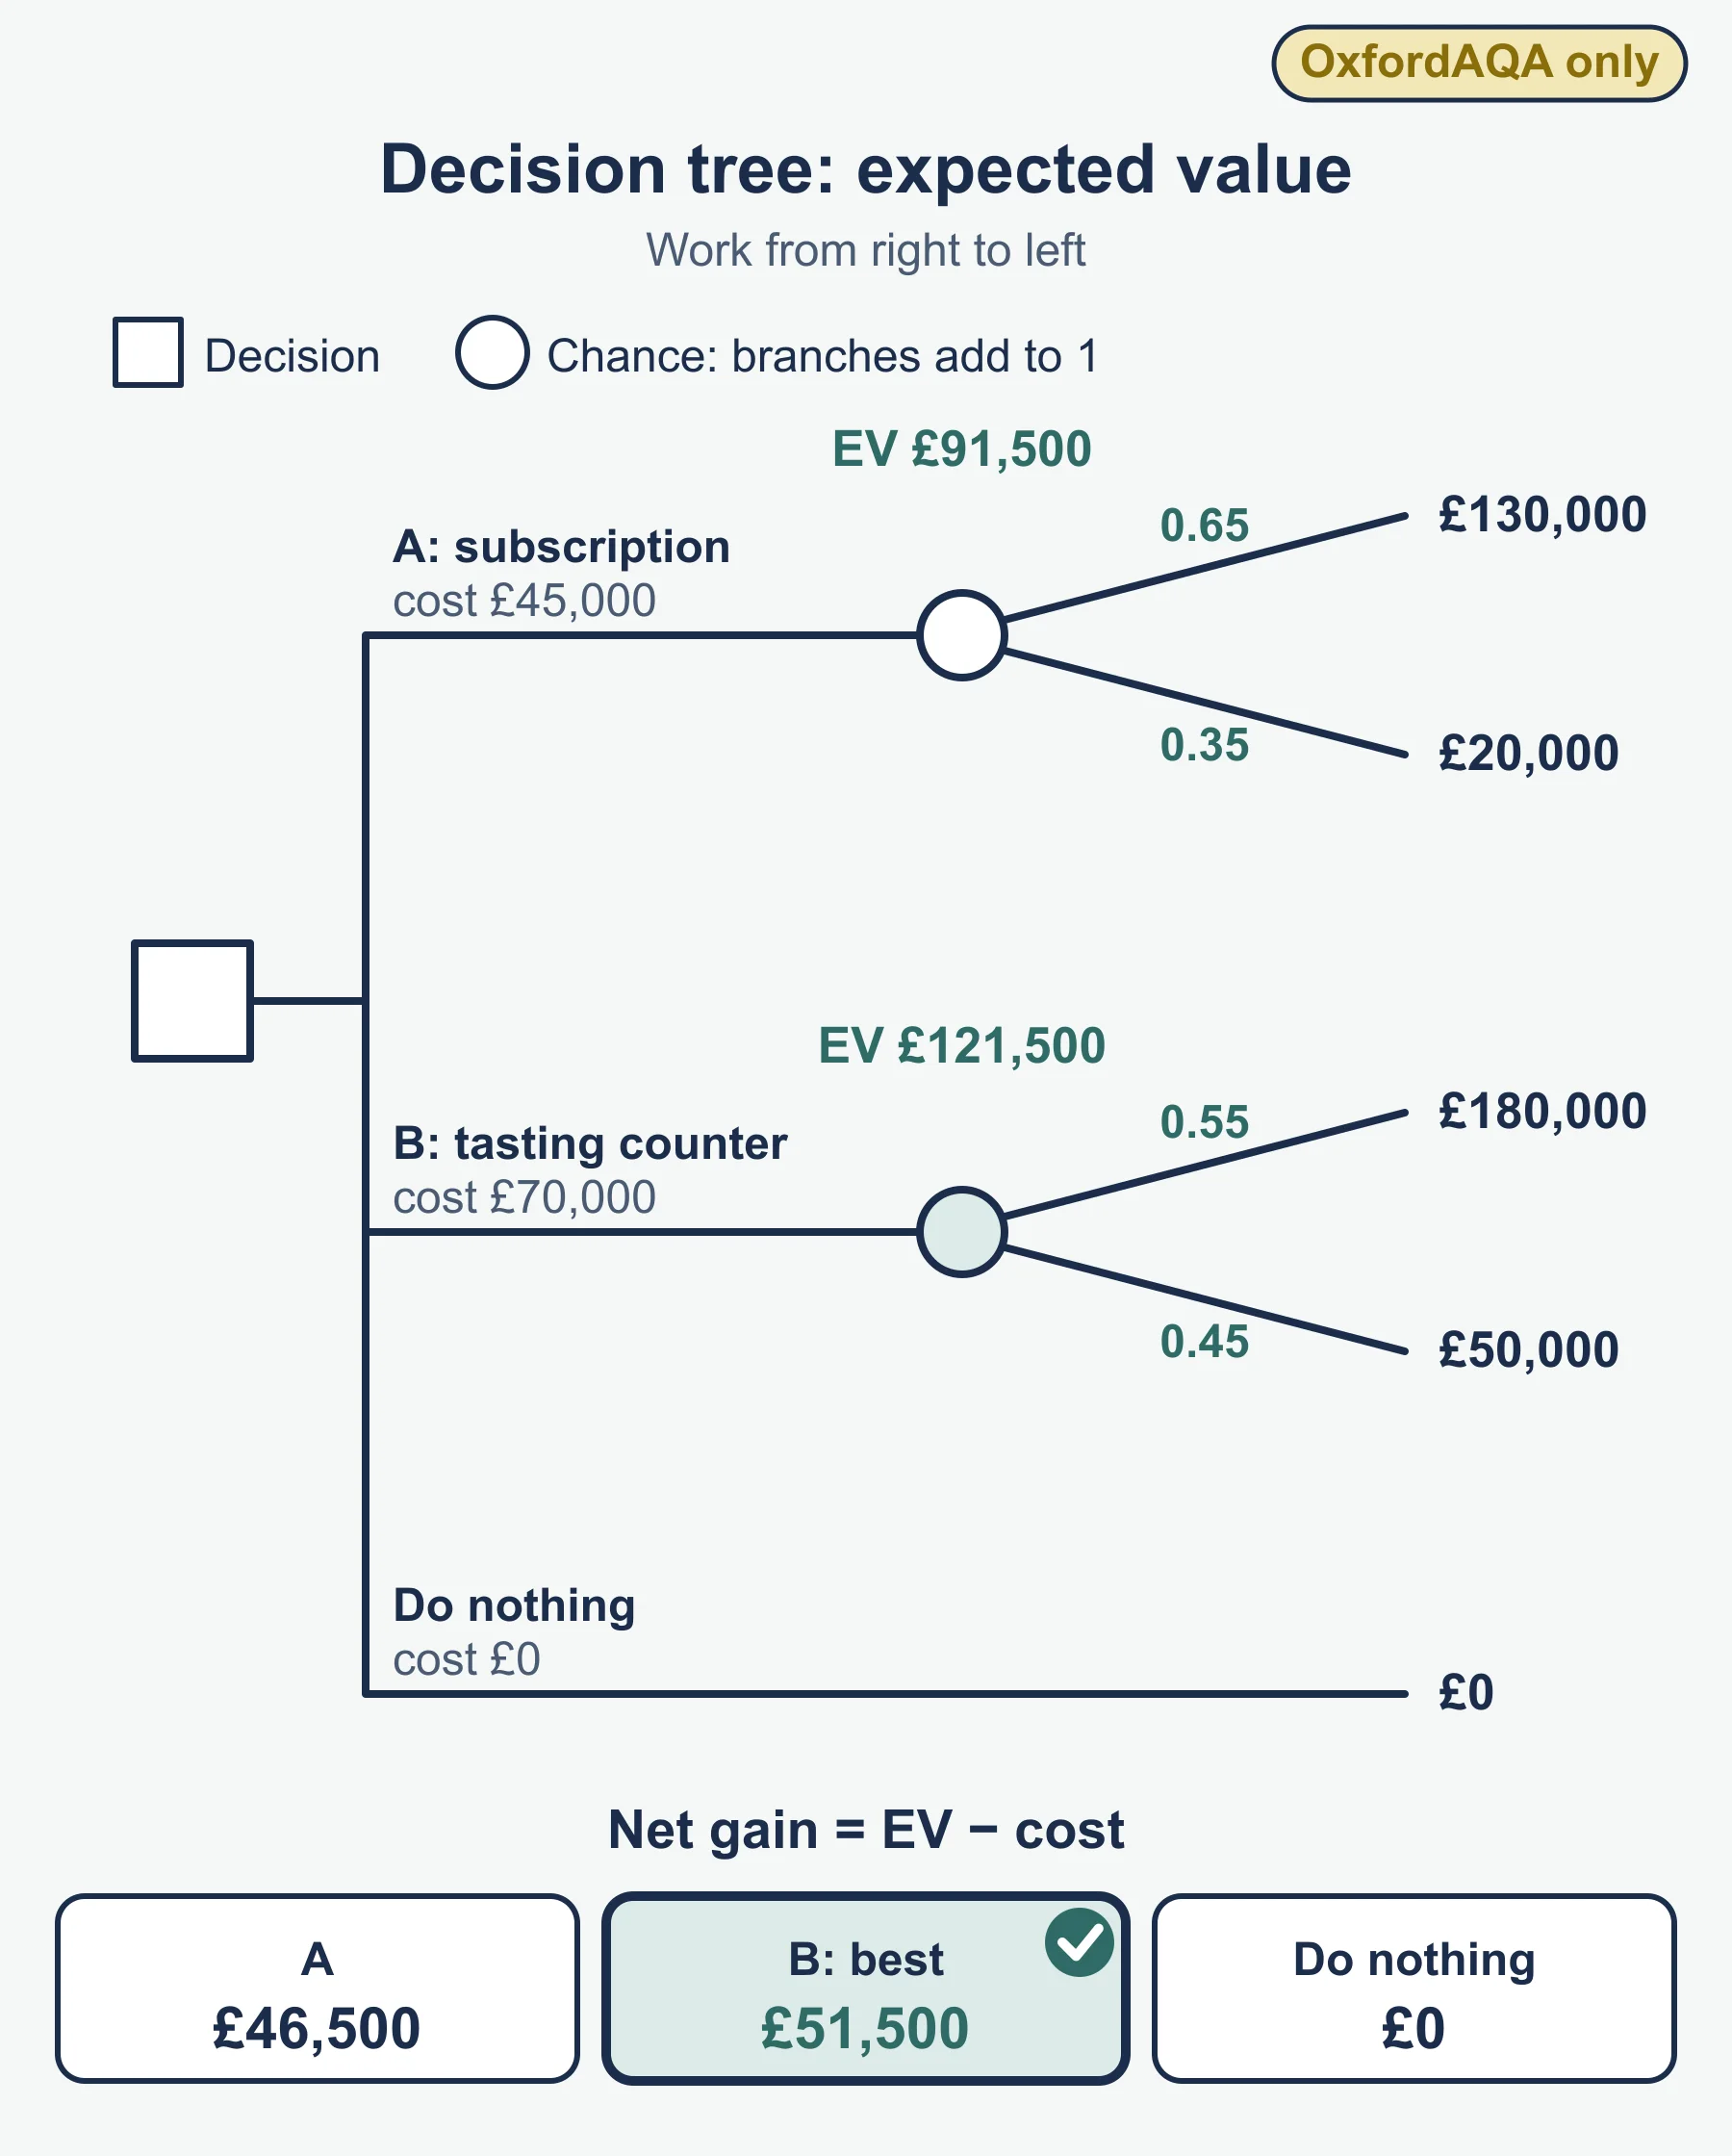
| Expected value (decision tree) | Sum of probability multiplied by outcome, less the cost | Weighs risk | Probabilities are estimates; the average may never happen |
Small worked reminder
Elmbright Garden Centres is weighing a plant subscription box. It would cost £60,000 and bring net cash inflows of £20,000, £25,000 and £30,000 in years 1 to 3.
- Payback: £45,000 returns in two years, and £15,000 of year 3’s £30,000 is needed, so 2.5 years.
- ARR: total inflows £75,000, profit £15,000, average £5,000 per year, which is 5,000 divided by 60,000 = 8.3%.
If the target payback is 3 years, the project passes. If the target ARR is 10%, it fails. That is a conflict inside the numbers. A separate decision tree gives a 0.7 chance of a £180,000 payoff and a 0.3 chance of a £40,000 loss, so expected value is 0.7 × 180,000 minus 0.3 × 40,000 = £114,000. Qualitative points then decide: is the brand a fit, can the delivery team cope, and what do gardeners think?
Method: evaluate a conflict
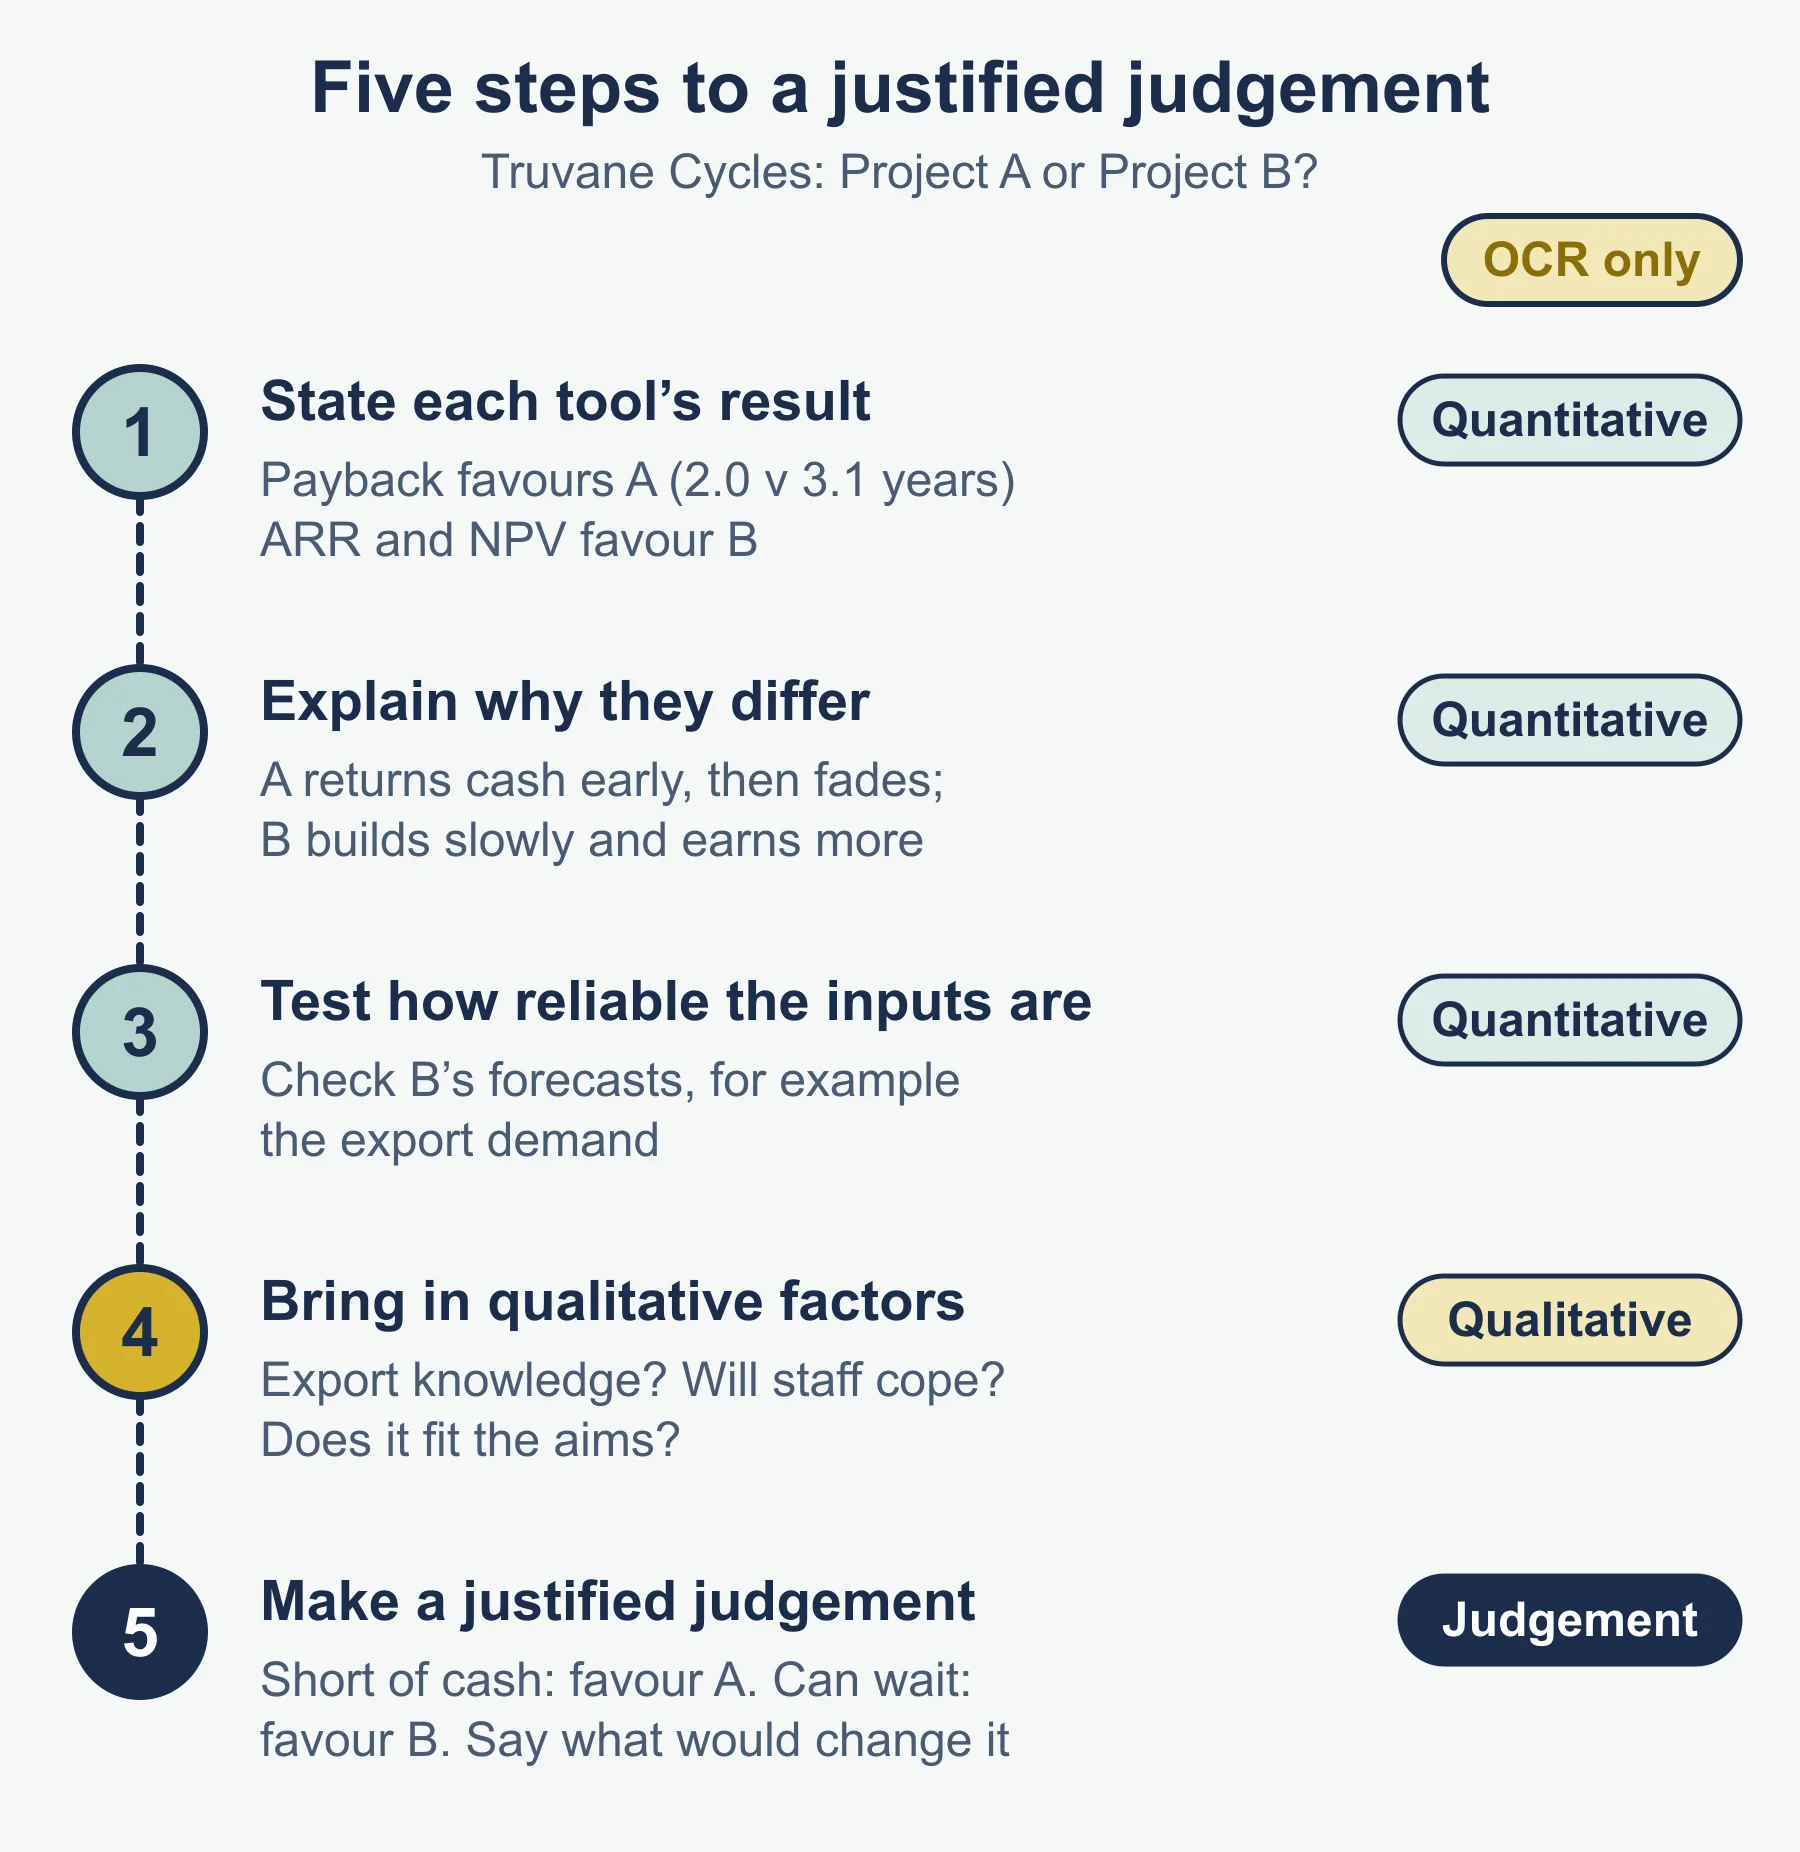
- State what each tool says.
- Explain why they differ (different measures, timing, assumptions).
- Test the reliability of the data and the sensitivity of the result.
- Add qualitative factors and stakeholders’ views.
- Judge which course of action is best and what would change it.
Evaluating decisions and likely success
- Is the proposal consistent with the aims and objectives?
- Are the forecasts realistic and who made them (possible bias)?
- Does the business have the money, skills and time?
- How will rivals, customers and the economy respond?
- What is the opportunity cost?
- What do the main stakeholders gain or lose?
Strengths and limitations of the tools (summary)
- Quantitative tools: objective in form, comparable, but depend on estimates and miss qualitative factors.
- Qualitative information: captures reputation, morale and ethics, but is subjective and hard to compare.
- Ansoff: a framework for risk, not for return.
- Decision trees: weigh probability, but the inputs are guesses.
Reasons for success or failure of a business
| Success | Failure |
|---|---|
| Strategy fits market and resources | Over-optimistic forecasts |
| Sound cash flow | Weak cash flow |
| Decisions tested with several tools | Reliance on one tool or on intuition alone |
| Risks managed and plans reviewed | Ignored warnings or poor risk management |
| Ability to adapt to change | Entering unfamiliar markets unprepared |
Model paragraph for a conflict question
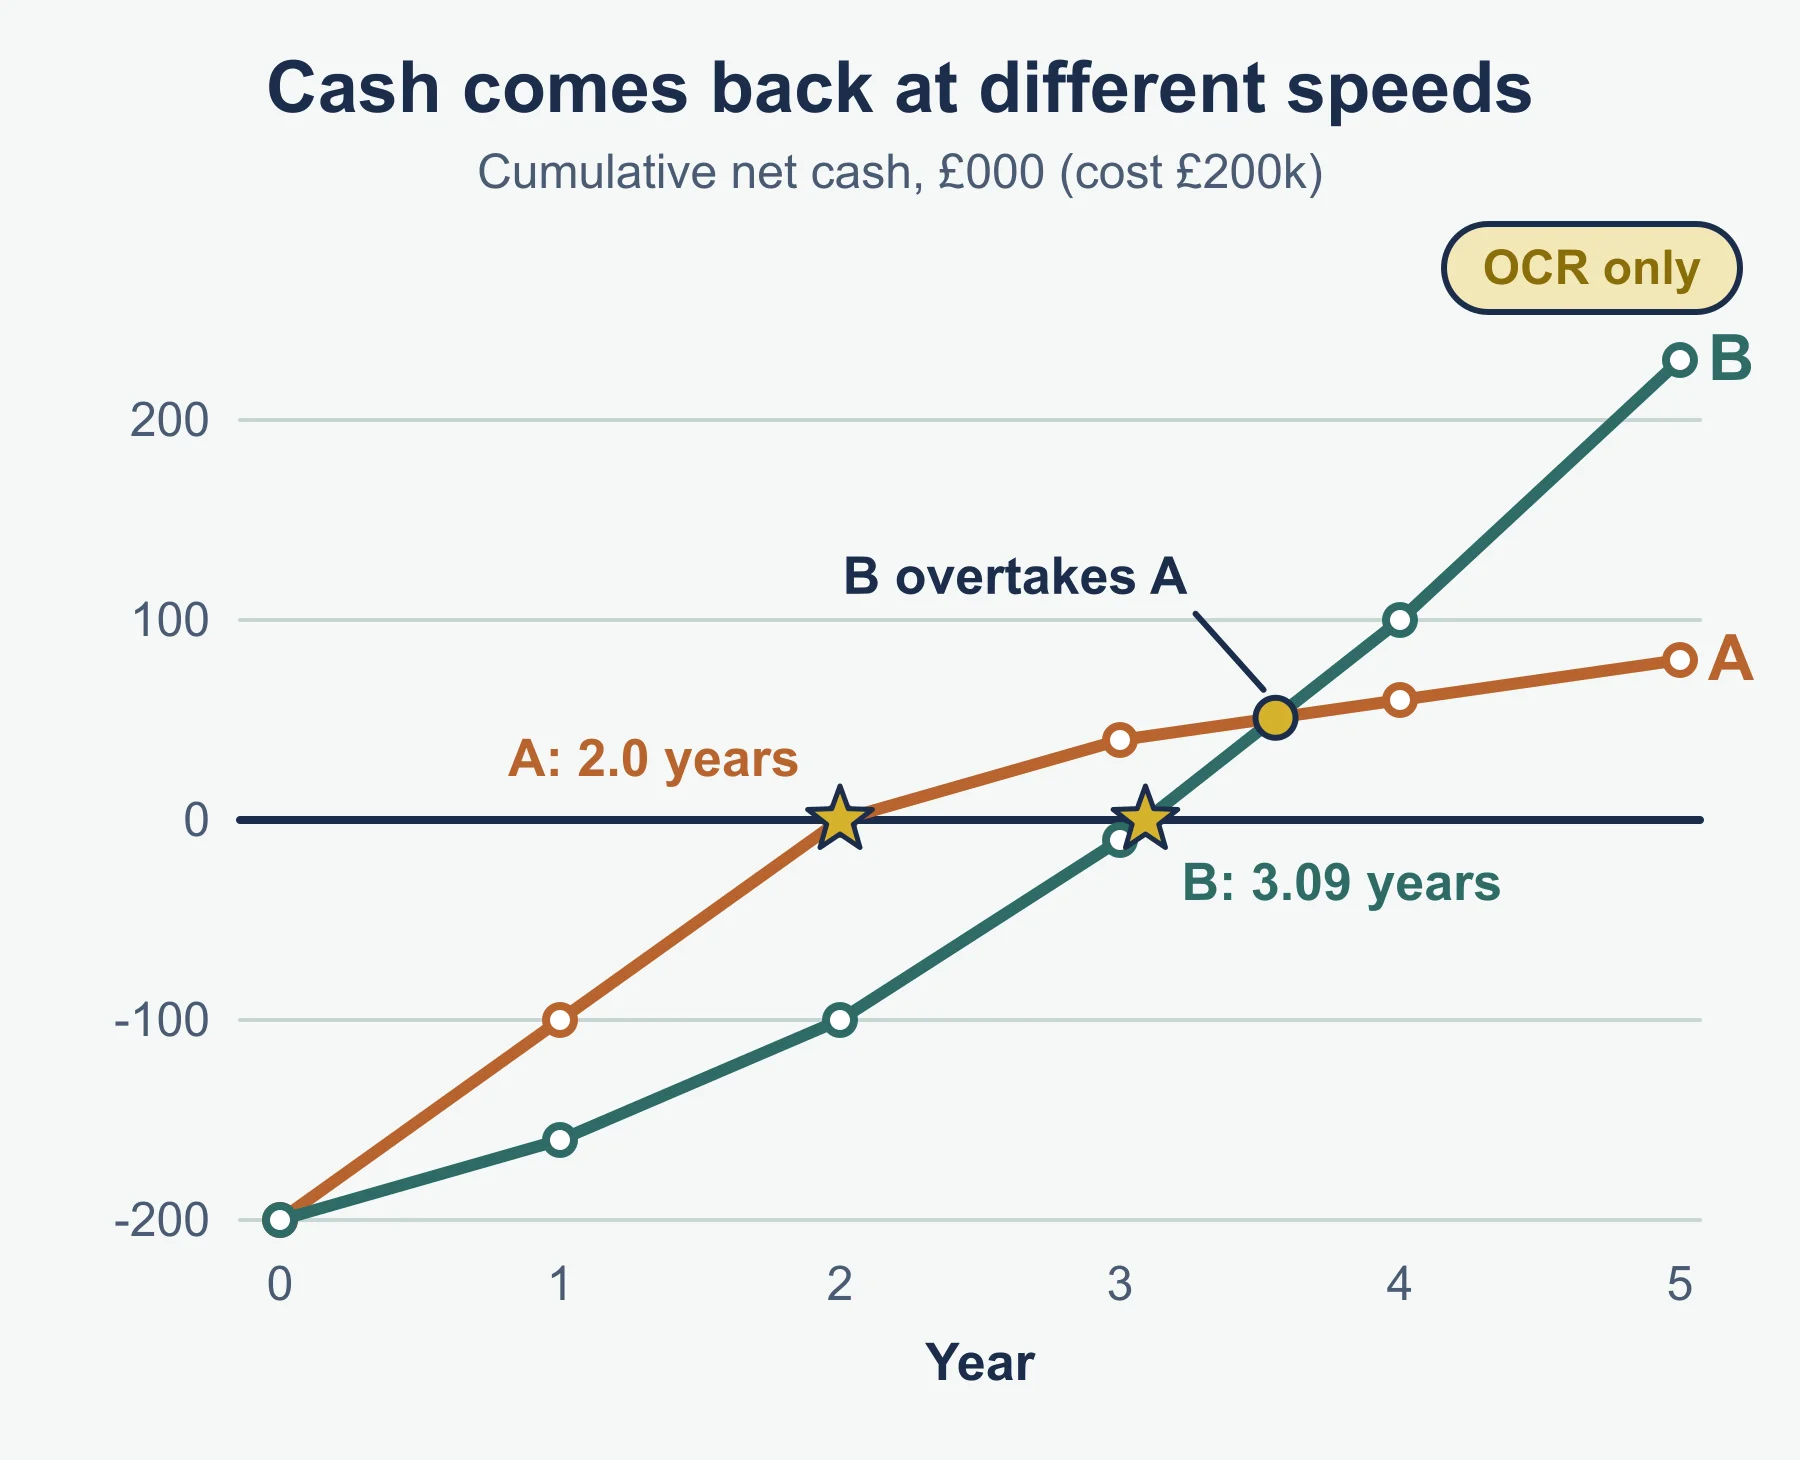
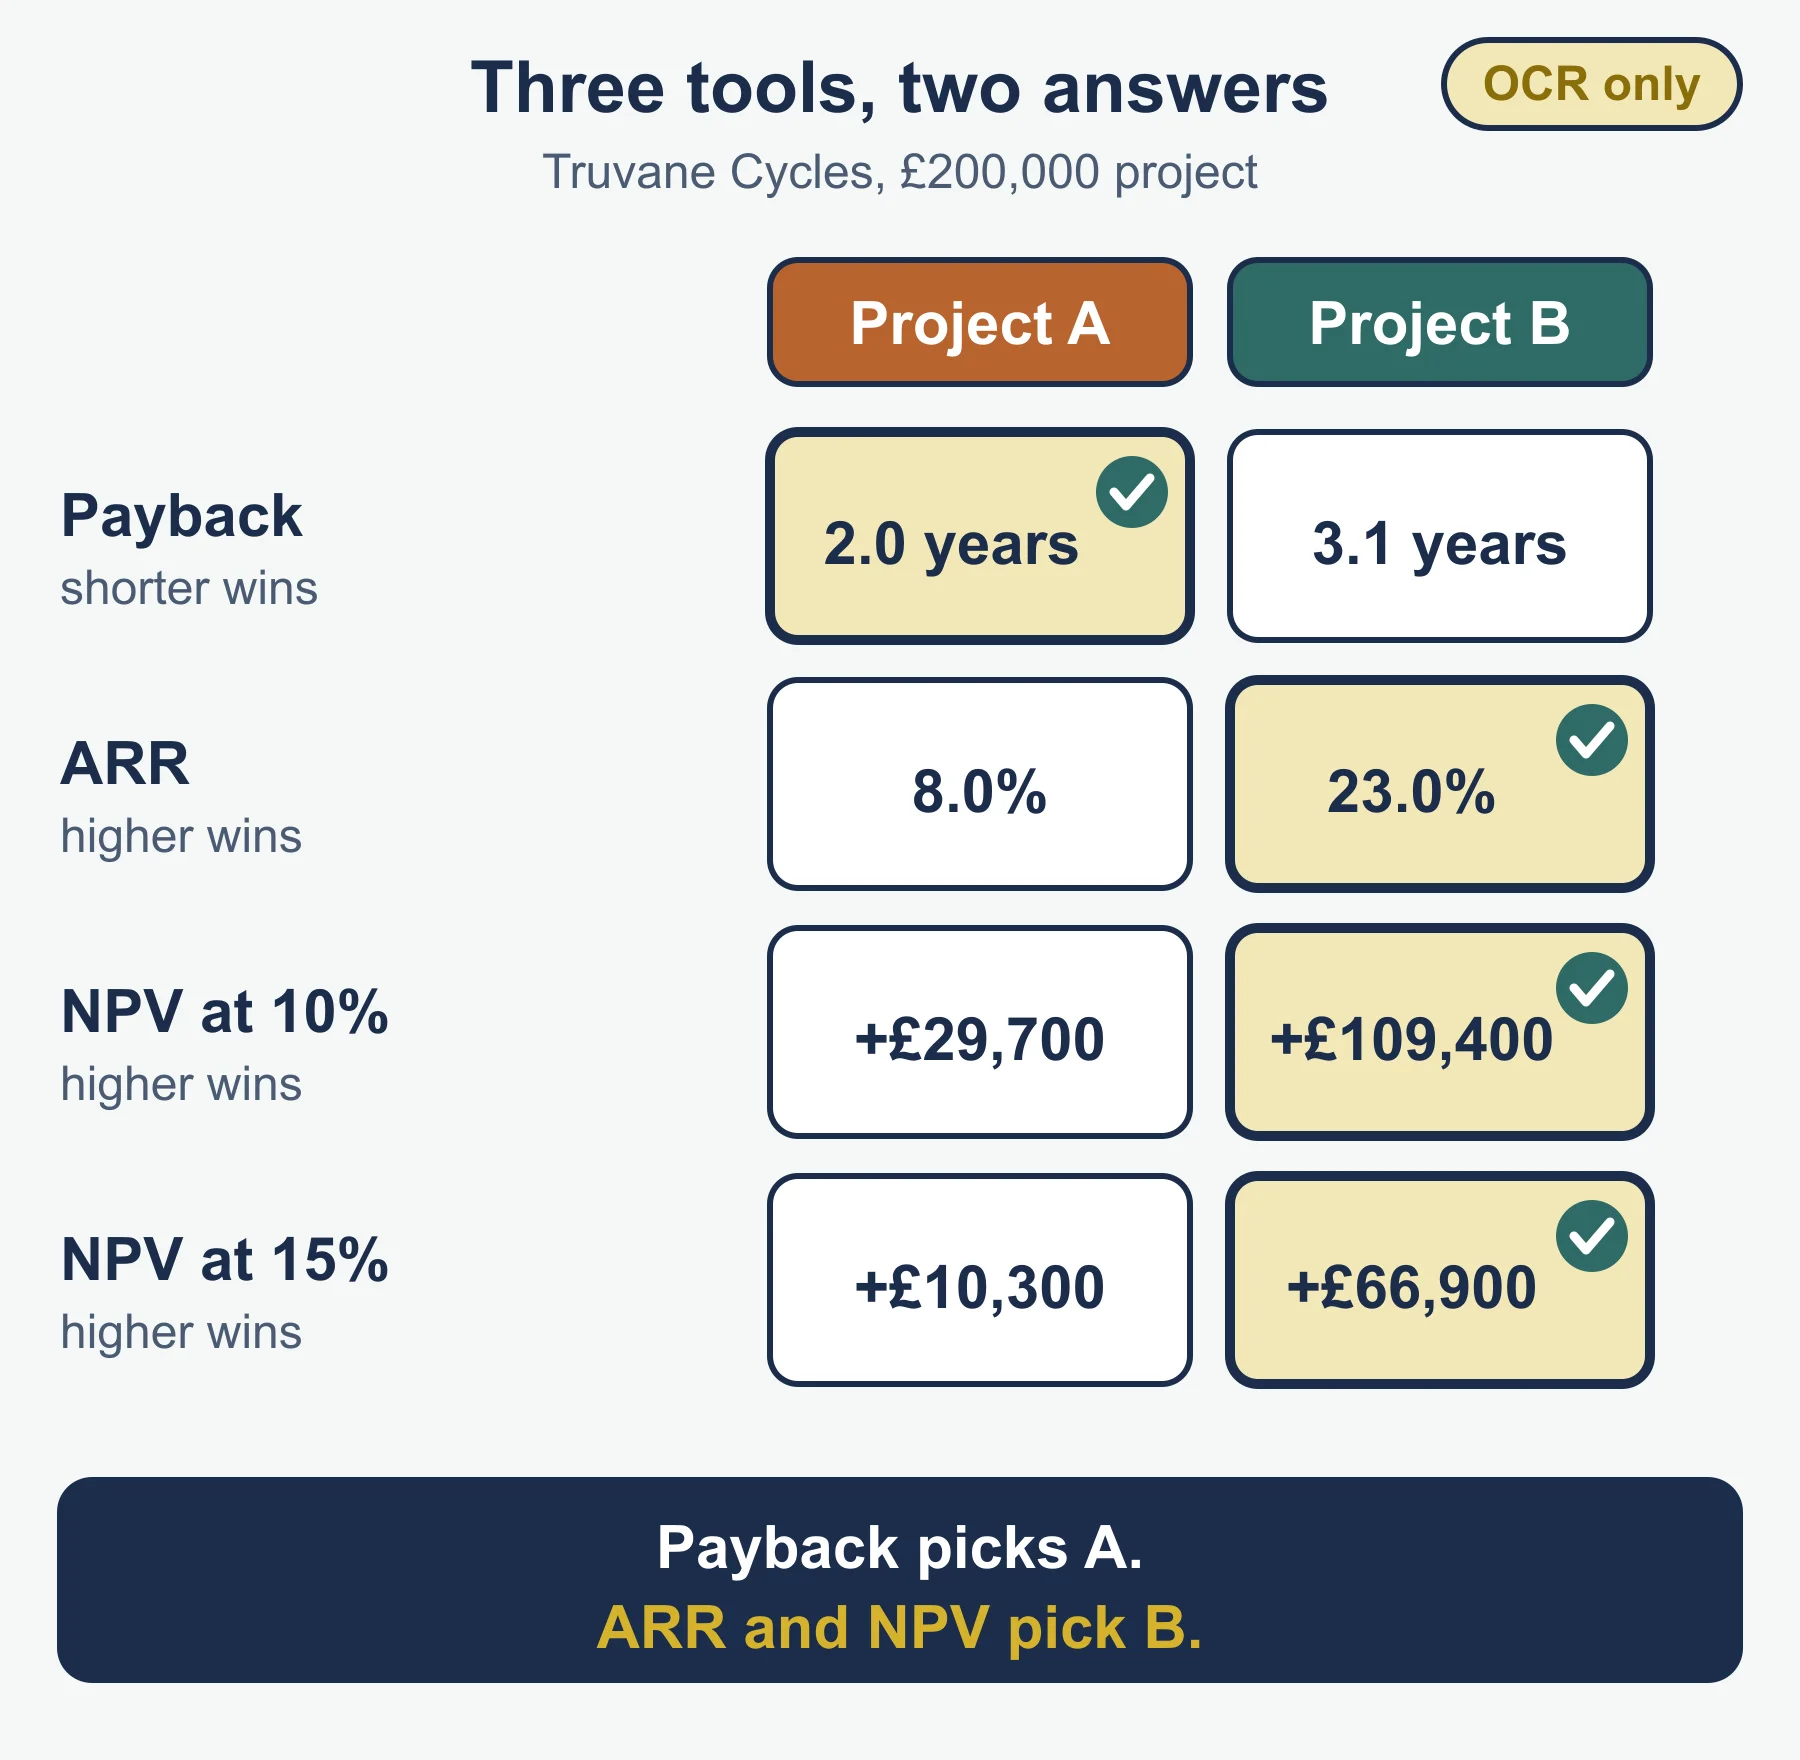
Use a chain: point, evidence, reason, consequence, judgement. For example: “Payback favours the accessories project because it returns the cash in two years (evidence). NPV favours the export bike because its later cash flows are larger even after discounting (evidence). The tools conflict because payback ignores what happens after the cost is recovered, while NPV values the whole project (reason). If the business is short of cash, the quicker payback may matter more, but if it can wait, the higher NPV is stronger (consequence). On balance I would back the export bike, provided the demand forecast is tested first (judgement).”
Which tool for which question
| If the question asks about | Lead with | Then add |
|---|---|---|
| Growth options and their risk | Ansoff’s matrix | Cost, resources, stakeholders |
| Speed of recovering cash | Payback | NPV for total value |
| Value of a project over its life | NPV | ARR and qualitative fit |
| A choice under uncertain outcomes | Decision tree expected value | The reliability of the probabilities |
| Whether a business is succeeding | Financial and non-financial measures | Stakeholders’ views |
Must-know distinctions
- Market development (new market, same product) against product development (new product, same market).
- Related diversification against unrelated diversification.
- Quantitative against qualitative information.
- Quantifiable risk against unquantifiable risk.
- Payback (speed) against NPV (value).
Quick self-test
- Name the Ansoff quadrant for an existing product in a new market.
- Which quadrant is usually the riskiest, and why?
- State two examples of market penetration strategies.
- Give one stakeholder who loses if a diversification fails, and how.
- Give two limitations of Ansoff’s matrix.
- A project costs £80,000 and returns £30,000 a year for four years. Calculate the payback period.
- For the same project, calculate the ARR.
- A decision tree option costs £150,000. It has a 0.4 chance of a £500,000 payoff and a 0.6 chance of £100,000. Calculate the net expected value.
- Give two reasons why payback and NPV may rank projects differently.
- Why might a project with a positive NPV still be rejected?
Answers
- Market development.
- Diversification, because both the product and the market are unfamiliar, so uncertainties combine.
- For example, a loyalty scheme and more advertising (or price promotions, or buying a rival).
- For example, employees may lose their jobs, or lenders may not be repaid.
- For example, it gives no financial figures and ignores the size of the reward, resources and competitors’ reactions.
- 80,000 divided by 30,000 = 2.67 years, about 2 years 8 months.
- Total inflows £120,000, profit £40,000, average £10,000 a year; 10,000 divided by 80,000 = 12.5%.
- Expected value is 0.4 × 500,000 + 0.6 × 100,000 = £260,000; minus the cost of £150,000 gives £110,000.
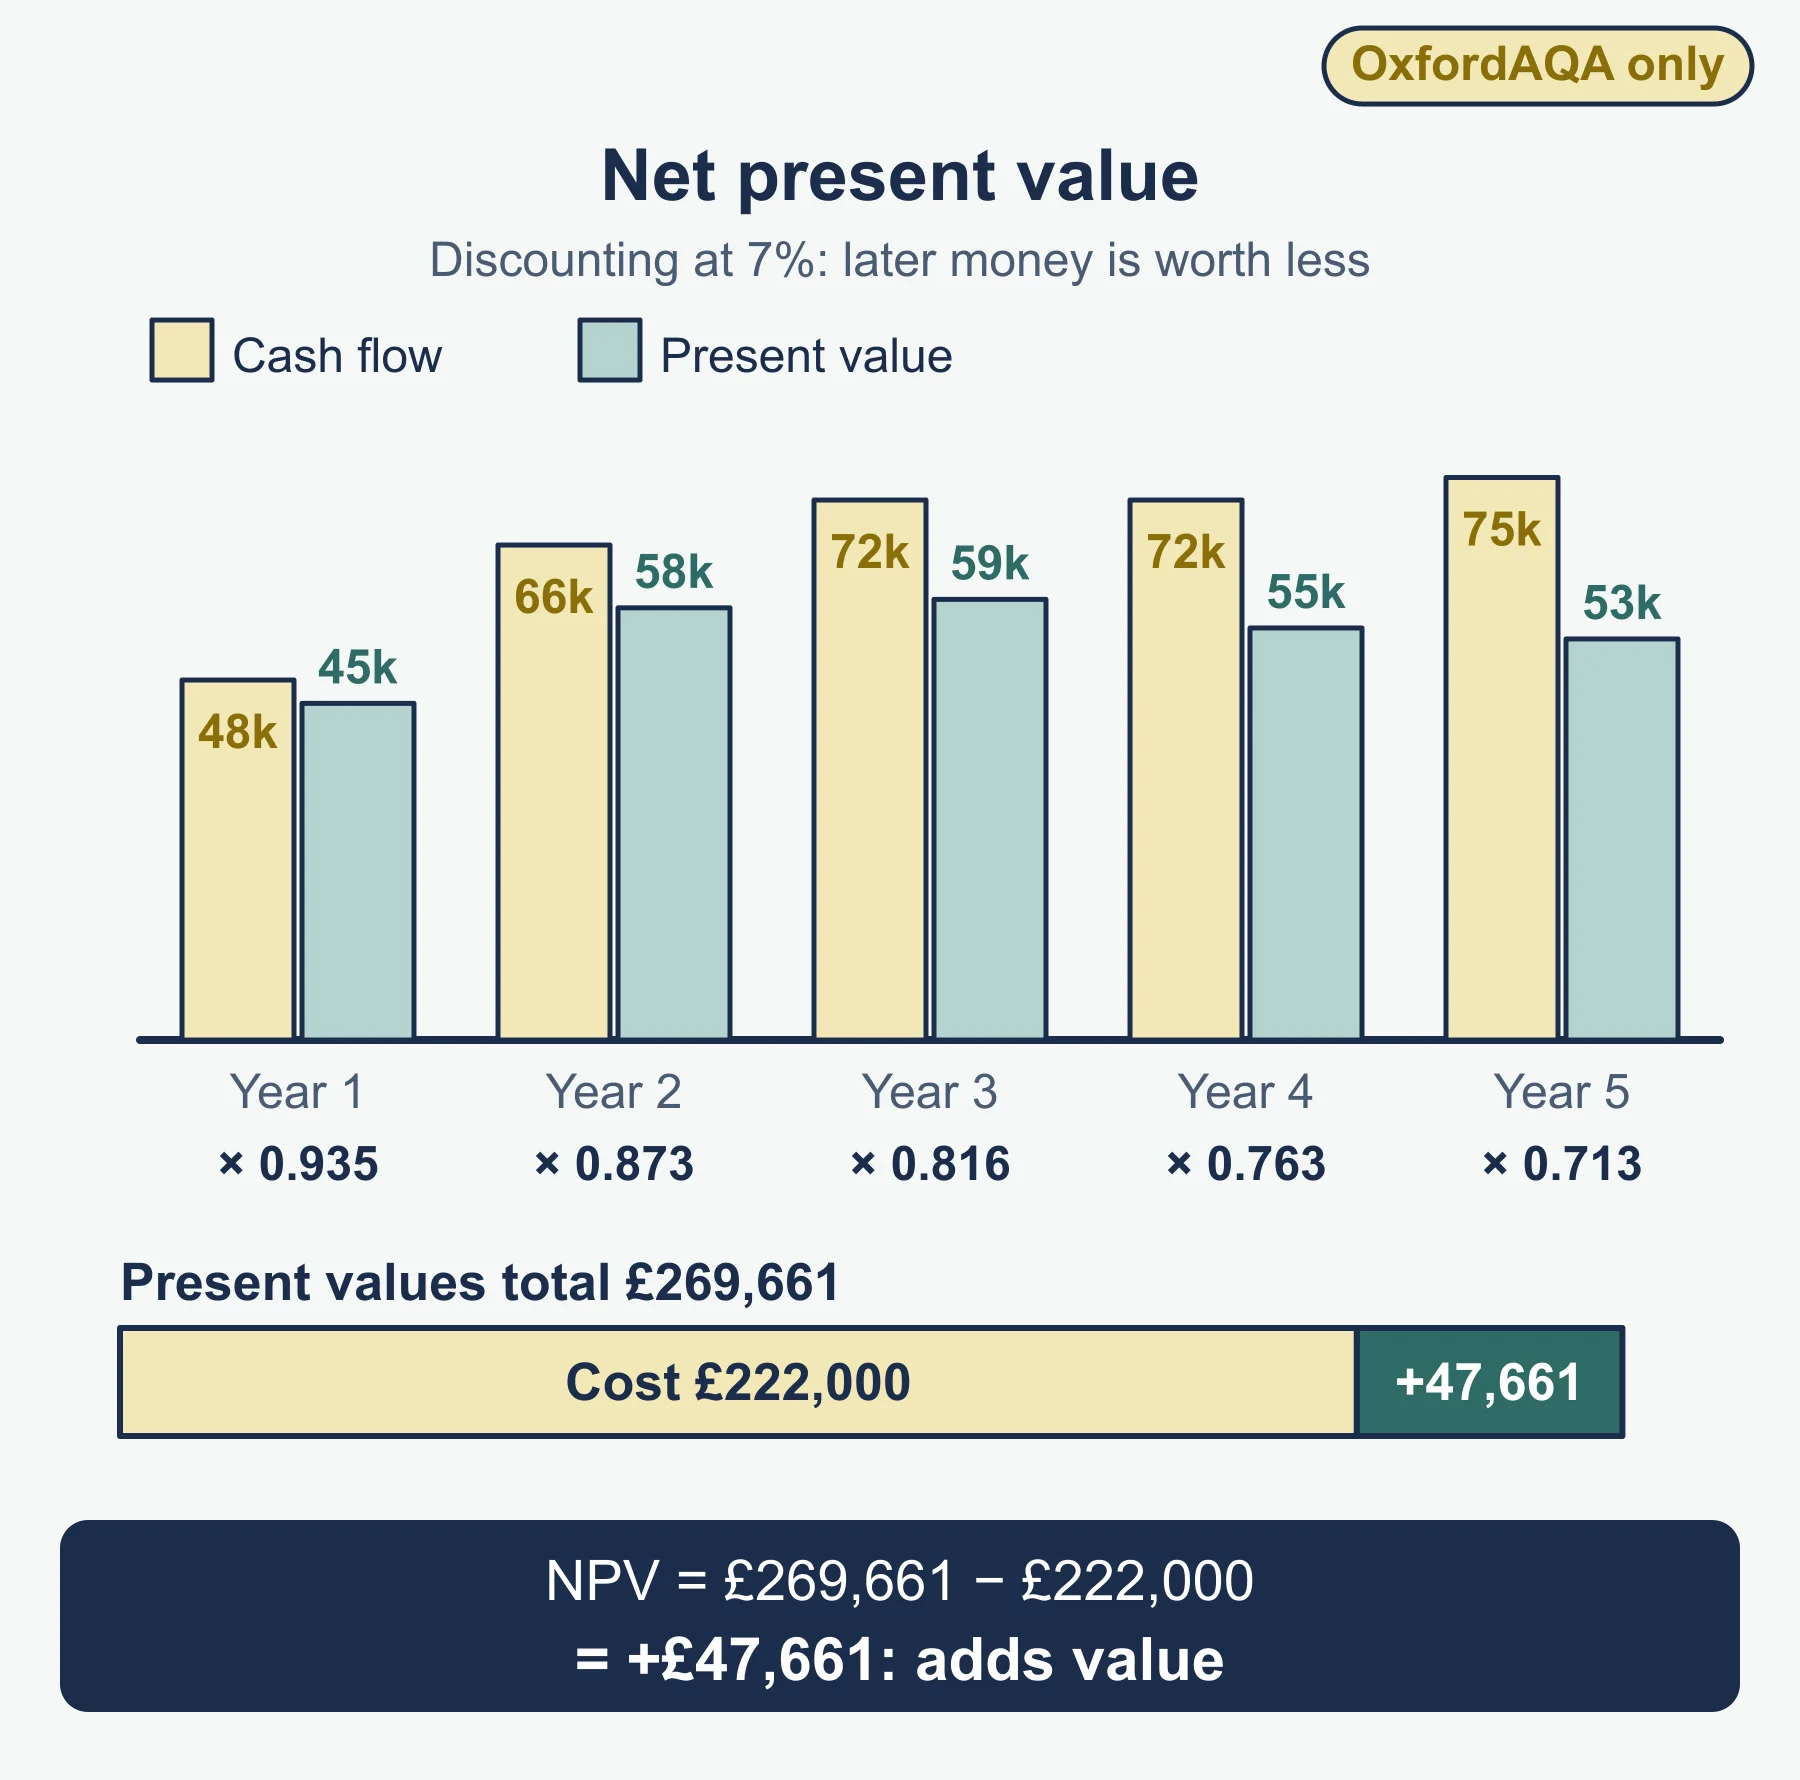
- Payback ignores cash after the payback point and does not discount; NPV values all cash flows in today’s money.
- For example, a poor fit with the mission, damage to reputation, lack of skills, an unreliable forecast, or better uses of the money.
Where marks are usually lost
- Naming the quadrants without applying them to the business in the case.
- Saying diversification is risky with no reason.
- Describing a stakeholder effect with no link to the strategy.
- Giving a recommendation with no reason for rejecting the other options.
- Calculating payback, ARR or NPV but not interpreting the result against a target.
- Treating a conflict between tools as a mistake instead of explaining the cause.
- Ignoring qualitative factors, or treating them as an afterthought.
- Concluding with a list of points and no judgement.
Frequently asked questions
Why is diversification the riskiest Ansoff strategy? Diversification means selling new products in new markets, so the business has no direct experience of either side. Risk rises the further a business moves from the products and markets it knows.
Is a conflict between payback, ARR and NPV a mistake? No. The tools measure different things and treat time differently, so they can rank projects differently. Explain the cause of the conflict rather than treating it as an error.
Should you compare investment appraisal results with a target? Yes. Calculating payback, ARR or NPV without comparing the result with the business’s target, such as a maximum payback period, leaves the figure uninterpreted.
What are the limitations of decision trees? The probabilities are often guesses, and the expected value is an average that may never actually occur.
Official syllabus
OCR, Advanced GCE in Business (H431) specification, Version 2.1 (January 2026), for first assessment in 2017: Business objectives and strategy, content points Ansoff’s matrix and Conflicts in business decision making.
Get free revision emails (optional)
Occasional emails with practice questions, worked explanations and links to free resources for the qualification and subjects you choose. No spam, and you can unsubscribe from any email. The free tools on this site never need an email.
Related resources
-
Study guides
OCR A Level Business: Contingency planning and crisis management (H431)
Study guide to contingency planning and crisis management for OCR A Level Business H431: purpose, evaluation, recommending a plan, with worked examples.
Business · OCR · A Level
Read guide -
Practice questions
OCR A Level Business: Contingency planning and crisis management (H431) – Practice Questions
Original practice questions with worked answers on contingency planning and crisis management for OCR A Level Business H431, including short cases.
Business · OCR · A Level
Try questions -
Revision notes
OCR A Level Business: Contingency planning and crisis management (H431) – Revision Notes
Condensed revision notes on contingency planning and crisis management for OCR A Level Business H431, with a quick self-test and common mark losses.
Business · OCR · A Level
Revise topic
Related articles
-
teaching
A Level tuition in Dubai: Cambridge or Pearson Edexcel International A Level?
Schools in Dubai and Abu Dhabi teach either Cambridge International AS & A Level or Pearson Edexcel International A Level. How the two are structured, why it matters for tuition, and how online classes from Lahore work.
9 October 2026
-
curriculum guides
Choosing subjects at IGCSE and A Level
How subject choices at 14 and 16 affect university options later, and how to keep pathways open without overloading a timetable.
28 July 2026
Studying this with a teacher
Working through Business A LEVELS?
This page is free and stays free. If you would rather be taught it, Marlbridge runs Business classes one-to-one, online in your own time zone. One-to-one only for this course: Rs 6,000 per class in Pakistan, with other currencies on the fees page. The first trial class is free. WhatsApp replies within an hour (8am–11pm Pakistan time, every day); email the same day.
OCR Business teachers at Marlbridge
