
Revision Notes
OCR A Level Business: Operational strategy (H431) – Revision Notes
Condensed OCR A Level Business (H431) revision notes on operational strategy: definitions, formulas, method steps, self-test and common errors.
- Subject
- Business
- Level
- A LEVELS
- Topic
- Operational strategy
- Author
- Marlbridge Academic Team
- Updated
- Reviewed by
- Salman Ahmad (what this means)
Aligned to OCR A Level Business (H431), Version 2.1 (January 2026), for first assessment in 2017; final assessment summer 2027. Official specification .
Syllabus page (what it covers and how it is assessed): OCR A Level Business.
Syllabus points this page covers
H431
- 4 Operational strategy (whole topic)
Found an error? Report a correction.
Need help with this topic? Request a free trial class for A Level Business (H431).
These notes condense topic 4, Operational strategy, from the OCR A Level Business (H431) specification, Version 2.1 (January 2026), with final assessment in summer 2027. For full explanations and worked examples read the study guide, then test yourself with the practice questions. The course hub is OCR A Level Business, the printable list is the checklist, and the free diagnostics show where to start.
Formulas (standard forms)
| Measure | Formula |
|---|---|
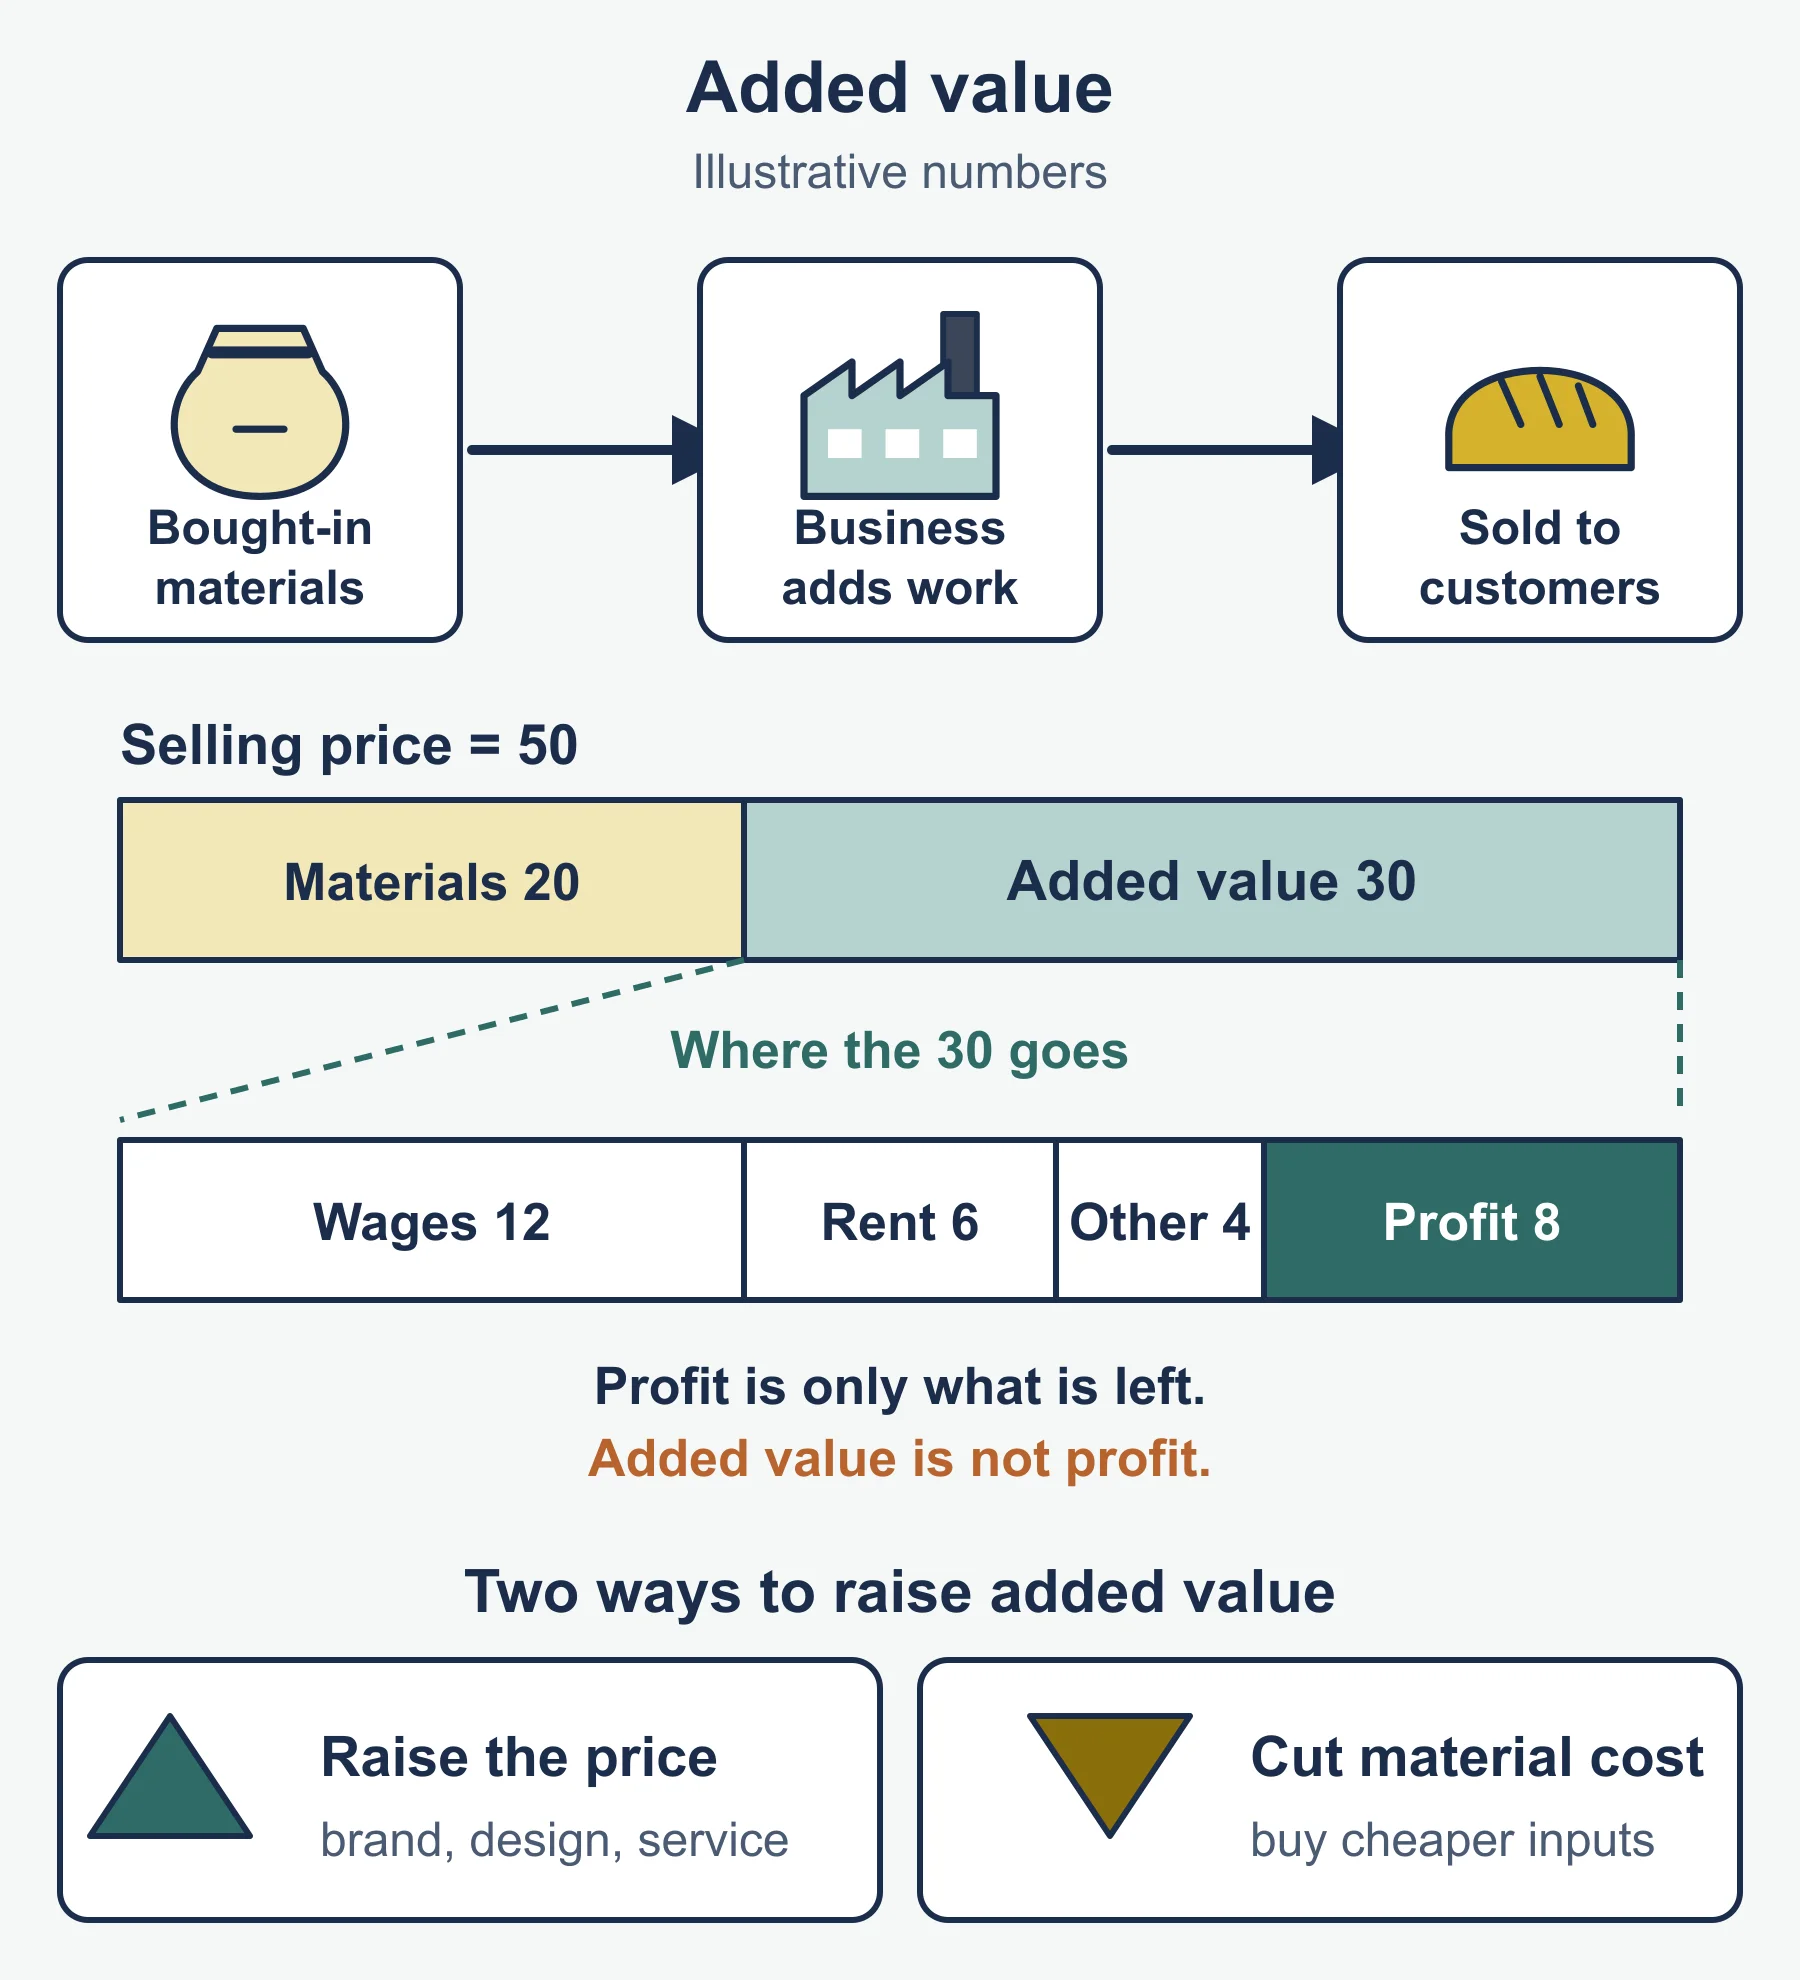
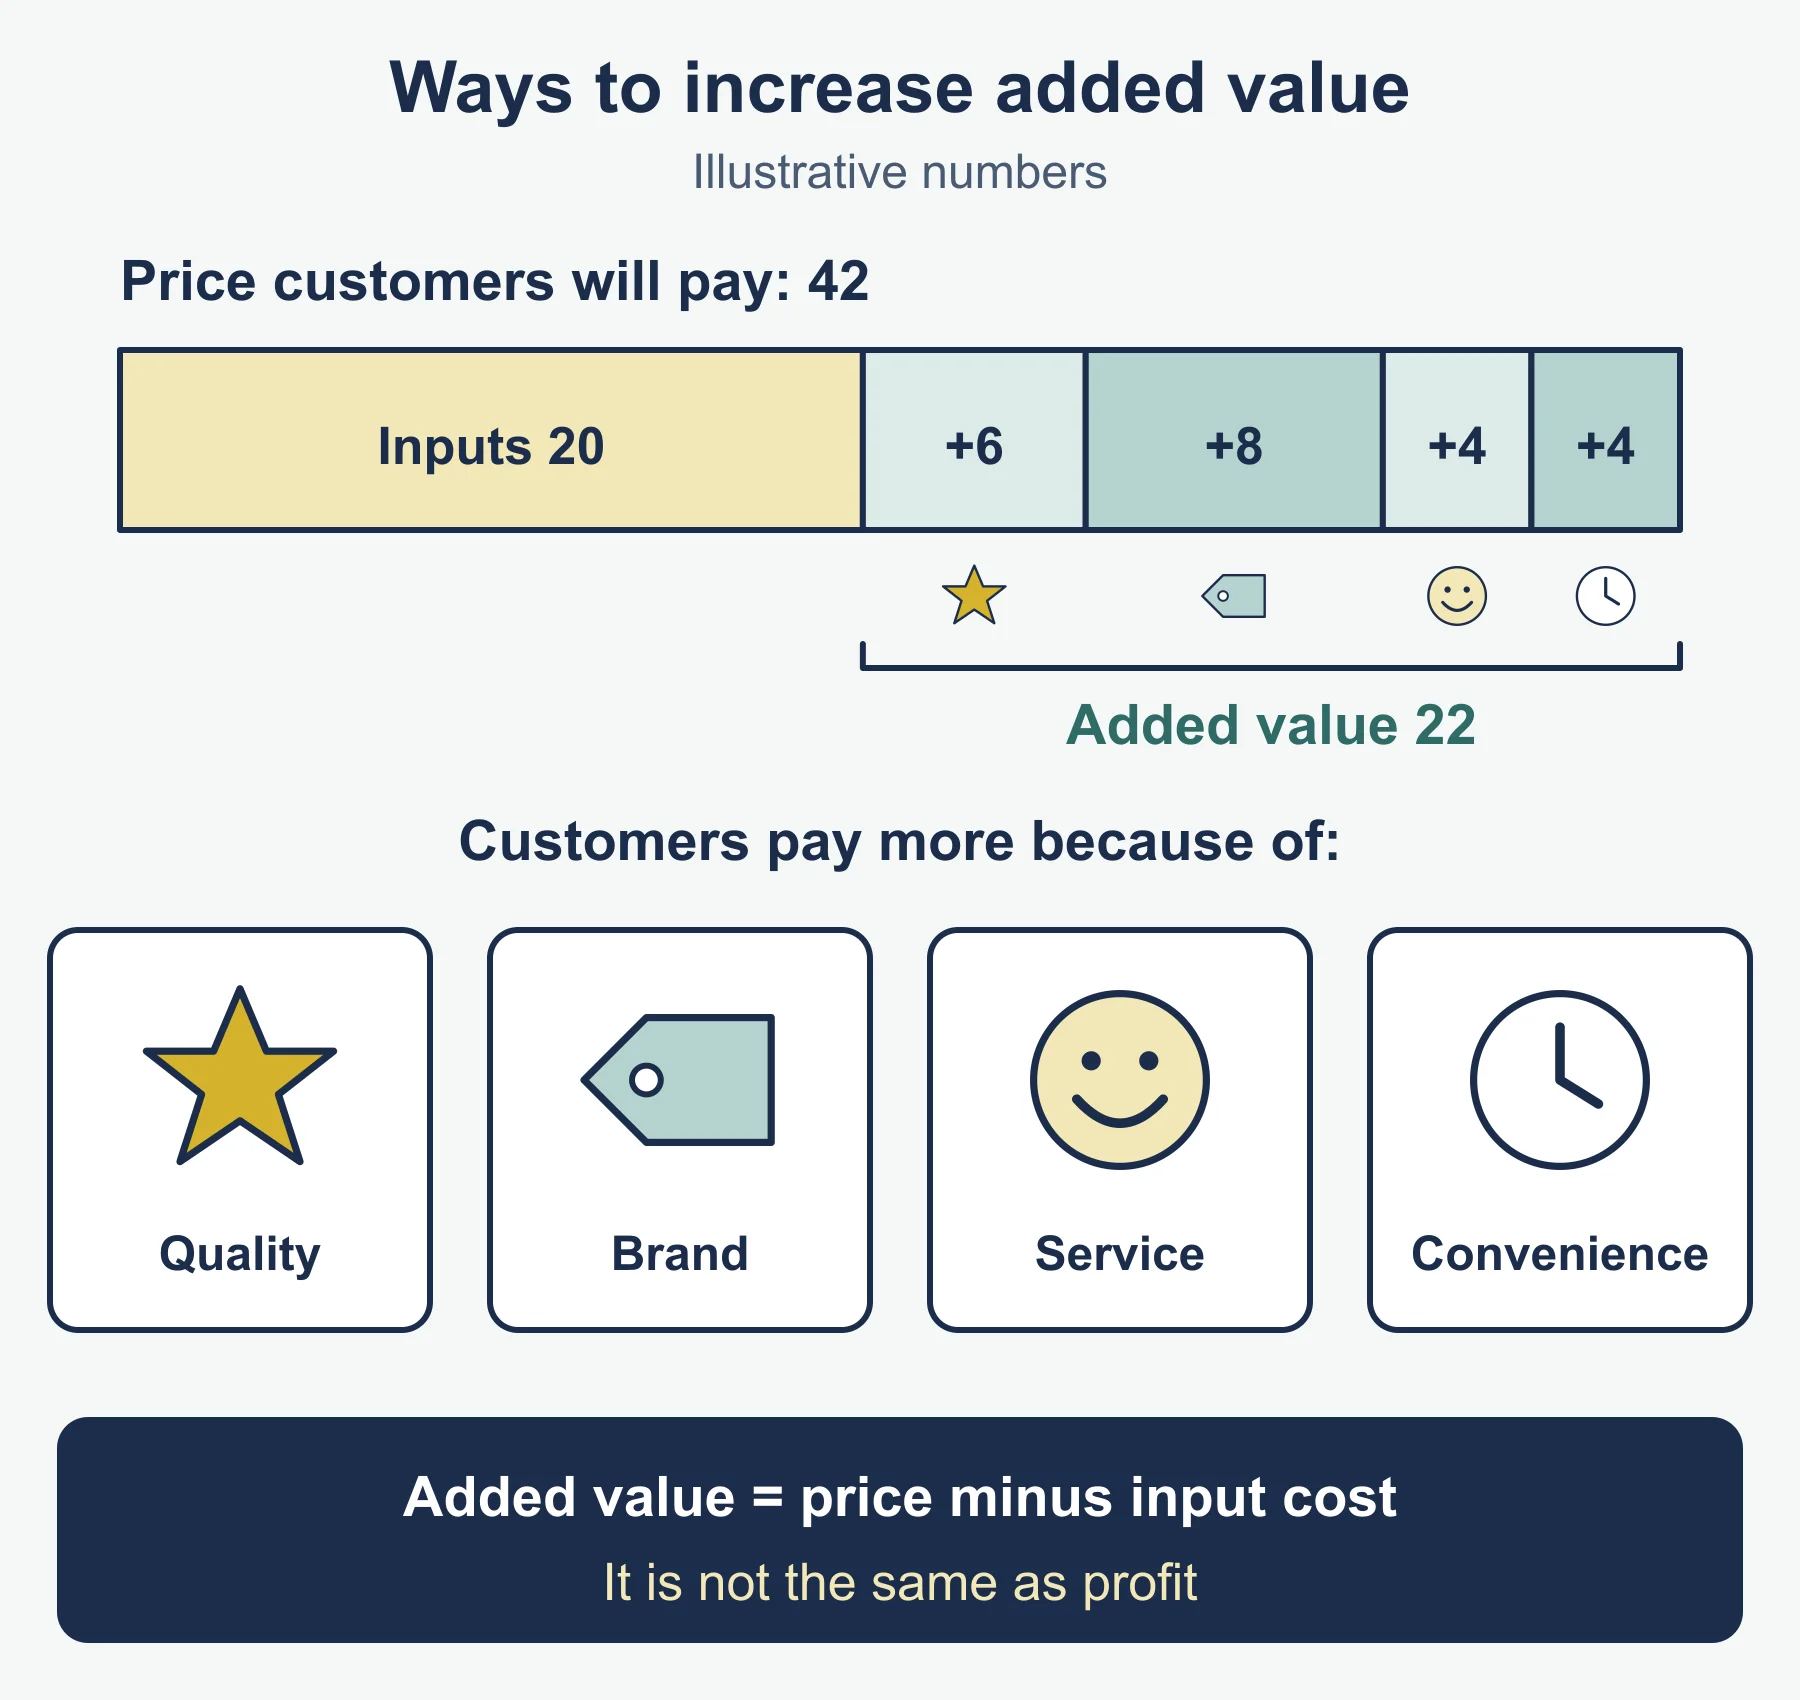
| Added value | Selling price - cost of bought-in materials and services |
| Labour productivity | Output / number of employees (or hours) |
| Capacity utilisation | Actual output / maximum output x 100 |
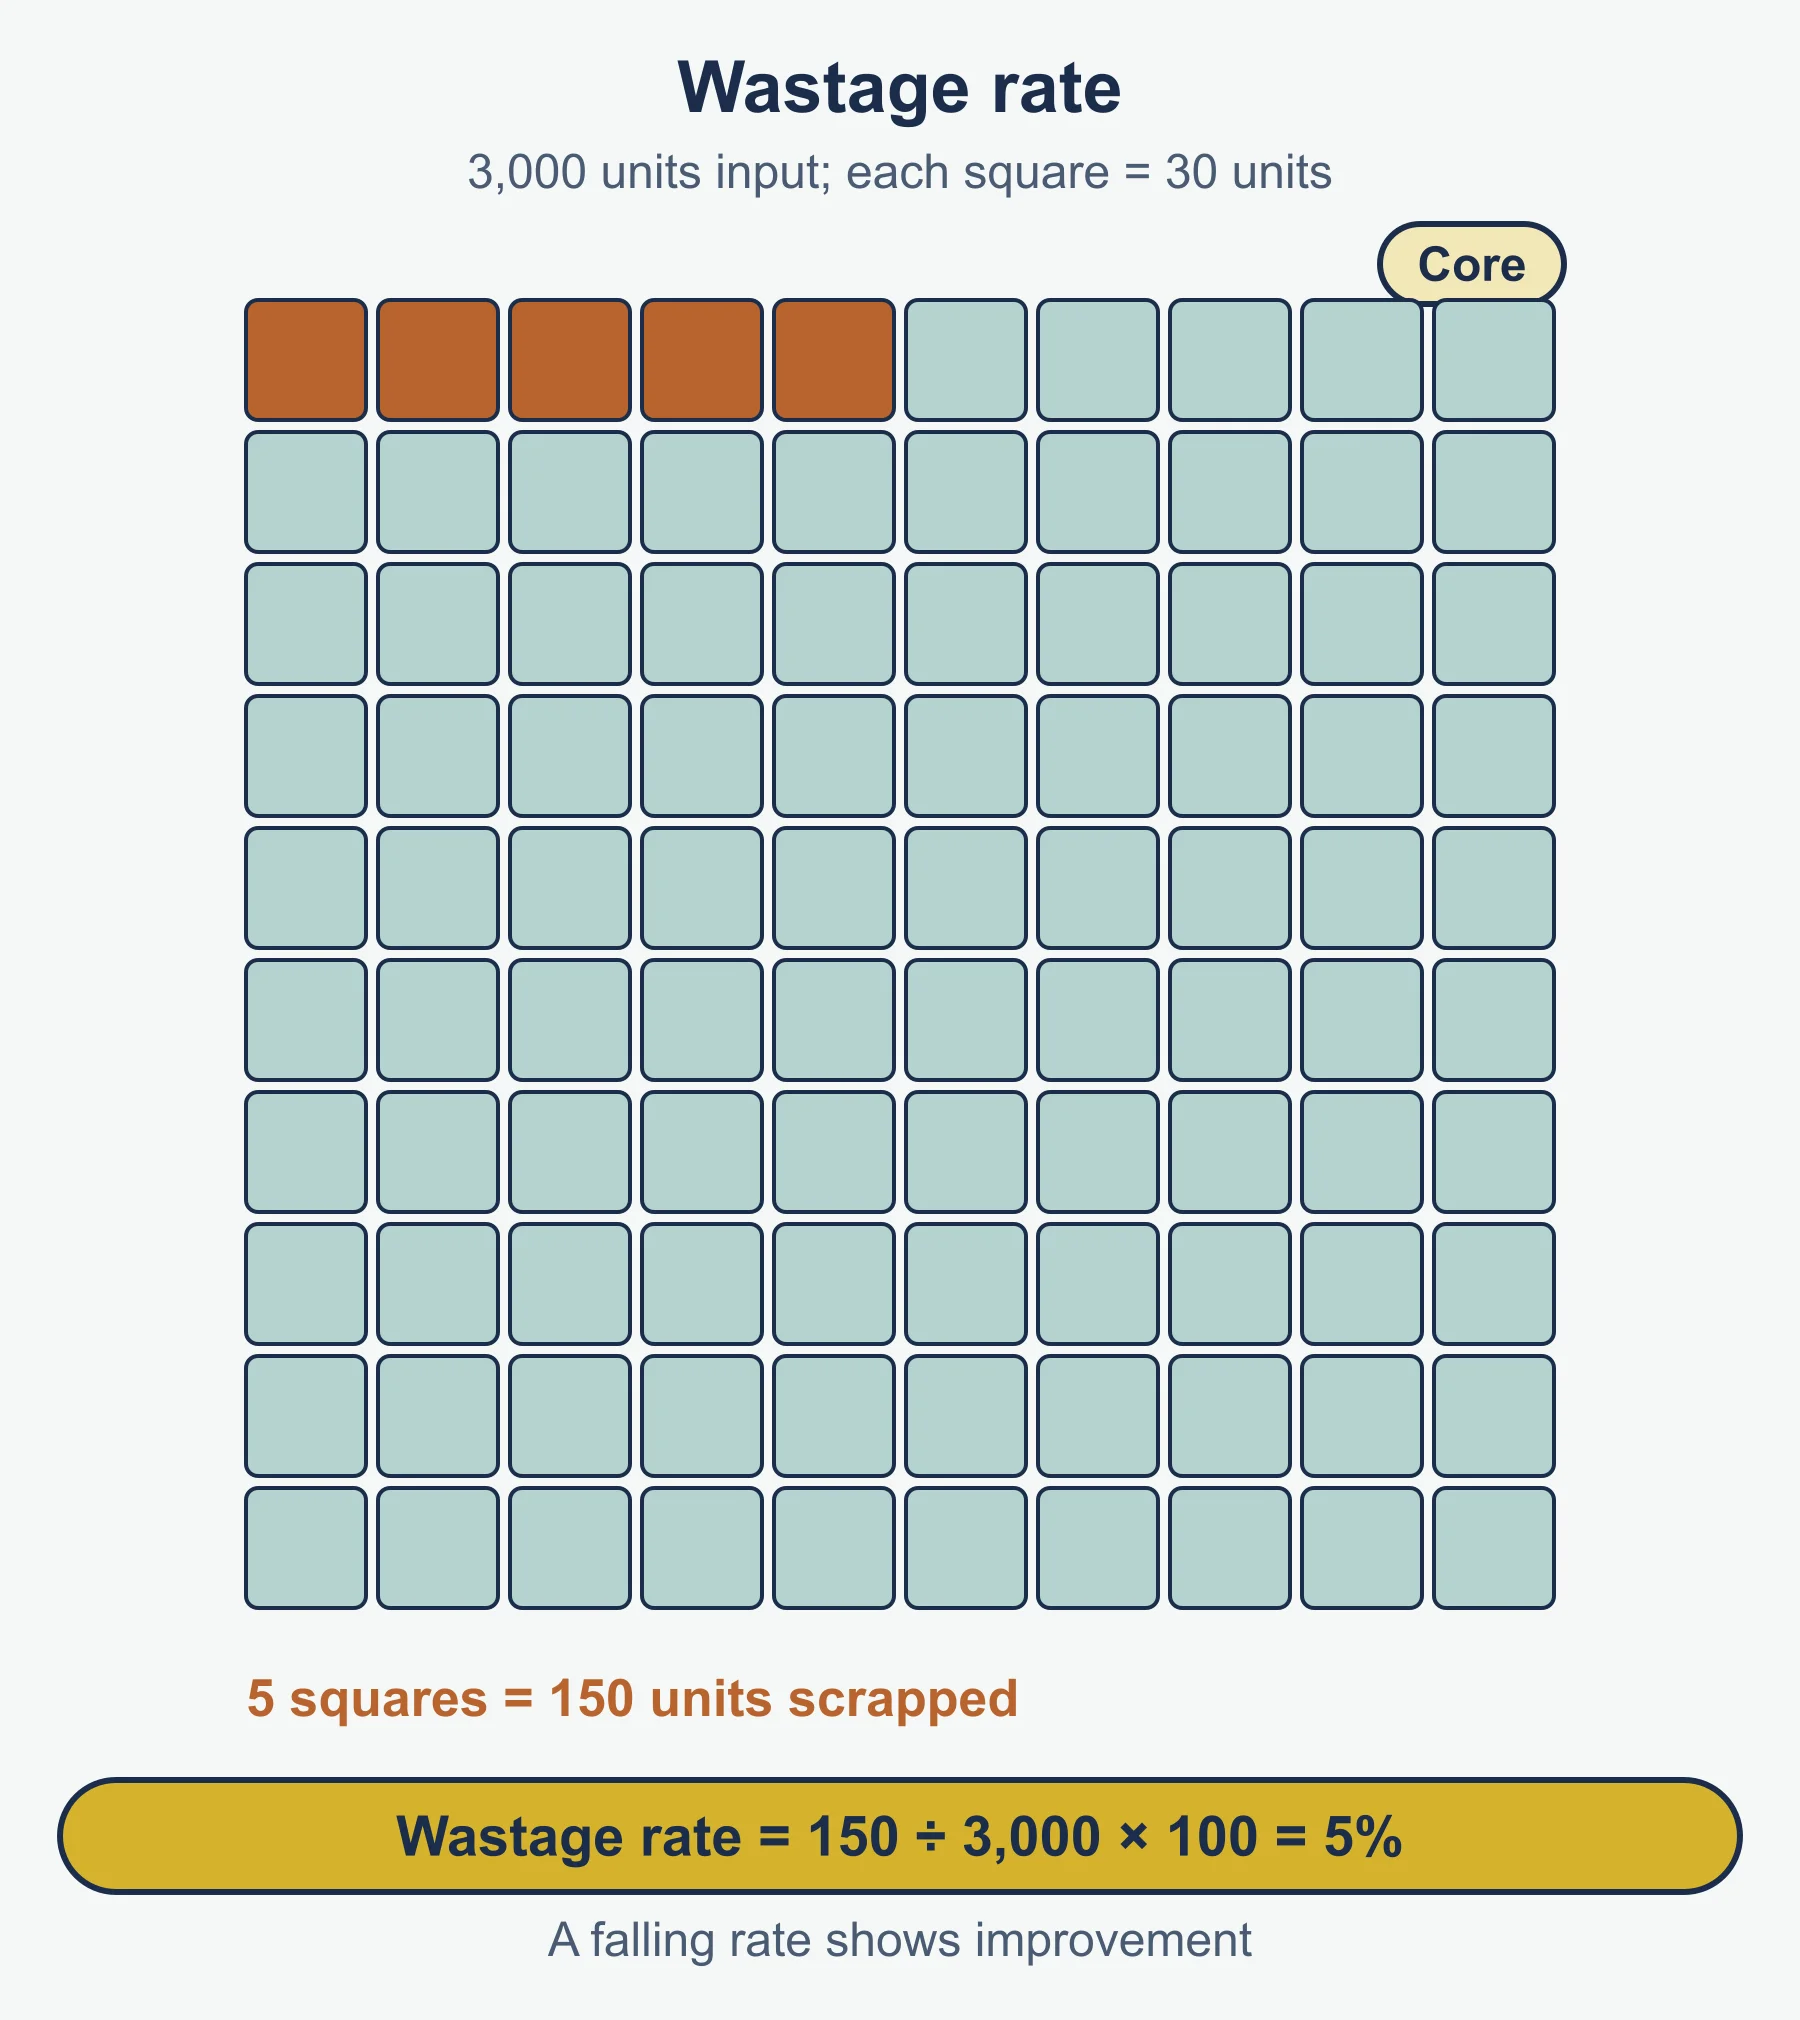
| Wastage rate | Units wasted / units input x 100 |
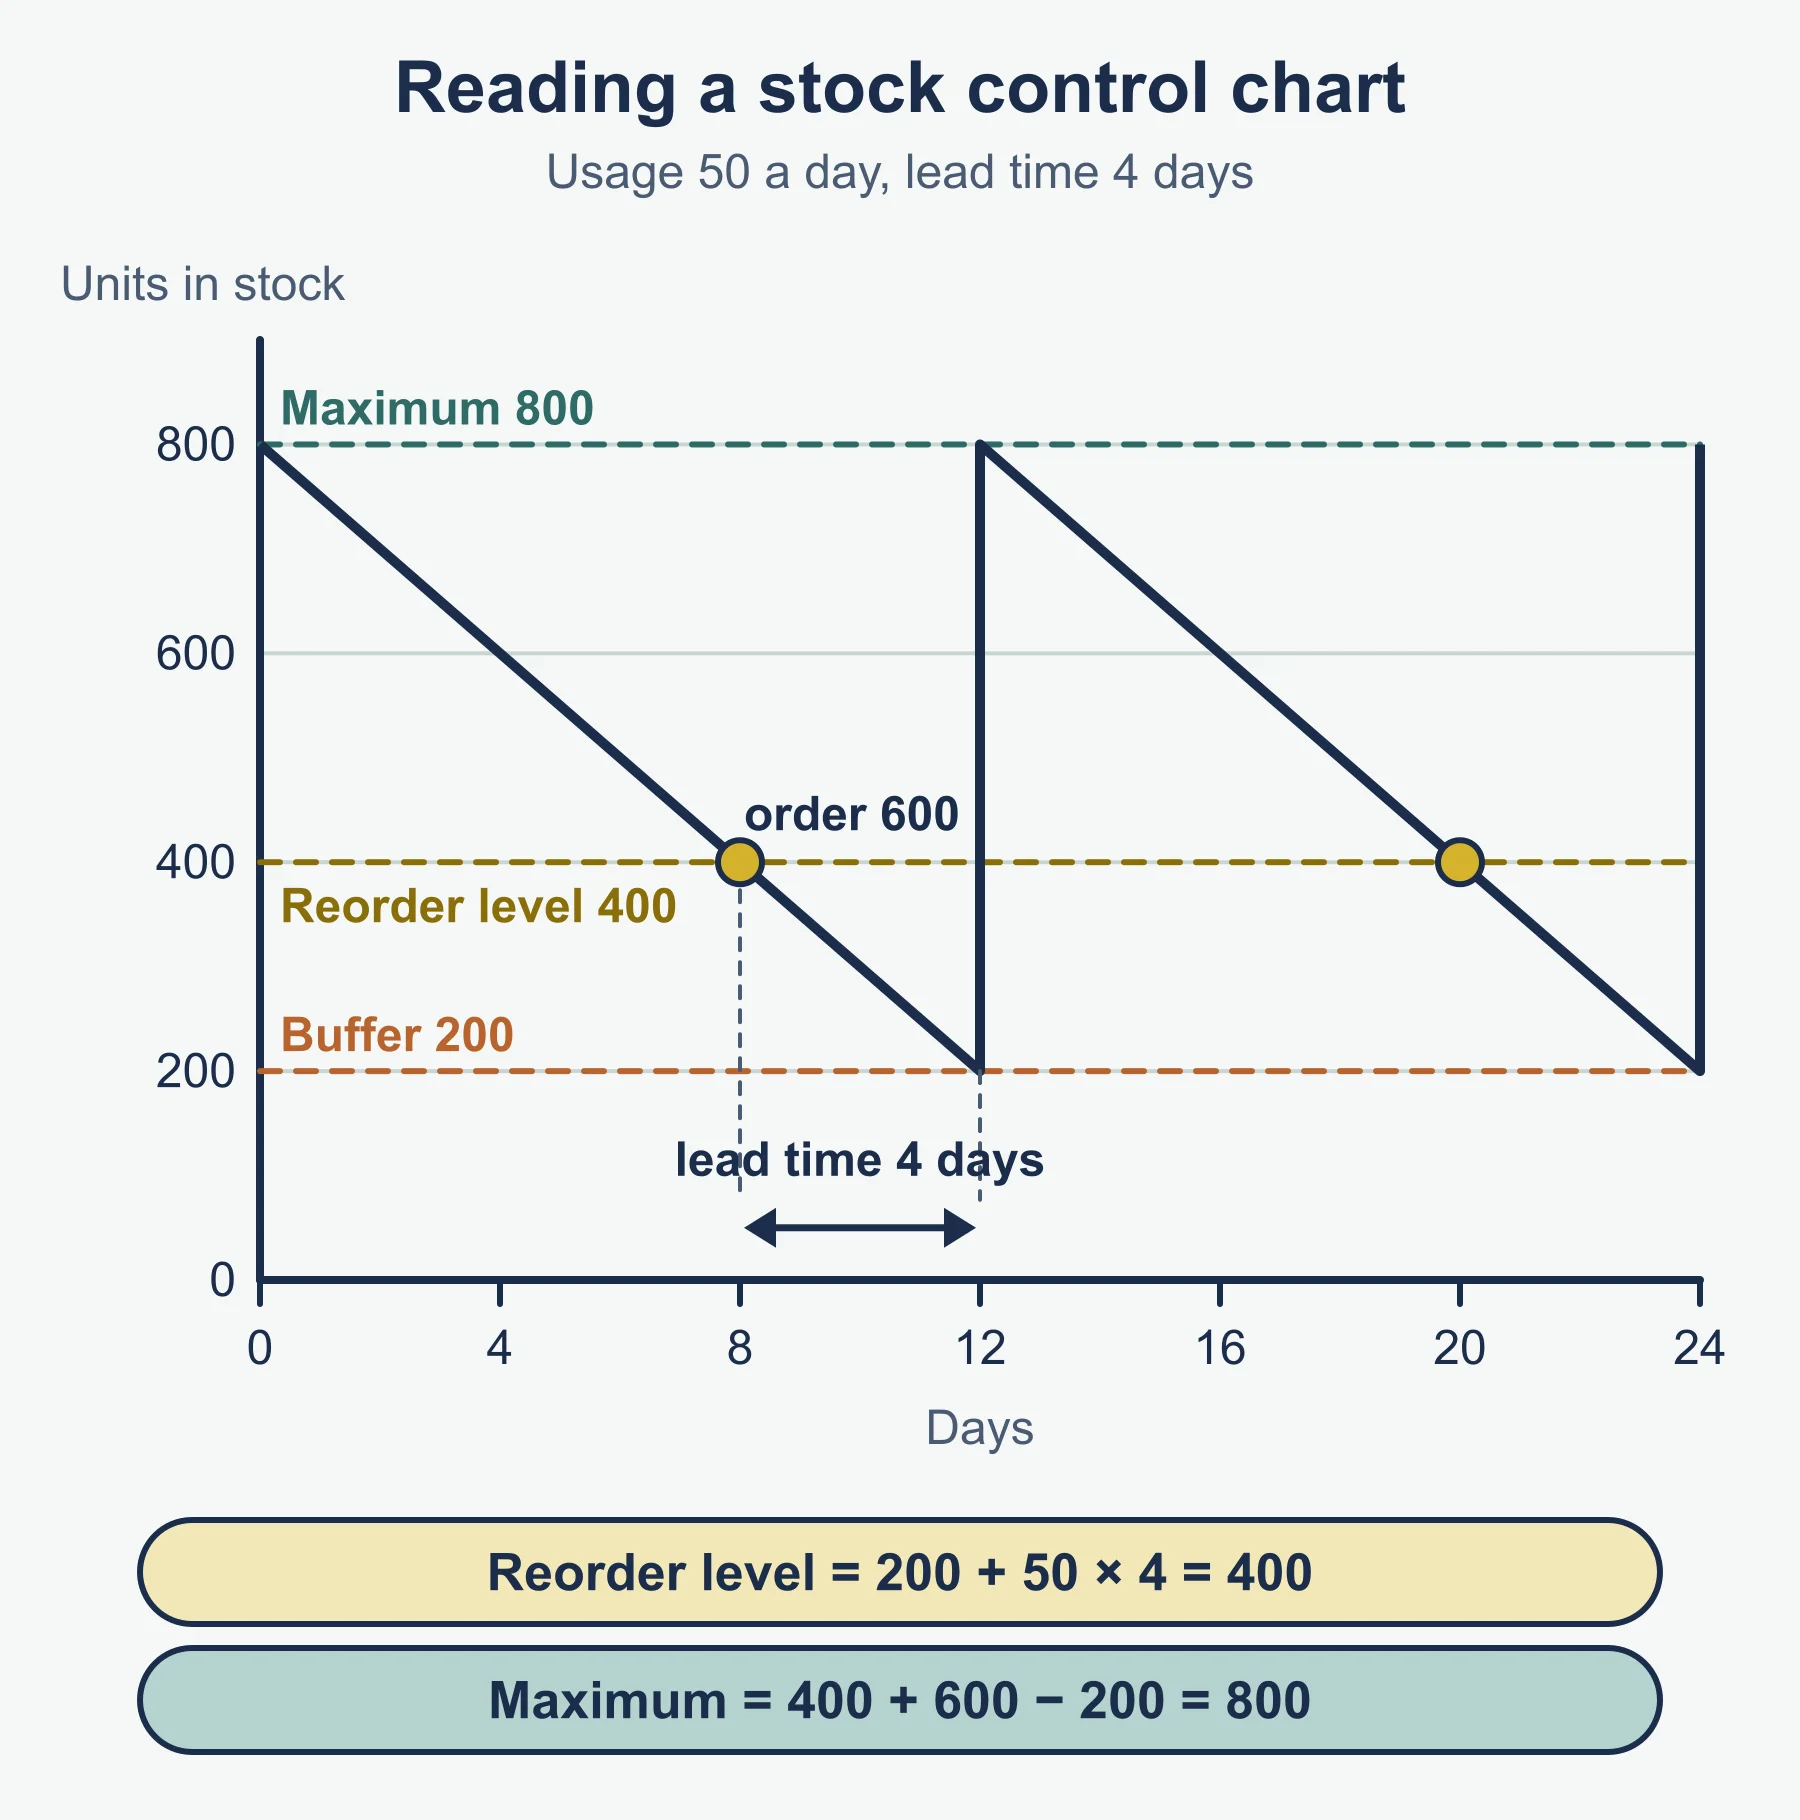
| Reorder level | Buffer stock + (usage per day x lead time) |
| Maximum stock | Reorder level + reorder quantity - usage in lead time |
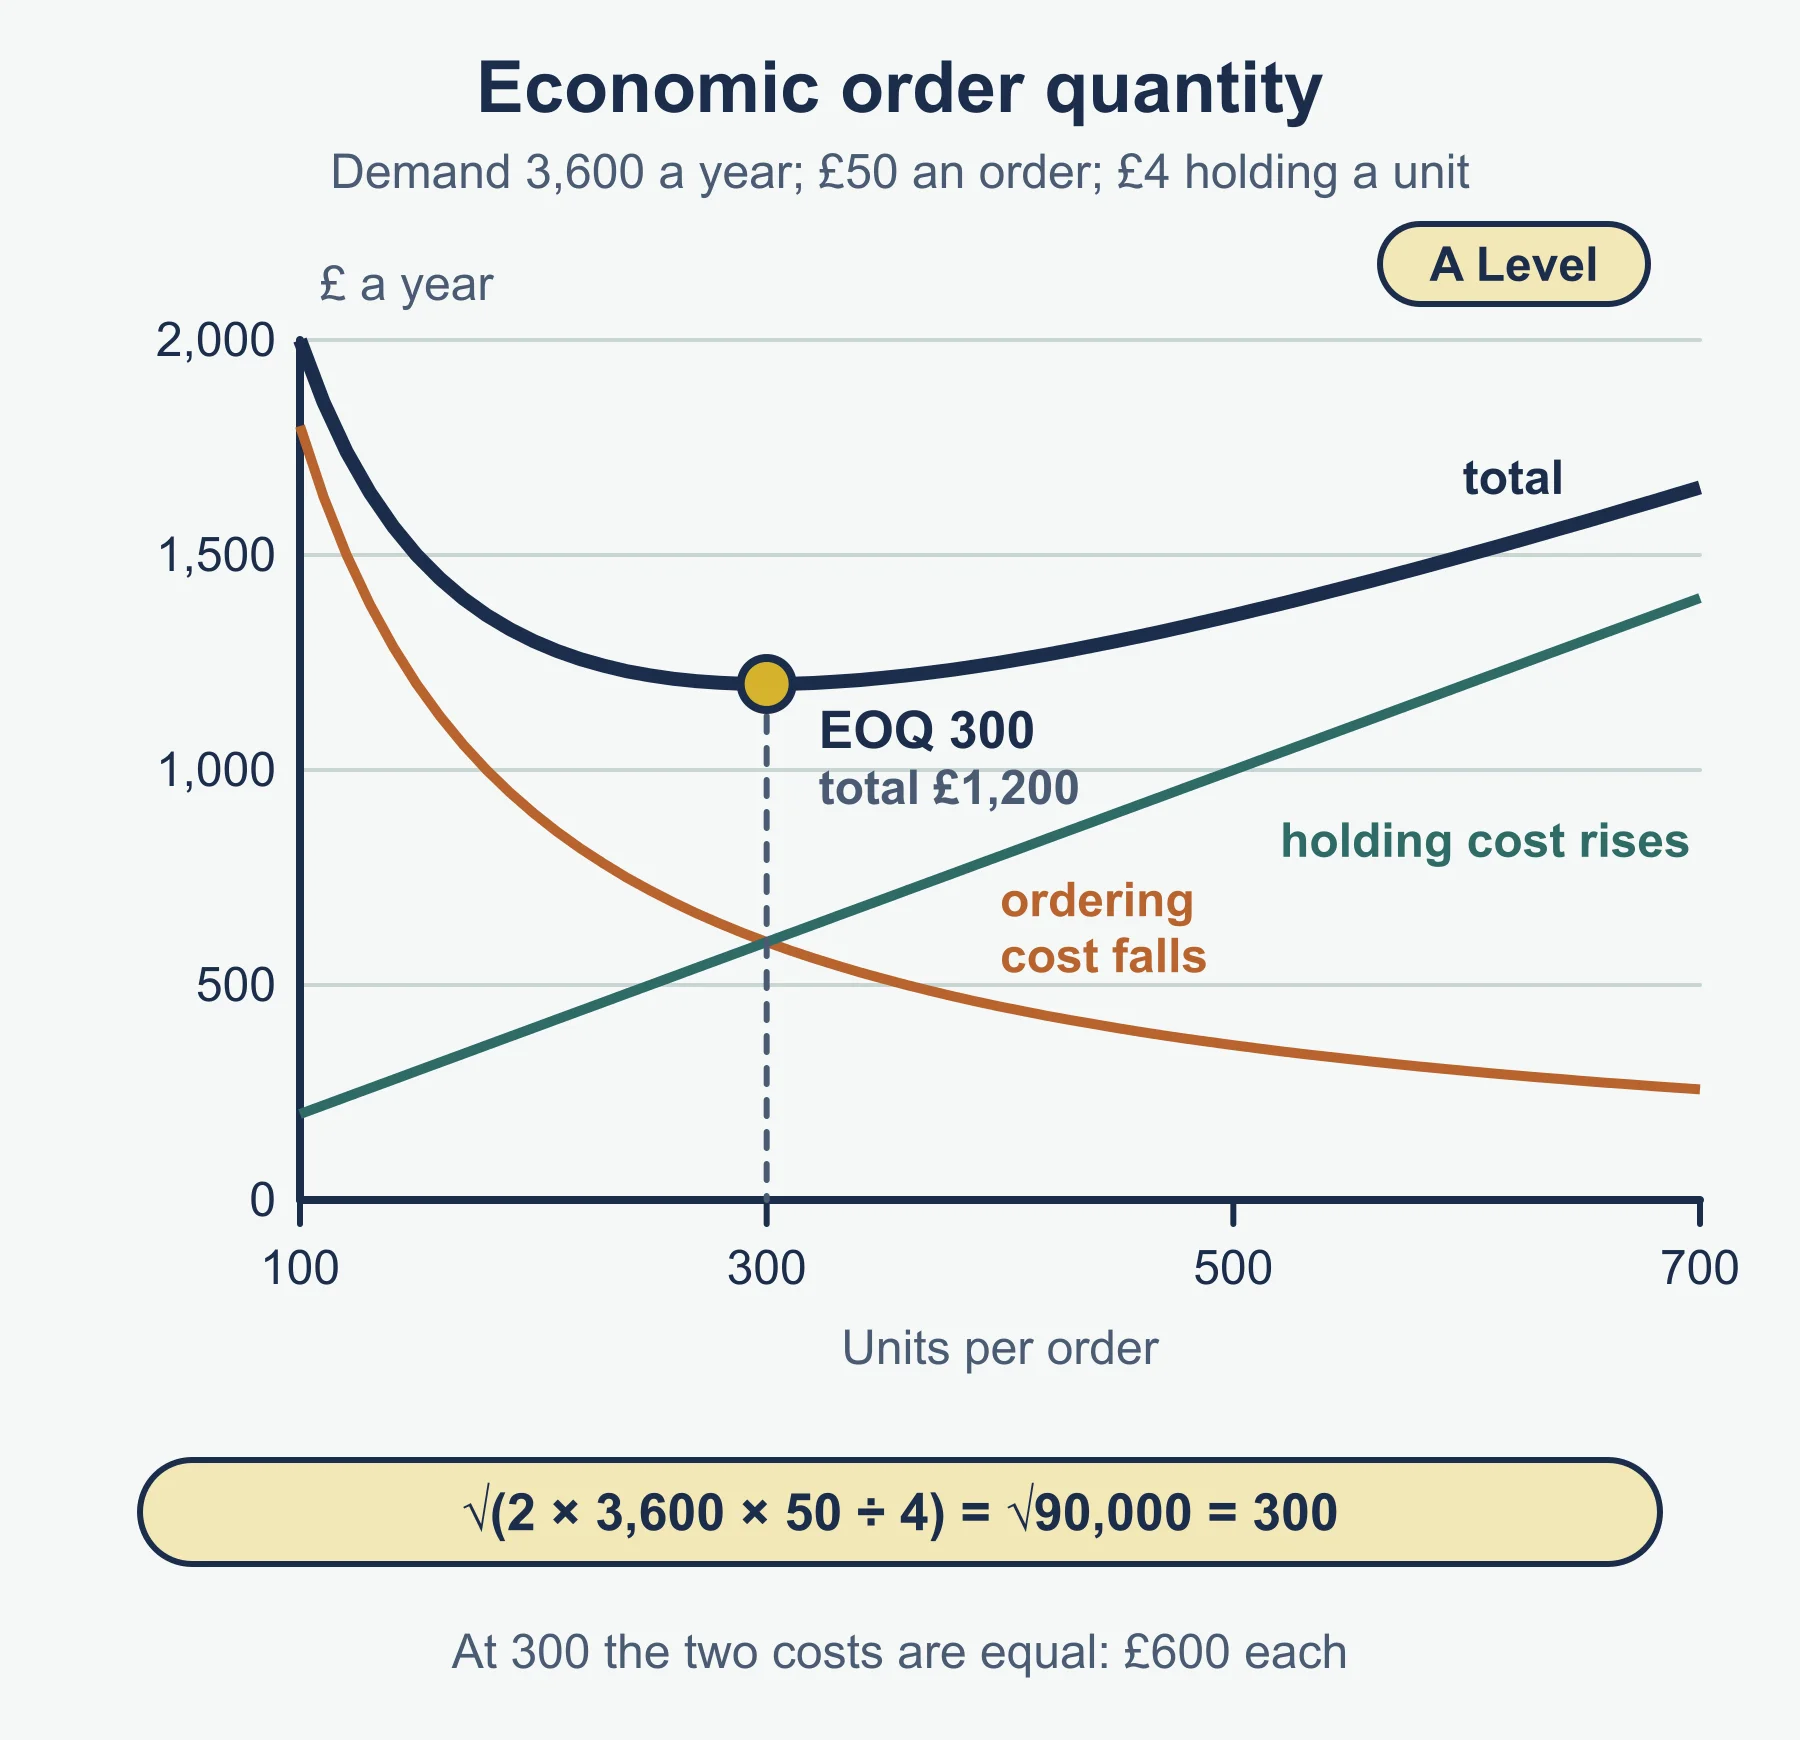
| EOQ | Square root of (2 x annual demand x cost per order / holding cost per unit) |
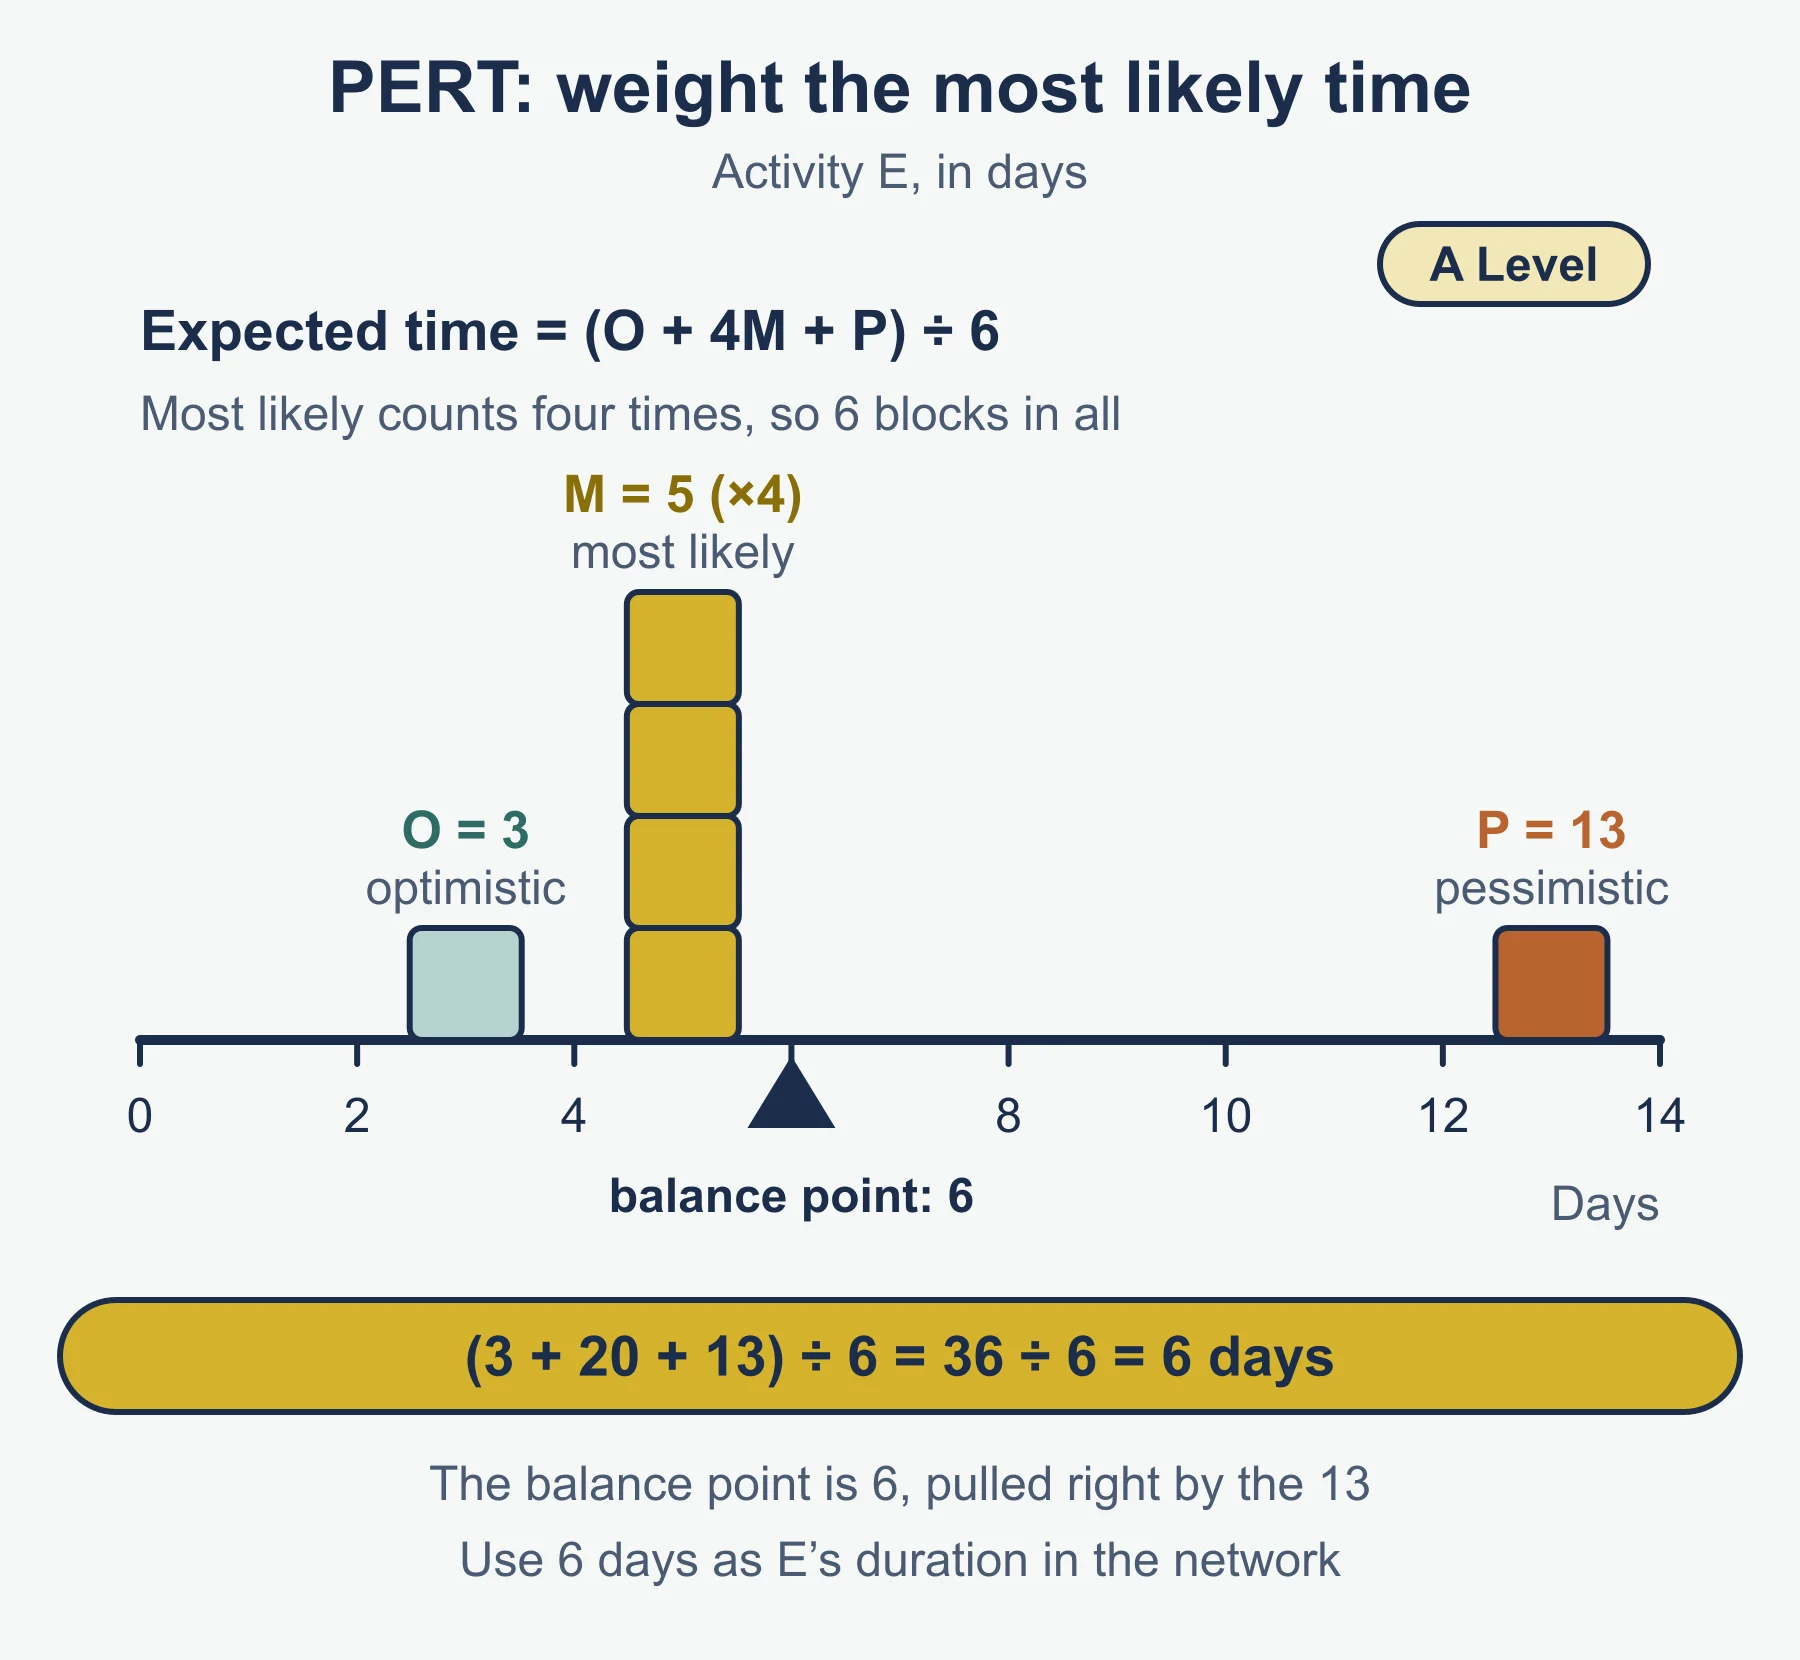
| PERT expected time | (O + 4M + P) / 6 |
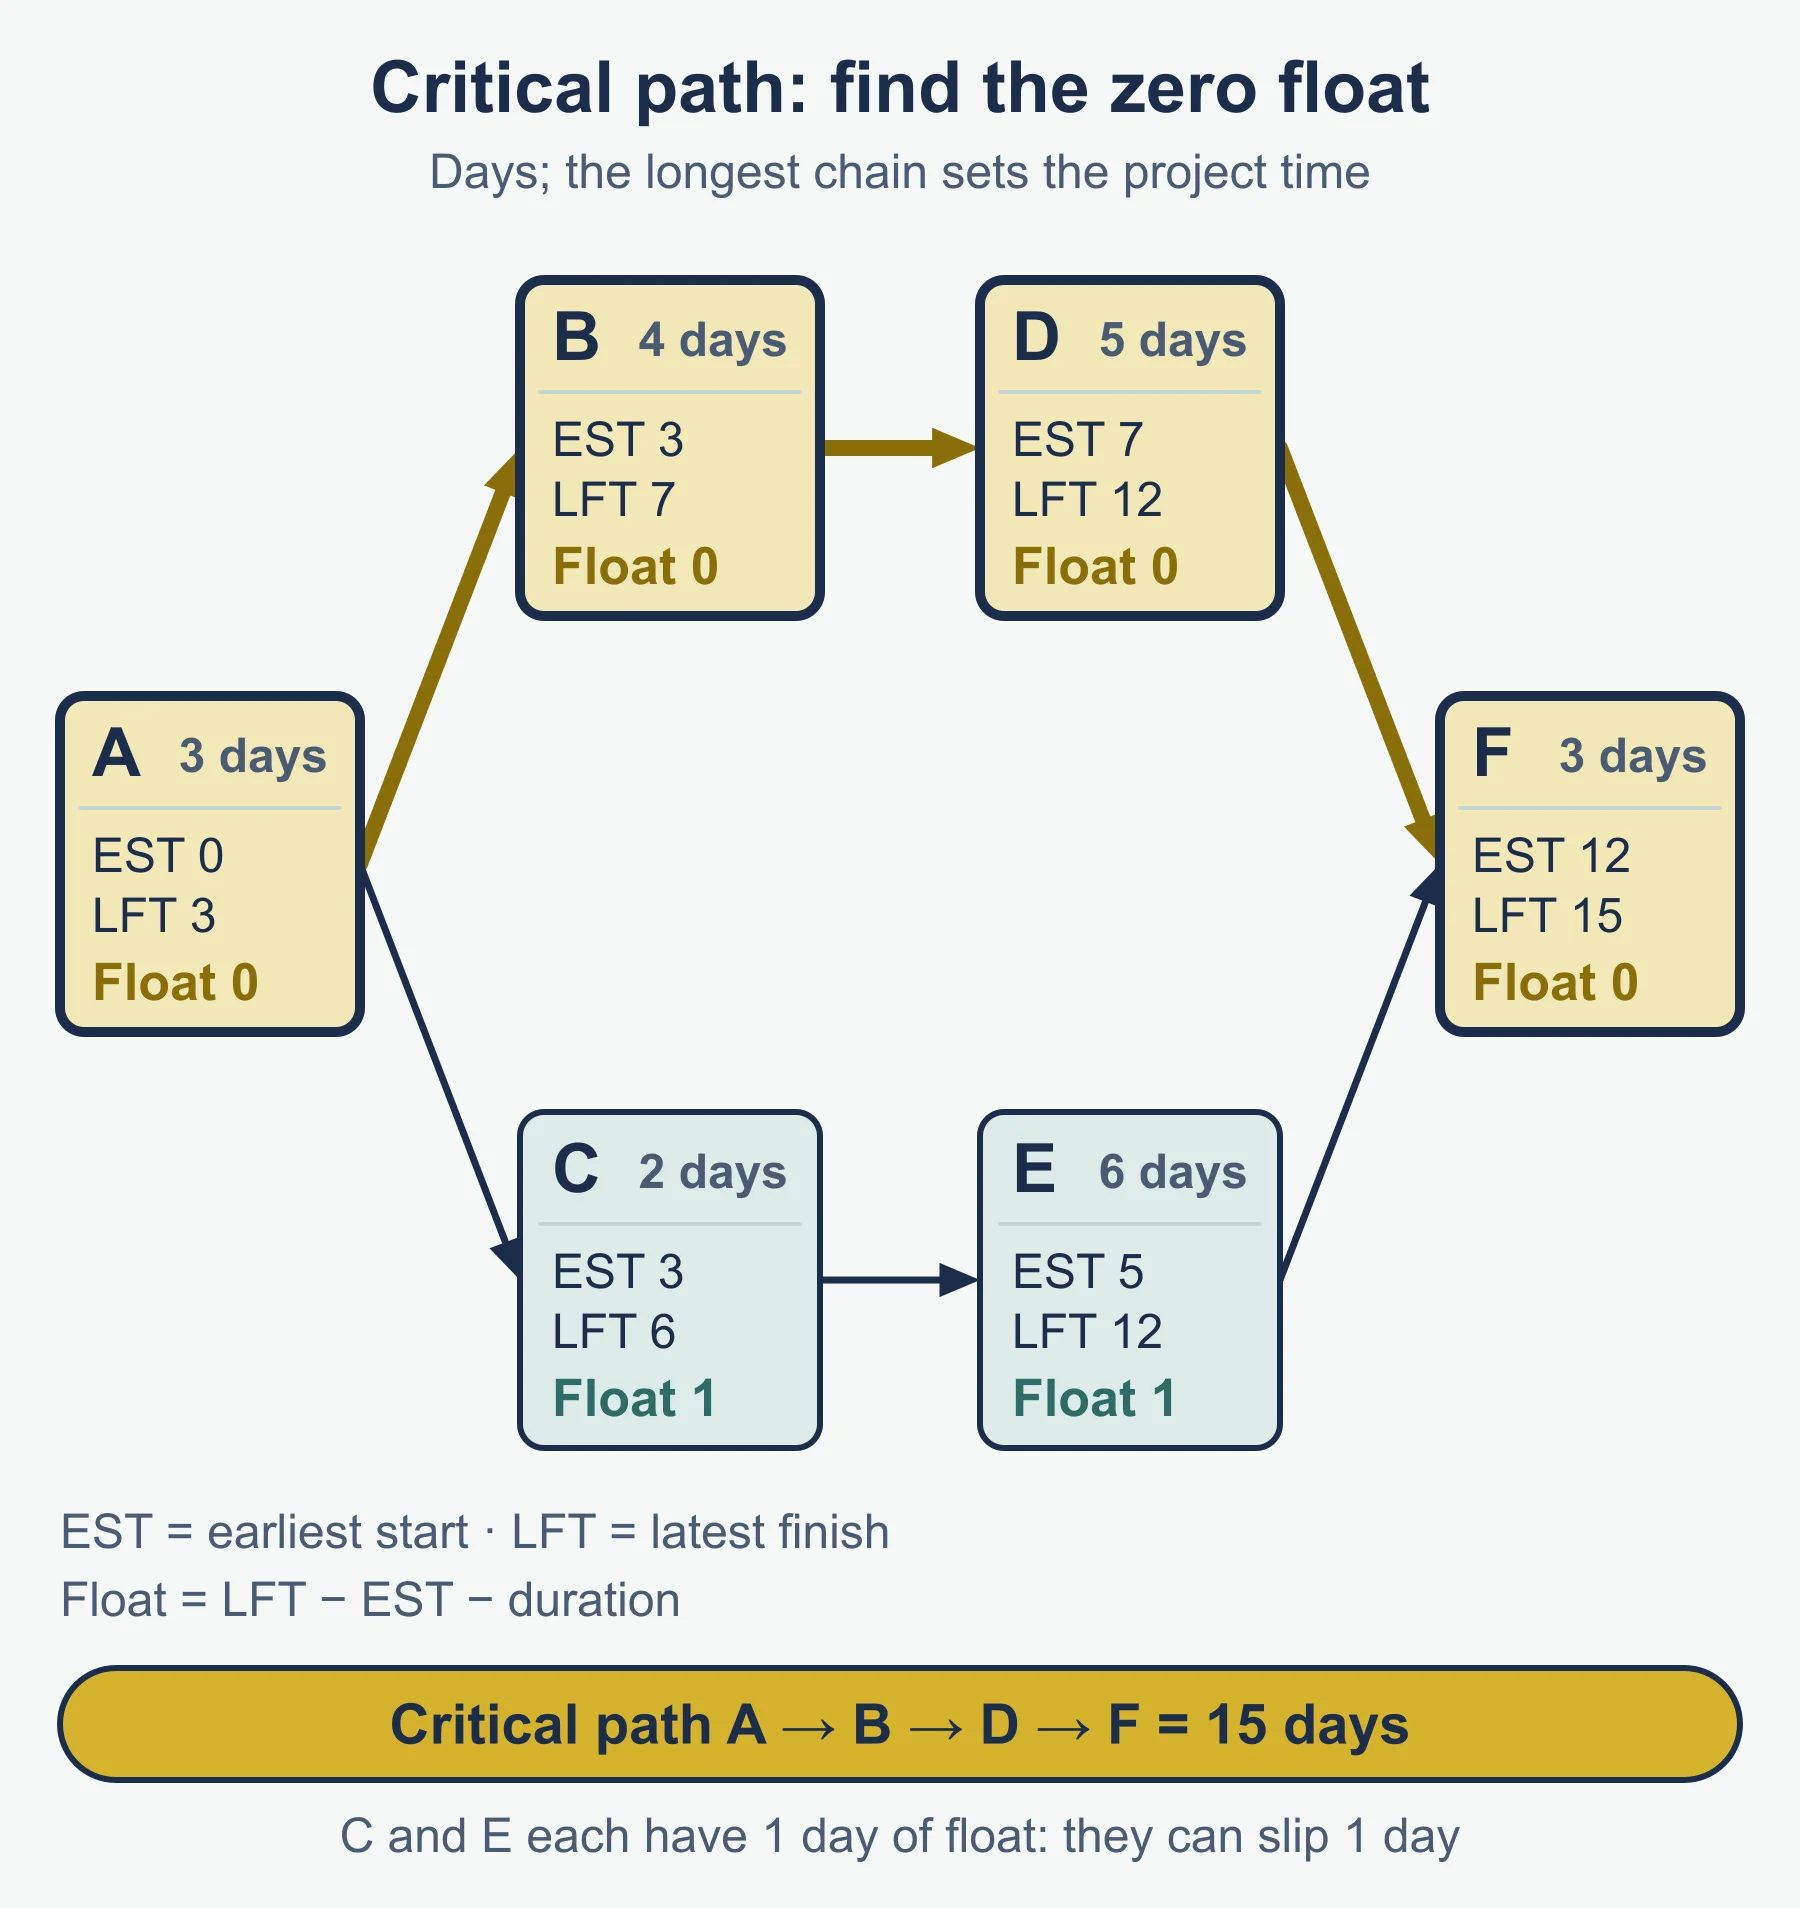
| Total float | LFT - EST - duration |
| Free float | EST of next activity - EST - duration |
Key definitions
- Operations management objectives: targets for quality, cost, speed, flexibility, innovation, environment and capacity that support business objectives.
- Research and development (R&D): discovering and developing new knowledge for products and processes.
- Product innovation: new or improved goods or services. Process innovation: new ways of making or delivering them.
- Specialisation: concentrating on narrow tasks. Division of labour: splitting production into tasks done by specialists.
- Service: an intangible output that is not owned and cannot be stored.
- Customer service: help given before, during and after a sale.
- Project management: planning and controlling resources for a one-off aim.
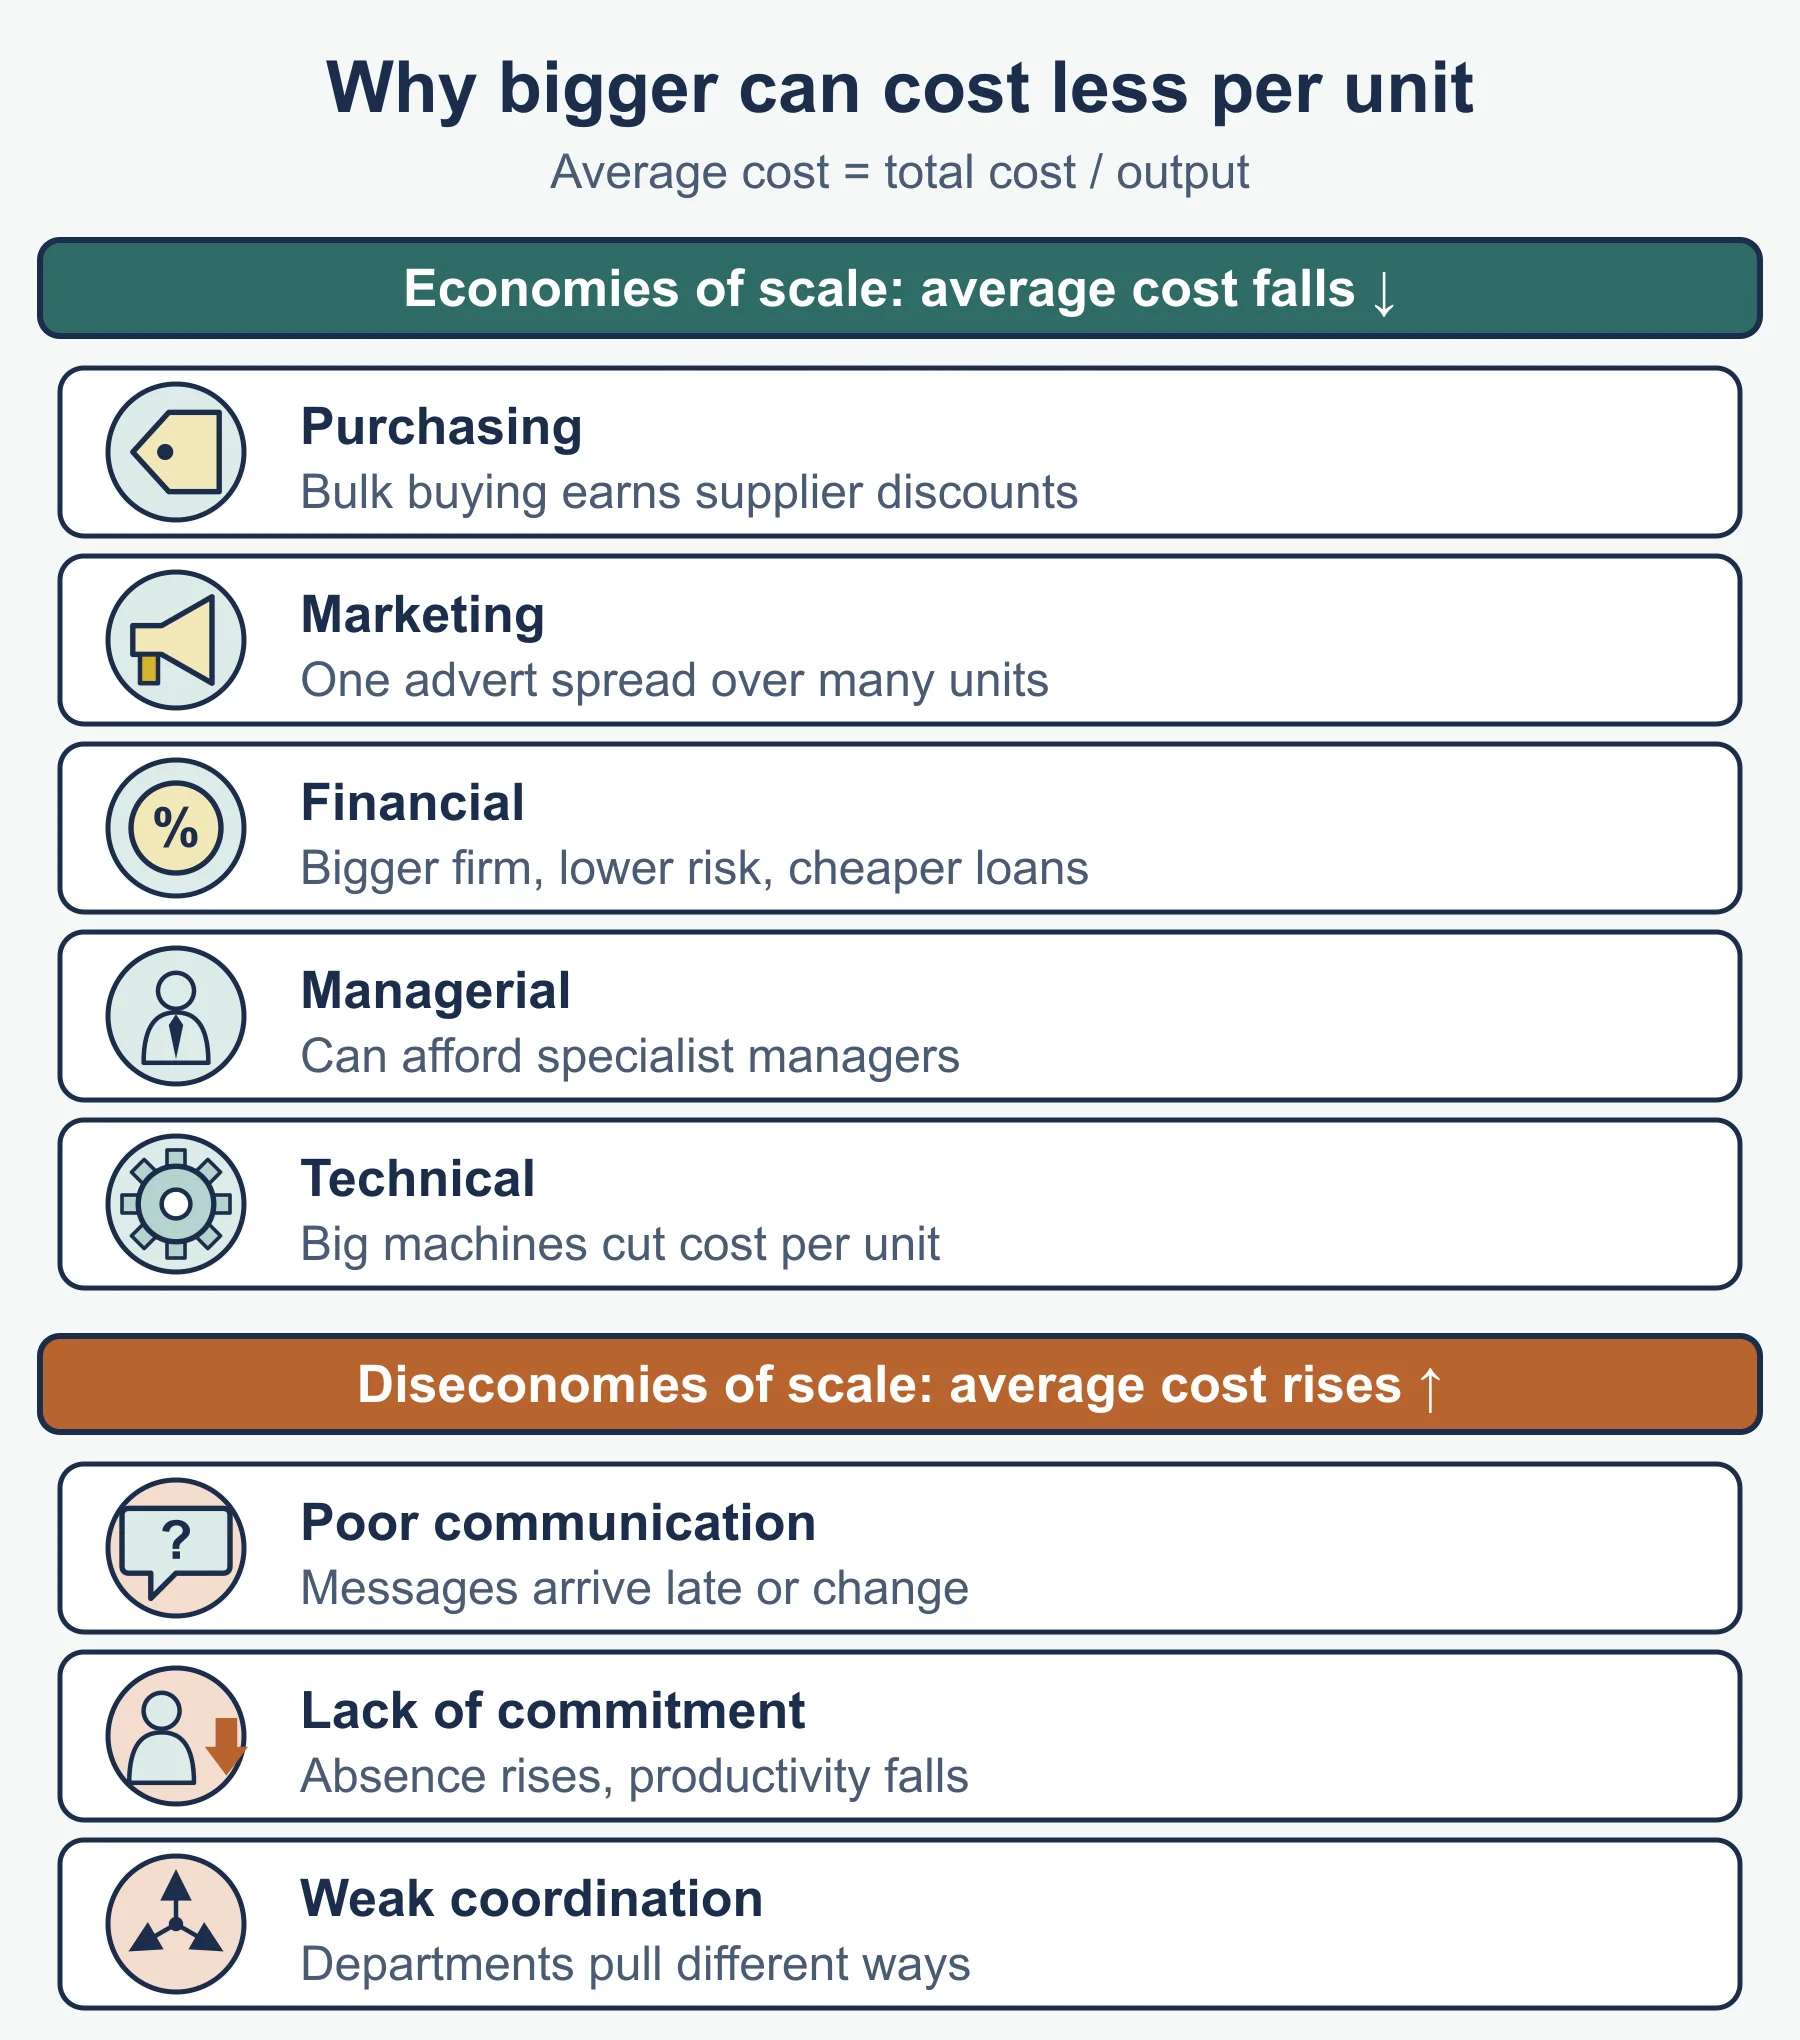
- Economies of scale: unit costs falling as output rises. Diseconomies: unit costs rising as the firm grows too large.
- Capacity management: matching capacity to demand.
- Lean production: minimising waste while keeping quality.
- Total quality management (TQM): quality as the responsibility of every employee.
- Benchmarking: comparing performance with the best and adopting their practice.
- Operations strategy: the long-term plan combining operations decisions to meet objectives.
Production methods at a glance
| Method | Volume | Variety | Unit cost | Flexibility |
|---|---|---|---|---|
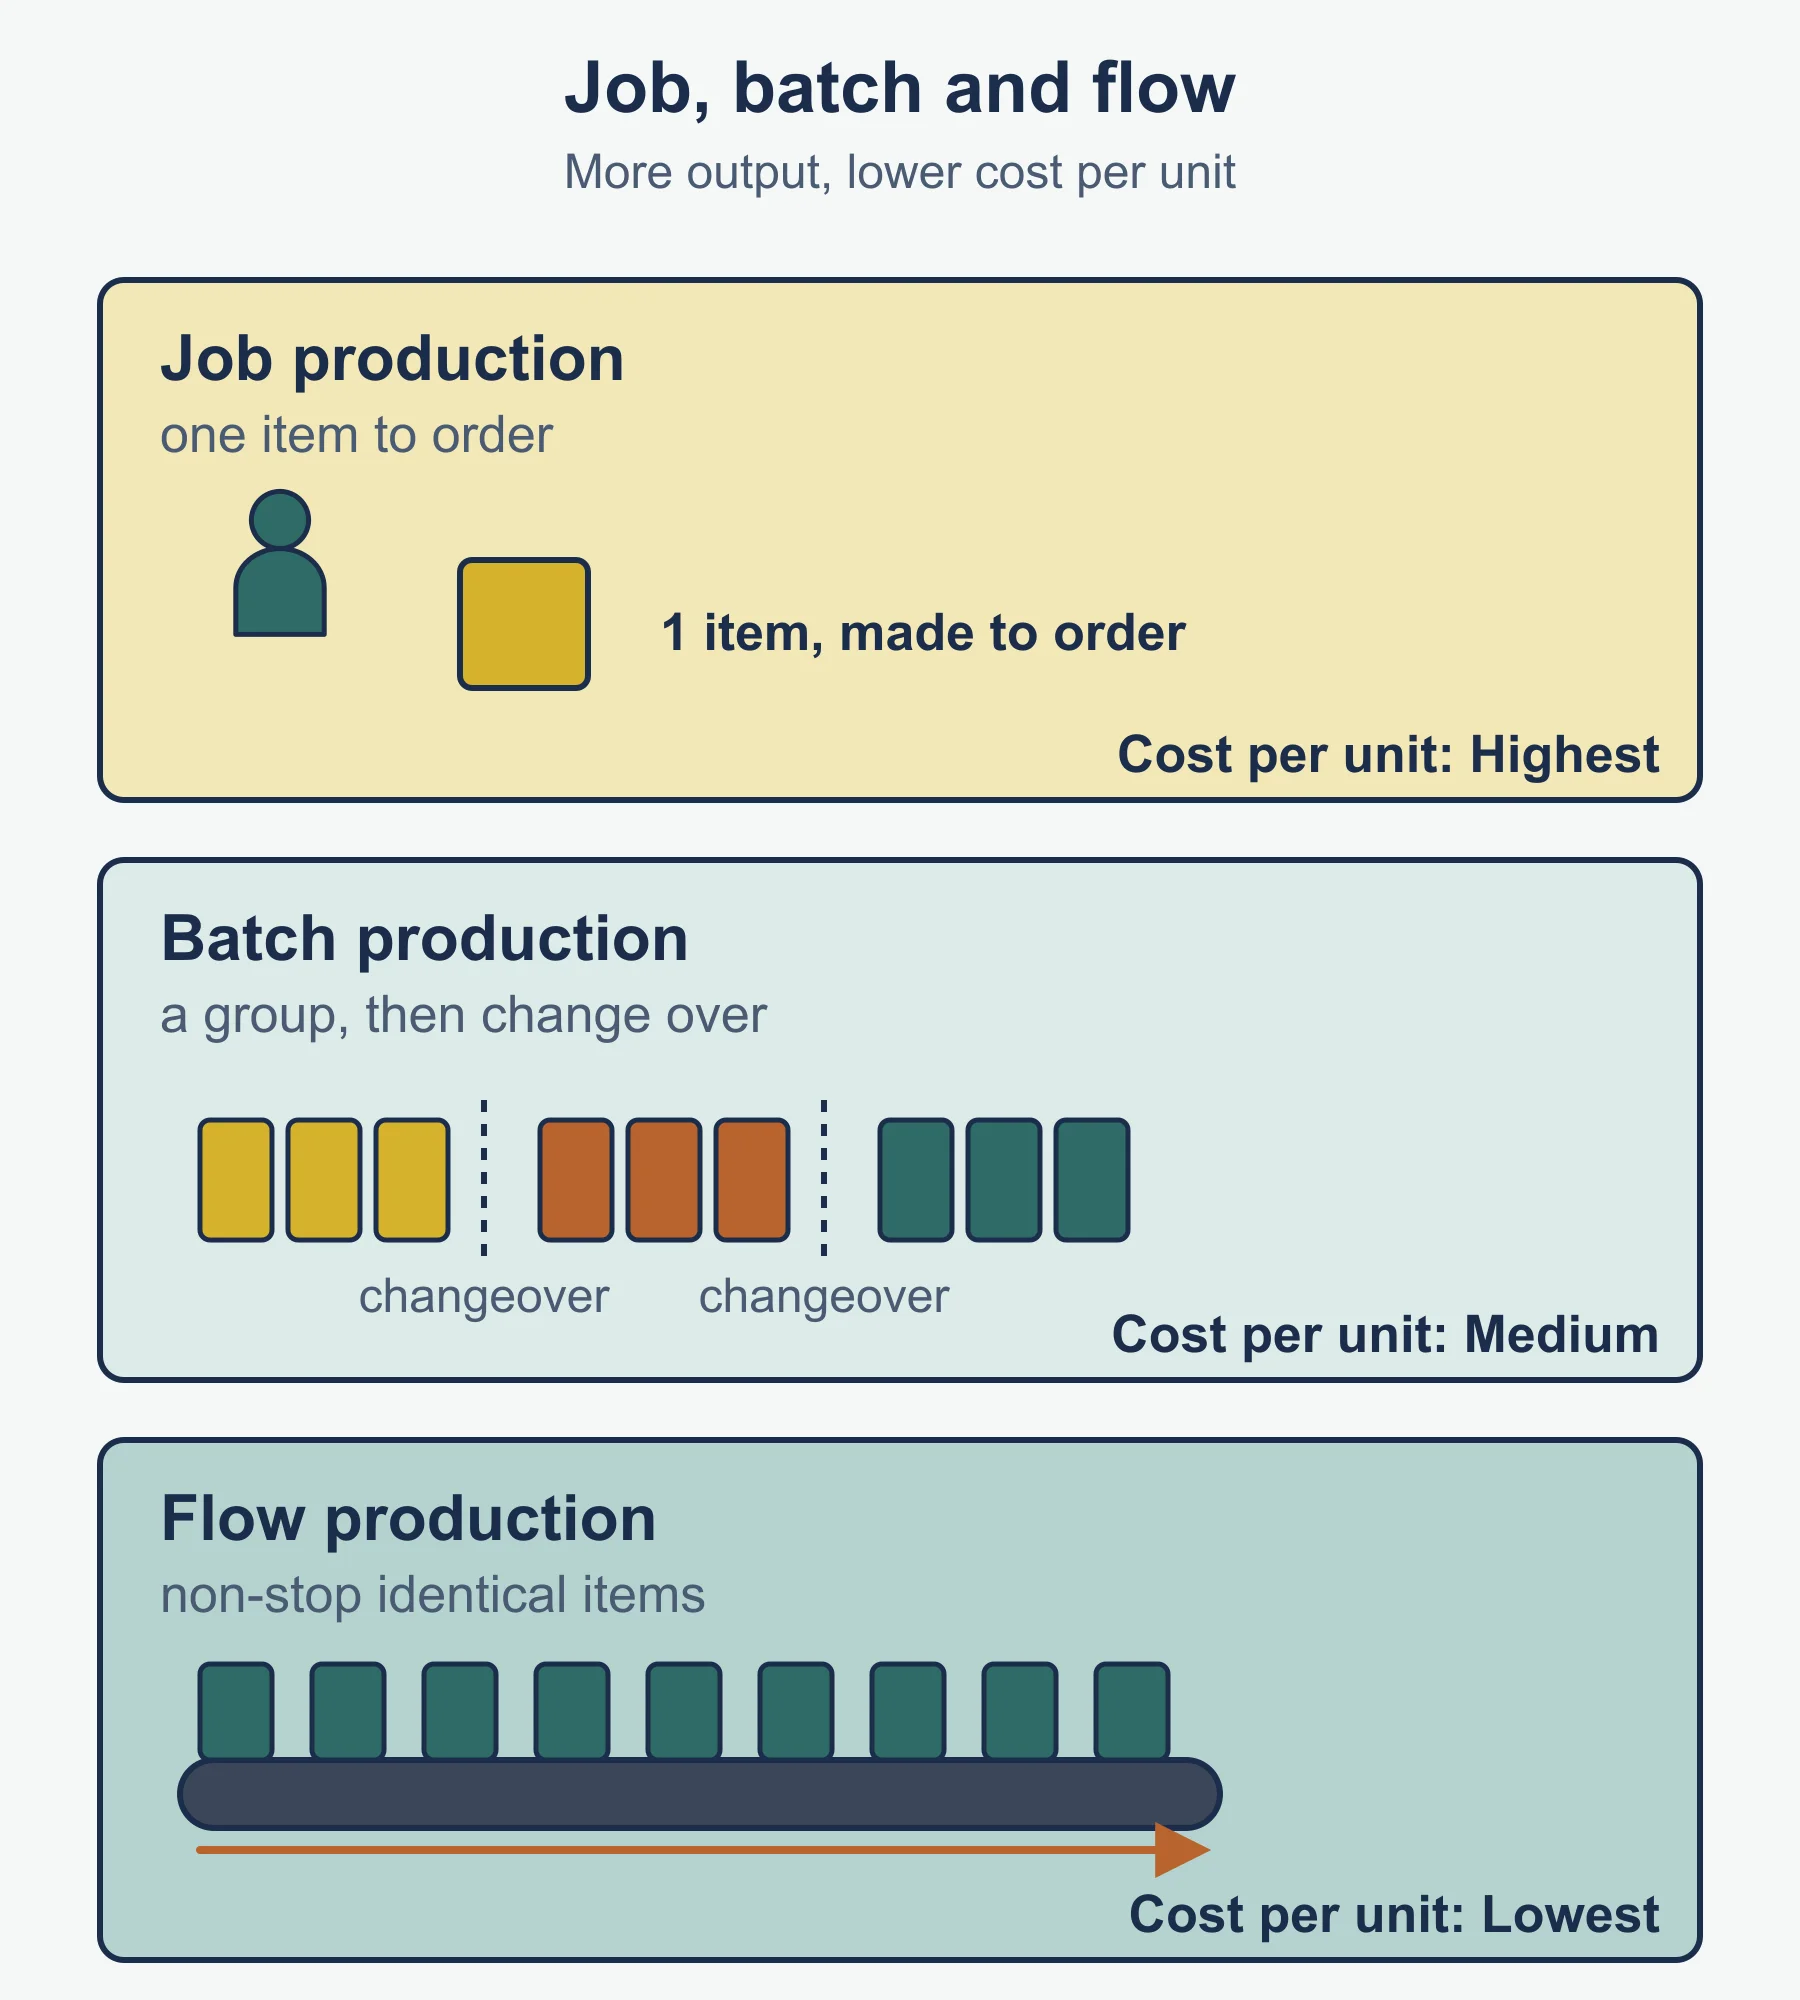
| Job | Very low | High | High | High |
| Batch | Medium | Medium | Medium | Medium |
| Flow | High | Low | Low | Low |
| Cell | Medium | Medium | Medium | Medium to high (team-based) |
Division of labour: faster and cheaper per unit, but boring and less motivating.
Project management in steps
- List activities, durations and what must come before each.
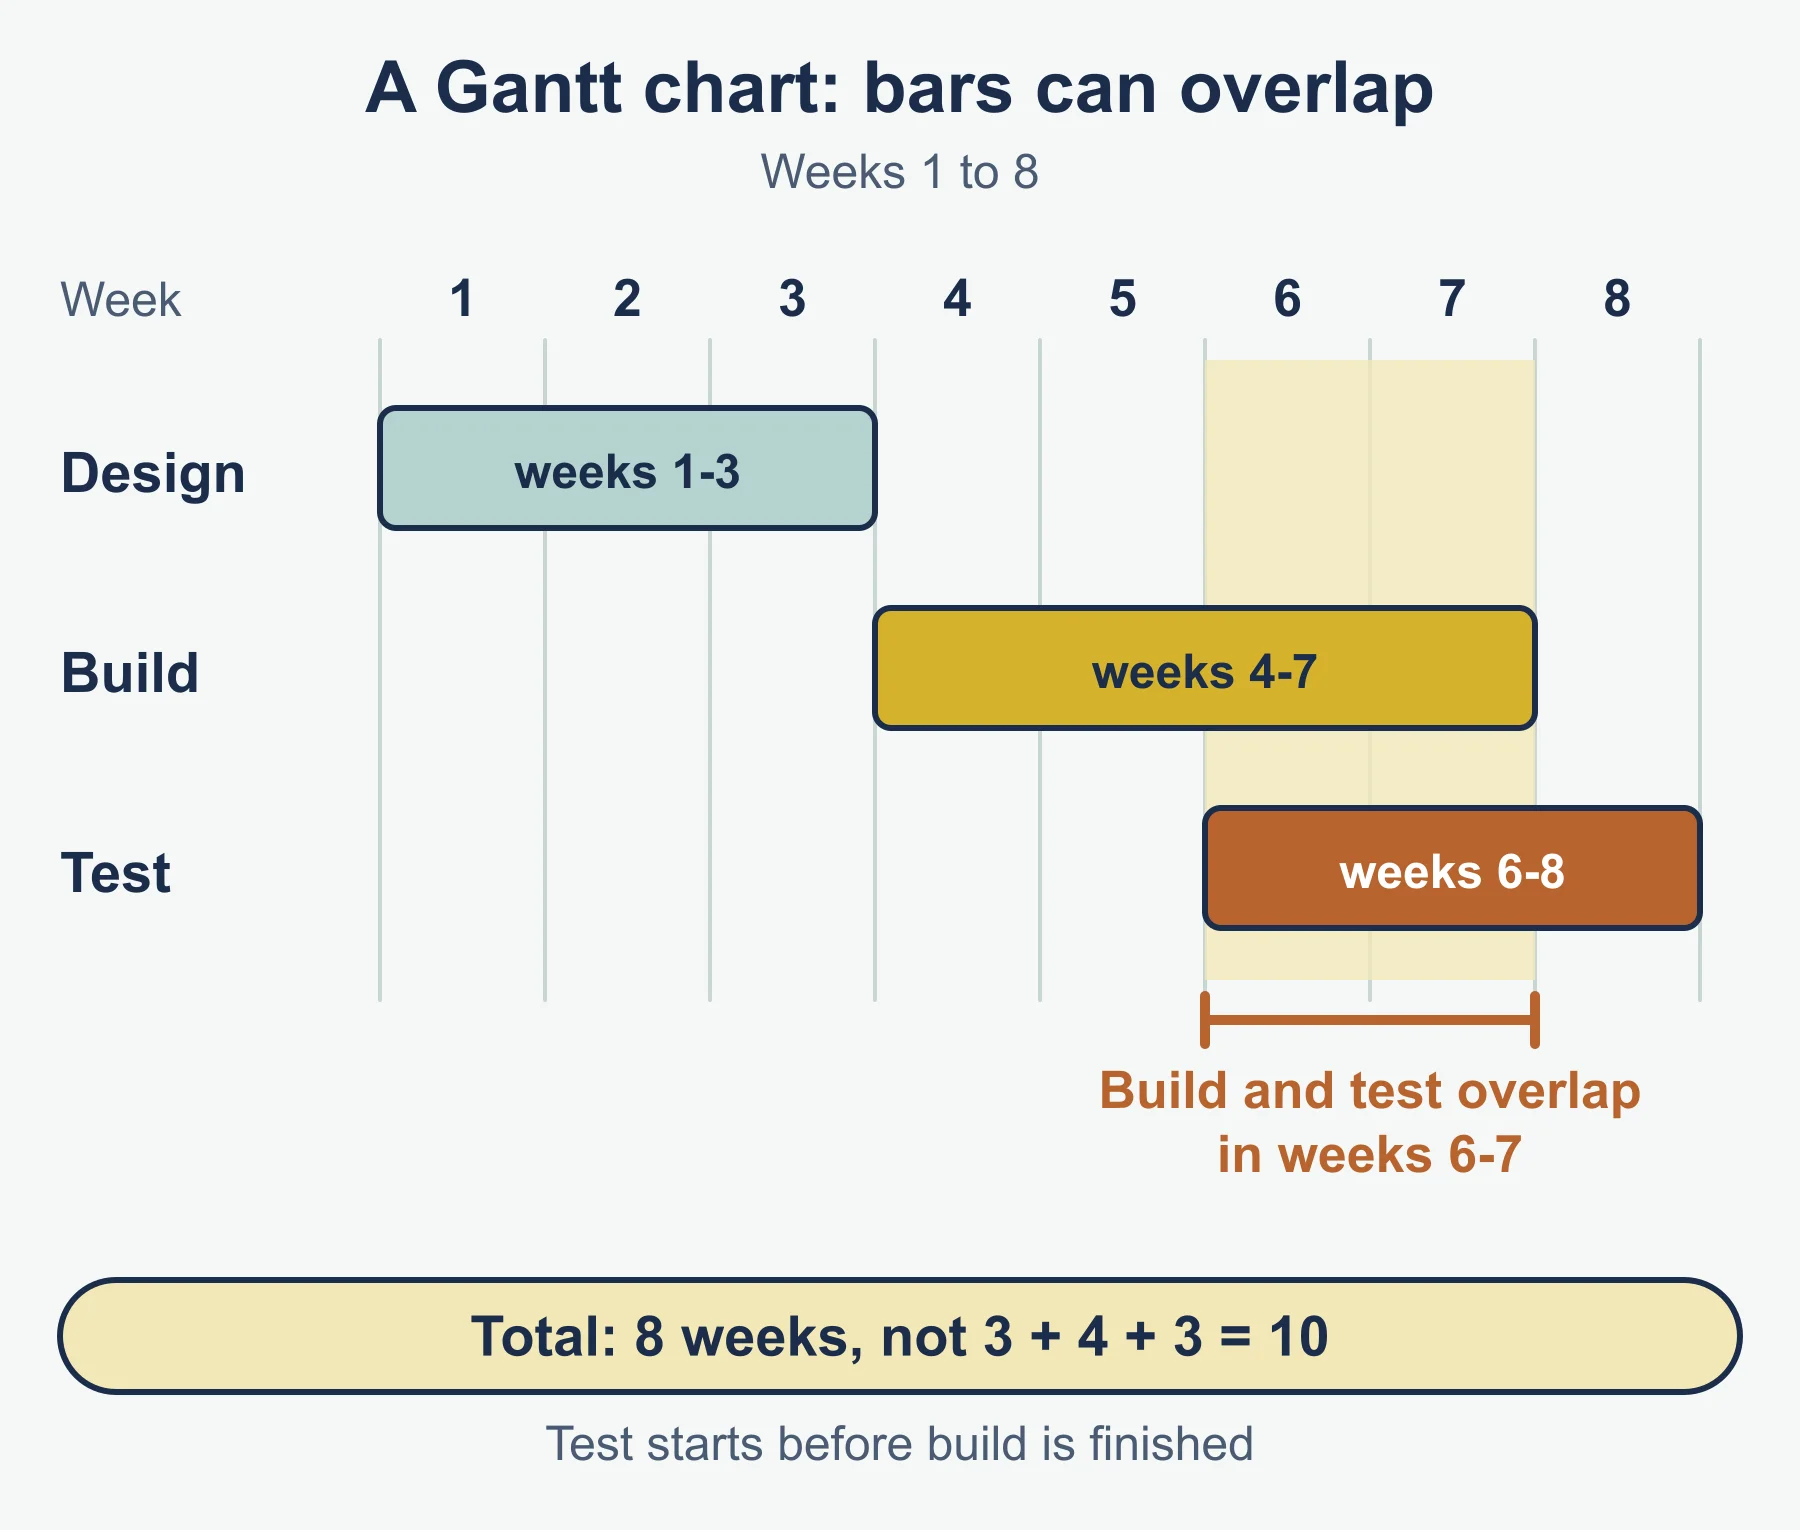
- Draw the network (or Gantt chart: bars on a time axis, overlap where bars share time).
- Forward pass: EST = largest of (EST + duration) over all preceding activities.
- Project duration = EST of the final activity + its duration.
- Backward pass: LFT of an activity = smallest of (LFT - duration) over its successors.
- Total float = LFT - EST - duration; free float = next EST - EST - duration.
- Critical path = activities with zero total float.
- For PERT, first convert O, M and P into expected times, then repeat steps 3 to 7.
Reminder: a critical activity delayed by one day delays the whole project by one day. Qualitative factors (team skills, communication, leadership, supplier reliability, weather, legal change) can break a plan the numbers say is sound.
Stock control reminders
- Buffer stock is the safety minimum; lead time is the delay between order and delivery.
- Fixed reorder level: set quantity, variable timing. Fixed time reordering: set timing, variable quantity.
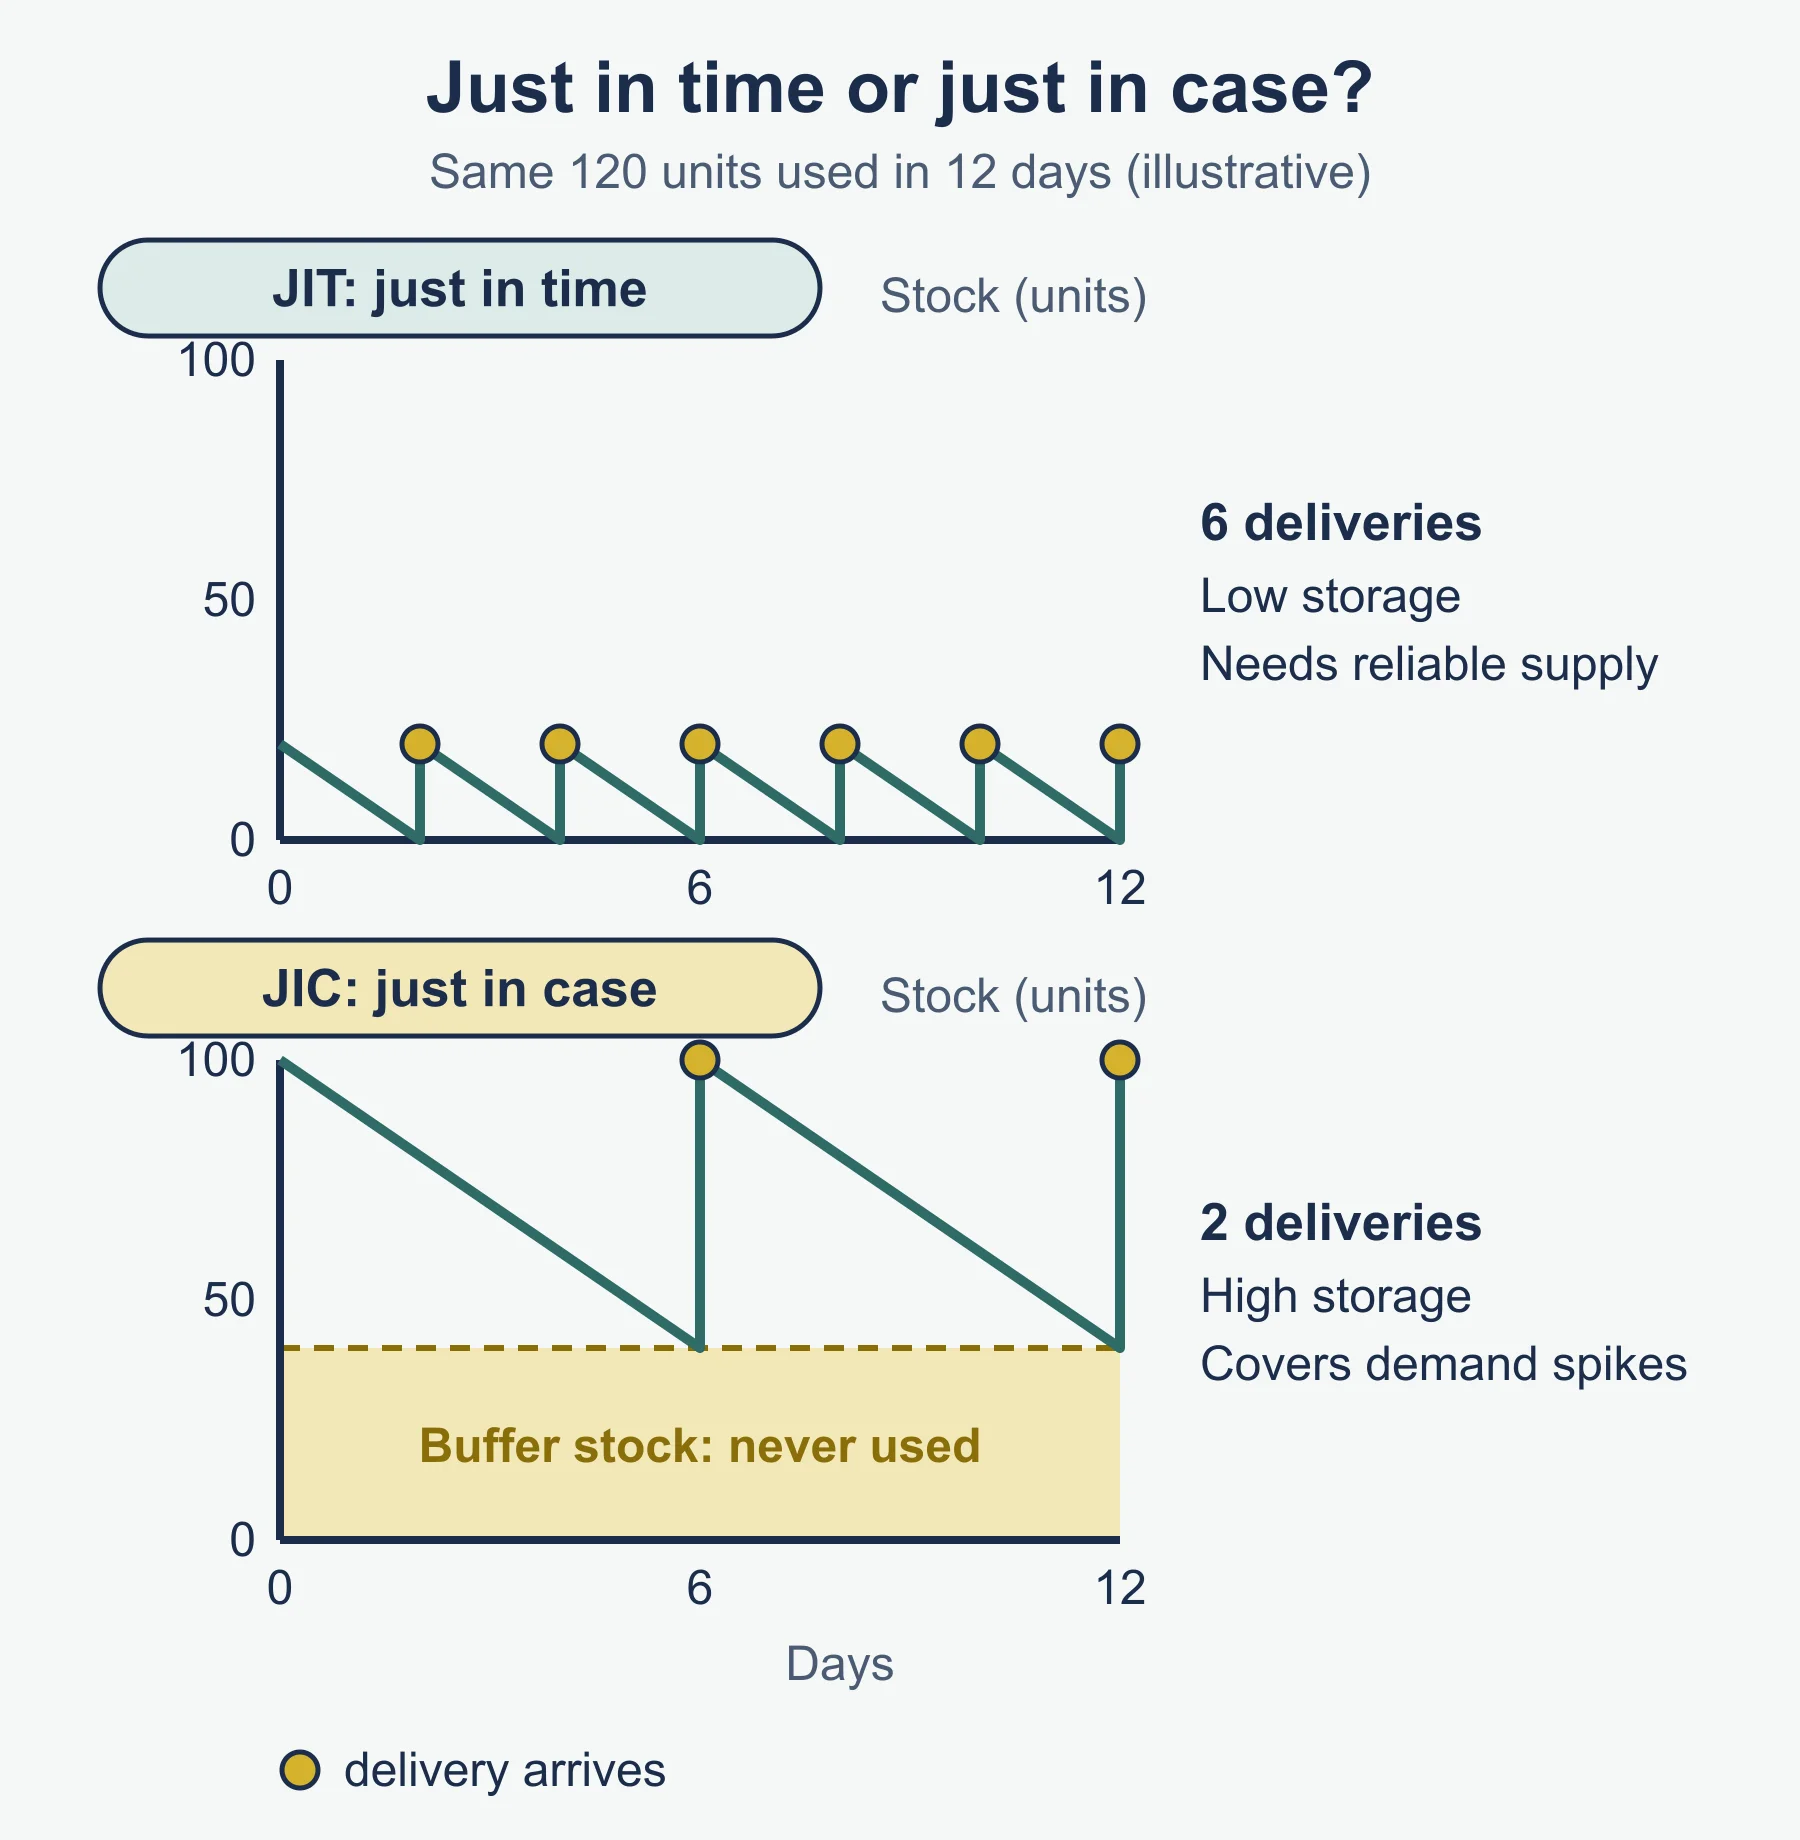
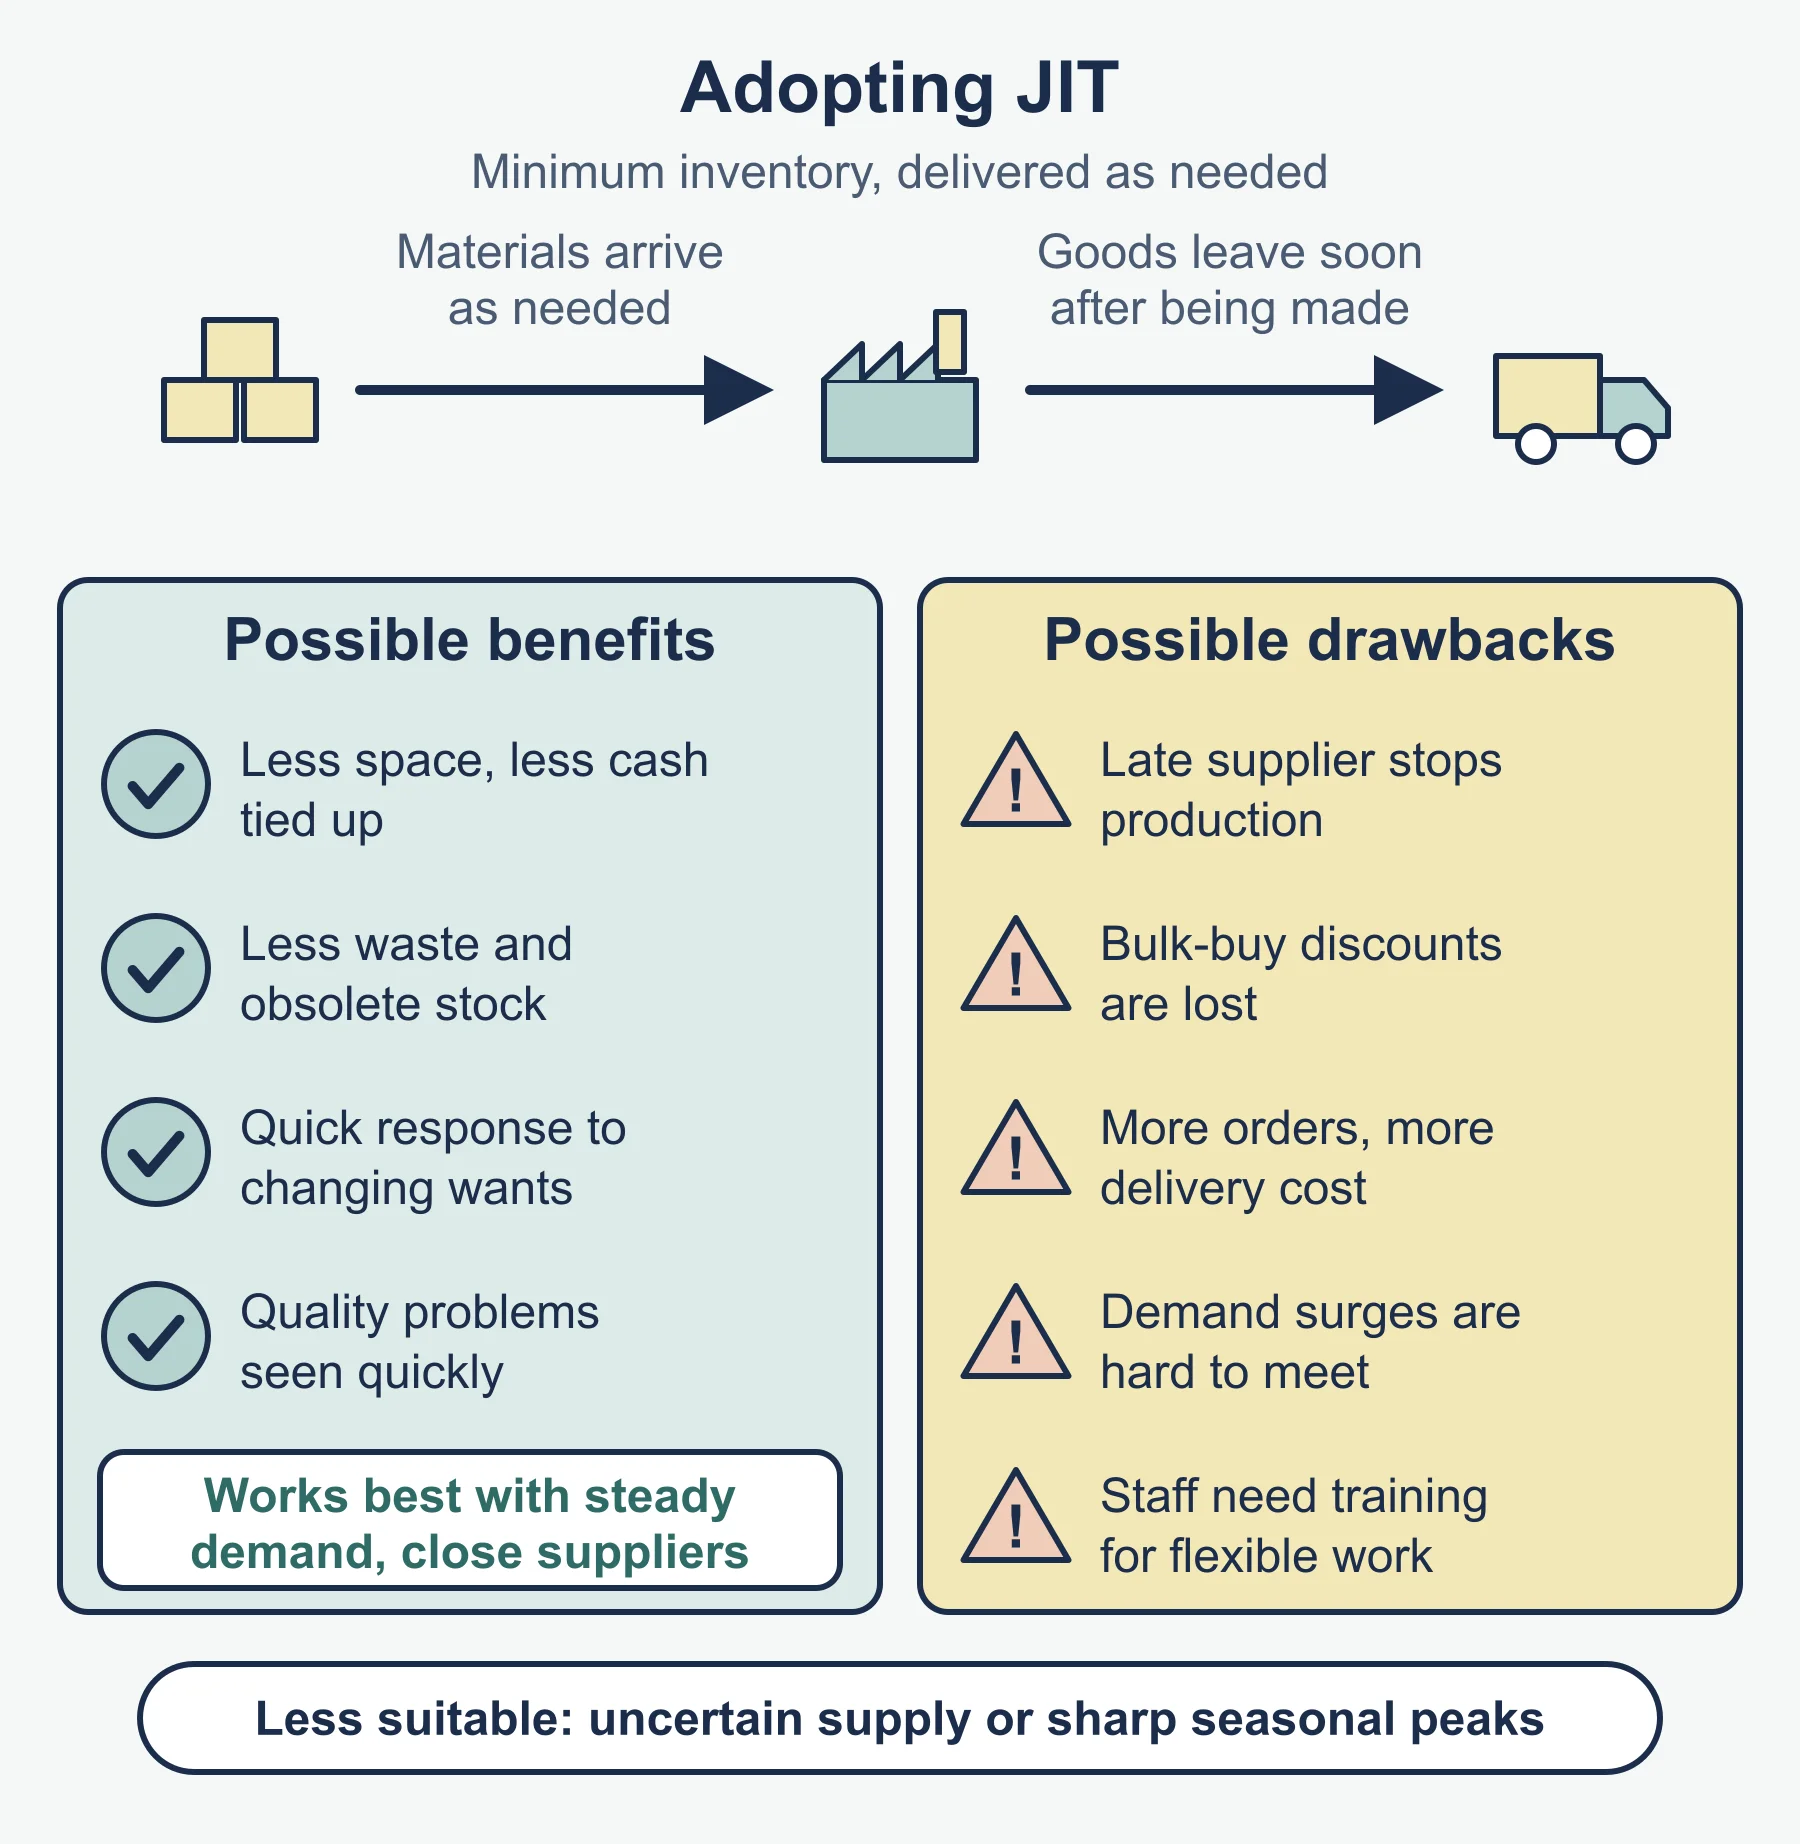
- JIT: minimal stock, needs reliable suppliers. Kanban: cards signal replacement. Electronic: continuous recording and automatic orders.
- Match to production method: flow needs steady supply; job needs stock tailored to each order.
Productivity, capacity and efficiency
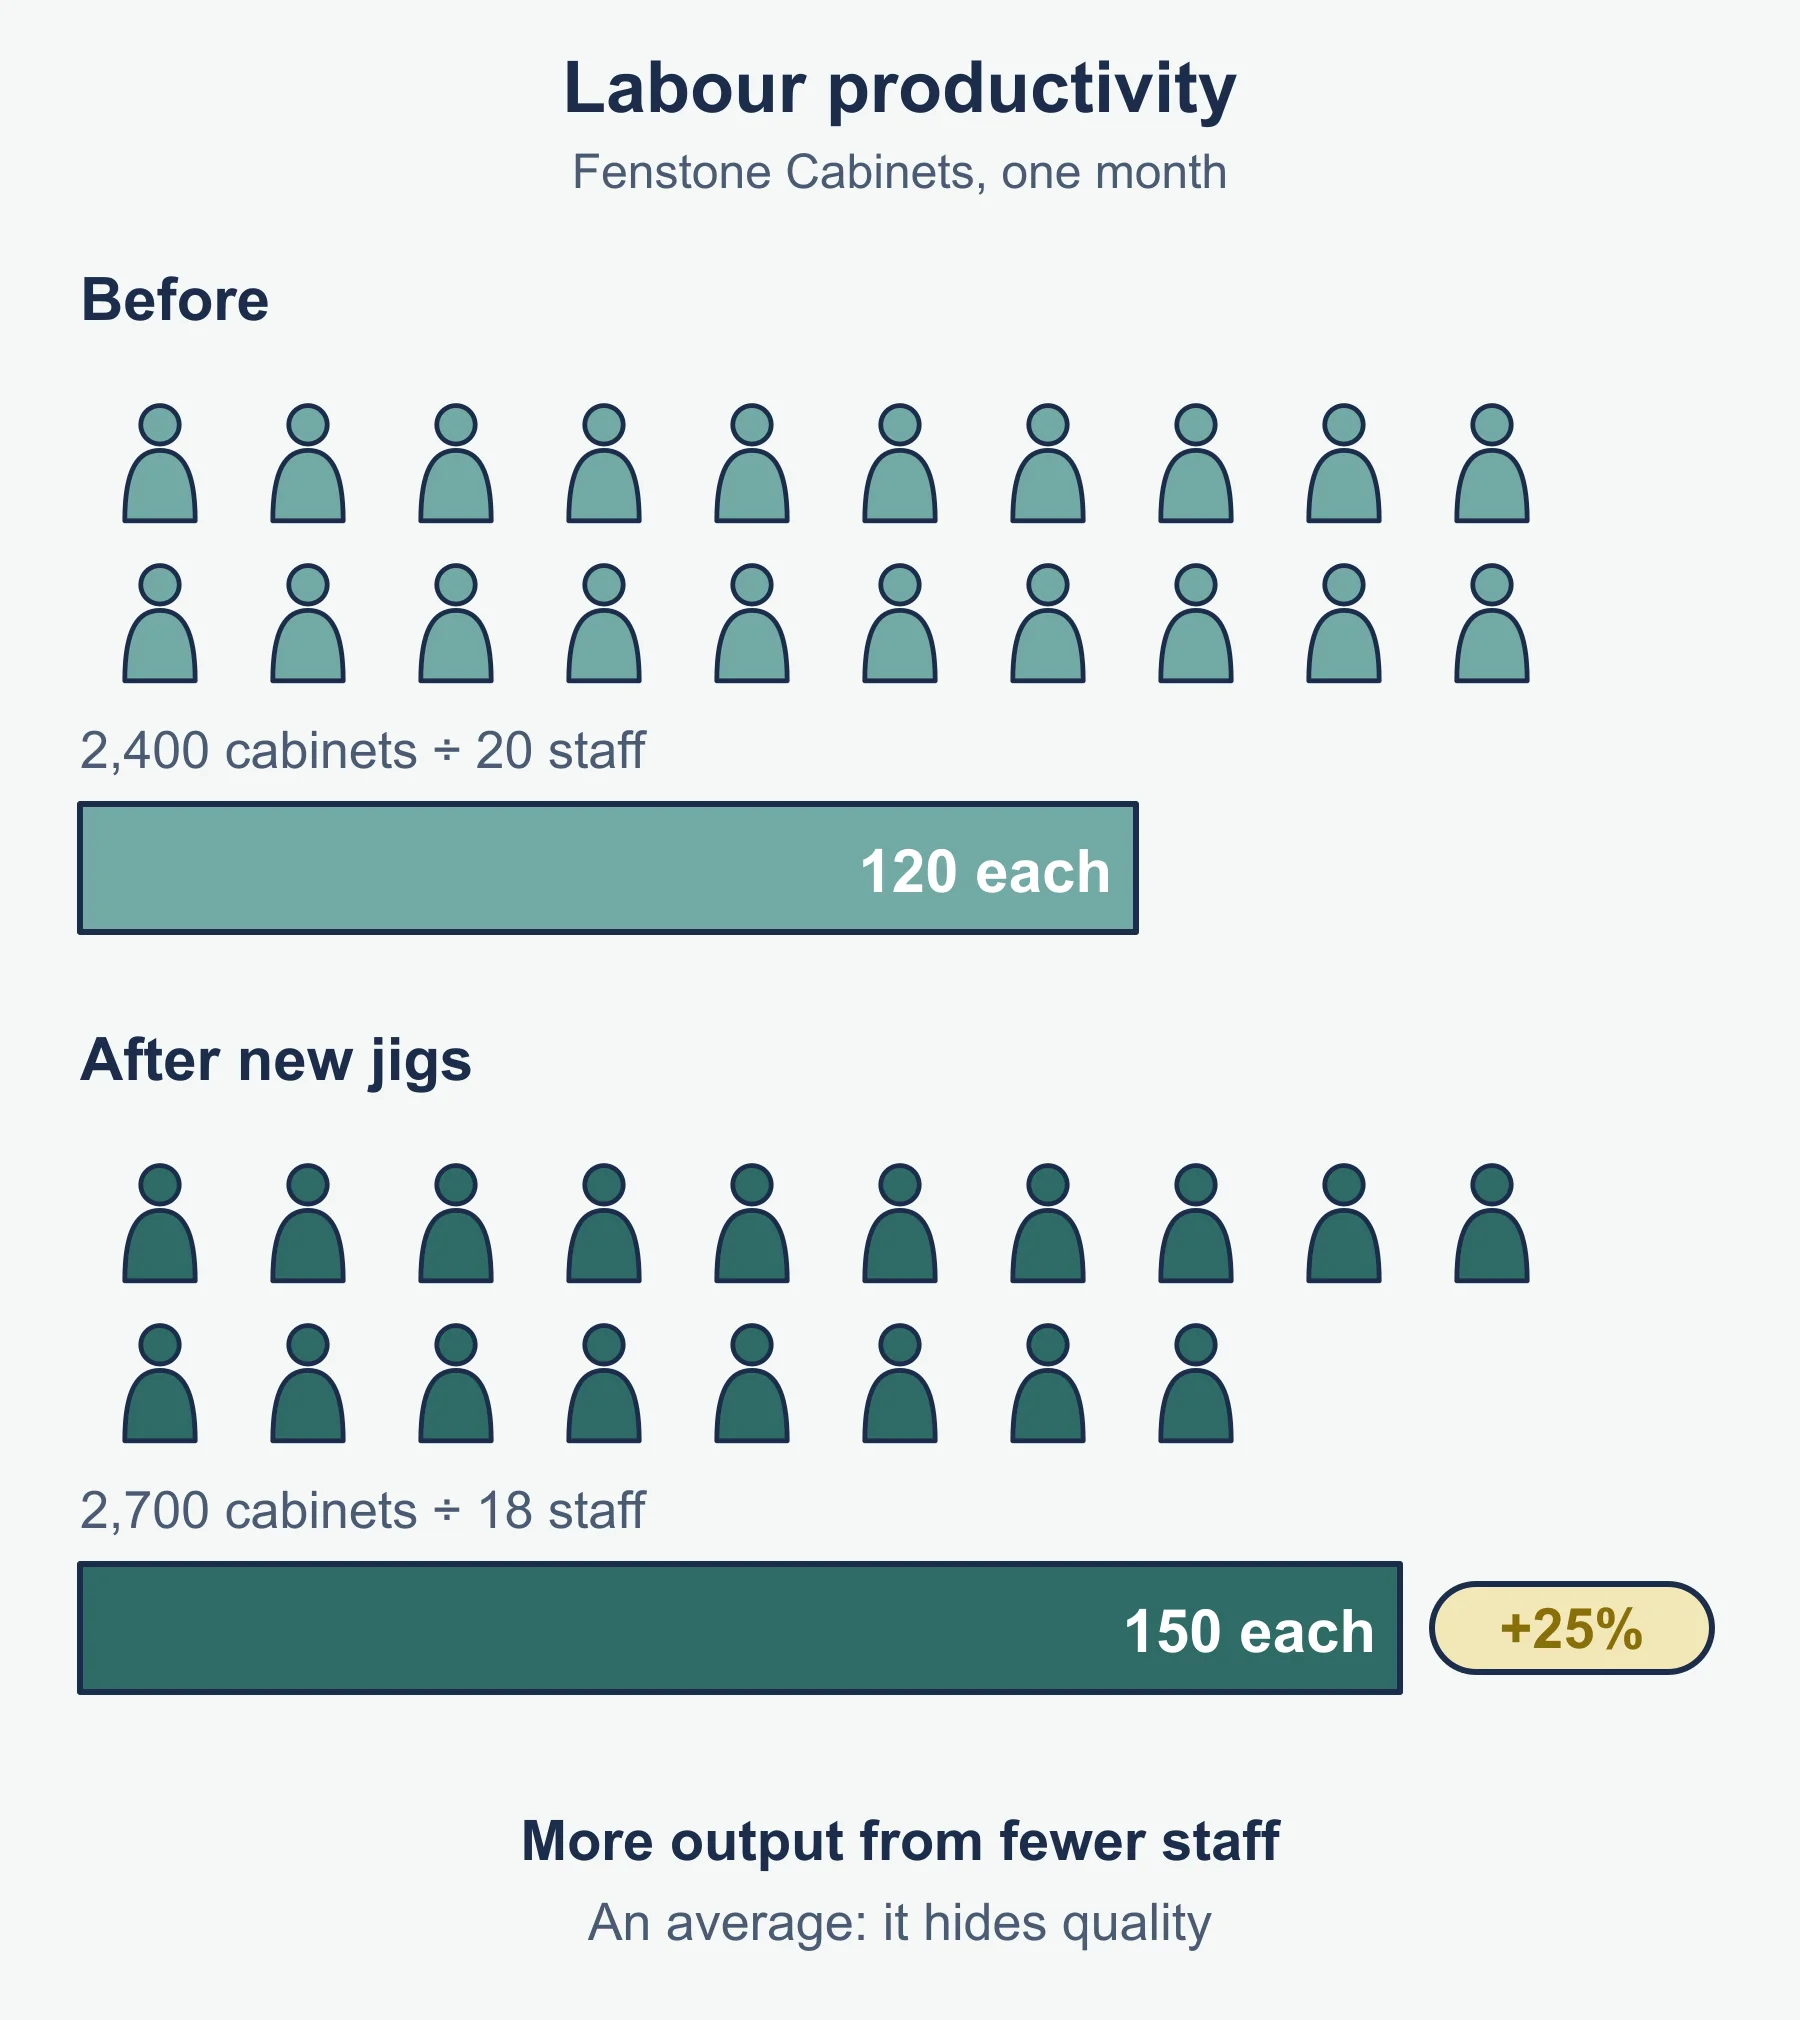
- Improve productivity by training, machinery, incentives, layout. Justify one using the case.
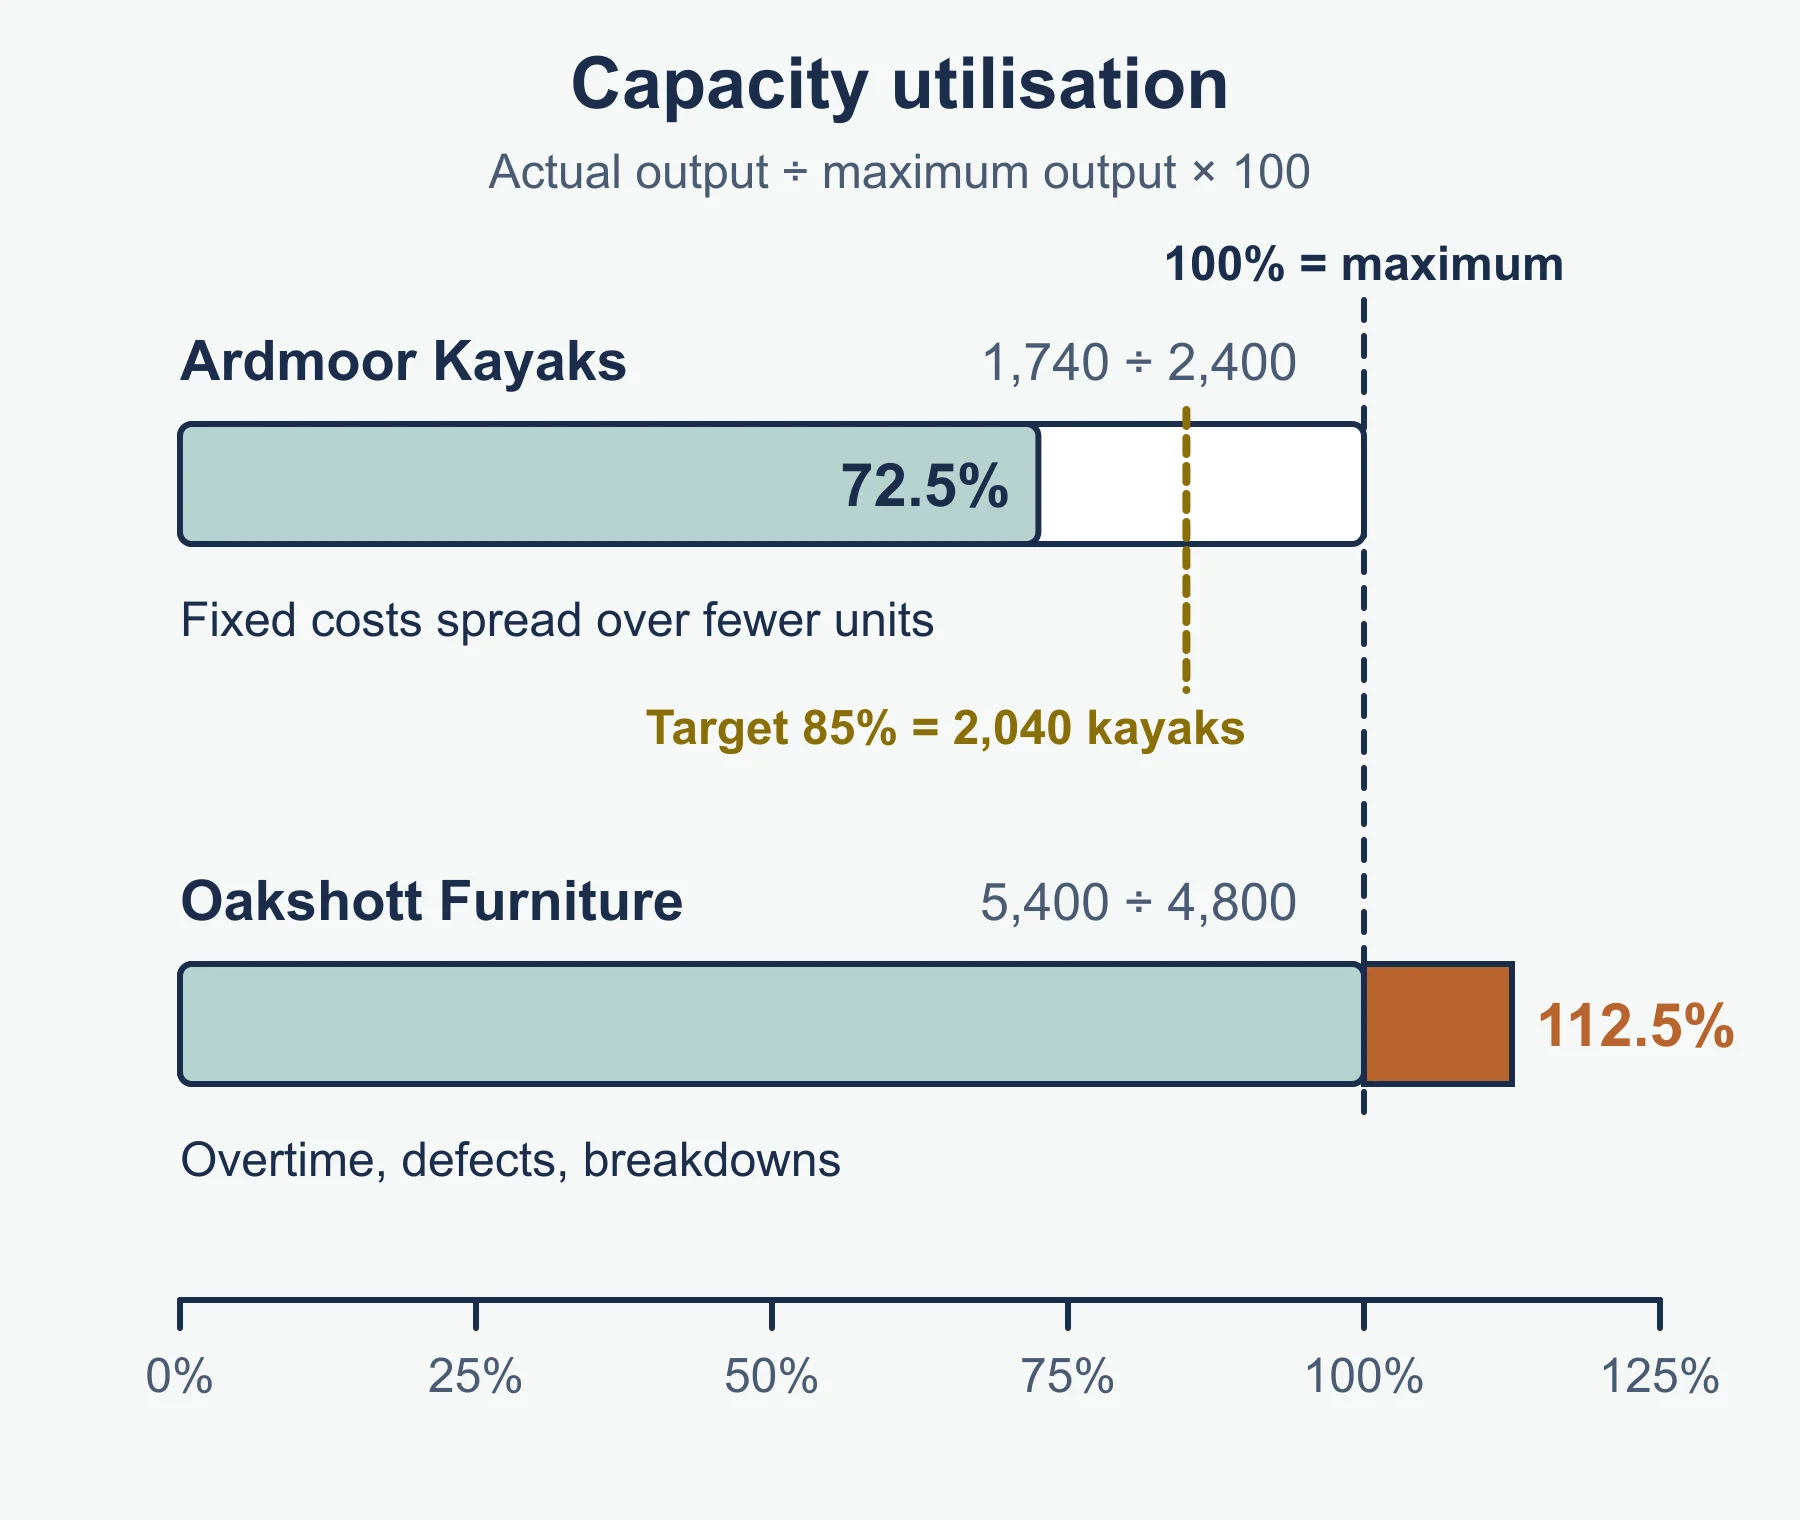
- Low capacity utilisation: high unit fixed cost. Near 100%: no spare room for surges or maintenance.
- Raise capacity: premises, shifts, subcontracting, temporary staff. Cut it: close sites, sell machinery.
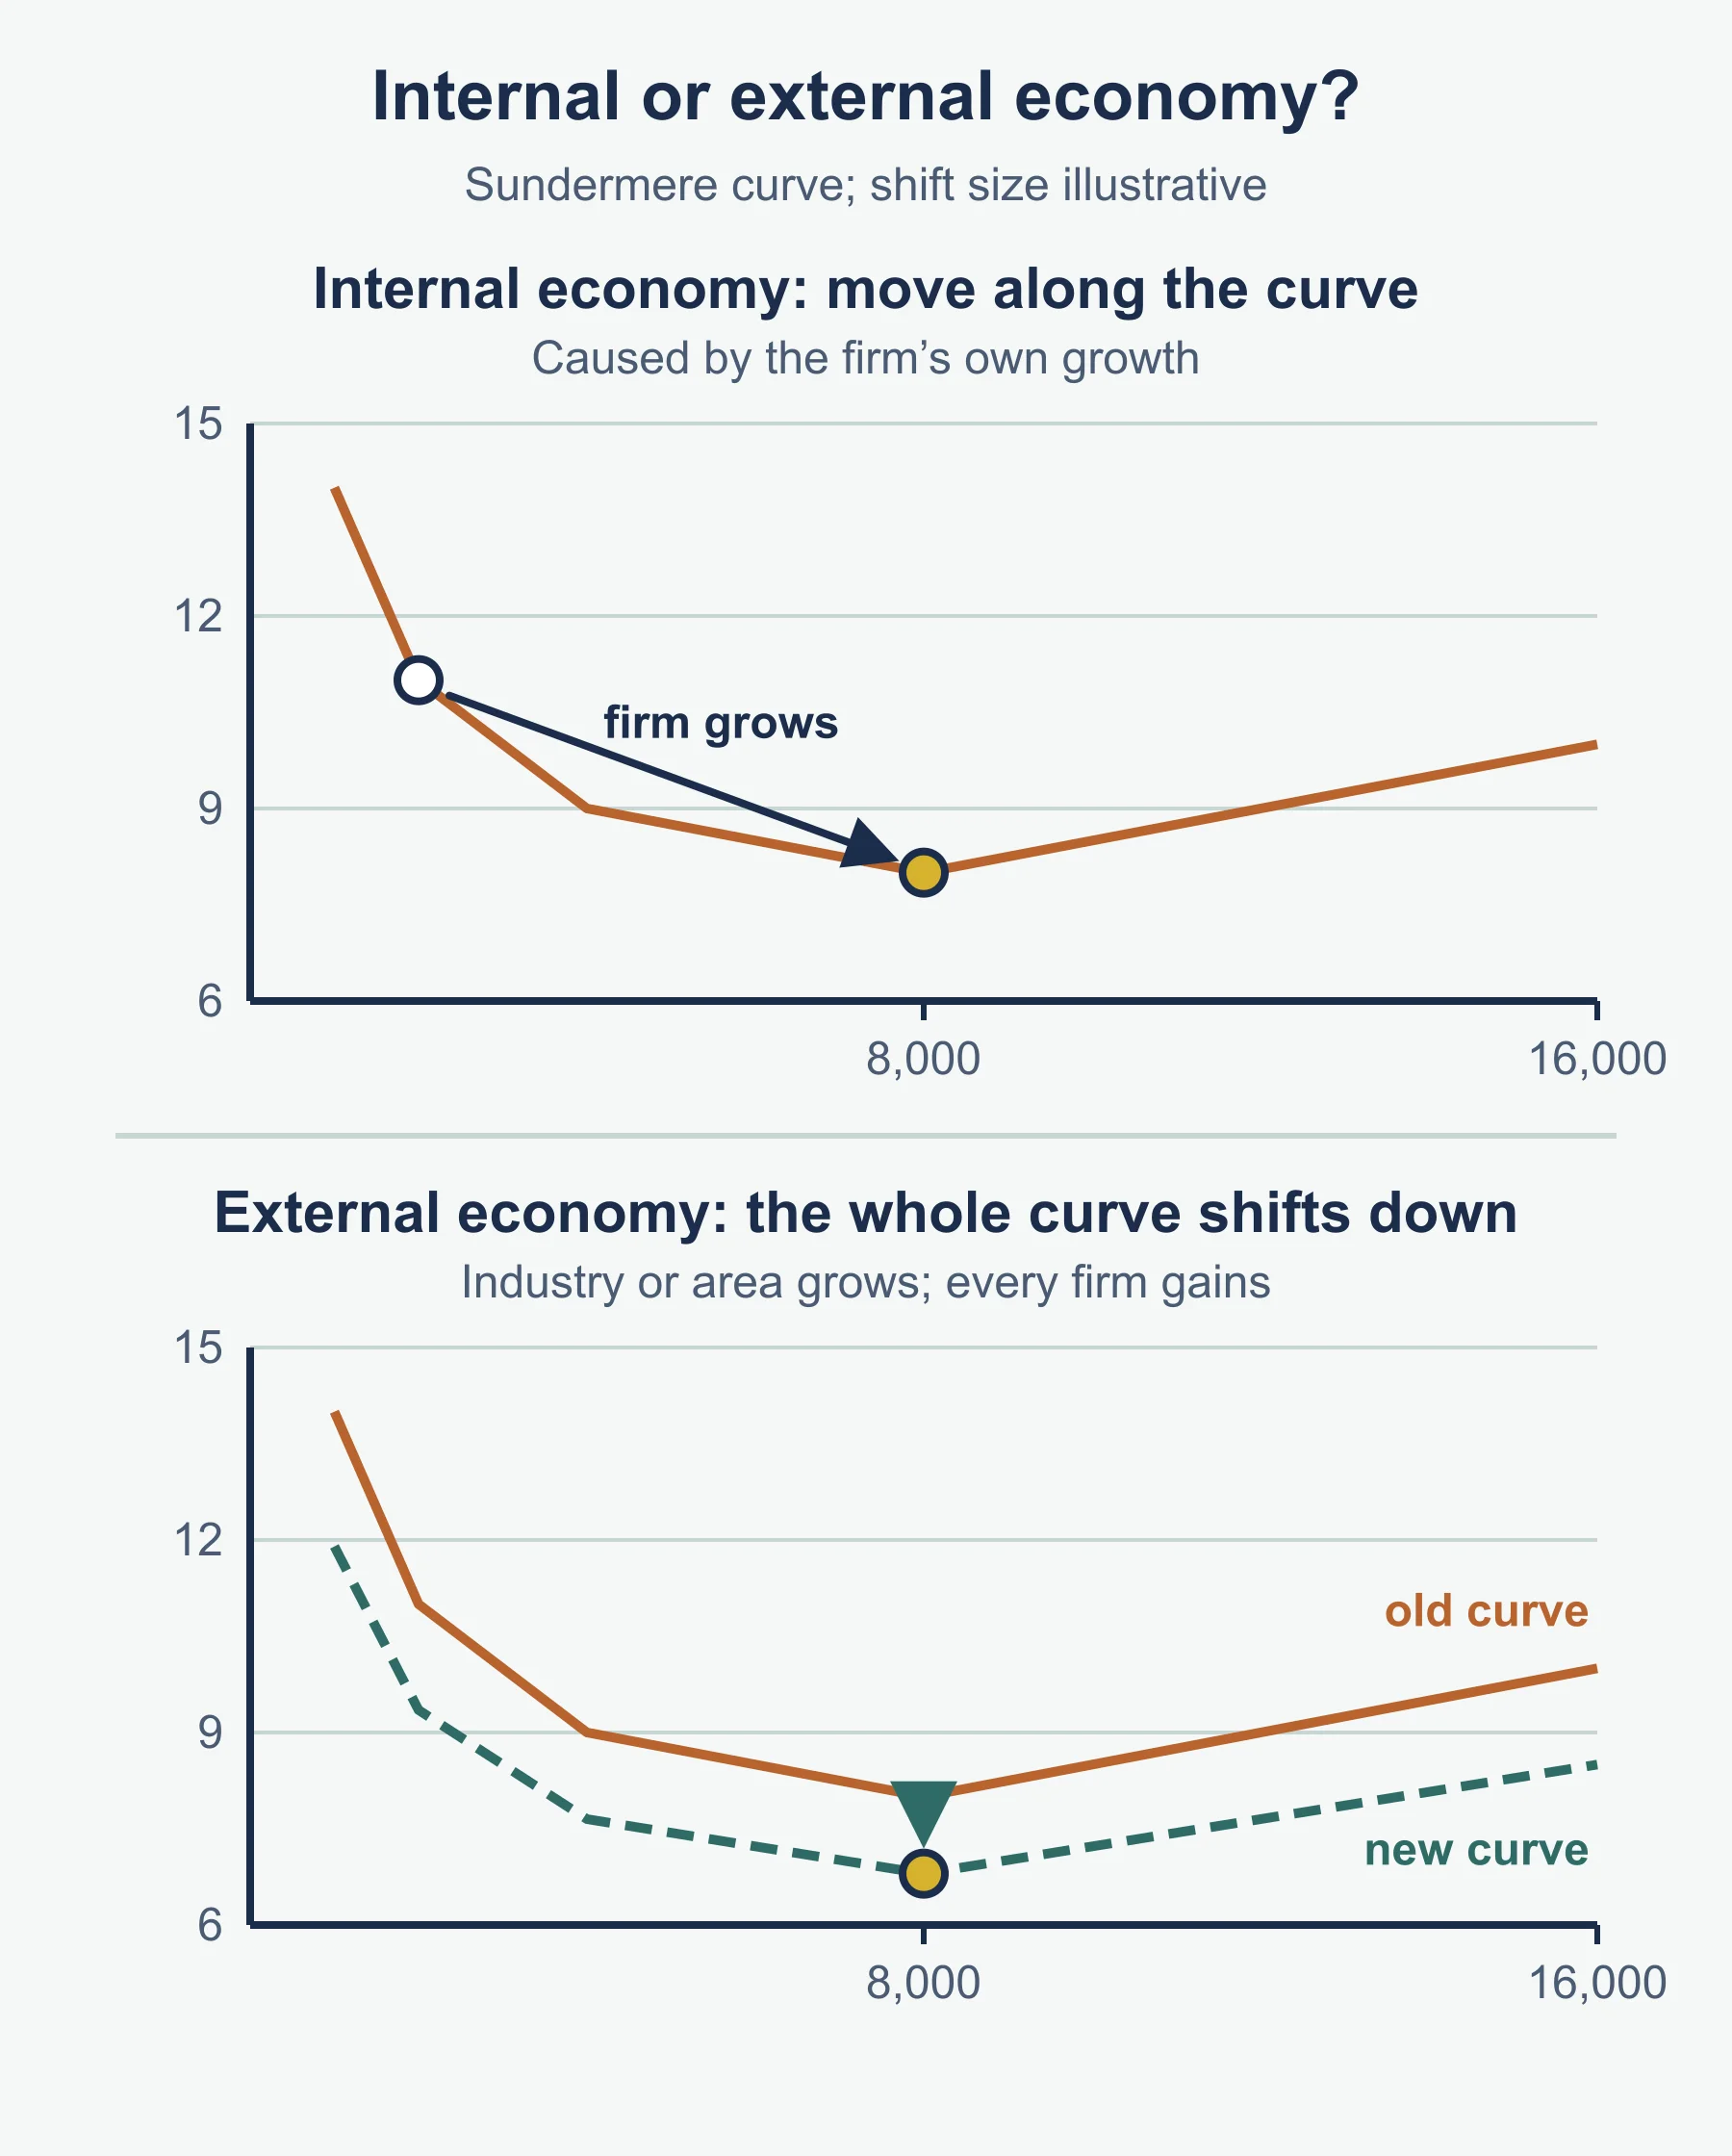
- Internal economies: technical, purchasing, financial, marketing, managerial. External: labour pool, supplier clusters, infrastructure. Diseconomies: communication, coordination, alienation, congestion.
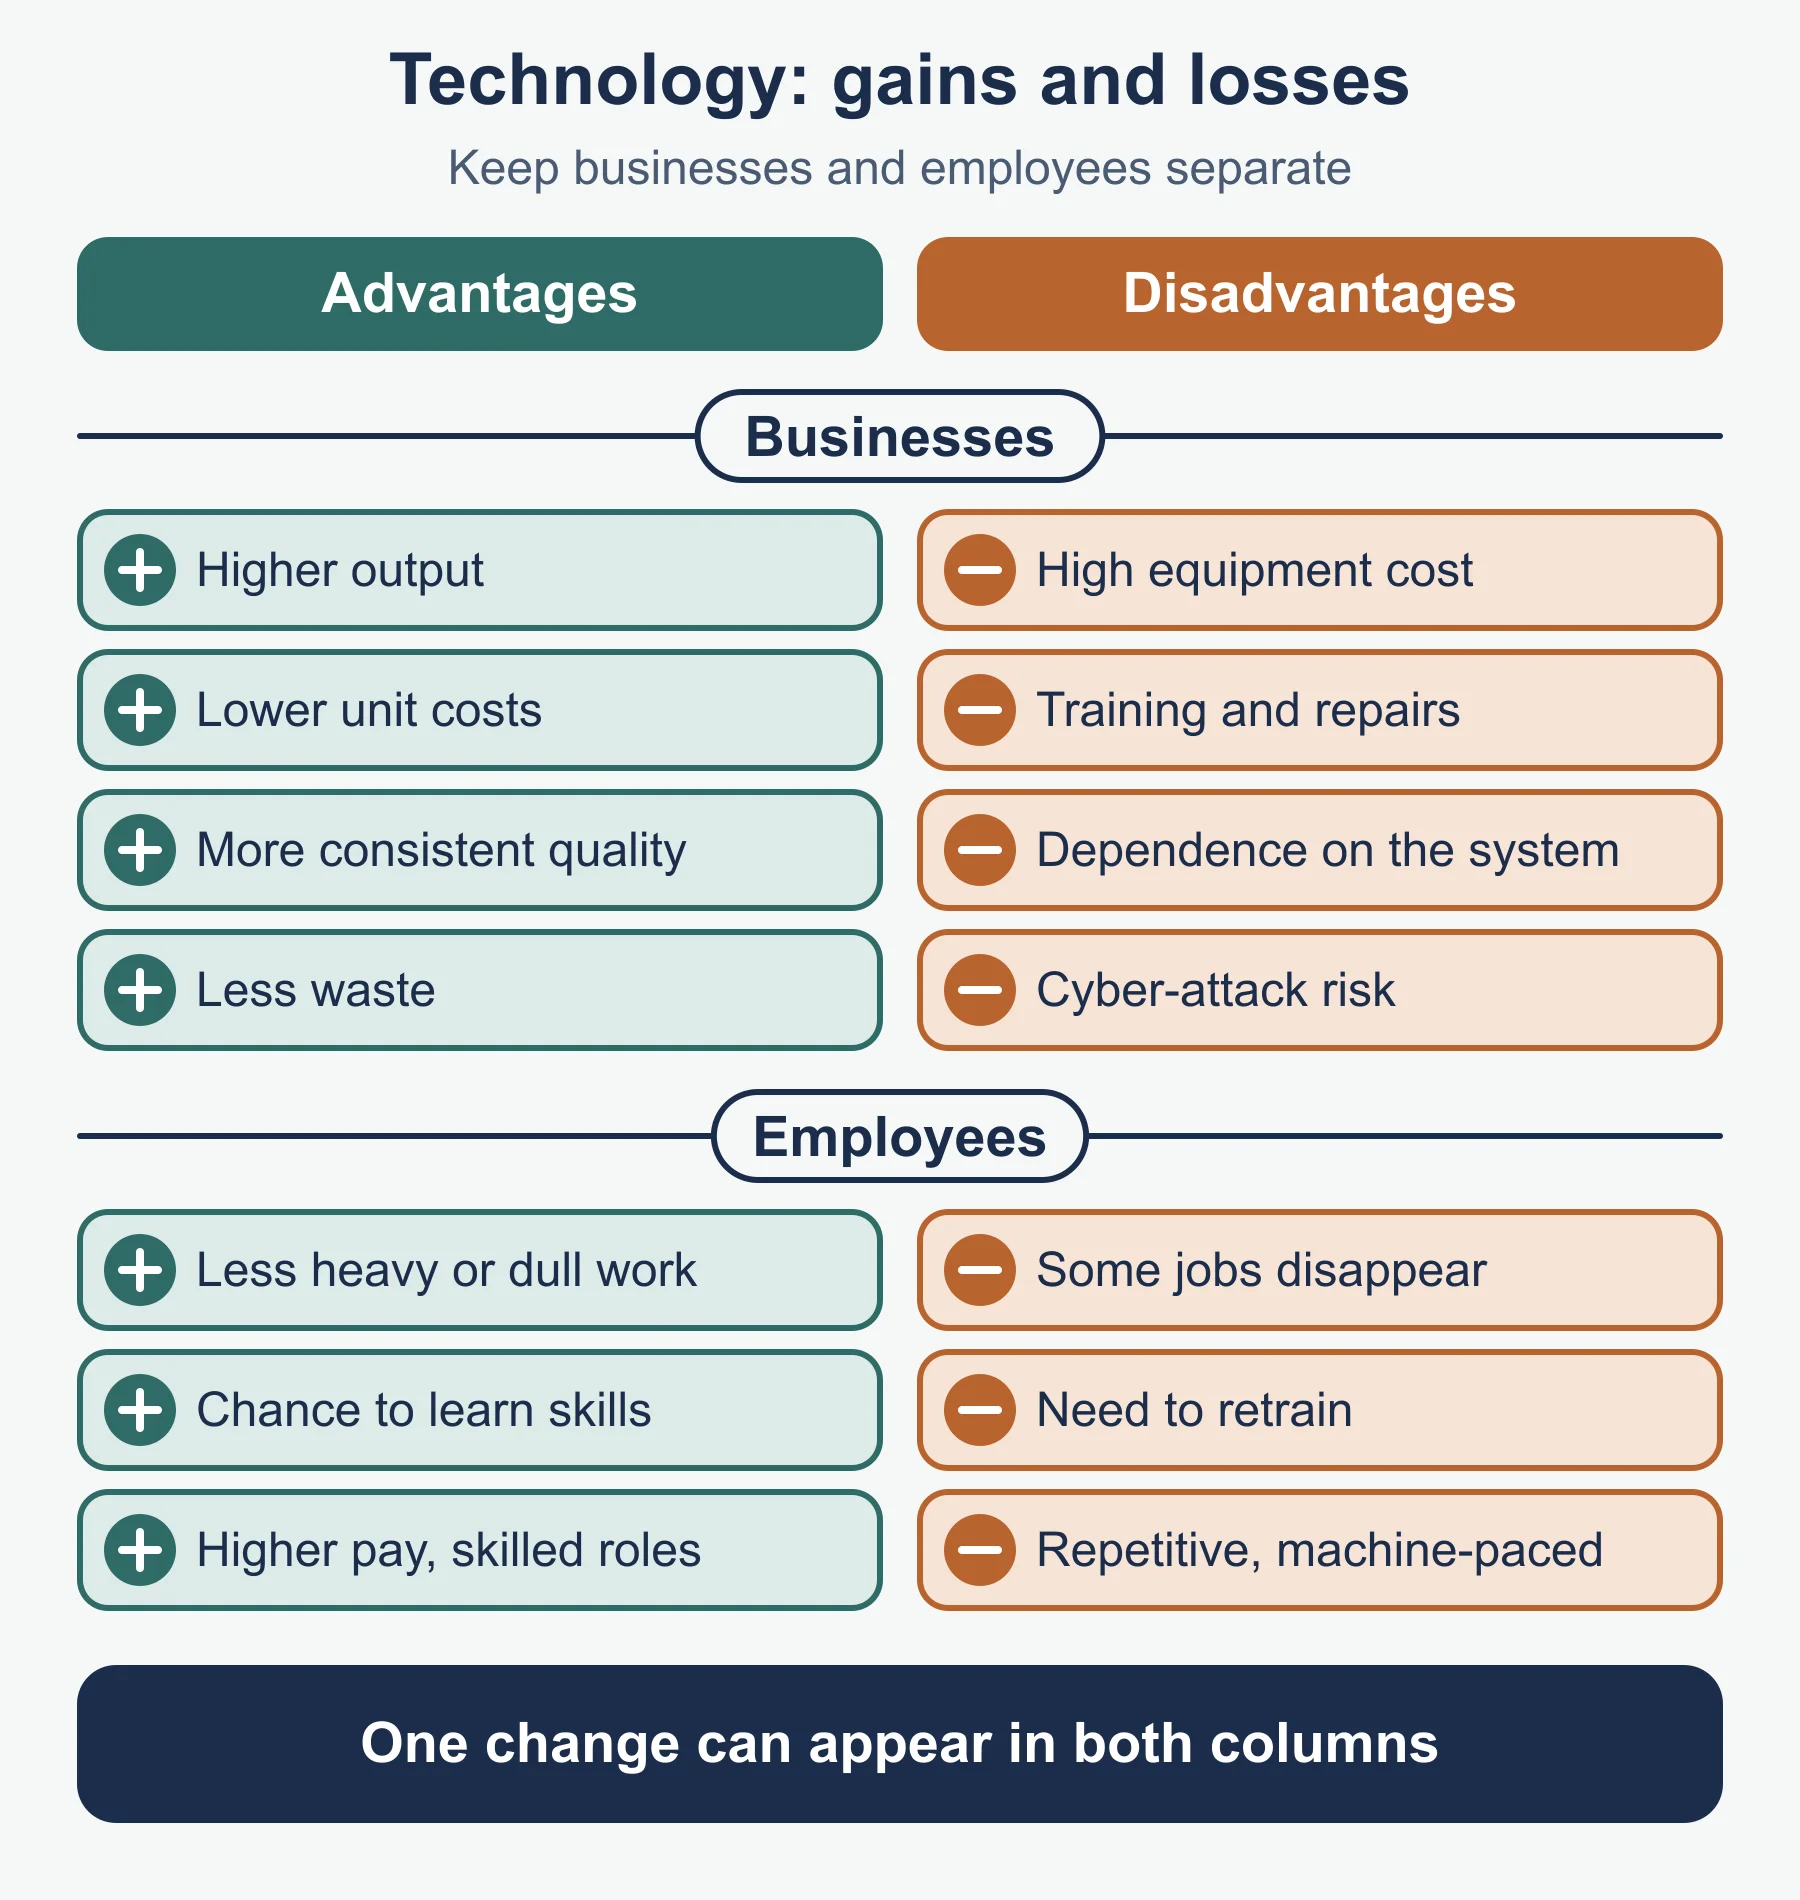
- Technology: gains in output and consistency; costs in capital, jobs and system risk.
Quality, services and standards
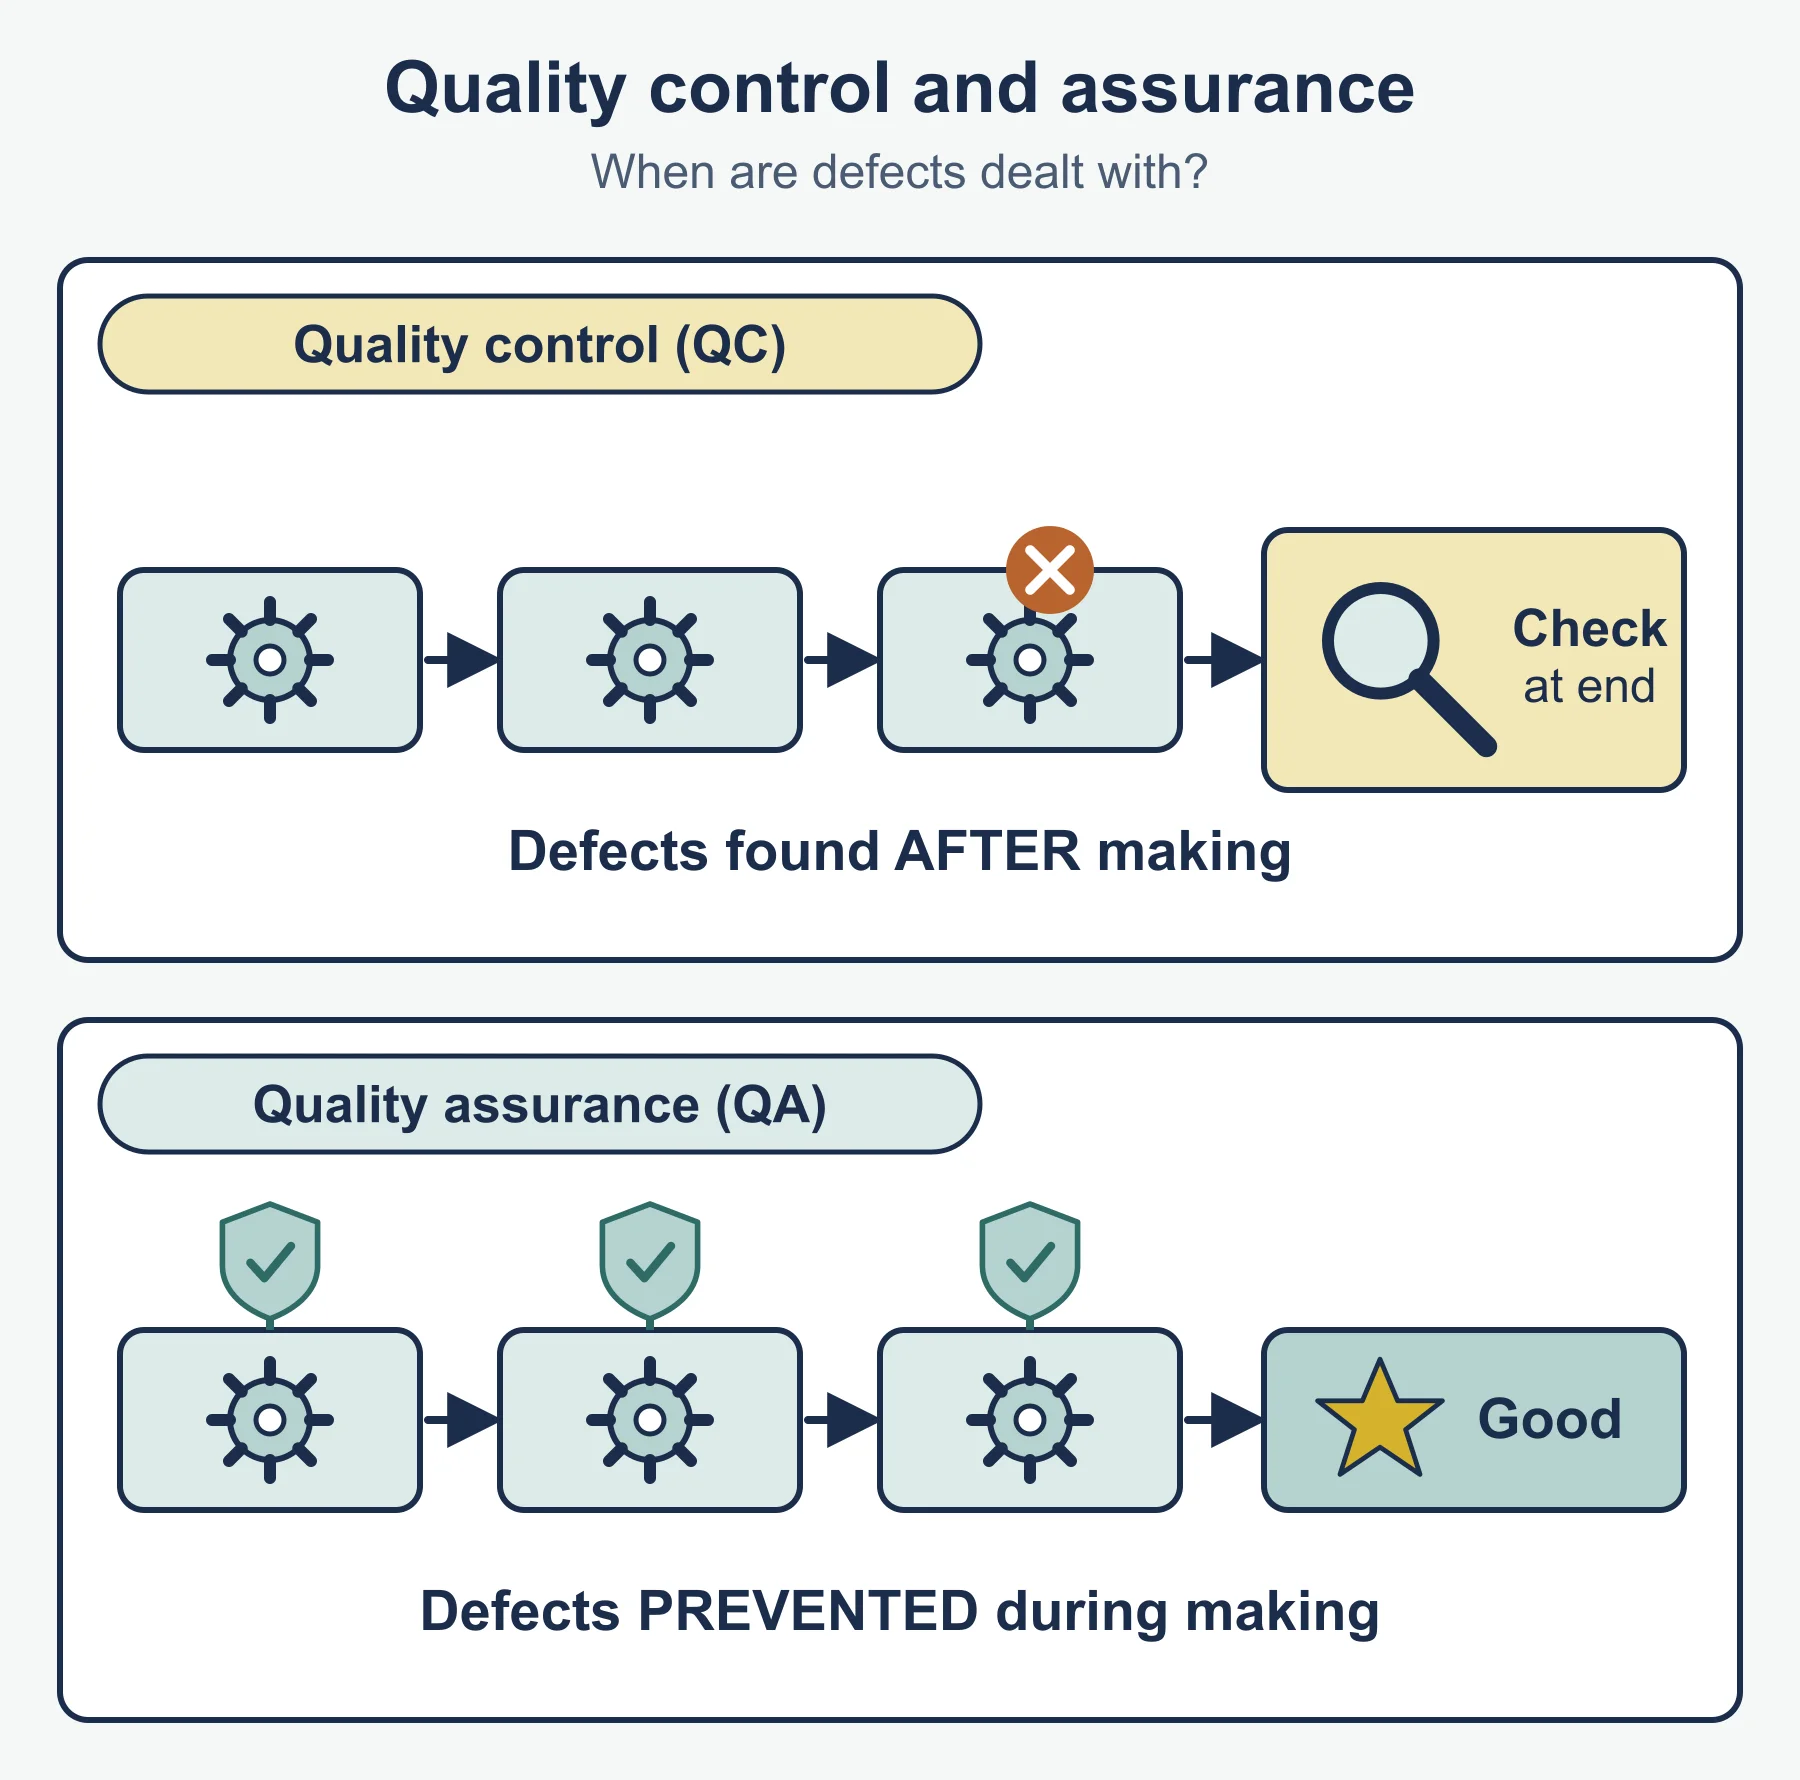
- Quality control detects defects; quality assurance prevents them.
- A lower wastage rate shows improving quality.
- External standards: BS, EN and ISO. Specific standards are not required.
- Service quality is monitored through surveys, mystery shoppers, complaints, repeat custom, waiting times and reviews.
- Poor customer service: lost sales, bad reputation, demoralised staff.
Location, logistics and sourcing
| Topic | Remember |
|---|---|
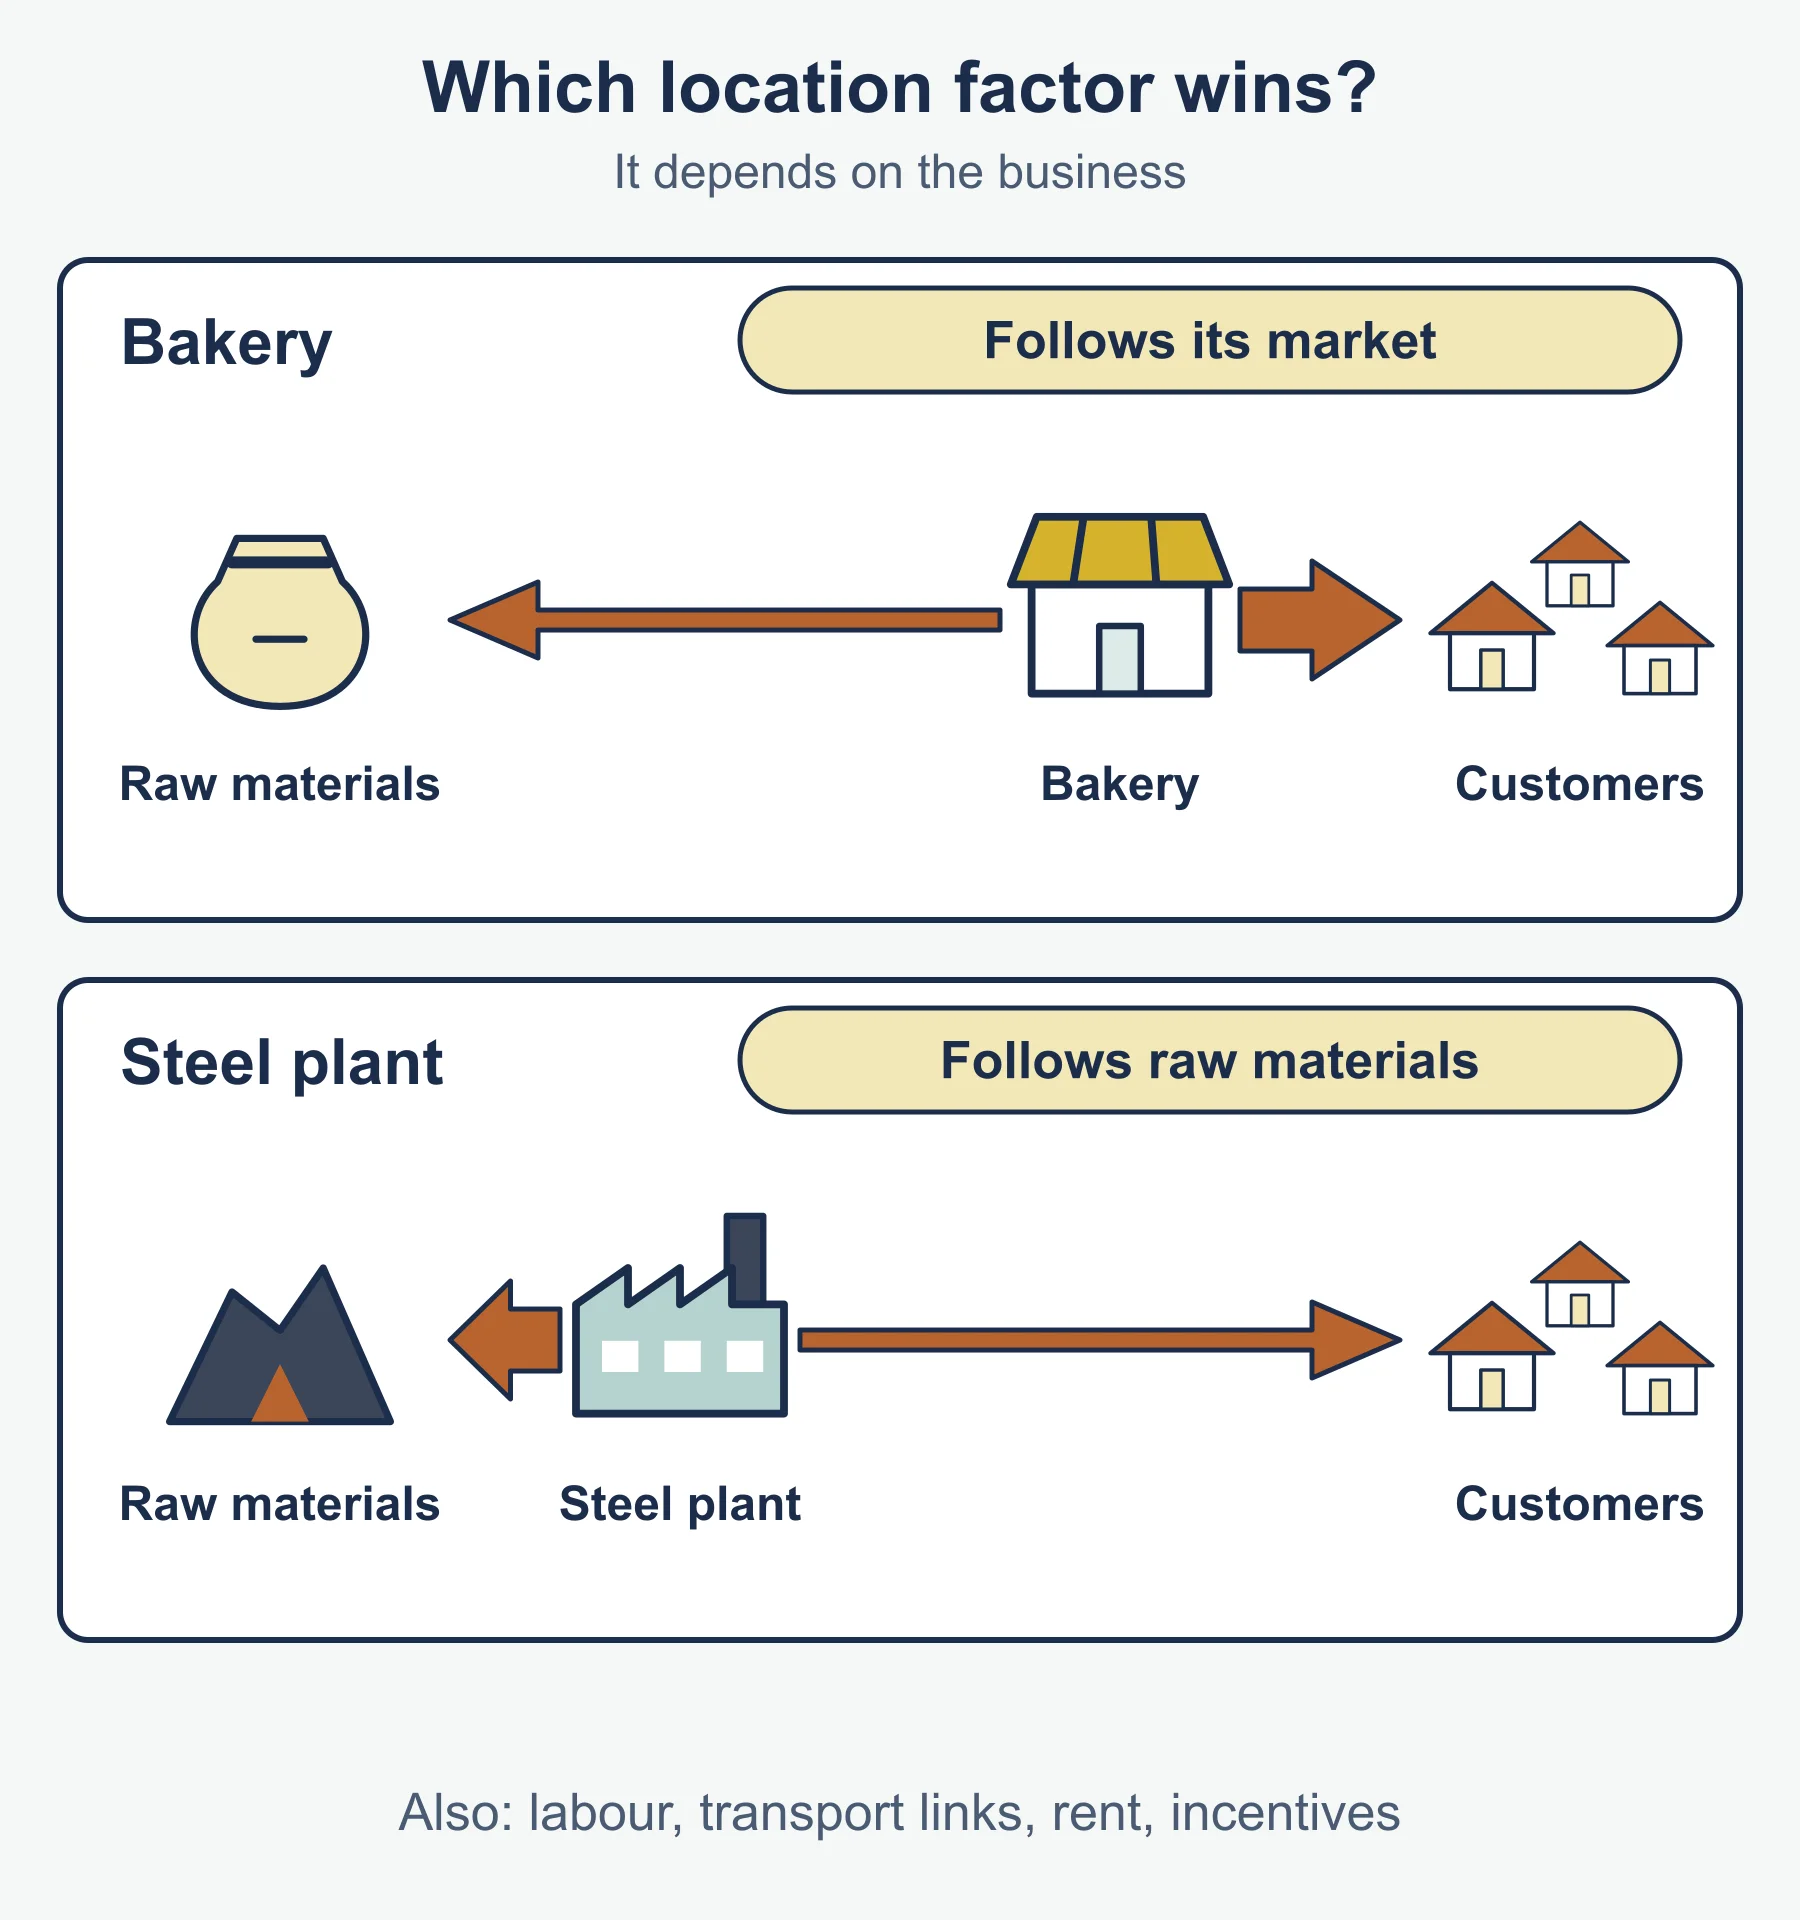
| Location factors | Customers, suppliers, labour, transport, cost, grants, competitors, expansion room, digital infrastructure |
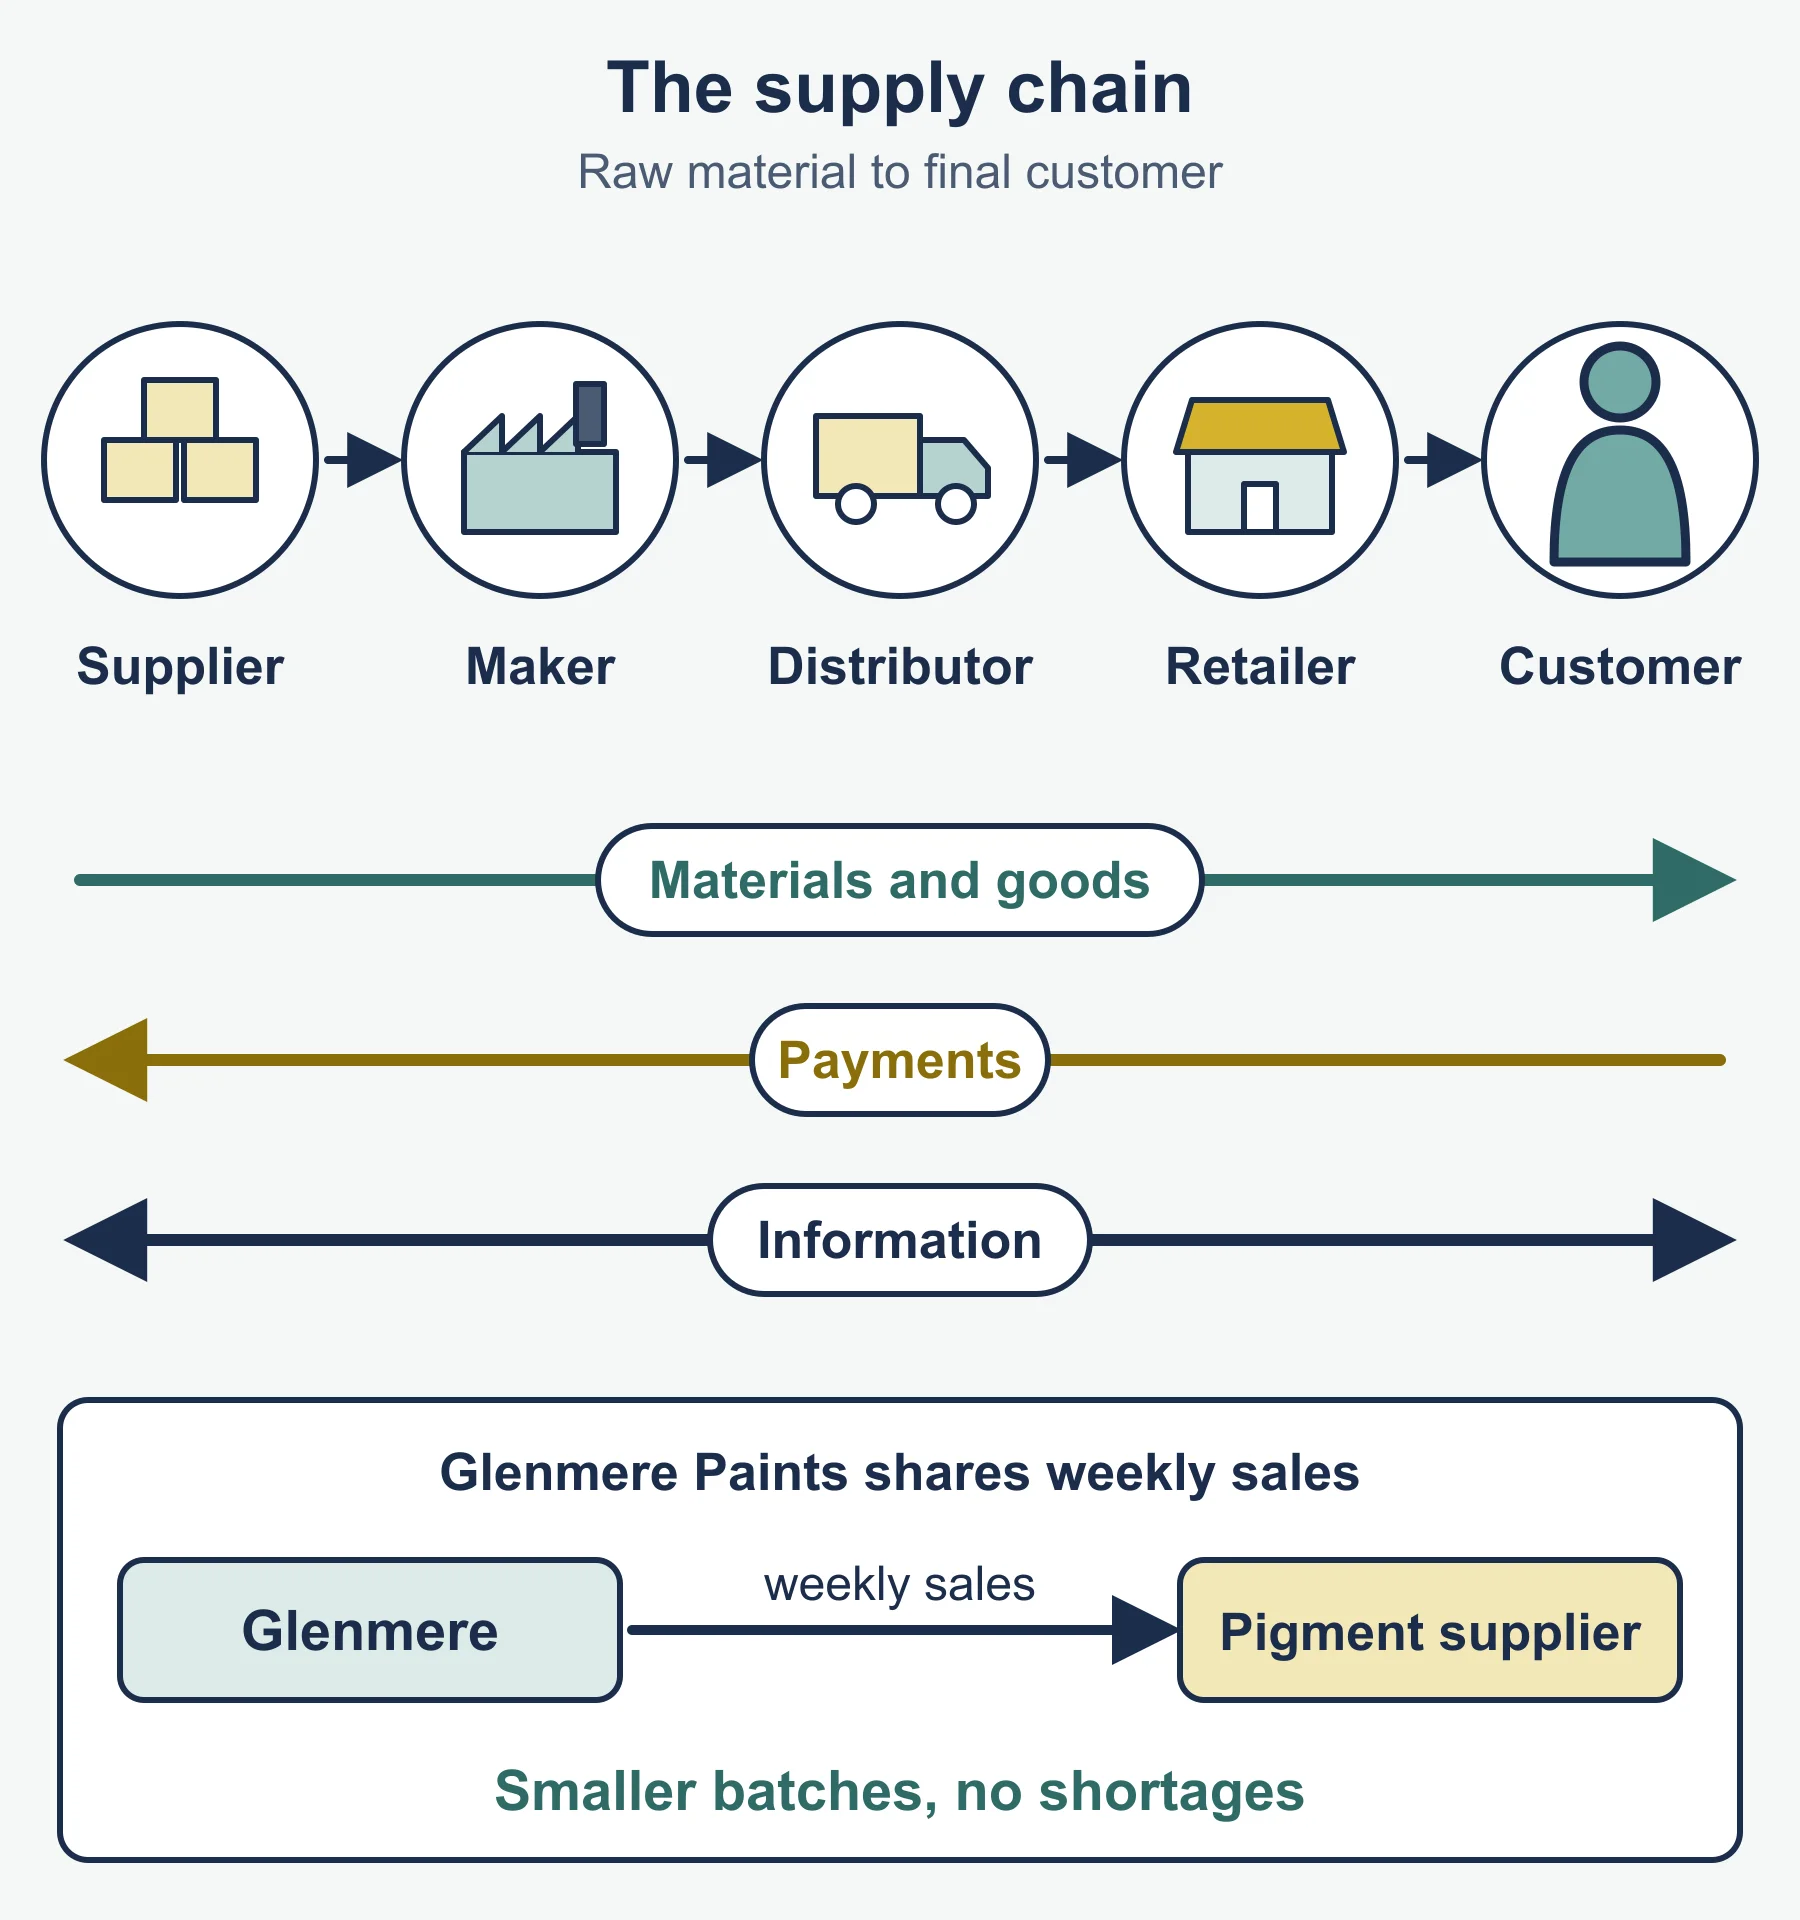
| Logistics | Supply chain management, distribution management, warehousing, distribution centres, digital |
| Outsourcing | Another business does an activity for you |
| Subcontracting | Another firm does part of a specific job |
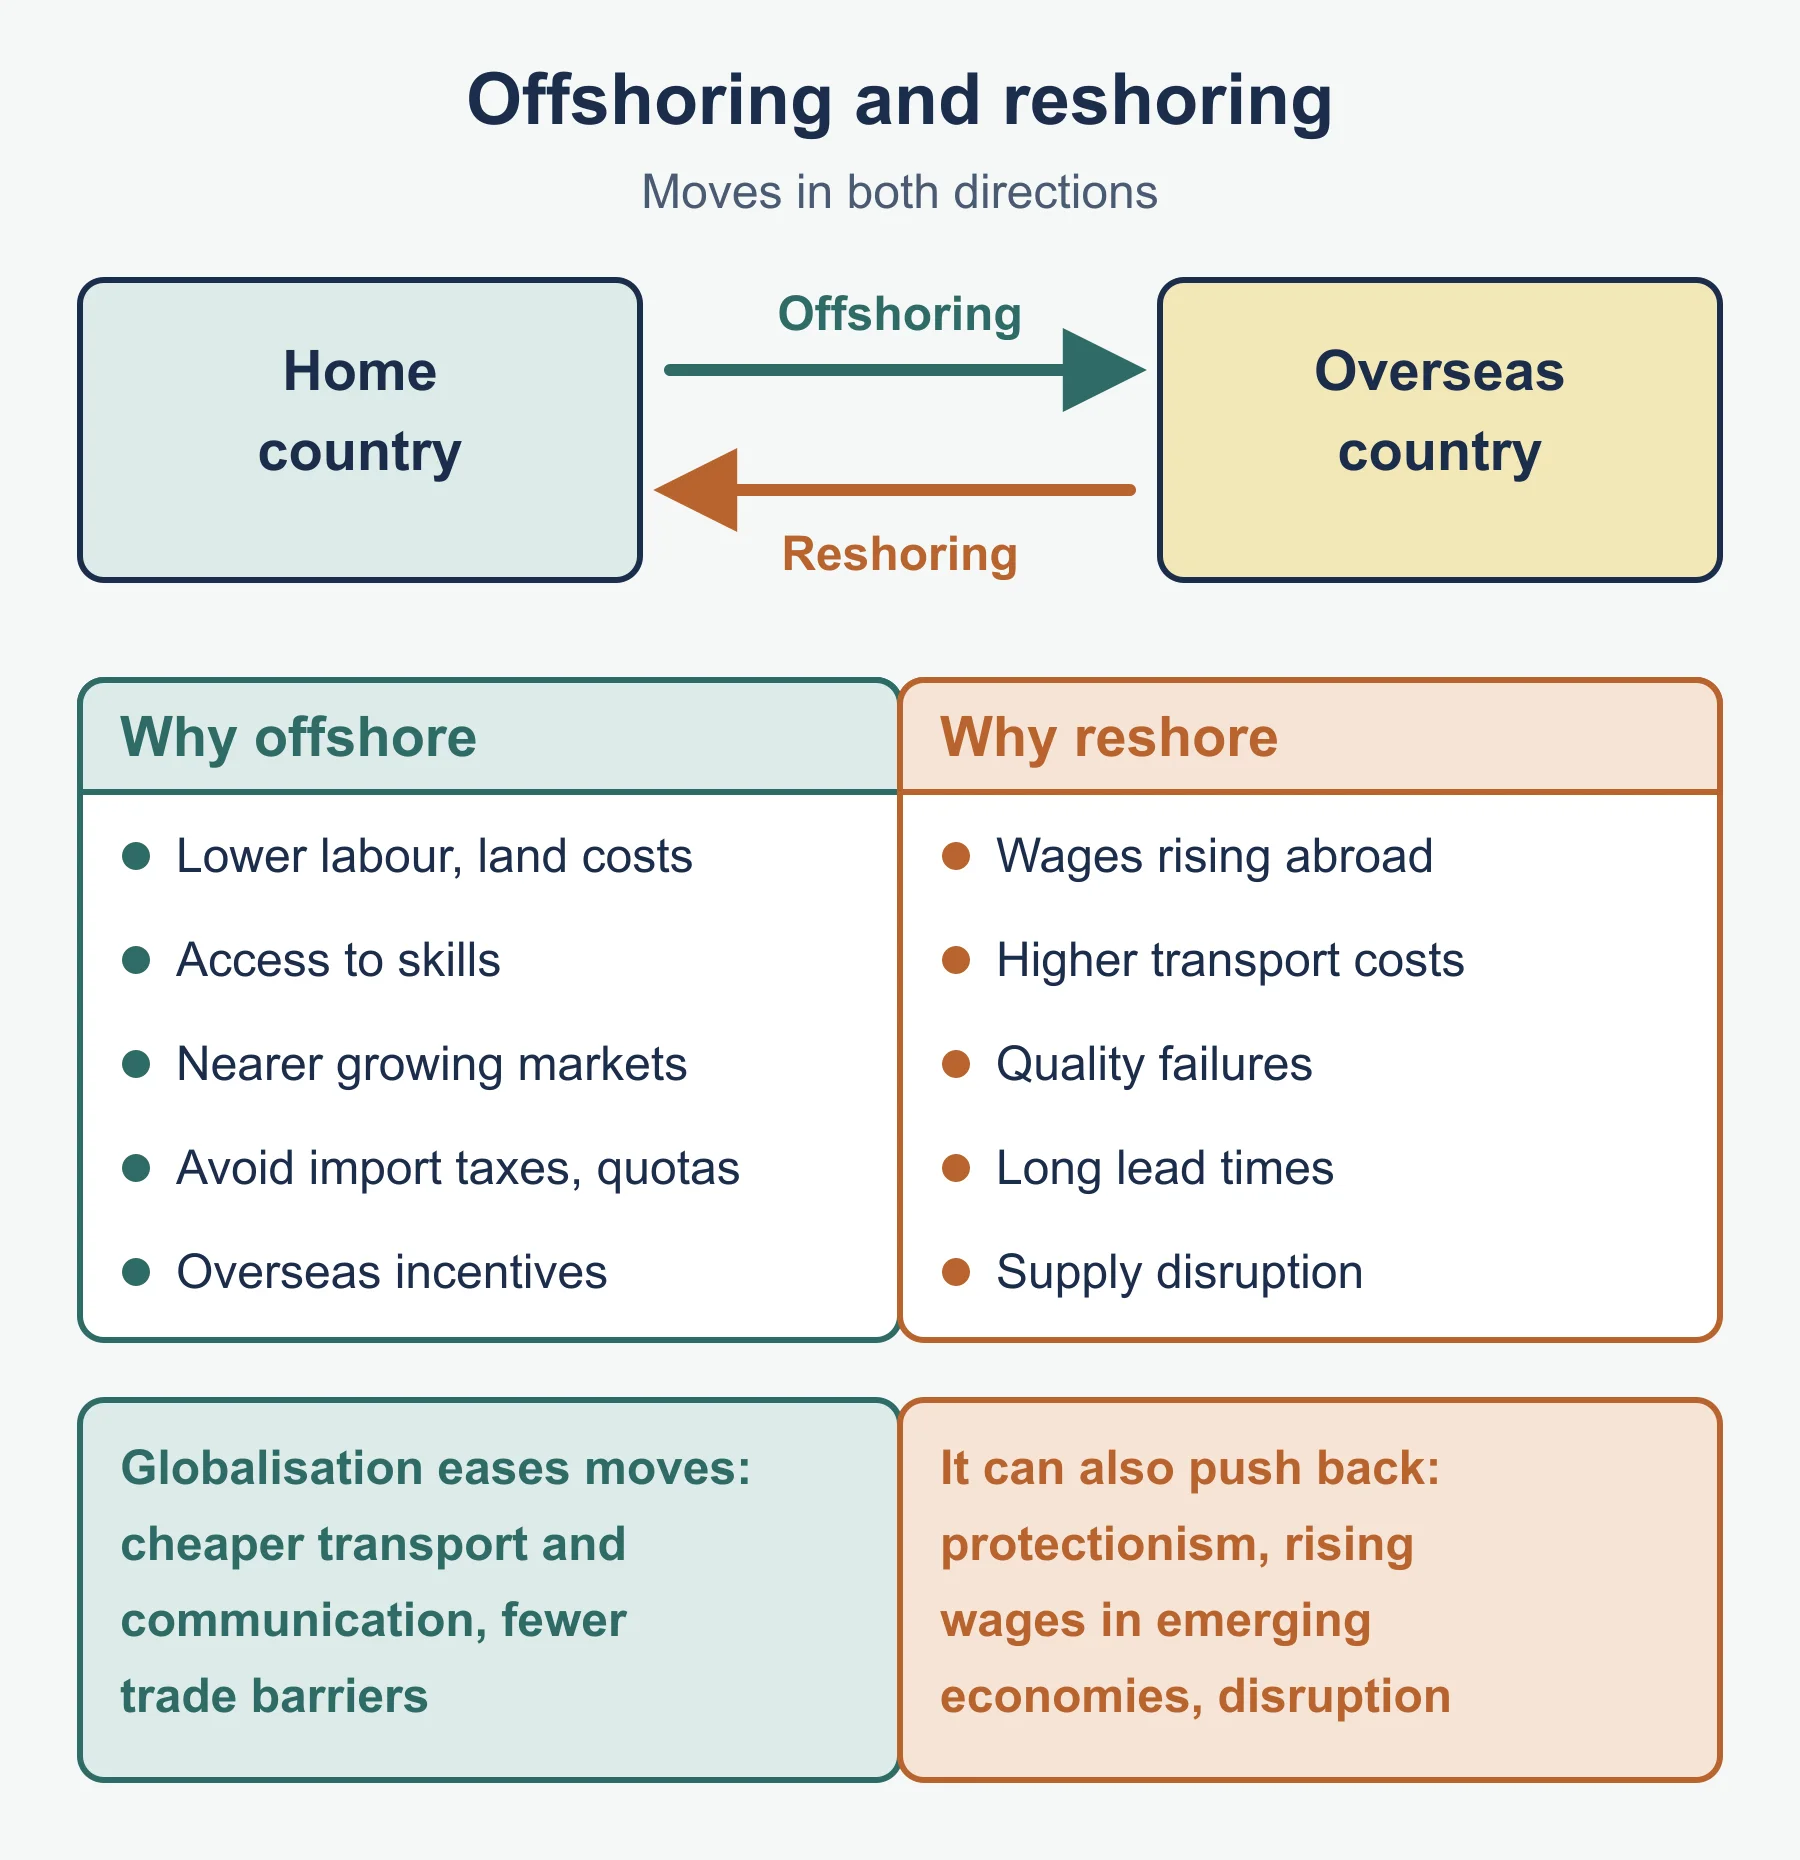
| Offshoring | Activity moved abroad |
| Re-shoring | Activity brought back home |
External influences on operations: social, legal, ethical, environmental, economic, political, technological, international.
Impact checklist by topic
- Lean production: lower waste and cost, faster response; risks are supplier failure and strain on staff.
- Technology: output and consistency up; capital cost, redundancy and retraining to weigh.
- Training for quality: fewer errors and returns; cost of lost working time.
- Benchmarking: shows performance gaps; copying others seldom creates a lasting advantage.
- Outsourcing: access to expertise and lower cost; less control and dependence on the supplier.
- Innovation: possible premium and lasting advantage; high cost and uncertain return.
Must-know distinctions
- Added value is not profit.
- Quality control (inspect) versus quality assurance (prevent).
- Product innovation versus process innovation.
- Outsourcing (any activity, any place) versus offshoring (moved abroad).
- Total float (delay without delaying the project) versus free float (delay without affecting the next activity).
- Economies of scale: internal (own size) versus external (industry size).
Small worked reminders
- Float. An activity with EST 4, duration 3 and LFT 10 has total float 10 - 4 - 3 = 3 days. If its successor starts at 9, free float is 9 - 4 - 3 = 2 days.
- Stock chart. Buffer 100, usage 30 a day, lead time 2 days, reorder quantity 400: reorder level 100 + 60 = 160; maximum 160 + 400 - 60 = 500.
- PERT. O = 2, M = 3, P = 10: (2 + 12 + 10) / 6 = 4 days.
- Gantt overlap. Task X runs weeks 1-4 and task Y weeks 3-6: they overlap in weeks 3-4 and the pair takes 6 weeks.
Evaluation and recommendation frames
For “evaluate the impact and importance” questions the specification asks about the business and its stakeholders, so cover both:
- State the point and tie it to the case figures.
- Give the effect on the business (cost, quality, speed, flexibility, profit).
- Give the effect on at least two stakeholders (customers, employees, owners, suppliers, the local community, the economy).
- Give a counter-point, such as cost, risk or time lag.
- Reach a judgement: which matters more here and why, with a condition such as “if demand is stable”.
For “recommend and justify” questions: choose one option, give two reasons from the case, say why the main alternative is weaker and name the risk you accept.
External influences on operations (social, legal, ethical, environmental, economic, political, technological, international) are best judged by asking how likely the change is, how large its effect on cost or delivery would be, and how far the business can respond.
Quick self-test
- A chair sells for £25 and uses £14.50 of bought-in materials and services. Calculate added value.
- A workshop makes 840 units with 14 workers. Calculate labour productivity.
- A firm produces 630 units a month with a maximum of 700. Calculate capacity utilisation.
- Of 800 units input, 24 are wasted. Calculate the wastage rate.
- Buffer stock is 60, usage 20 a day, lead time 5 days. Calculate the reorder level.
- An activity has O = 4, M = 7 and P = 16 days. Calculate the expected time.
- Annual demand is 2,000, cost per order £25 and holding cost £2.50 per unit. Calculate the EOQ.
- An activity has EST 6, duration 4 and LFT 13. Calculate total float.
- The same activity’s successor has EST 11. Calculate free float.
- Distinguish quality control from quality assurance.
- State the difference between offshoring and re-shoring.
- Name two internal economies of scale.
Answers
- £10.50.
- 60 units per worker.
- 90%.
- 3%.
- 60 + 100 = 160.
- (4 + 28 + 16) / 6 = 8 days.
- Square root of 40,000 = 200 units.
- 13 - 6 - 4 = 3.
- 11 - 6 - 4 = 1.
- Control inspects output to find defects; assurance designs the process to prevent them.
- Offshoring moves activities to another country; re-shoring brings them back home.
- Any two of technical, purchasing, financial, marketing or managerial.
Where marks are usually lost
- Writing added value as if it were profit, or omitting units.
- Leaving out x 100 for percentages.
- Forgetting to subtract duration in float calculations.
- Doing the backward pass from the wrong end or using the largest value instead of the smallest.
- Using the PERT formula without weighting M by four.
- Listing advantages of JIT, lean or technology with no link to the case.
- Evaluating without a judgement on the stakeholders affected.
- Recommending without justifying against alternatives.
- Mixing up outsourcing, subcontracting and offshoring.
Frequently asked questions
What is the formula for capacity utilisation? Capacity utilisation is actual output divided by maximum possible output, multiplied by 100. Low utilisation means a high fixed cost per unit, while running close to 100% leaves no room for rises in demand or for maintenance.
What is the difference between total float and free float? Total float is how long an activity can be delayed without delaying the whole project, found as latest finish time minus earliest start time minus duration. Free float is how long it can be delayed without delaying the start of the next activity.
What happens if a critical activity is delayed? An activity on the critical path has no float, so a delay of one day to it delays the whole project by one day. Qualitative factors such as team skills also matter alongside the network calculation.
What is the difference between job, batch, flow and cell production? Job production makes one-off items to customer order, batch production makes a set quantity before switching, flow production is continuous and standardised, and cell production uses a team to make a complete product or component. Flow gives the lowest unit cost but the least flexibility, while job production gives high flexibility at a high unit cost.
Official syllabus
OCR Level 3 Advanced GCE in Business (H431), Version 2.1 (January 2026), topic 4 Operational strategy, published by OCR.
Get free revision emails (optional)
Occasional emails with practice questions, worked explanations and links to free resources for the qualification and subjects you choose. No spam, and you can unsubscribe from any email. The free tools on this site never need an email.
Related resources
-
Study guides
OCR A Level Business: Operational strategy (H431)
Study guide to OCR A Level Business (H431) operational strategy: added value, production, project management, efficiency, quality, location and logistics.
Business · OCR · A Level
Read guide -
Practice questions
OCR A Level Business: Operational strategy (H431) – Practice Questions
Original OCR A Level Business (H431) operational strategy practice questions with worked answers on calculations, project management and evaluation.
Business · OCR · A Level
Try questions -
Study guides
OCR A Level Business: Political, economic, social and technological factors and related topics (H431)
Study guide to political, economic, social, technological, digital, ethical, legal and environmental factors for OCR A Level Business H431.
Business · OCR · A Level
Read guide
Related articles
-
teaching
A Level tuition in Dubai: Cambridge or Pearson Edexcel International A Level?
Schools in Dubai and Abu Dhabi teach either Cambridge International AS & A Level or Pearson Edexcel International A Level. How the two are structured, why it matters for tuition, and how online classes from Lahore work.
9 October 2026
-
curriculum guides
Choosing subjects at IGCSE and A Level
How subject choices at 14 and 16 affect university options later, and how to keep pathways open without overloading a timetable.
28 July 2026
Studying this with a teacher
Working through Business A LEVELS?
This page is free and stays free. If you would rather be taught it, Marlbridge runs Business classes one-to-one, online in your own time zone. One-to-one only for this course: Rs 6,000 per class in Pakistan, with other currencies on the fees page. The first trial class is free. WhatsApp replies within an hour (8am–11pm Pakistan time, every day); email the same day.
OCR Business teachers at Marlbridge
