
Study Guides
OCR A Level Business: Operational strategy (H431)
Study guide to OCR A Level Business (H431) operational strategy: added value, production, project management, efficiency, quality, location and logistics.
- Subject
- Business
- Level
- A LEVELS
- Topic
- Operational strategy
- Author
- Marlbridge Academic Team
- Updated
- Reviewed by
- Salman Ahmad (what this means)
Aligned to OCR A Level Business (H431), Version 2.1 (January 2026), for first assessment in 2017; final assessment summer 2027. Official specification .
Syllabus page (what it covers and how it is assessed): OCR A Level Business.
Syllabus points this page covers
H431
- 4 Operational strategy (whole topic)
Found an error? Report a correction.
Need help with this topic? Request a free trial class for A Level Business (H431).
This guide covers topic 4, Operational strategy, in the OCR A Level Business (H431) specification, Version 2.1 (January 2026), for first assessment in 2017 with final assessment in summer 2027. It follows every area of study the specification lists under operations. Use it with the revision notes and the practice questions. The course hub is at OCR A Level Business and the printable list is the checklist. To find weak spots first, try the free diagnostics.
Map of the topic
| Area of study | Content you must cover |
|---|---|
| Operations management within a business environment | Operations management objectives; added value |
| The production process | Innovation, research and development; methods of production; services; project management |
| Productive efficiency | Productivity; economies and diseconomies of scale; capacity utilisation and management; stock control; lean production; technology |
| Productive quality (fit for purpose) | Internal quality standards; external quality standards; services; location and logistics |
| Operations management within the external environment | External influences on operations management |
| The operations strategy | The strategy |
Calculations (added value, productivity, capacity utilisation, wastage, stock control charts, critical path analysis, PERT) sit alongside evaluation of impact on stakeholders. Where the specification gives no formula, this guide gives the standard form and says so.
Operations management objectives and added value
Operations management objectives are targets for the operations function, such as quality, cost, speed, flexibility, innovation, environmental impact and capacity use. A business needs clear ones so departments pull the same way, performance can be measured and operations support corporate objectives. Customers gain reliability, employees gain clear targets and owners see the link to profit. Objectives can conflict (faster delivery usually costs more), so judge which matters most in the case.
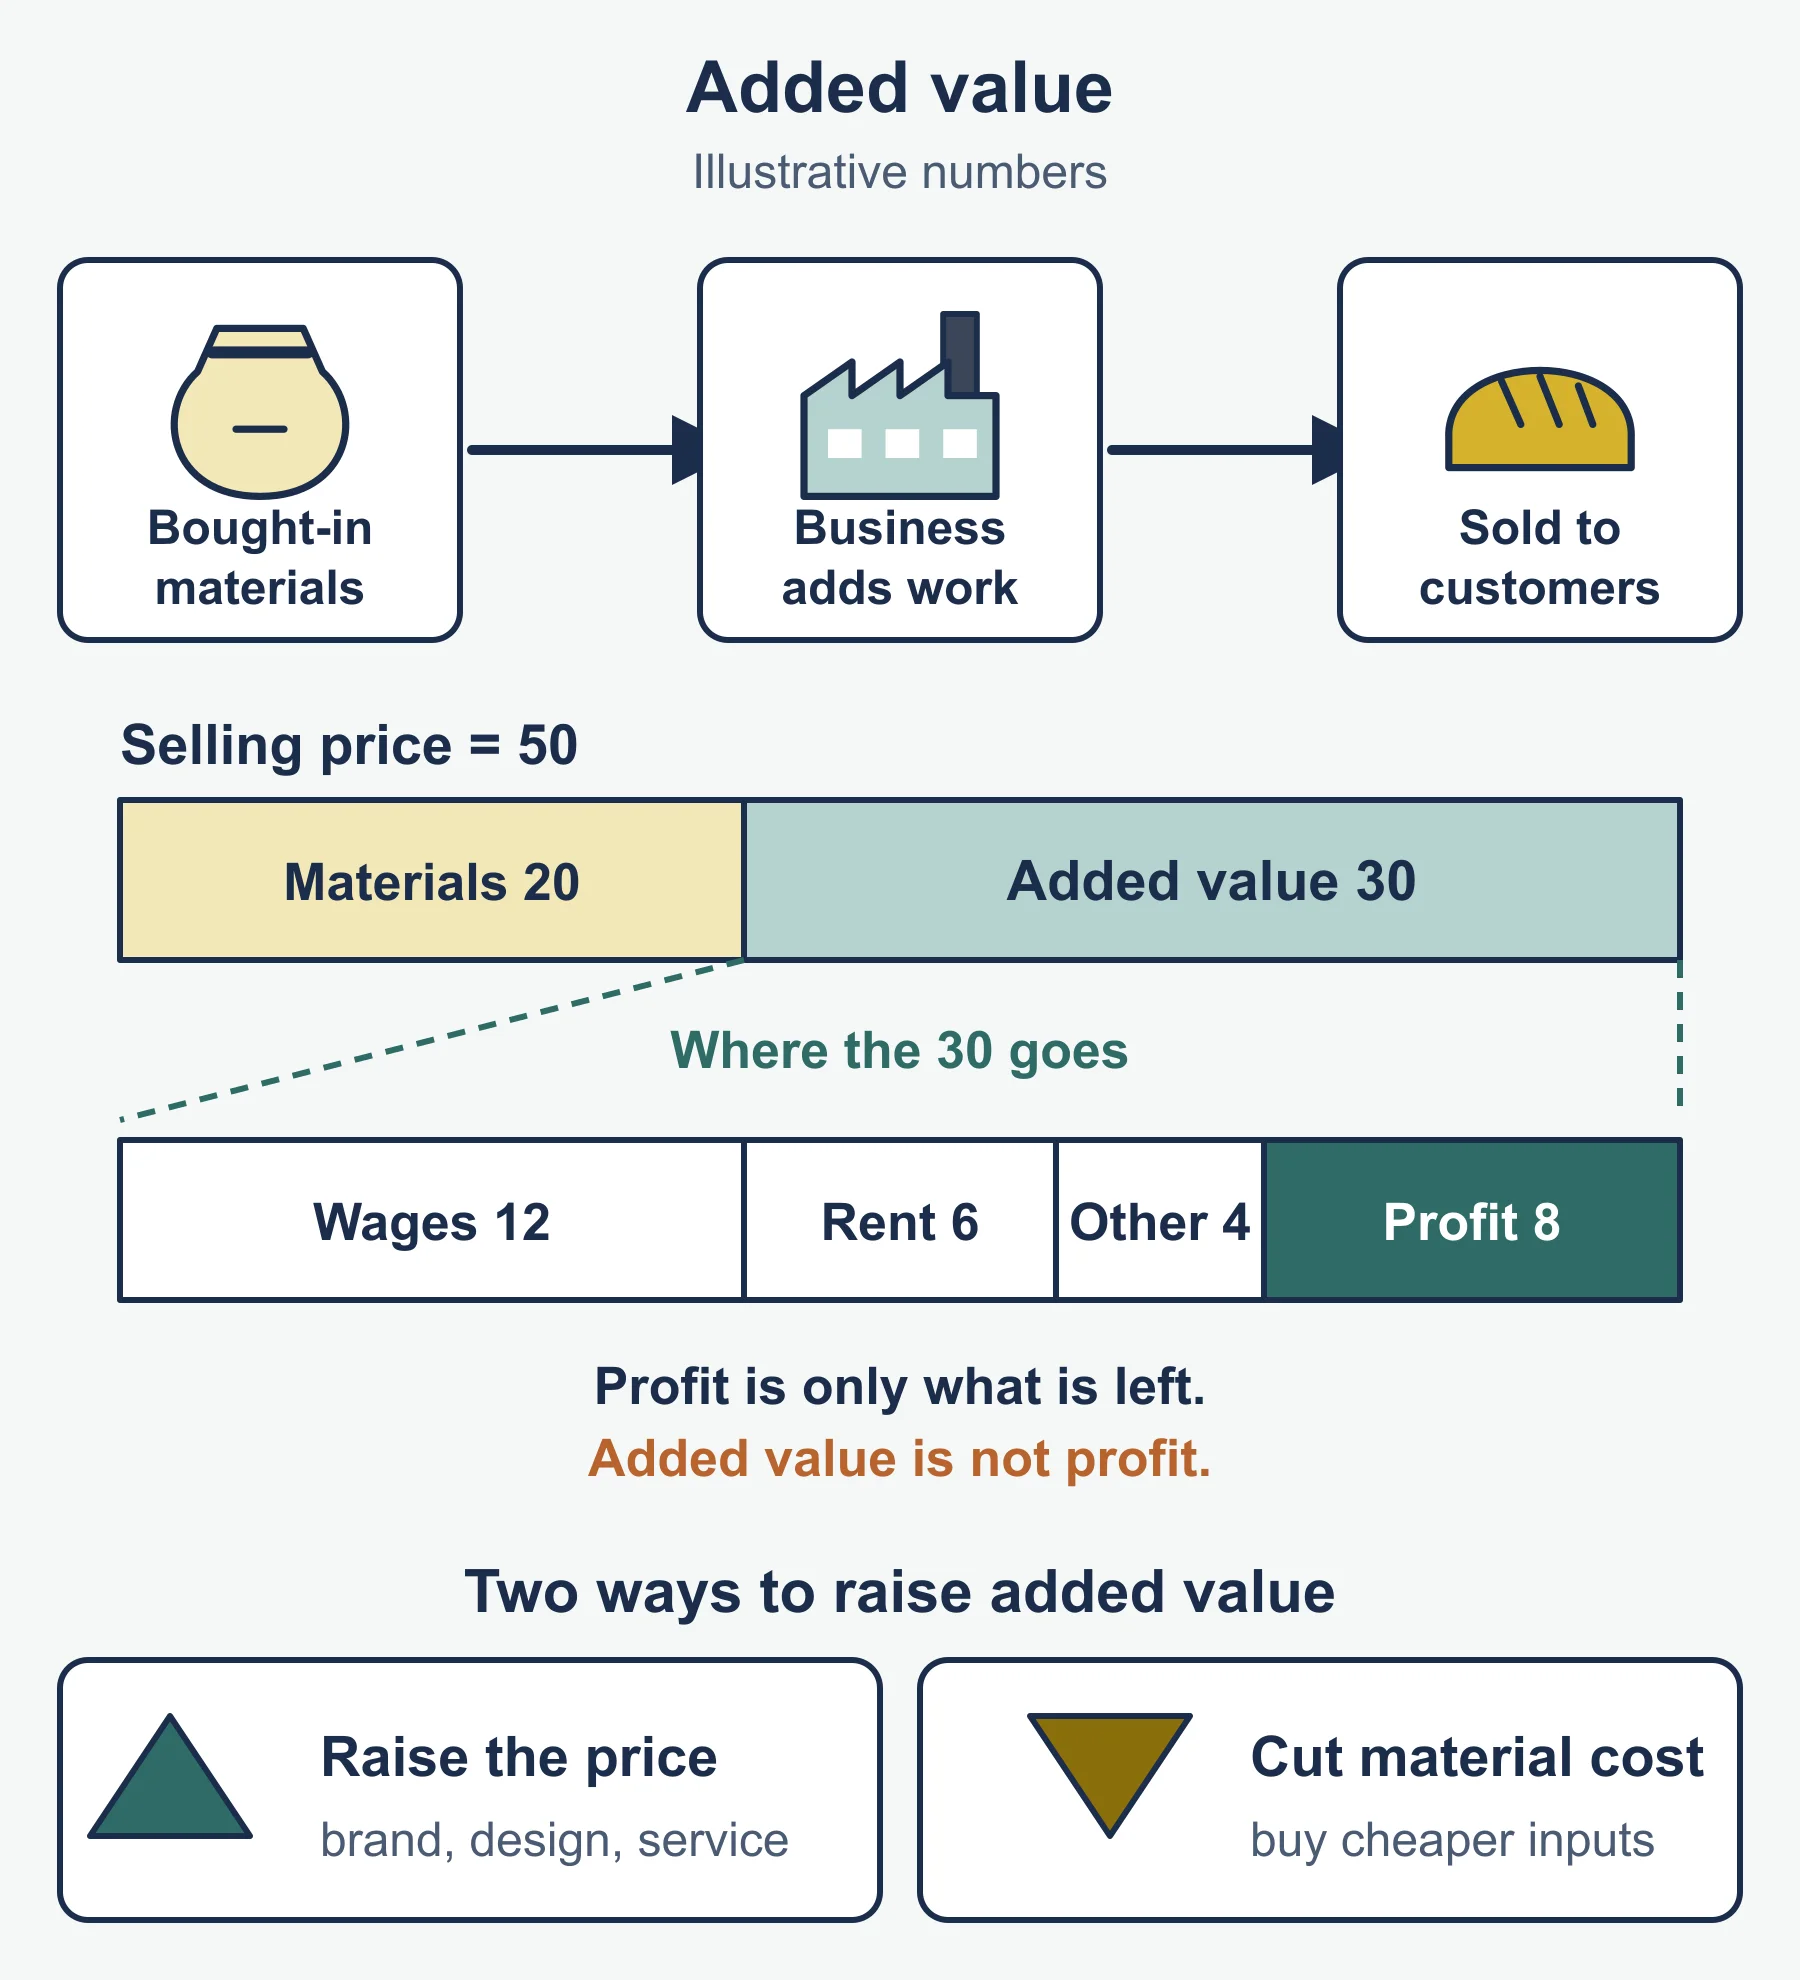
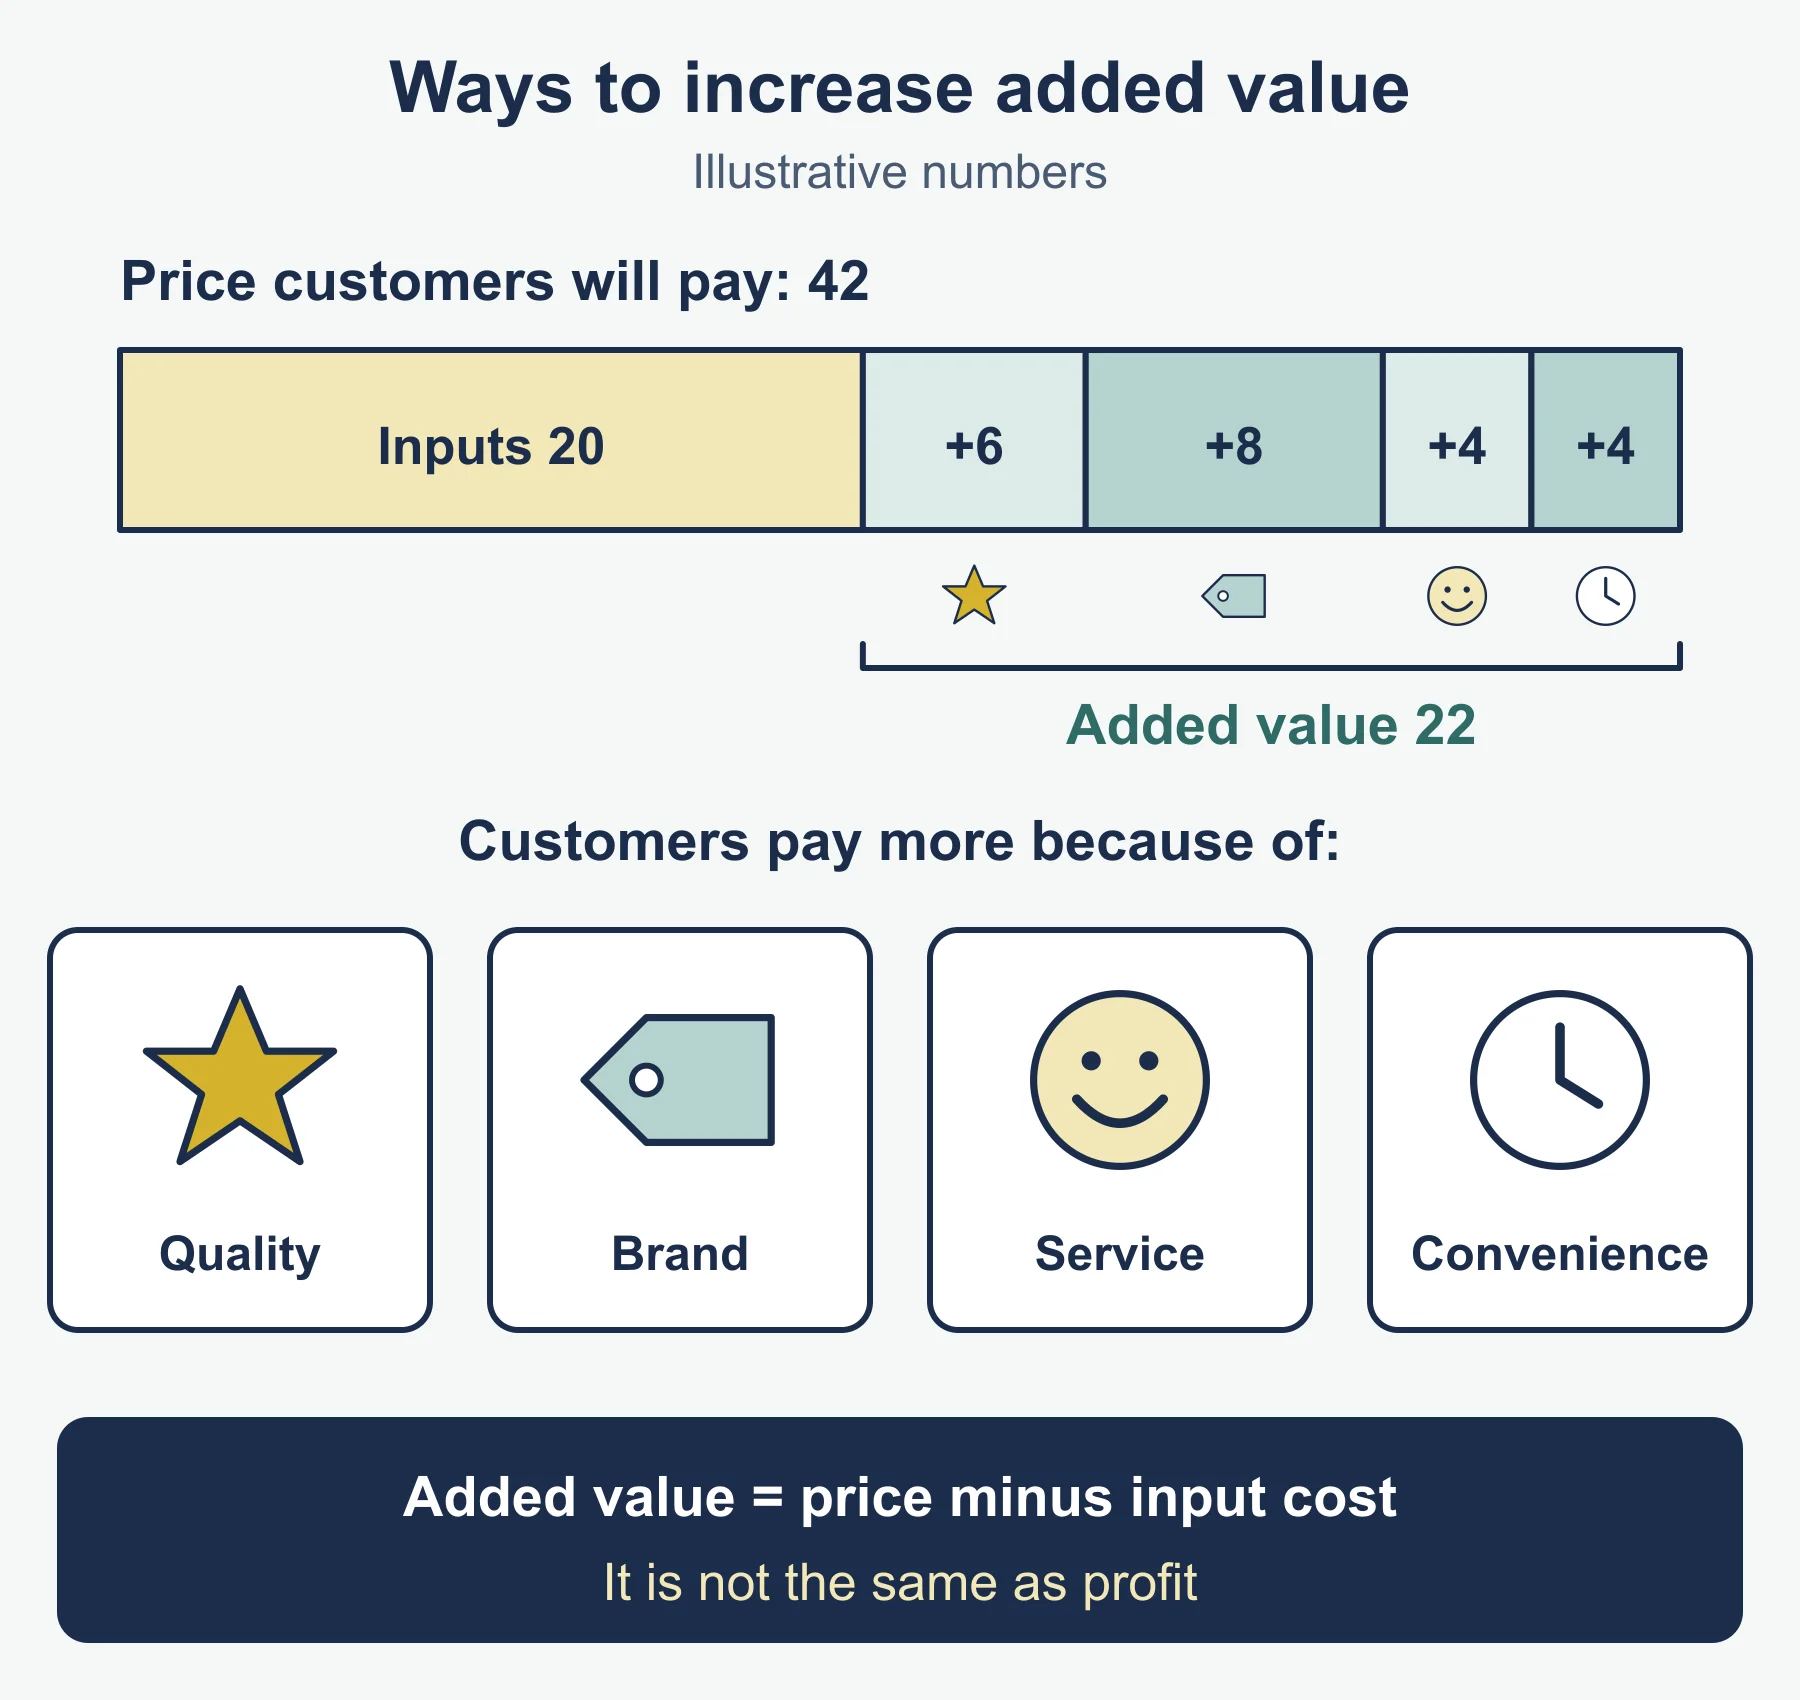
Added value is selling price minus the cost of bought-in materials and services (standard form). It is not profit, because wages and overheads are still paid from it.
Example. Oxley Pike Cycles sells a frame for £480 and buys in £310 of tubing, paint and components. Added value = 480 - 310 = £170 per frame (35.4% of price).
Raise it by lifting price (brand, design) or cutting bought-in costs. It shows where a product earns its keep, but it ignores overheads, so a high figure does not prove profit.
Innovation, research and development
Research and development (R&D) is work to discover new knowledge and turn it into new or better products and processes. Innovation is putting a new idea into use. Product innovation creates new or improved goods or services; process innovation changes how they are made or delivered.
The cycle: idea generation, research, prototype development, testing, launch, then review feeding new ideas. Businesses innovate to stay ahead, enter markets, protect margins and meet changing wants; an industry innovates because rivals force the pace.
| Advantages | Disadvantages |
|---|---|
| Competitive advantage, premium prices | Costly, no guarantee of success |
| Cost savings from process innovation | Long wait for returns; ideas copied |
Importance differs by stakeholder: consumers gain choice, employees gain skilled jobs, shareholders may gain growth and the economy gains competitiveness.
Methods of production
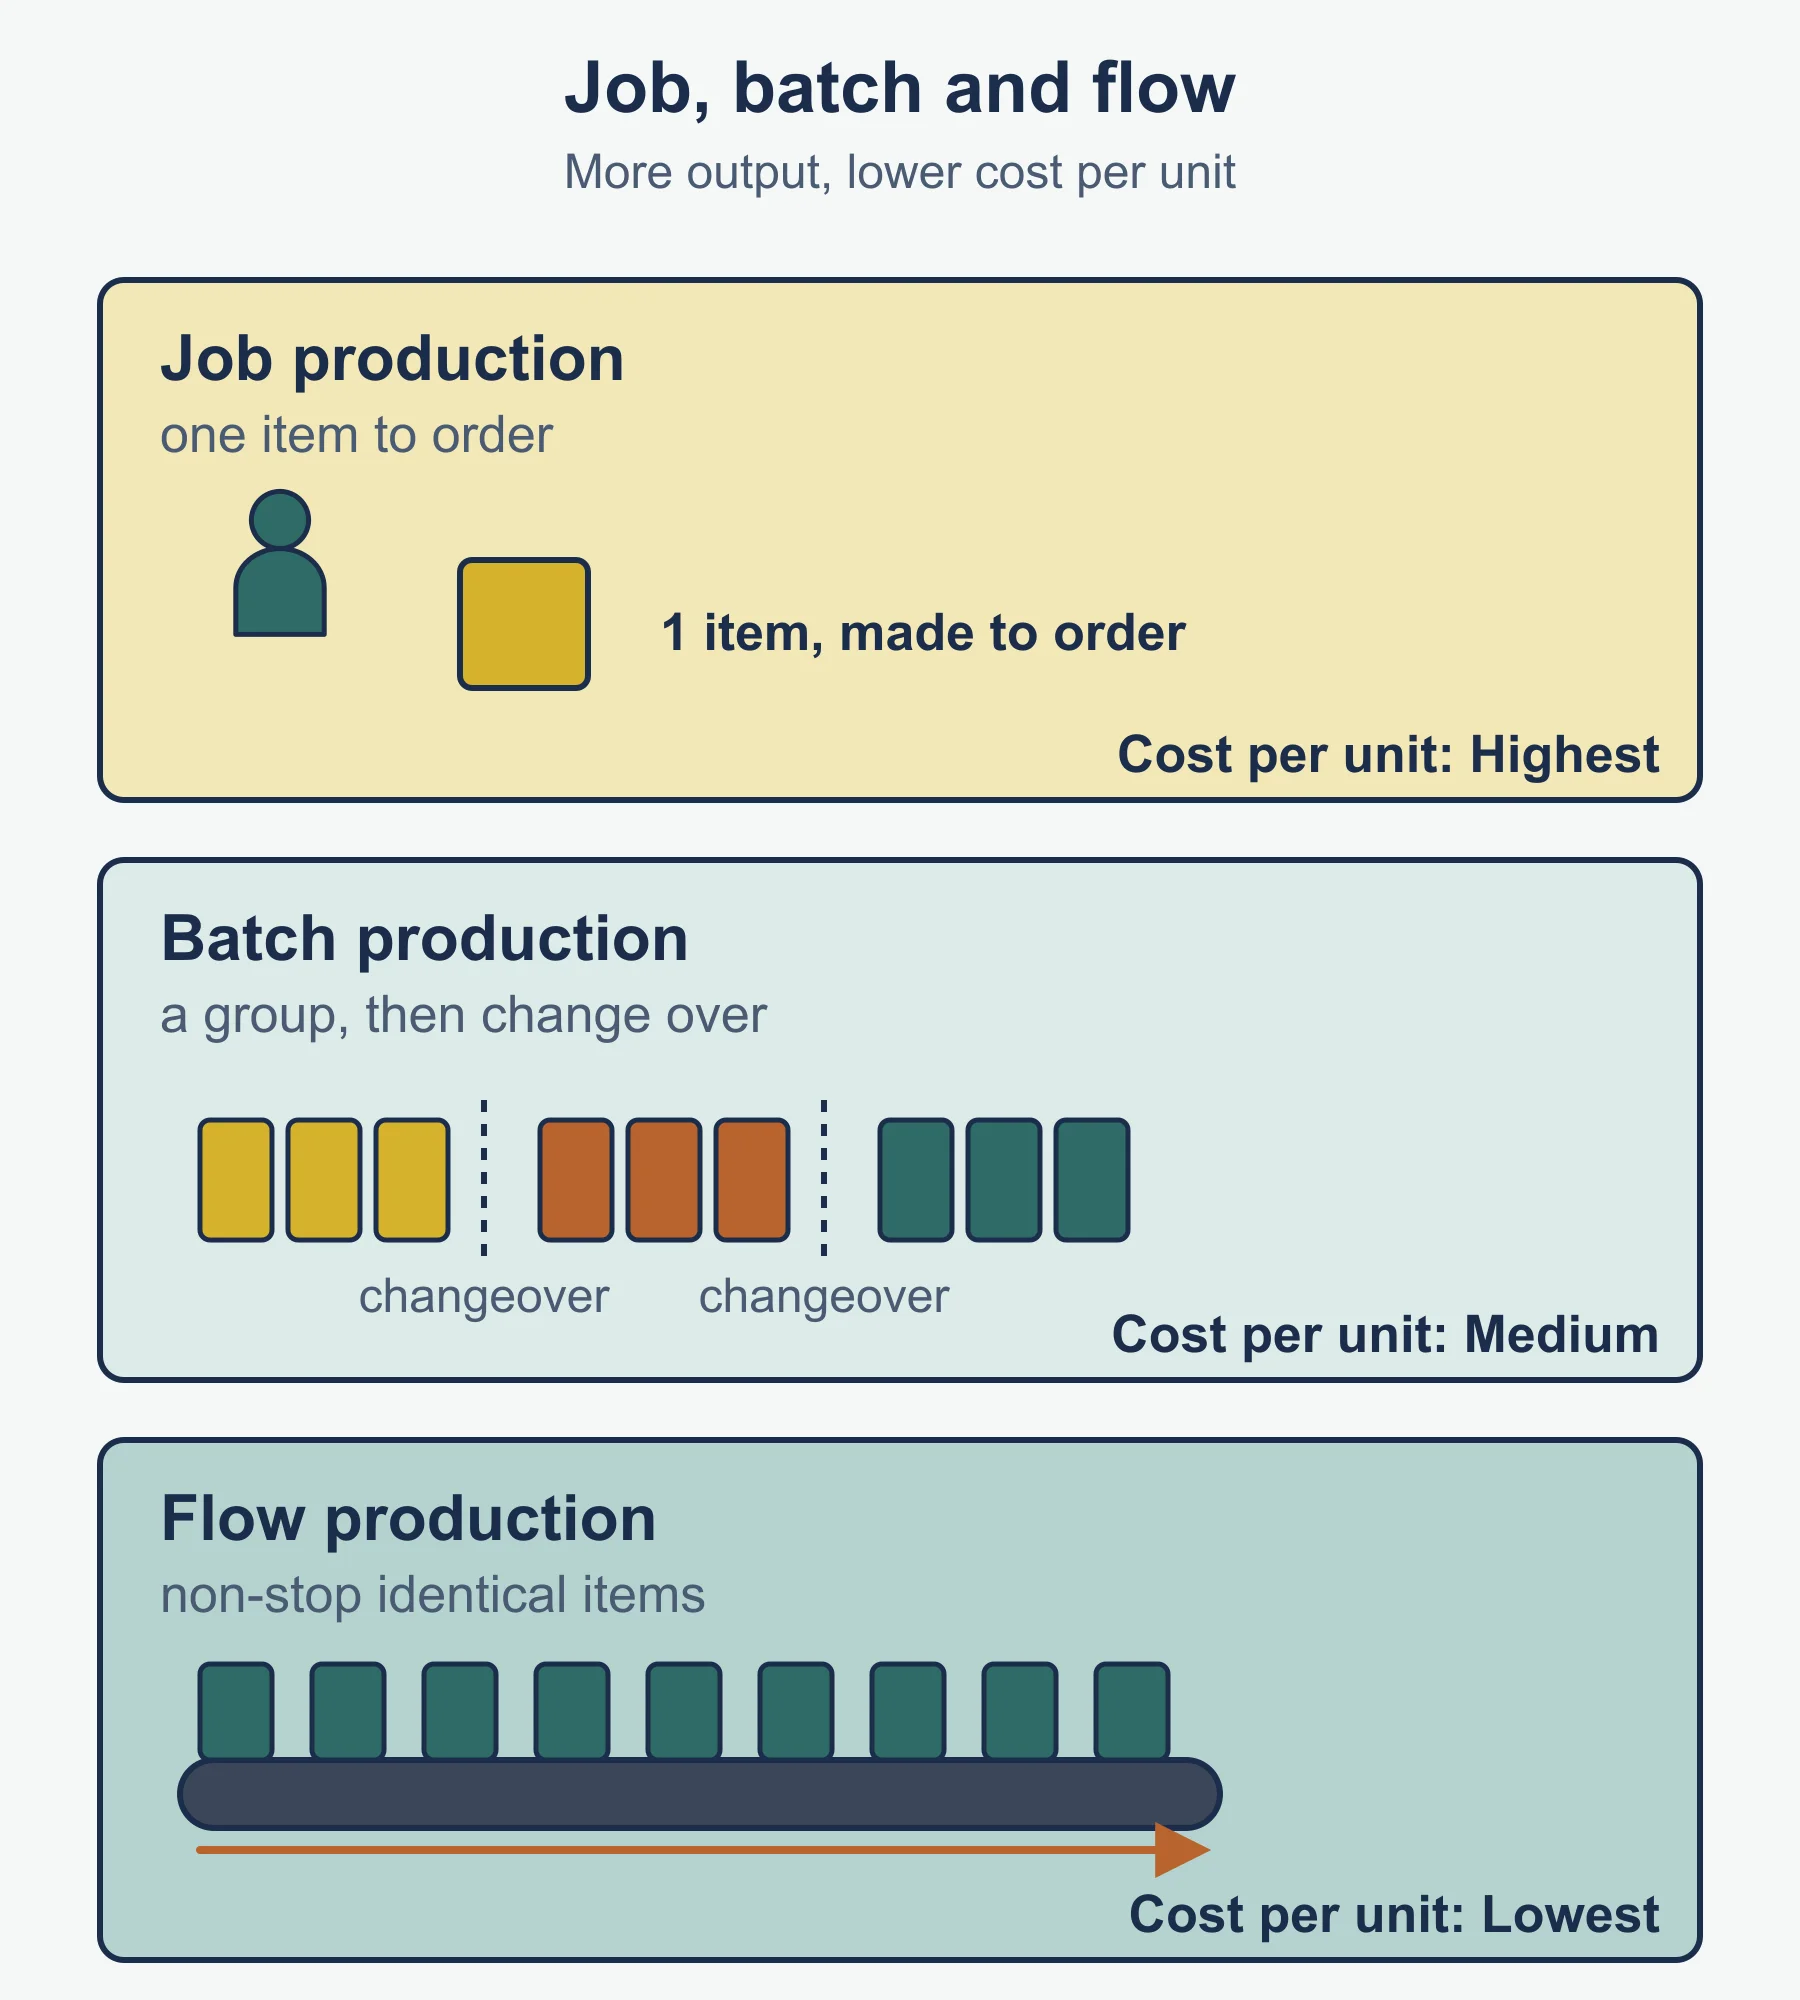
| Method | Description | Suits |
|---|---|---|
| Job | One-off, to customer order | Bespoke furniture |
| Batch | Set quantity, then switch | Bakery, paint |
| Flow | Continuous, standardised | Bottled drinks |
| Cell | Team makes a complete product or component | Electronics assembly |
Choose by volume, variety, capital, skills and price. Flow gives low unit cost but high capital cost and little flexibility; job gives flexibility and high prices but high unit cost; cell working can raise motivation but needs multi-skilled staff.
Specialisation means workers or machines concentrate on narrow tasks; division of labour splits production into tasks done by specialists. Reasons: faster work, expertise, lower training per task. Impact: lower unit costs for the firm, but boredom, lower motivation and dependence on key workers.
Services and customer service in production
A service is an intangible output that cannot be owned or stored, such as haulage. Its production usually involves the customer: enquiry, agreeing needs, delivery, follow-up. Customer service is what is done before, during and after a sale to meet customer needs: advice, speed, complaint handling, after-sales support. High quality gives repeat custom and the ability to charge more, and employees gain pride, but training and staffing cost money.
Project management
Project management is planning, organising and controlling resources to achieve a one-off aim within time and cost. It is used for launches and building work because it shows tasks, order and delays in advance.
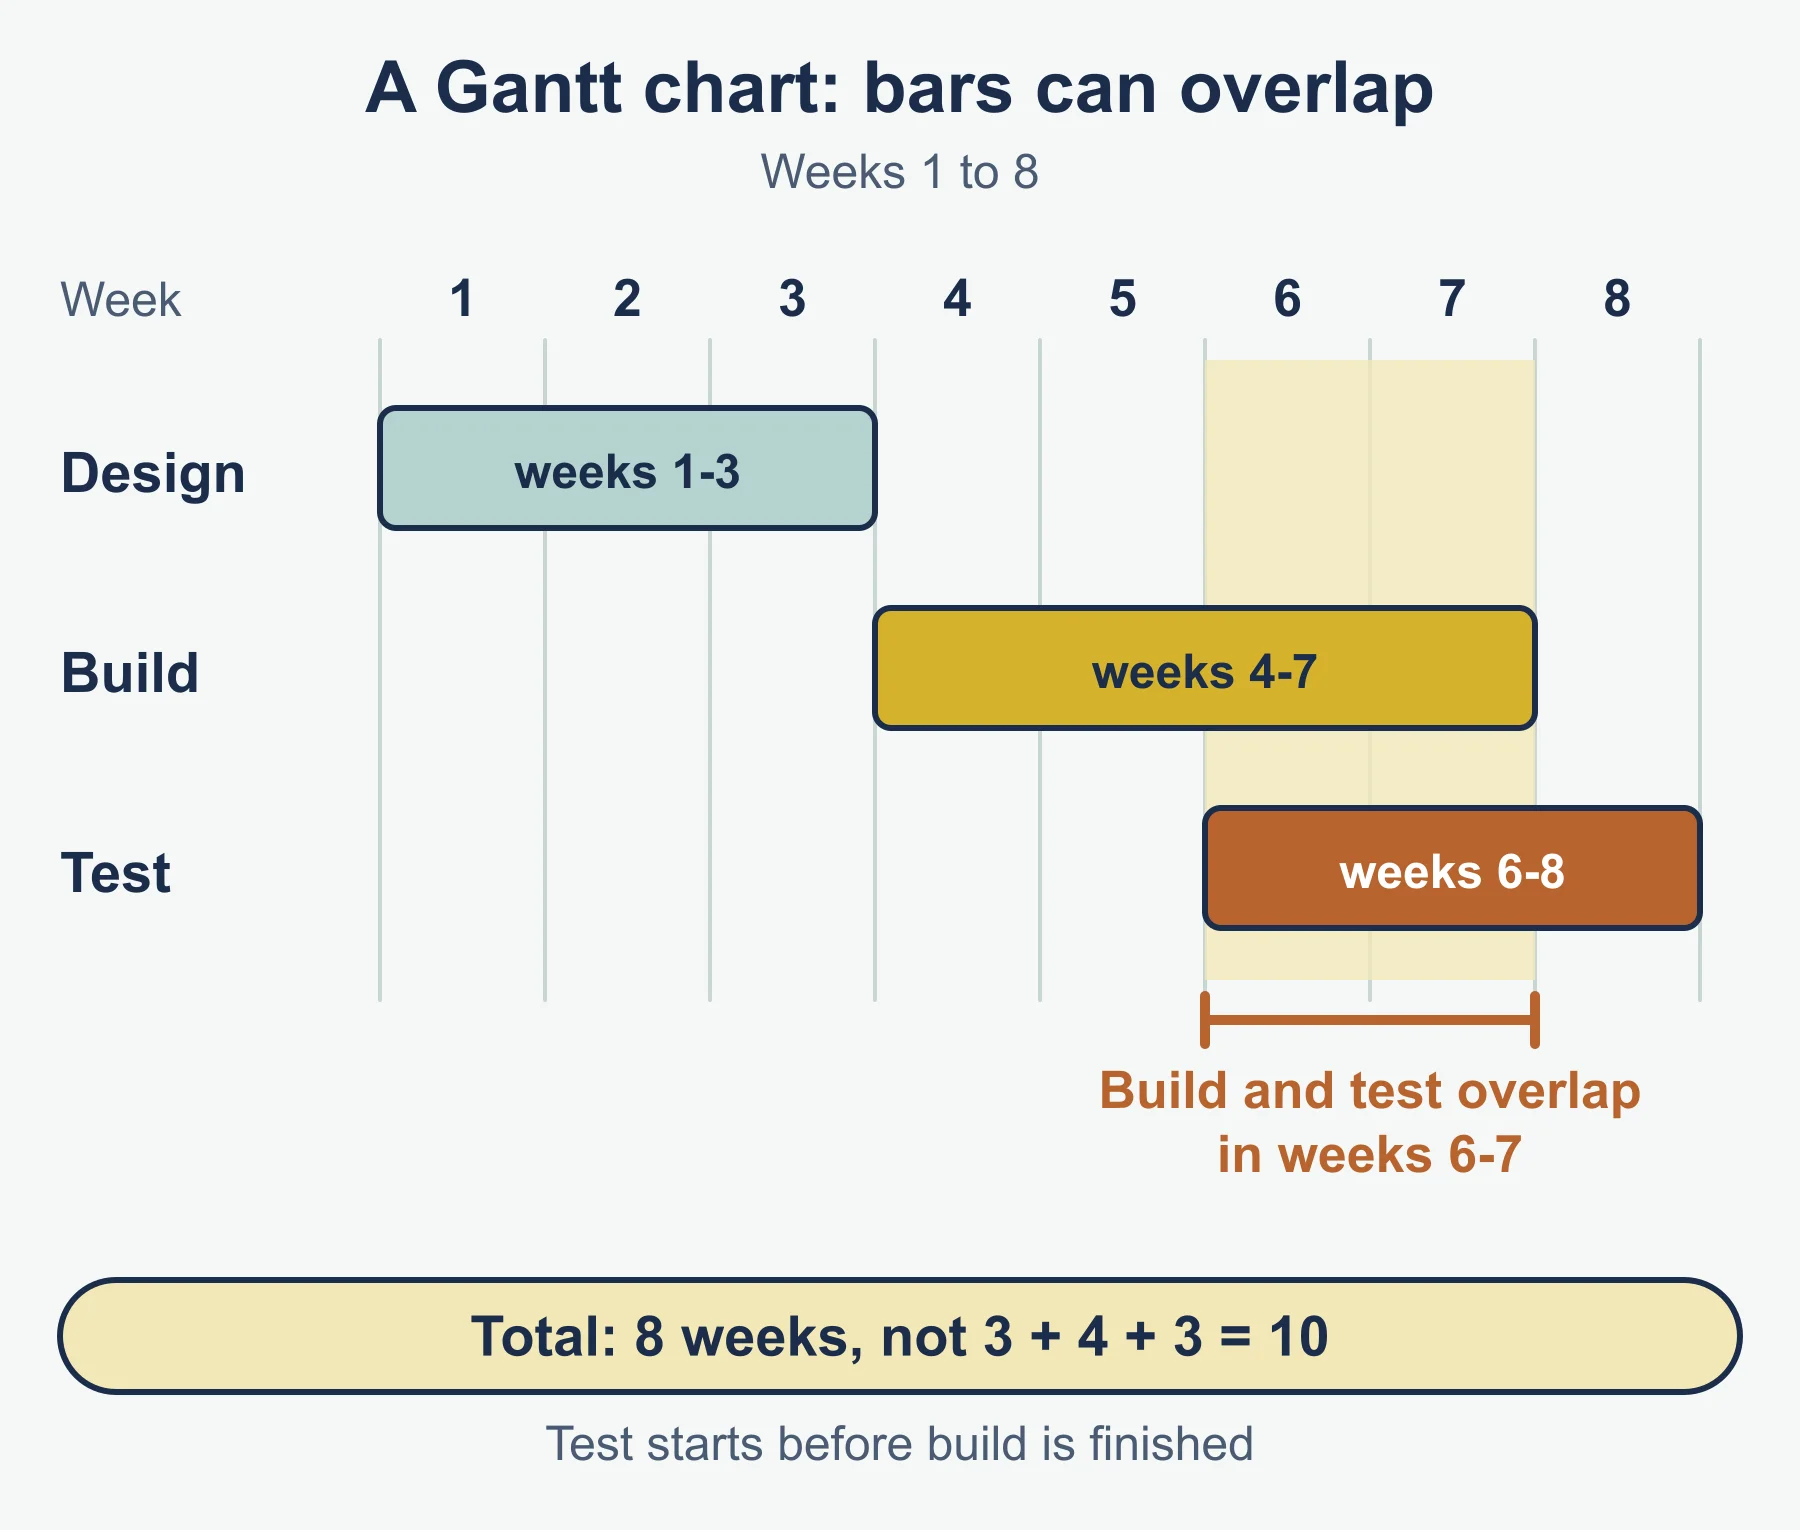
A Gantt chart shows each activity as a bar on a time axis; bars starting before others finish show overlap. Example: design weeks 1-3, build weeks 4-7, test weeks 6-8 overlap in weeks 6-7; total 8 weeks.
A network analysis diagram (critical path analysis, CPA) shows activities, durations and dependencies.
- EST: earliest start time, the largest total of preceding durations.
- LFT: latest finish time without delaying the project, found working backwards.
- Total float = LFT - EST - duration.
- Free float = next activity’s EST - EST - duration.
- The critical path joins zero-float activities and gives the shortest project time.
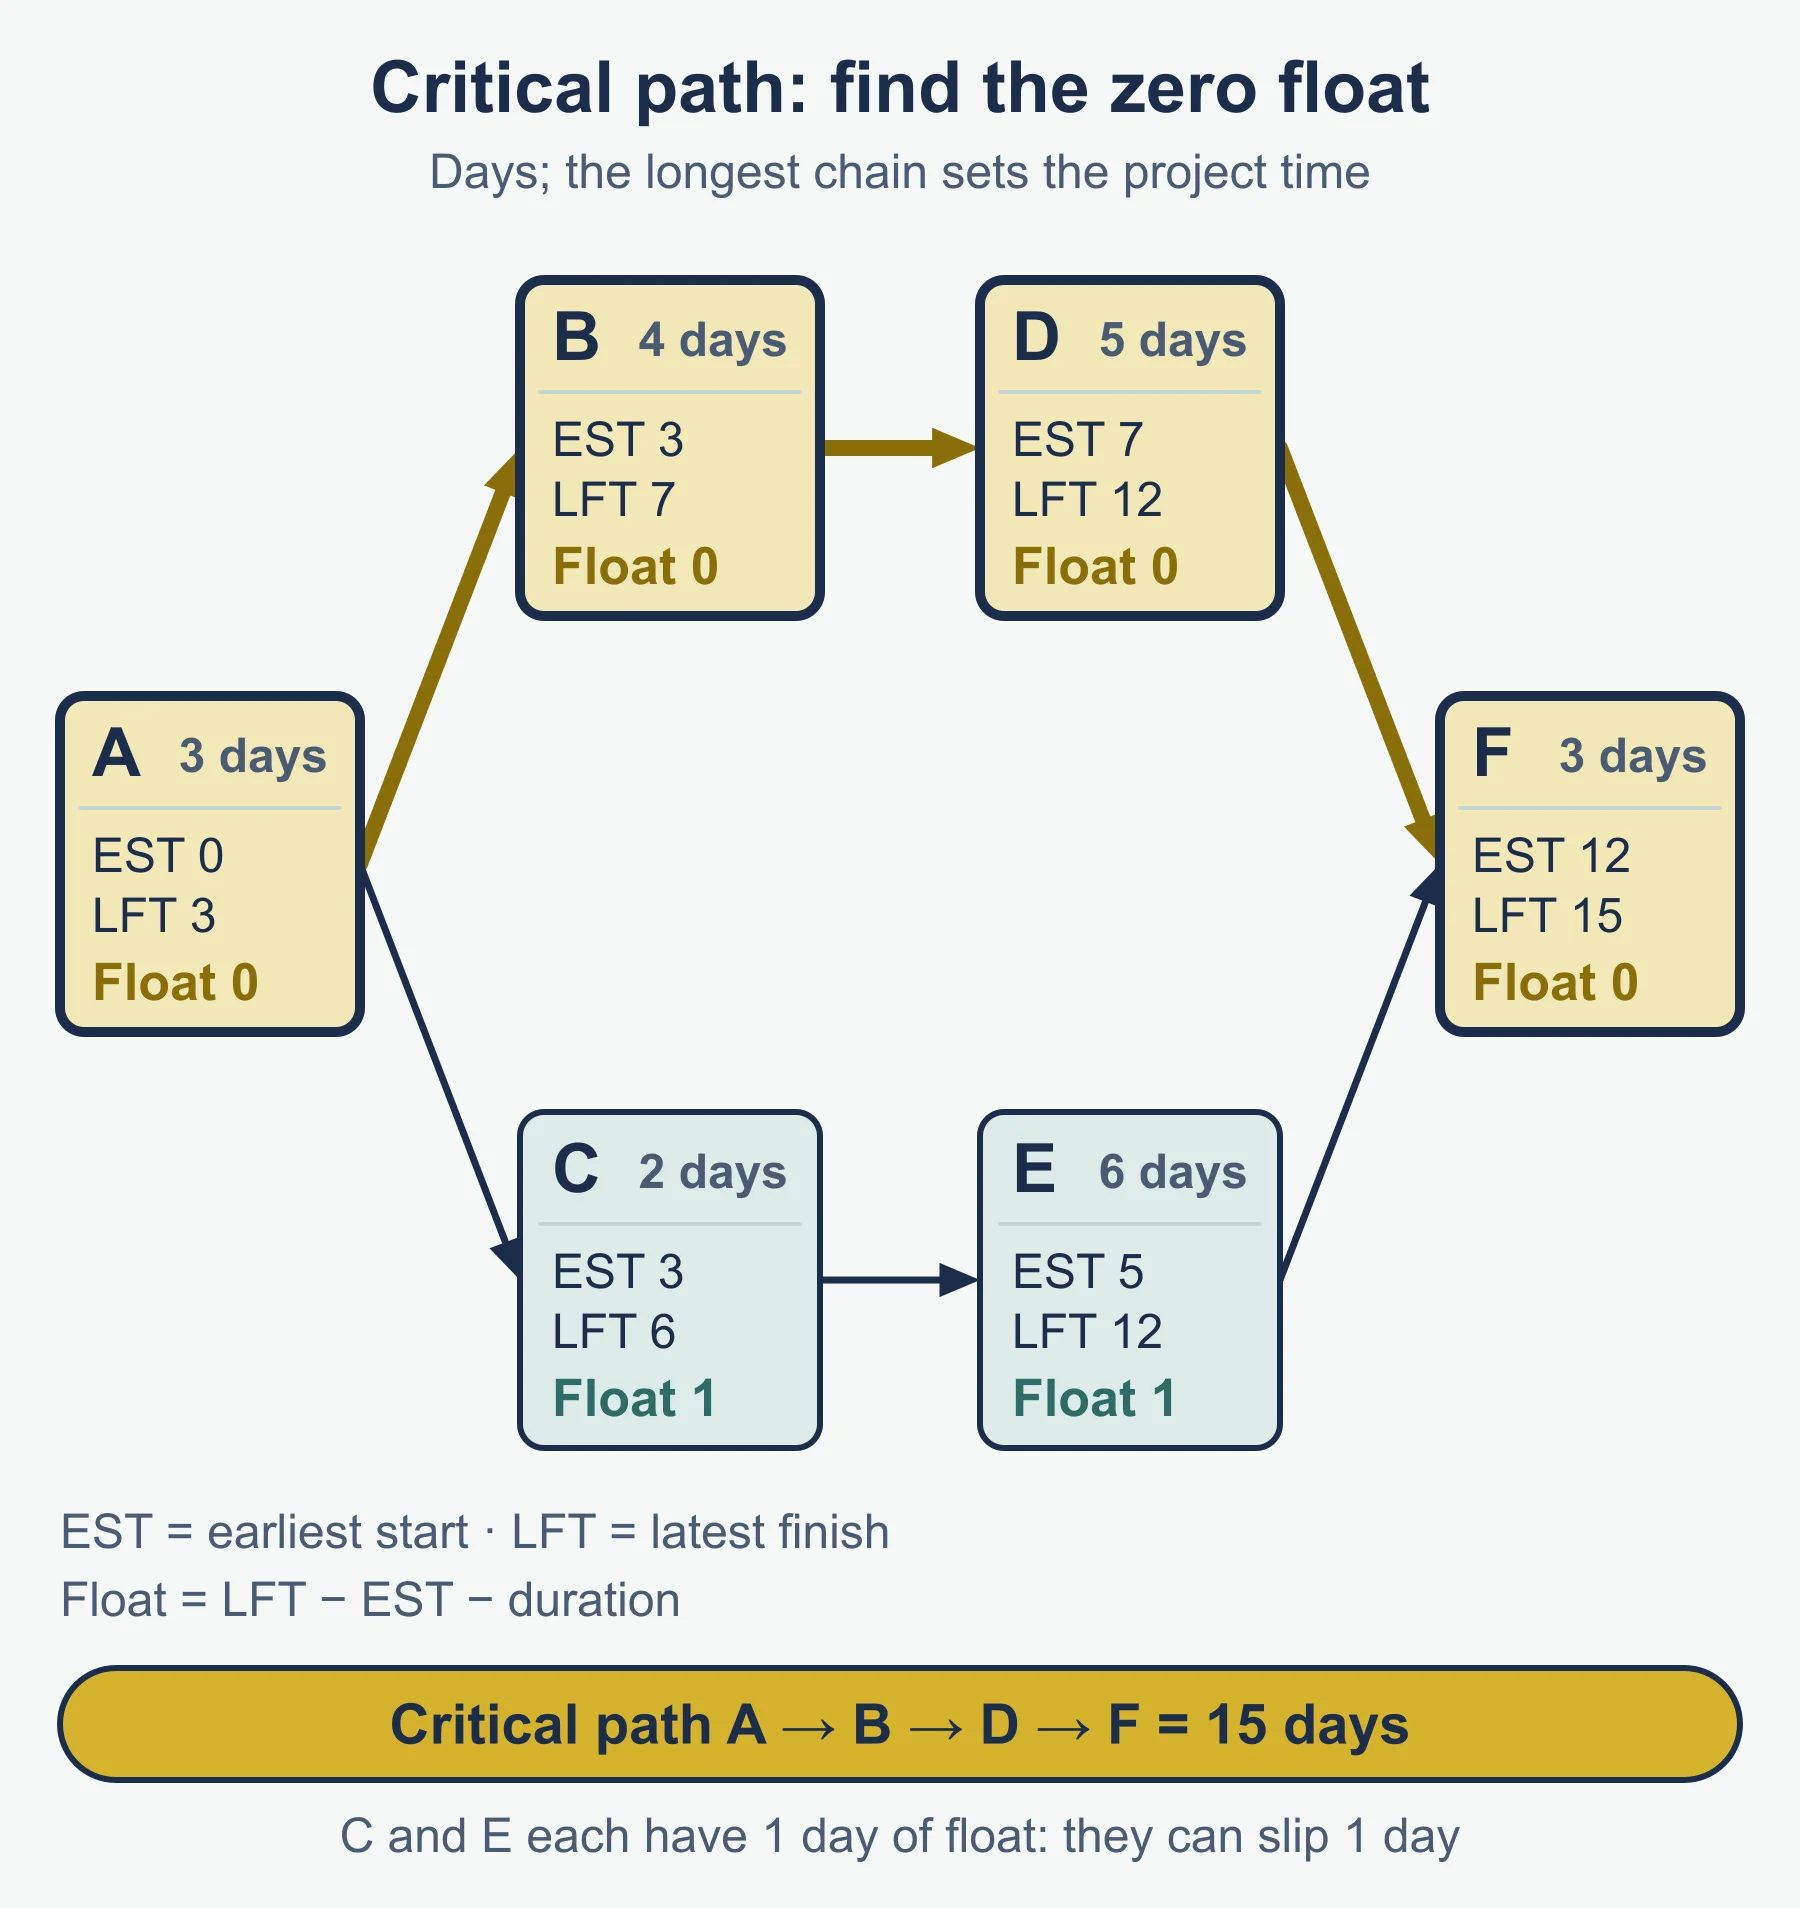
Example. A 3 days, B 4 (after A), C 2 (after A), D 5 (after B), E 6 (after C), F 3 (after D and E).
| Activity | EST | LFT | Total float | Free float |
|---|---|---|---|---|
| A | 0 | 3 | 0 | 0 |
| B | 3 | 7 | 0 | 0 |
| C | 3 | 6 | 1 | 0 |
| D | 7 | 12 | 0 | 0 |
| E | 5 | 12 | 1 | 1 |
| F | 12 | 15 | 0 | 0 |
Critical path A, B, D, F: 15 days.
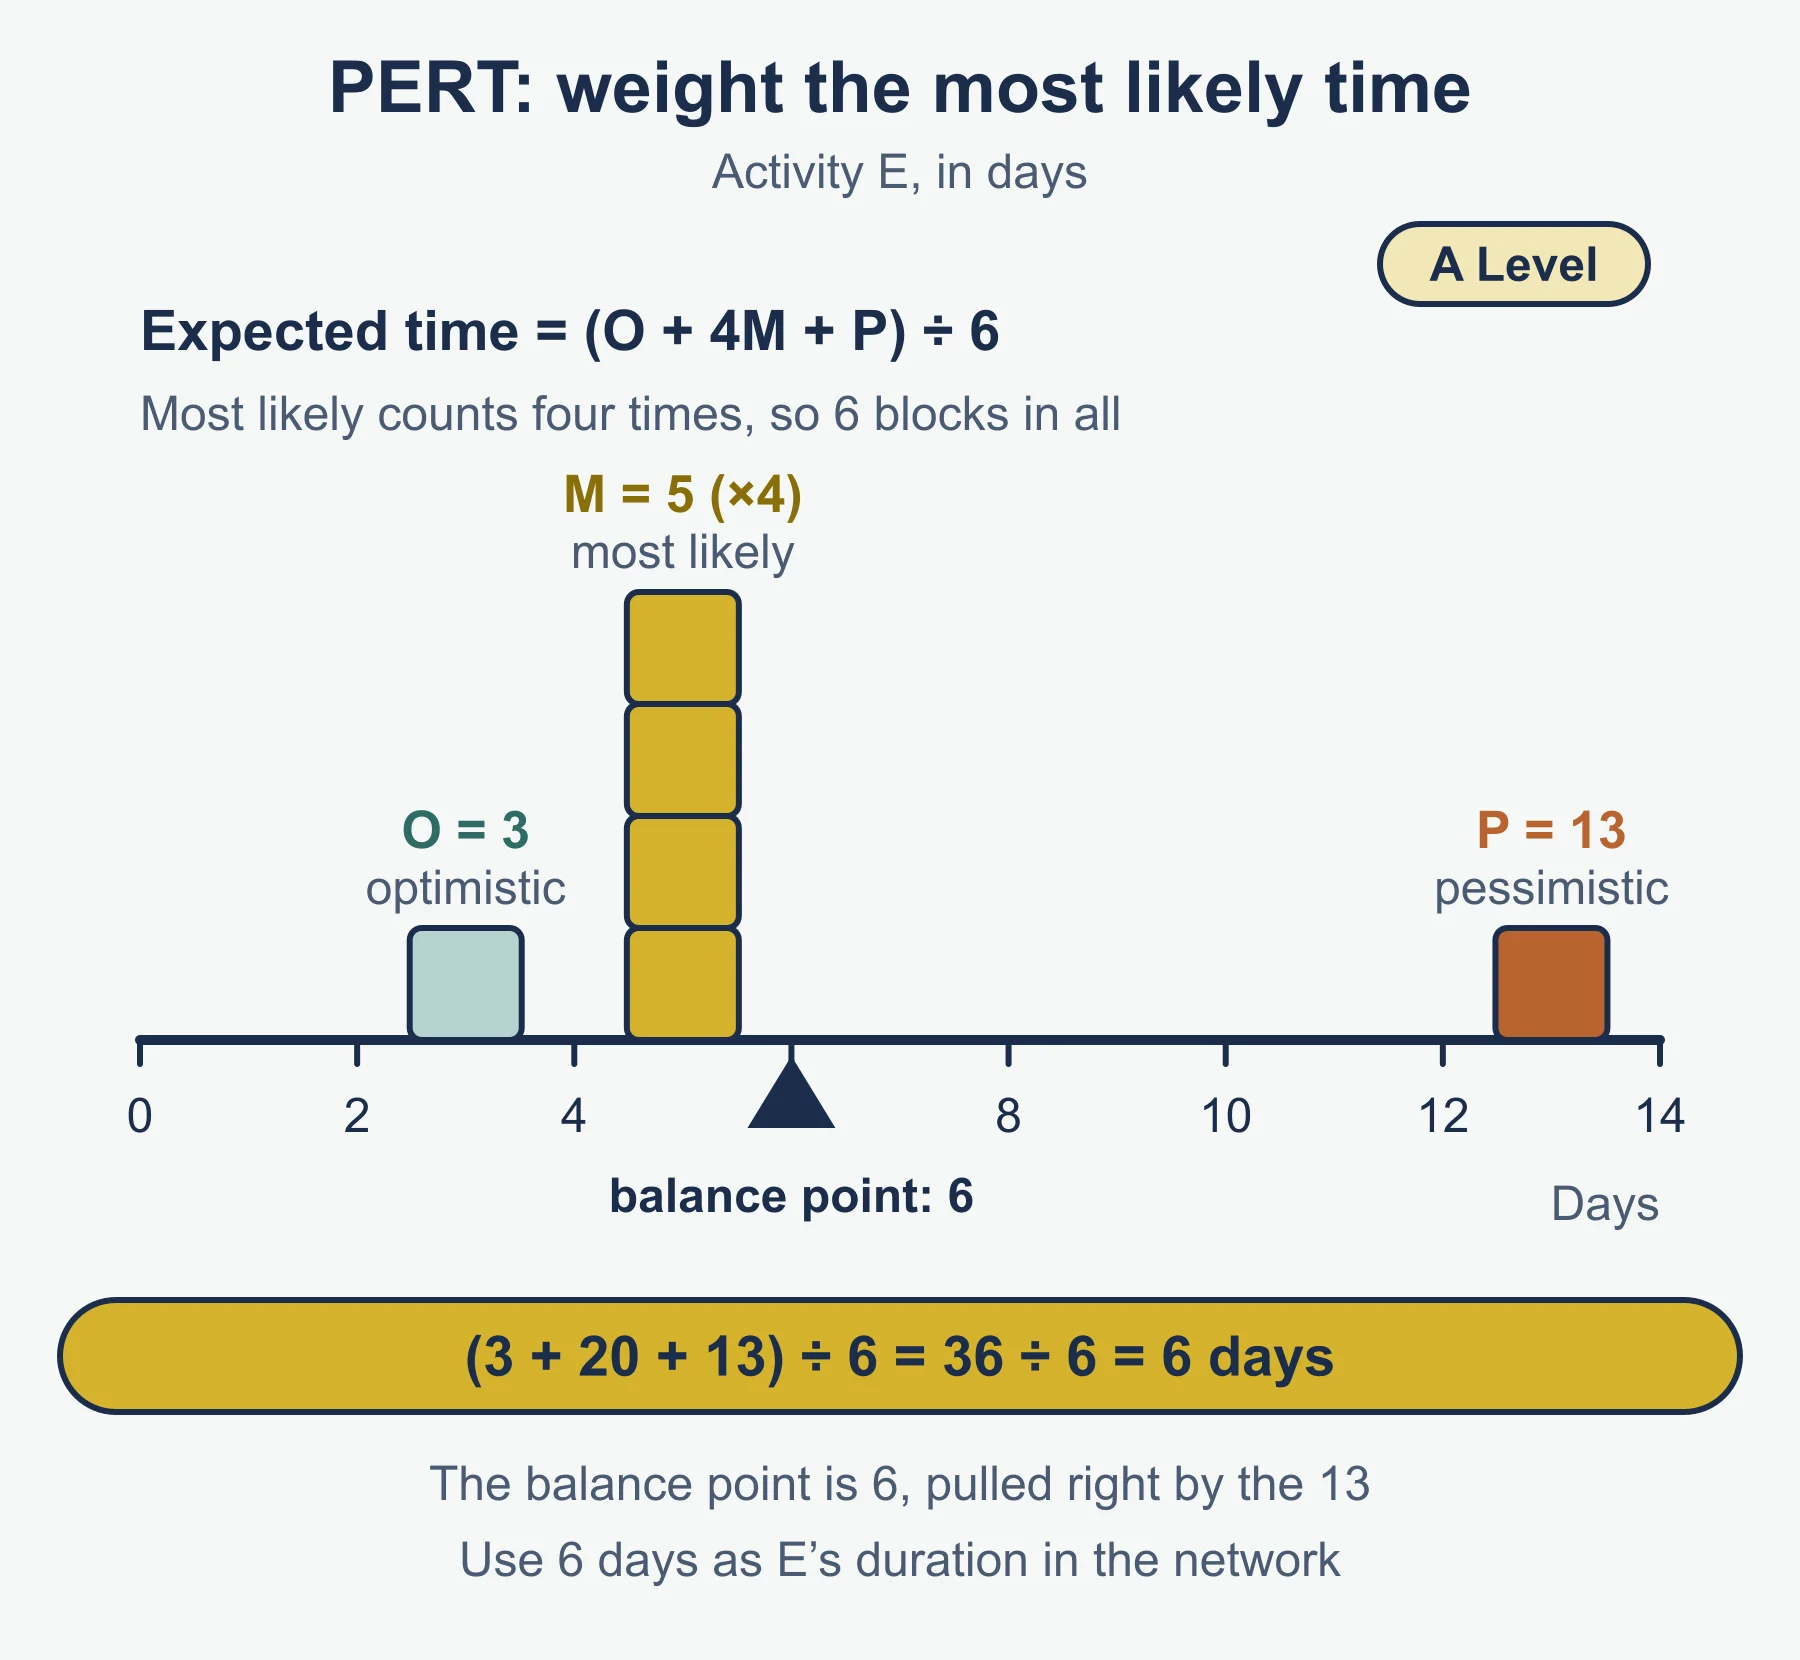
PERT (program evaluation and review technique) allows for uncertainty using optimistic (O), most likely (M) and pessimistic (P) times. Expected time = (O + 4M + P) / 6 (standard weighting). For E with O = 3, M = 5, P = 13: (3 + 20 + 13) / 6 = 6 days. Use expected times as durations, then find floats and the critical path as above.
Quantitative methods show minimum duration and which activities cannot slip, but depend on accurate estimates. Qualitative factors include team skills and motivation, communication, leadership, supplier reliability, weather and legal change. Numbers show structure; qualitative factors decide whether the plan runs.
Productivity
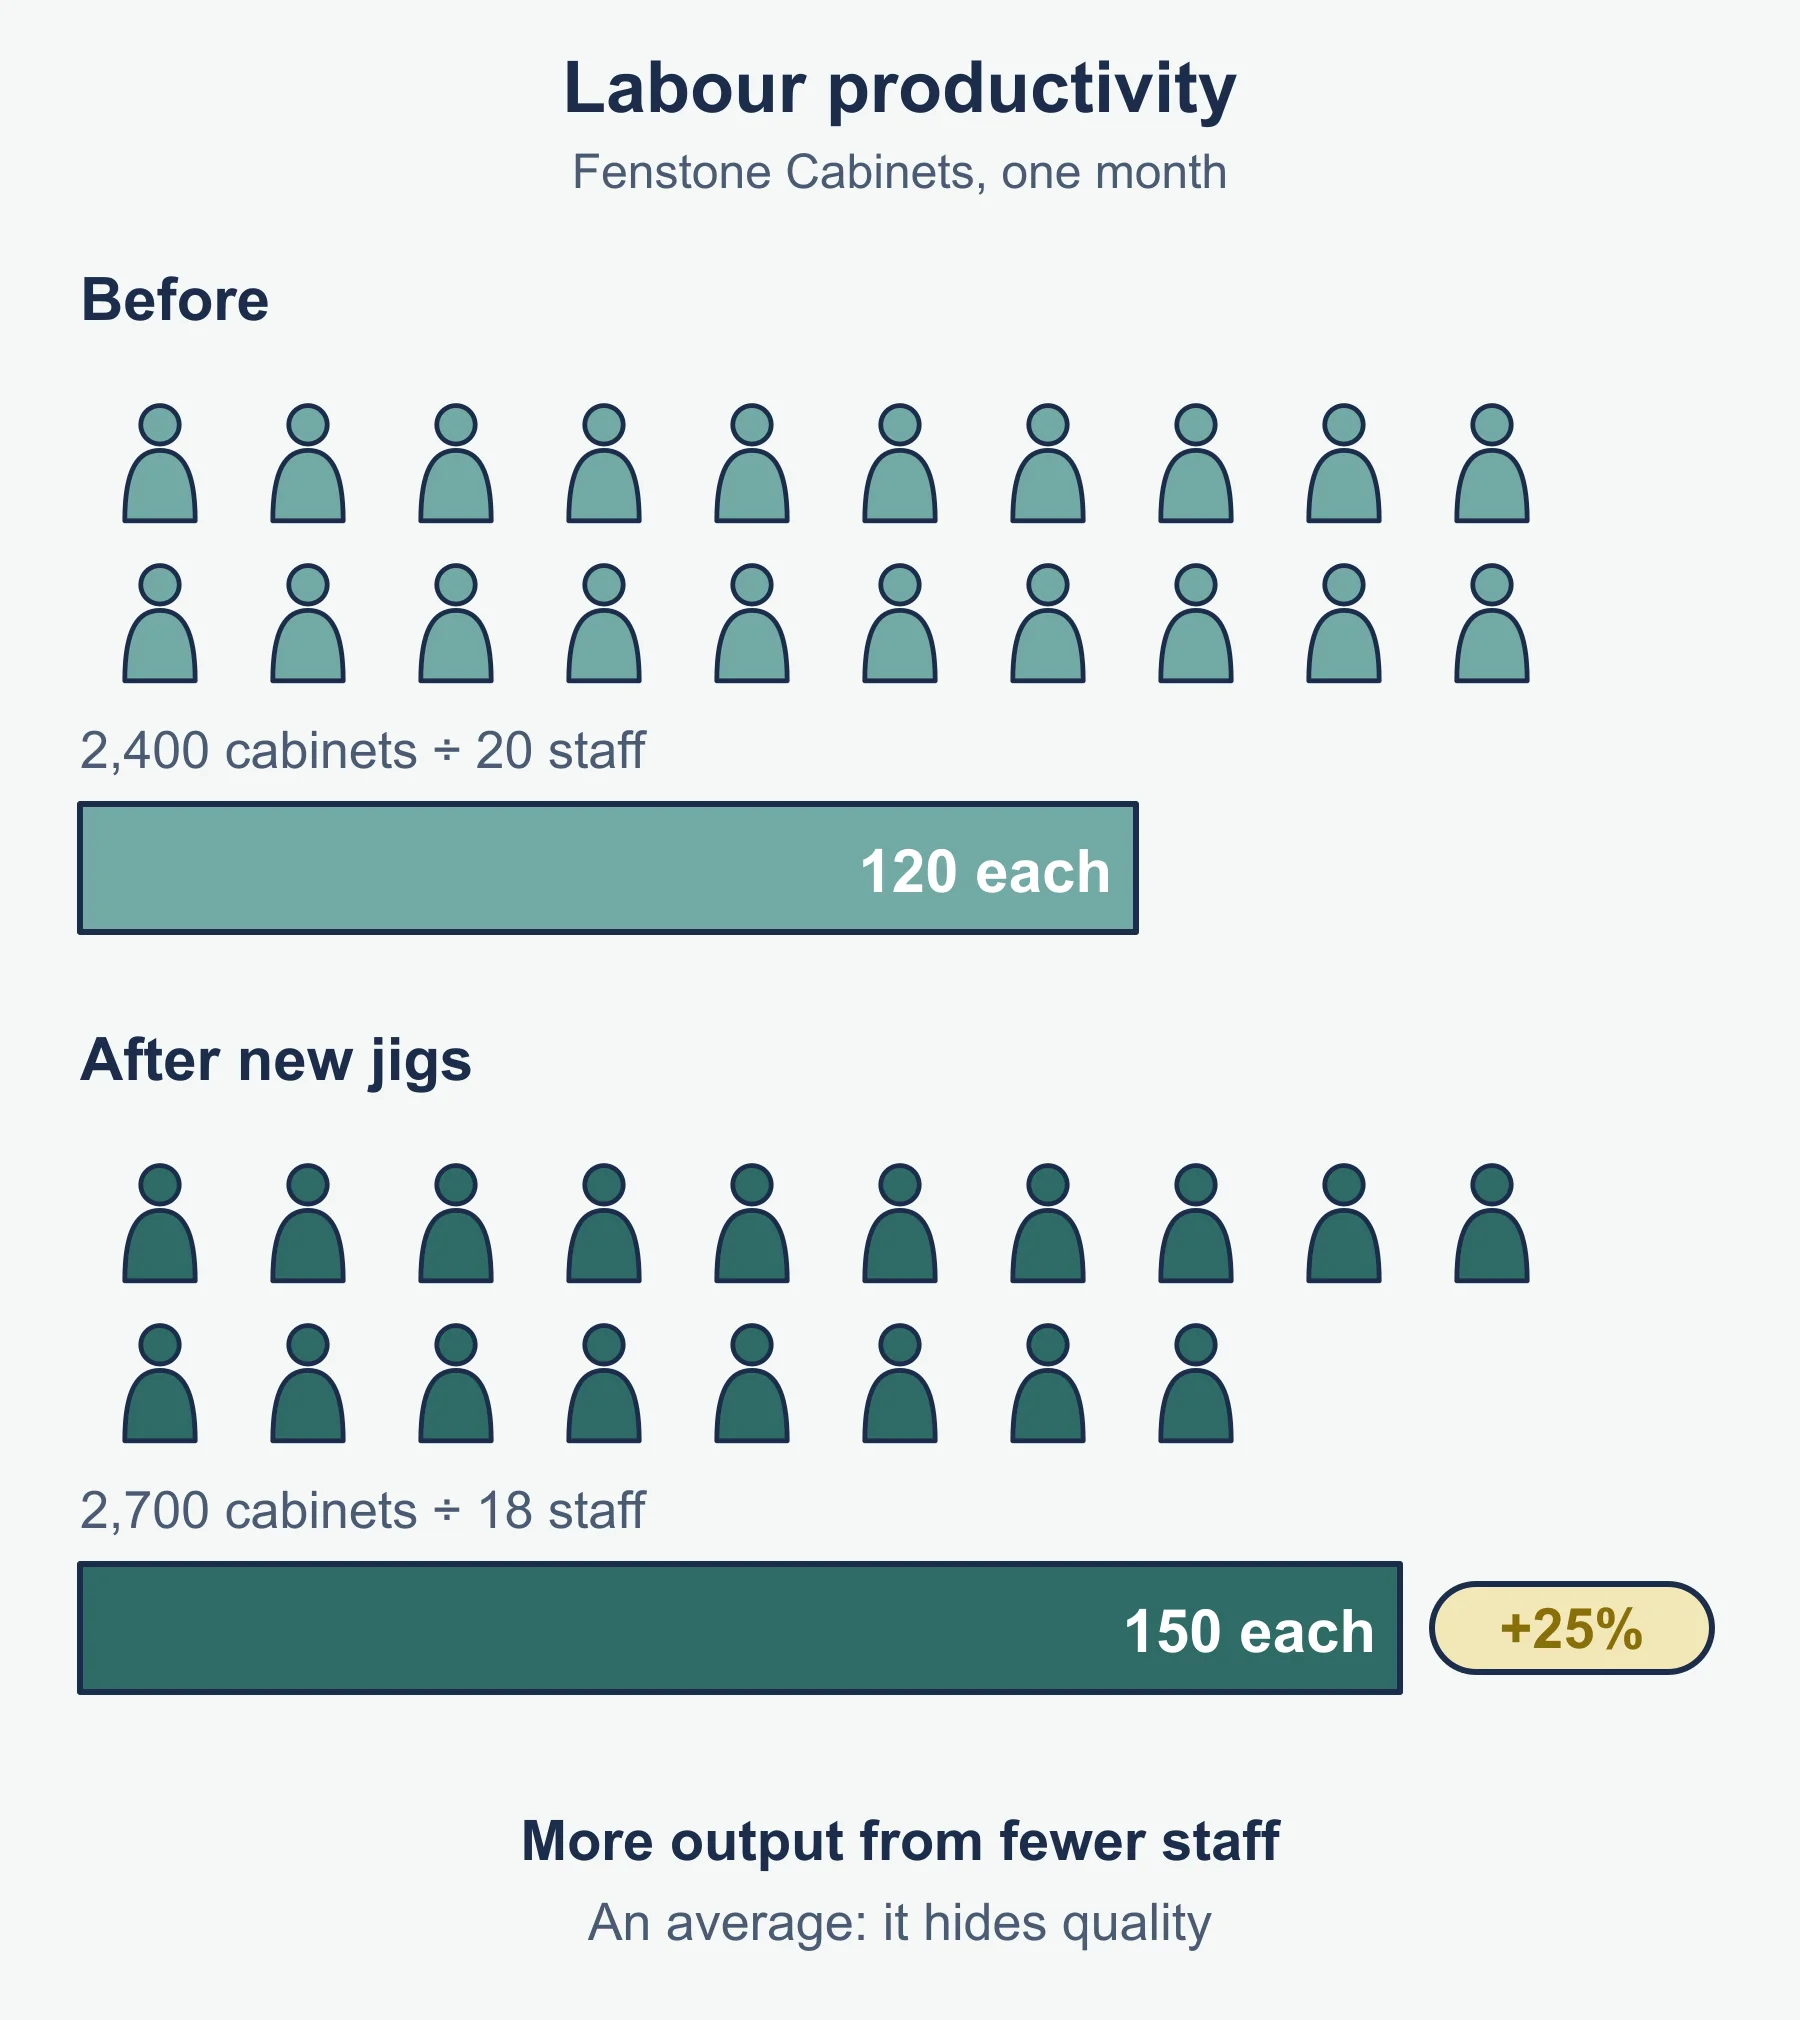
Productivity is output relative to input. Labour productivity (standard form) = output / employees (or hours).
Example. Velmarsh Bakery makes 12,600 loaves a week with 18 workers: 12,600 / 18 = 700 loaves per worker.
Higher productivity cuts unit labour cost and improves competitiveness. Methods: training (slow but lasting), machinery (costly but quick), incentives, better layout. Justify the choice from the case.
Economies and diseconomies of scale
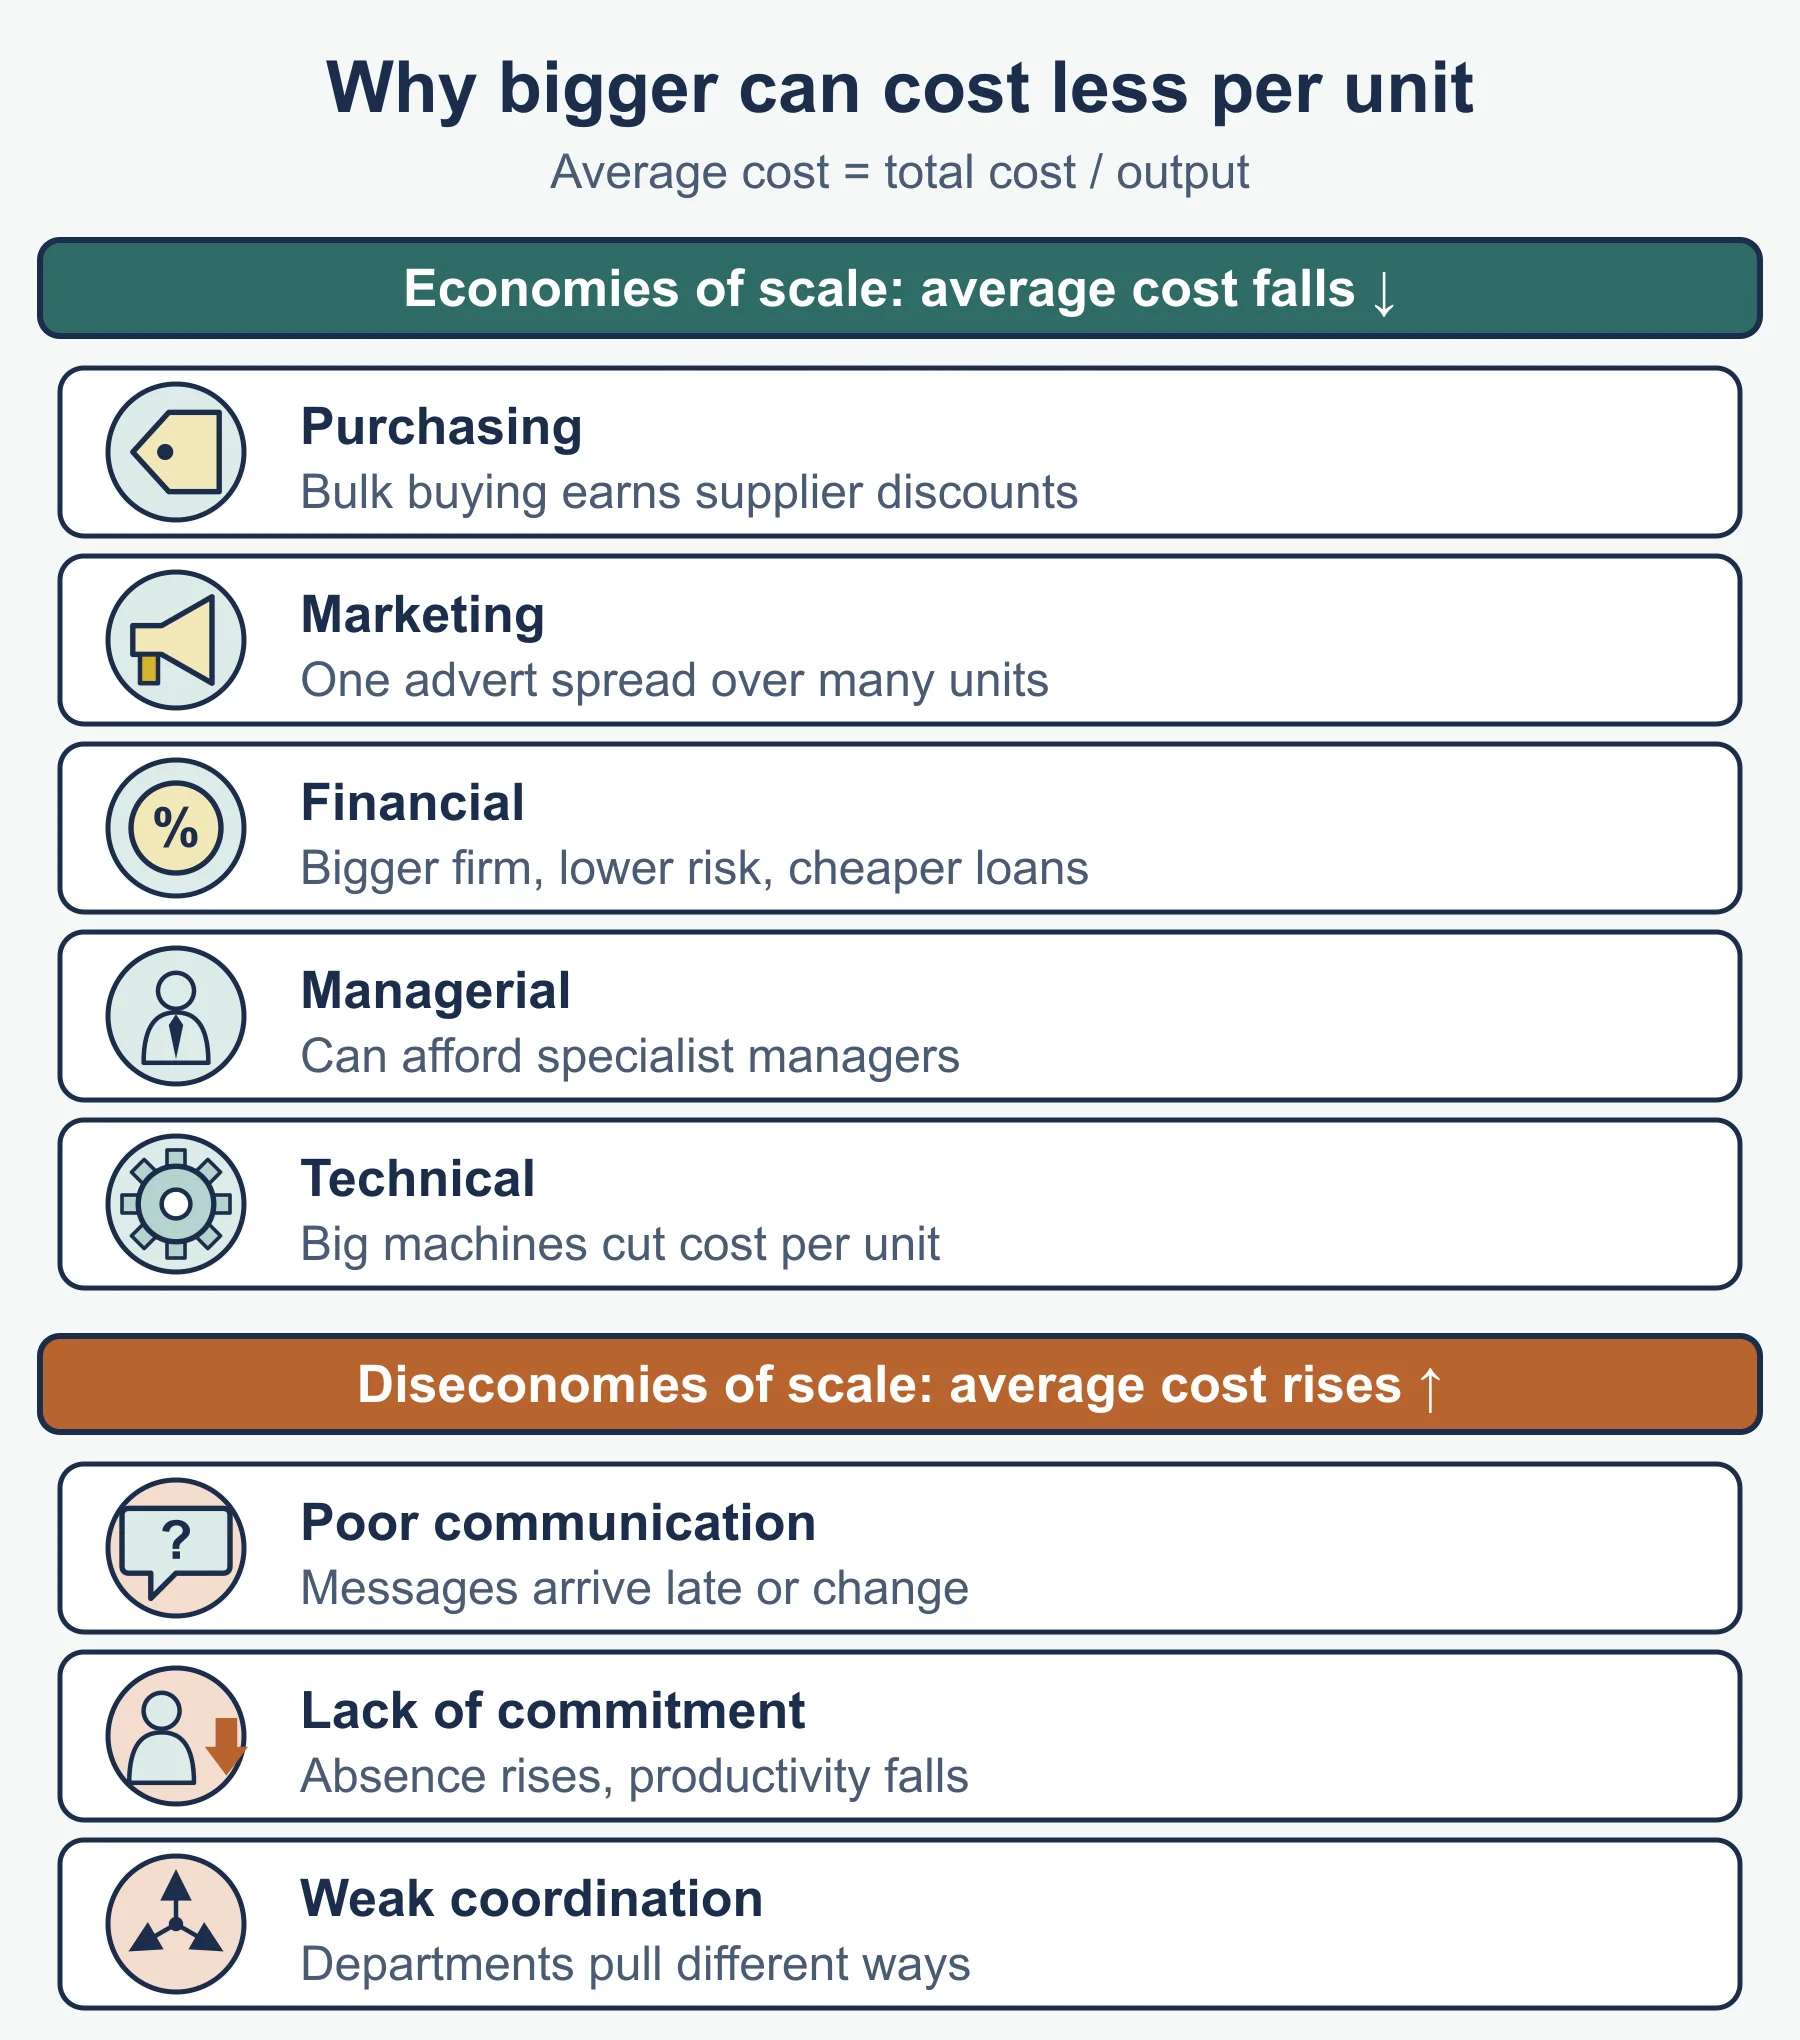
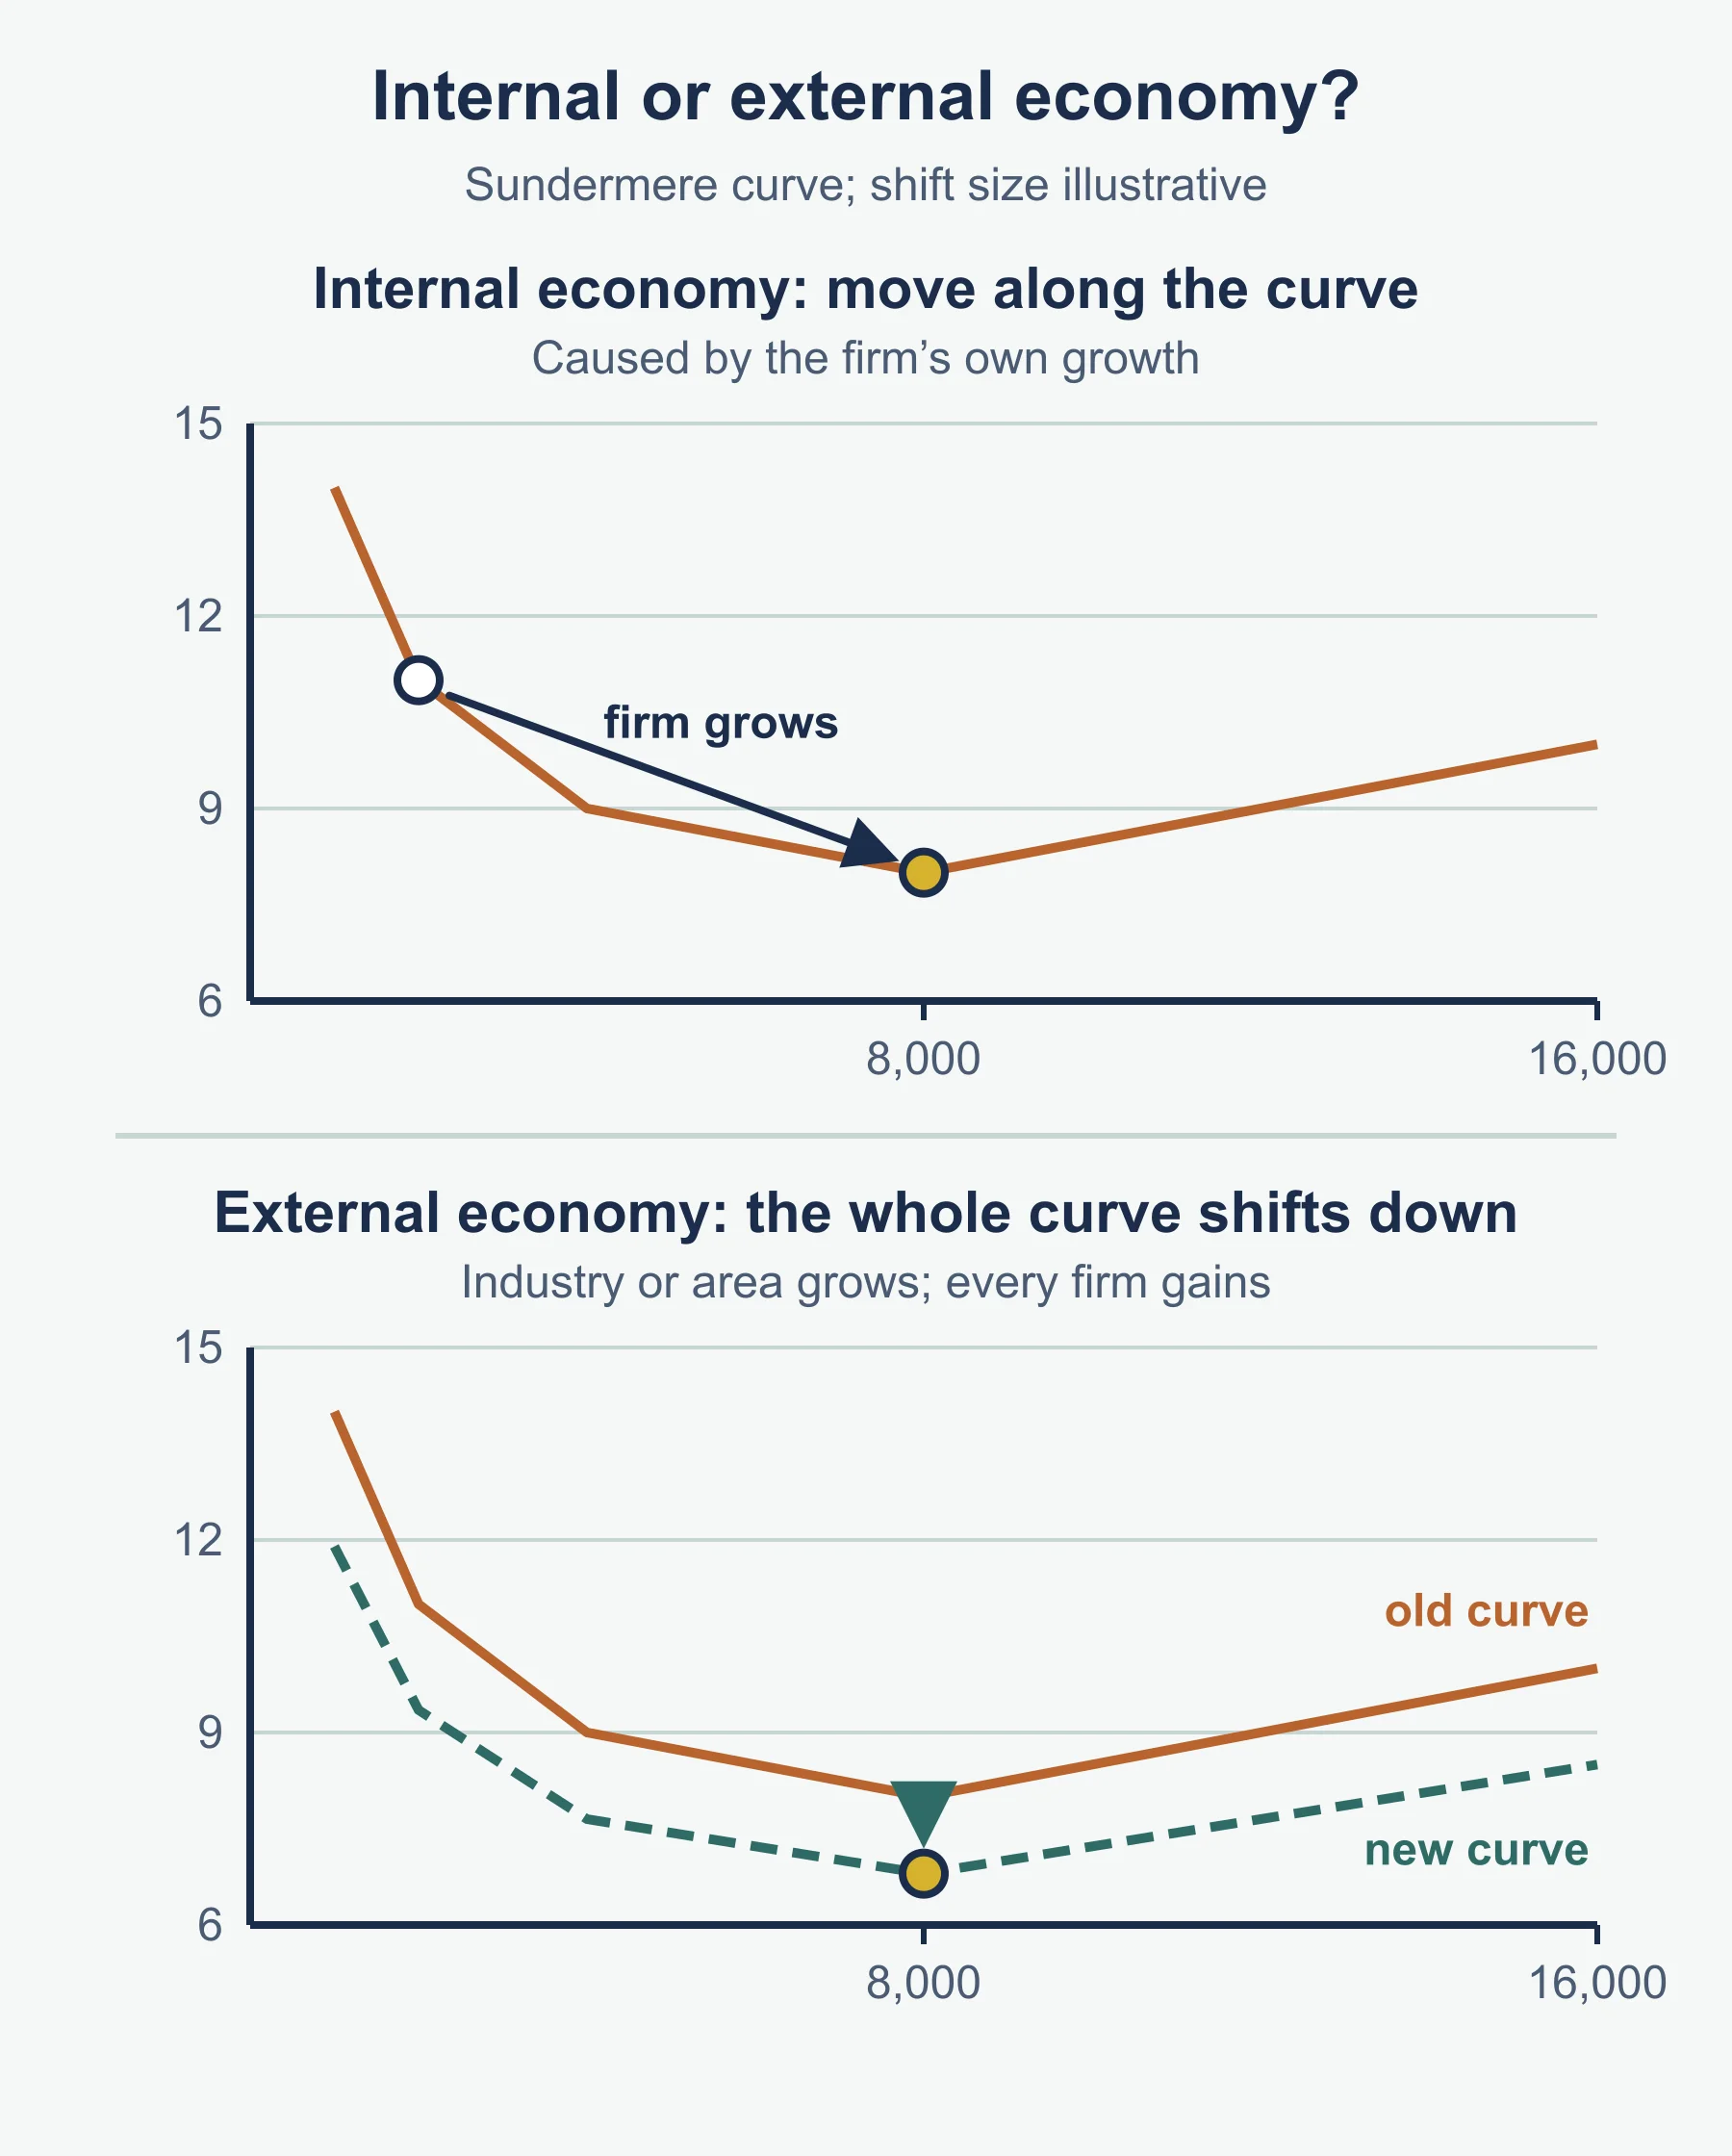
Economies of scale are falls in unit cost as output grows; diseconomies are rises as a business grows too large. Internal ones come from the firm’s own size; external ones from the size of the industry or area.
| Economies | Diseconomies | |
|---|---|---|
| Internal | Technical, purchasing, financial, marketing, managerial | Poor communication, slow decisions, alienated workers |
| External | Skilled labour pool, supplier clusters, infrastructure | Congestion, rising land and wage costs |
Lower unit costs allow lower prices or higher margins, but growth needs investment and may reduce flexibility.
Capacity utilisation and management
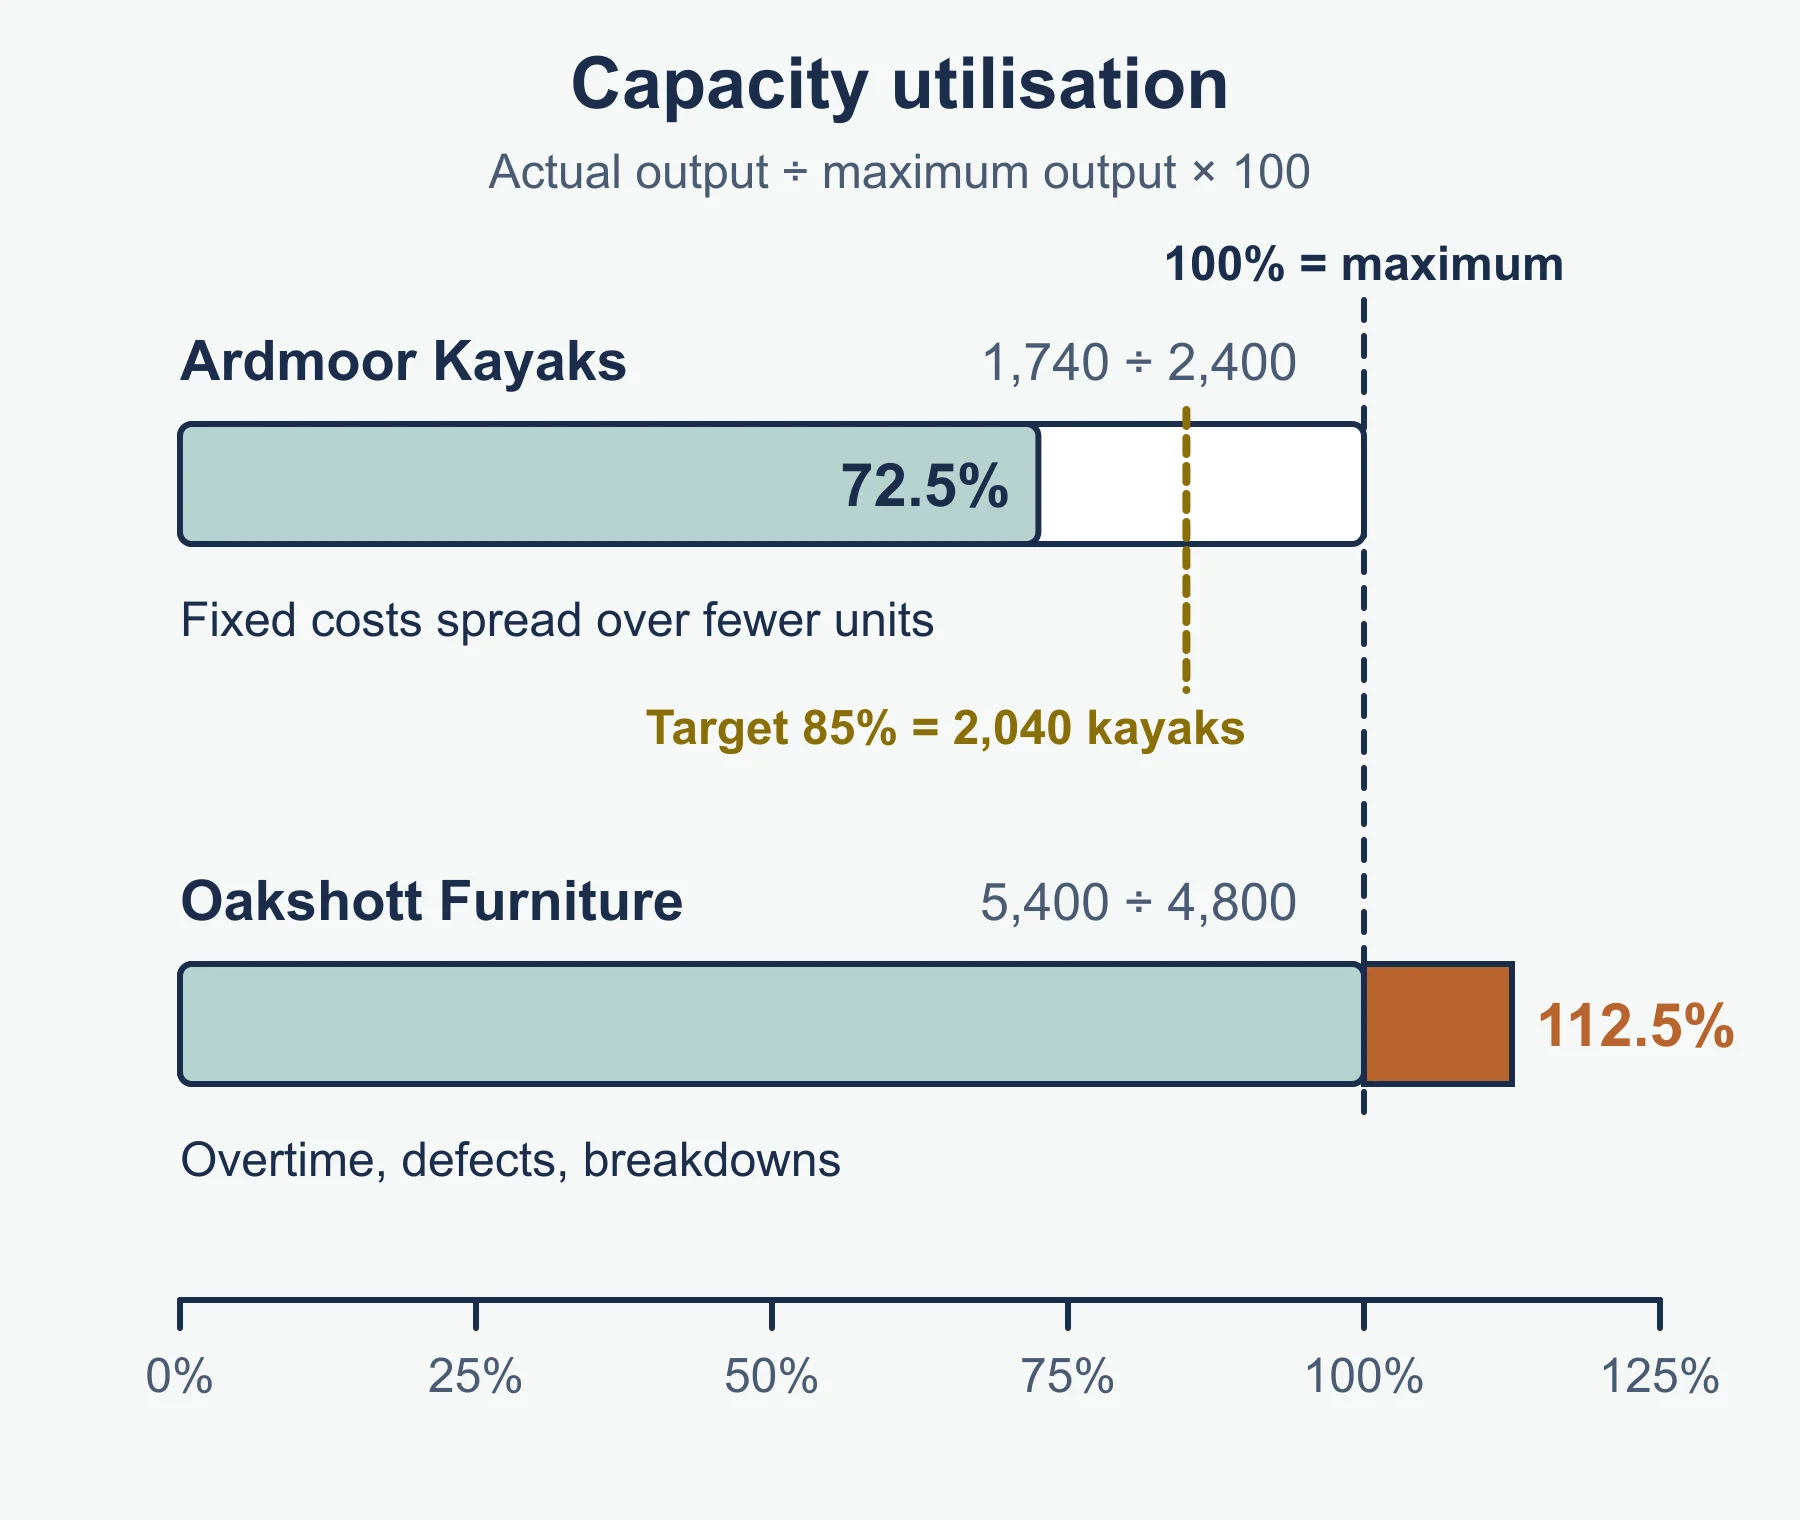
Capacity utilisation (standard form) = actual output / maximum output x 100. Capacity management matches capacity to demand. Example: 7,200 of 9,000 units = 80%.
Low utilisation means high fixed cost per unit; near 100% leaves no room for demand rises or maintenance. Change capacity by renting or buying premises, adding shifts, subcontracting or temporary staff; reduce it by closing sites or selling machinery. Manage it through demand forecasting, flexible contracts and planned maintenance.
Stock control
Stock control is managing stock so the business neither runs out nor ties up cash. Holding stock protects against shortages but costs storage, insurance and cash, and risks waste.
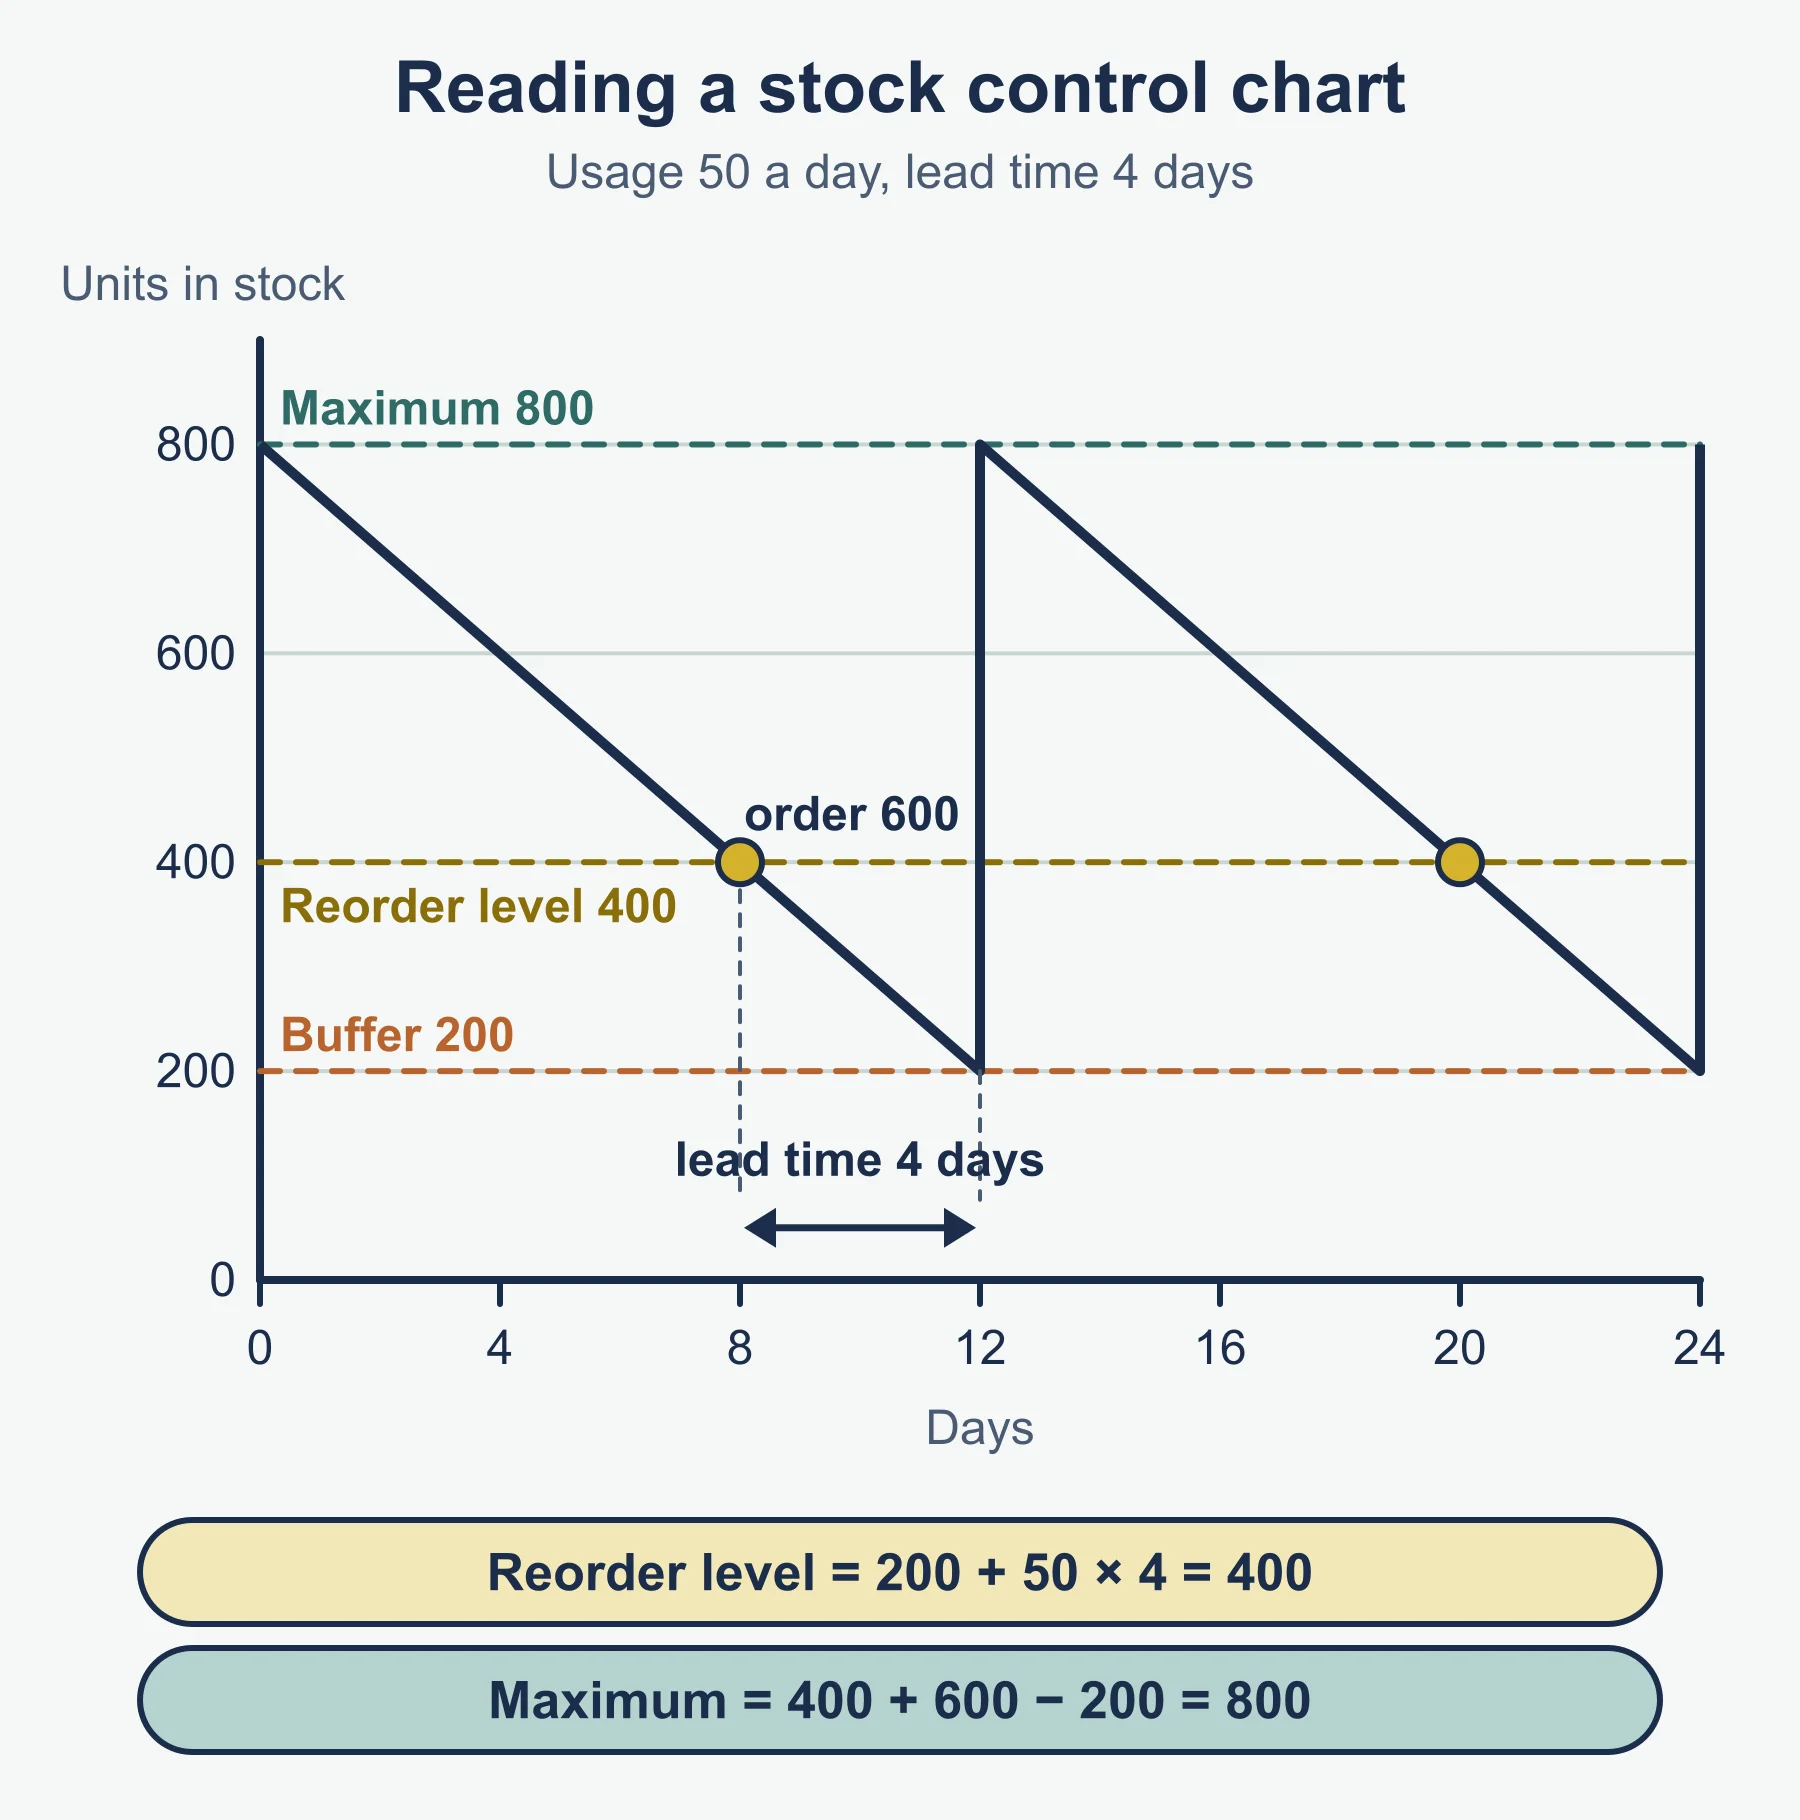
Stock control charts show stock over time: buffer stock (minimum level), lead time (order to delivery), reorder level and reorder quantity. Reorder level (standard form) = buffer + usage x lead time. Maximum stock = reorder level + reorder quantity - usage in lead time.
Example. Buffer 200, usage 50 a day, lead time 4 days, reorder quantity 600: reorder level 200 + 200 = 400; maximum 400 + 600 - 200 = 800.
Methods:
- Fixed reorder stock level: order a set quantity when stock hits the reorder level.
- Fixed time reordering: order at set intervals, varying quantity.
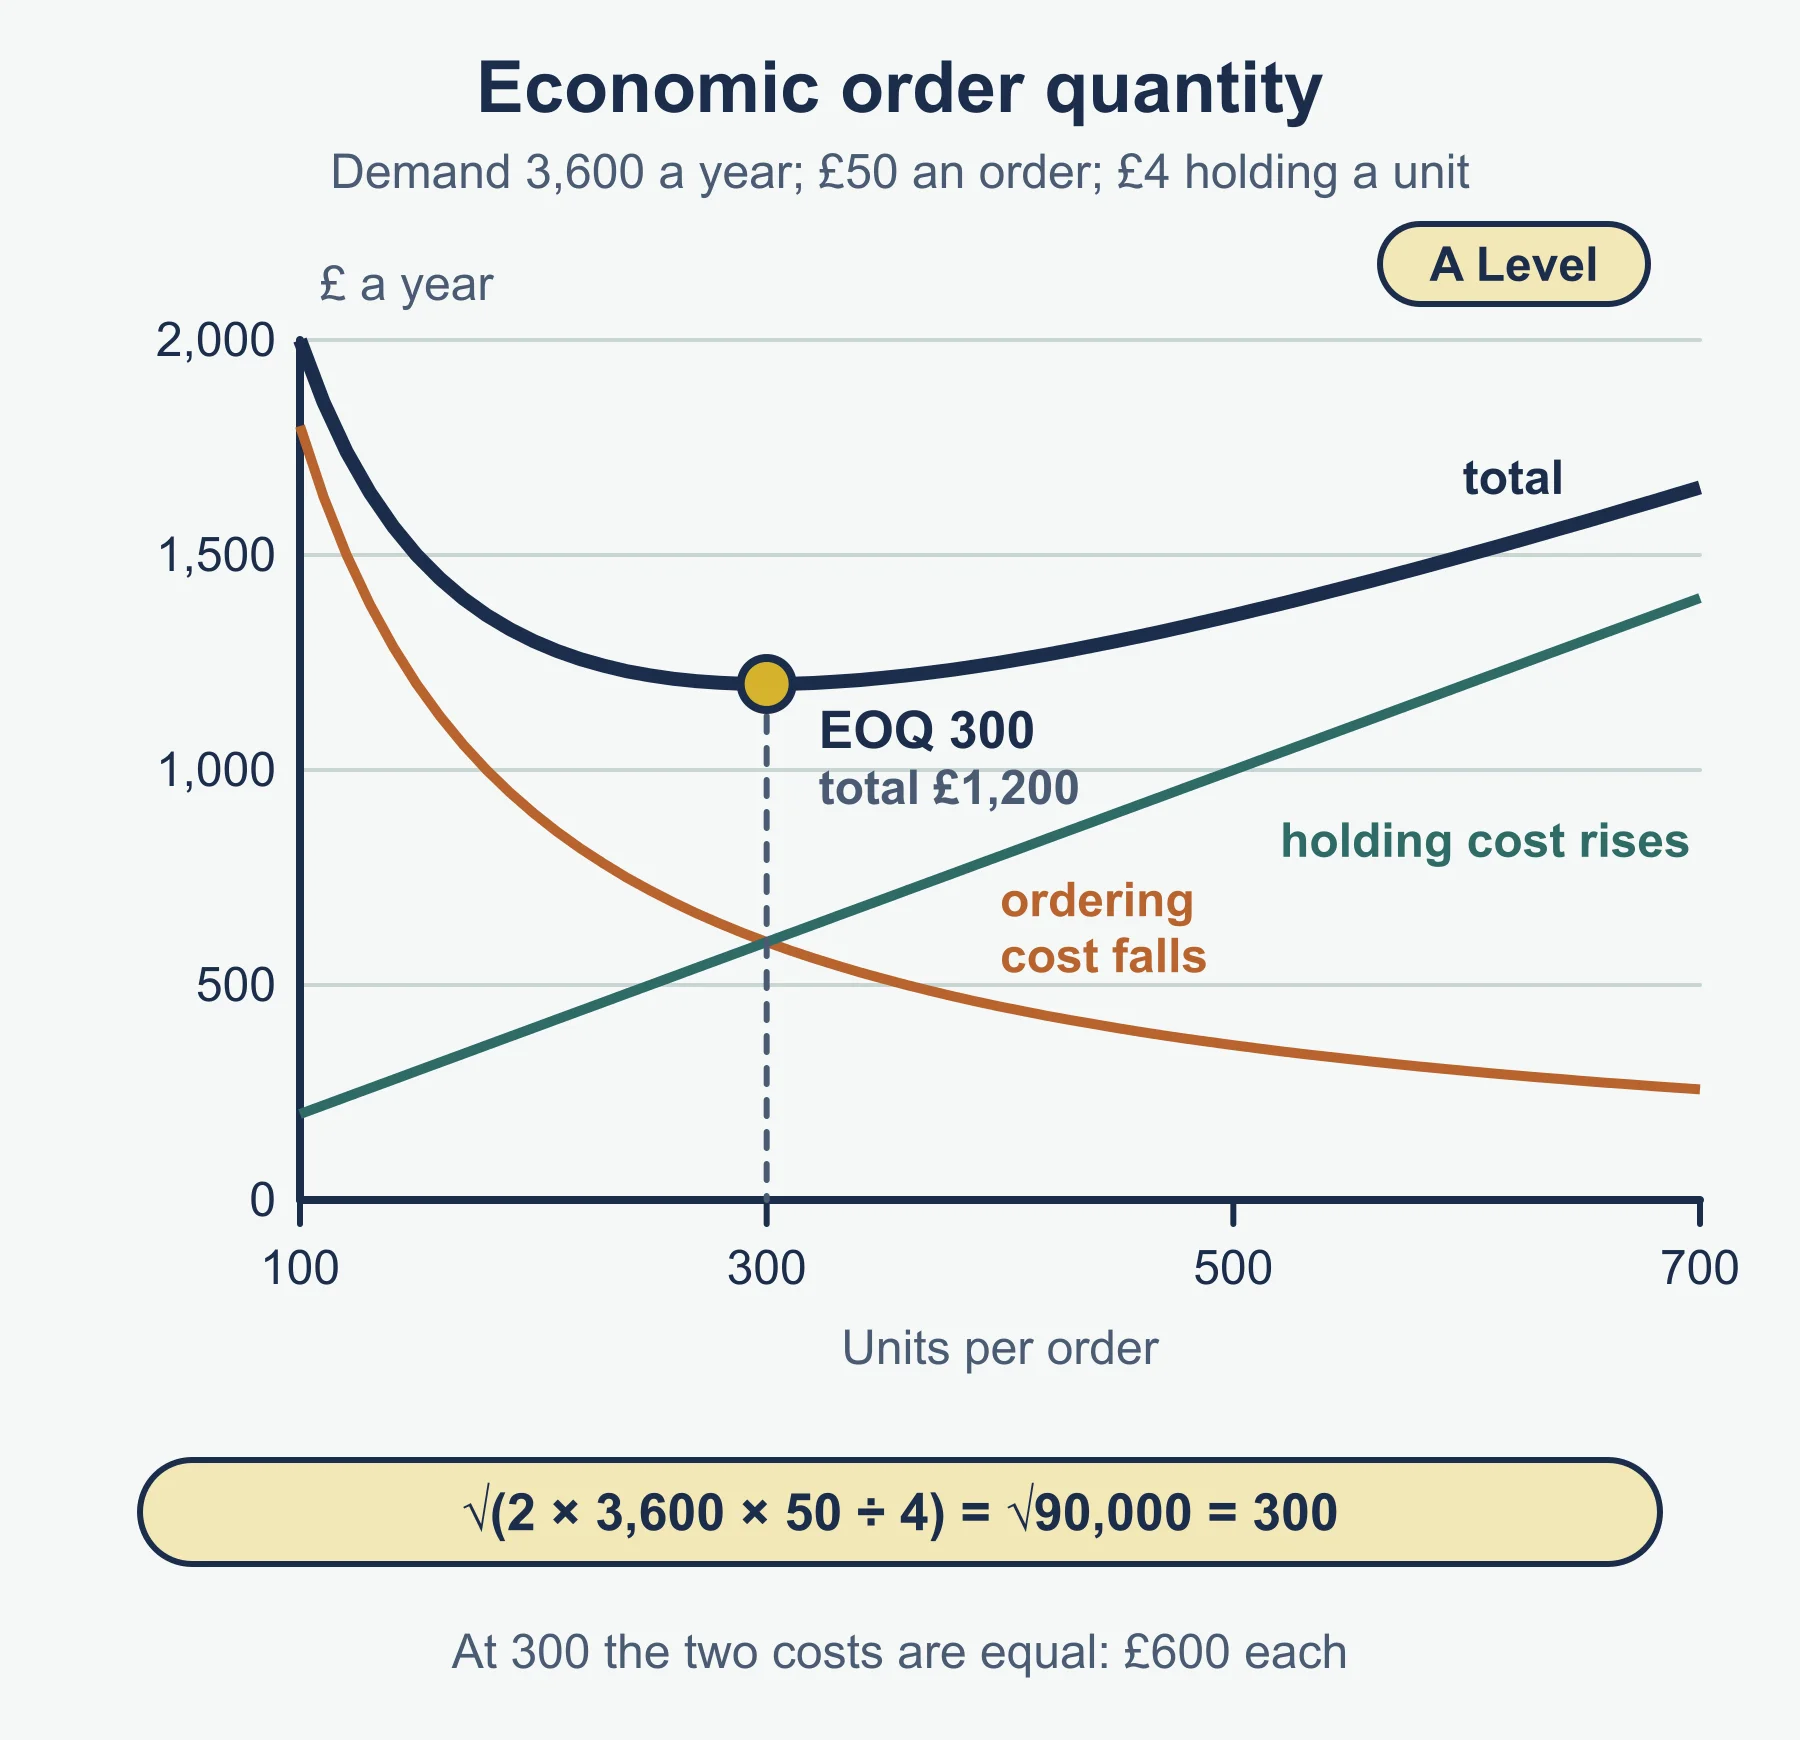
- Economic order quantity (EOQ): the order size minimising ordering plus holding cost; standard form square root of (2 x annual demand x cost per order / holding cost per unit). Demand 3,600, £50 per order, £4 holding: square root of 90,000 = 300.
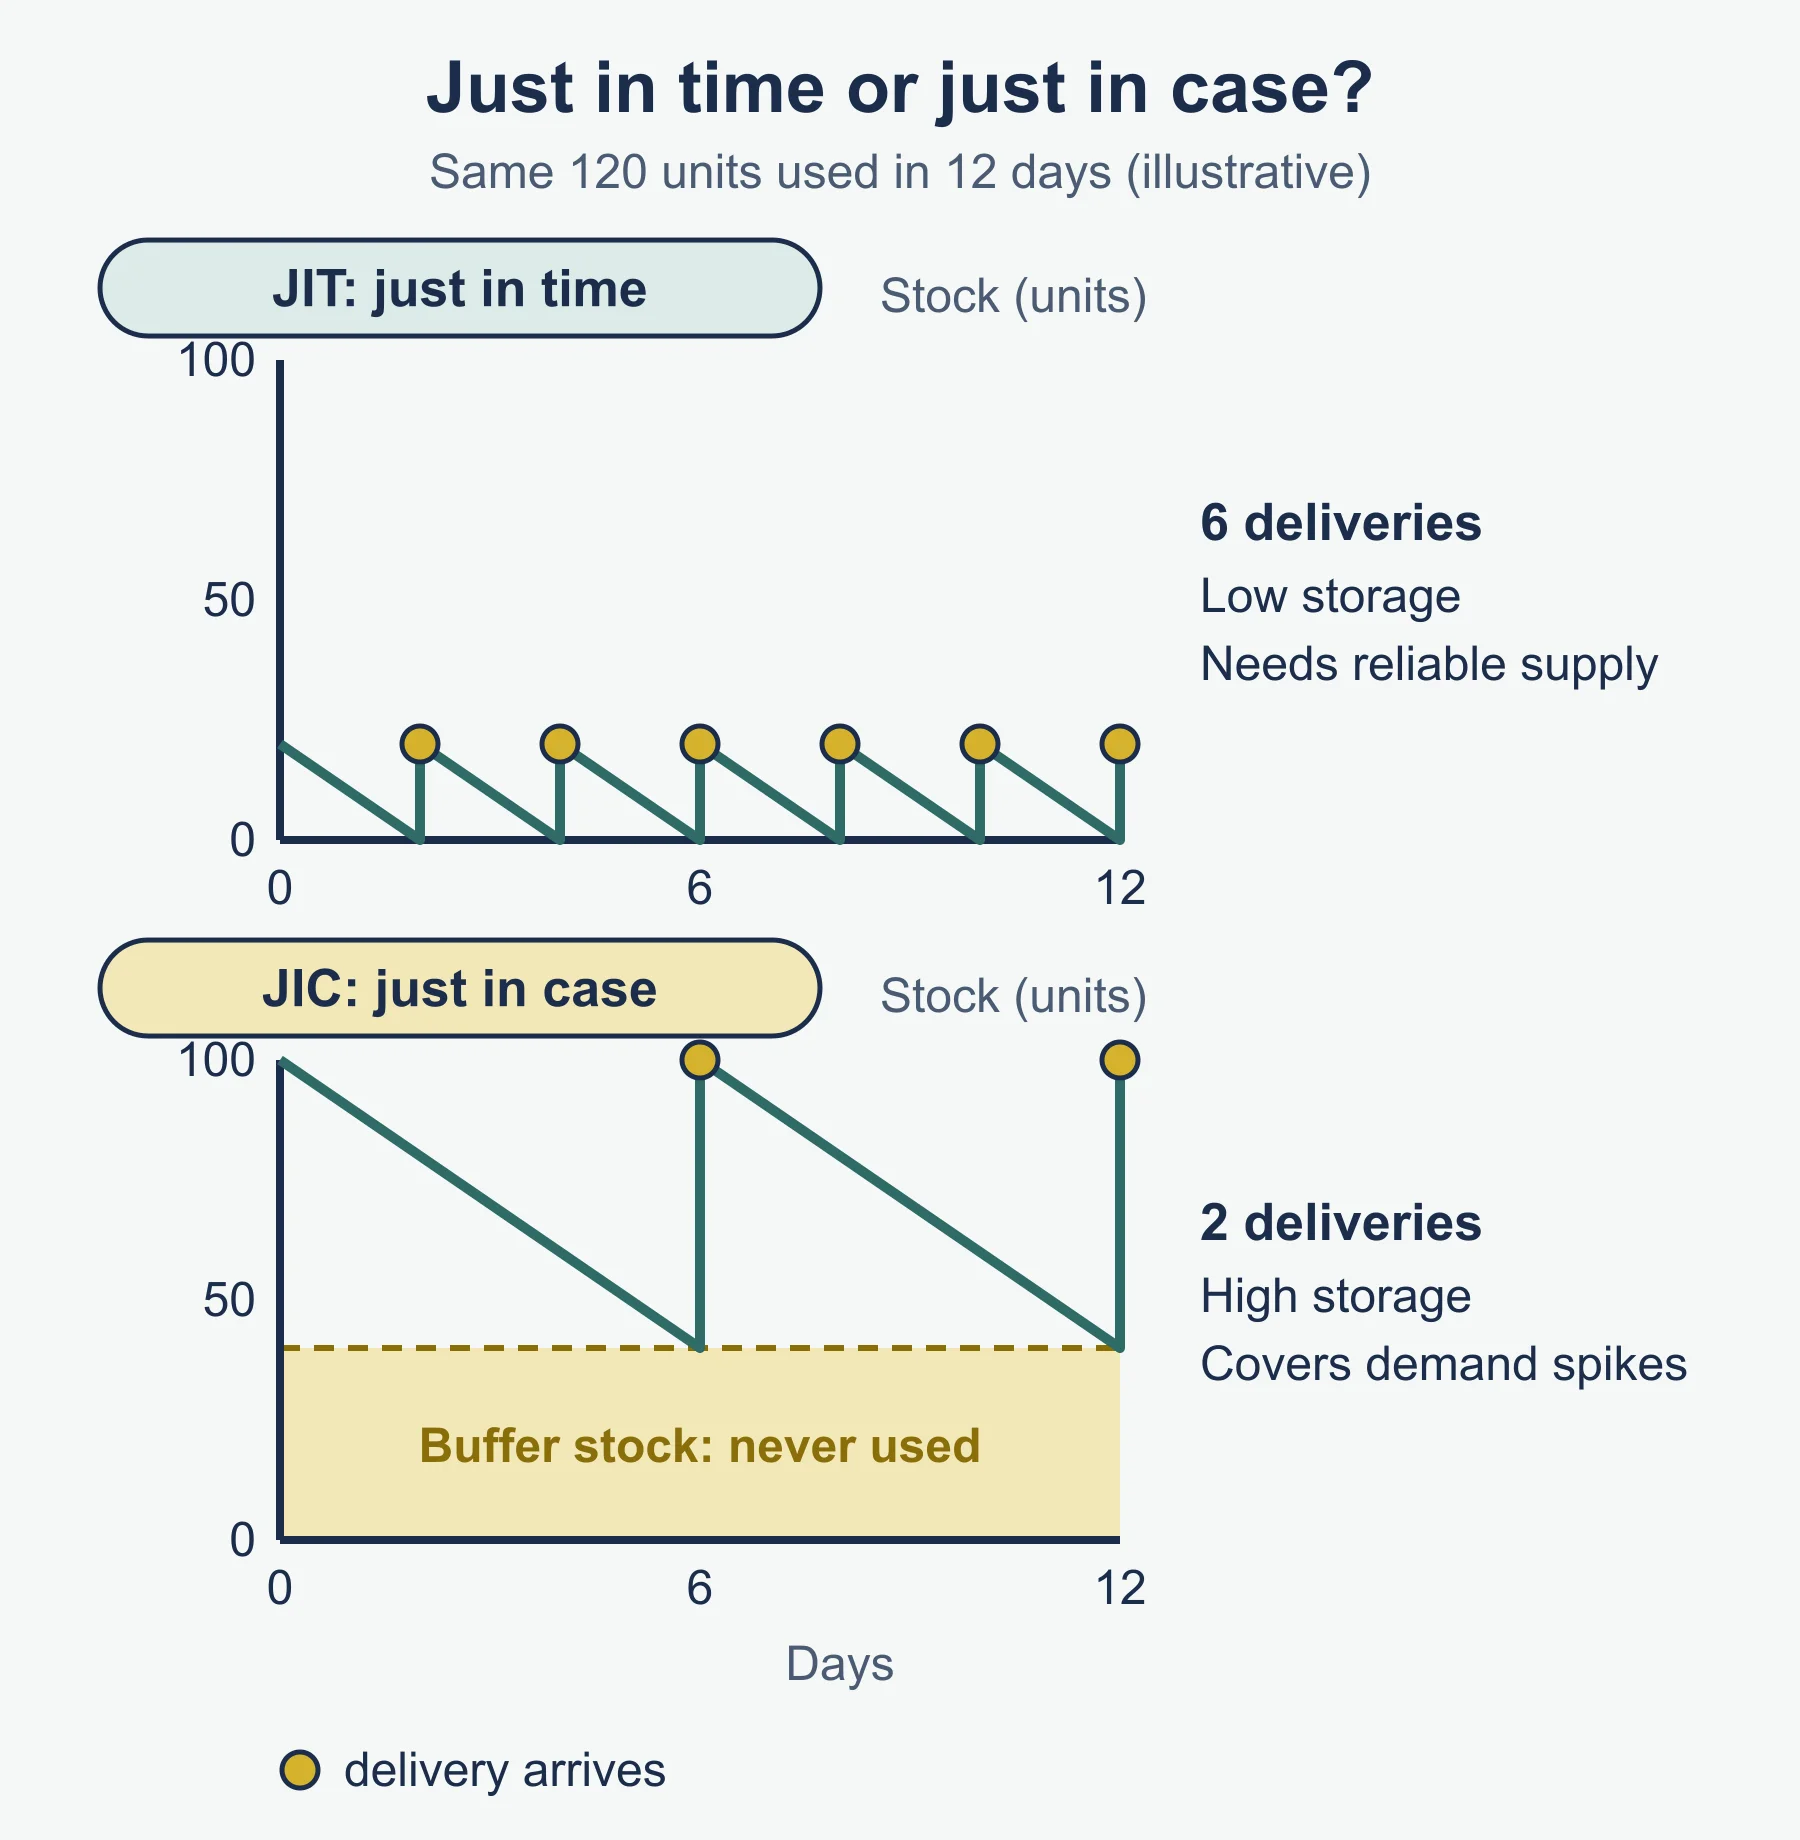
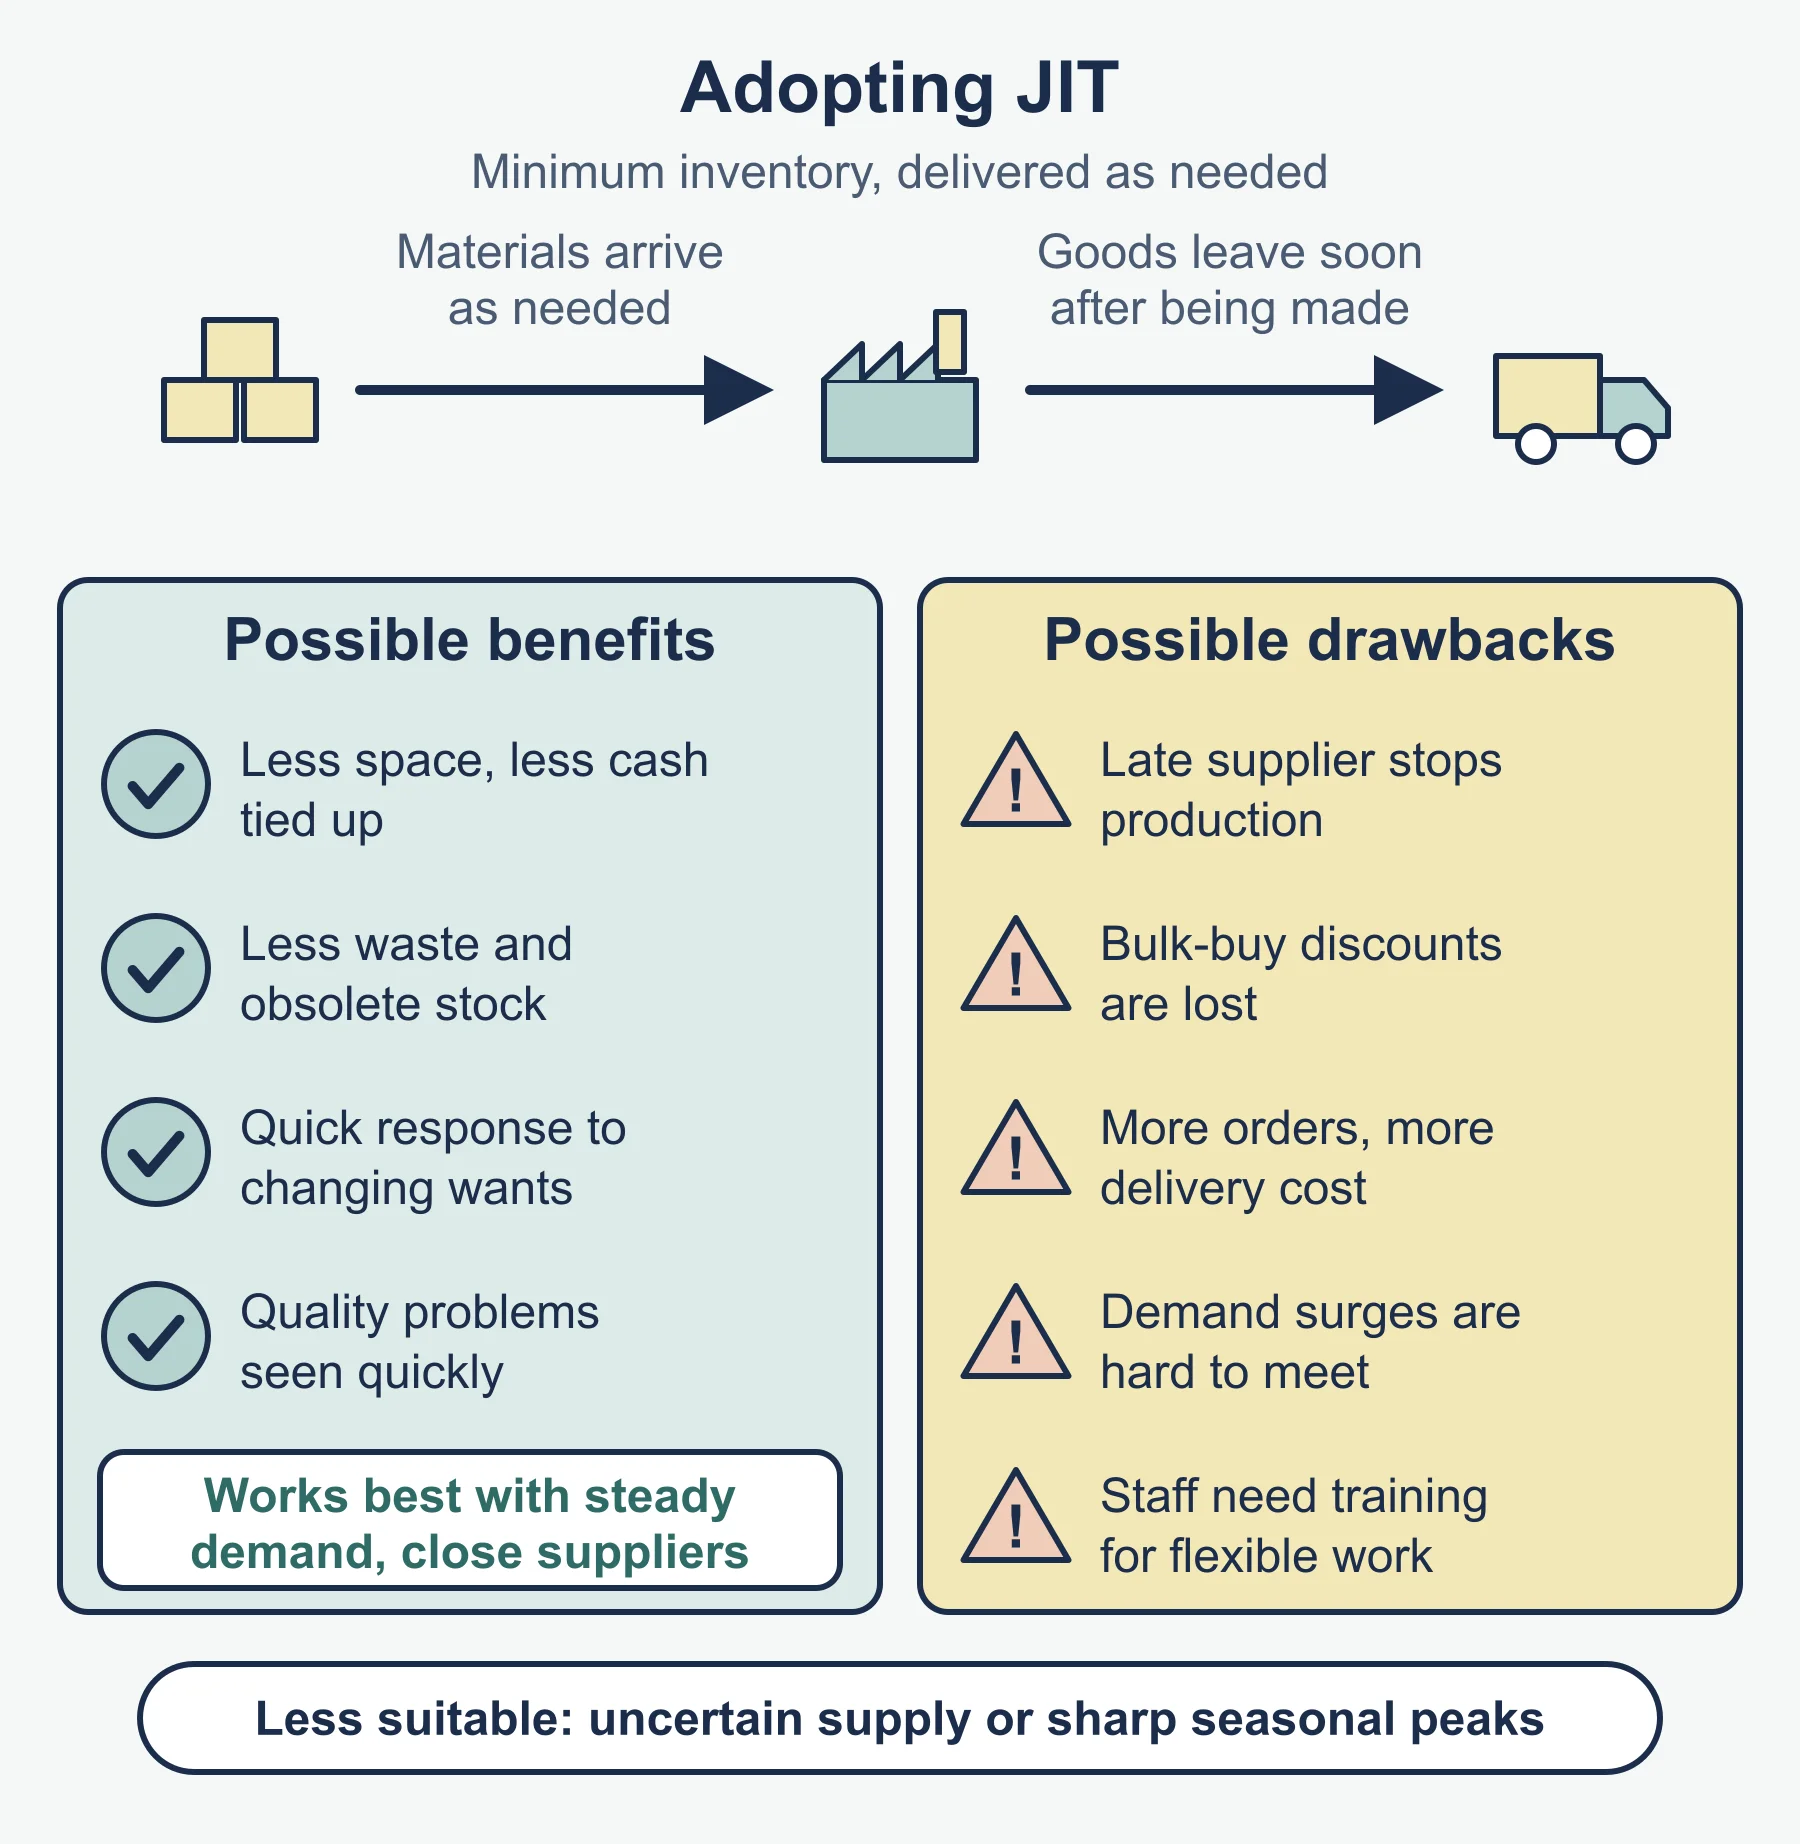
- Just in time (JIT): materials arrive as needed; saves cash and space but exposes production to late deliveries.
- Kanban: signal cards trigger replacement of stock used.
- Electronic methods: barcode and sales data track stock and trigger orders.
Link to production method: job production needs stock for each order, flow needs reliable continuous supply, batch holds stock between batches.
Lean production
Lean production minimises waste of materials, time, space and effort while keeping quality, to cut costs and respond to customers. Methods: JIT, kaizen (continuous improvement from small employee suggestions), cell production, time-based management. Impact: lower costs and faster delivery, but fragile supply and heavy reliance on staff commitment. Recommend JIT where suppliers are close and reliable; kaizen where staff are skilled and motivated.
Technology
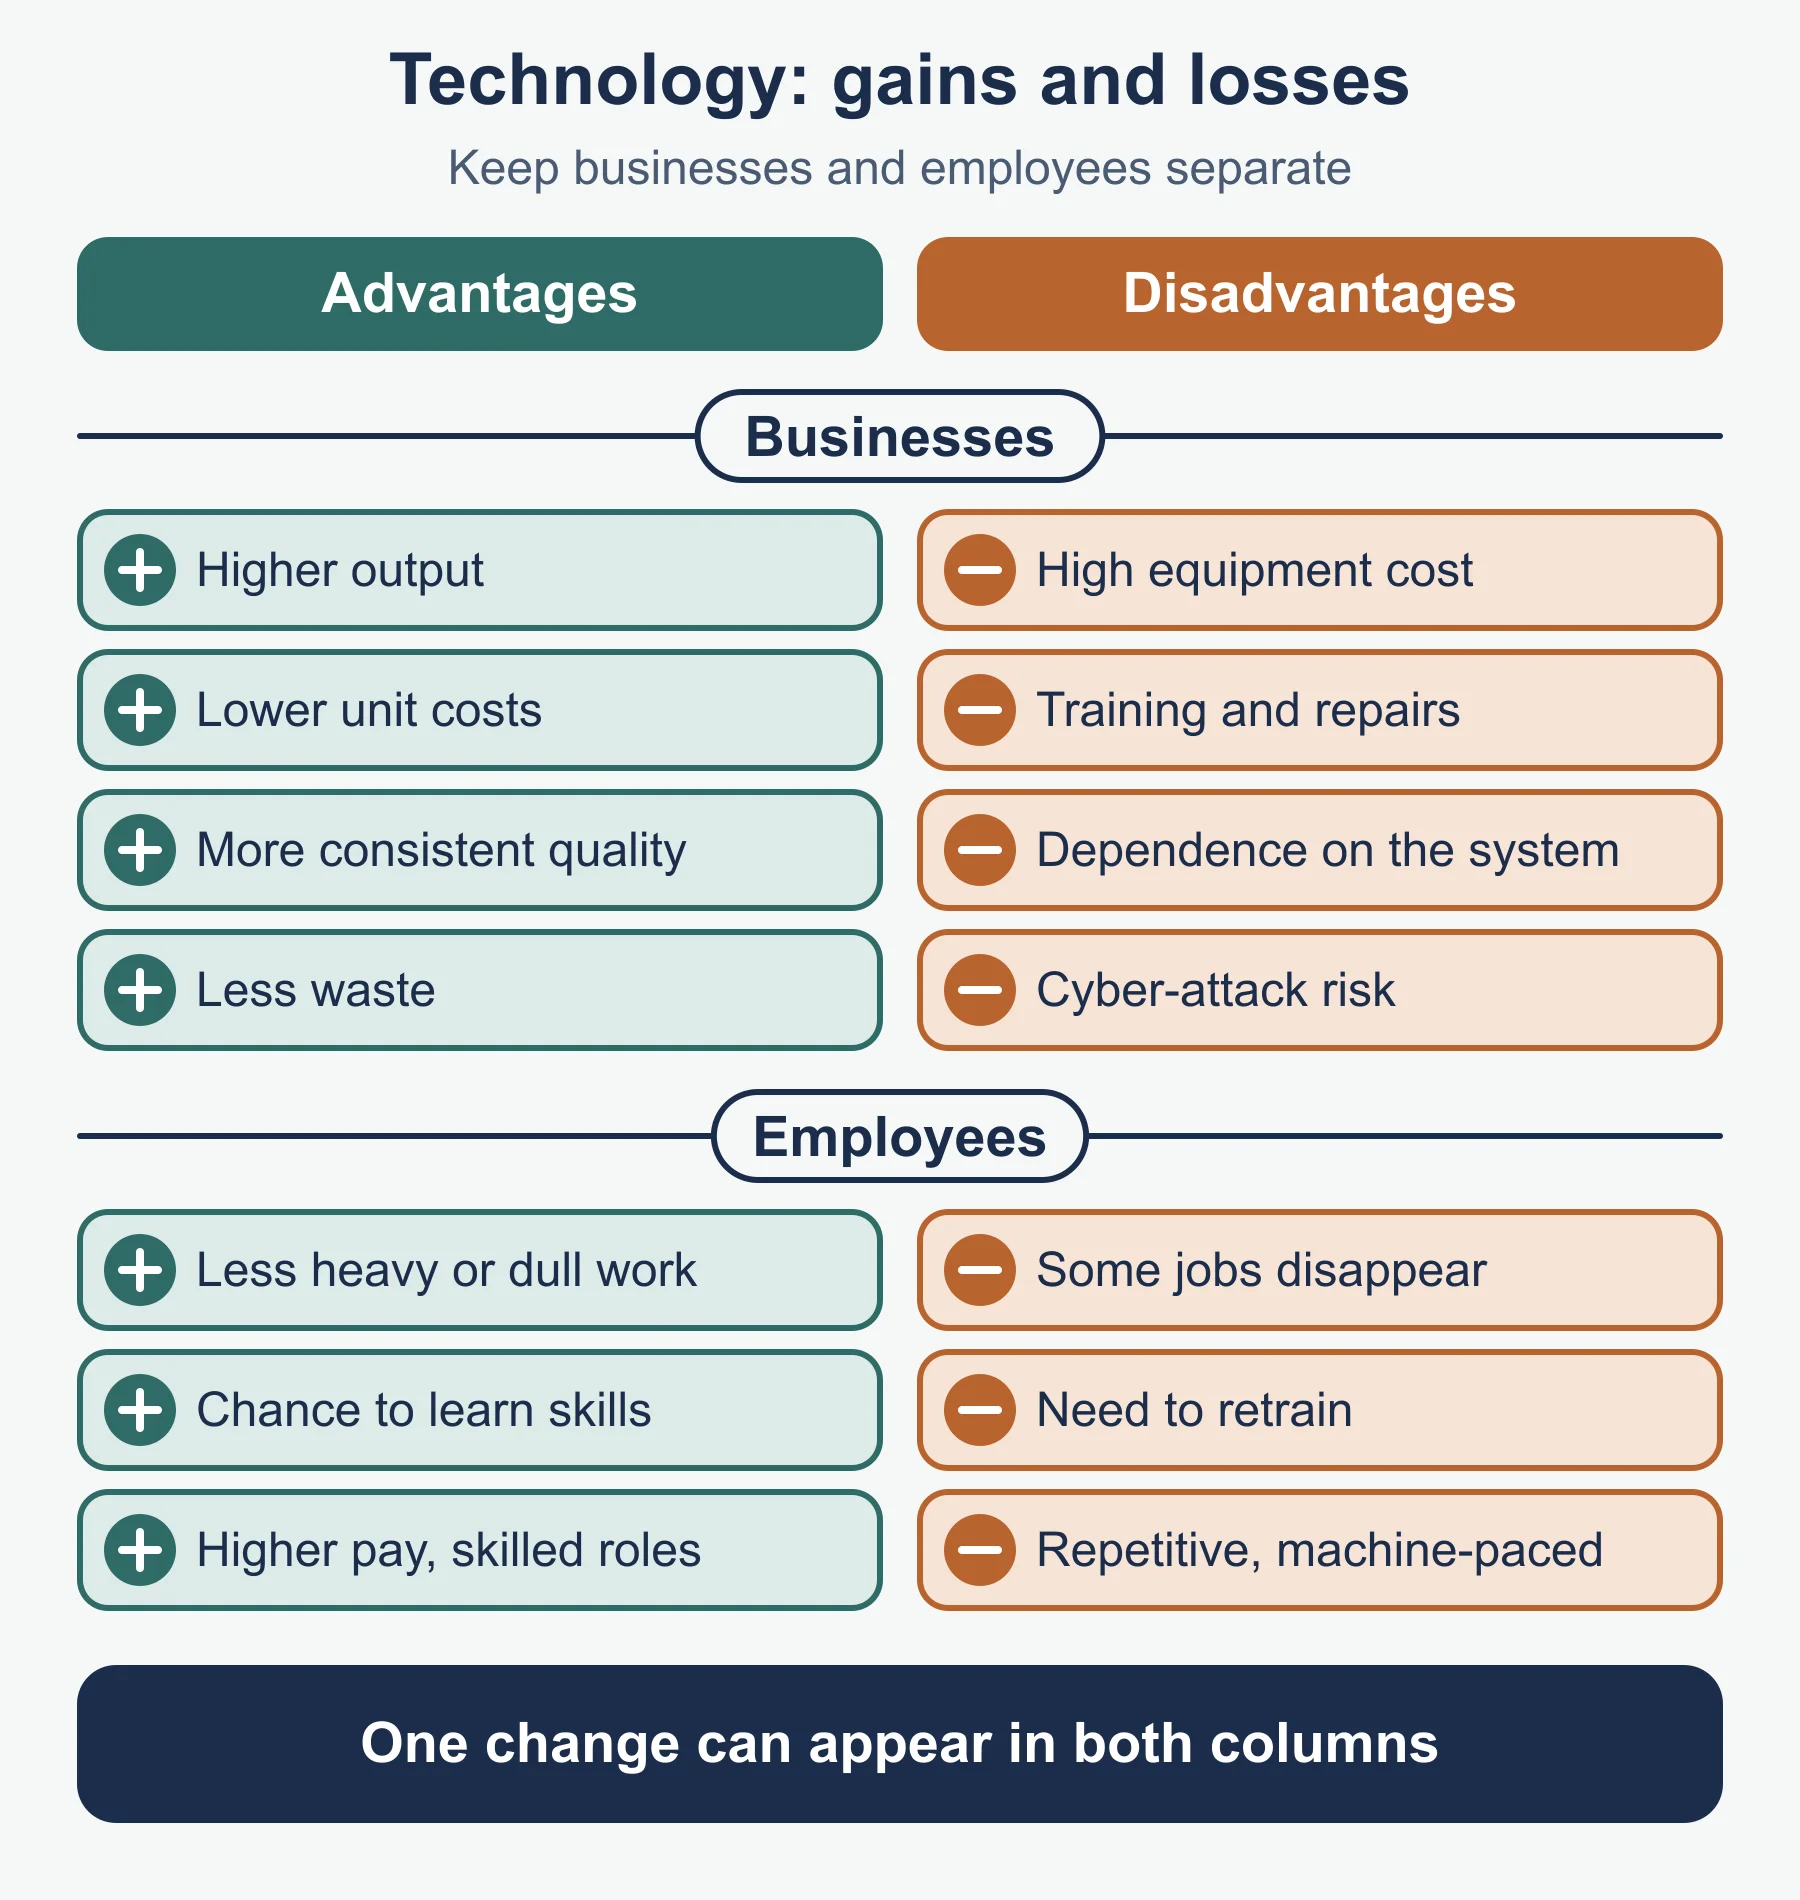
Technology in operations includes computer-aided design and manufacture, robots, stock software and e-commerce. It raises productivity and consistency and lowers unit cost, but brings capital cost, job losses, retraining and system-failure risk.
Quality
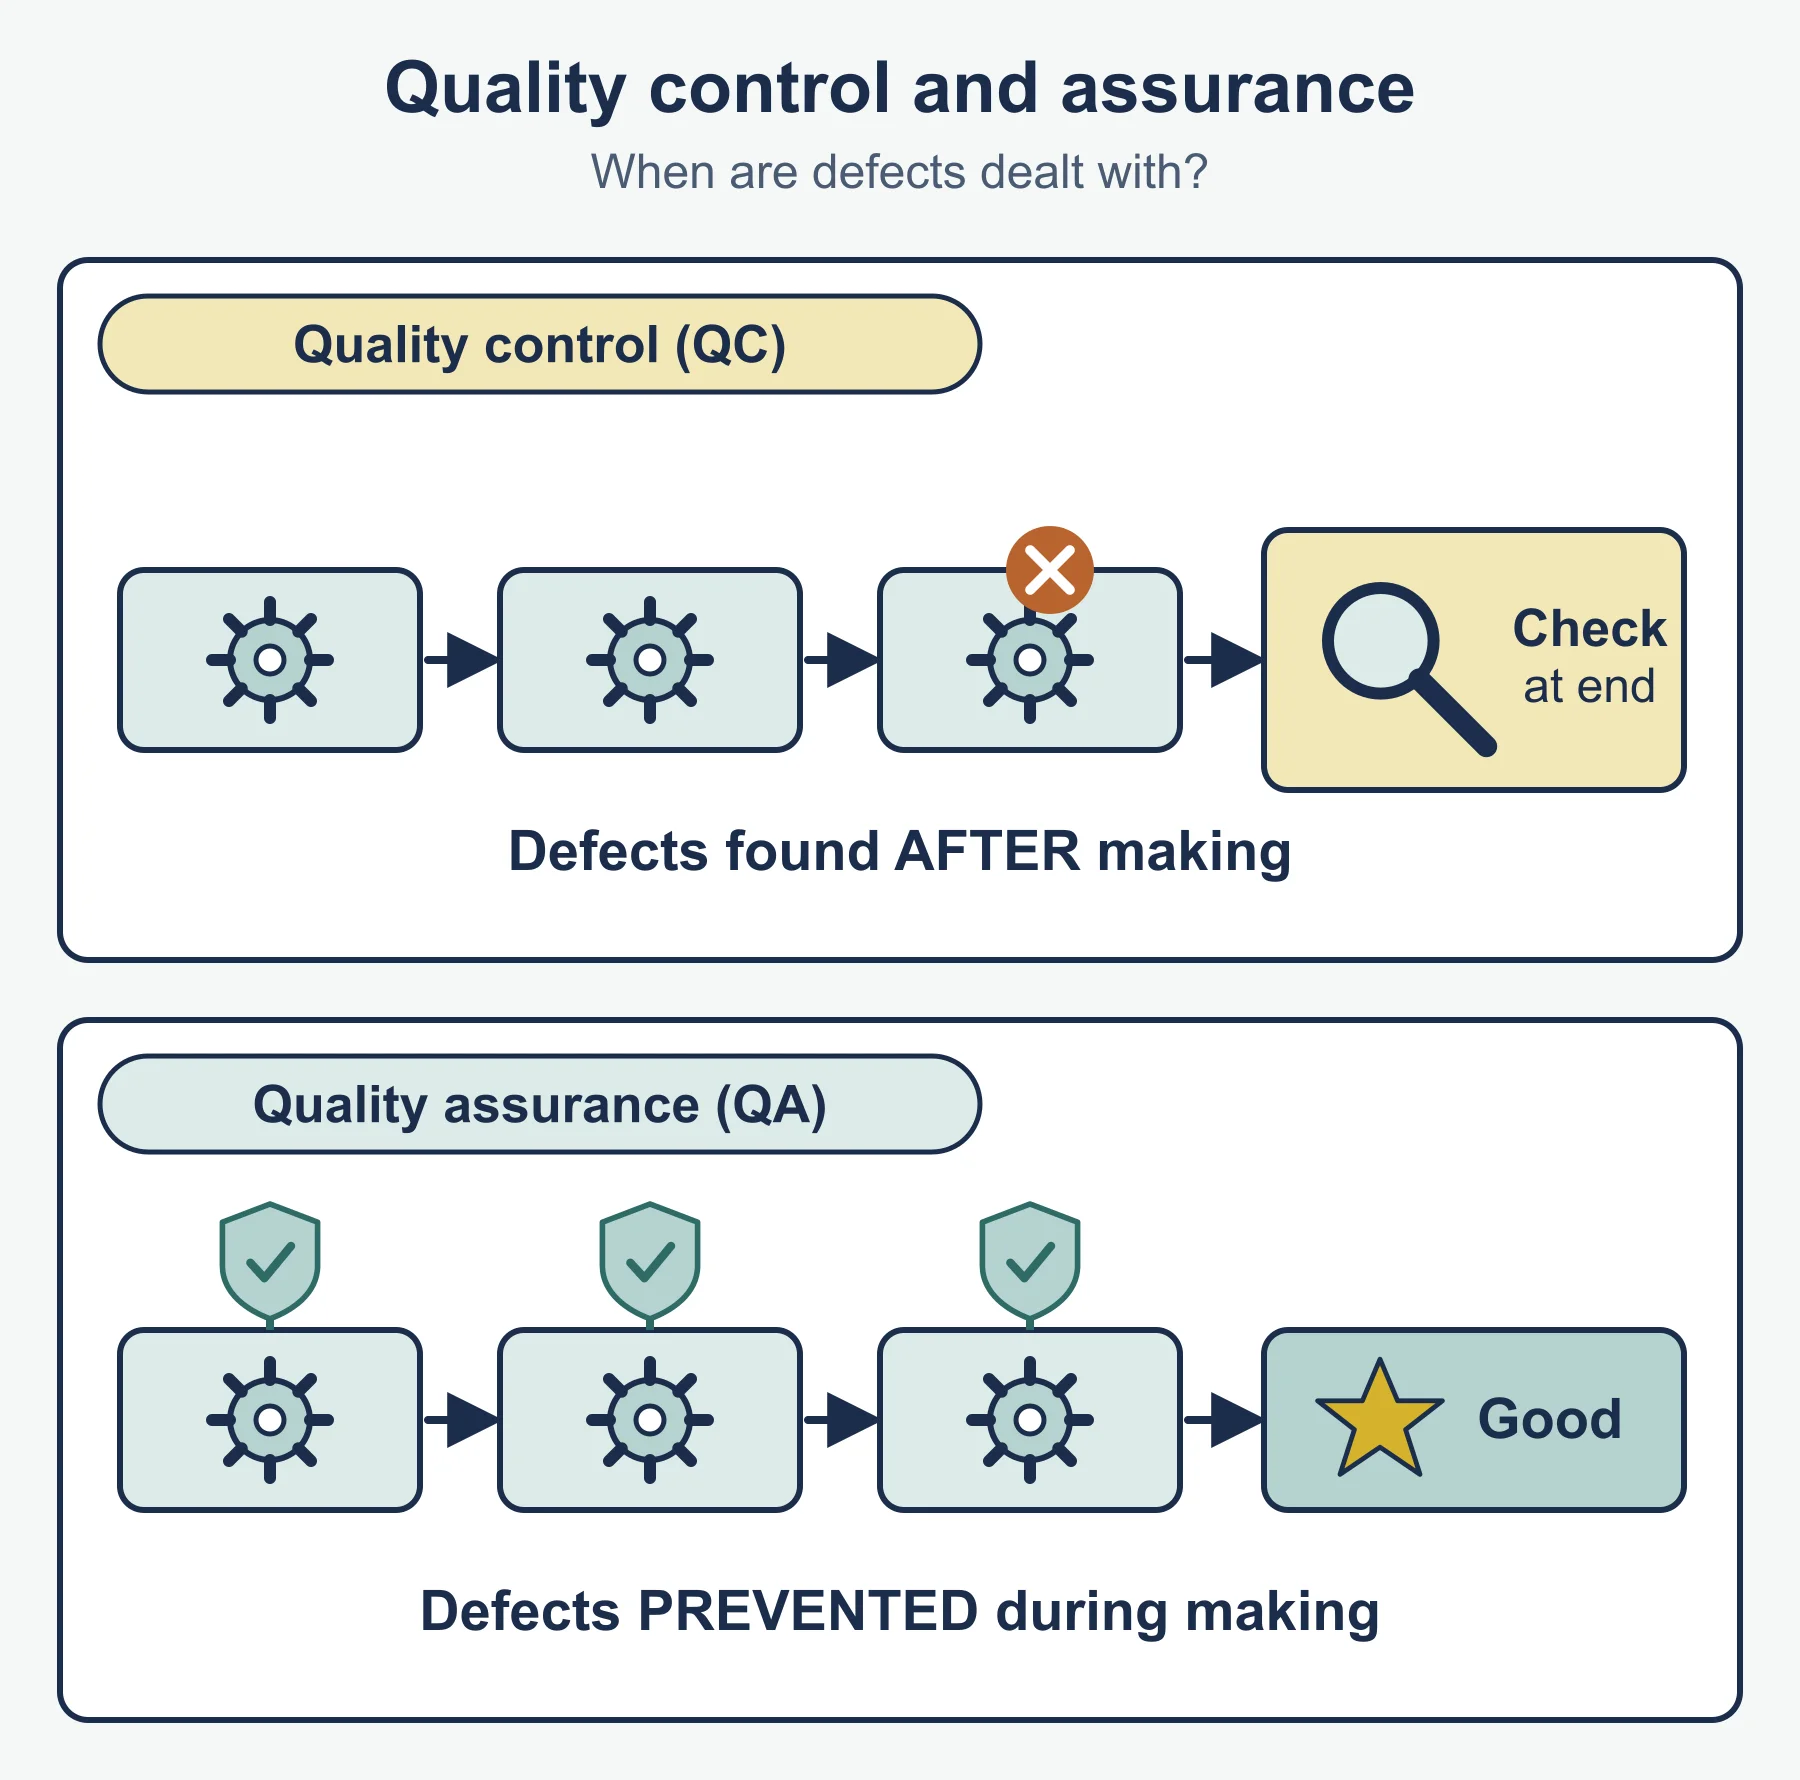
Quality control inspects output to find defects; quality assurance builds quality into the whole process to prevent them. Reasons: meet expectations, protect reputation, cut waste and returns.
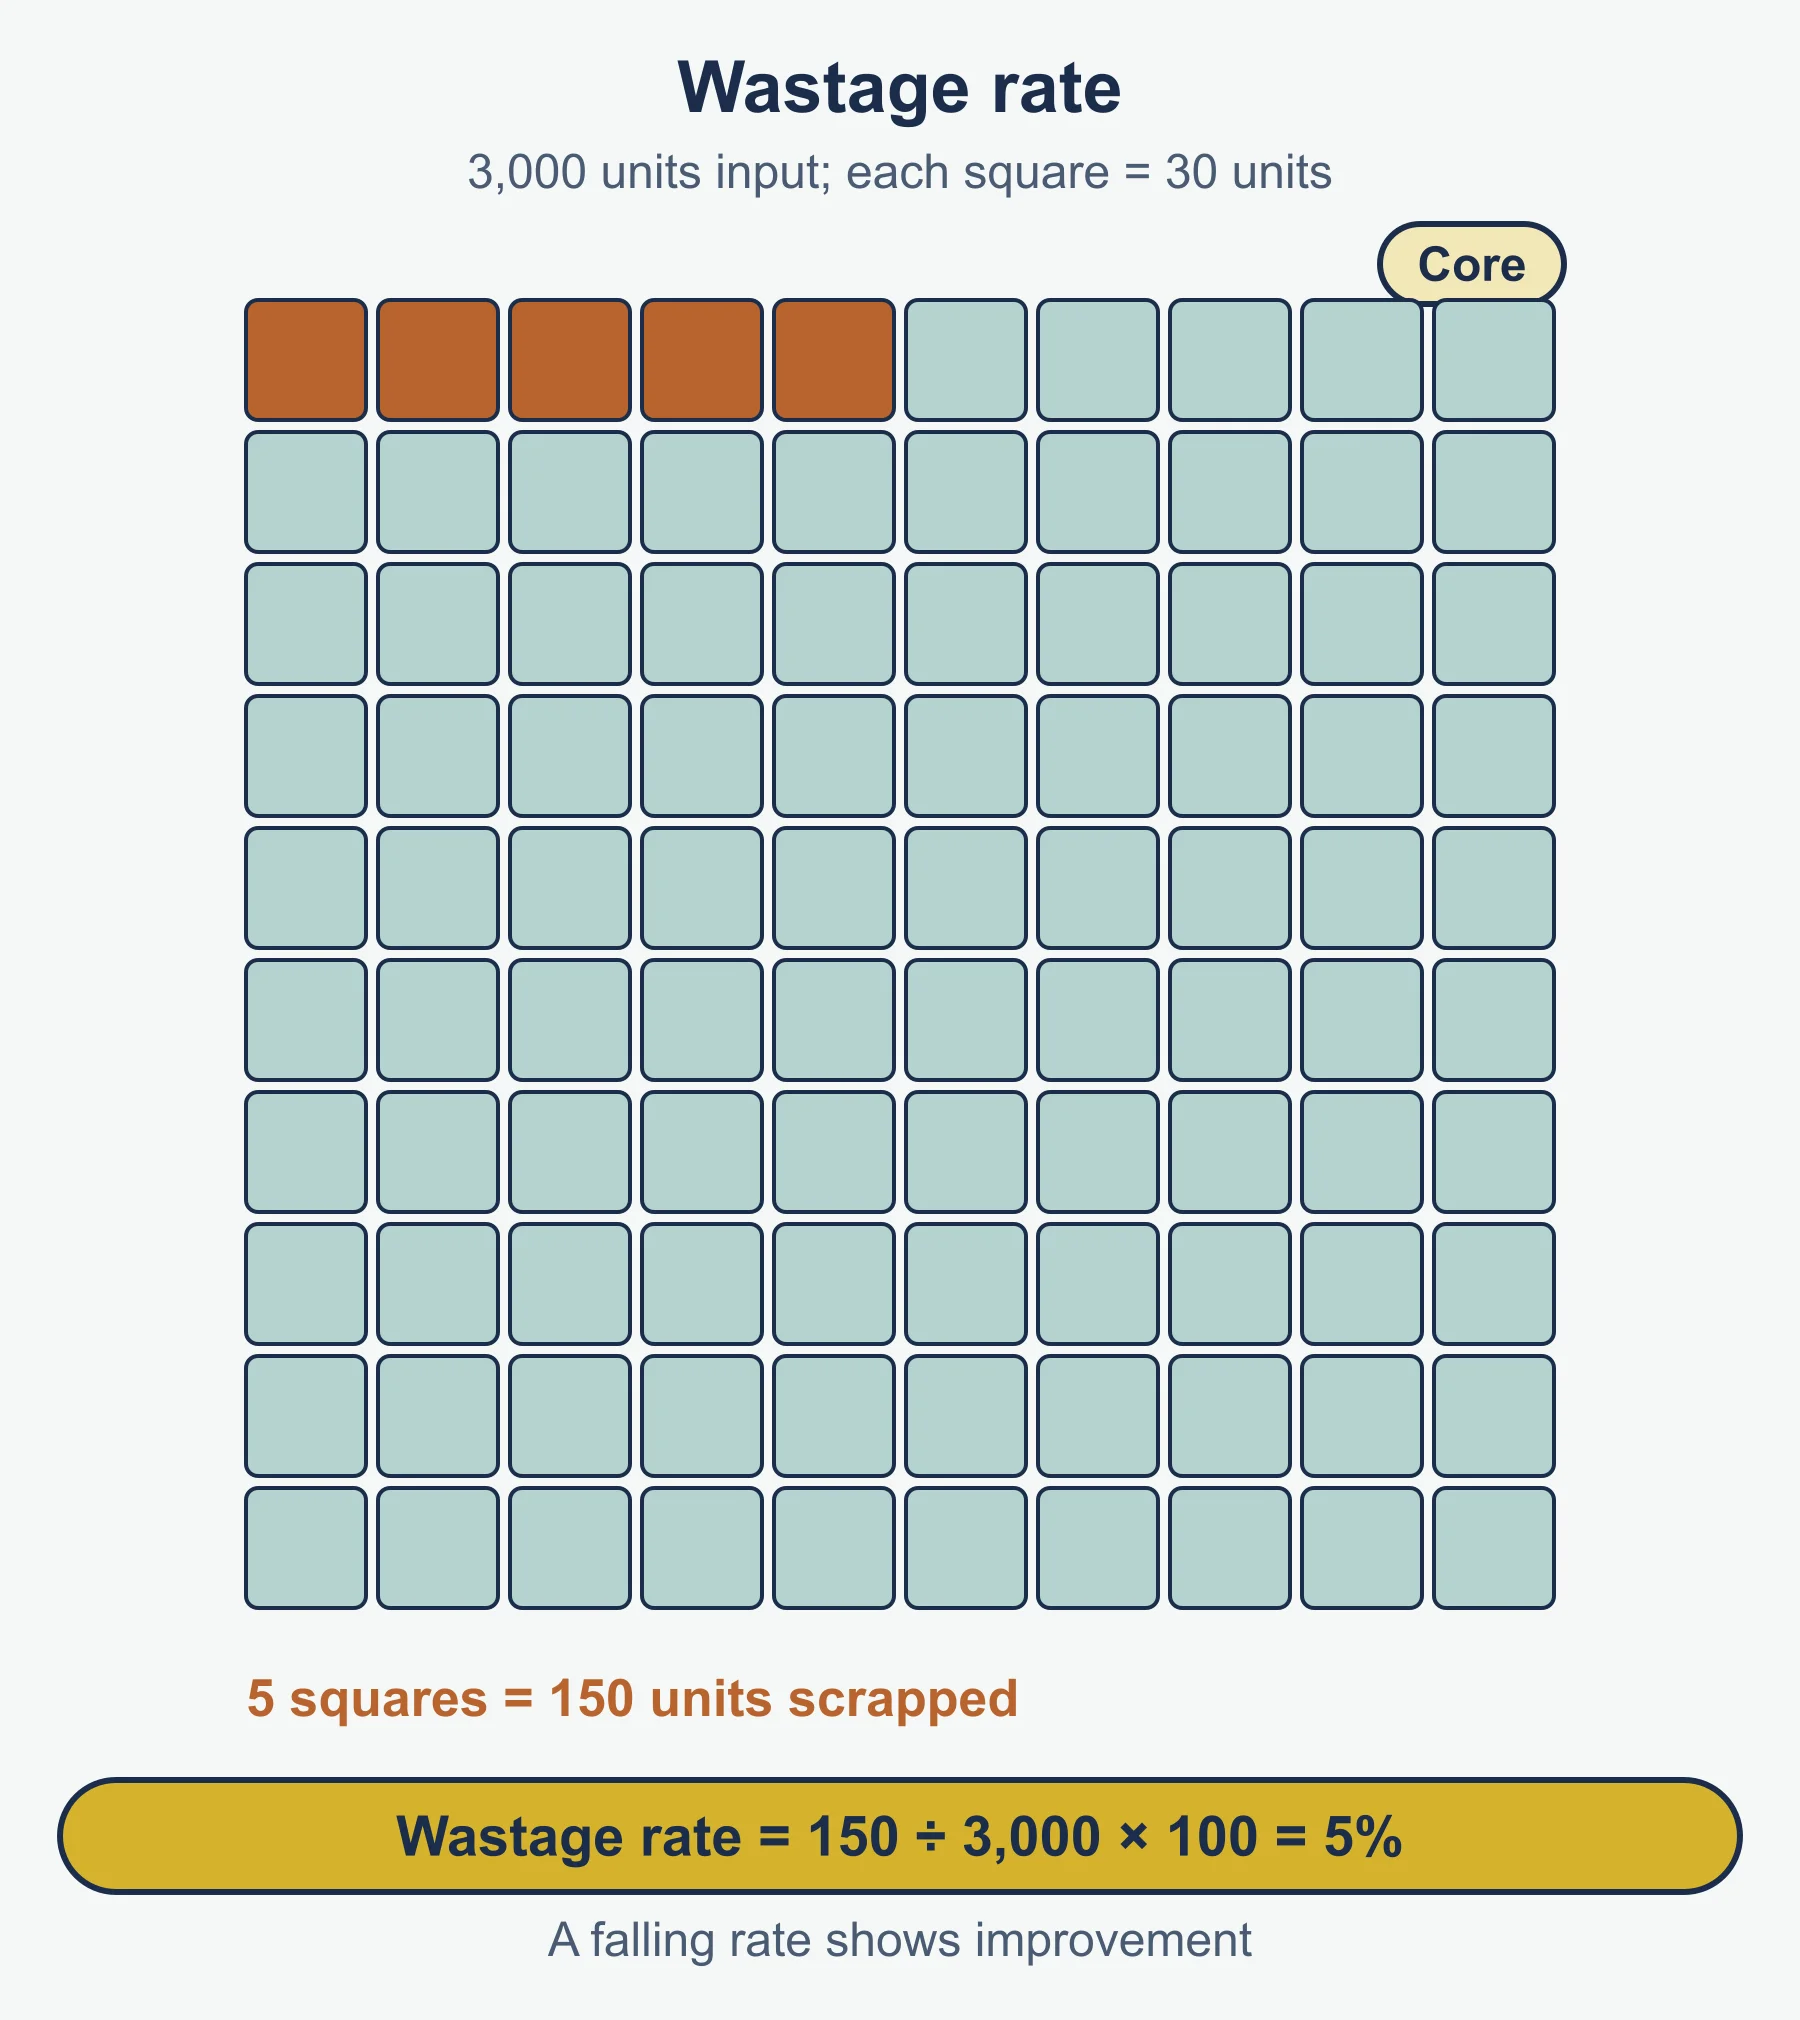
Wastage rate (standard form) = units wasted / units input x 100. 150 of 3,000 scrapped = 5%. A falling rate shows improvement.
Total quality management (TQM) makes quality every employee’s responsibility, with training, teamwork and continuous improvement. It cuts waste and rework but needs management commitment. Training improves quality because skilled staff make fewer errors, at the cost of working time.
External quality standards: British Standards (BS), European Standards (EN) and International Standards (ISO); specific standards are not required. They build customer trust and market access, but certification costs money. Benchmarking compares performance against the best in the industry and adopts their practice; it shows gaps, but data may be hard to get.
Services and quality of service
Services provide most UK employment and output and a large share of exports. Quality can be monitored through surveys, mystery shoppers, complaint numbers, repeat custom, waiting times and reviews. Poor service loses customers, damages reputation and lowers staff morale. Improve it with training, better systems, empowering staff and acting on feedback. It matters most where rivals offer similar products.
Location and logistics
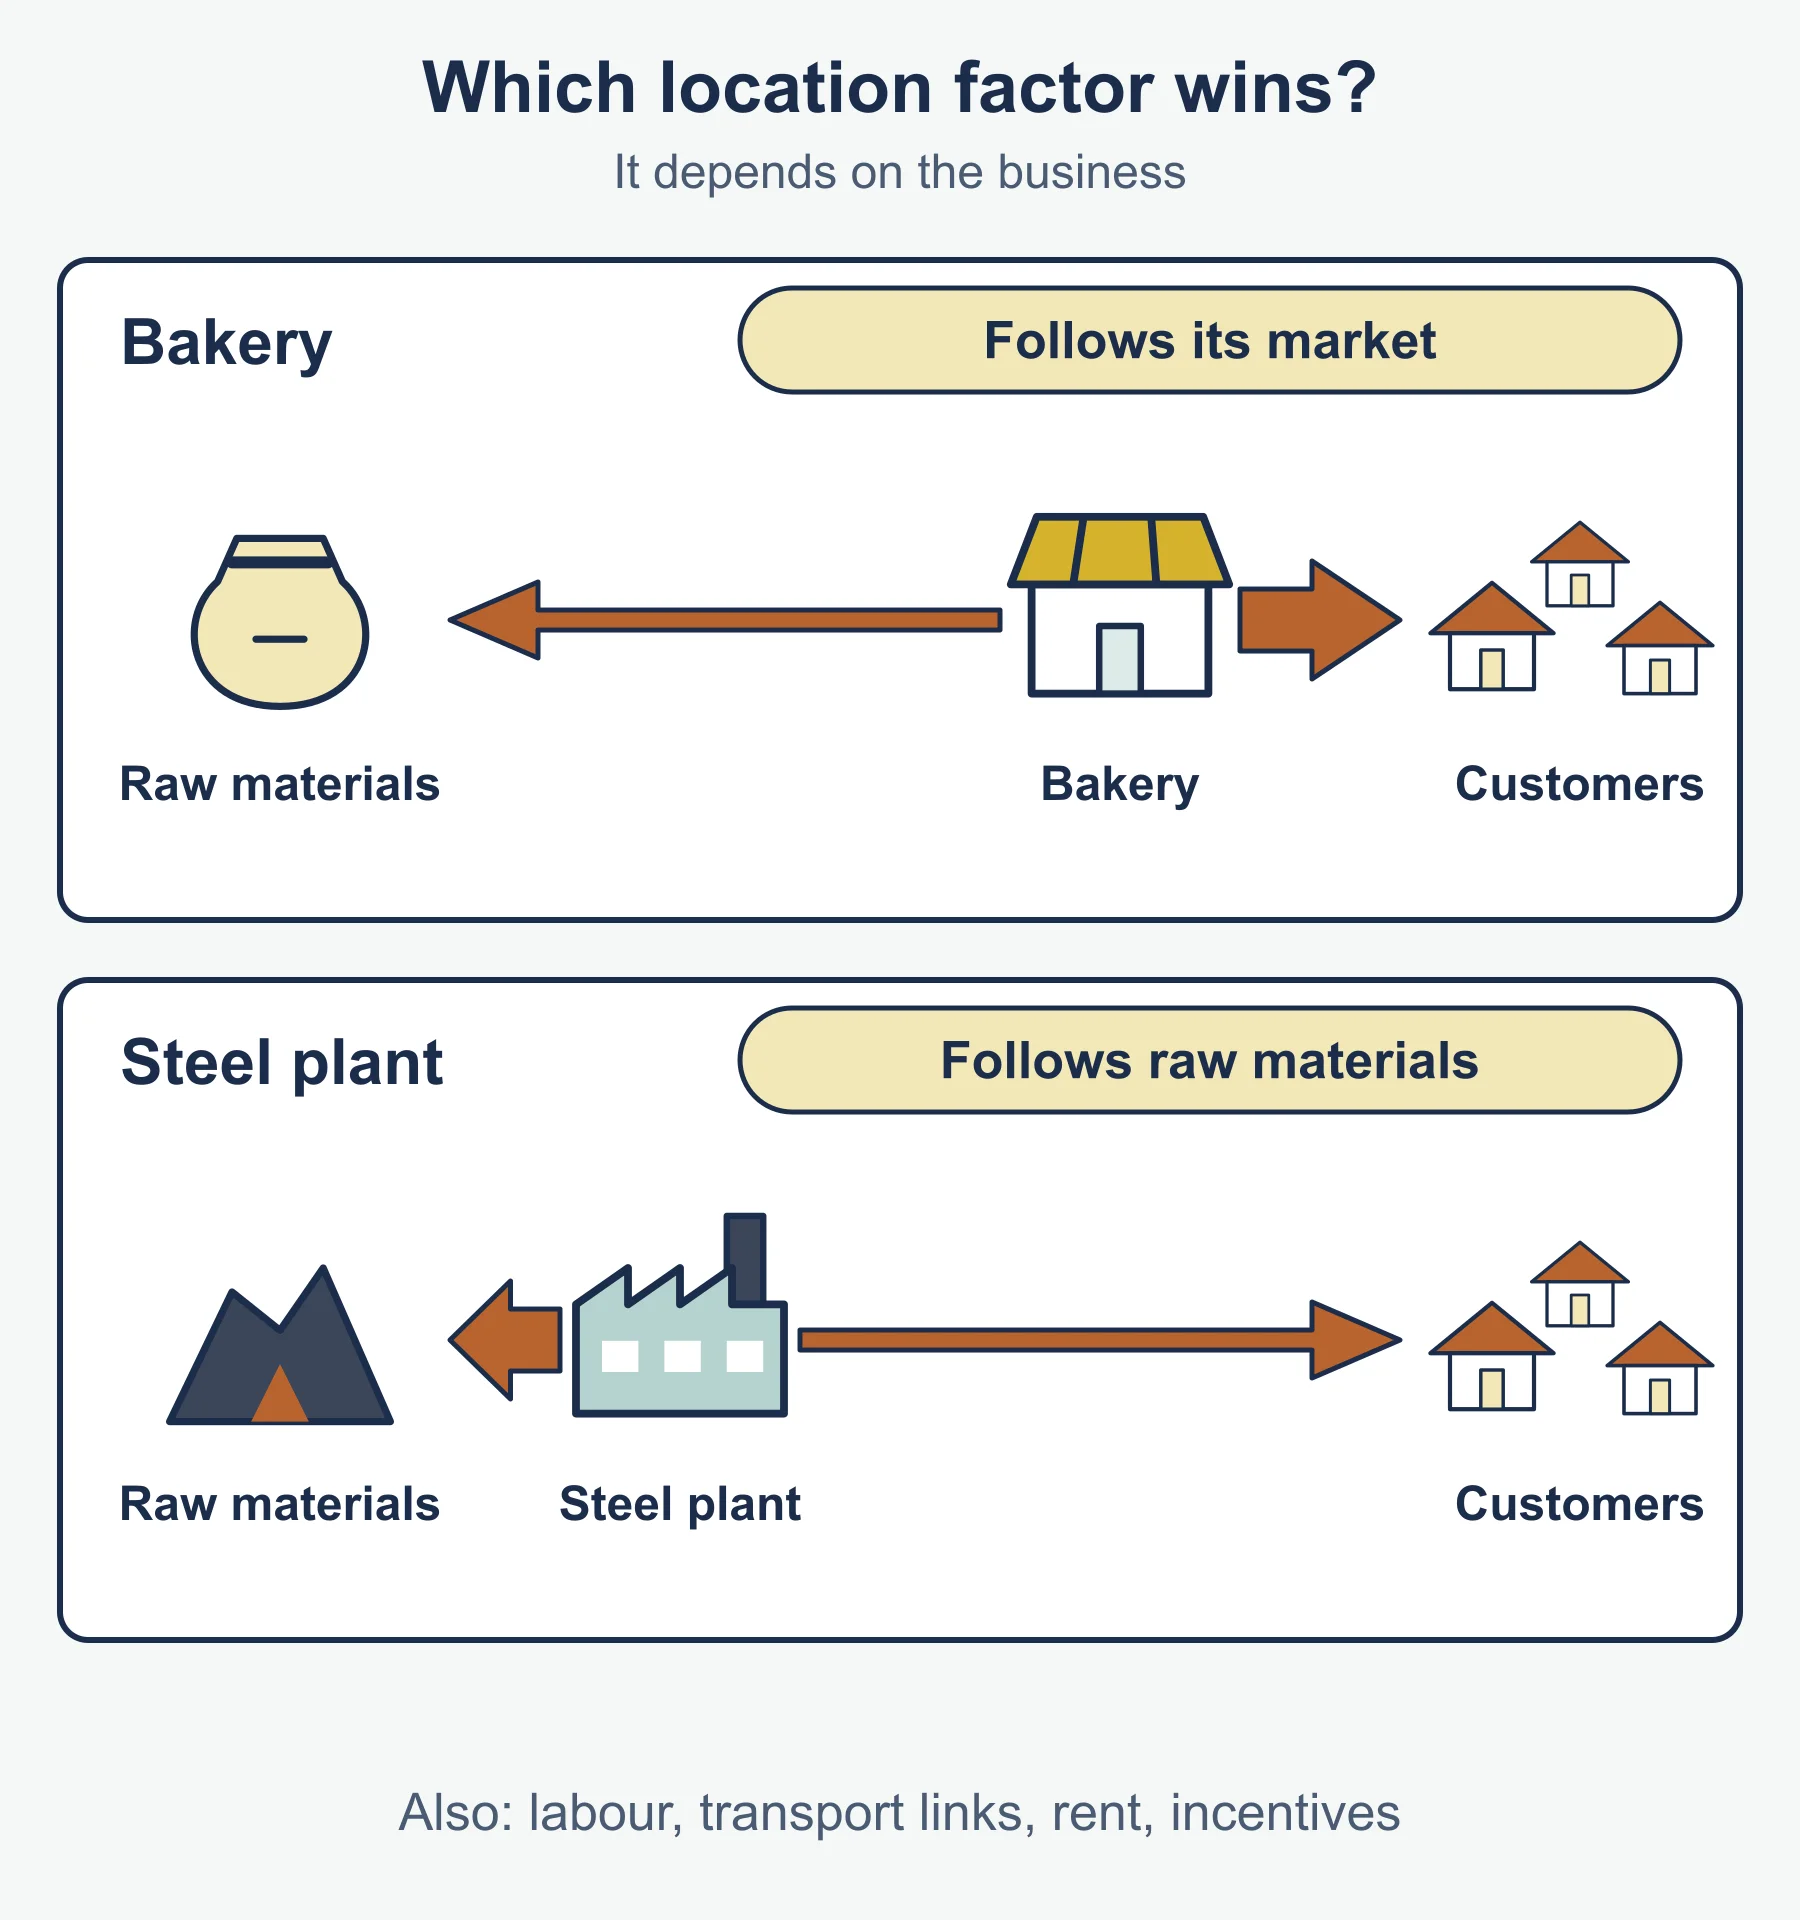
Location factors: closeness to customers, suppliers and labour, transport, land cost, grants, competitors, room to expand and digital infrastructure. A city centre gives footfall but high rent; an out-of-town site gives space but needs transport. Recommend using the case.
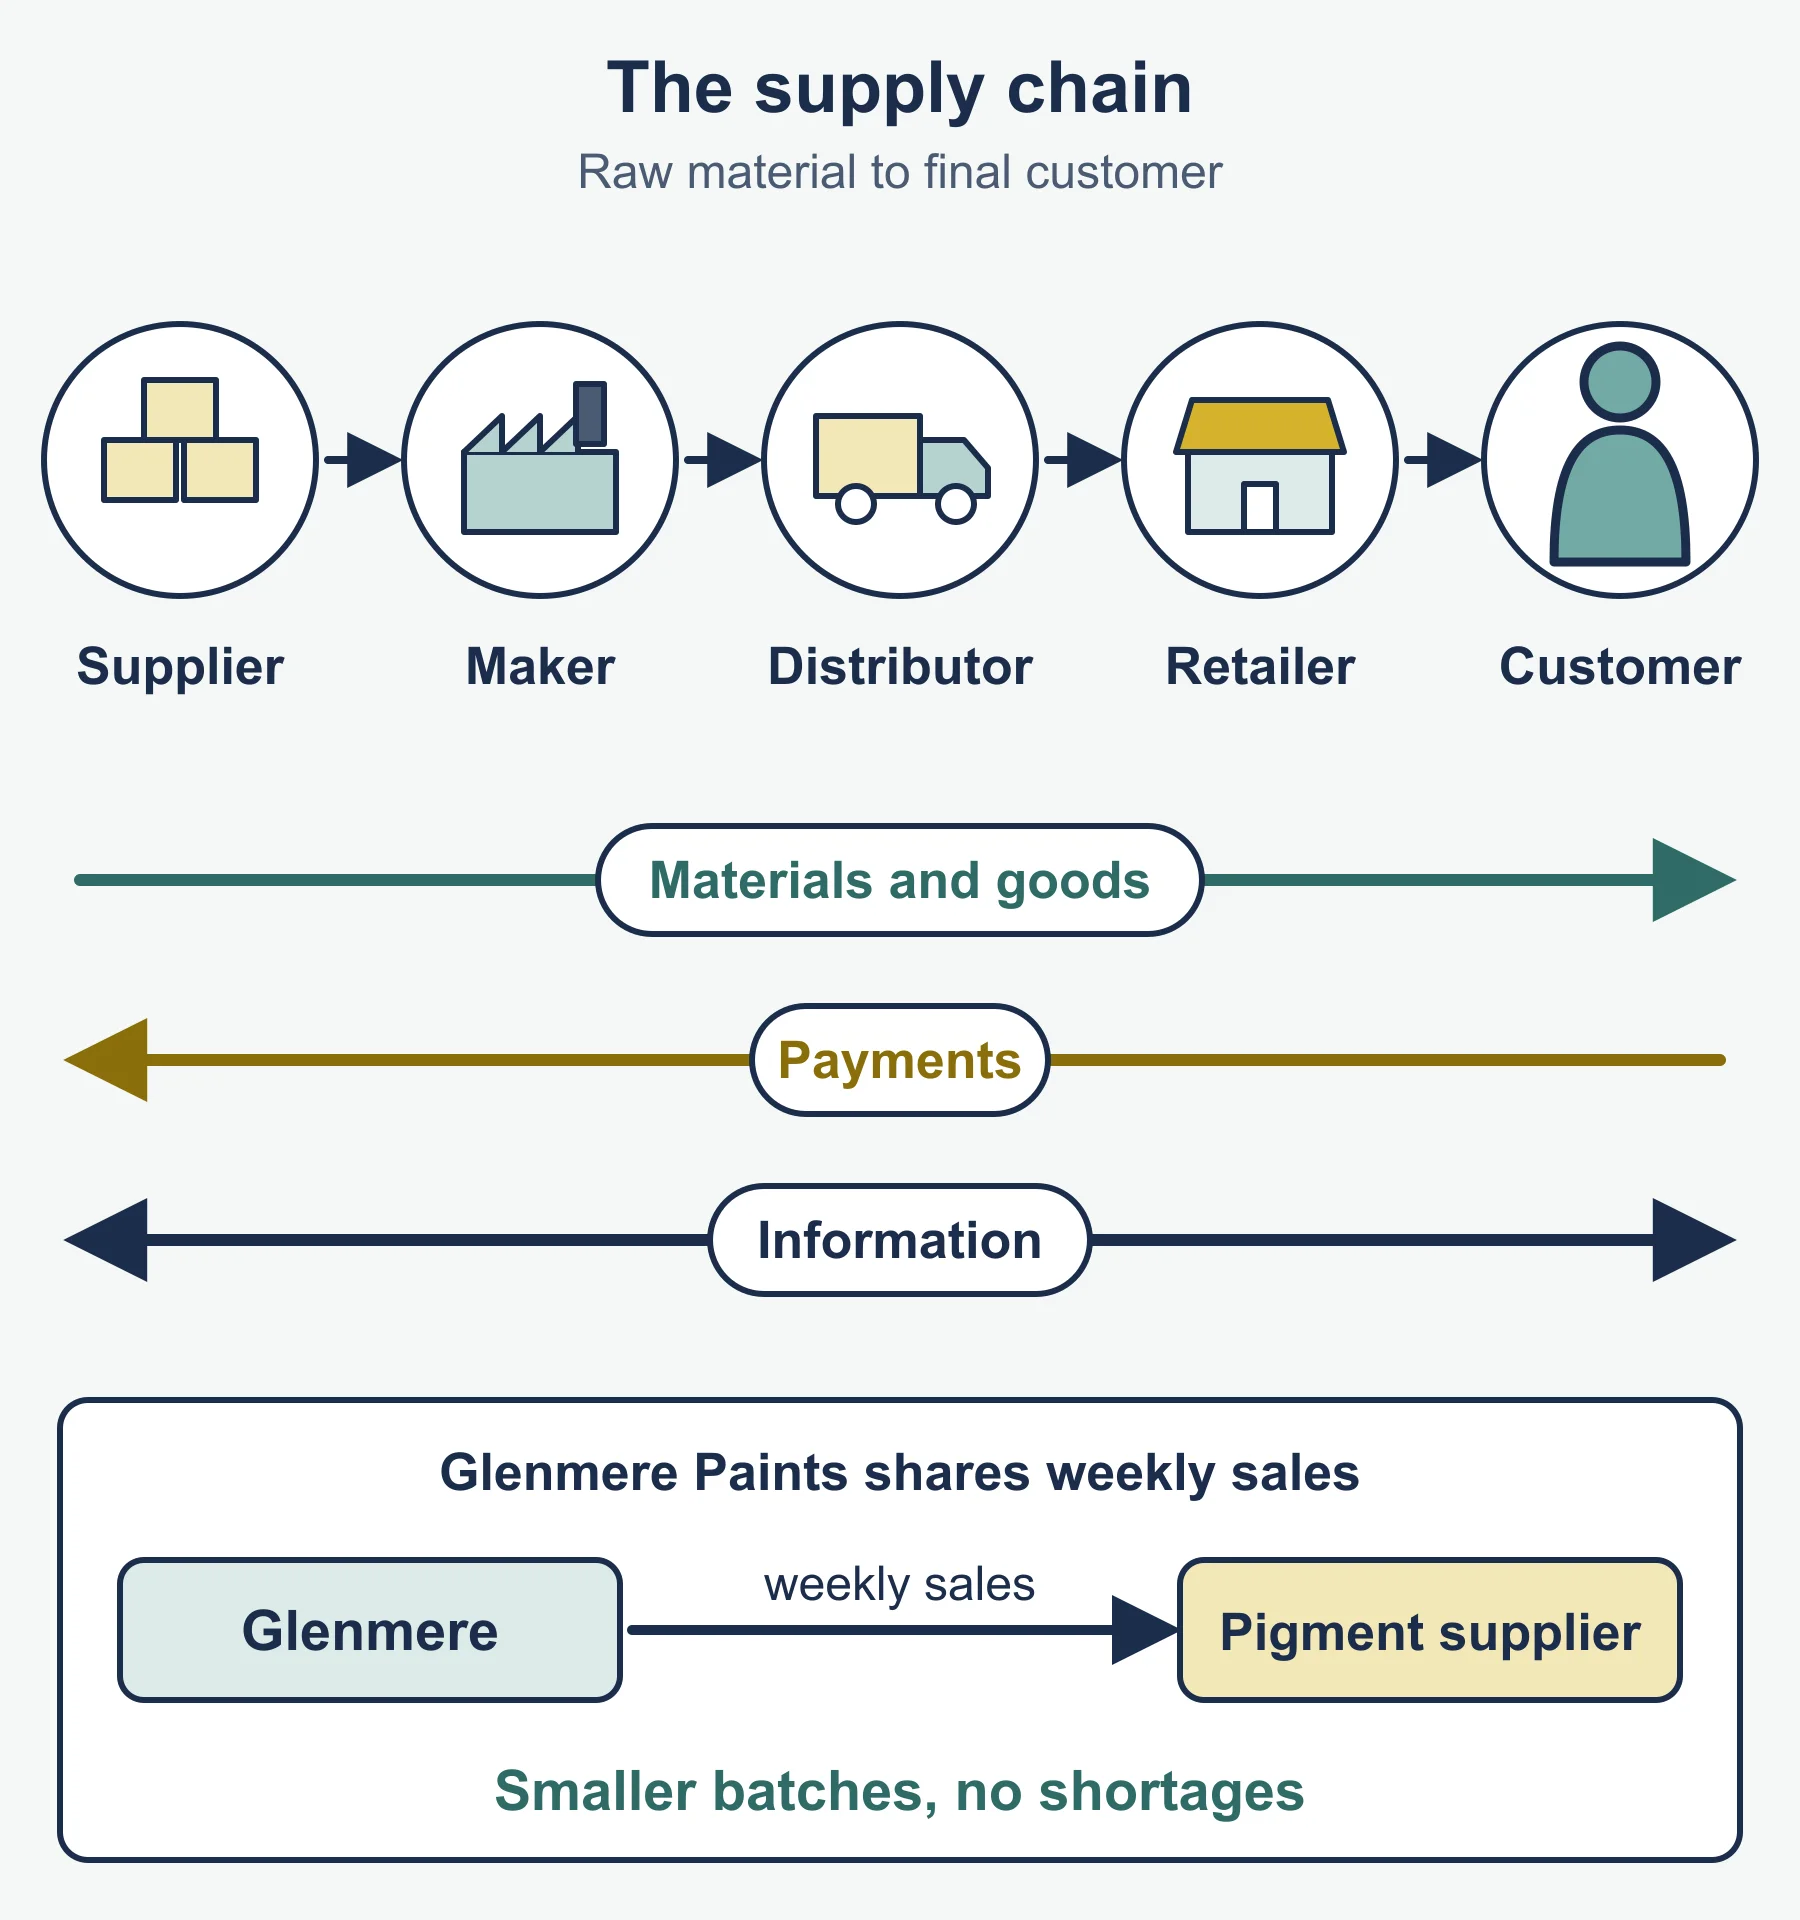
Logistics is moving materials and products to the right place at the right time: supply chain management (coordinating raw material to customer), distribution management, warehousing (storing stock), distribution centres (sorting and dispatching to outlets) and digital tracking and ordering. Factors: cost, speed, reliability, product type and environment. Internal provision gives control; external gives expertise and flexibility.
| Term | Meaning |
|---|---|
| Outsourcing | Paying another business to do an activity |
| Subcontracting | Hiring another firm for part of a specific job |
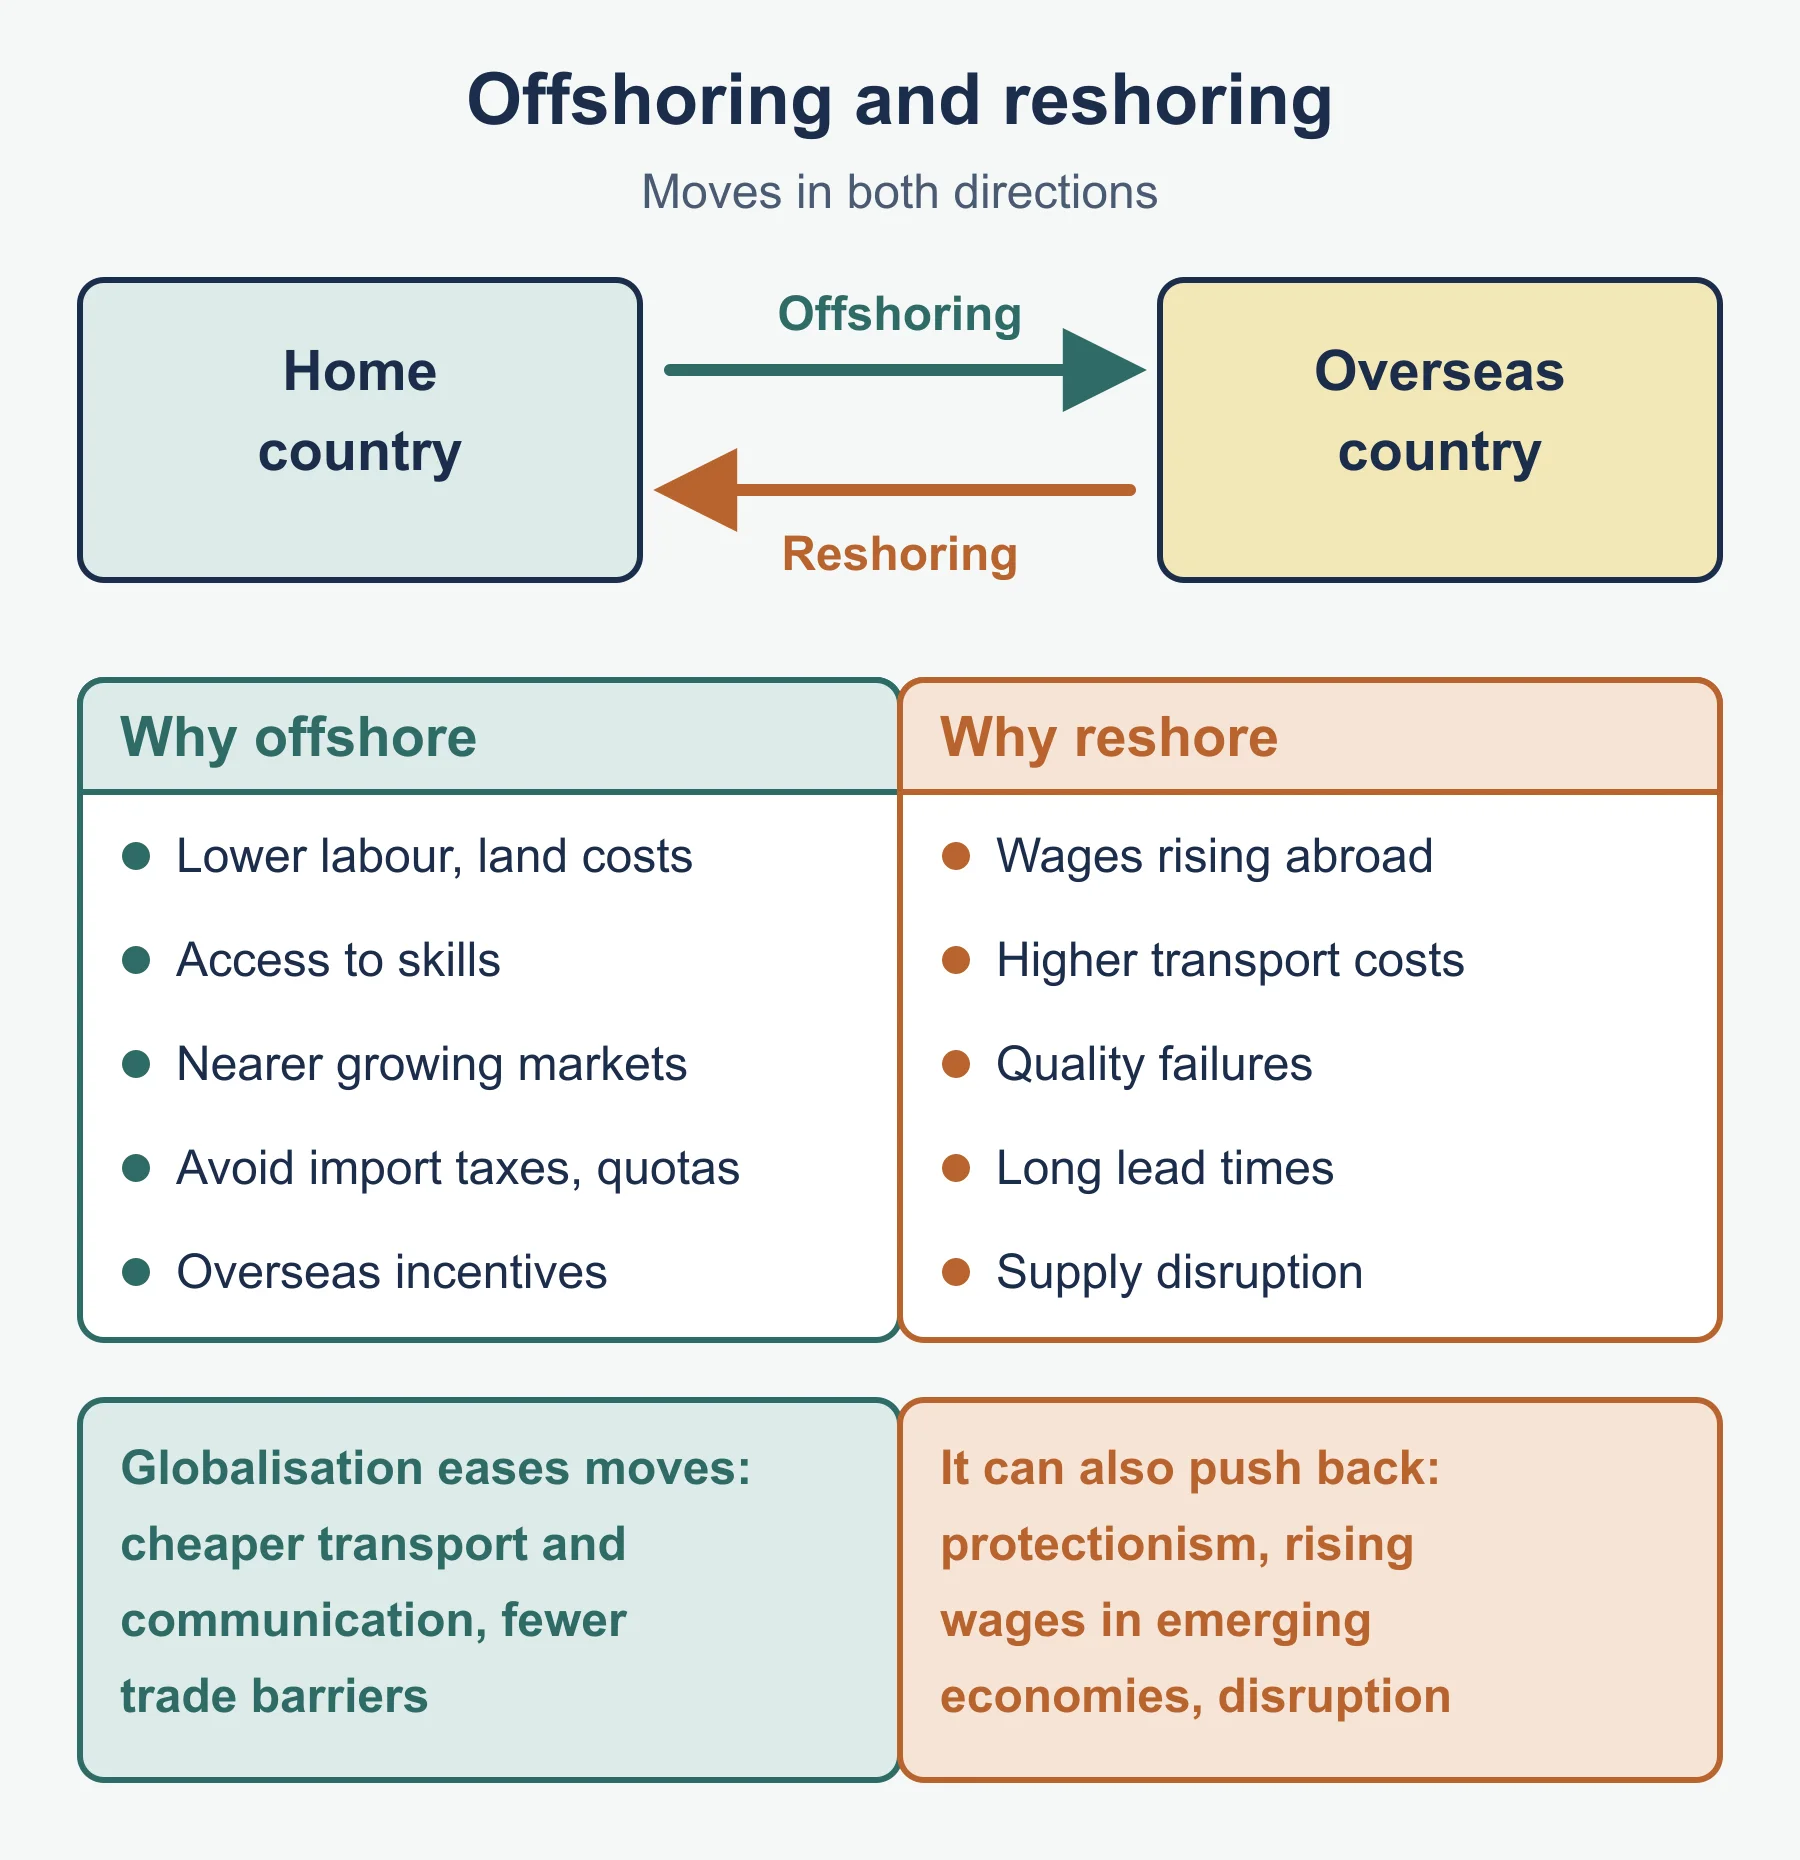
| Offshoring | Moving activities to another country |
| Re-shoring | Bringing activities back home |
Offshoring may cut labour cost but raises communication, quality and transport risk; re-shoring improves control but costs more.
External influences on operations management
Evaluate each in context: social (tastes, working patterns), legal (health and safety, employment), ethical (treatment of suppliers and workers), environmental (waste, energy), economic (exchange rates, demand), political (policy, trade rules), technological and international (global supply chains). Judge which matters most and how far the firm controls it.
The operations strategy
An operations strategy is the long-term plan combining operations decisions to meet objectives. Evaluate whether its elements (production method, capacity, stock, quality, location, logistics, technology) fit each other and the marketing strategy, and what they mean for stakeholders. To recommend and justify, state a choice, give reasons from the case data, note a cost or risk and reach a judgement.
Common errors
- Giving added value as profit.
- Forgetting x 100 in capacity utilisation.
- Calculating float without subtracting duration.
- Saying JIT is always best without discussing supplier reliability.
Frequently asked questions
What is added value in OCR A Level Business? Added value is the selling price minus the cost of bought-in materials and services. In OCR A Level Business (H431) it is not the same as profit, because overheads such as wages and rent have not yet been deducted.
How is PERT different from critical path analysis? PERT allows for uncertainty by using an optimistic, a most likely and a pessimistic time for each activity to give an expected time, rather than a single fixed duration. Like critical path analysis, it depends on the accuracy of the estimates.
What is the difference between offshoring and re-shoring? Offshoring moves business activities to another country, often to cut labour costs, while re-shoring brings them back to the home country. Offshoring raises communication, quality and transport risks, whereas re-shoring improves control but usually costs more.
Official syllabus
OCR Level 3 Advanced GCE in Business (H431), Version 2.1 (January 2026), topic 4 Operational strategy, published by OCR.
Get free revision emails (optional)
Occasional emails with practice questions, worked explanations and links to free resources for the qualification and subjects you choose. No spam, and you can unsubscribe from any email. The free tools on this site never need an email.
Related resources
-
Practice questions
OCR A Level Business: Operational strategy (H431) – Practice Questions
Original OCR A Level Business (H431) operational strategy practice questions with worked answers on calculations, project management and evaluation.
Business · OCR · A Level
Try questions -
Revision notes
OCR A Level Business: Operational strategy (H431) – Revision Notes
Condensed OCR A Level Business (H431) revision notes on operational strategy: definitions, formulas, method steps, self-test and common errors.
Business · OCR · A Level
Revise topic -
Study guides
OCR A Level Business: Political, economic, social and technological factors and related topics (H431)
Study guide to political, economic, social, technological, digital, ethical, legal and environmental factors for OCR A Level Business H431.
Business · OCR · A Level
Read guide
Related articles
-
teaching
A Level tuition in Dubai: Cambridge or Pearson Edexcel International A Level?
Schools in Dubai and Abu Dhabi teach either Cambridge International AS & A Level or Pearson Edexcel International A Level. How the two are structured, why it matters for tuition, and how online classes from Lahore work.
9 October 2026
-
curriculum guides
Choosing subjects at IGCSE and A Level
How subject choices at 14 and 16 affect university options later, and how to keep pathways open without overloading a timetable.
28 July 2026
Studying this with a teacher
Working through Business A LEVELS?
This page is free and stays free. If you would rather be taught it, Marlbridge runs Business classes one-to-one, online in your own time zone. One-to-one only for this course: Rs 6,000 per class in Pakistan, with other currencies on the fees page. The first trial class is free. WhatsApp replies within an hour (8am–11pm Pakistan time, every day); email the same day.
OCR Business teachers at Marlbridge
