
Revision Notes
OxfordAQA A-Level Business: The marketing mix (9625/9725) – Revision Notes
Condensed revision notes for section 3.1.2.4, the marketing mix, in OxfordAQA International AS and A-level Business, with formulas, tables and a self-test.
- Subject
- Business
- Level
- AS LEVEL
- Topic
- Marketing
- Author
- Marlbridge Academic Team
- Updated
- Reviewed by
- Salman Ahmad (what this means)
Aligned to OxfordAQA A Level Business (9625, 9725), 9625: first teaching September 2018 (current cohorts). 9725: first teaching September 2026 (AS) / September 2027 (A2), the successor specification.. Official specification .
Syllabus page (what it covers and how it is assessed): OxfordAQA A Level Business.
Found an error? Report a correction.
Need help with this topic? Request a free trial class for A Level Business (9625 / 9725).
These notes condense section 3.1.2.4, The marketing mix, from the OxfordAQA International AS and A-level Business specification (main text: 9725 Version 1.1, four elements: product, pricing, promotional mix and distribution). 9625 (Version 3.1) differs and uses seven Ps; see the 9625 box below. Full explanations and worked examples are in the study guide. Test yourself with the practice questions, use the course page and checklist, and try the free diagnostics to find gaps. Topic overview: Marketing revision notes. All businesses named are invented.
The mix in context
| Context | What changes |
|---|---|
| Goods | Tangible; packaging, quality, stock and physical distribution |
| Services | Intangible, produced as consumed; the experience, location or booking channel is the product |
| B2B | Few buyers, large orders; sales force, contracts, negotiated price, reliability |
| B2C | Many buyers; brand, convenience, mass media, public prices |
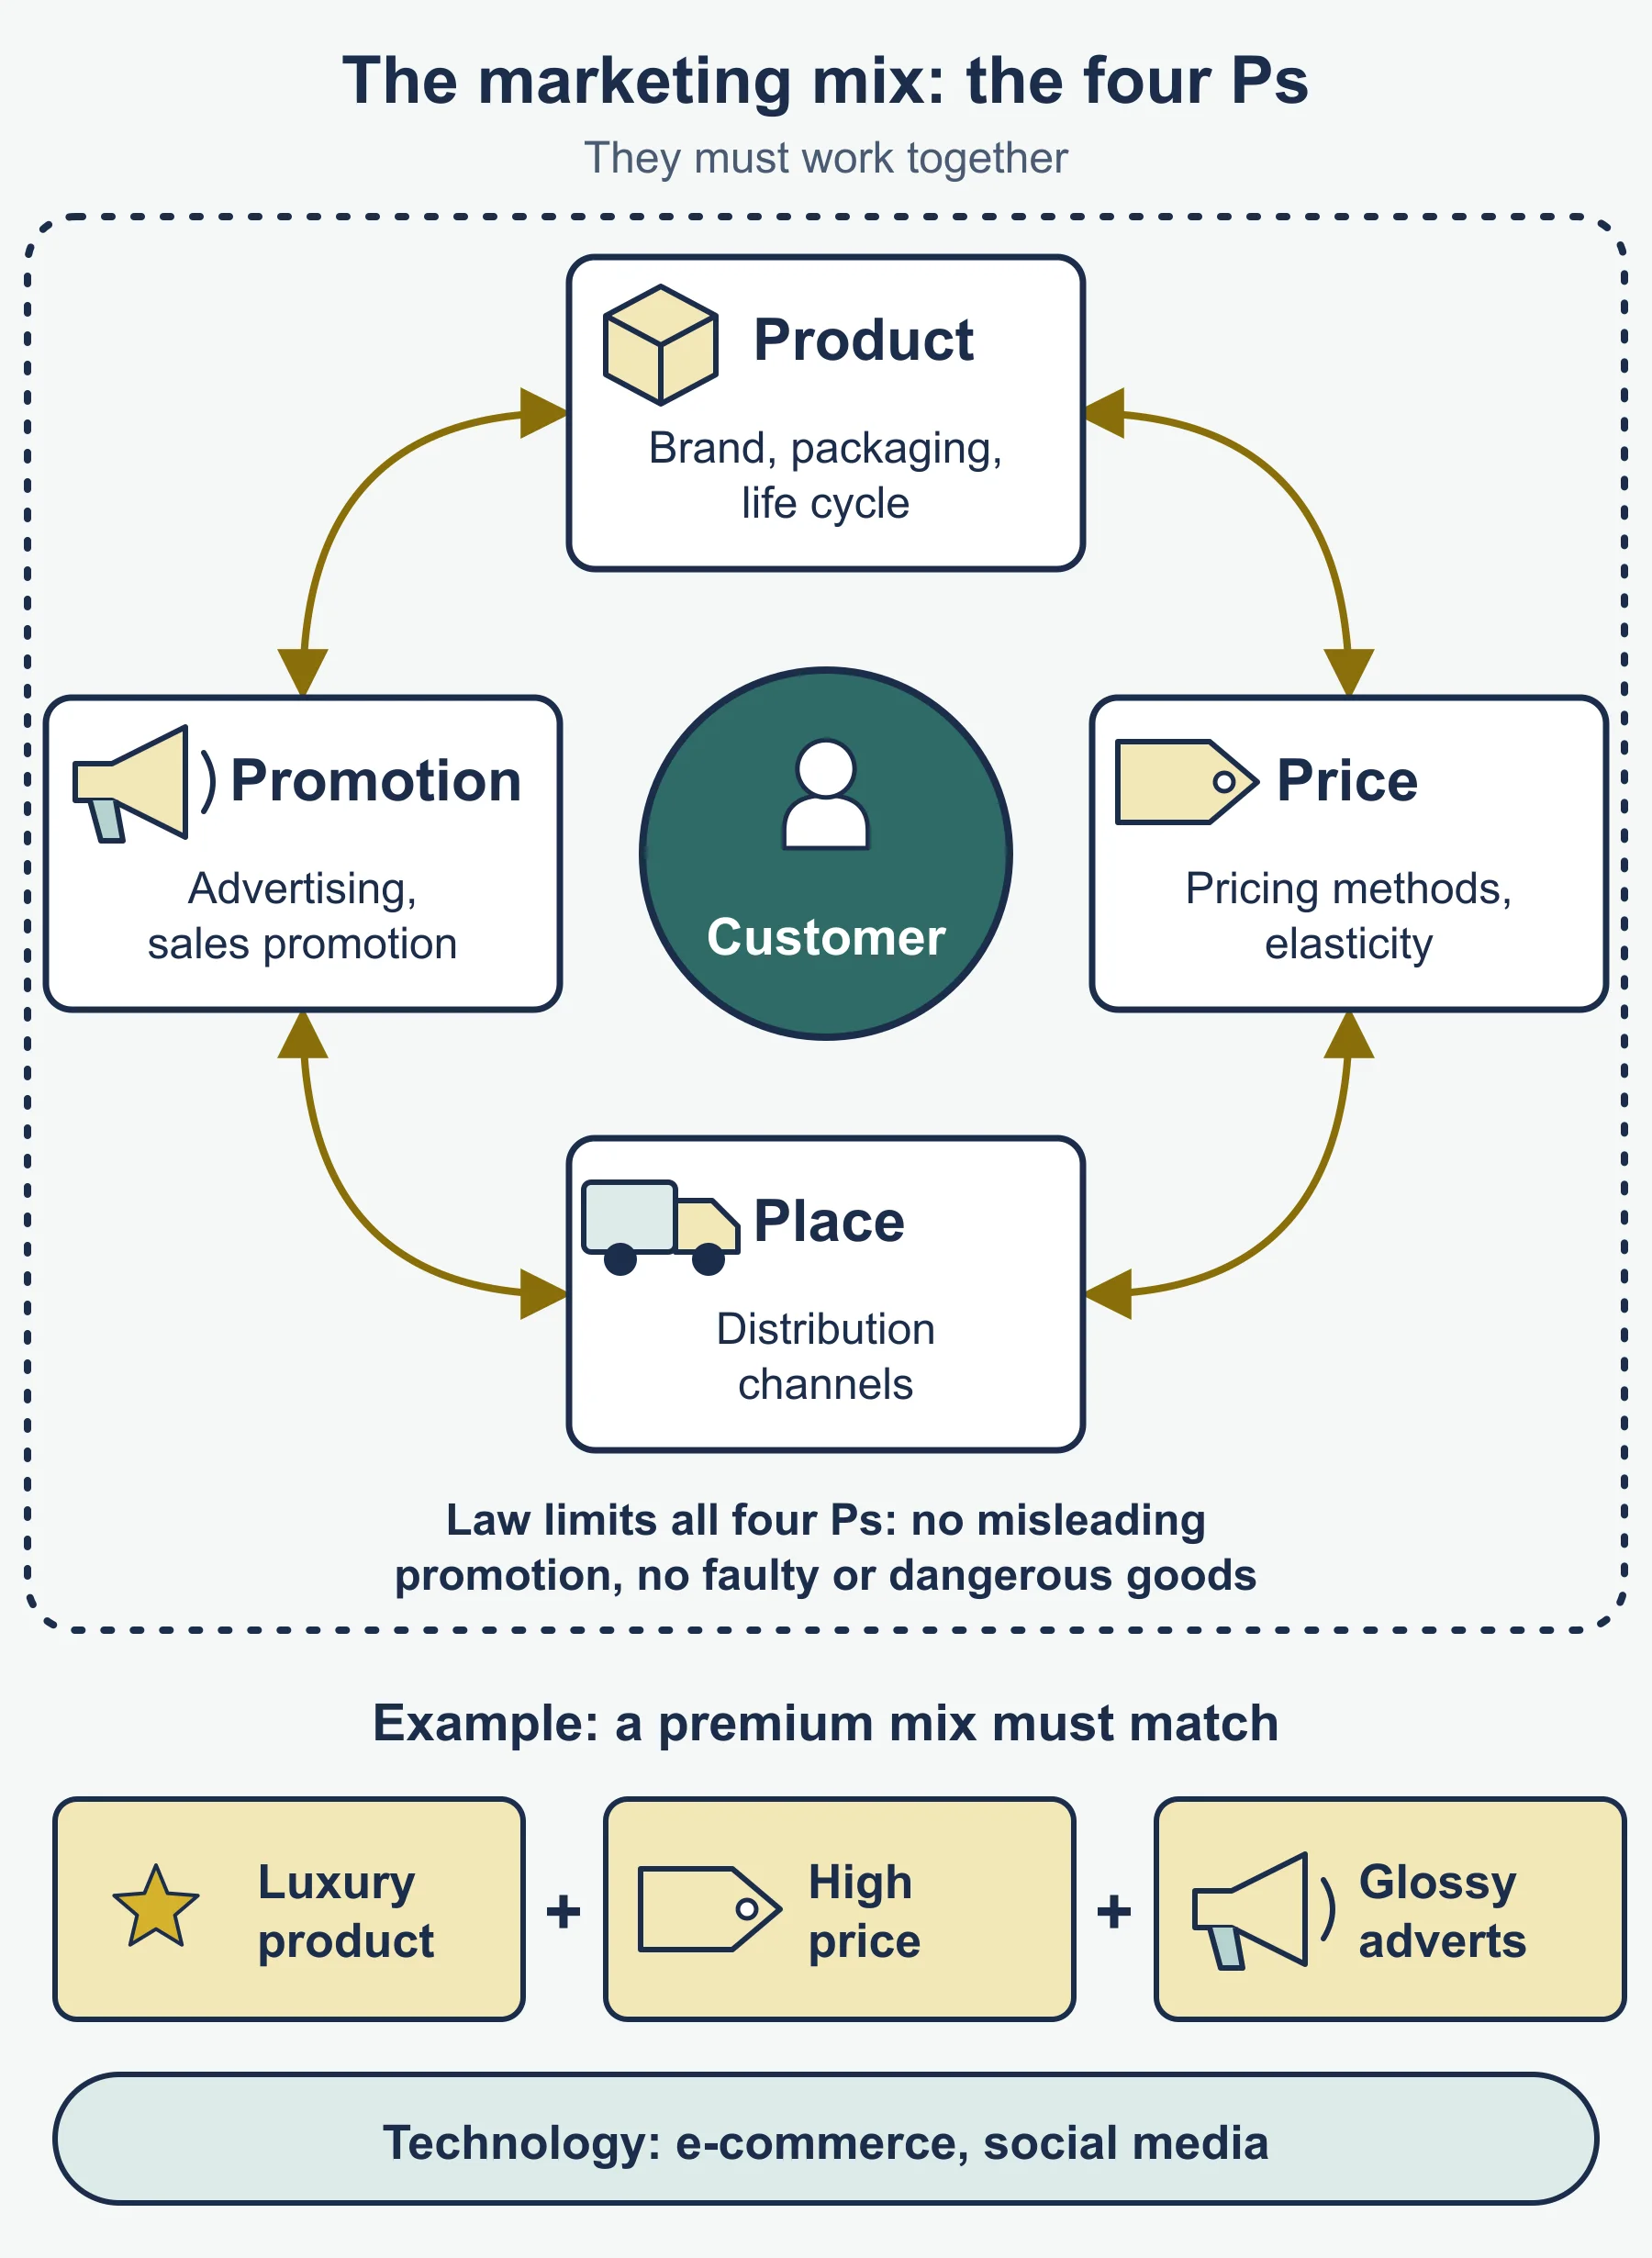
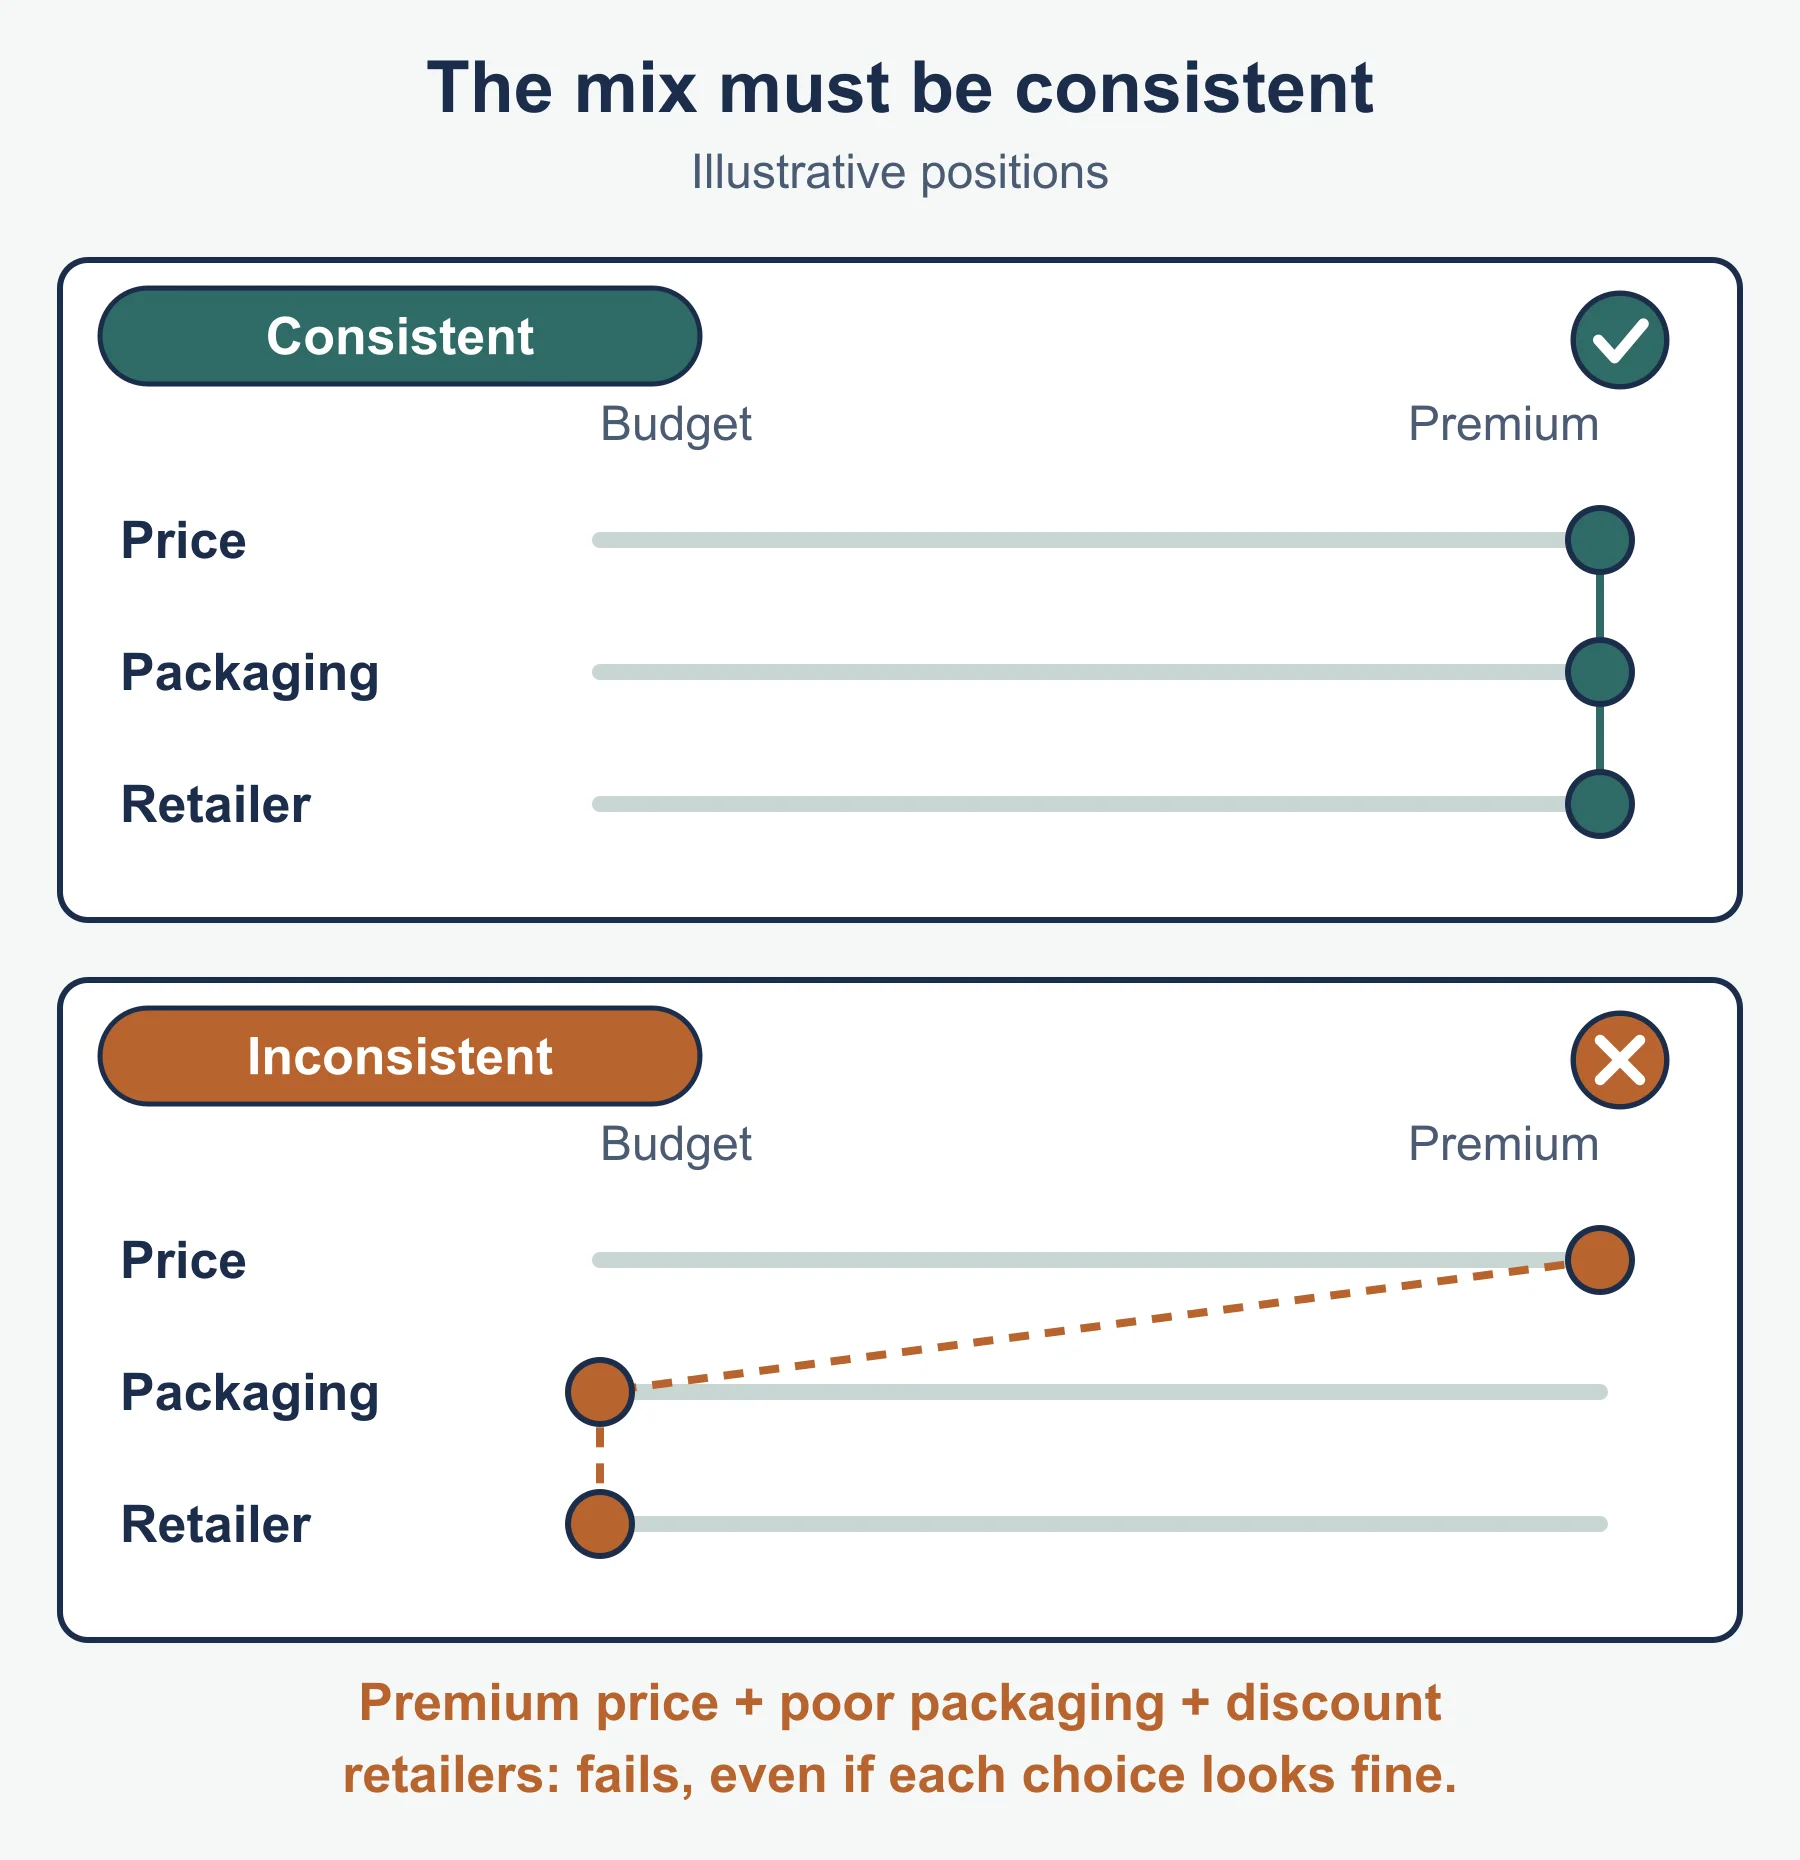
Integrated mix: the four elements support one positioning and one target market. Benefits: consistent message, less wasted spend, harder for rivals to copy. Influences: target market, budget, life cycle stage, competitors, costs, technology, objectives.
Product
NPD value: competitive advantage, spreads risk, new segments, replaces declining products. Risk: costly and may fail. Influences: tastes, competitors, technology, budget, skills.
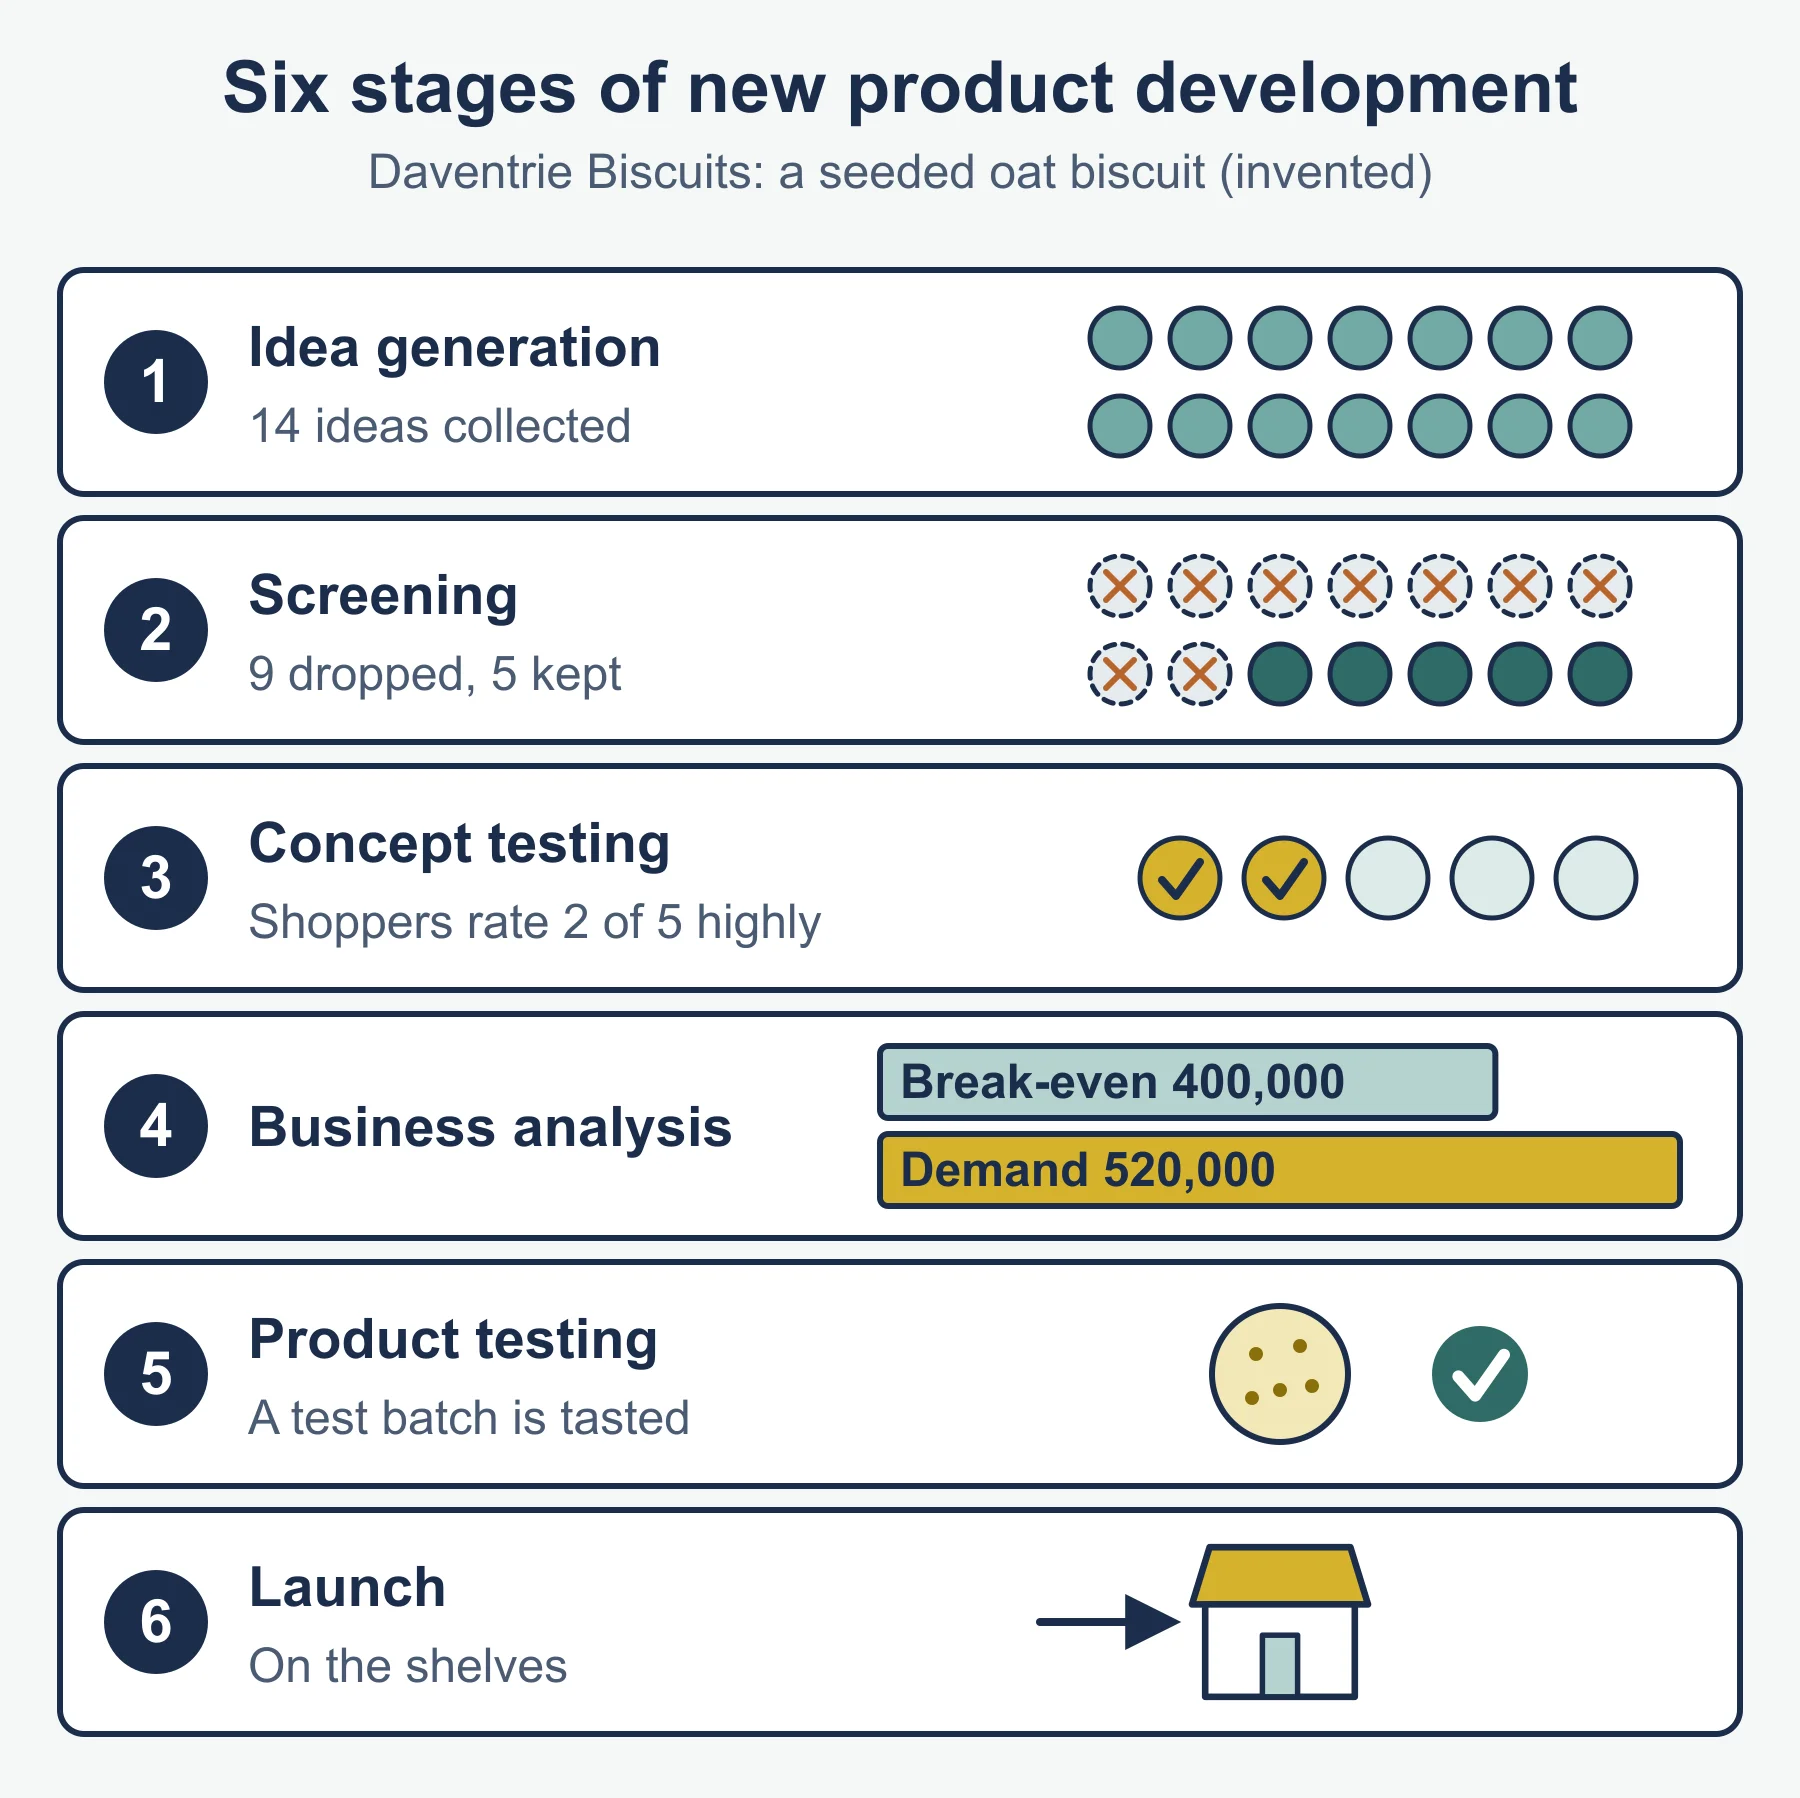
Six stages (in order): idea generation, screening, concept testing, business analysis, product testing, launch.
Memory hook: “I Should Choose Better Products Locally.”
| Stage | What happens |
|---|---|
| Idea generation | Gather ideas |
| Screening | Drop unsuitable ideas |
| Concept testing | Customers react to the idea |
| Business analysis | Demand, cost and profit estimated |
| Product testing | Prototype tested |
| Launch | Goes on sale |
Success or failure factors: real need found, quality, price against value, promotion and distribution ready, timing, rivals’ reaction, forecast accuracy, capacity.
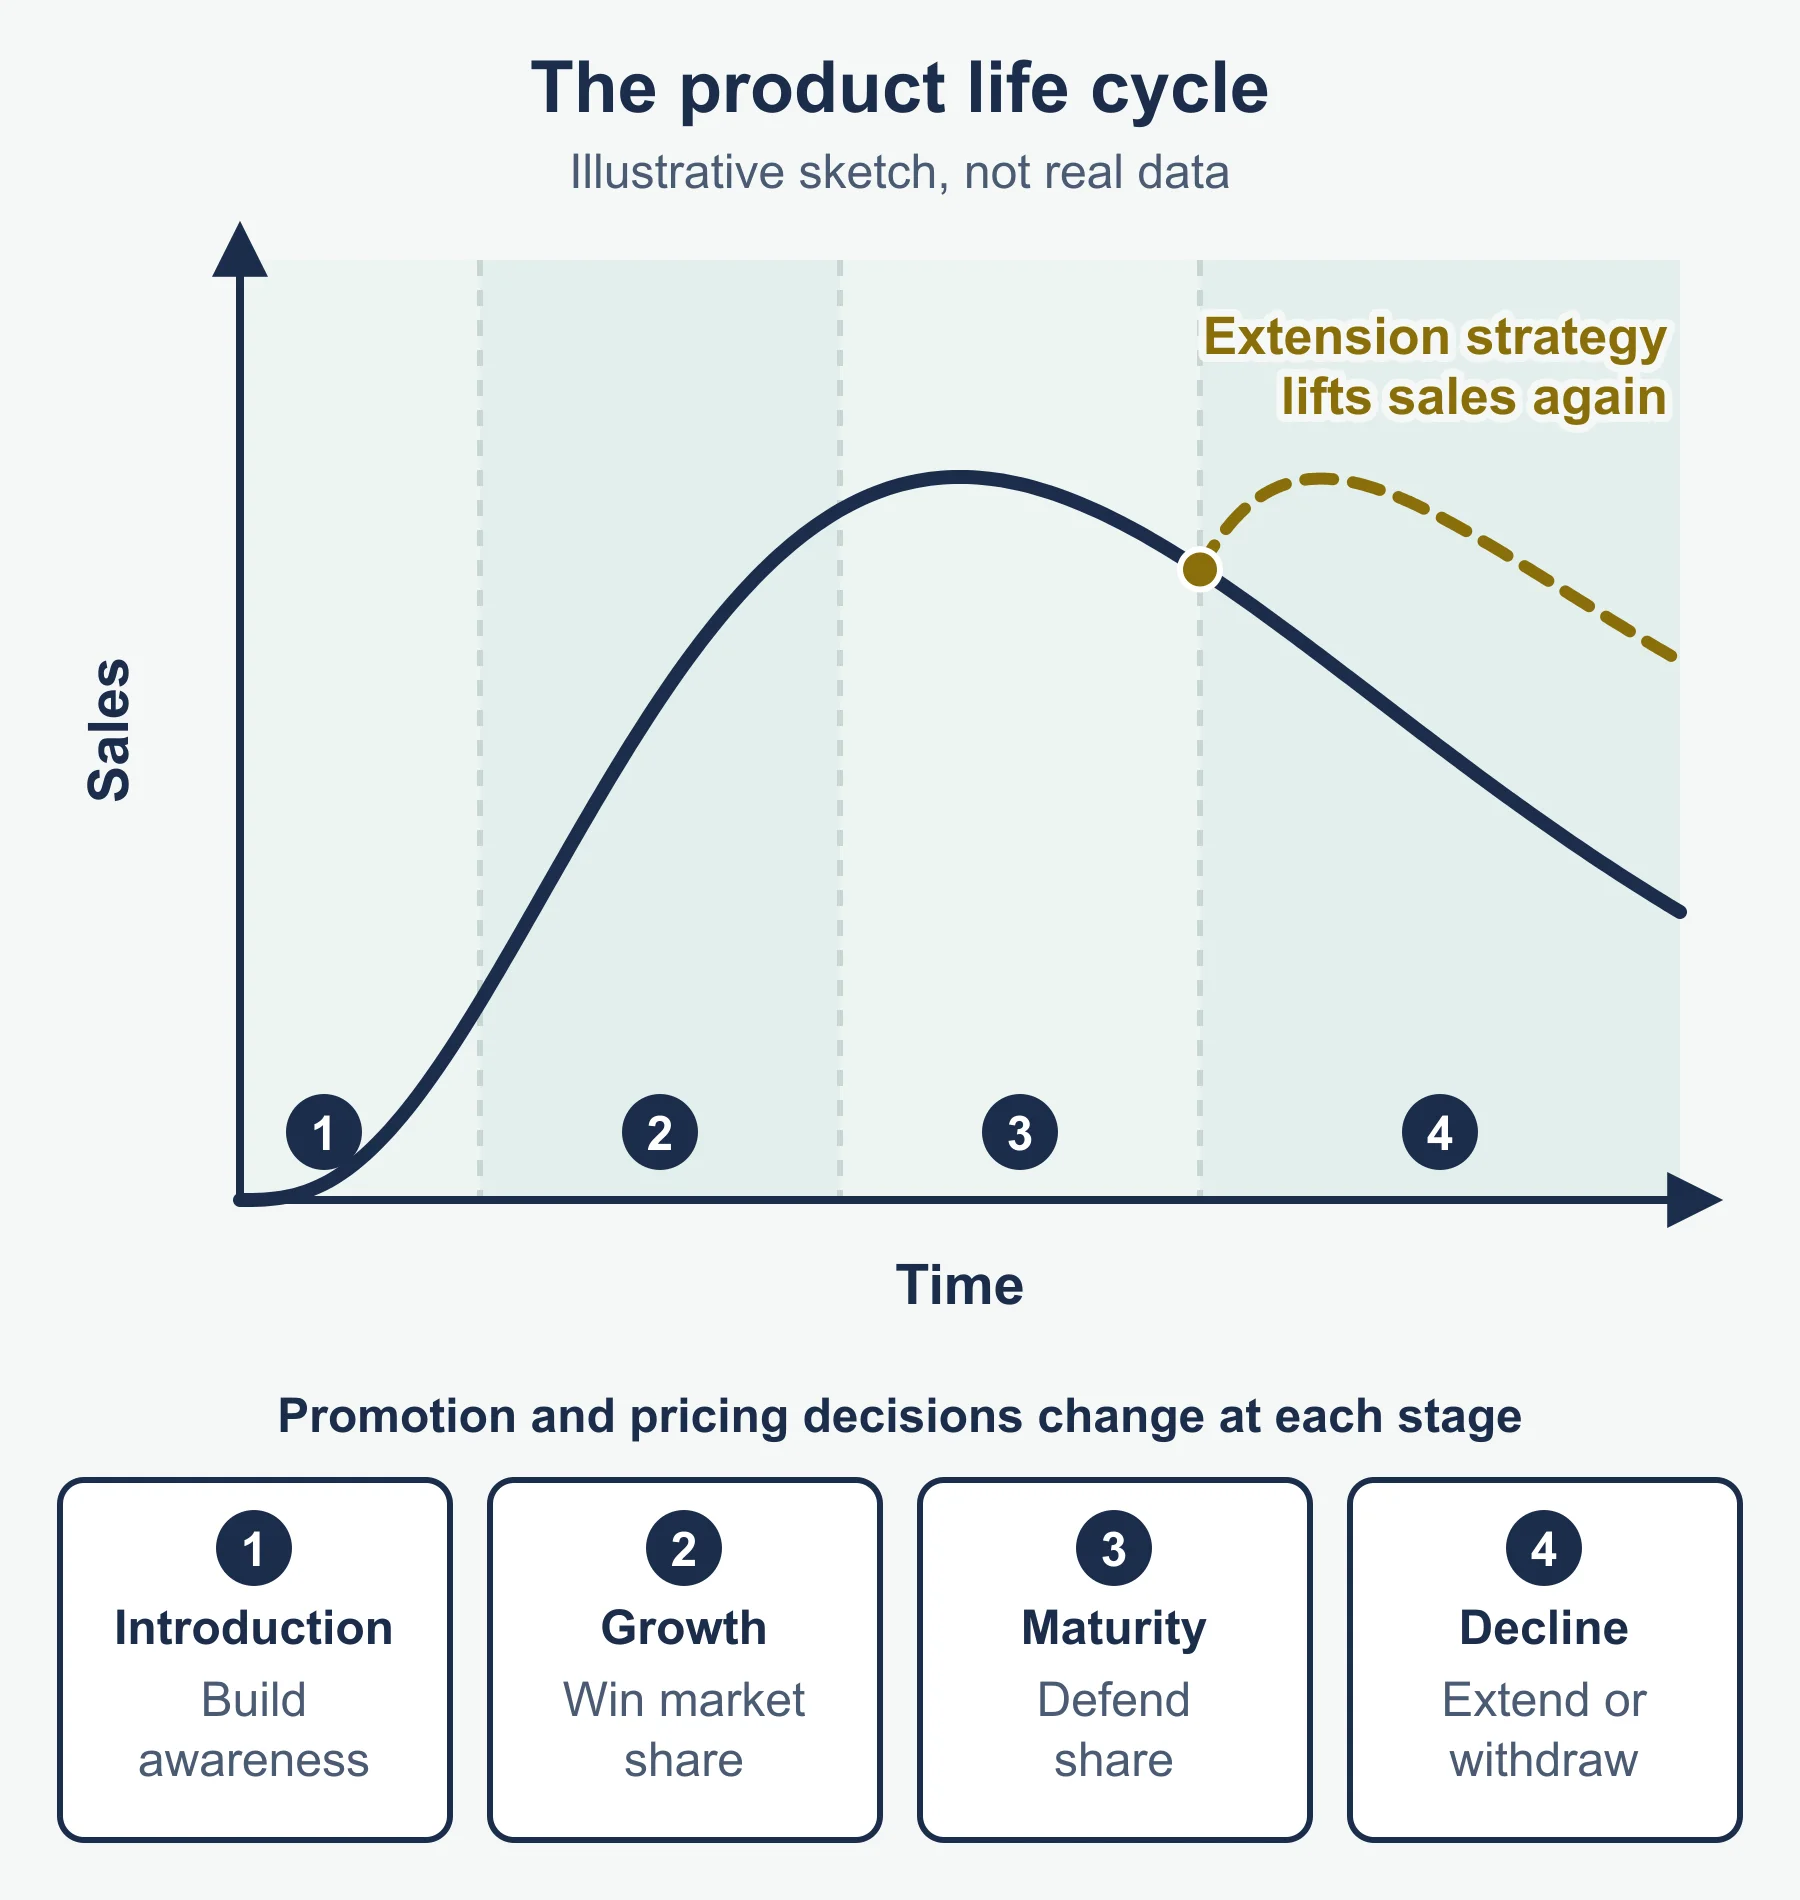
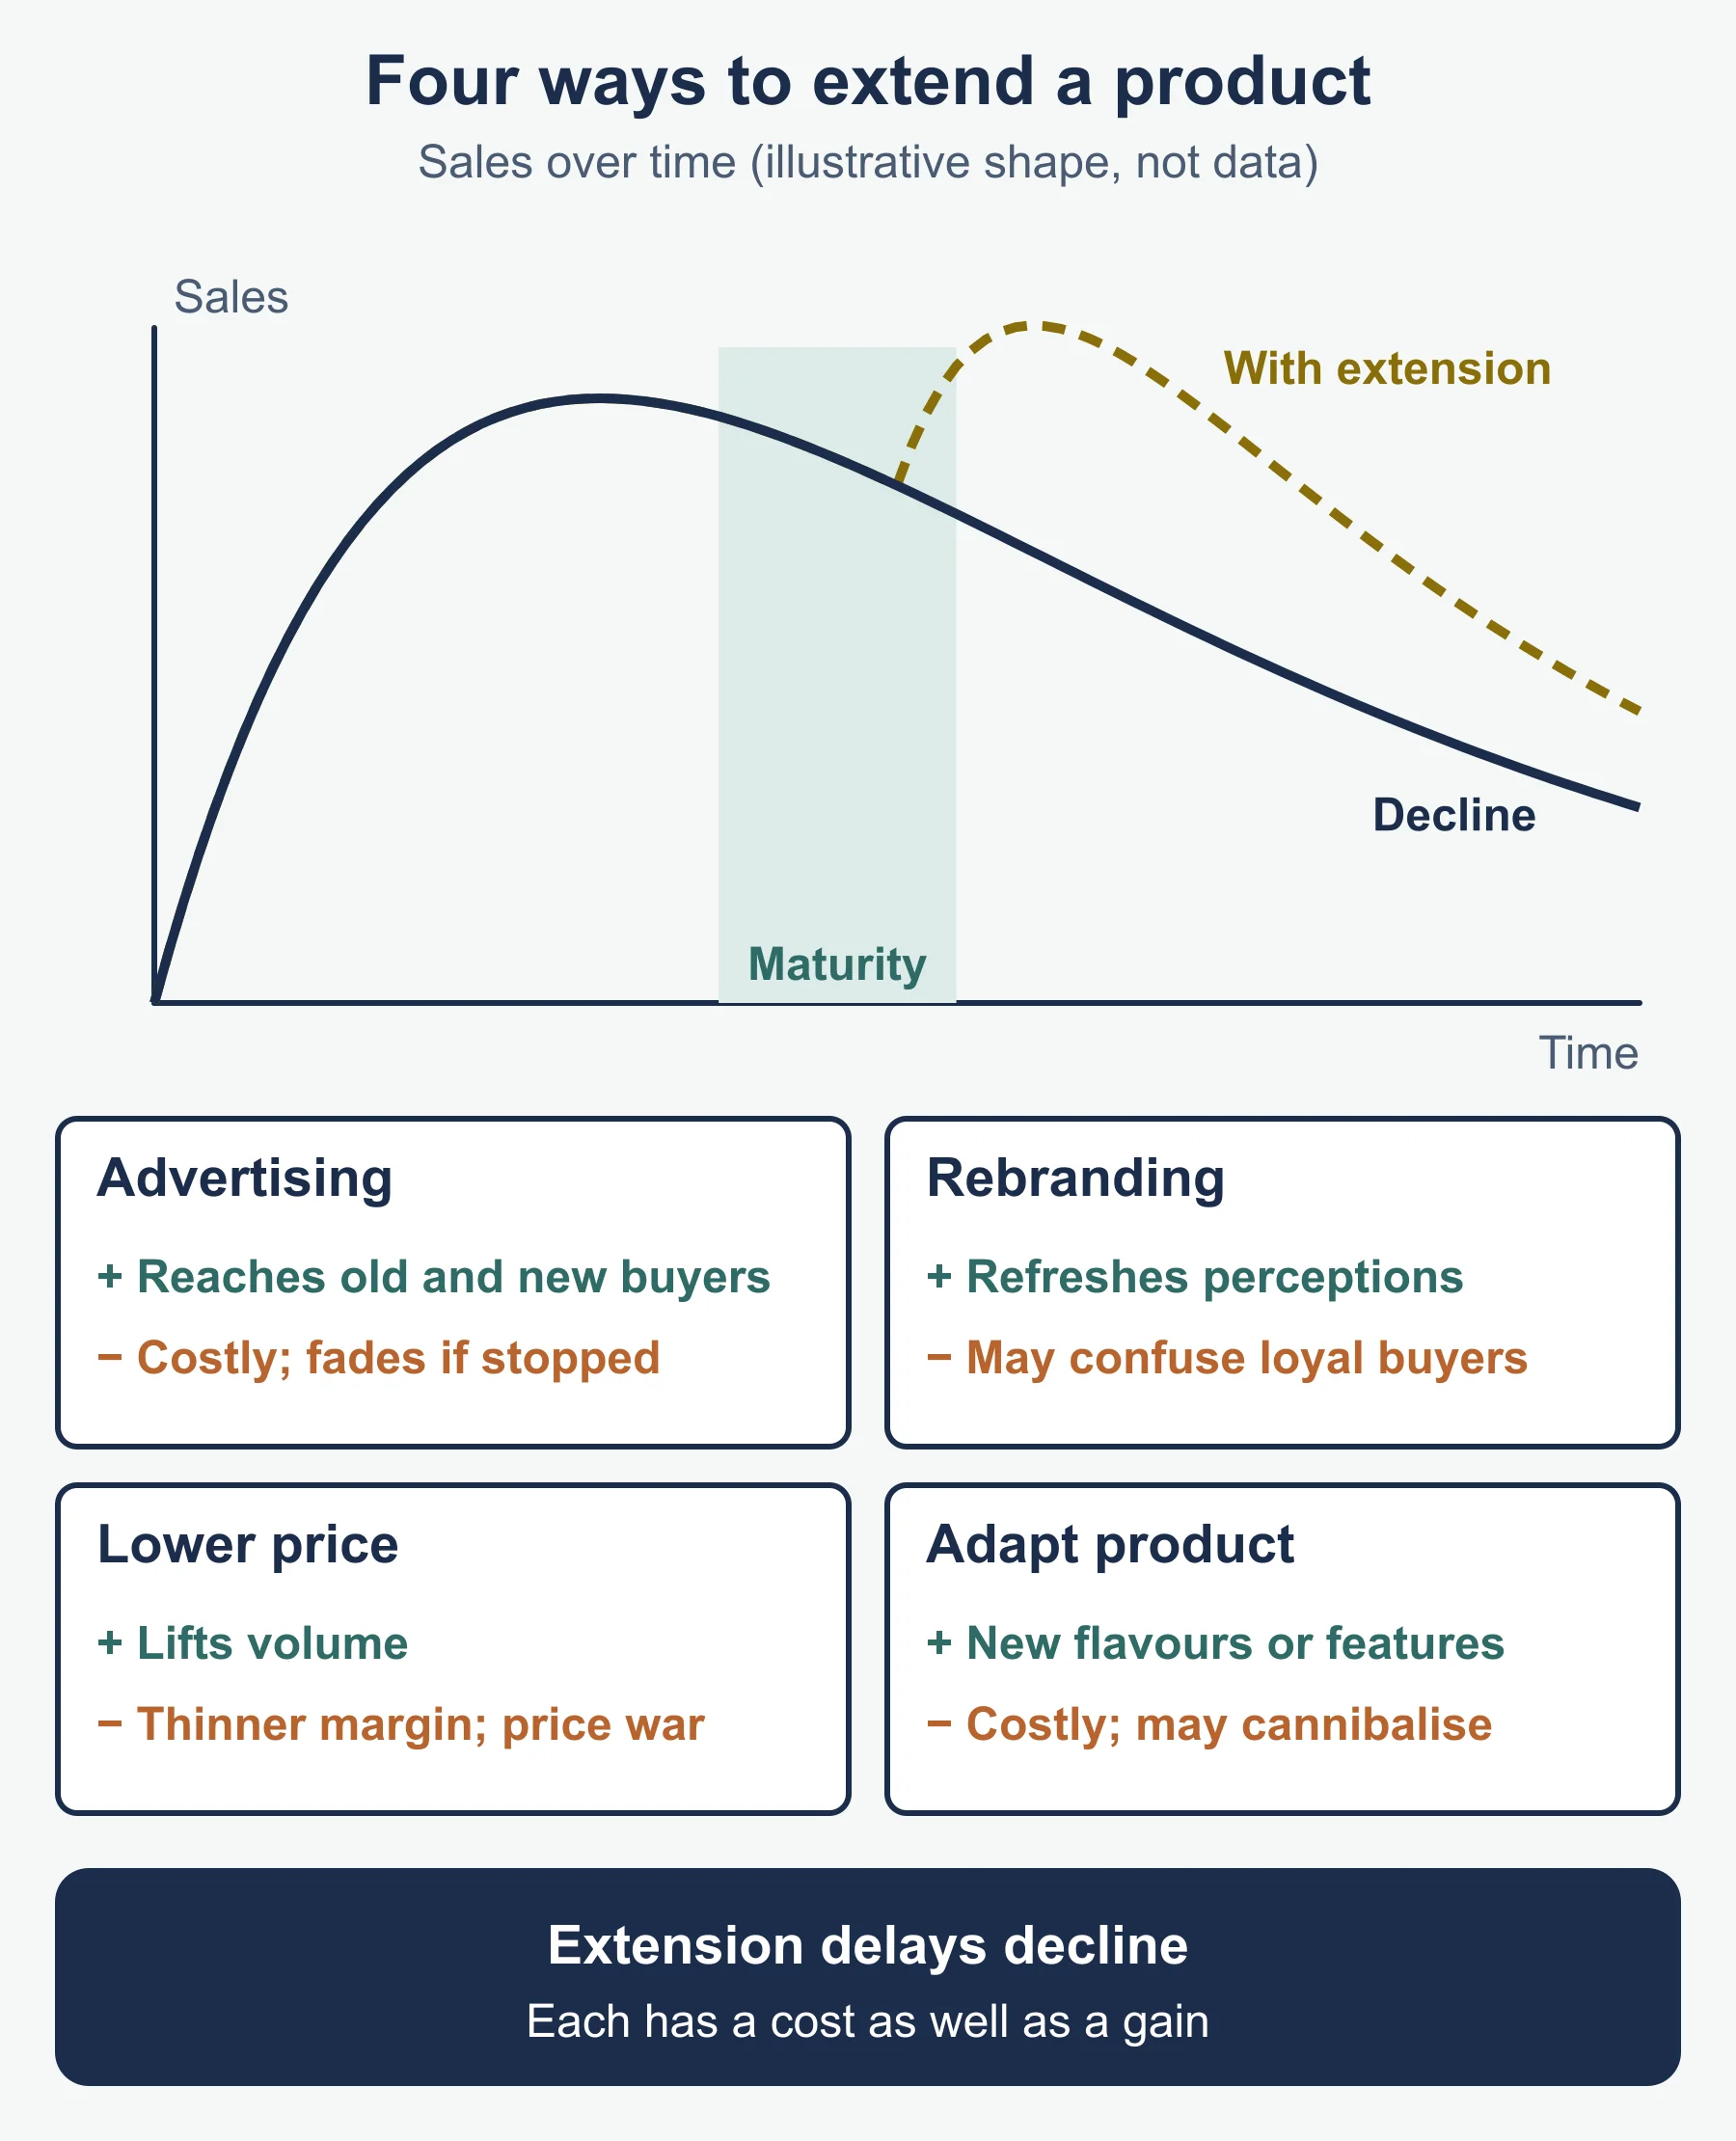
Extension strategies (four): advertising, rebranding, lowering the price, adapting the product. For each, give one benefit and one cost: advertising (reach / cost), rebranding (fresh image / confuses loyal buyers), lower price (volume / lower margin, price war), adaptation (new appeal / development cost, cannibalisation).
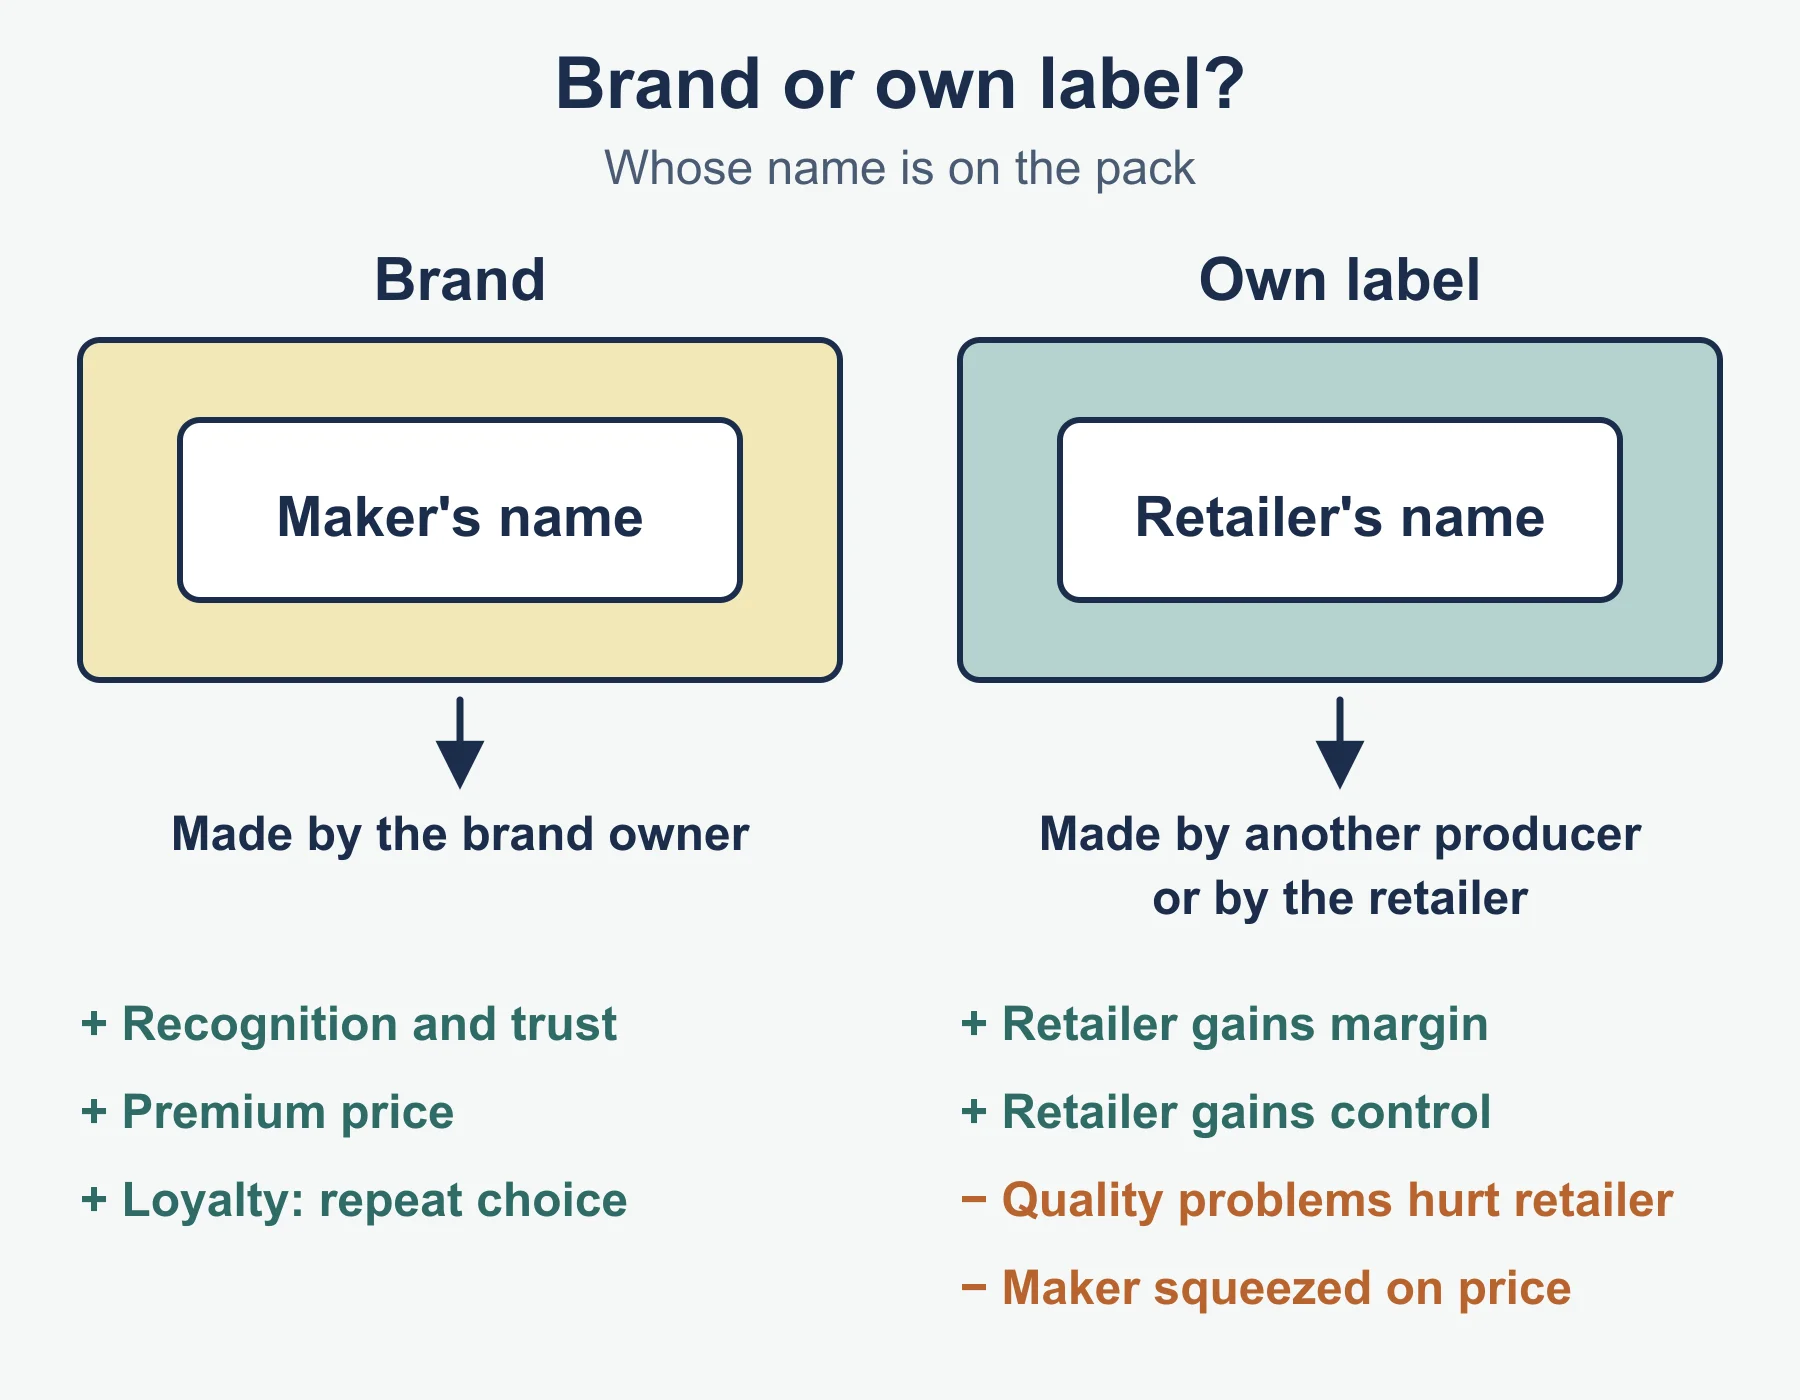
Branding: recognition, premium price, trust, easier launches, brand loyalty stabilises sales. Own label brand: sold under the retailer’s name; retailer gets margin and control, but takes the reputational risk, and the supplier faces price pressure.
Pricing
Influences: marketing objectives, target market, level of demand, PED, costs, competitors’ prices and actions, rest of the marketing mix.
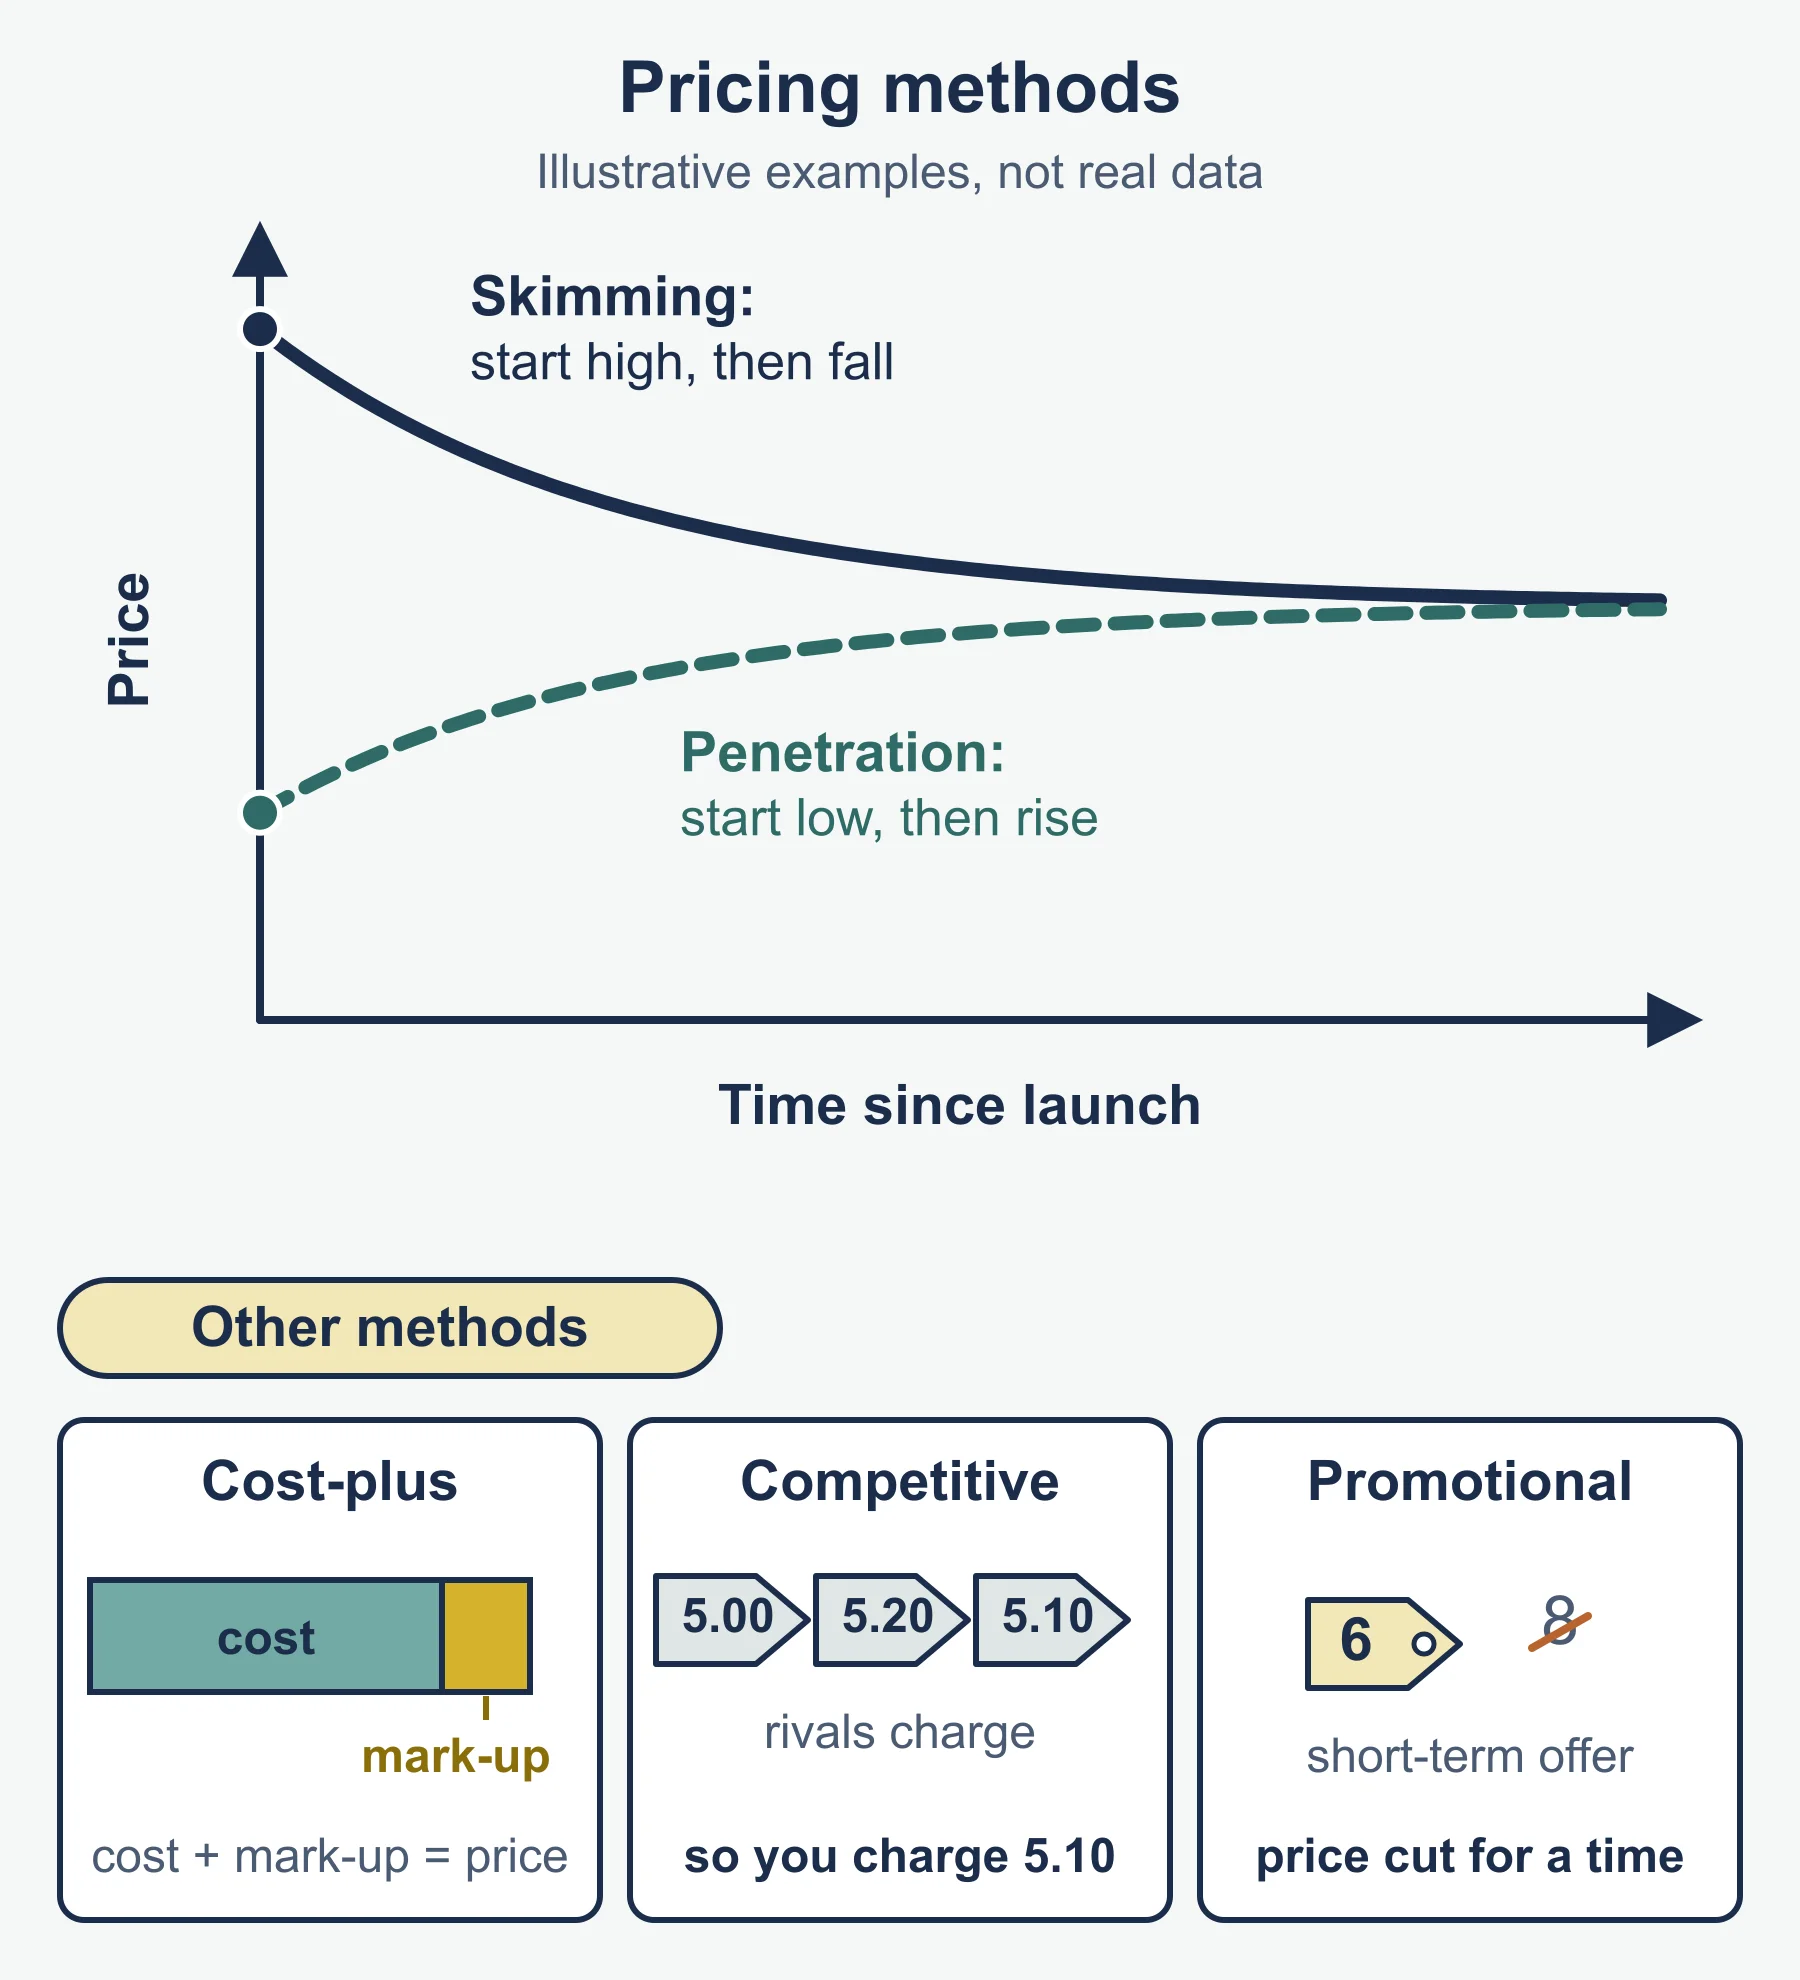
| Method | One-line definition | Best when |
|---|---|---|
| Cost based (cost-plus, standard form) | Unit cost plus a mark-up | Costs known, many products |
| Penetration | Low entry price for share | Price-sensitive market |
| Skimming | High entry price, cut later | Novel product, early adopters |
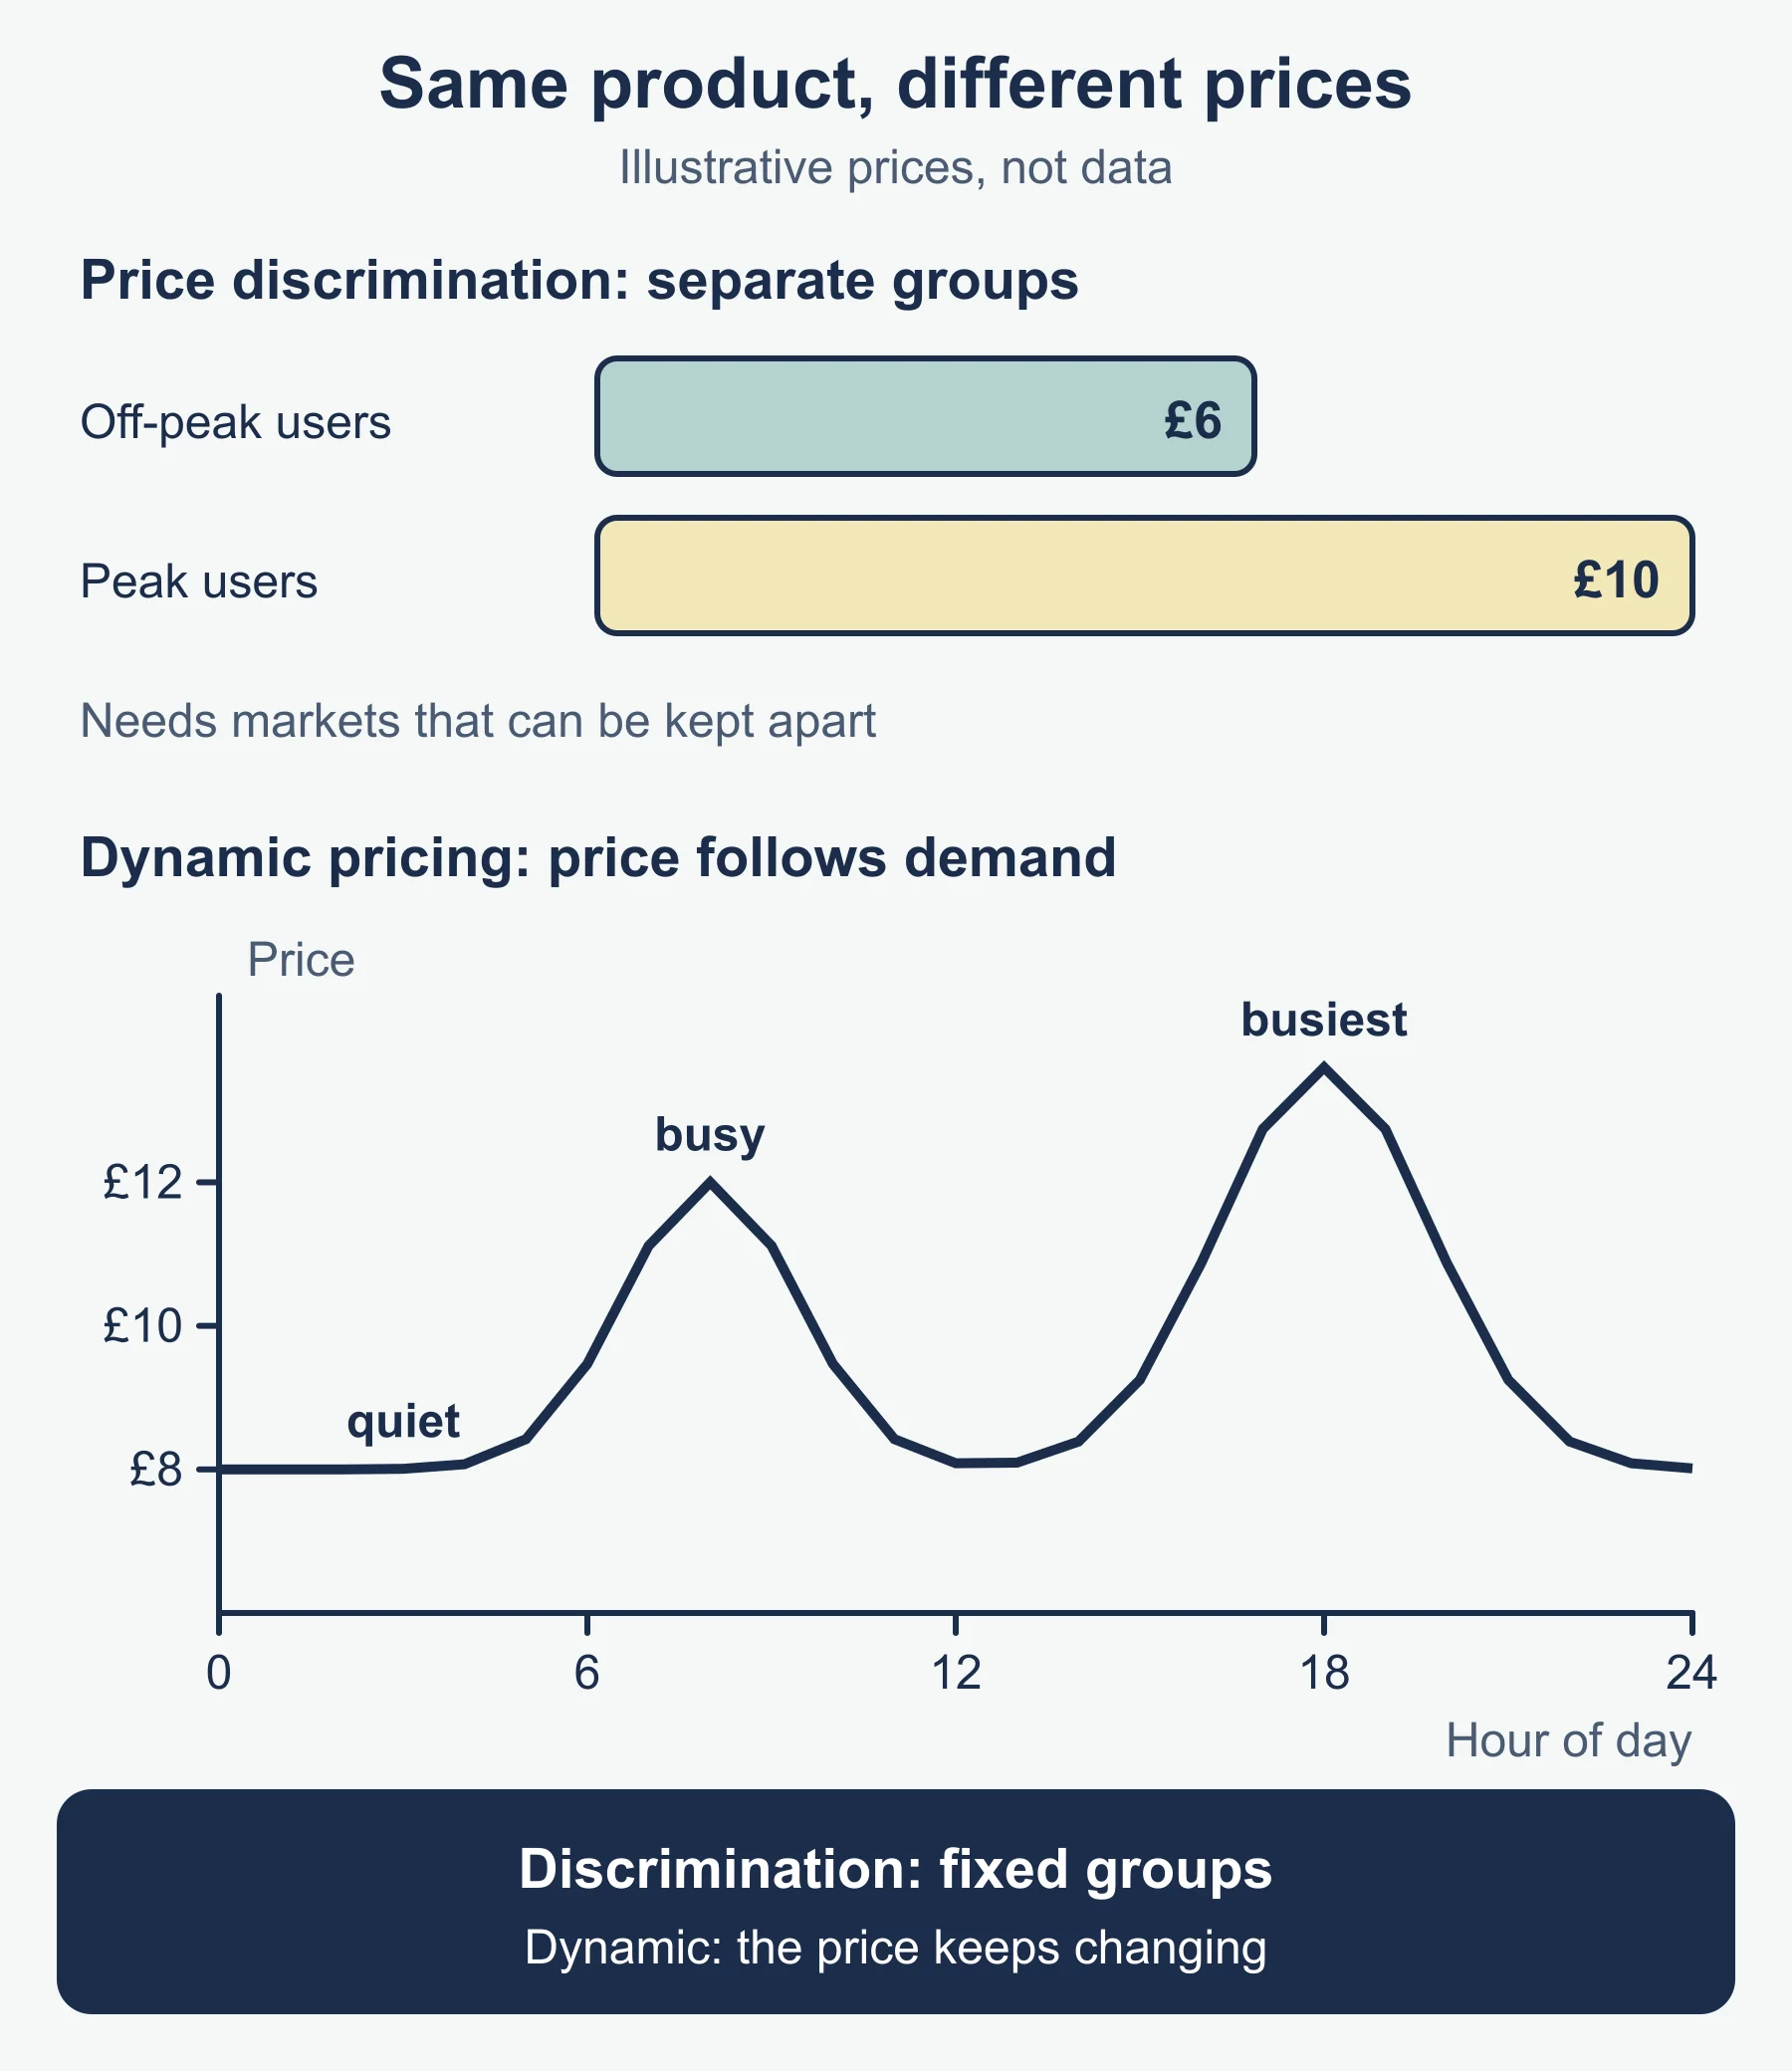
| Dynamic | Price changes with demand in real time | Online sales, perishable capacity |
| Premium | Above rivals | Strong brand |
| Going rate | In line with rivals | Near-identical products |
| Discount | Below rivals | Cost advantage |
Formulas (standard forms)
| Measure | Formula | Reading the answer |
|---|---|---|
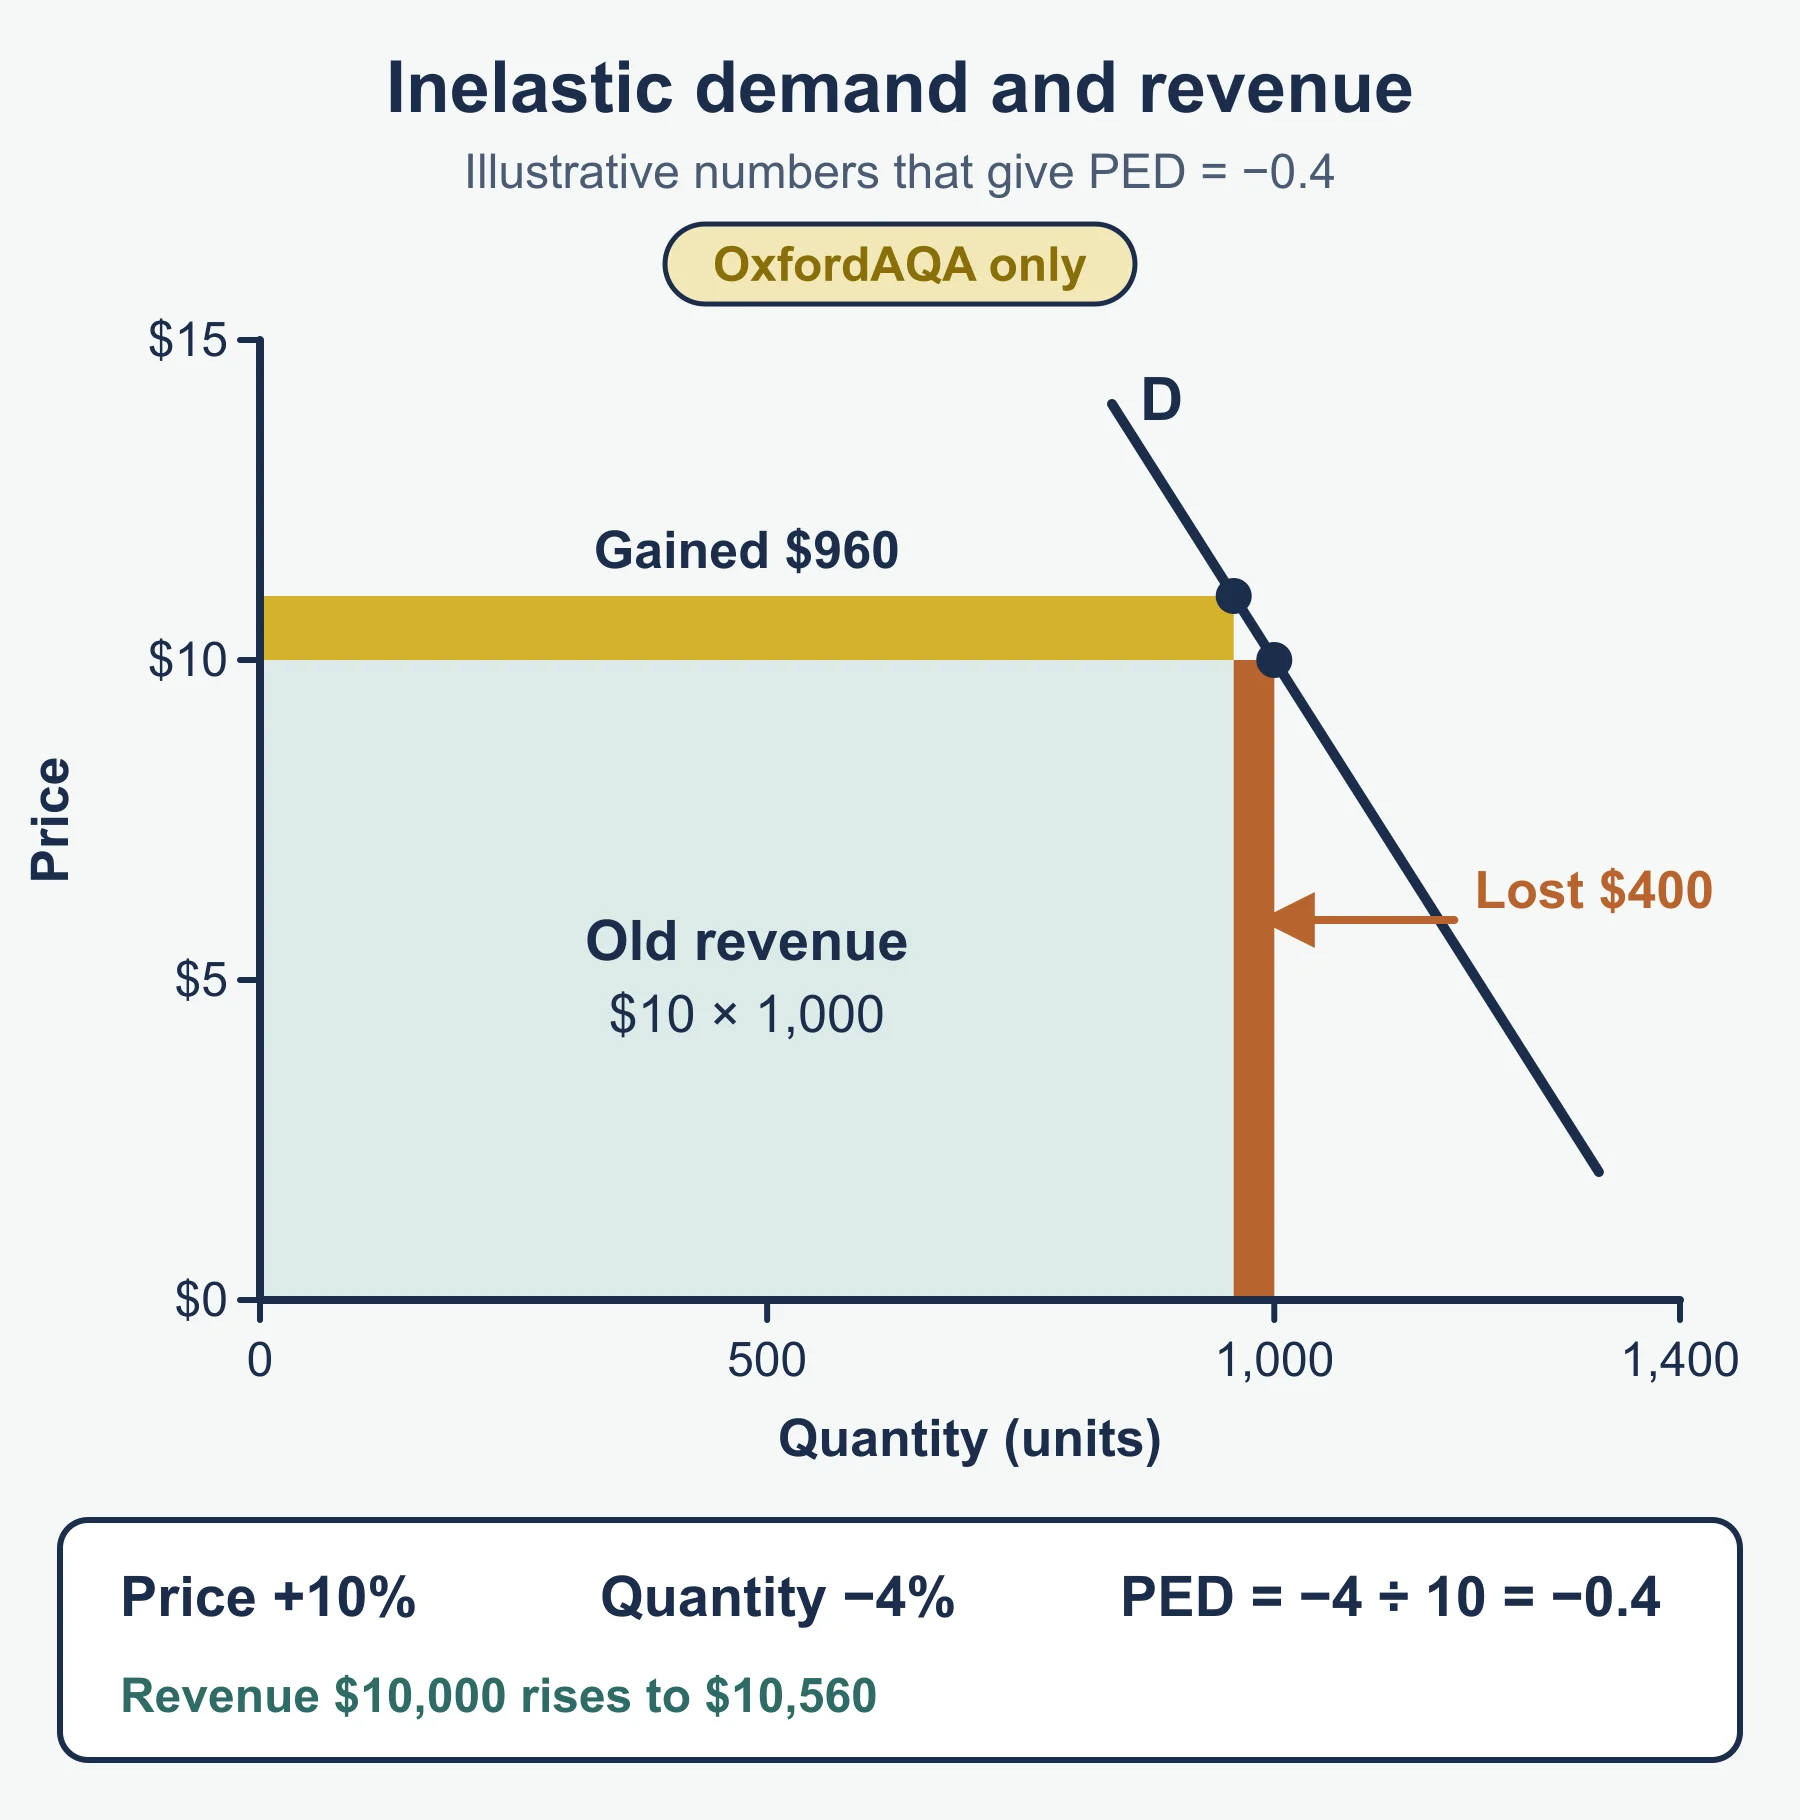
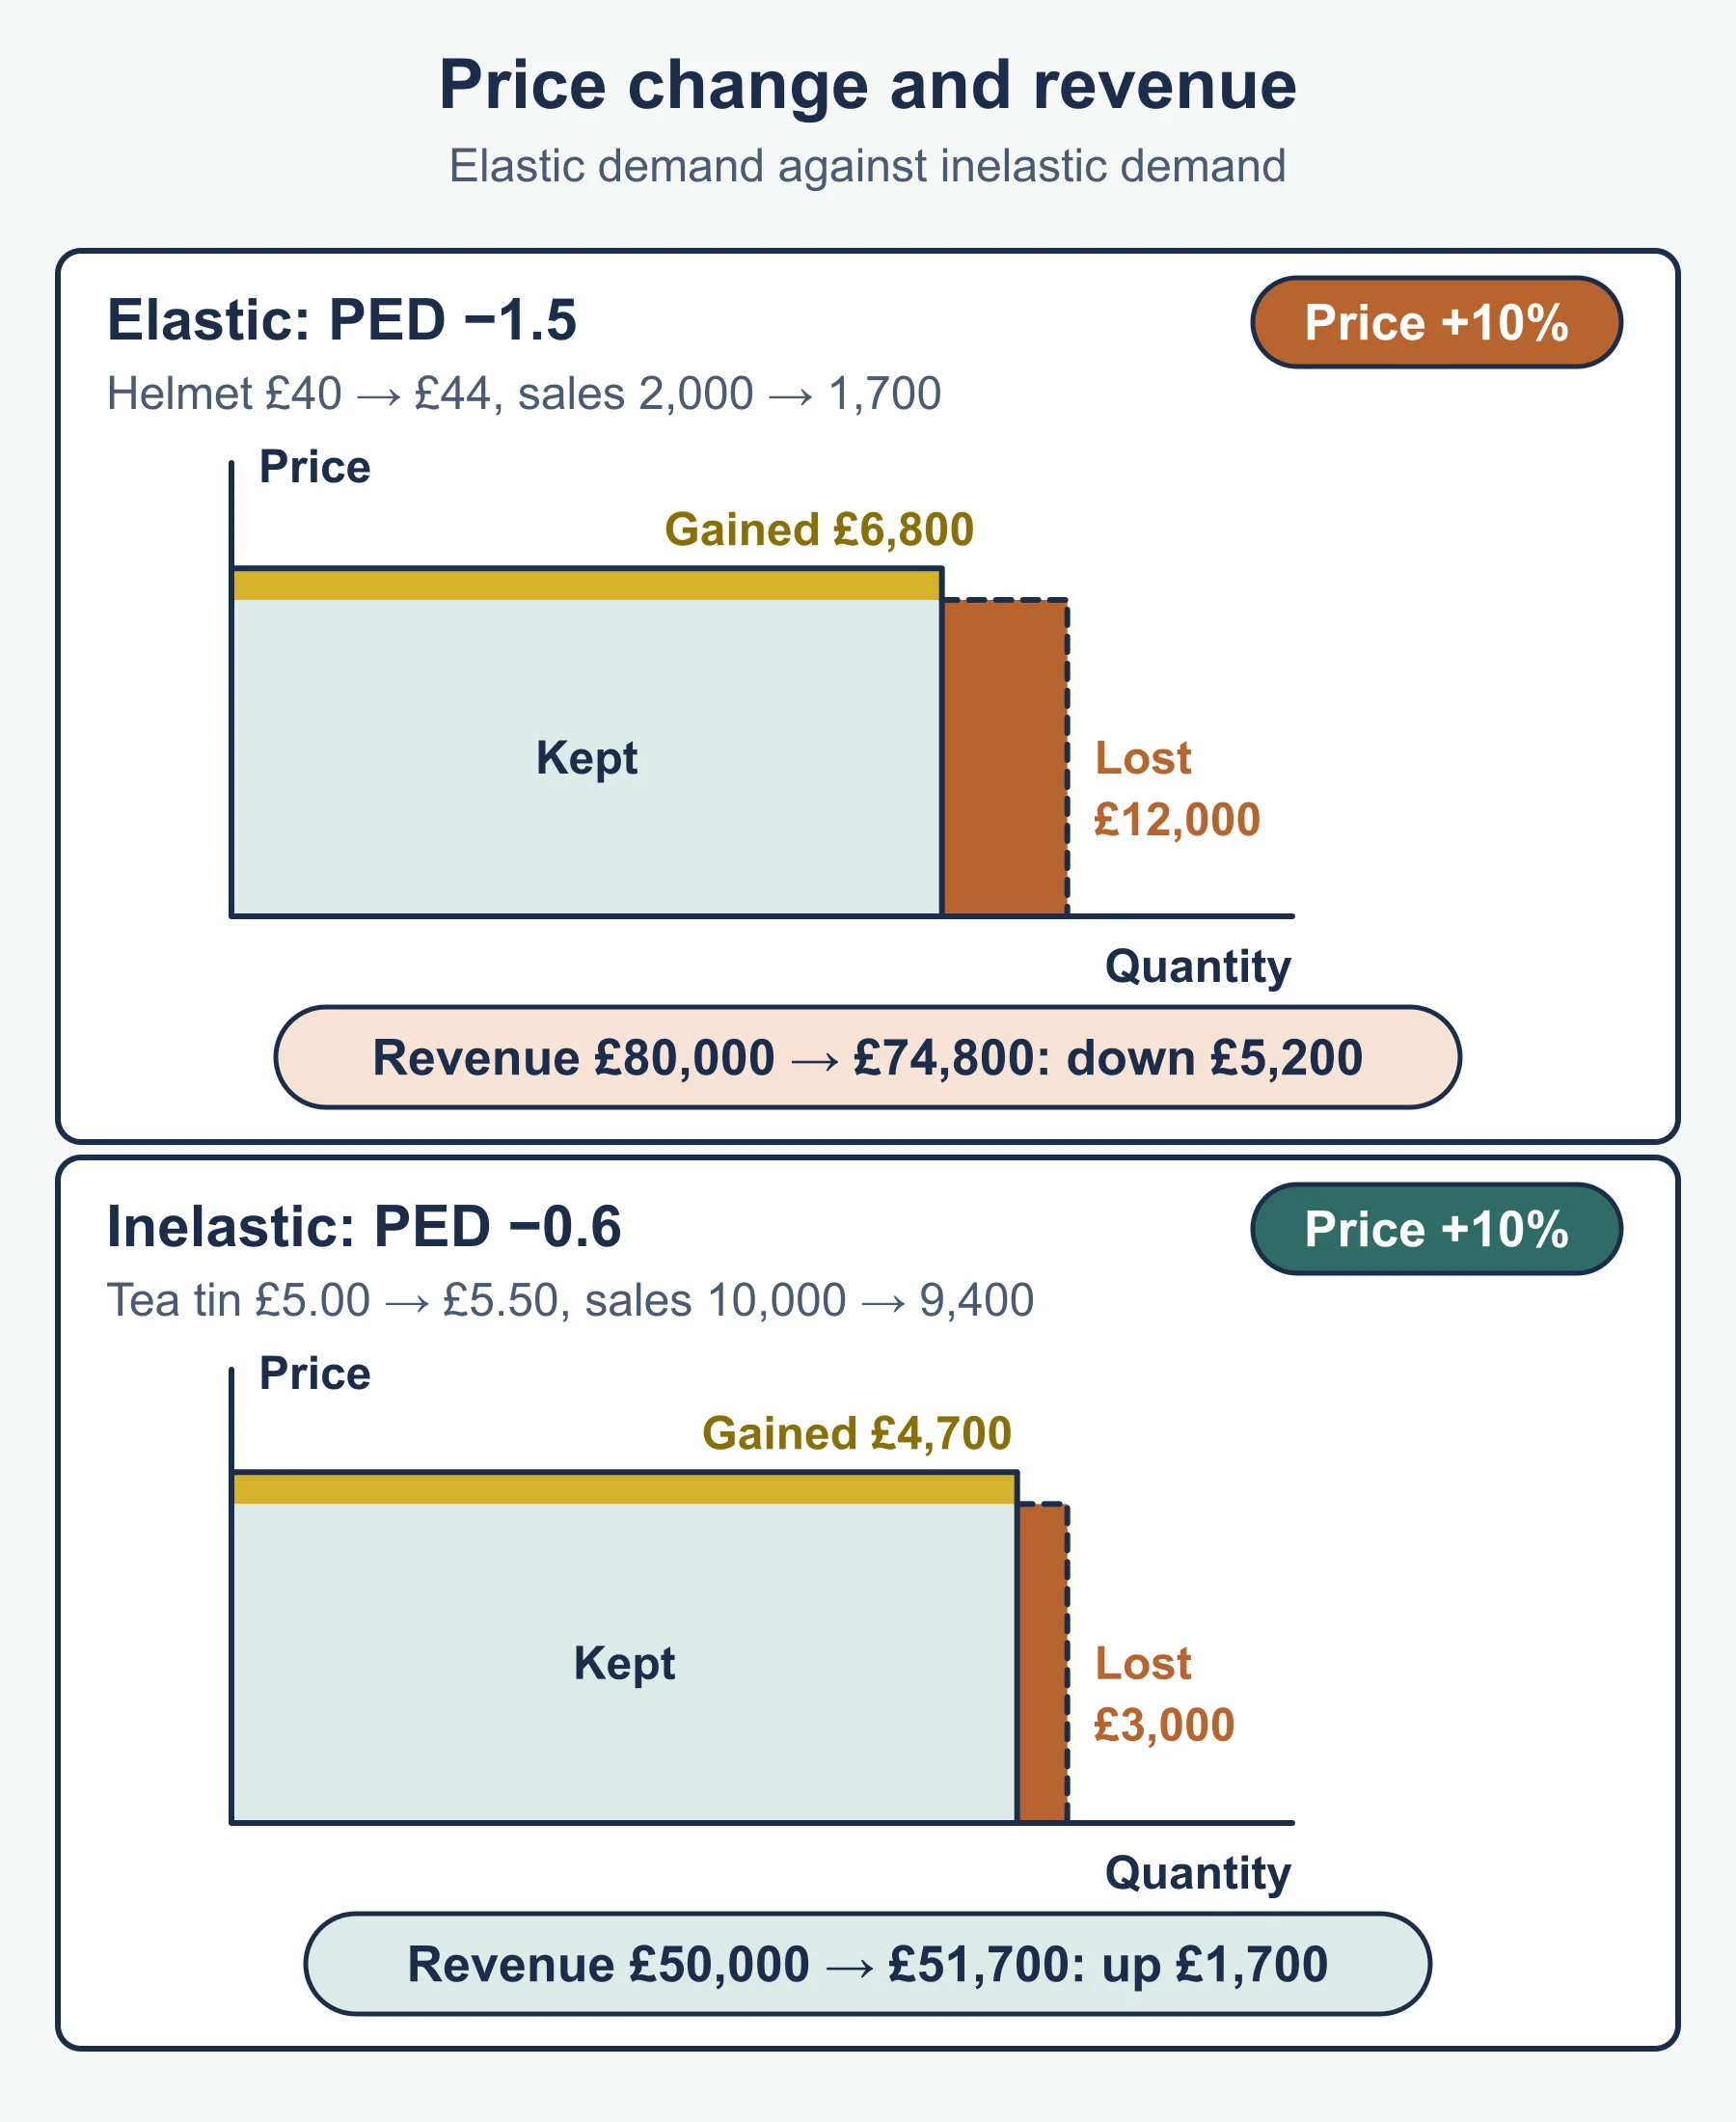
| PED | % change in quantity demanded ÷ % change in price | Size above 1 elastic; below 1 inelastic |
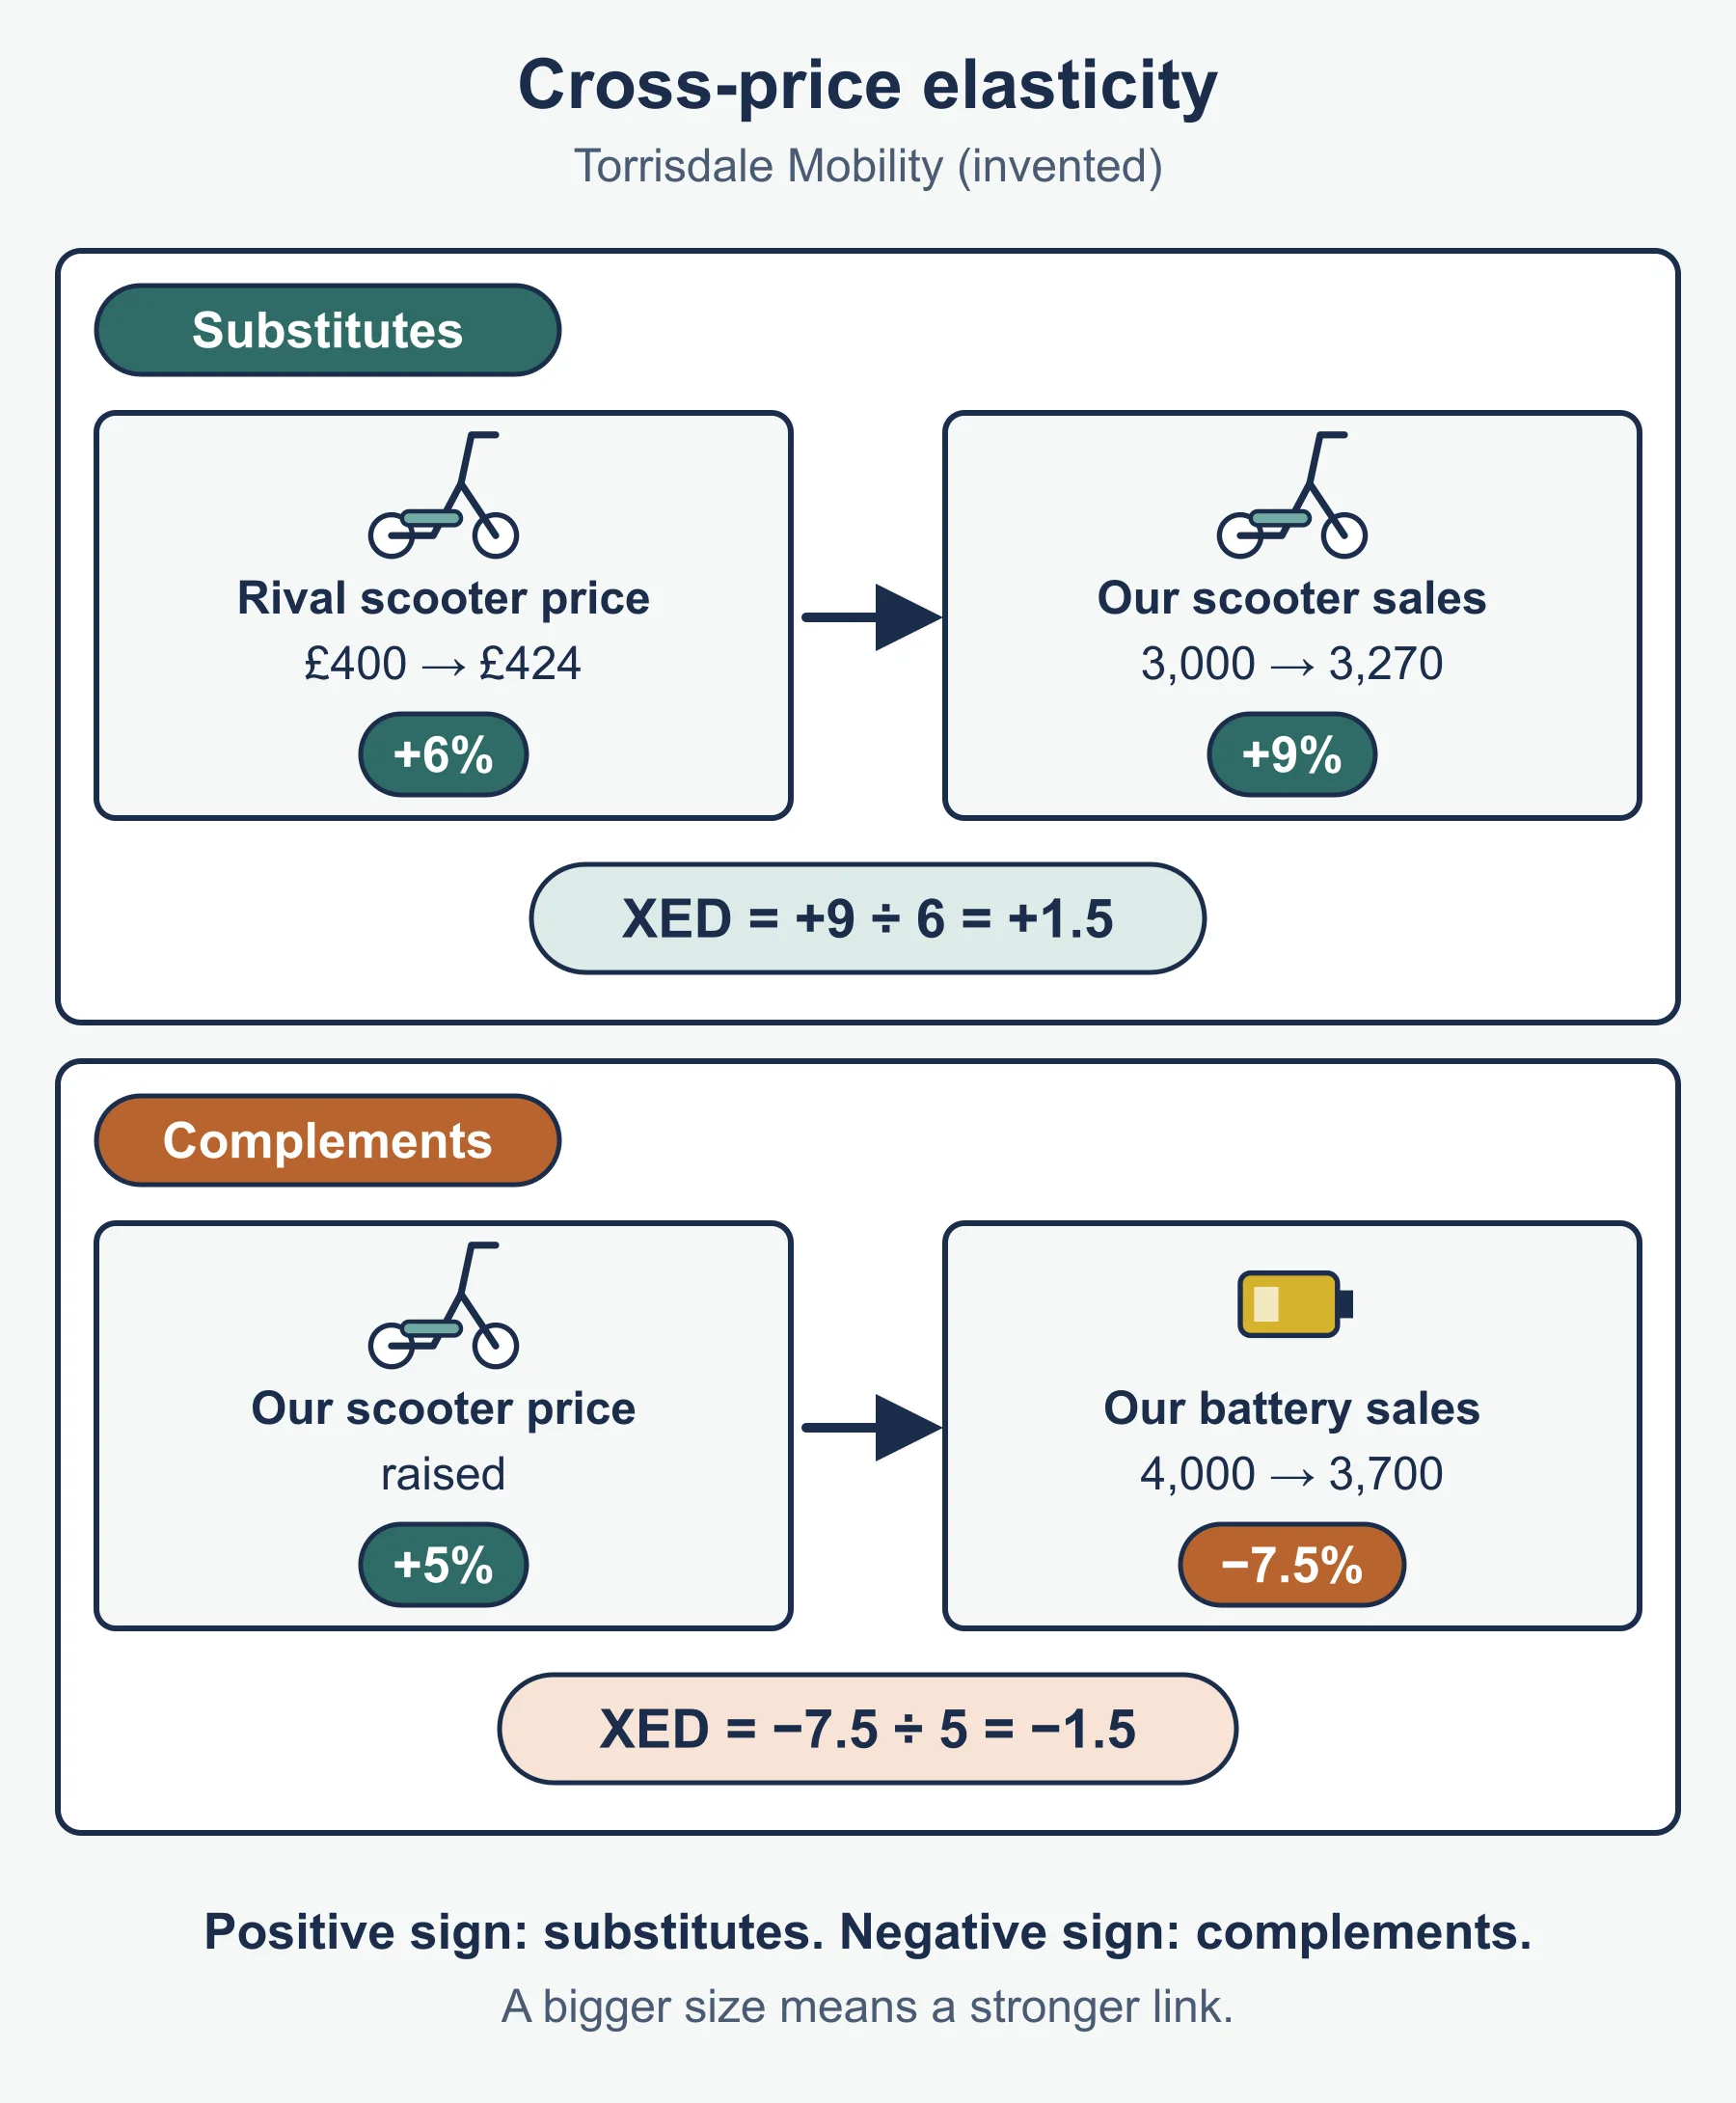
| XED | % change in quantity of A ÷ % change in price of B | Positive substitutes; negative complements |
| % change | (new − old) ÷ old × 100 | |
| Revenue | price × quantity | |
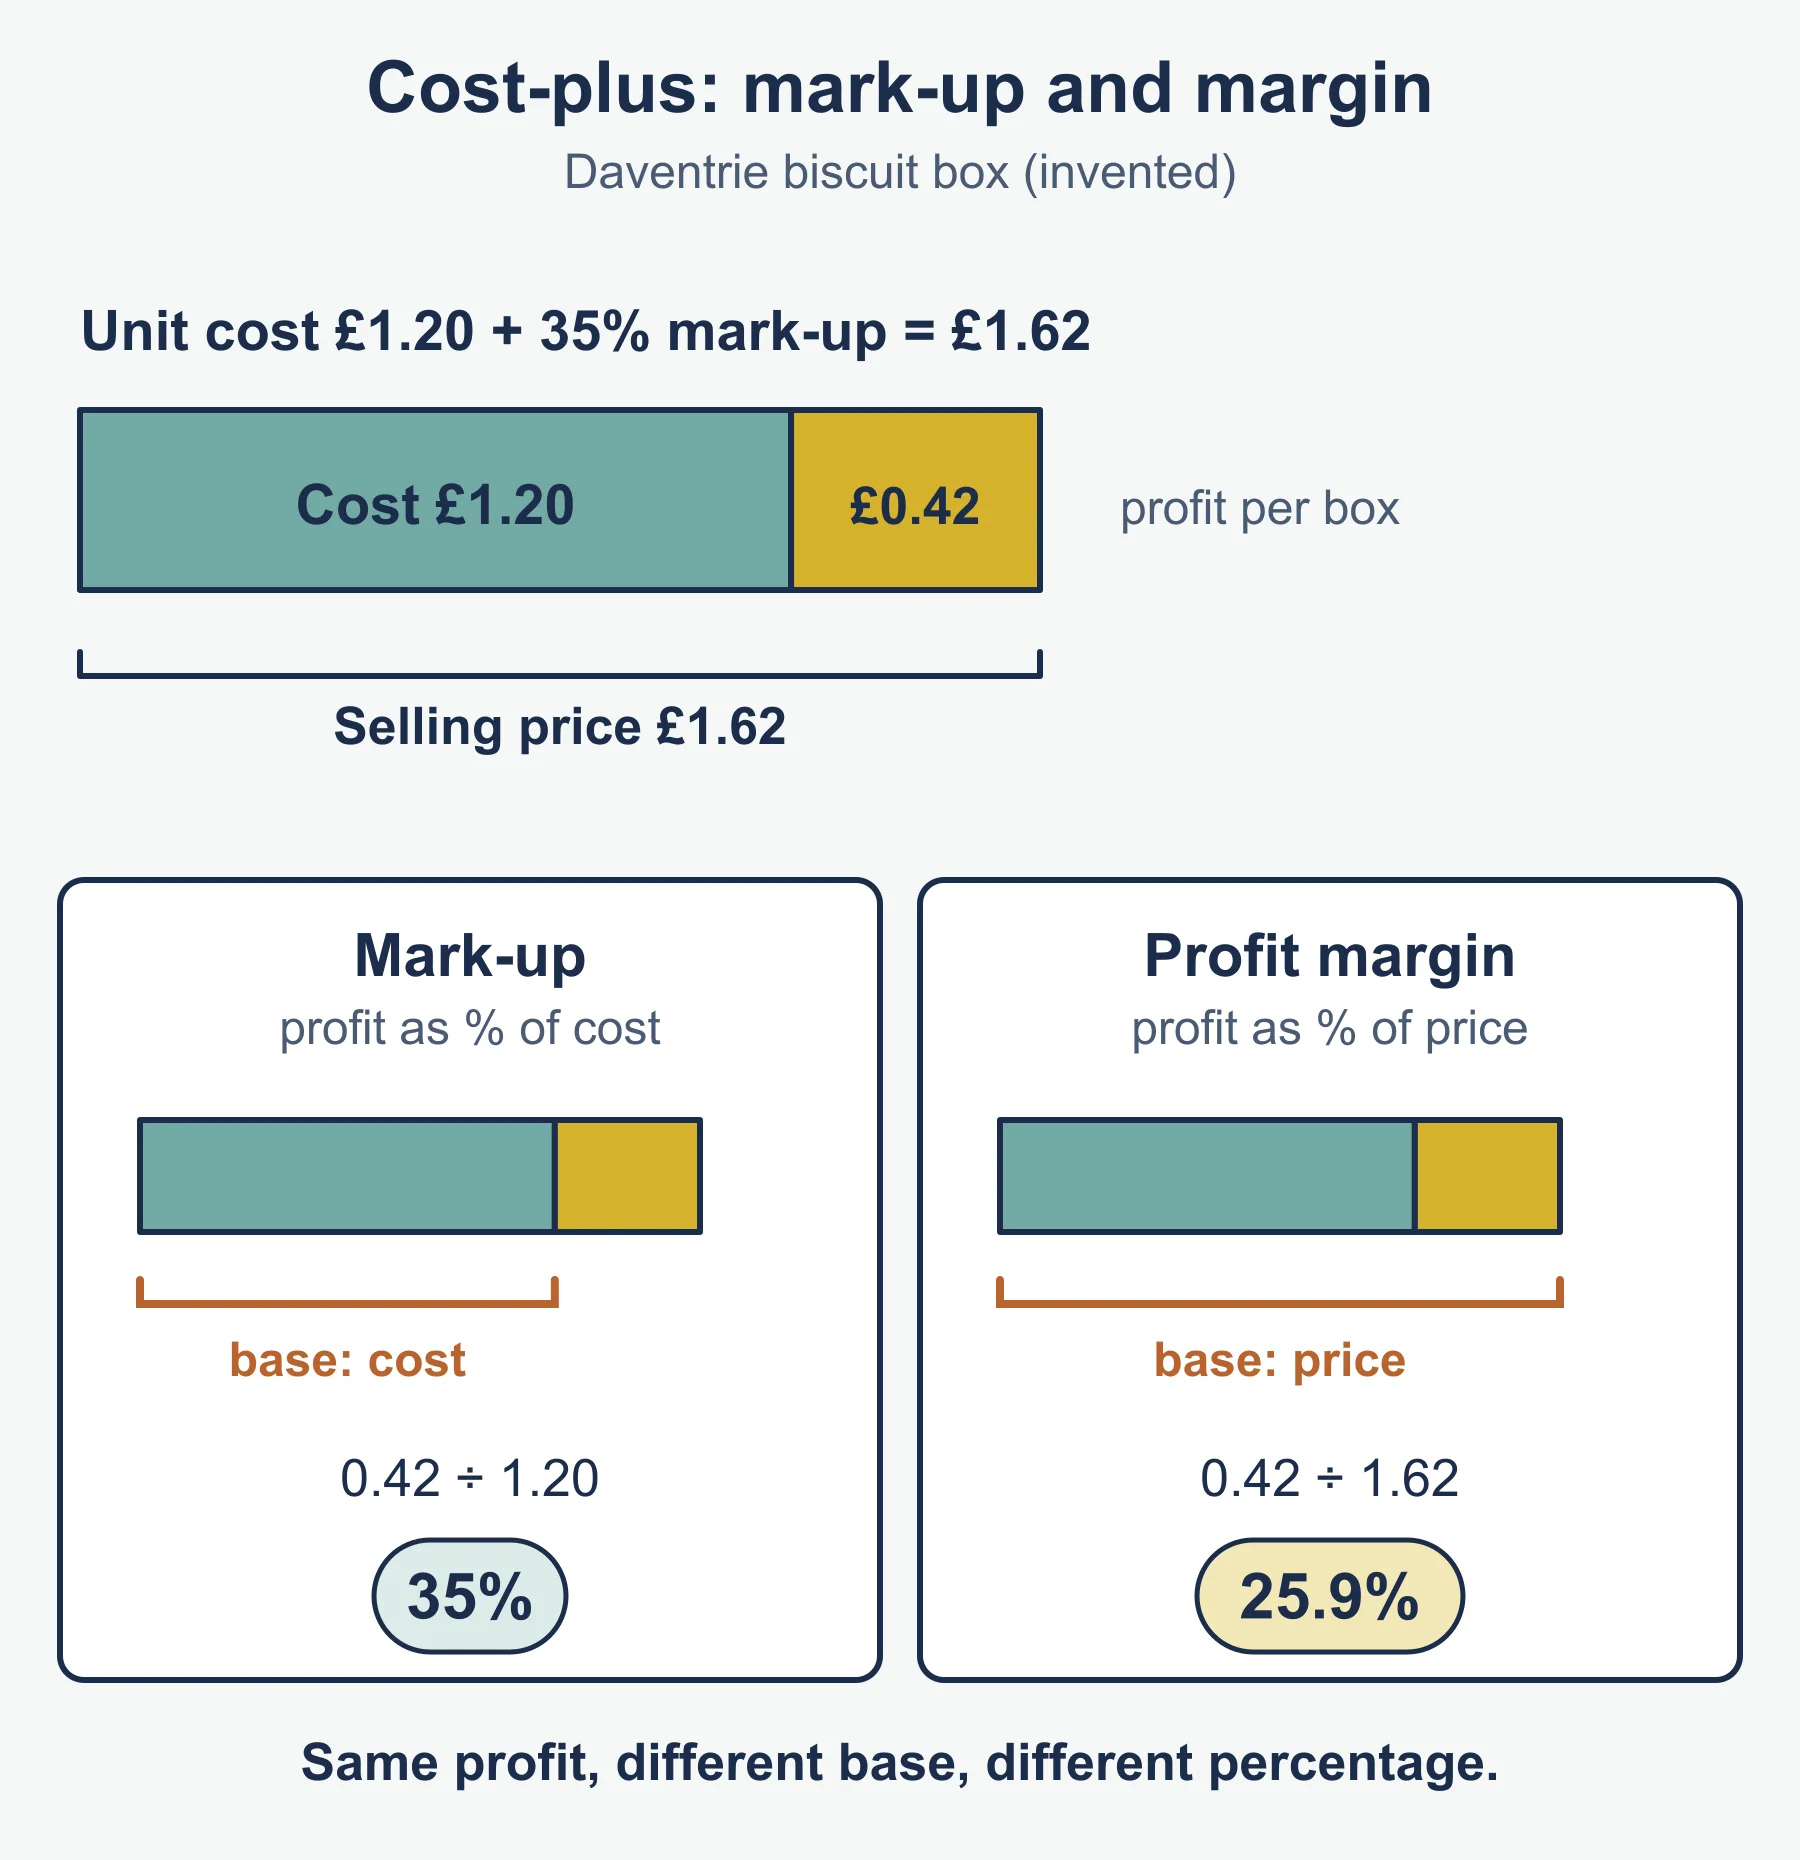
| Cost-plus price | unit cost × (1 + mark-up) | |
| Margin | (price − cost) ÷ price × 100 | Differs from mark-up |
Method for revenue questions
- Work out the % change in price.
- Use PED to find the % change in quantity.
- Apply both to the original figures.
- Compare old and new revenue, and state the difference.
- Add a caution: PED is an estimate, and profit also depends on costs.
Rule of thumb: elastic, a price rise cuts revenue; inelastic, a price rise lifts it. Cuts do the opposite.
Promotion
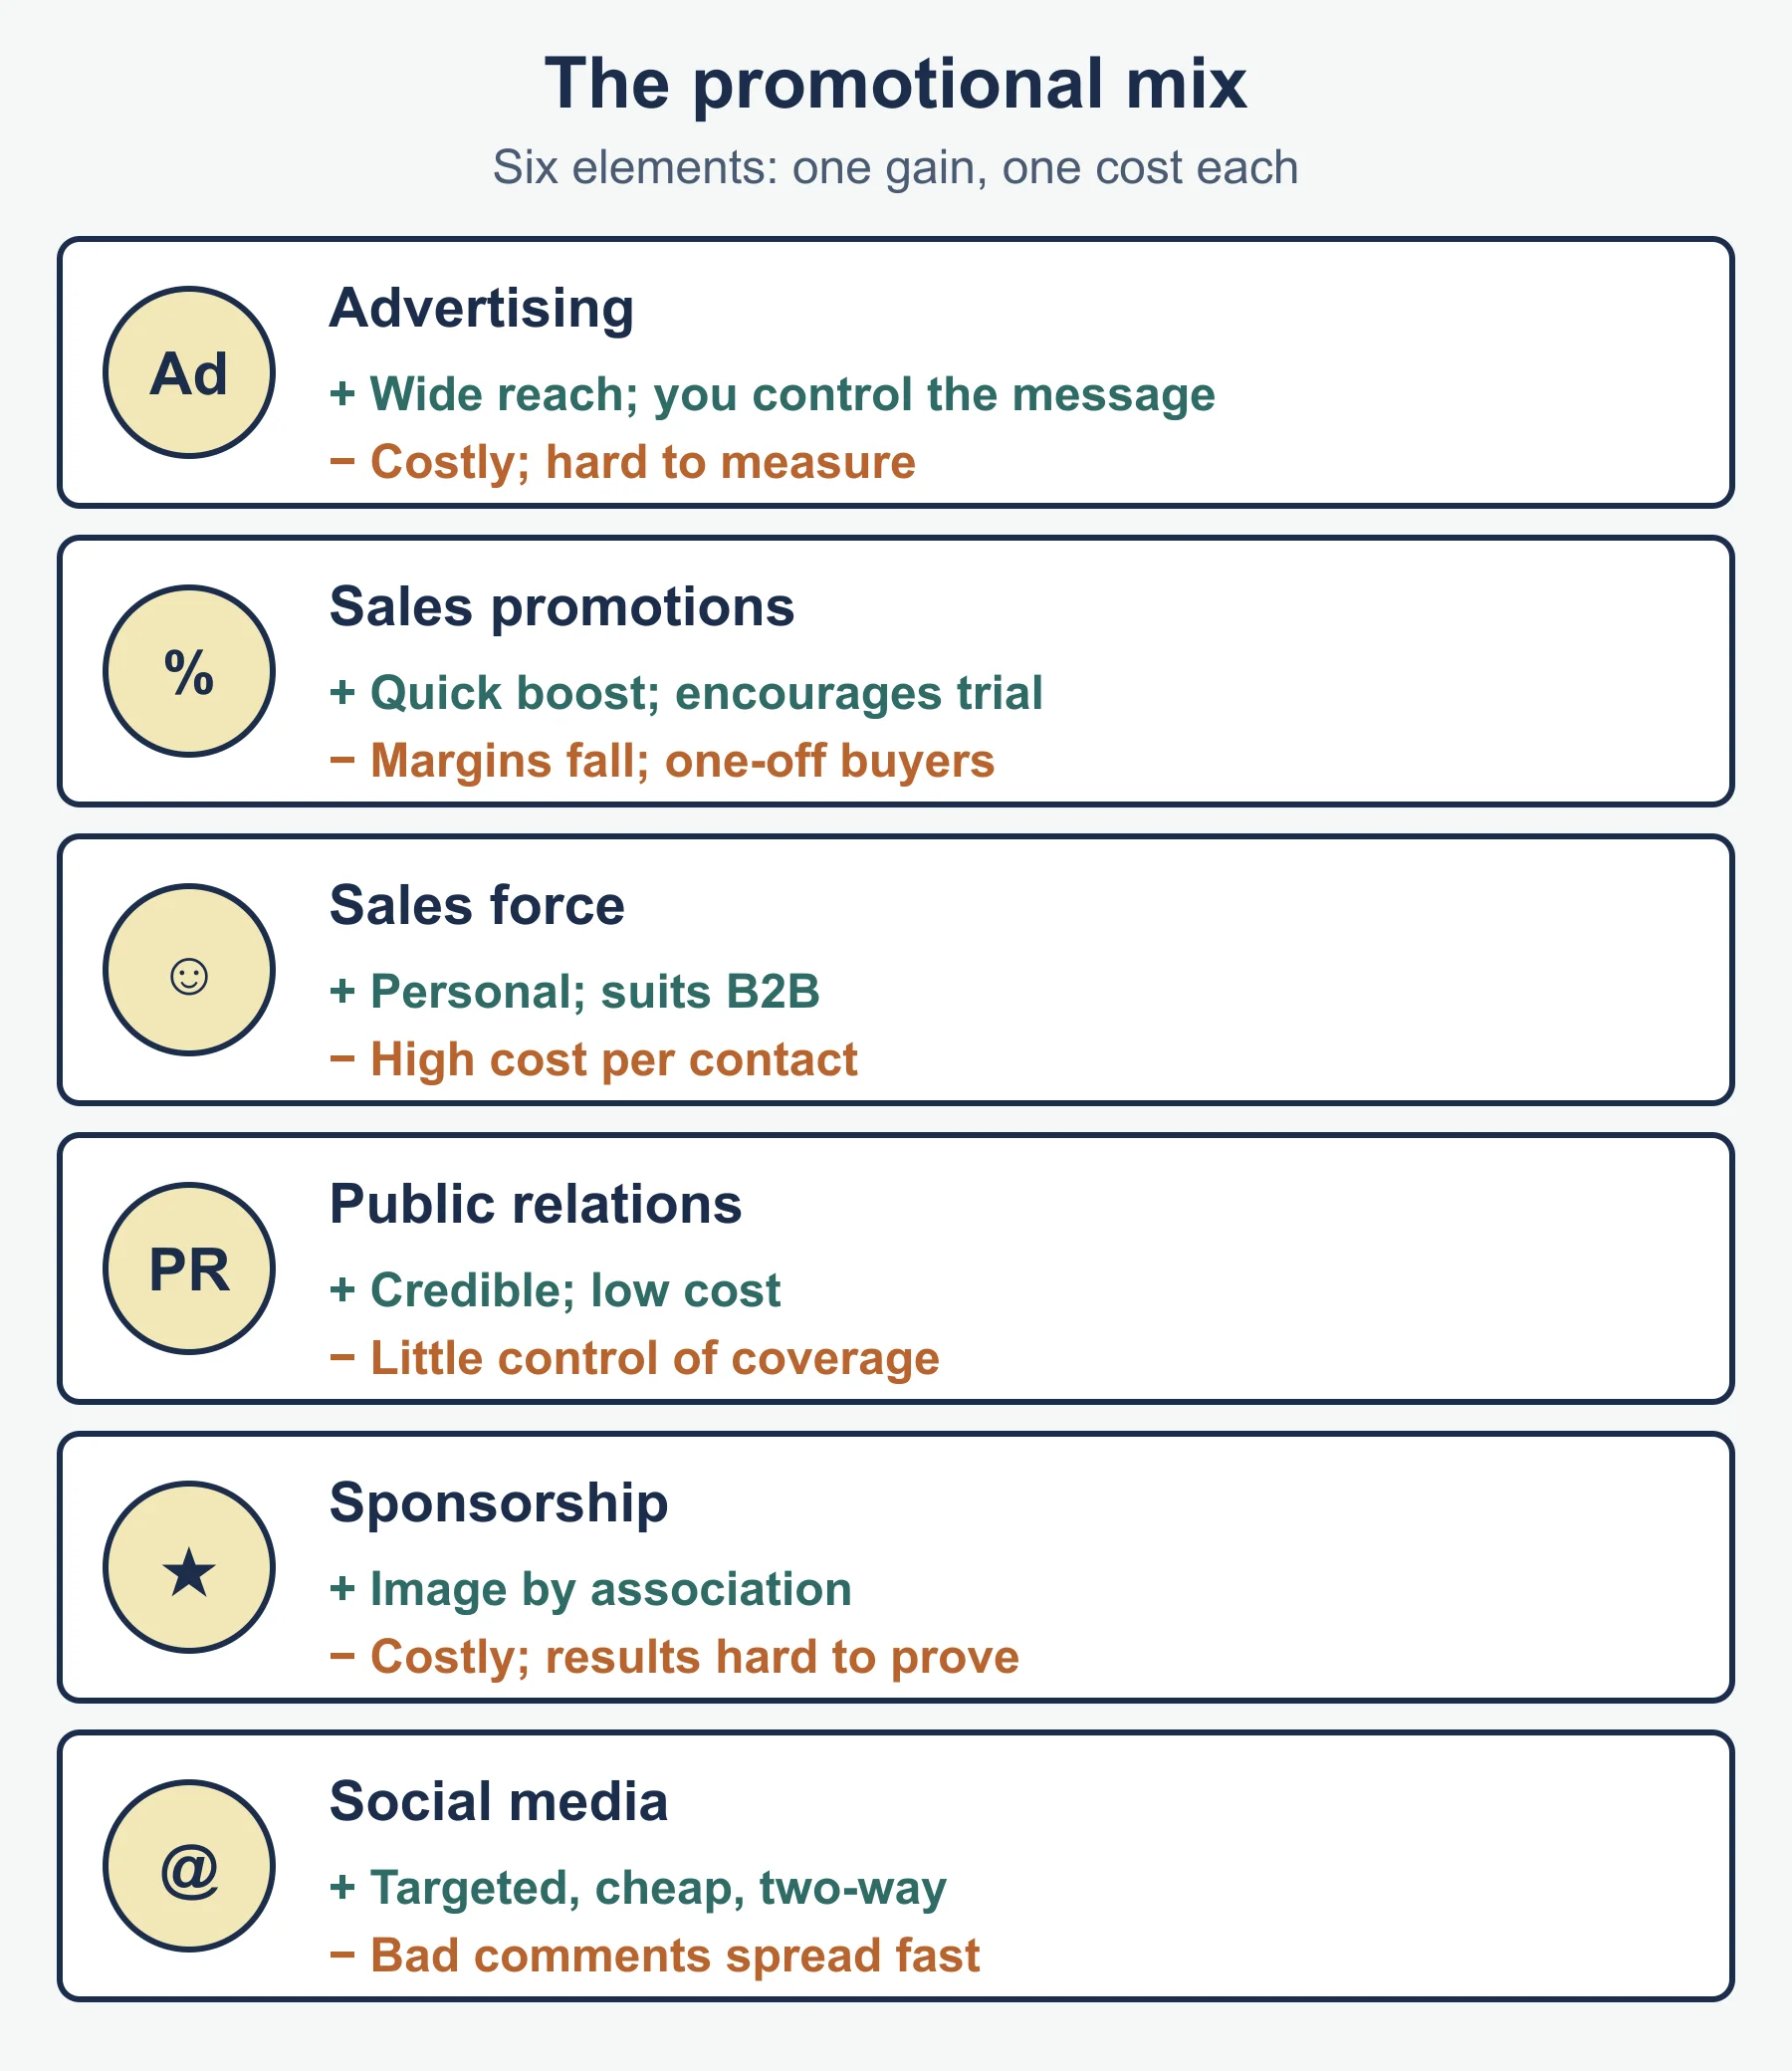
Purpose: inform, persuade, remind; build awareness and image; raise sales.
| Element | Strength | Weakness |
|---|---|---|
| Advertising | Reach, controlled message | Cost, hard to measure |
| Sales promotions | Quick boost, trial | Margin loss, one-off buyers |
| Sales force | Personal, suits B2B | Costly per contact |
| Public relations | Credible, cheap | Little control |
| Sponsorship | Image by association | Costly, results unclear |
| Social media | Targeted, two-way, measurable | Negative comments spread, needs management |
Influences on the mix: budget, target market’s media habits, product type, life cycle stage, competitors’ promotion, B2B or B2C.
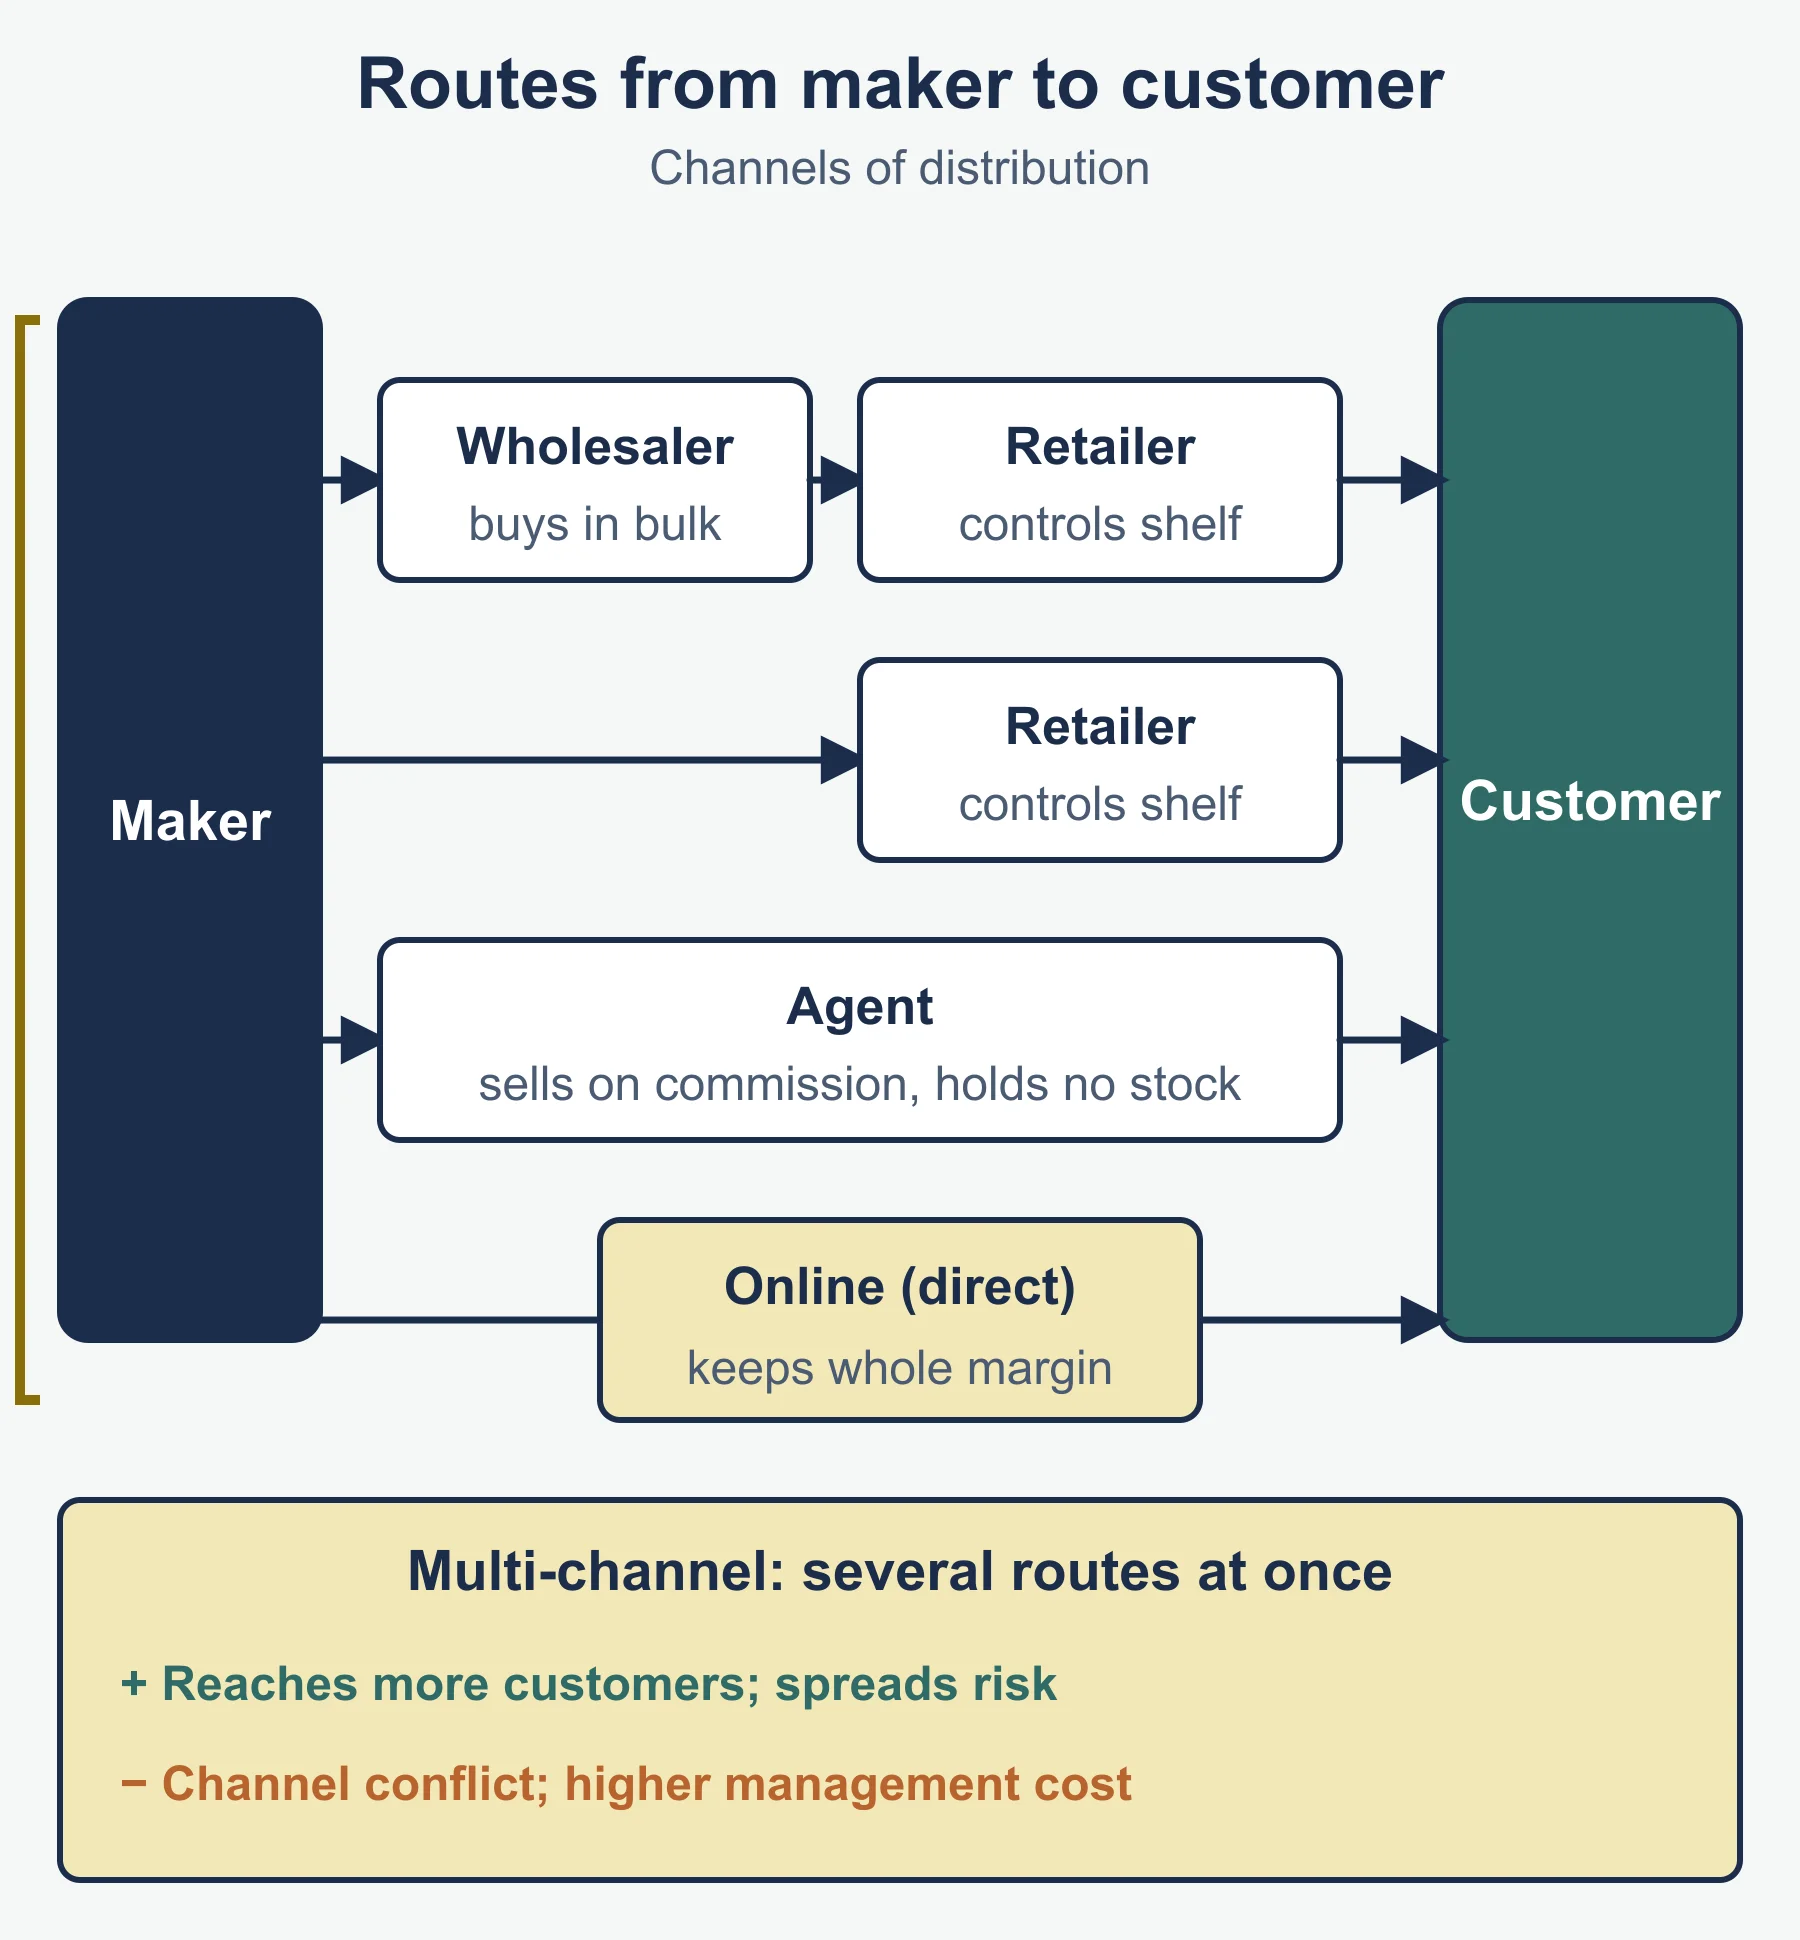
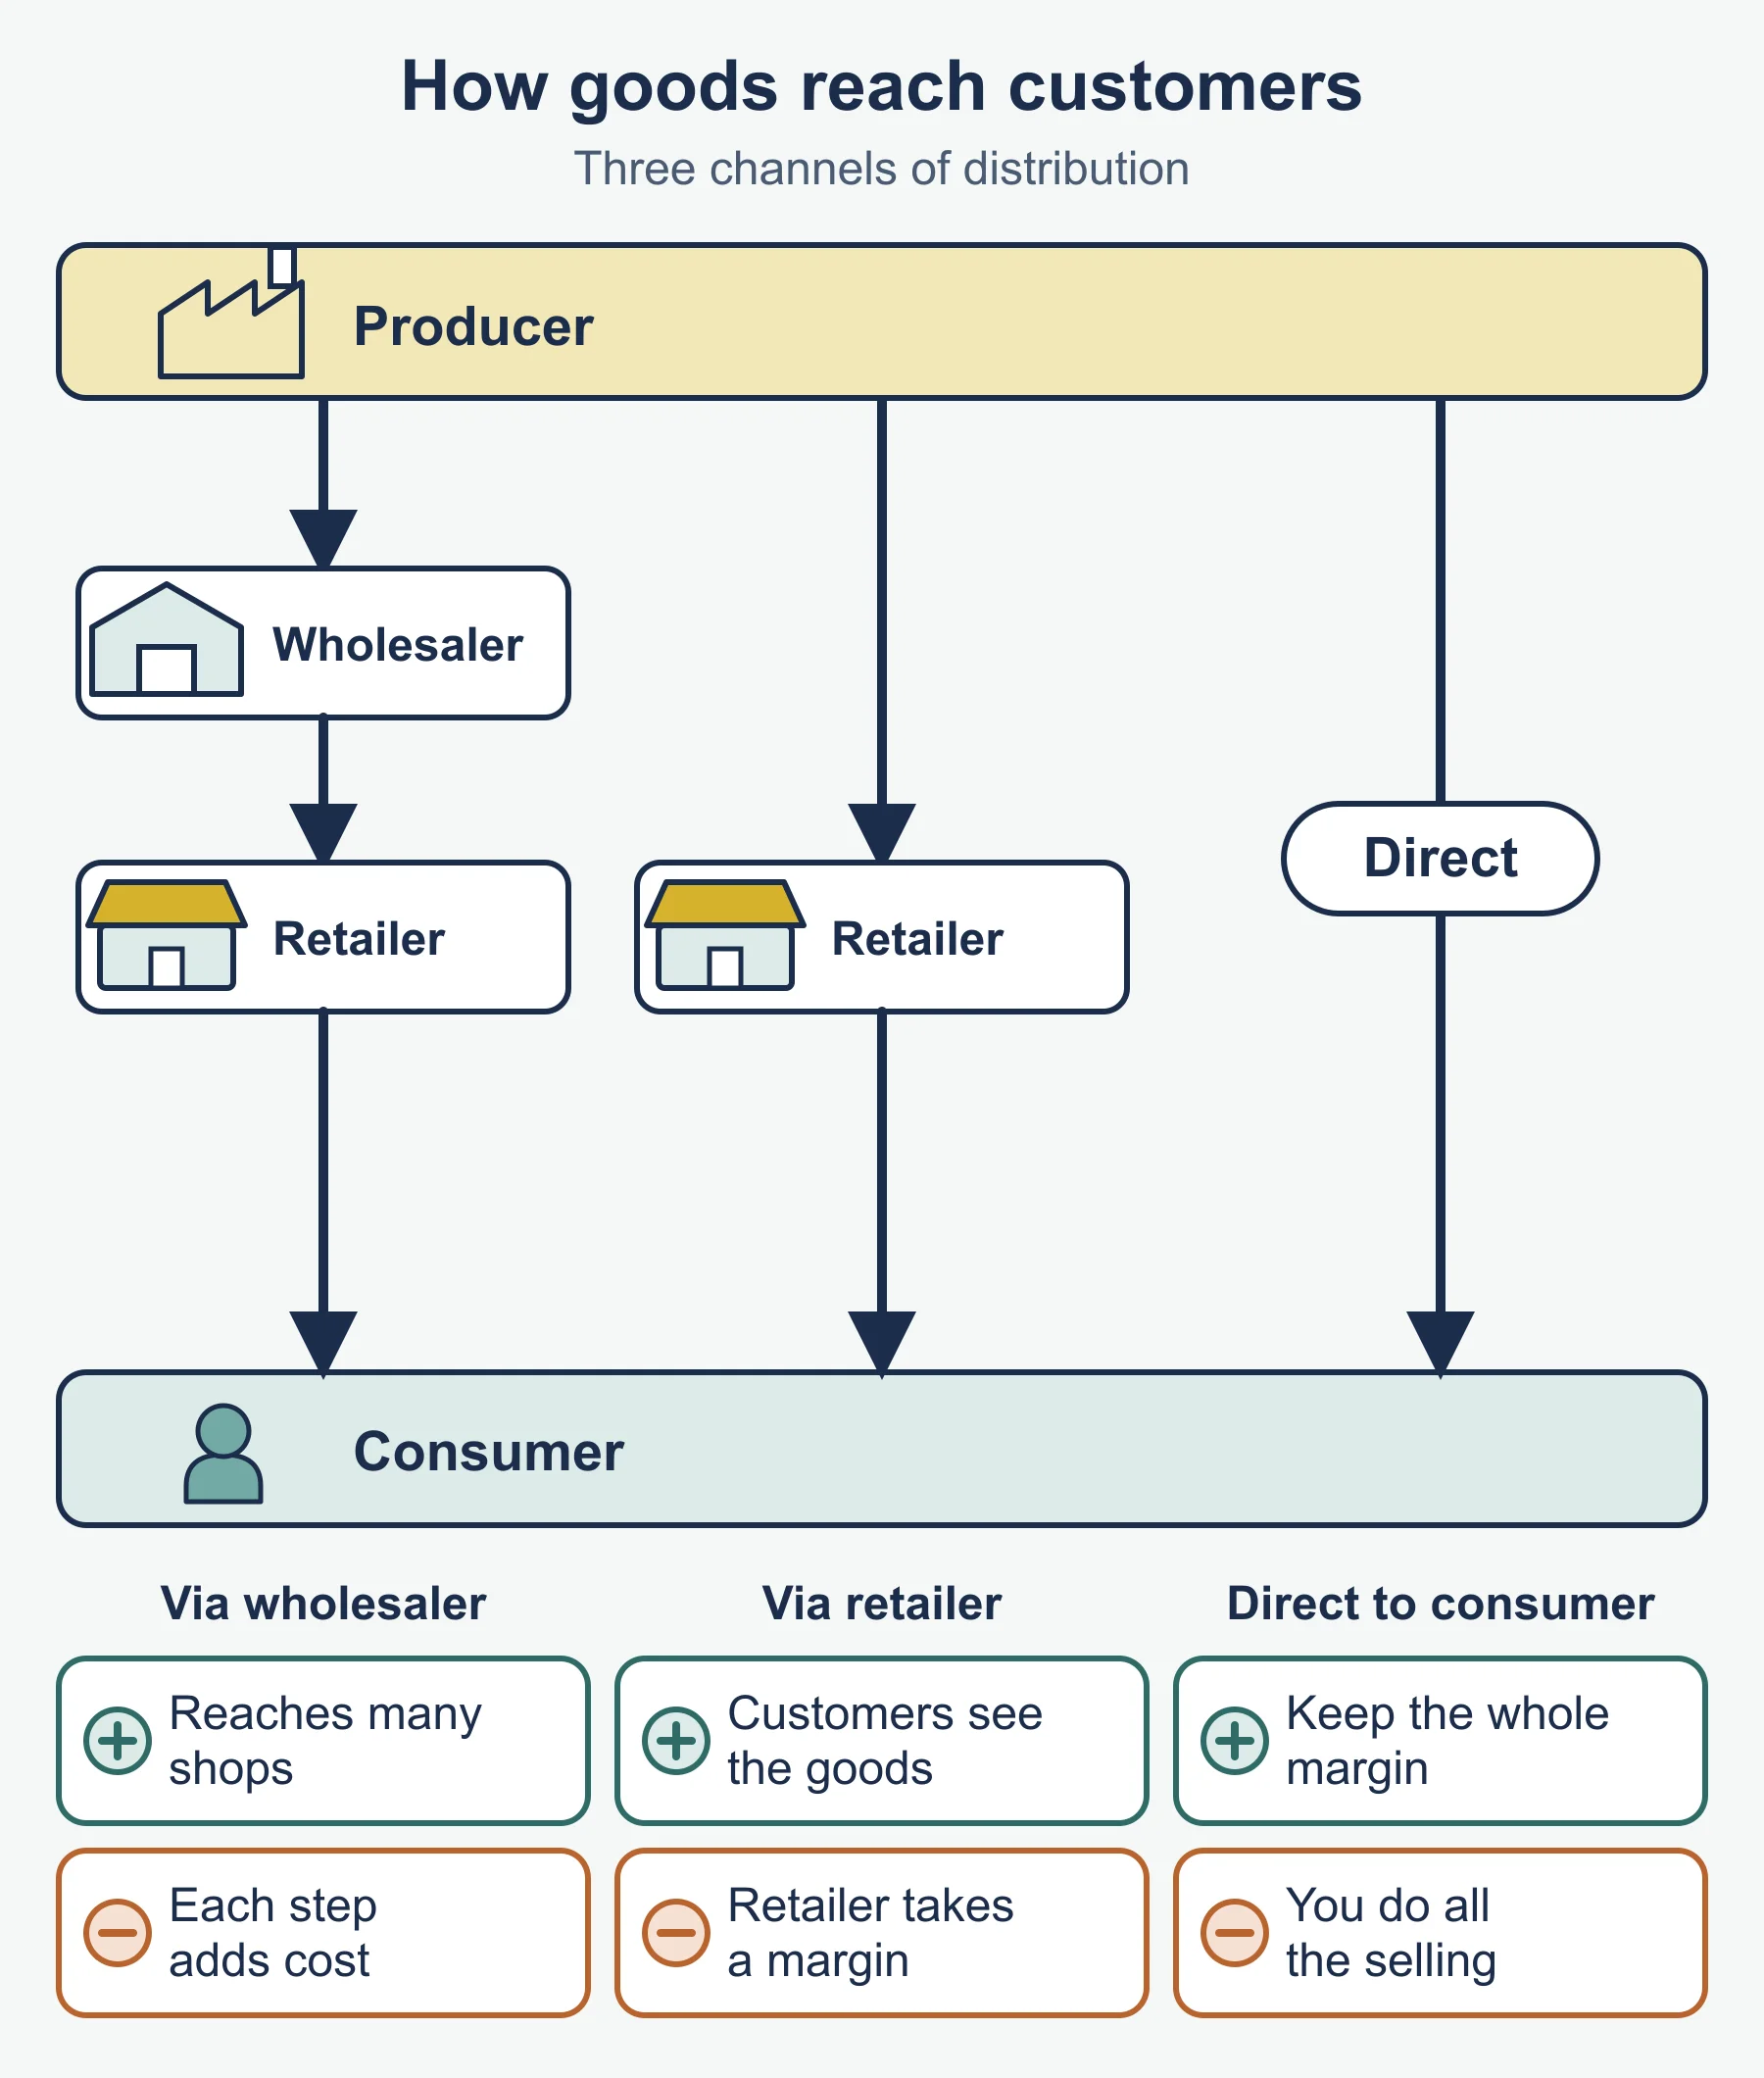
Place
| Route | Strength | Weakness |
|---|---|---|
| Wholesaler | Many outlets reached | Takes margin |
| Retailer | Display, convenience | Controls shelf space, wants discounts |
| Agent | Local knowledge, commission only | Less control |
| Online direct | Wide reach, whole margin | Delivery and service burden |
| Multi-channel | More customers, spreads risk | Channel conflict, higher cost |
Influences: product nature, target market habits, number of customers, channel cost, control wanted, competitors, technology.
If your course is 9625 (different content)
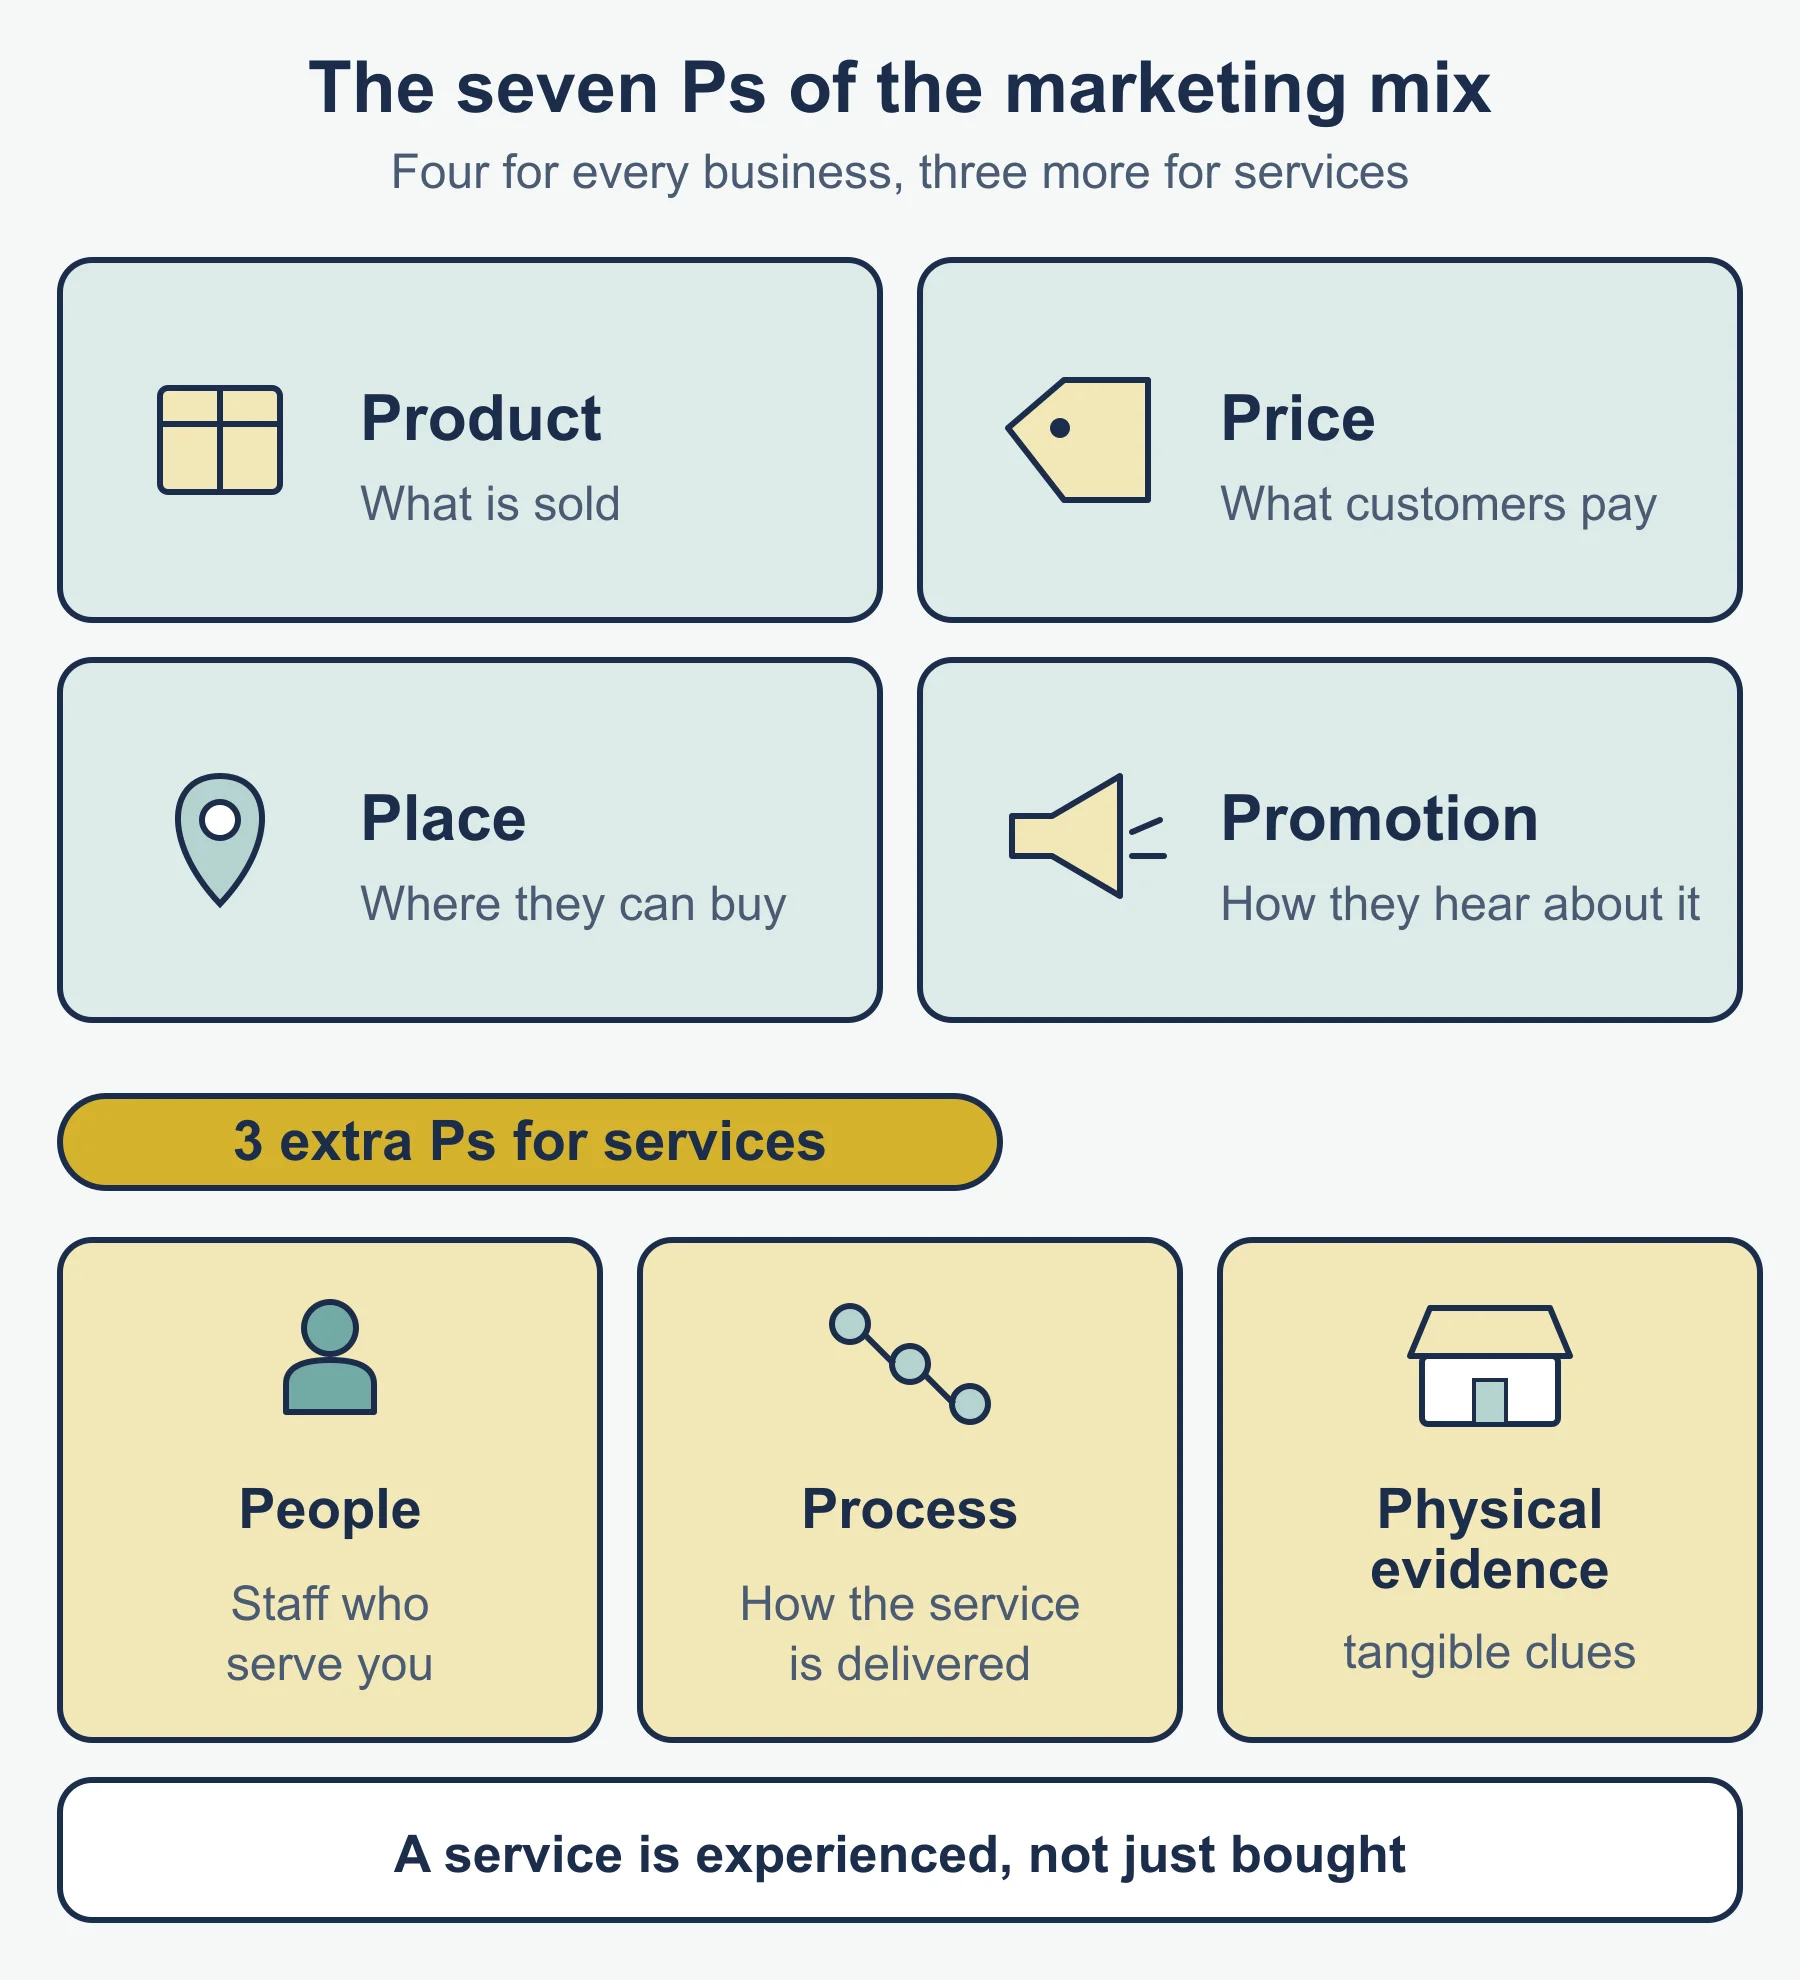
- 7Ps: product, price, promotion, place plus people, process, physical environment (influences on these). Consider goods and services (industrial and consumer), B2B and B2C, national and international markets, e-commerce.
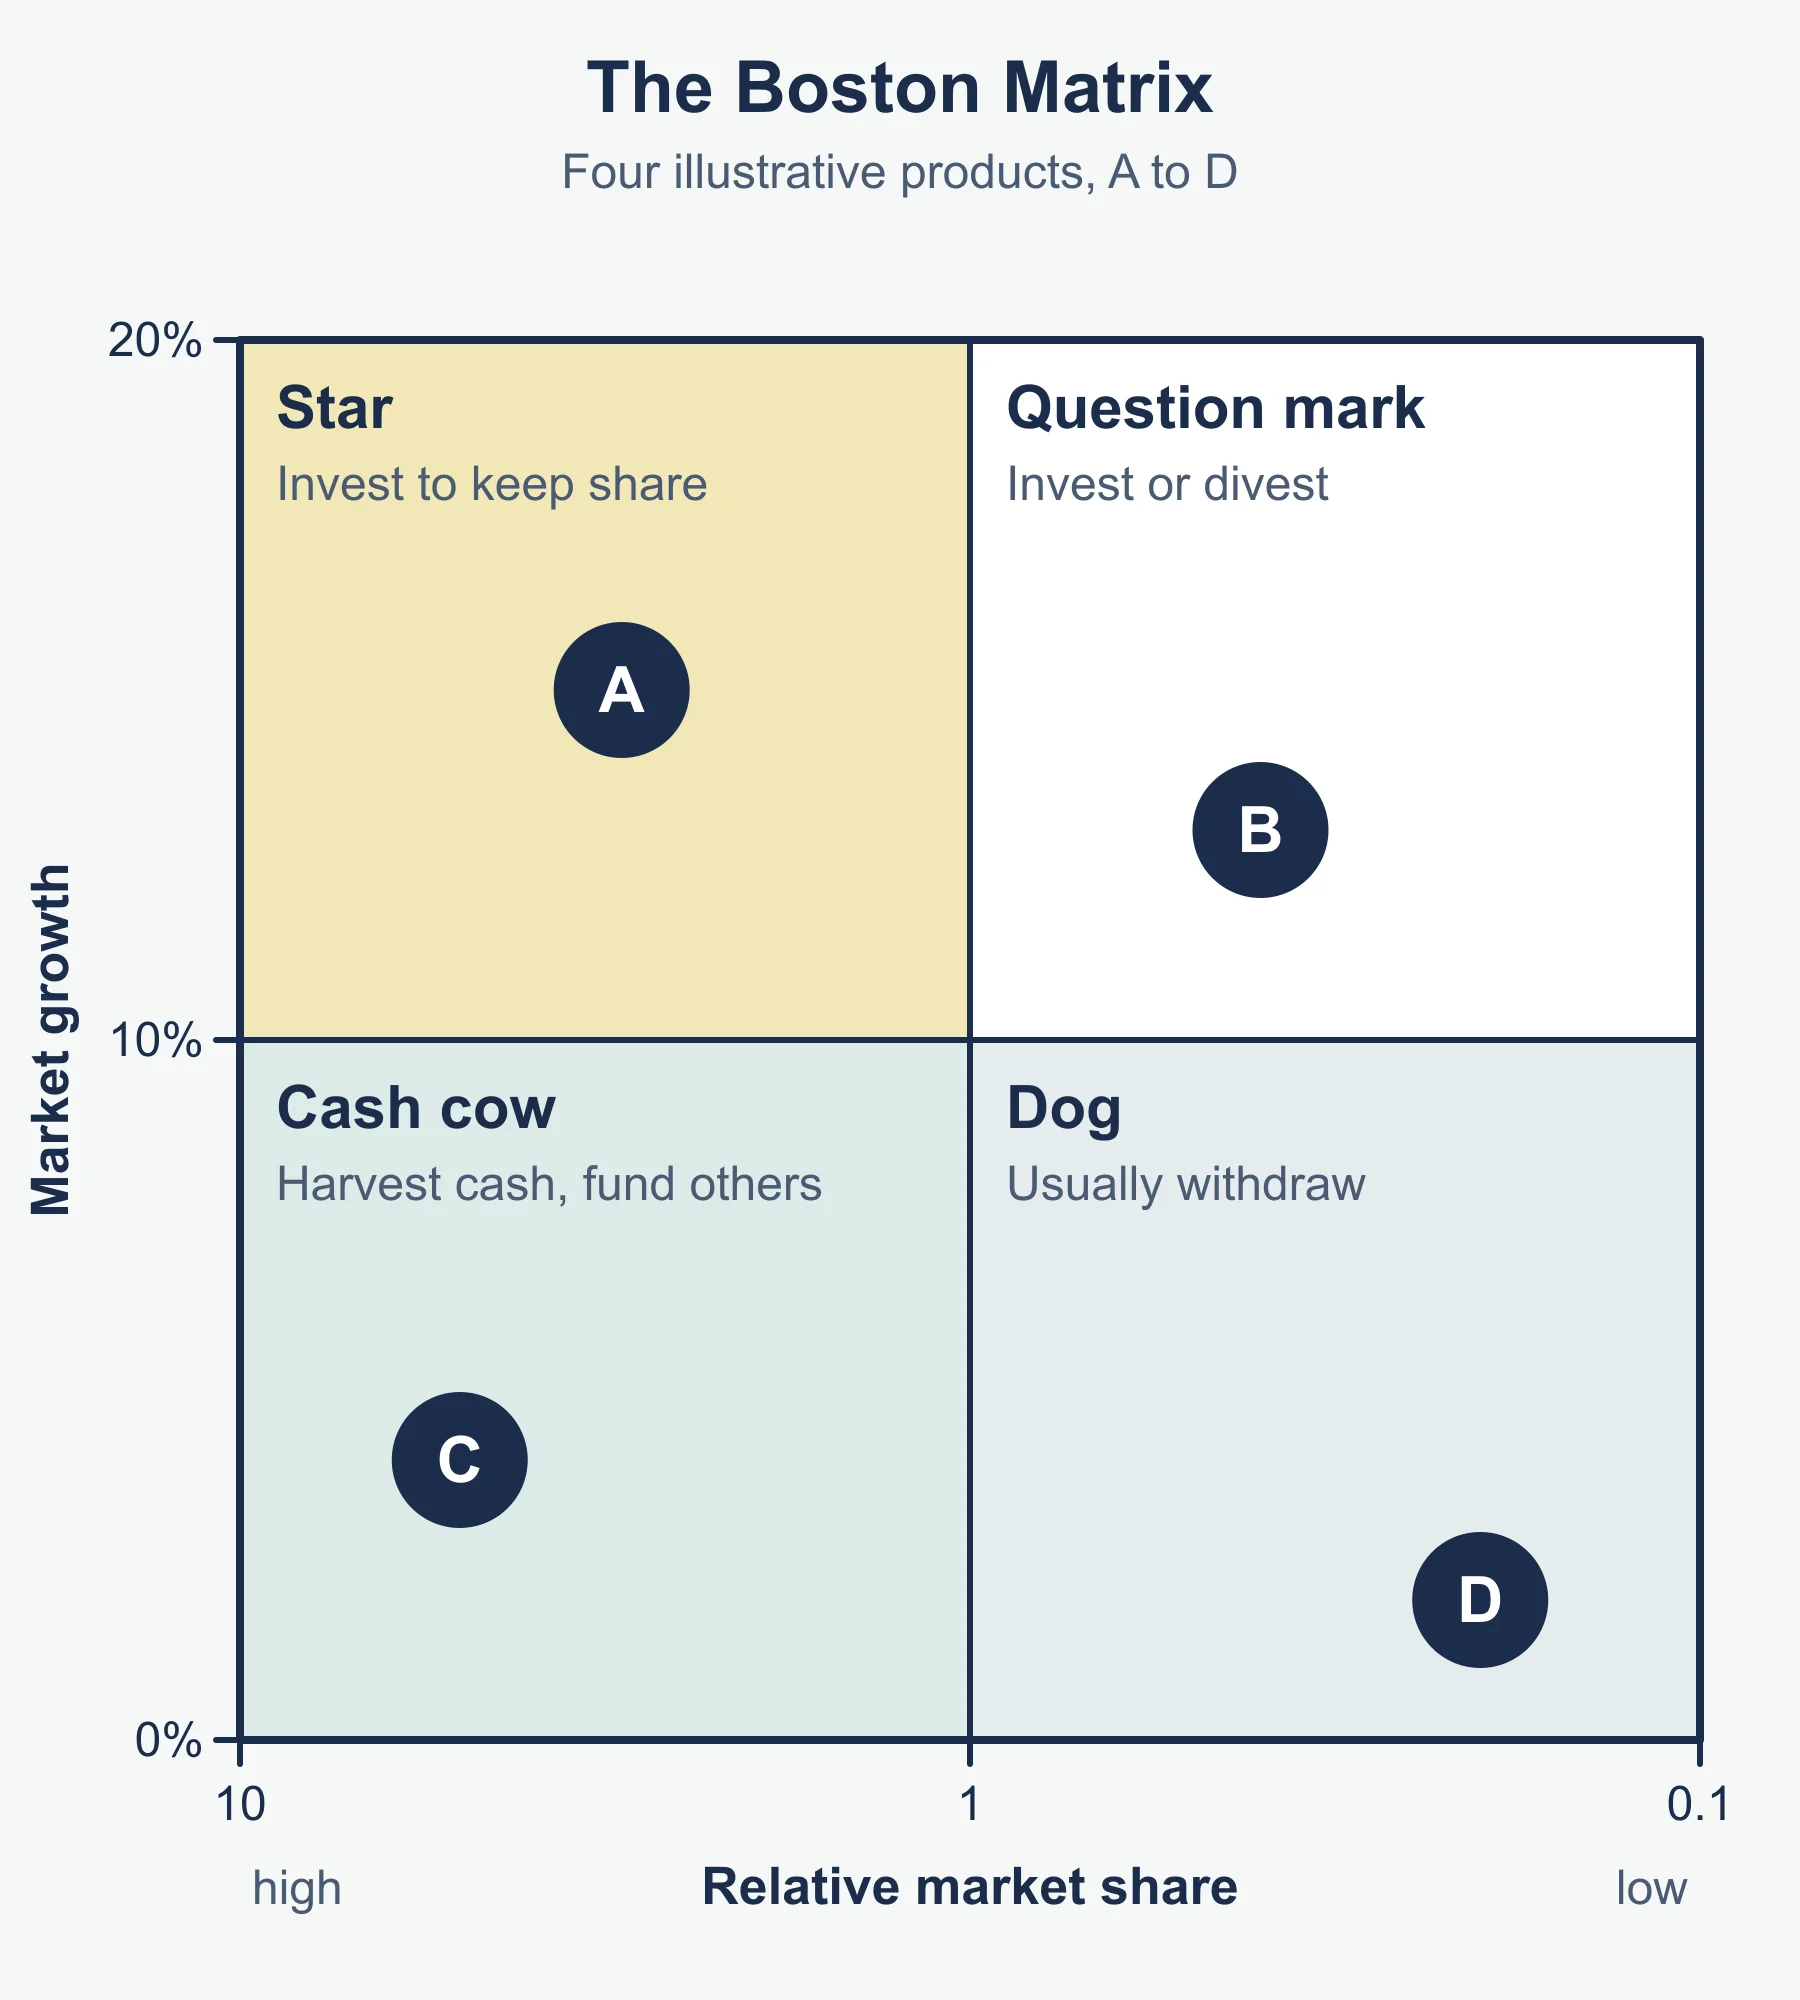
- Product: NPD influences and value; product life cycle stages and extension strategies; Boston Matrix (stars: high share, growing market; cash cows: high share, slow market; problem children: low share, growing market; dogs: low share, slow market; standard form); own label brands.
- Pricing: influences; skimming, penetration, price discrimination (selling one product at different prices to separate groups; writer’s wording). Interpret PED, analyse revenue effects, assess the value of PED to business.
- Promotion: advertising, sales promotions, sales force, public relations, exhibitions. Place: channels including online, multi-channel.
- The six NPD stages and cross-price elasticity are not printed in this 9625 section; ask your teacher.
Importance of marketing
- Technology: digital marketing, social media, dynamic pricing, e-commerce.
- Ethics: misleading promotions, targeting vulnerable groups.
- Competitiveness: good mix decisions win customers from rivals.
- Links: operations (capacity, quality), finance (budget), HR (skilled staff).
Must-know distinctions
- Penetration versus skimming: both are demand based. Penetration starts low to win share fast; skimming starts high to take profit from early buyers, then falls. Penetration needs price-sensitive buyers; skimming needs a distinctive product.
- Cost based versus competition based: cost-plus looks inwards at unit cost; going rate, premium and discount look outwards at rivals.
- Mark-up versus margin: mark-up is profit on cost; margin is profit on price. A 60% mark-up is a 37.5% margin.
- Substitutes versus complements: positive XED means a rival’s price rise lifts your sales; negative XED means a rise in one product’s price cuts sales of its partner product.
- Elastic versus inelastic: size above 1 or below 1, ignoring the sign.
- Wholesaler versus agent: a wholesaler buys and holds stock; an agent sells on commission and does not own the goods.
- Concept testing versus product testing: the first tests an idea or description; the second tests a working sample.
- Rebranding versus adapting: rebranding changes the image; adapting changes the product itself.
Method in steps: applying the mix to a case
- Identify the context: goods or service, B2B or B2C, and the target market.
- Pick the element the question is about, and name the specific method or channel.
- Link it to a fact from the case (a figure, a rival, a budget).
- Say what it leads to for sales, revenue, costs or image.
- For analyse, develop the chain of cause and effect. For evaluate or justify, weigh both sides and reach a judgement that says what it depends on.
Small reminders
NPD in action. Wetherup Pens tests a written description of a refillable pen on 80 office workers. That is concept testing, not product testing, because no working sample exists yet. Only after business analysis shows an acceptable profit does it build prototypes.
Dynamic pricing. An online ticket seller raises prices as seats sell and lowers them as the event nears with seats unsold. Prices follow demand, so this is demand based. The risk is that regular buyers see the changes as unfair.
Ethics. A snack advertised as a healthy choice when it is high in sugar is a misleading promotion. A game that pushes in-app purchases at young children is targeting a vulnerable group. In an evaluation answer, weigh the short-term sales against loss of trust and reputation.
Quick self-test
- List the six stages of NPD in order.
- Wetherup Pens raises a pen from £25 to £27. Sales fall from 500 to 470 a month. Calculate PED and the change in revenue.
- Skirlaw Tools sees its sales rise 5% after a rival raises its price by 20%. Calculate XED and say what it shows.
- Oakenholt Toys makes a puzzle for £30. Calculate the price with a 60% mark-up.
- State the margin on that puzzle.
- A firm sells 1,000 units at £20 and its PED is −2. It cuts the price to £19. Calculate the new quantity and revenue.
- Define an own label brand.
- Pilsworth Cycles raises the price of its bikes by 10% and sells 8% fewer cycle locks. Calculate XED and state the relationship.
- Name the four extension strategies in the section.
- Give one risk of using an agent and one of using social media.
- Explain why the mix must be integrated.
Answers
- Idea generation, screening, concept testing, business analysis, product testing, launch.
- %ΔP = 2 ÷ 25 = +8%; %ΔQ = −30 ÷ 500 = −6%; PED = −6 ÷ 8 = −0.75 (inelastic). Revenue £12,500 to 27 × 470 = £12,690, a rise of £190.
- XED = +5 ÷ 20 = +0.25: weak substitutes.
- £30 × 1.6 = £48.
- (48 − 30) ÷ 48 = 37.5%.
- Price falls 5%, so quantity rises 10% to 1,100. Revenue before £20,000; after 19 × 1,100 = £20,900.
- A product sold under the retailer’s own name, rather than the manufacturer’s brand.
- XED = −8 ÷ 10 = −0.8: complements.
- Advertising, rebranding, lowering the price, adapting the product.
- Agent: less control over how the product is presented. Social media: negative comments spread quickly.
- Mixed messages confuse customers and waste spend; the elements should reinforce one positioning for one target market.
Where marks are usually lost
- Stating elastic or inelastic and stopping, without saying what happens to revenue.
- Using the wrong base for percentages (always divide by the original).
- Losing the sign on XED, so substitutes and complements are confused.
- Mixing up mark-up and margin.
- Listing NPD stages in the wrong order or naming them without applying them.
- Giving only advantages of an element when asked to weigh up its use.
- Describing a pricing method generically without linking it to the product, market or objective given.
- Ignoring B2B or B2C context when the case makes it clear.
Frequently asked questions
What are the six stages of new product development? The six stages, in order, are idea generation, screening, concept testing, business analysis, product testing and launch.
What are the four extension strategies in OxfordAQA Business? The four extension strategies are advertising, rebranding, lowering the price and adapting the product. They are used at maturity to delay decline.
What does the sign of cross-price elasticity of demand show? A positive XED shows the two products are substitutes, while a negative XED shows they are complements.
What is the difference between penetration and skimming pricing? Both are demand-based. Penetration starts with a low price to win market share fast and needs price-sensitive buyers, while skimming starts high to take profit from early buyers and then falls, and needs a distinctive product.
Official syllabus
OxfordAQA International AS and A-level Business specification, section 3.1.2.4 The marketing mix. Text read: 9725 Version 1.1 (4Ps) and 9625 Version 3.1 (7Ps); the two differ. Published by OxfordAQA.
Get free revision emails (optional)
Occasional emails with practice questions, worked explanations and links to free resources for the qualification and subjects you choose. No spam, and you can unsubscribe from any email. The free tools on this site never need an email.
Related resources
-
Study guides
OxfordAQA A-Level Business: Marketing objectives and plans and Marketing data (9625/9725)
Study guide to OxfordAQA International AS Business marketing objectives, plans, market research, sampling and data interpretation, with worked examples.
Business · OxfordAQA · AS Level
Read guide -
Practice questions
OxfordAQA A-Level Business: Marketing objectives and plans and Marketing data (9625/9725) – Practice Questions
Original practice questions with worked answers on OxfordAQA International AS Business marketing objectives, plans, market research and data.
Business · OxfordAQA · AS Level
Try questions -
Revision notes
OxfordAQA A-Level Business: Marketing objectives and plans and Marketing data (9625/9725) – Revision Notes
Condensed OxfordAQA International AS Business revision notes on marketing objectives, plans, research, sampling and data interpretation, with a self-test.
Business · OxfordAQA · AS Level
Revise topic
Related articles
-
teaching
A Level tuition in Dubai: Cambridge or Pearson Edexcel International A Level?
Schools in Dubai and Abu Dhabi teach either Cambridge International AS & A Level or Pearson Edexcel International A Level. How the two are structured, why it matters for tuition, and how online classes from Lahore work.
9 October 2026
-
curriculum guides
Choosing subjects at IGCSE and A Level
How subject choices at 14 and 16 affect university options later, and how to keep pathways open without overloading a timetable.
28 July 2026
Studying this with a teacher
Working through Business AS LEVEL?
This page is free and stays free. If you would rather be taught it, Marlbridge runs Business classes one-to-one and in small groups of up to 15, online in your own time zone. The first trial class is free. WhatsApp replies within an hour (8am–11pm Pakistan time, every day); email the same day.
OxfordAQA Business teachers at Marlbridge
