
Revision Notes
AQA A-level Biology: Transport Across Cell Membranes and Required Practicals 3 and 4 (7402) – Revision Notes
Condensed AQA A-level Biology 7402 notes on 3.2.3: the fluid-mosaic model, diffusion, osmosis, active transport, co-transport and Required Practicals 3 and 4.
- Subject
- Biology
- Level
- A LEVEL (AS CONTENT)
- Topic
- Transport Across Cell Membranes and Required Practicals 3 and 4
- Author
- Marlbridge Academic Team
- Updated
- Reviewed by
- Hina Mogul (what this means)
Aligned to AQA A Level Biology (7402), For first teaching 2015. Official specification .
Syllabus page (what it covers and how it is assessed): AQA A Level Biology.
Syllabus points this page covers
7402 (AS content of the A Level)
- 3.2.3 Transport across cell membranes
This page covers 1 of the 6 subtopics recorded here in topic 2, Cells.
Found an error? Report a correction.
Need help with this topic? Request a free trial class for A Level Biology (7402).
Short notes for the final weeks. These notes follow section 3.2.3, Transport across cell membranes, in the AQA AS and A-level Biology specification (A-level 7402), for first teaching 2015, exams June 2016 onwards. The section is part of the AS content, so nothing here is marked A-level only. It includes Required practicals 3 and 4. Find the AQA A-level Biology hub, tick off topics on the checklist, and use the free diagnostics to find weak spots. Phospholipid structure is in the lipids and protein structure notes; absorption in the ileum is revisited in the exchange with the environment notes.
Key definitions
| Term | Meaning |
|---|---|
| Fluid-mosaic model | The model of membrane structure: a phospholipid bilayer in which the molecules can move (fluid), with proteins scattered through it (mosaic) |
| Simple diffusion | Net movement of molecules from a higher to a lower concentration, directly through the phospholipid bilayer; passive |
| Facilitated diffusion | Passive net movement down a concentration gradient through channel proteins or carrier proteins |
| Water potential (ψ) | A measure of the tendency of water molecules to move; measured in kPa; pure water is 0 kPa under standard conditions |
| Osmosis | Net movement of water from a higher (less negative) to a lower (more negative) water potential across a partially permeable membrane |
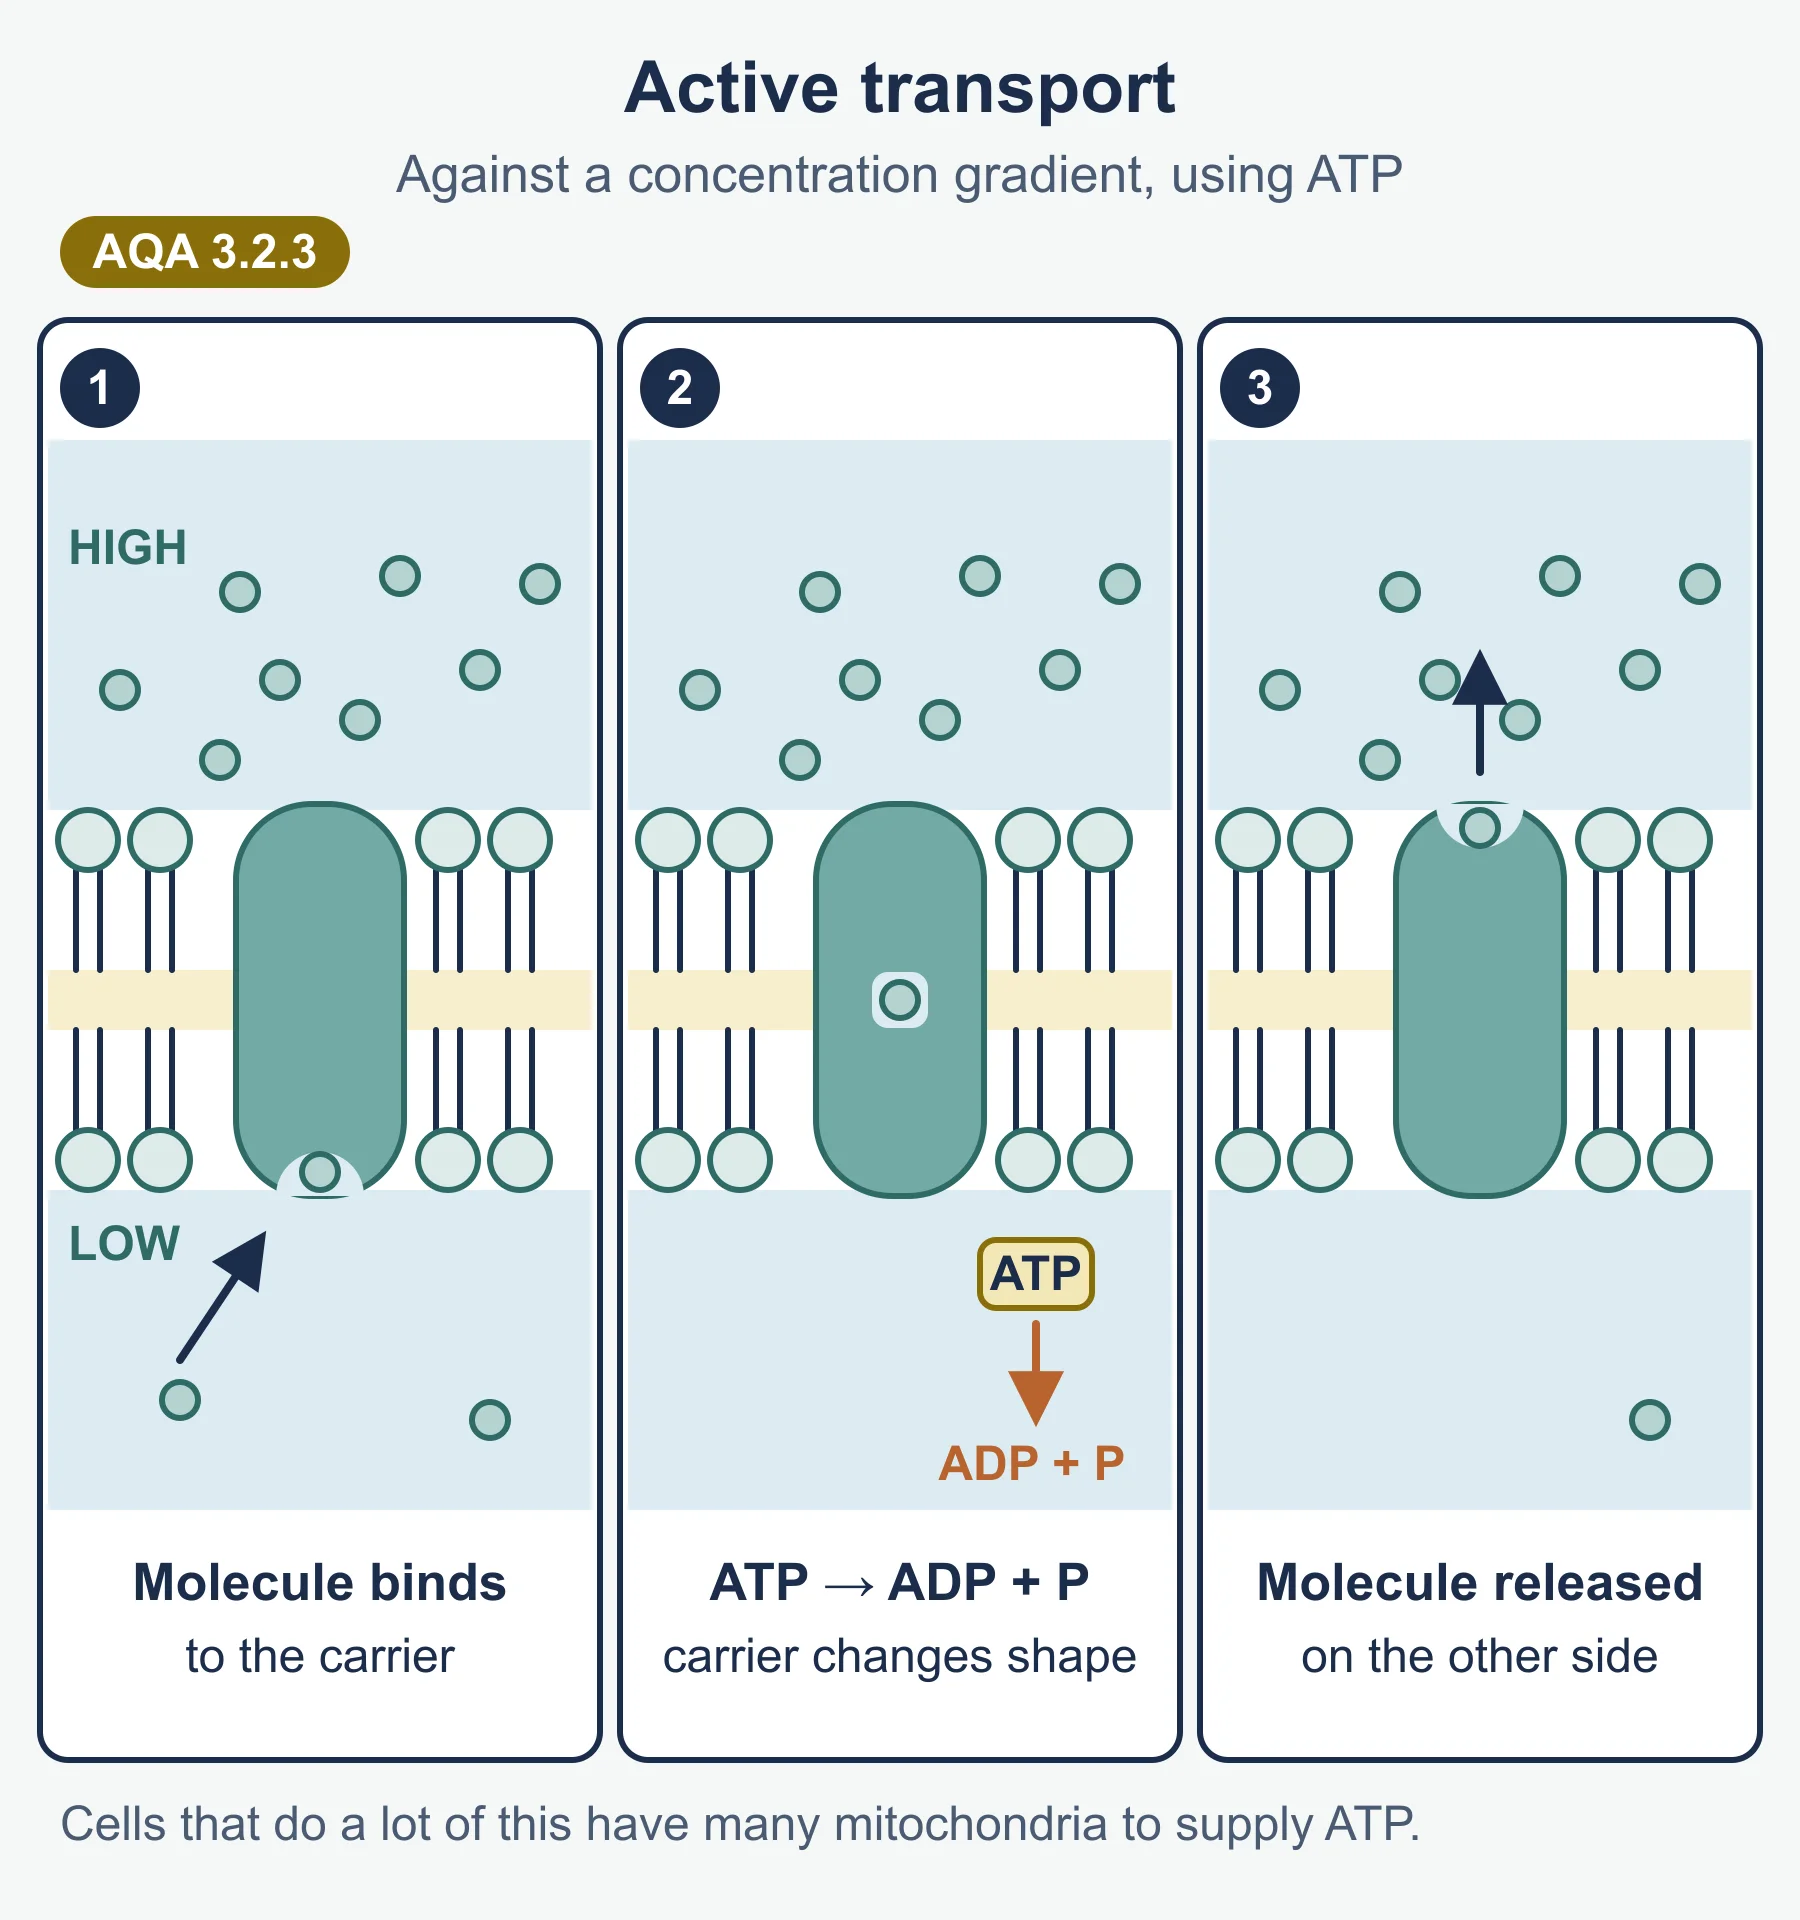
| Active transport | Movement of a substance against its concentration gradient by a carrier protein, using energy from the hydrolysis of ATP |
| Co-transport | Movement of two substances together through one carrier protein, where one moving down its gradient drives the other against its gradient |
| Calibration curve | A graph made from known standards, used to read off an unknown value |
One structure for every membrane
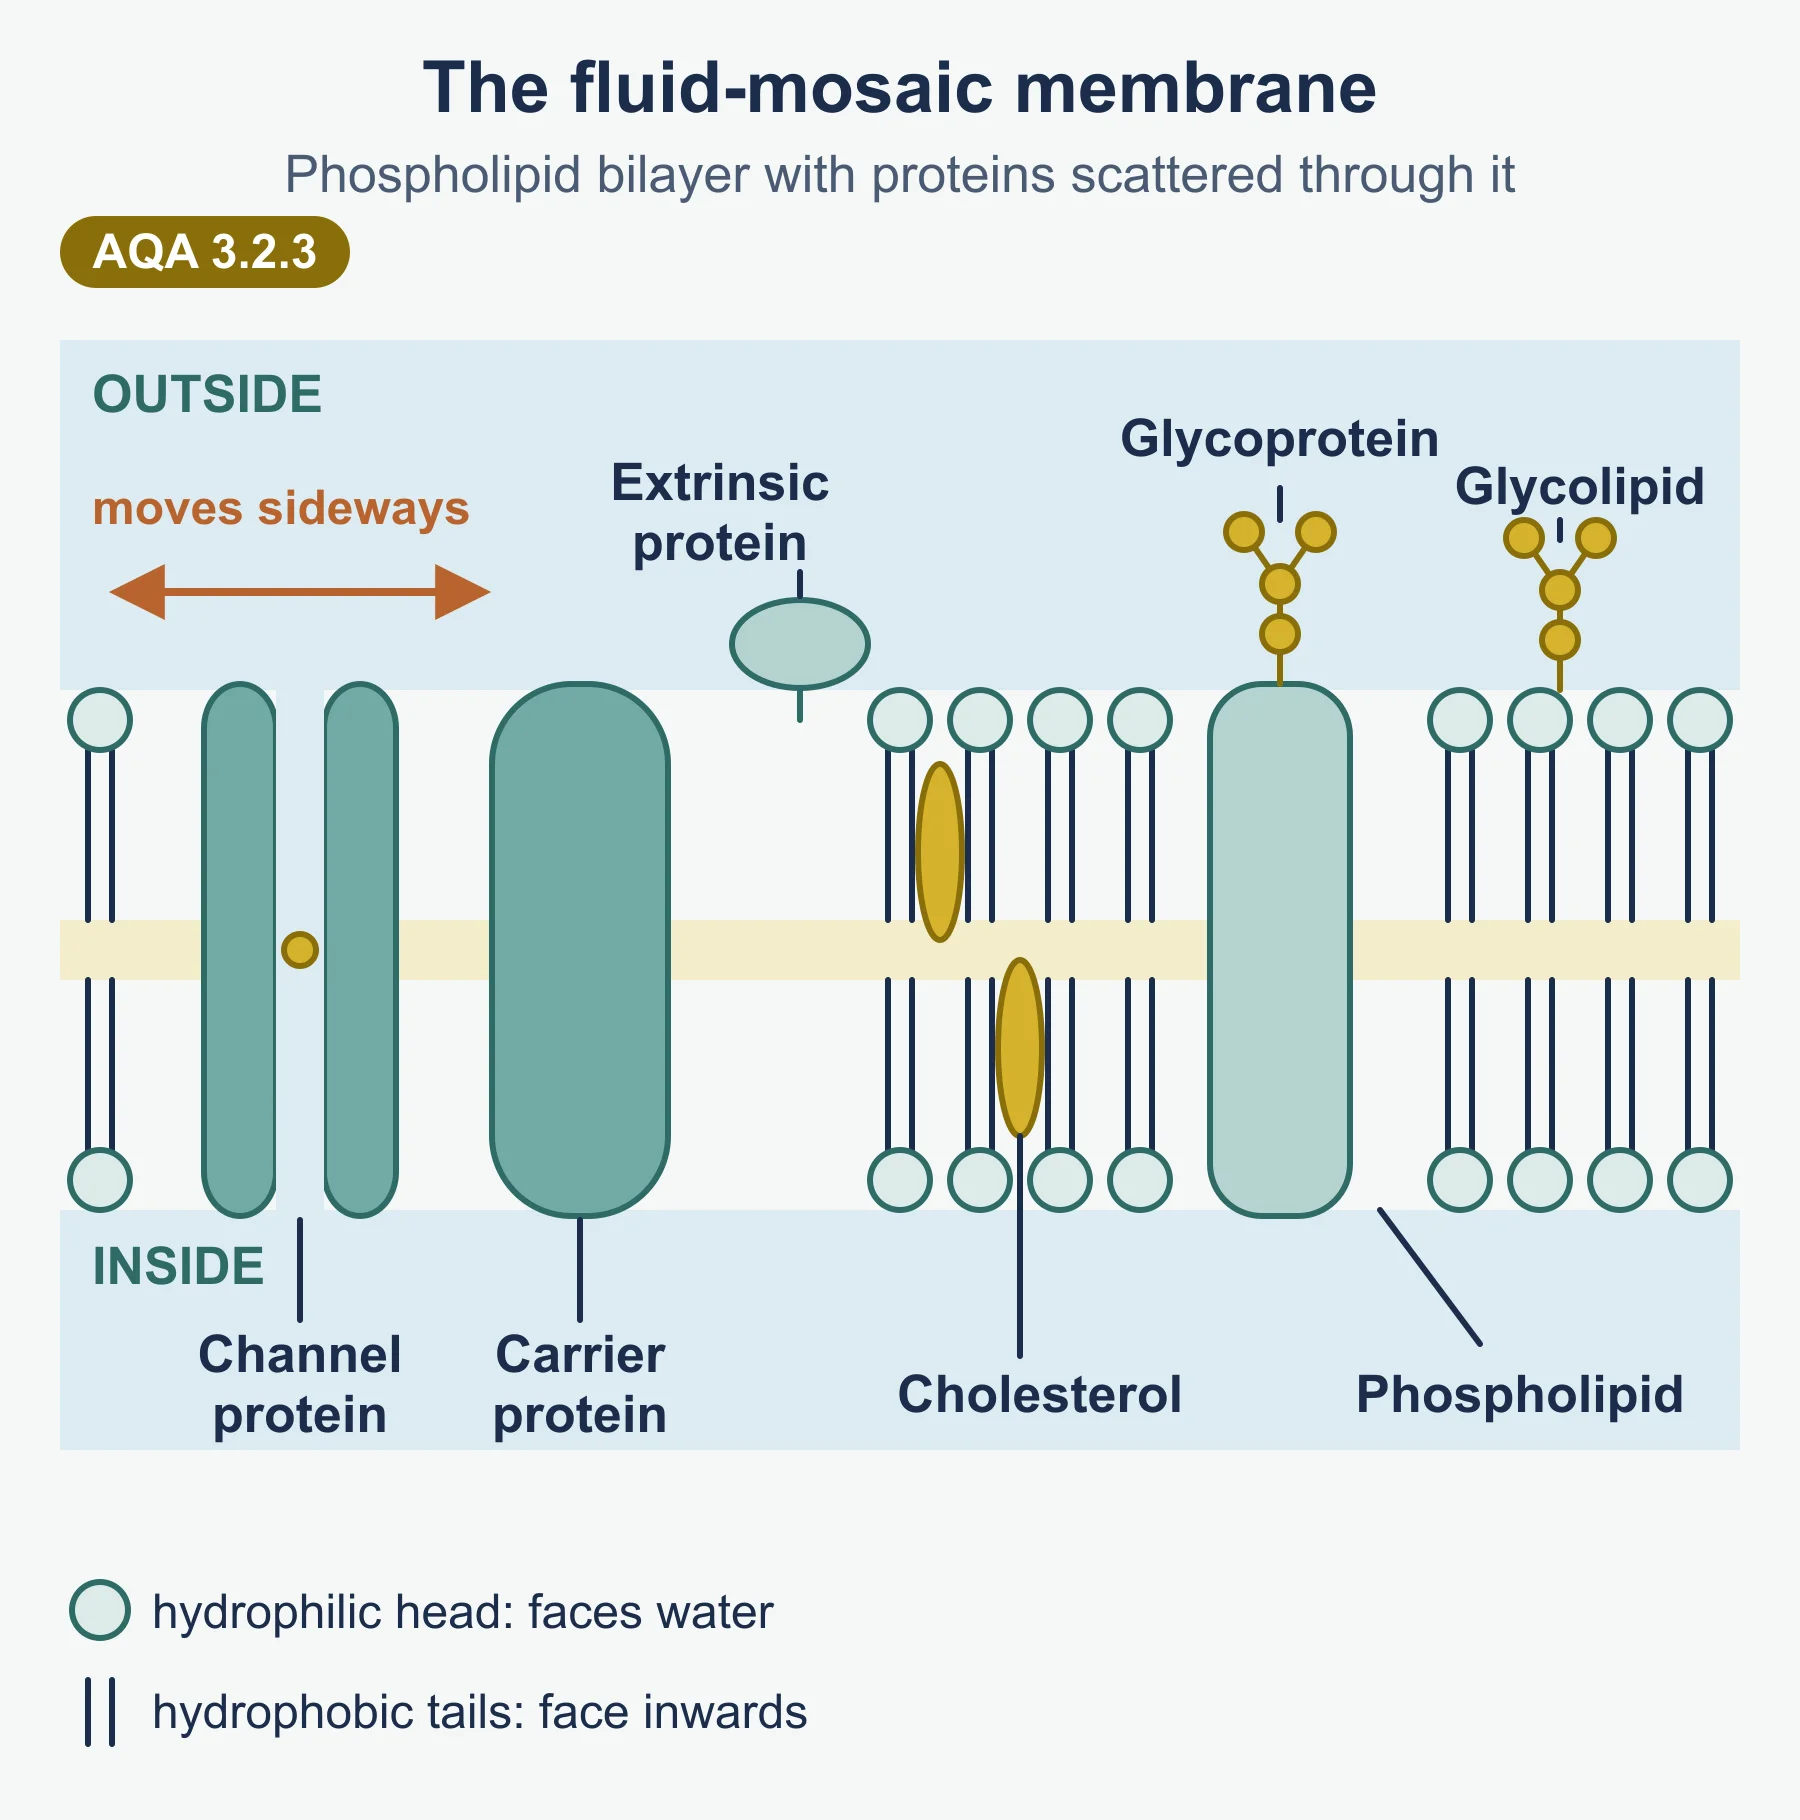
The cell-surface membrane and the membranes around eukaryotic organelles (nucleus, mitochondria, chloroplasts, ER, Golgi, lysosomes, vacuole) all have the same basic structure.
| Component | Arrangement | Movement and role |
|---|---|---|
| Phospholipids | A bilayer: hydrophilic phosphate heads face the water on each side; hydrophobic fatty acid tails point inwards | Move sideways within their layer, which makes the membrane fluid; the hydrophobic core stops water-soluble substances passing freely |
| Proteins | Some span the bilayer (channel and carrier proteins); others sit on one surface only | Many drift sideways in the bilayer; they transport substances, act as receptors or enzymes, or give structural support |
| Glycoproteins | Proteins with carbohydrate chains on the outer surface | Cell recognition, receptors (for example for hormones), and antigens |
| Glycolipids | Lipids with carbohydrate chains on the outer surface | Cell recognition and helping cells attach to one another |
| Cholesterol (may be present) | Between the phospholipids | Restricts the movement of other molecules in the membrane, so it is less fluid and more stable |
Five ways across a membrane
| Process | Passive or active? | Protein needed? | Direction | Typical substances |
|---|---|---|---|---|
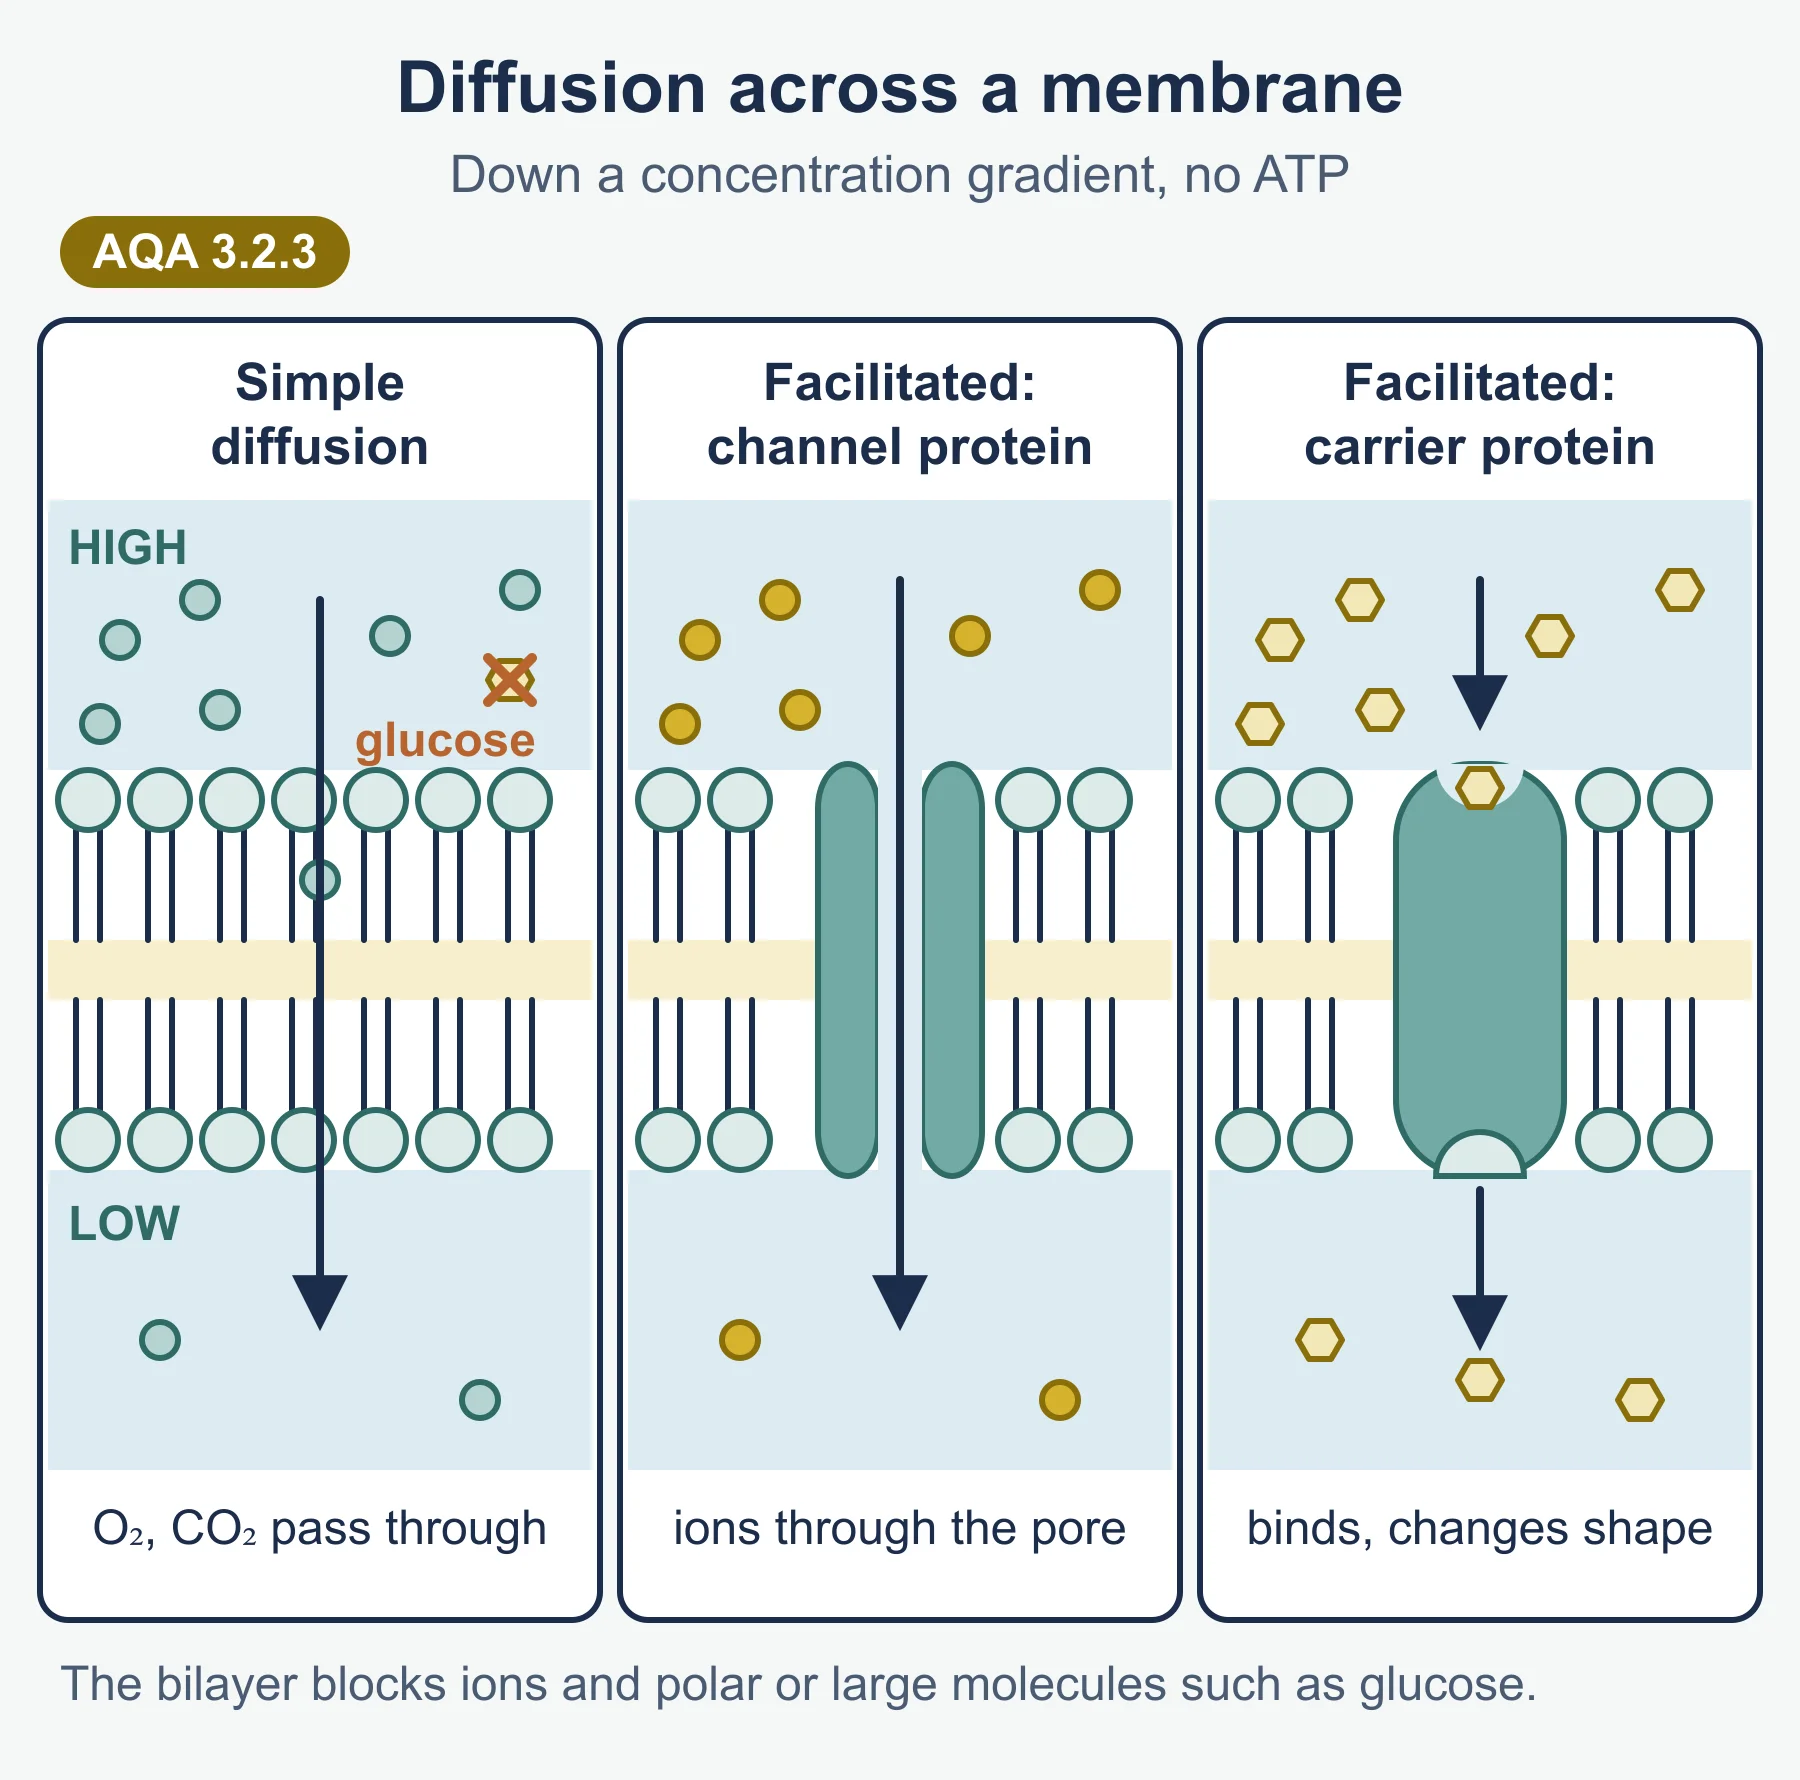
| Simple diffusion | Passive | No | Down the gradient | Small, non-polar or lipid-soluble molecules such as O₂ and CO₂ |
| Facilitated diffusion | Passive | Channel or carrier protein | Down the gradient | Ions and polar molecules such as glucose |
| Osmosis | Passive | No (water channels can help) | Higher ψ to lower ψ | Water |
| Active transport | Active (ATP) | Carrier protein | Against the gradient | Ions such as Na⁺ and K⁺, mineral ions in root hairs |
| Co-transport | Driven by a gradient set up by active transport | Co-transporter (carrier) protein | One down, one against its gradient | Na⁺ with glucose (or amino acids) in the ileum |
Why simple diffusion is limited
The centre of the bilayer is hydrophobic. Ions and polar molecules cannot pass through it easily, and large molecules are too big. These need proteins.
Channel versus carrier proteins
- Channel proteins form water-filled pores for particular ions. Many can open and close.
- Carrier proteins bind a specific molecule, then change shape to release it on the other side. In facilitated diffusion no ATP is used; in active transport the shape change is driven by ATP hydrolysis.
Active transport and ATP
ATP is hydrolysed to ADP and inorganic phosphate, releasing energy. This energy changes the shape of the carrier protein so the substance is moved against its concentration gradient. Cells doing a lot of active transport have many mitochondria.
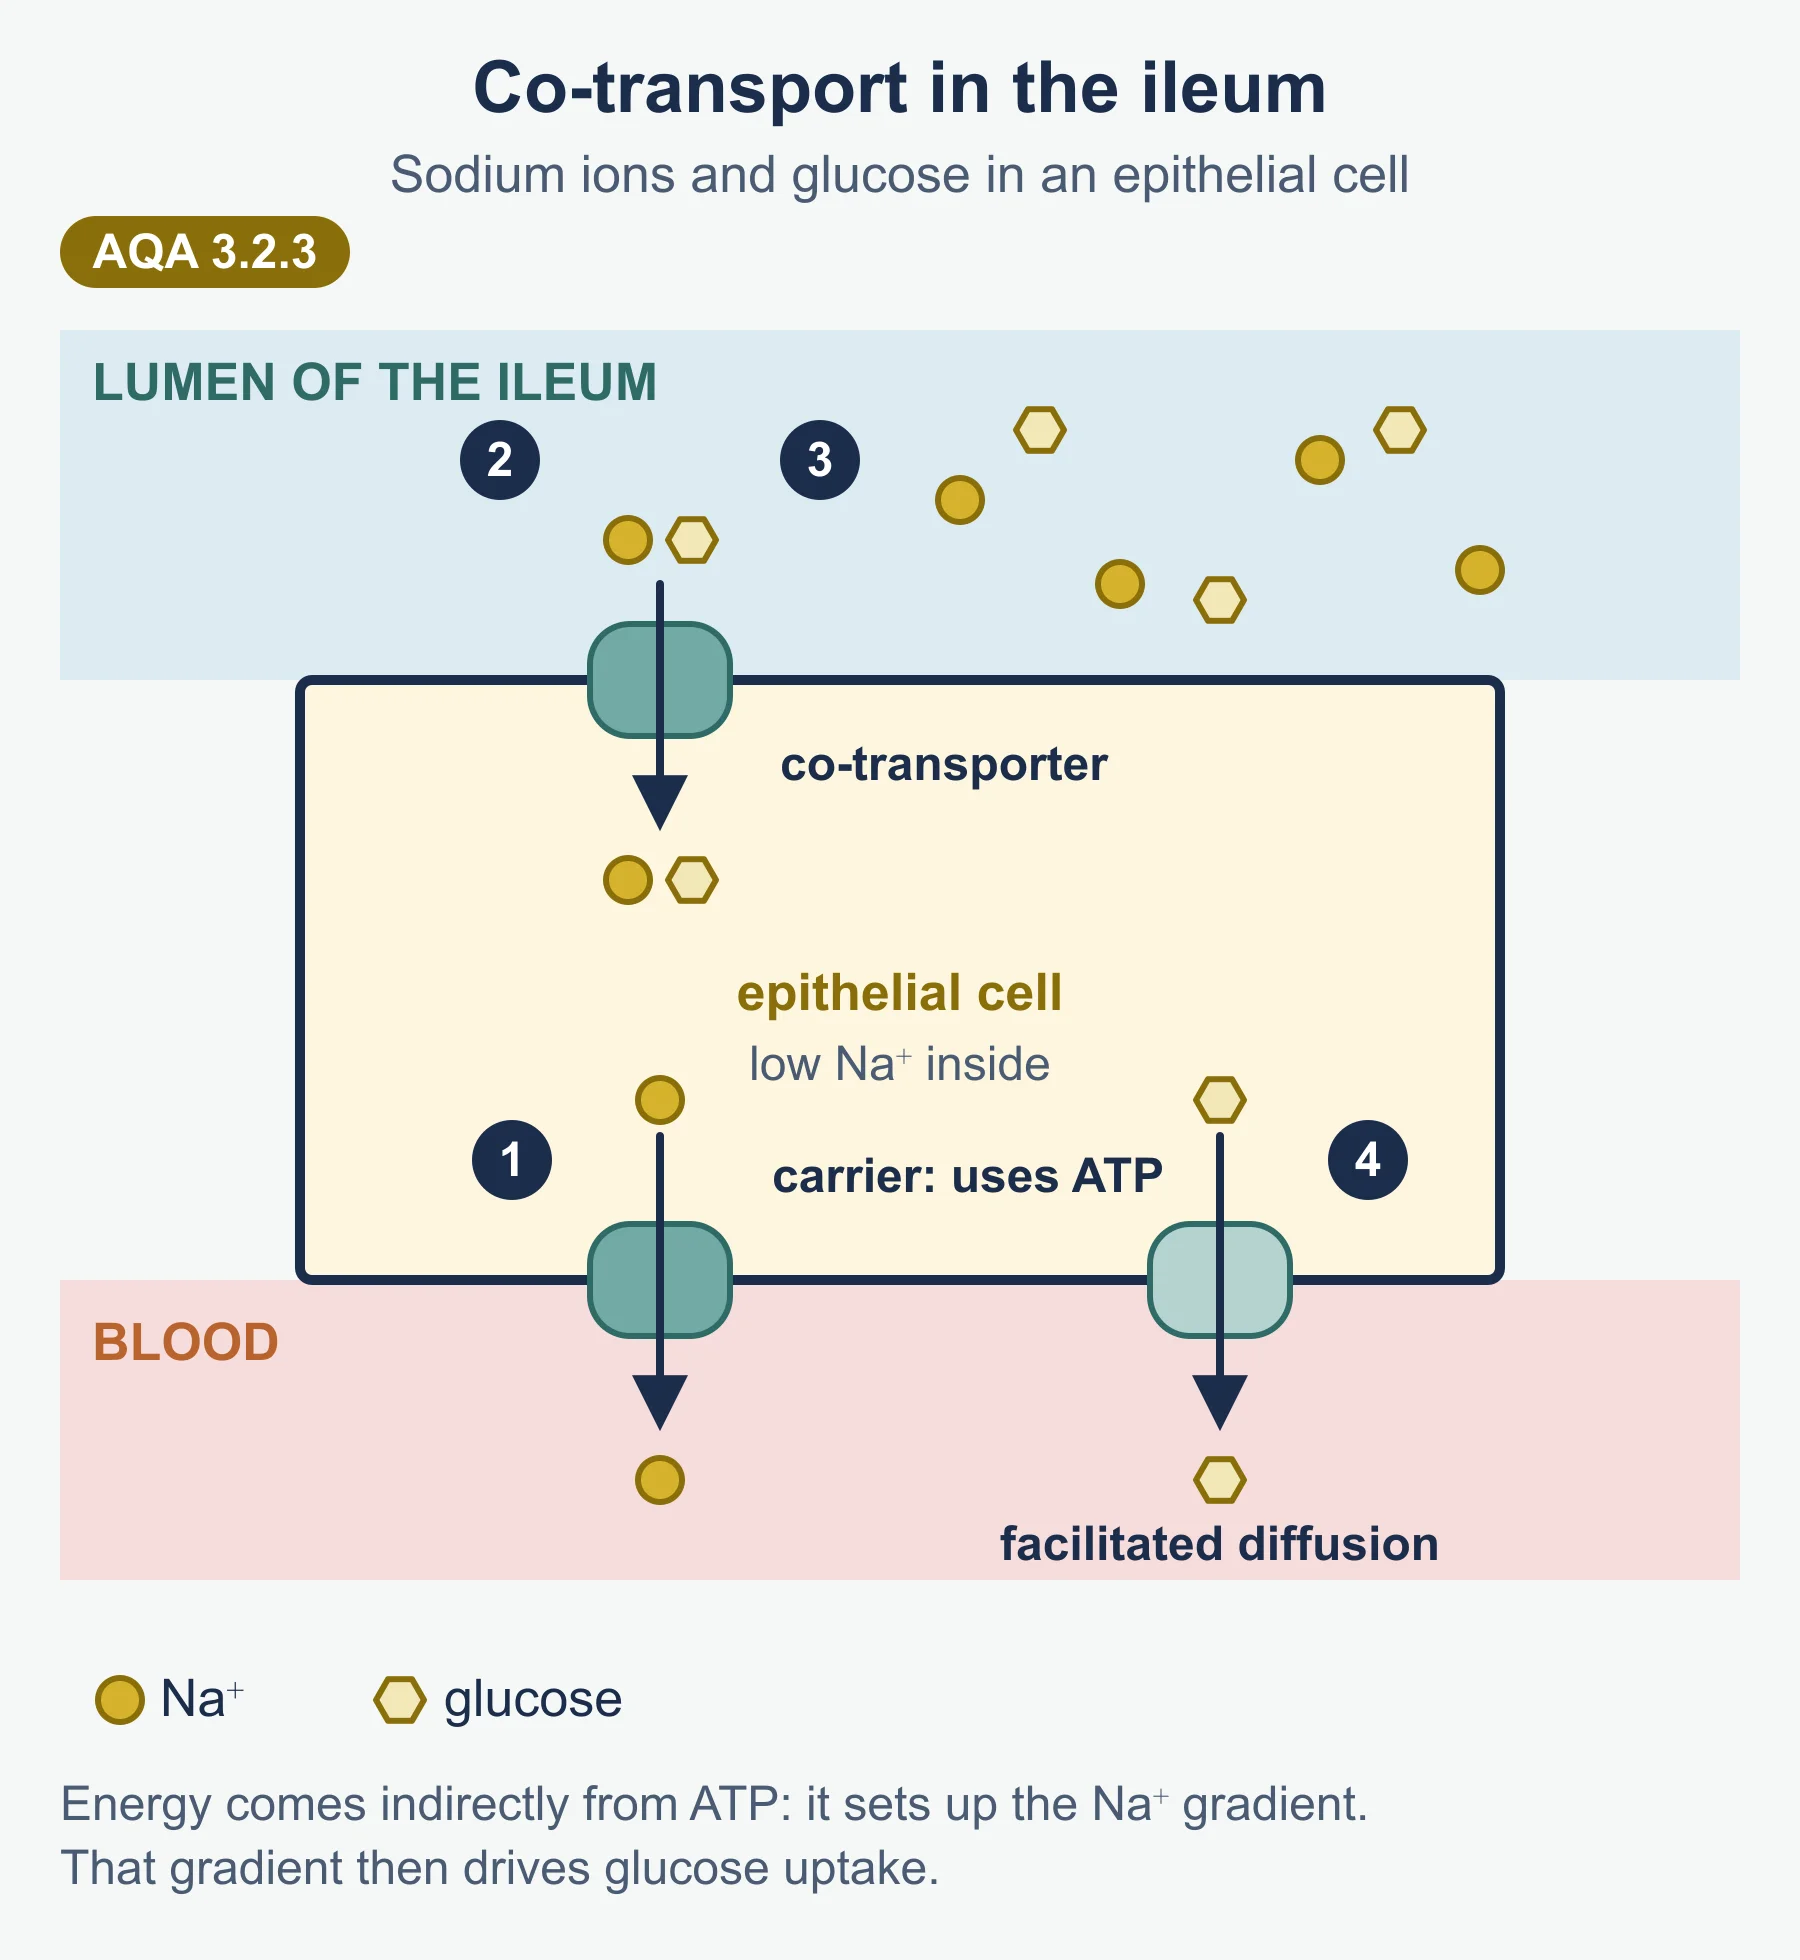
Co-transport in the ileum
- Sodium-potassium pumps in the membrane facing the blood actively move Na⁺ out of the epithelial cell (and K⁺ in), using ATP.
- This keeps the Na⁺ concentration inside the cell lower than in the ileum lumen.
- Na⁺ diffuses into the cell from the lumen through a co-transporter protein in the microvilli, carrying glucose with it. Glucose moves against its concentration gradient.
- Glucose then leaves the cell into the blood by facilitated diffusion.
The energy is used to set up the Na⁺ gradient, not to move glucose directly.
Osmosis and water potential
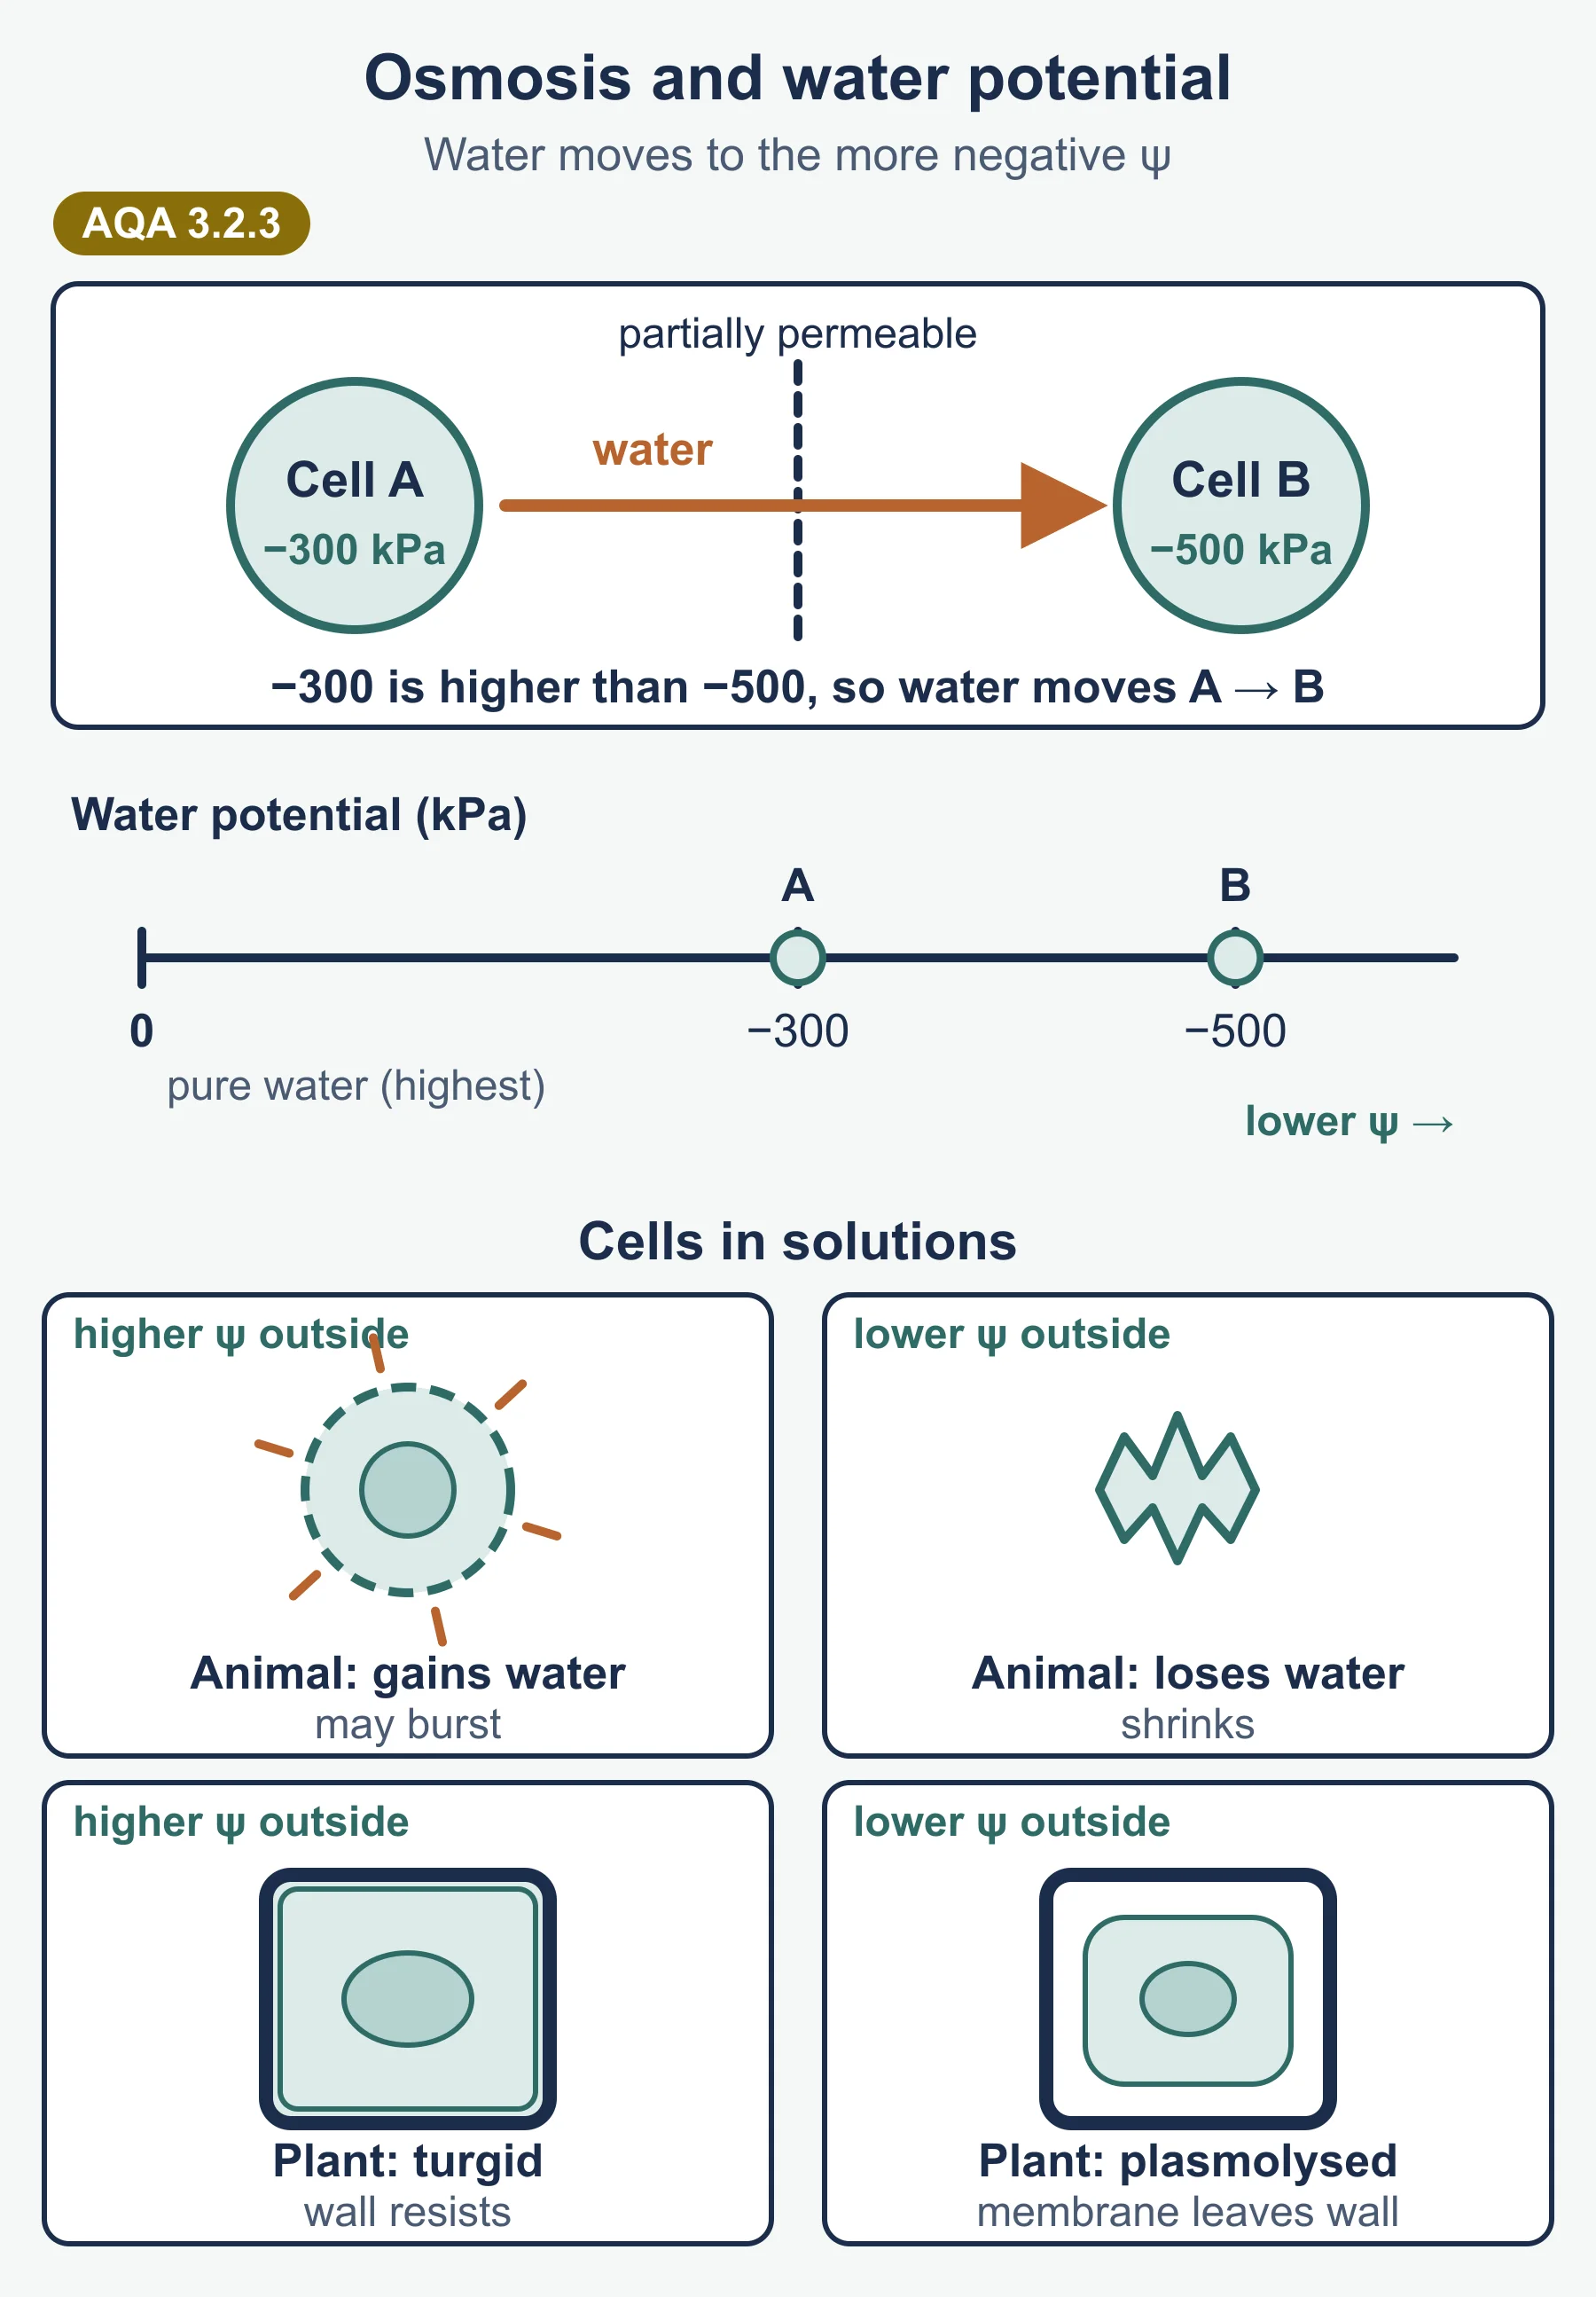
- Pure water has the highest water potential, 0 kPa. Adding solute lowers ψ, so all solutions have a negative ψ.
- Water always moves from less negative to more negative ψ.
| Solution outside the cell | Animal cell | Plant cell |
|---|---|---|
| Higher ψ than the cell | Water enters; the cell swells and may burst (lysis) | Water enters; the cell becomes turgid; the wall stops it bursting |
| Same ψ as the cell | No net movement | No net movement |
| Lower ψ than the cell | Water leaves; the cell shrinks | Water leaves; the cell becomes flaccid and the membrane pulls away from the wall (plasmolysis) |
What affects the rate of movement
| Factor | Effect |
|---|---|
| Surface area of membrane | More area, more molecules cross per second |
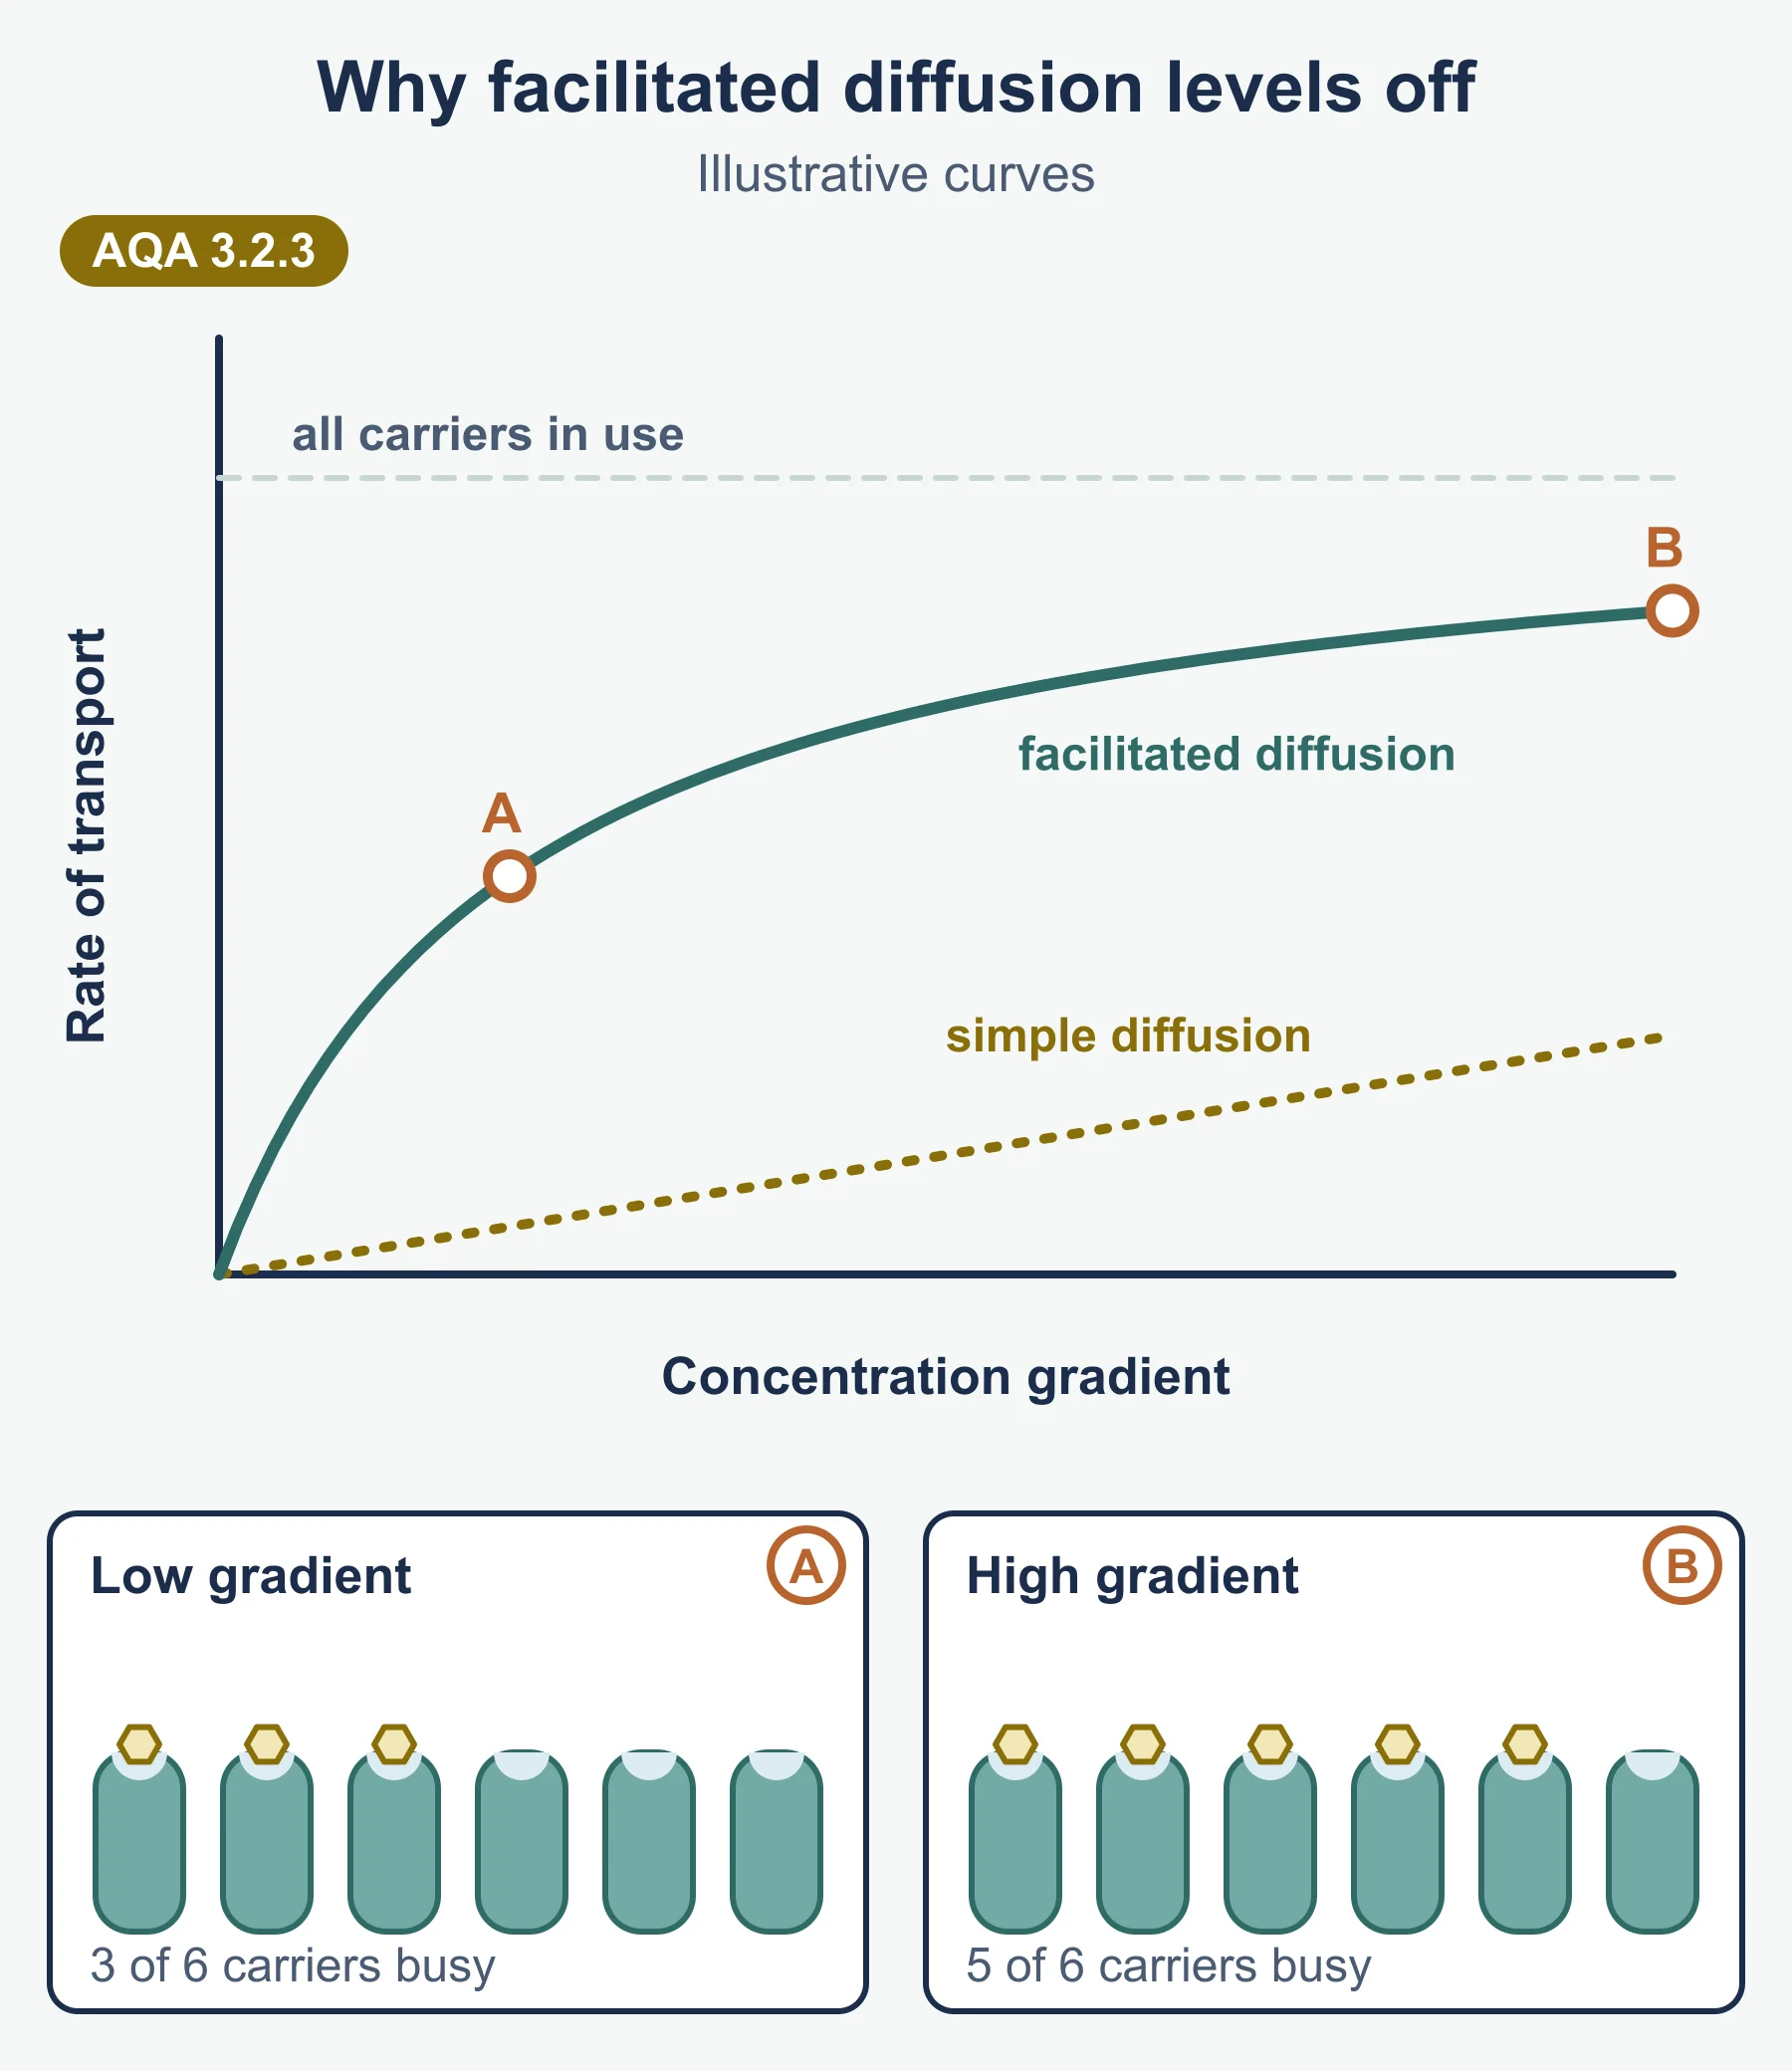
| Number of channel or carrier proteins | More proteins, faster facilitated diffusion and active transport; when all proteins are in use, the rate stops rising however steep the gradient |
| Concentration gradient (or ψ gradient) | Steeper gradient, faster diffusion or osmosis |
Graph reminder: for simple diffusion, rate rises in a straight line as the gradient increases. For facilitated diffusion, rate rises then levels off, because the number of protein molecules becomes the limiting factor.
Cells adapted for rapid transport
- Ileum epithelial cells: microvilli greatly increase surface area; many carrier and co-transporter proteins; many mitochondria supply ATP for the sodium-potassium pumps.
- Root hair cells: long extension increases surface area for water uptake by osmosis; many carrier proteins and mitochondria for active uptake of mineral ions.
- Internal membranes: the folded inner membrane of a mitochondrion gives a large area for the proteins it holds.
Answer frame: name the feature, say what it increases (surface area or number of proteins), then say how that speeds up the named process.
Required practical 3: water potential of plant tissue
Aim: make a dilution series of a solute (usually sucrose) and use it to find the water potential of a plant tissue such as potato.
Making the dilution series
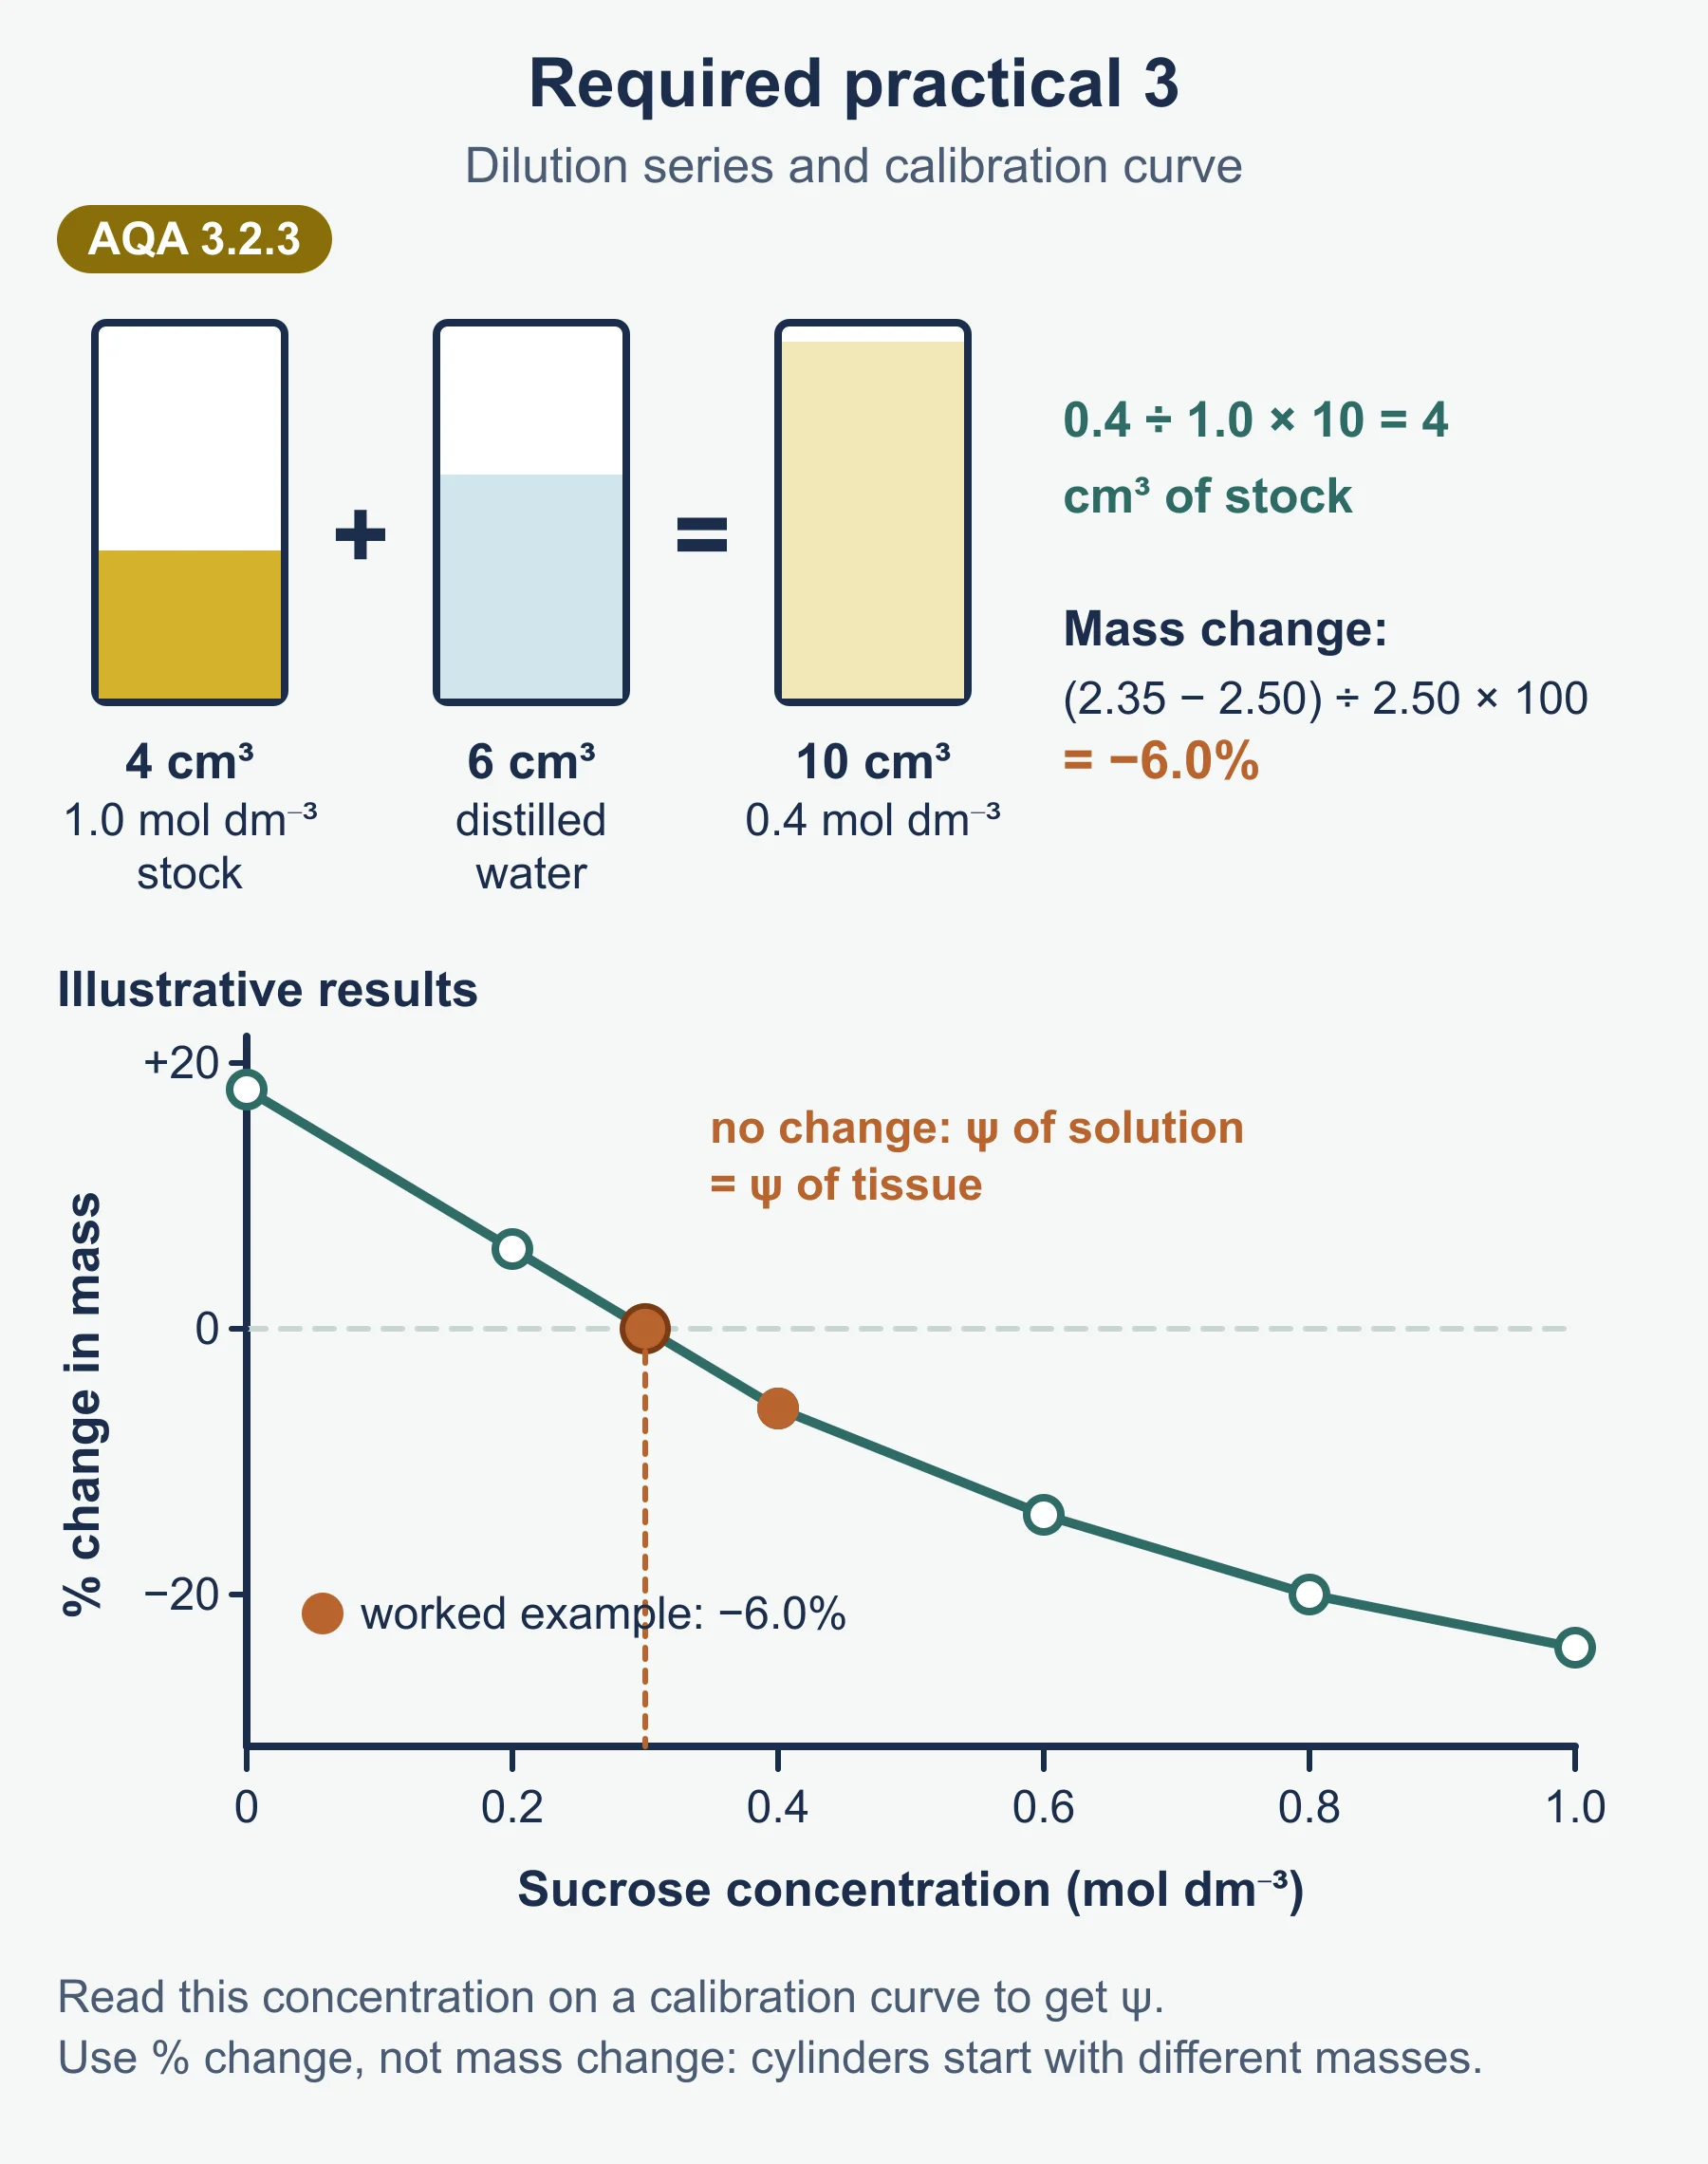
Volume of stock = (concentration wanted ÷ stock concentration) × final volume. Make up the rest with distilled water.
Worked reminder: 20 cm³ of 0.4 mol dm⁻³ from a 1.0 mol dm⁻³ stock needs (0.4 ÷ 1.0) × 20 = 8 cm³ of stock + 12 cm³ of water.
Method in outline
- Cut cylinders of tissue of the same size, from the same source, with no skin.
- Blot each one gently and find its initial mass.
- Put one (or more) into each concentration, for the same time and at the same temperature.
- Remove, blot in the same way, and find the final mass.
- Calculate percentage change in mass, so samples that start at slightly different masses can be compared.
Percentage change in mass = (final mass − initial mass) ÷ initial mass × 100
Worked reminder: 2.50 g becomes 2.35 g. Change = (2.35 − 2.50) ÷ 2.50 × 100 = −6.0%.
Using the graph
- Plot percentage change in mass (y) against solution concentration (x). Gain is above the axis, loss below.
- Draw a line or curve of best fit and read where it crosses zero change in mass.
- At that concentration the solution and the tissue have the same water potential, so there is no net osmosis.
- Use the calibration curve or table you are given (concentration against water potential) to convert that concentration into the tissue’s water potential.
The specification also mentions plotting mass change against the water potential of each solution directly; the intercept then gives the tissue’s water potential straight away.
Reliability and errors
- Blot the same way each time: water left on the surface adds mass.
- Repeat each concentration and calculate a mean; spot and discuss anomalies.
- Cover the tubes so water does not evaporate and change the concentration.
Required practical 4: permeability of cell-surface membranes
Aim: investigate how a named variable, usually temperature or ethanol concentration, affects membrane permeability. Beetroot is used because its cells contain a red pigment that leaks out only when membranes are damaged.
Method in outline
- Cut beetroot pieces of the same size and rinse them to wash off pigment from cells broken by cutting.
- Place one piece in the same volume of water (or ethanol solution) at each value of the independent variable for the same time.
- Remove the beetroot and measure the colour of the liquid with a colorimeter (absorbance), zeroed with distilled water.
- Higher absorbance means more pigment has leaked, so the membranes are more permeable.
Explaining the results
| Condition | Effect on the membrane | Result |
|---|---|---|
| Rising temperature | Phospholipids move more, so the bilayer becomes more fluid; at high temperatures membrane proteins denature, leaving gaps | More pigment leaks, with a sharp rise above about 40 °C in typical results |
| Rising ethanol concentration | Ethanol dissolves (disrupts) the lipids in the membrane | More pigment leaks |
| Freezing | Ice crystals can pierce the membrane | Pigment leaks when the tissue thaws |
Control variables: size and surface area of the pieces, volume of liquid, time in the liquid, and the beetroot source.
Must-know distinctions
- Facilitated diffusion is passive. It uses proteins but not ATP.
- Co-transport of glucose is not powered by ATP directly. ATP sets up the Na⁺ gradient that drives it.
- Water potential is negative. “Higher” ψ means closer to 0. Say “less negative” if in doubt.
- Osmosis is about water, not solute. Do not describe the solute moving by osmosis.
- Percentage change, not change. Use it whenever starting masses differ.
- The x-intercept is where ψ is equal, not where the tissue is “full”.
Quick self-test
- Why is the membrane model described as “fluid” and “mosaic”?
- What does cholesterol do in a membrane?
- Why can glucose not cross the bilayer by simple diffusion?
- How does a carrier protein differ from a channel protein?
- Which has the higher water potential: −300 kPa or −700 kPa?
- A plant cell of ψ −600 kPa is placed in a solution of ψ −200 kPa. Which way does water move?
- Explain how sodium ions help glucose to be absorbed in the ileum.
- How much 1.0 mol dm⁻³ stock and water are needed for 25 cm³ of 0.2 mol dm⁻³ solution?
- A potato cylinder goes from 3.20 g to 3.44 g. Calculate the percentage change in mass.
- Why does beetroot pigment leak more at 70 °C than at 30 °C?
Answers
- Fluid: phospholipids and many proteins move about within the bilayer. Mosaic: proteins are scattered through it in a pattern like tiles.
- It restricts the movement of the other molecules, making the membrane less fluid.
- Glucose is polar (and quite large), so it cannot pass through the hydrophobic core of the bilayer.
- A carrier protein binds the molecule and changes shape; a channel protein is a pore that lets ions through.
- −300 kPa (less negative).
- Into the cell, from the solution (higher ψ) to the cell (lower ψ).
- Na⁺ is actively pumped out of the cell into the blood, lowering its concentration in the cell. Na⁺ then diffuses in from the lumen through a co-transporter, carrying glucose against its gradient.
- (0.2 ÷ 1.0) × 25 = 5 cm³ stock + 20 cm³ water.
- (3.44 − 3.20) ÷ 3.20 × 100 = +7.5%.
- At 70 °C membrane proteins denature and the phospholipids are more fluid, so gaps form and pigment escapes.
Where marks are usually lost
- Saying water moves “from a high to a low concentration” in an osmosis answer, instead of using water potential.
- Calling active transport “diffusion against the gradient”.
- Leaving ATP or the carrier protein out of an active transport answer.
- Giving “the cell bursts” for a plant cell in a dilute solution.
- Using change in mass, not percentage change, when cylinder masses differ.
- In practical 4, failing to rinse the beetroot, so pigment from cut cells inflates every reading.
Frequently asked questions
What is the difference between channel and carrier proteins? Channel proteins form water-filled pores for particular ions. Carrier proteins bind a specific molecule, then change shape to move it across the membrane.
Does co-transport of glucose use ATP directly? No. ATP is used by sodium-potassium pumps to set up a sodium ion gradient. Glucose then enters with sodium ions through a co-transporter protein down the sodium gradient.
How do you find the water potential of a plant tissue in Required Practical 3? Plot percentage change in mass against solution concentration and read where the line crosses zero change. At that concentration the tissue and the solution have the same water potential.
What does Required Practical 4 investigate? It investigates how a variable such as temperature or ethanol concentration affects the permeability of cell-surface membranes, using pigment leaking from beetroot measured with a colorimeter.
Why is percentage change in mass used instead of change in mass? Tissue samples often start at slightly different masses, so percentage change allows a fair comparison.
Official syllabus
AQA AS and A-level Biology specification (7401 and 7402), for first teaching 2015, exams June 2016 onwards, Version 1.5, published by AQA. Section 3.2.3 Transport across cell membranes, including Required practicals 3 and 4.
Get free revision emails (optional)
Occasional emails with practice questions, worked explanations and links to free resources for the qualification and subjects you choose. No spam, and you can unsubscribe from any email. The free tools on this site never need an email.
Related resources
-
Exam preparation
AQA A-Level Biology: Paper-by-Paper Exam Preparation
How AQA A-Level Biology 7402 Papers 1, 2 and 3 work, with strategy for the Paper 2 comprehension, the Paper 3 essay and practical skills, plus a checklist.
Biology · AQA · A Level
Read guide -
Study guides
AQA A-level Biology: Transport Across Cell Membranes and Required Practicals 3 and 4 (7402)
Study guide to AQA A-level Biology 3.2.3: fluid-mosaic model, diffusion, water potential, active transport, co-transport in the ileum and practicals 3 and 4.
Biology · AQA · A Level (AS content)
Read guide -
Practice questions
AQA A-level Biology: Transport Across Cell Membranes and Required Practicals 3 and 4 (7402) – Practice Questions
Original questions with worked answers on AQA A-level Biology 3.2.3: fluid mosaic, diffusion, water potential, active transport, co-transport, practicals 3-4.
Biology · AQA · A Level (AS content)
Try questions
Related articles
-
study skills
How to revise for a science examination
Most science revision fails because it rereads notes instead of retrieving them. A practical method for revising physics, chemistry and biology in the weeks before a paper.
14 July 2026
-
teaching
A Level tuition in Dubai: Cambridge or Pearson Edexcel International A Level?
Schools in Dubai and Abu Dhabi teach either Cambridge International AS & A Level or Pearson Edexcel International A Level. How the two are structured, why it matters for tuition, and how online classes from Lahore work.
9 October 2026
Studying this with a teacher
Working through Biology A LEVEL (AS CONTENT)?
This page is free and stays free. If you would rather be taught it, Marlbridge runs Biology classes one-to-one and in small groups of up to 15, online in your own time zone. The first trial class is free. WhatsApp replies within an hour (8am–11pm Pakistan time, every day); email the same day.
AQA Biology teachers at Marlbridge


