
Revision Notes
AQA A-Level Business: Marketing management (7132) – Revision Notes
Condensed revision notes for AQA A-Level Business (7132) marketing management: formulas, models, distinctions, a self-test and common lost marks.
- Subject
- Business
- Level
- A LEVELS
- Topic
- Marketing management
- Author
- Marlbridge Academic Team
- Updated
- Reviewed by
- Salman Ahmad (what this means)
Aligned to AQA A Level Business (7132), For first teaching from September 2023. Official specification .
Syllabus page (what it covers and how it is assessed): AQA A Level Business.
Syllabus points this page covers
7132
- 3 Marketing management (whole topic)
Found an error? Report a correction.
Need help with this topic? Request a free trial class for A Level Business (7132).
These notes condense the marketing section (3.3.1 to 3.3.4 in the specification text) of the AQA AS and A-level Business specification (7131/7132) for A-level Business (7132). For full explanations and worked examples read the study guide, then test yourself with the practice questions. Other links: the AQA A-Level Business hub, the checklist and free diagnostics.
Section map
| Section | One-line summary |
|---|---|
| 3.3.1 | Marketing objectives: volume, value, market size, growth, share, brand loyalty; external and internal influences |
| 3.3.2 | Research, sampling, data interpretation, technology, elasticity, using data |
| 3.3.3 | Segment, target, position; four segmentation methods; niche and mass |
| 3.3.4 | 7Ps, Boston Matrix, product life cycle, new products, pricing, promotion, place, integration, digital |
Five themes run through every section: technology, ethical and environmental influences, market conditions and competition, competitiveness, and links with other functions.
3.3.1 Objectives
- Value: gives direction, a target to measure against and a link between marketing and the other functions.
- Listed objectives: sales volume, sales value, market size, market growth, sales growth, market share, brand loyalty.
- External influences: competitors, the economy, technology, social attitudes, ethical and environmental pressure, legislation.
- Internal influences: corporate objectives, finance, capacity, staff skills, brand and product range.
3.3.2 Markets and customers
Definitions
| Term | Meaning |
|---|---|
| Primary research | New data gathered first-hand: tailored, slower, dearer |
| Secondary research | Existing data: cheaper, quicker, may be dated or off target |
| Quantitative | Numerical (counts, prices, percentages) |
| Qualitative | Opinions, attitudes, motives |
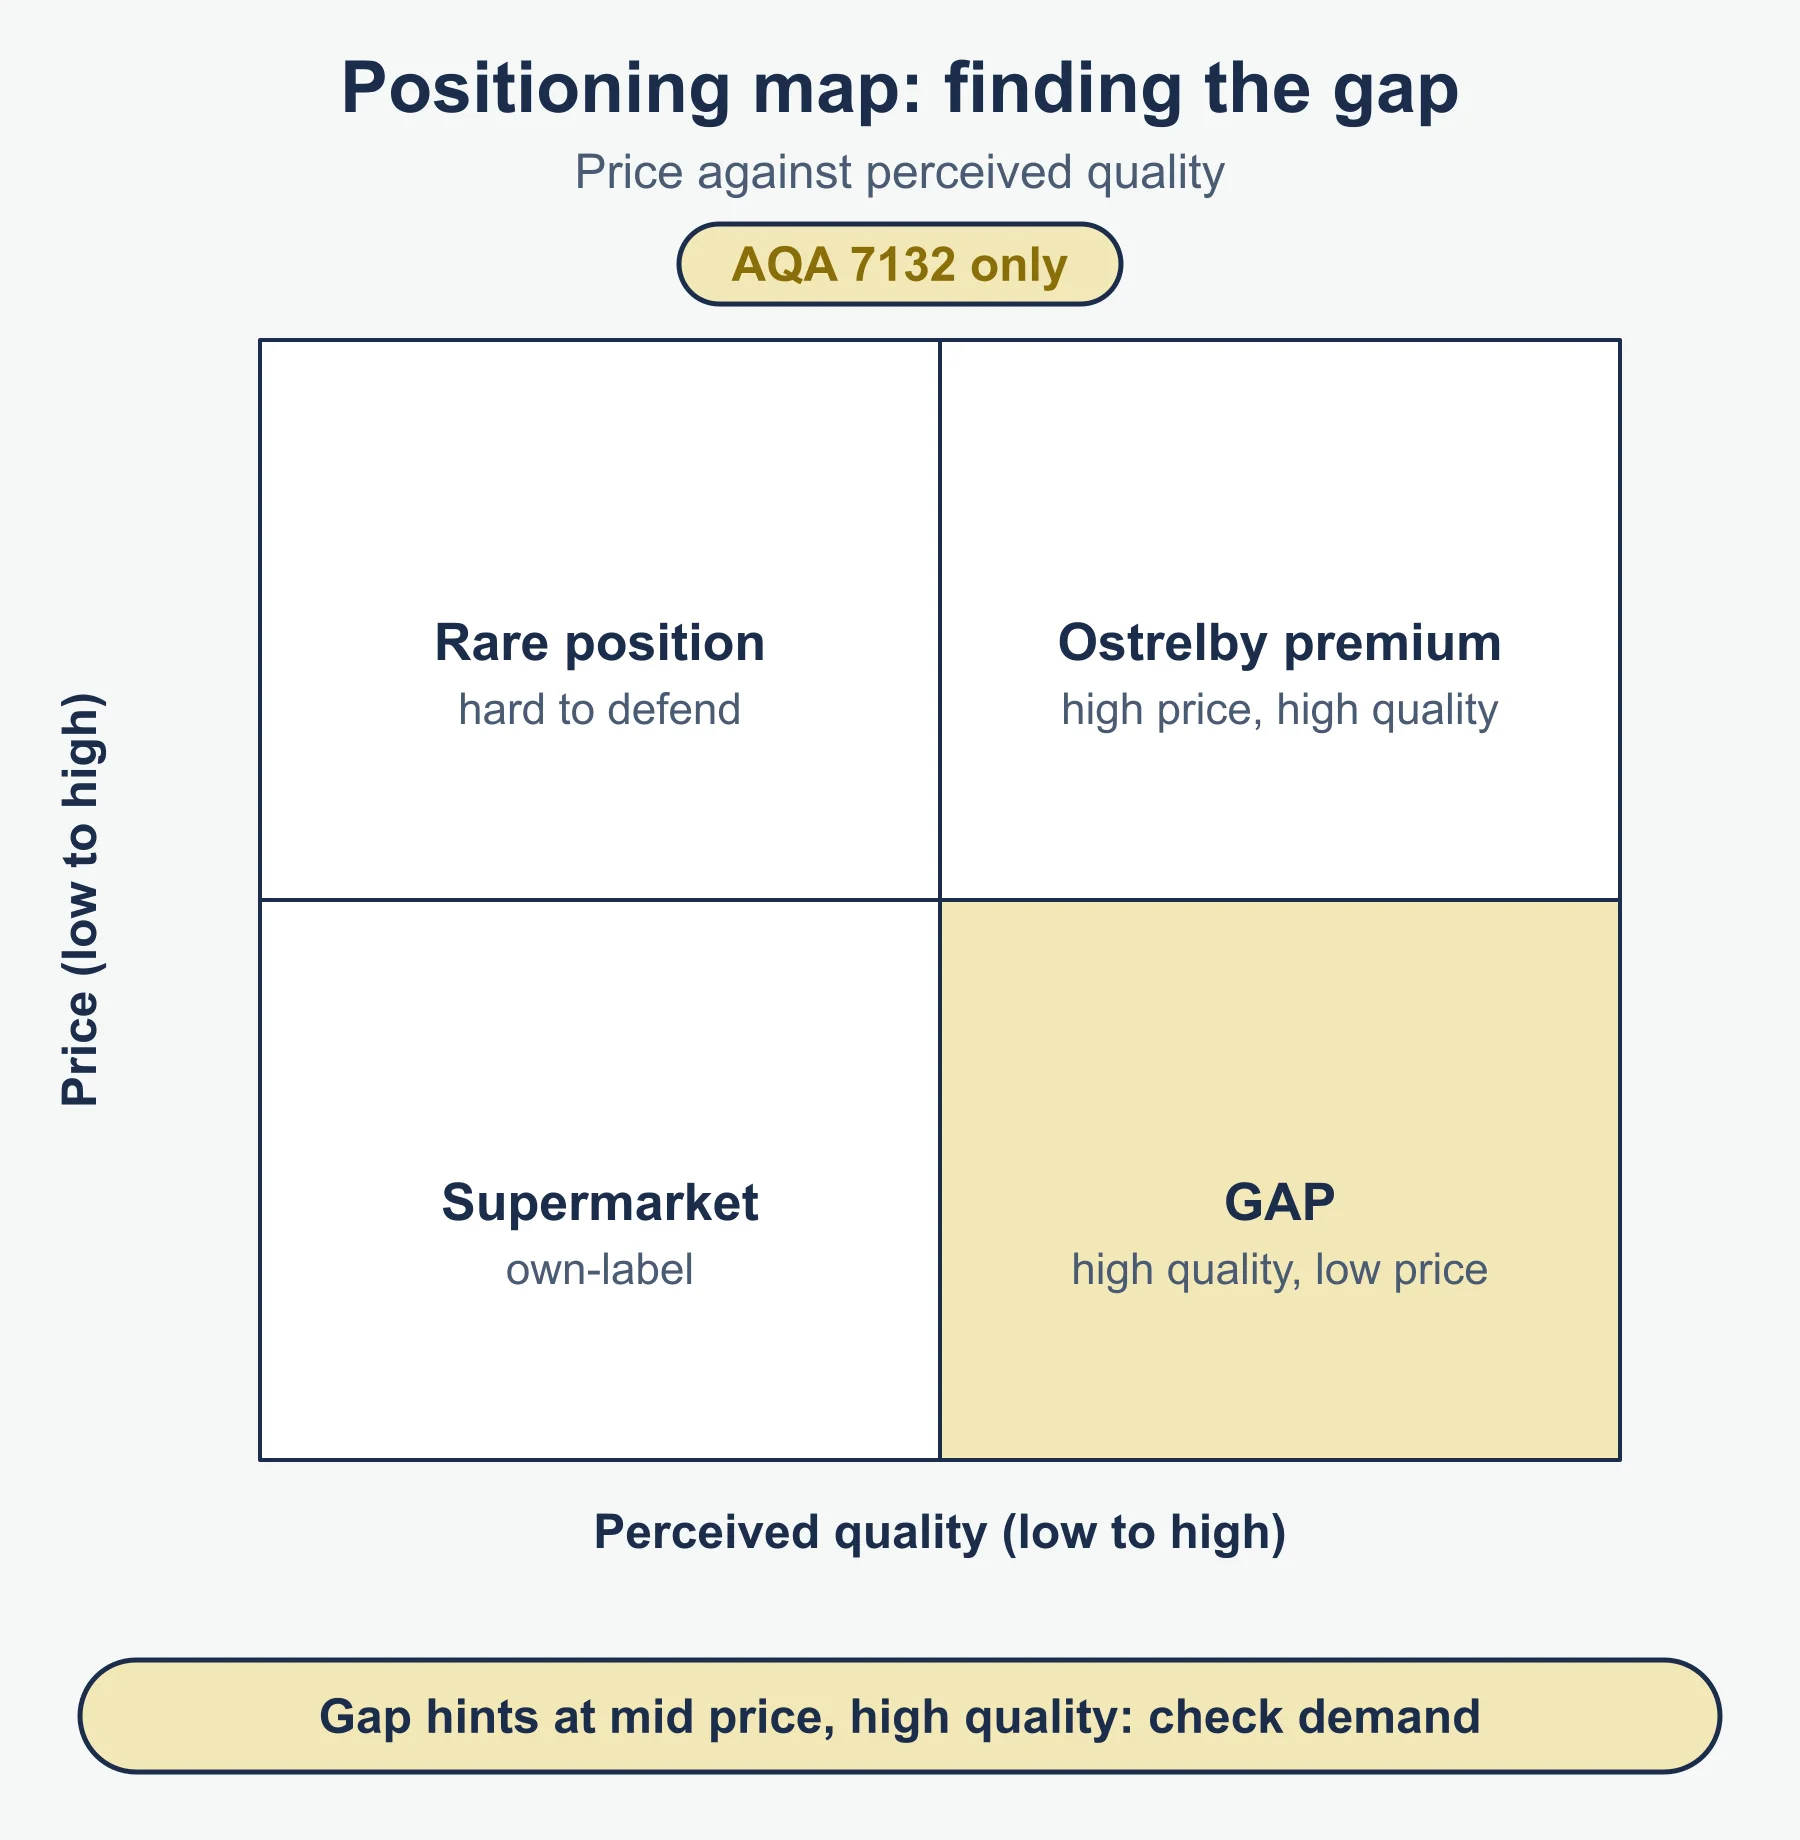
| Market mapping | Plotting brands on two axes to show competition and gaps |
| Sampling | Asking a part of the population to estimate the whole |
| Confidence interval | Range likely to contain the true population value |
| Extrapolation | Extending a trend beyond the data range |
Formulas
| Measure | Calculation |
|---|---|
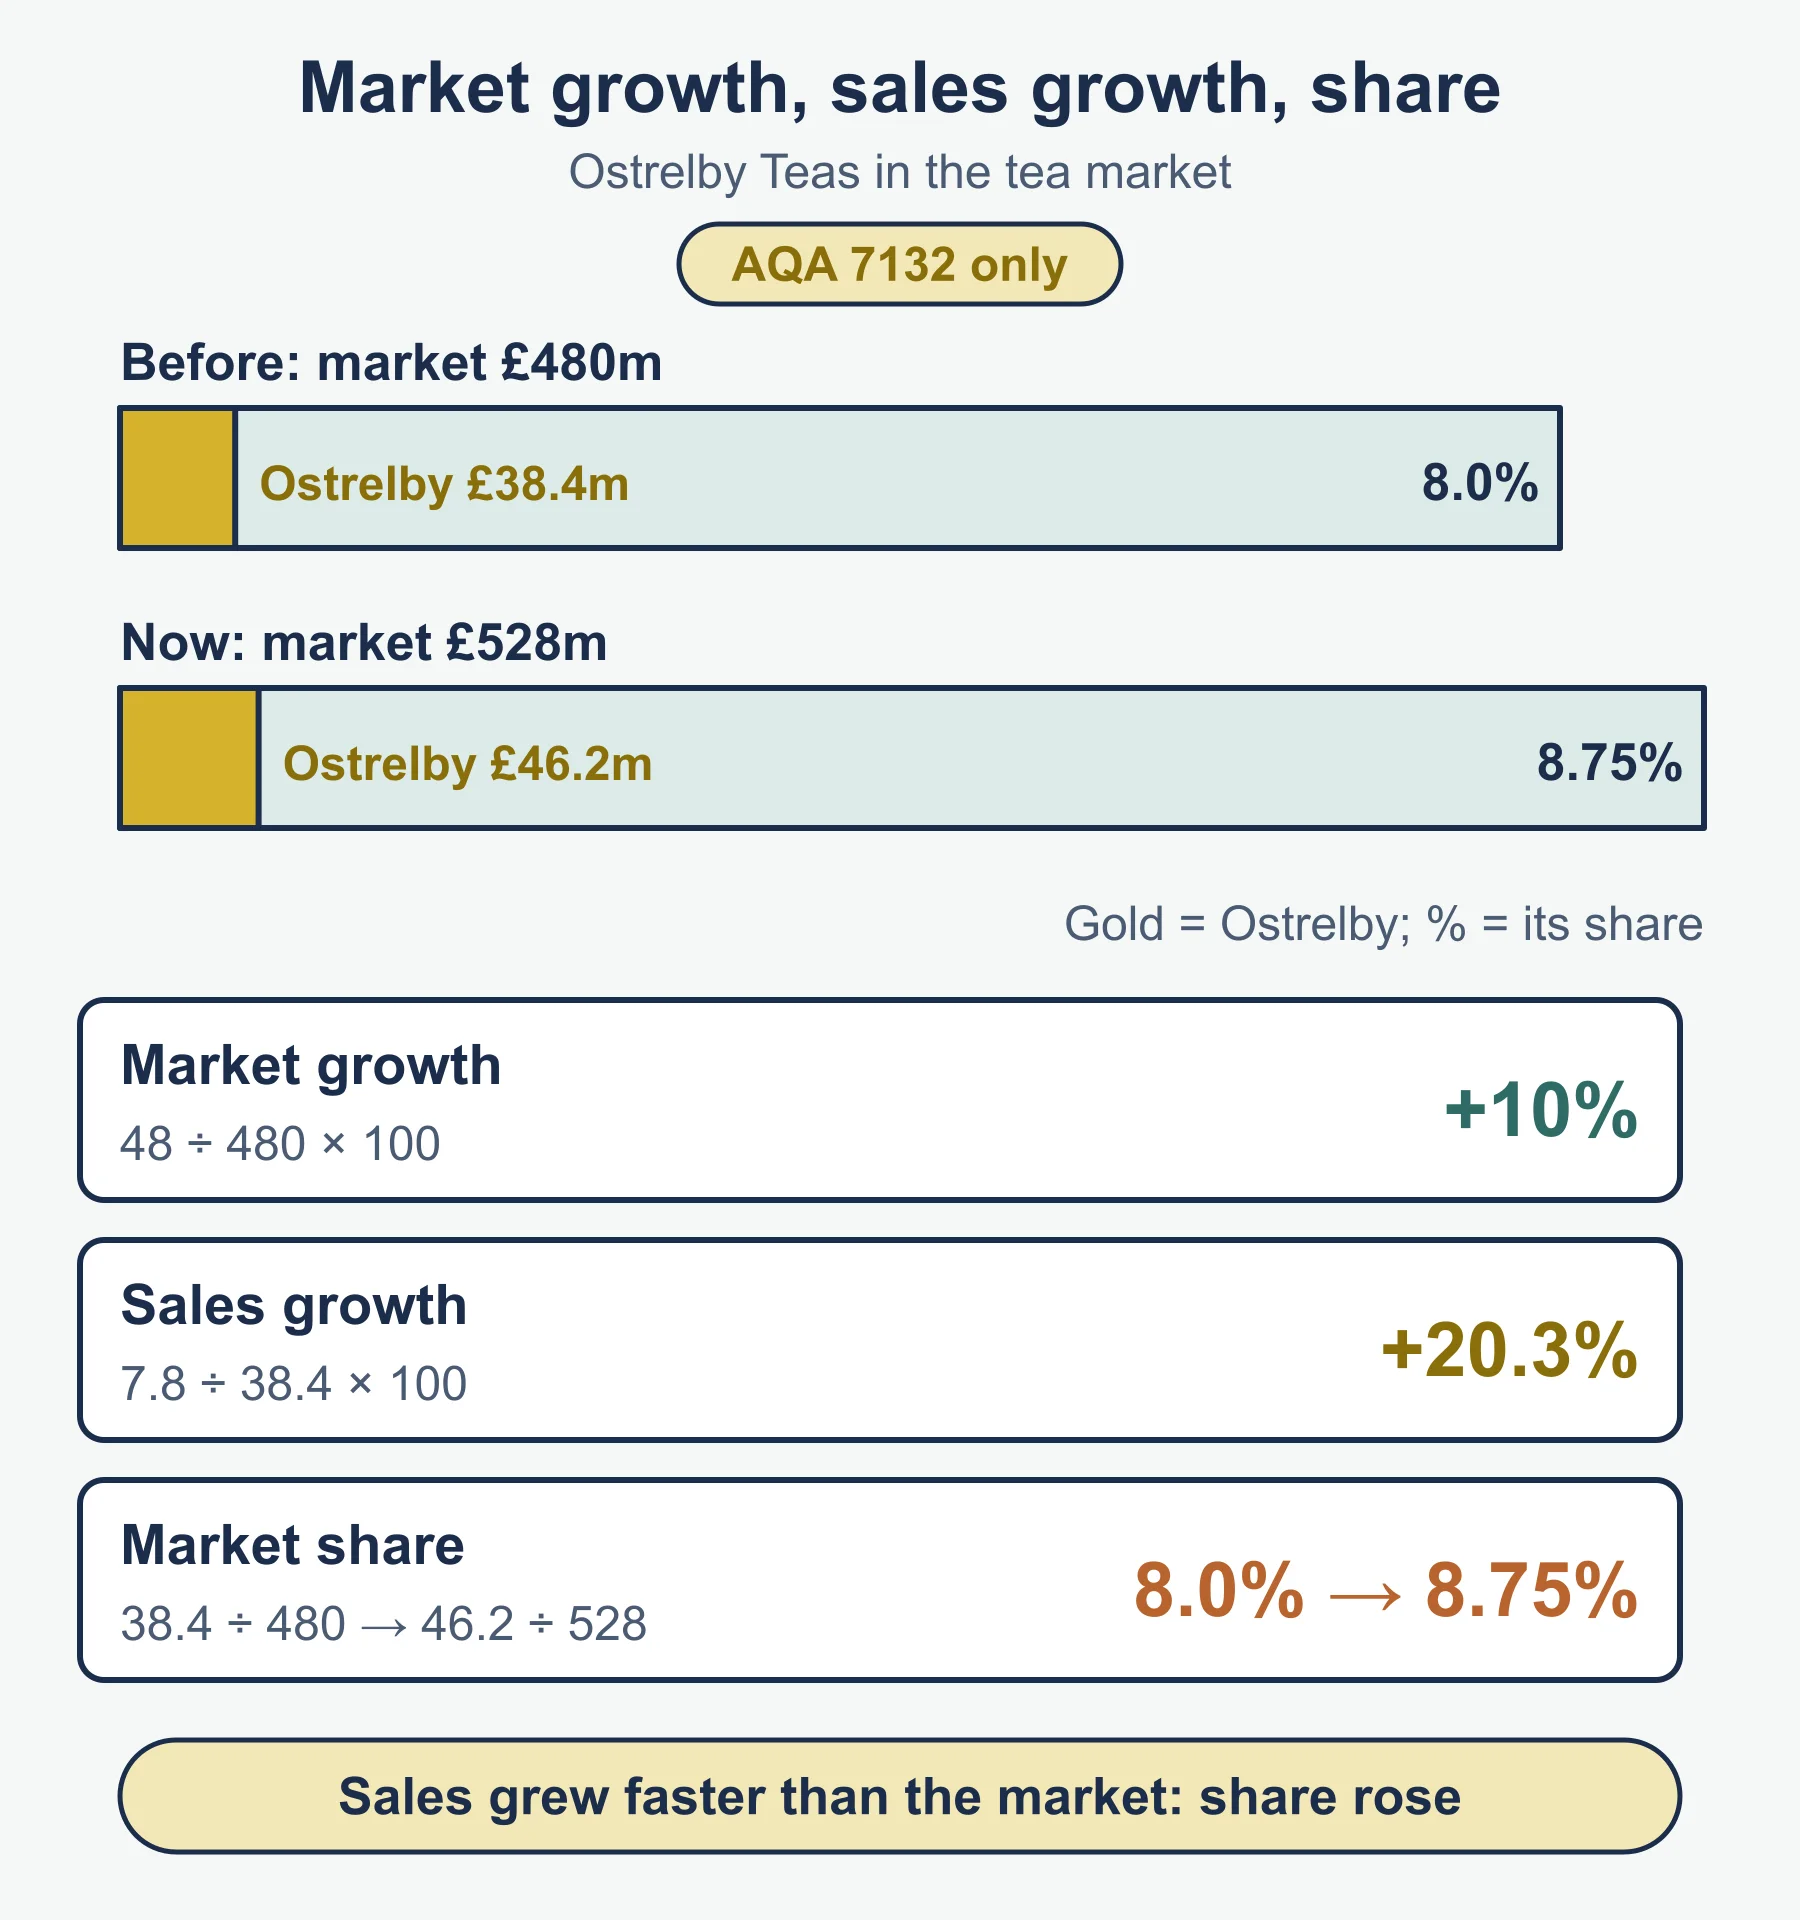
| Market growth (%) | change in market size ÷ original market size × 100 |
| Sales growth (%) | change in sales ÷ original sales × 100 |
| Market share (%) | firm’s sales ÷ market sales × 100 |
| Market size | firm’s sales ÷ market share |
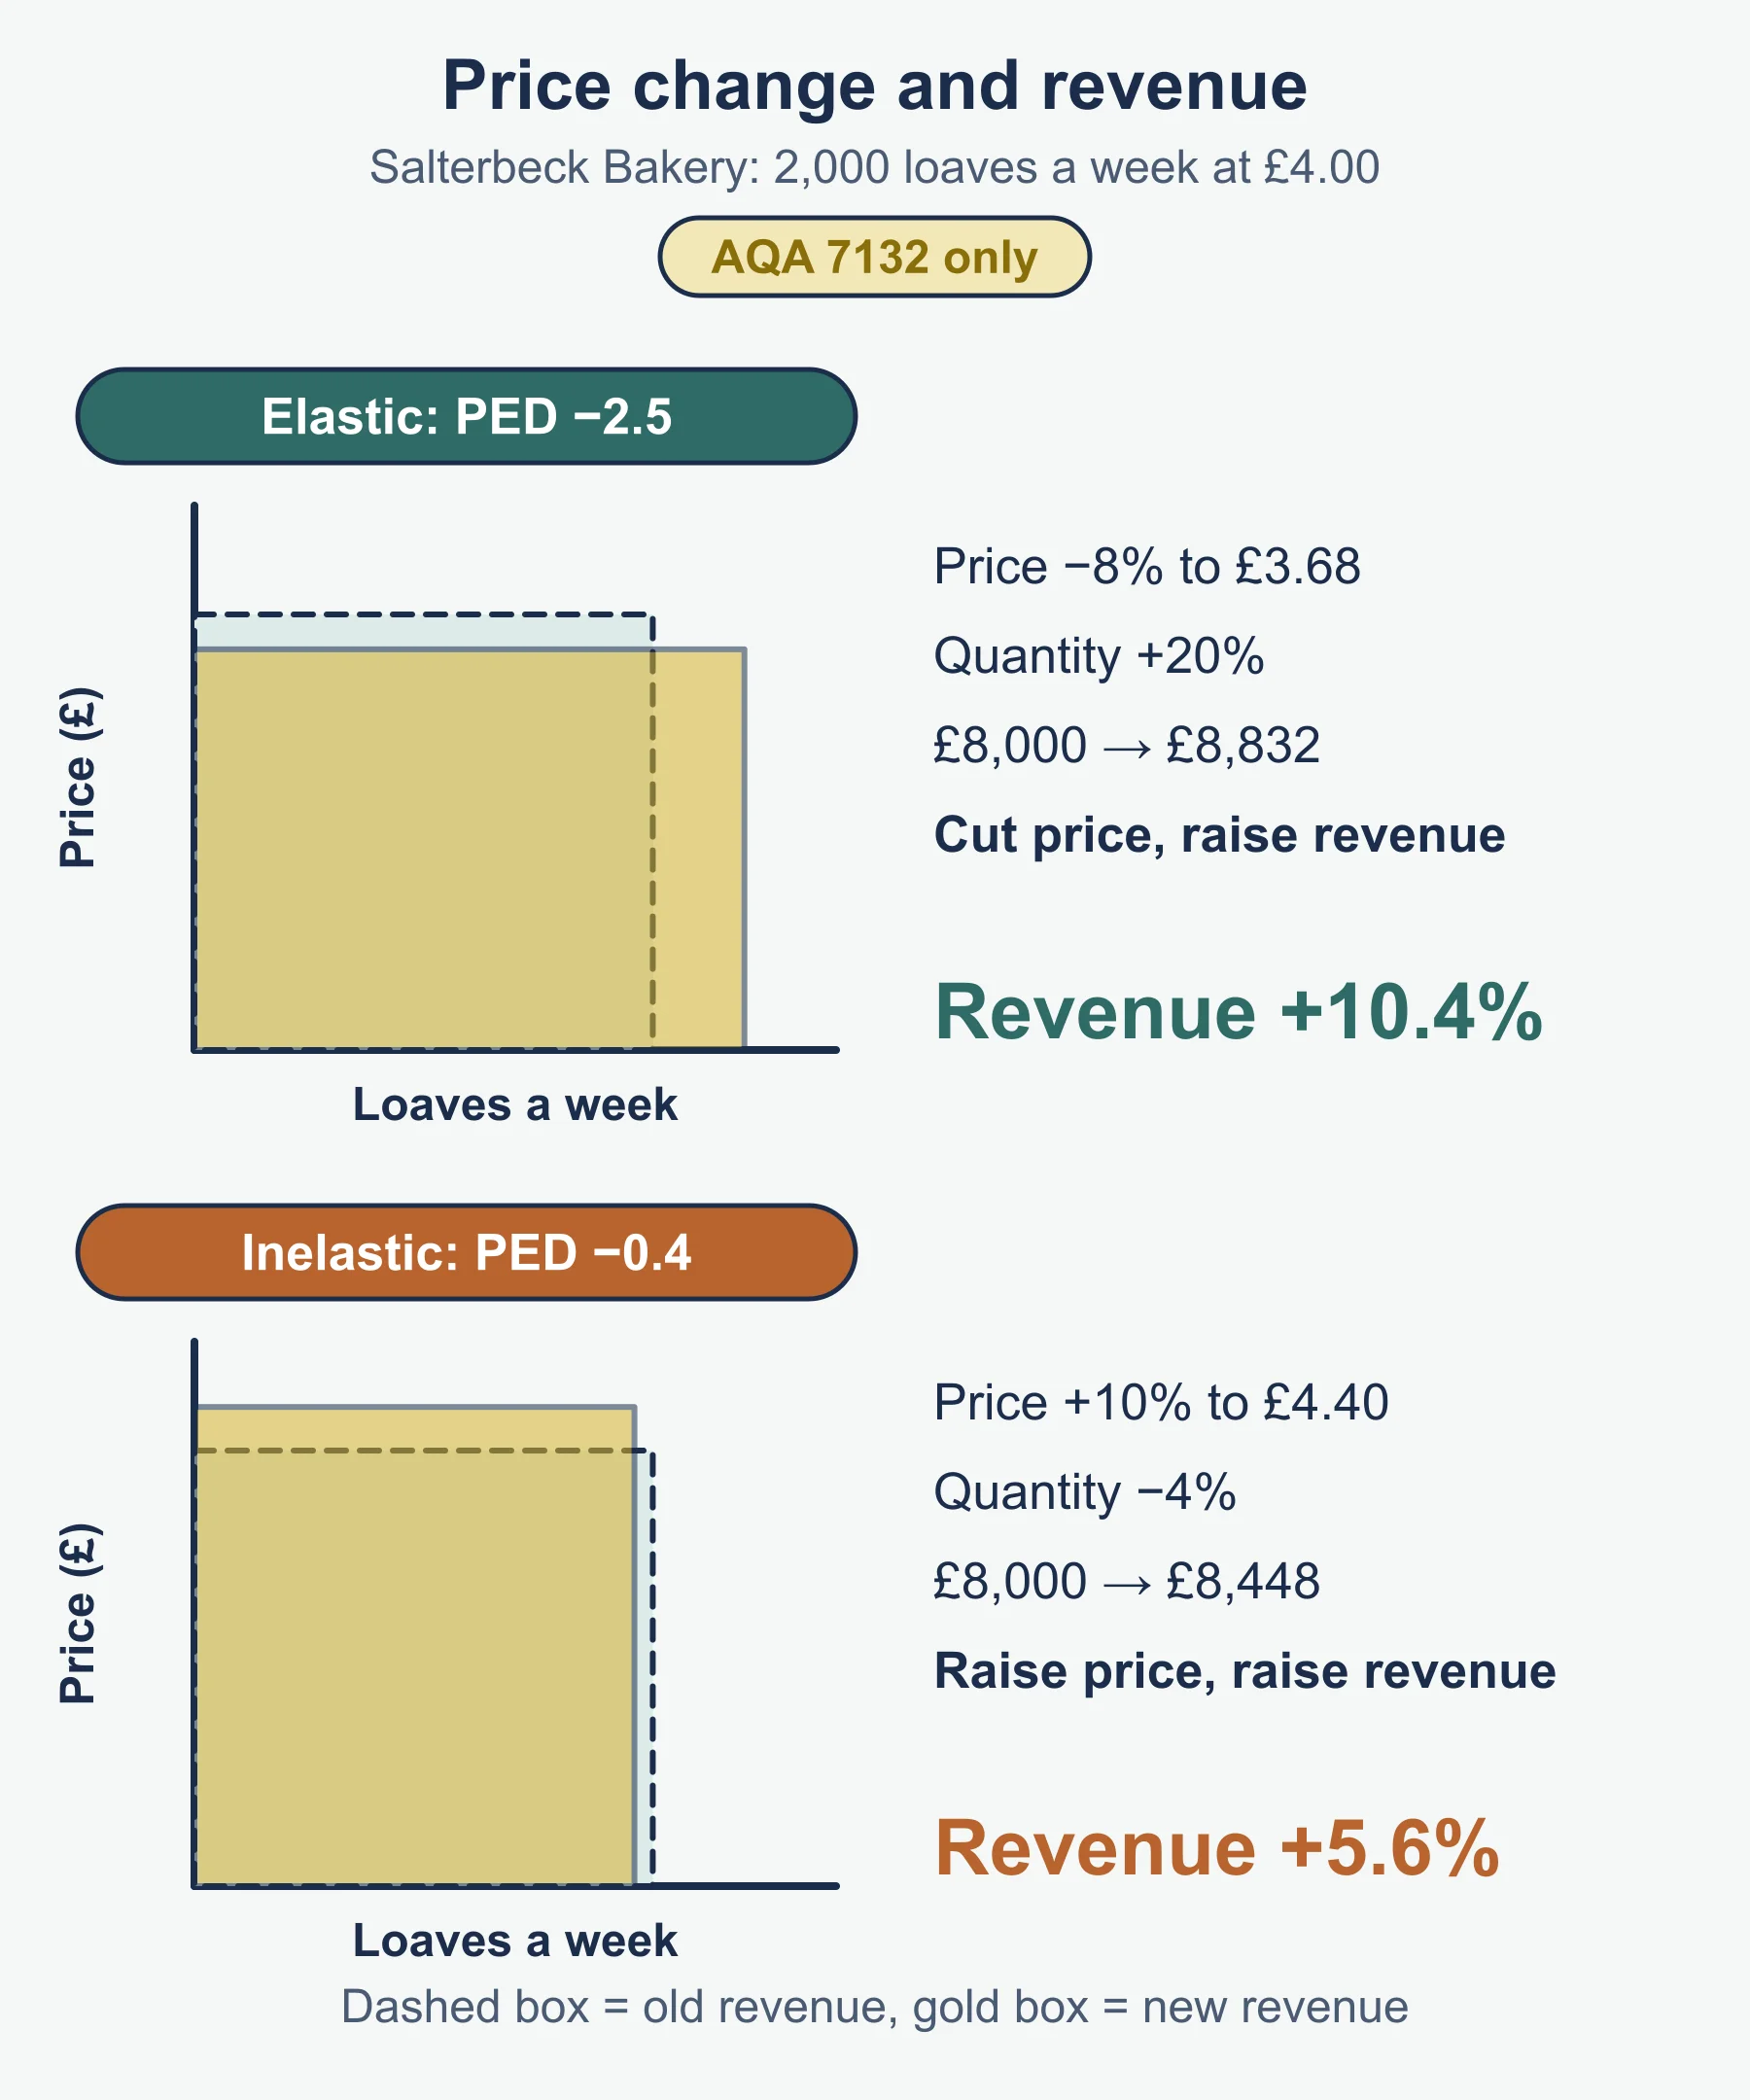
| PED (standard form) | % change in quantity ÷ % change in price |
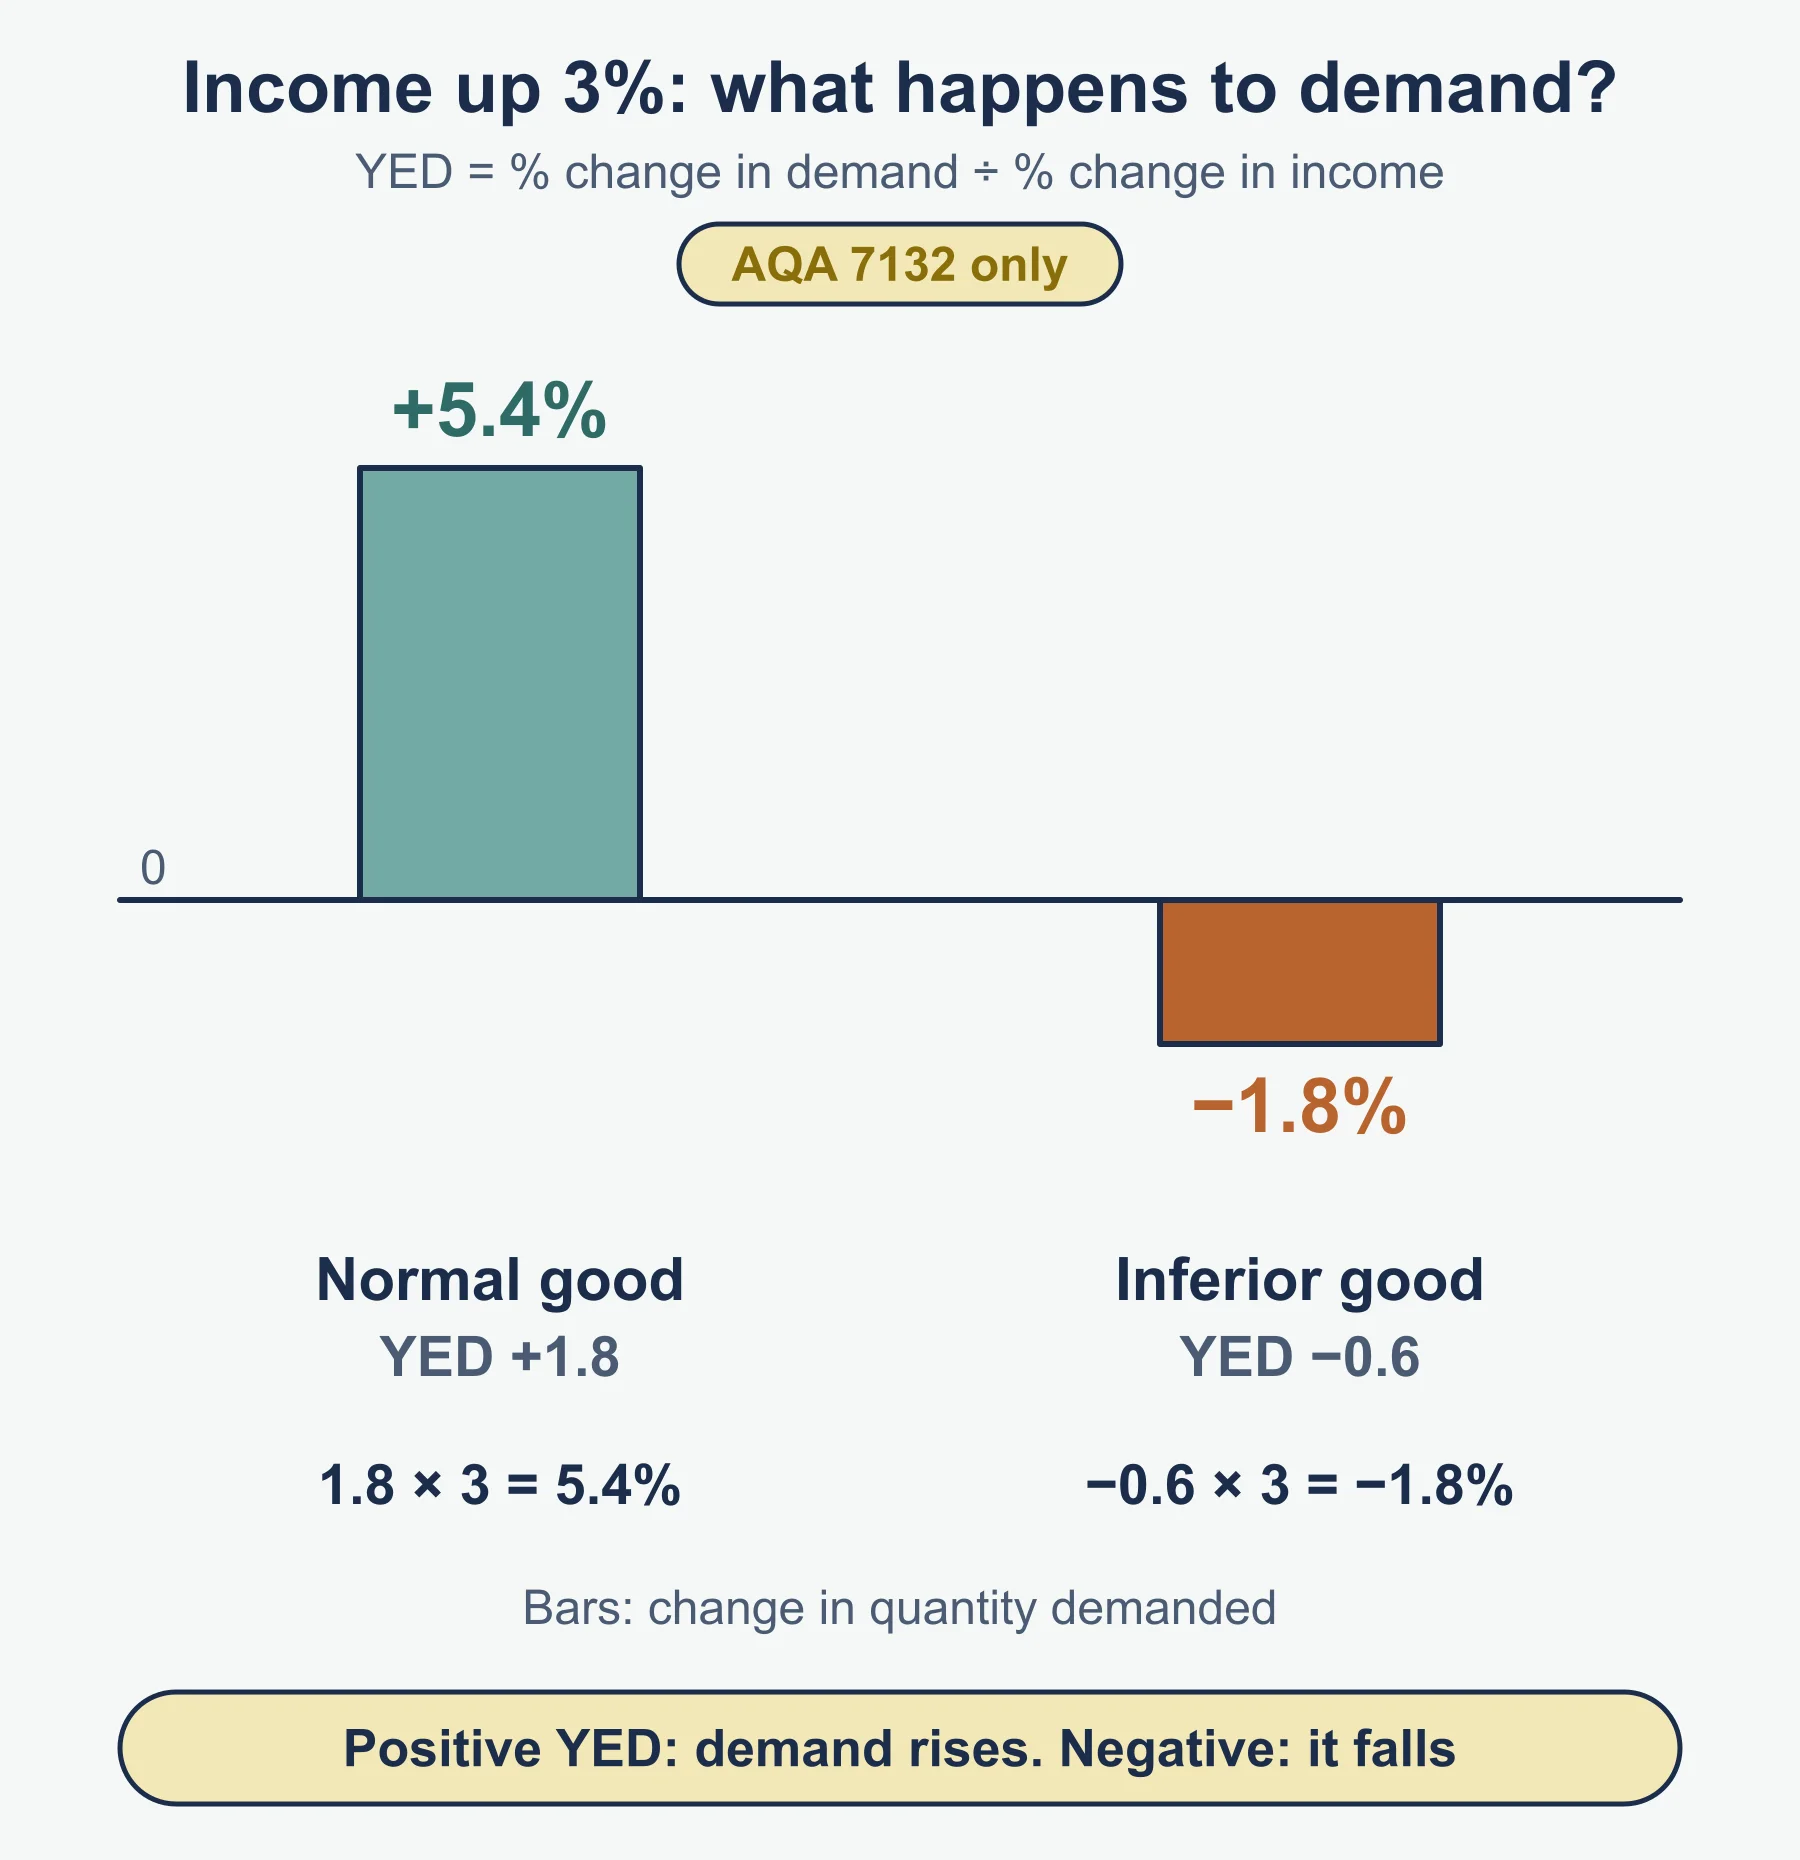
| YED (standard form) | % change in quantity ÷ % change in income |
The specification says you must calculate market and sales growth, share and size, and that you need to interpret, not calculate, elasticity.
Method in steps for share and growth questions
- Write each formula with the figures in.
- Keep the same units (£m with £m).
- Compare firm growth with market growth: faster means share rises, slower means share falls, equal means share is unchanged.
- State the meaning for the business.
Reminder. Pennivale Cycles sold £28.8m in a £360m market. A year later the market was £414m and Pennivale sold £33.12m. Market growth is 54 ÷ 360 = 15%. Sales growth is 4.32 ÷ 28.8 = 15%. Share is 28.8 ÷ 360 = 8% before and 33.12 ÷ 414 = 8% after, so no share was gained.
Interpreting data
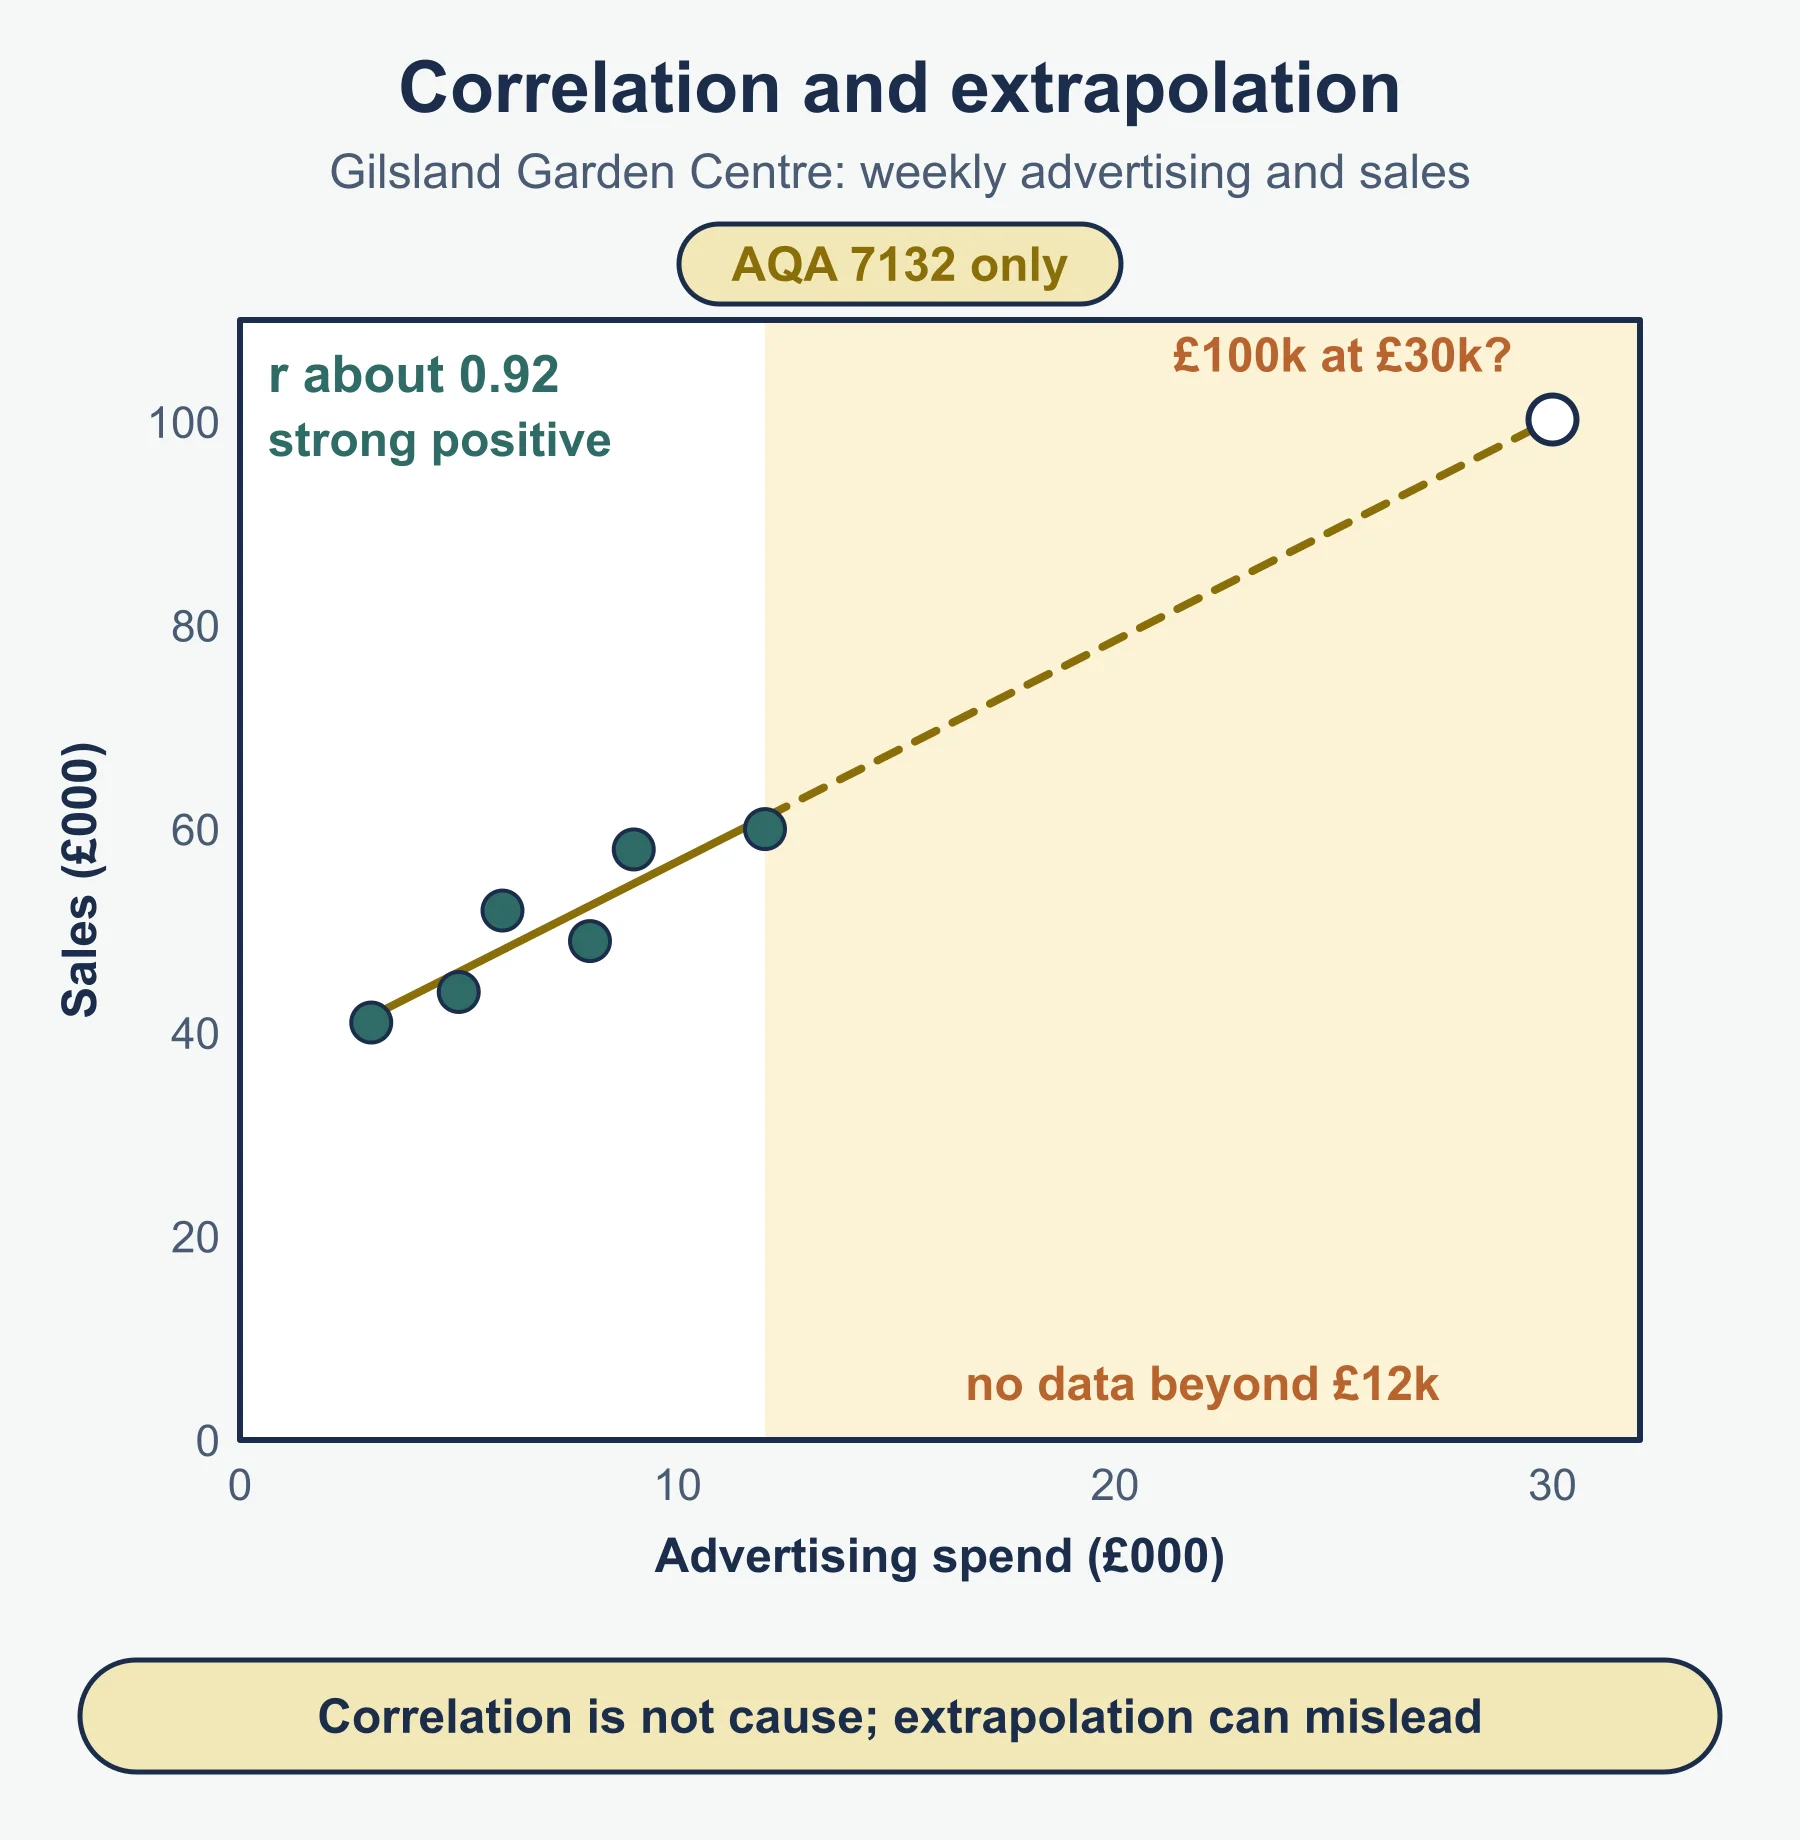
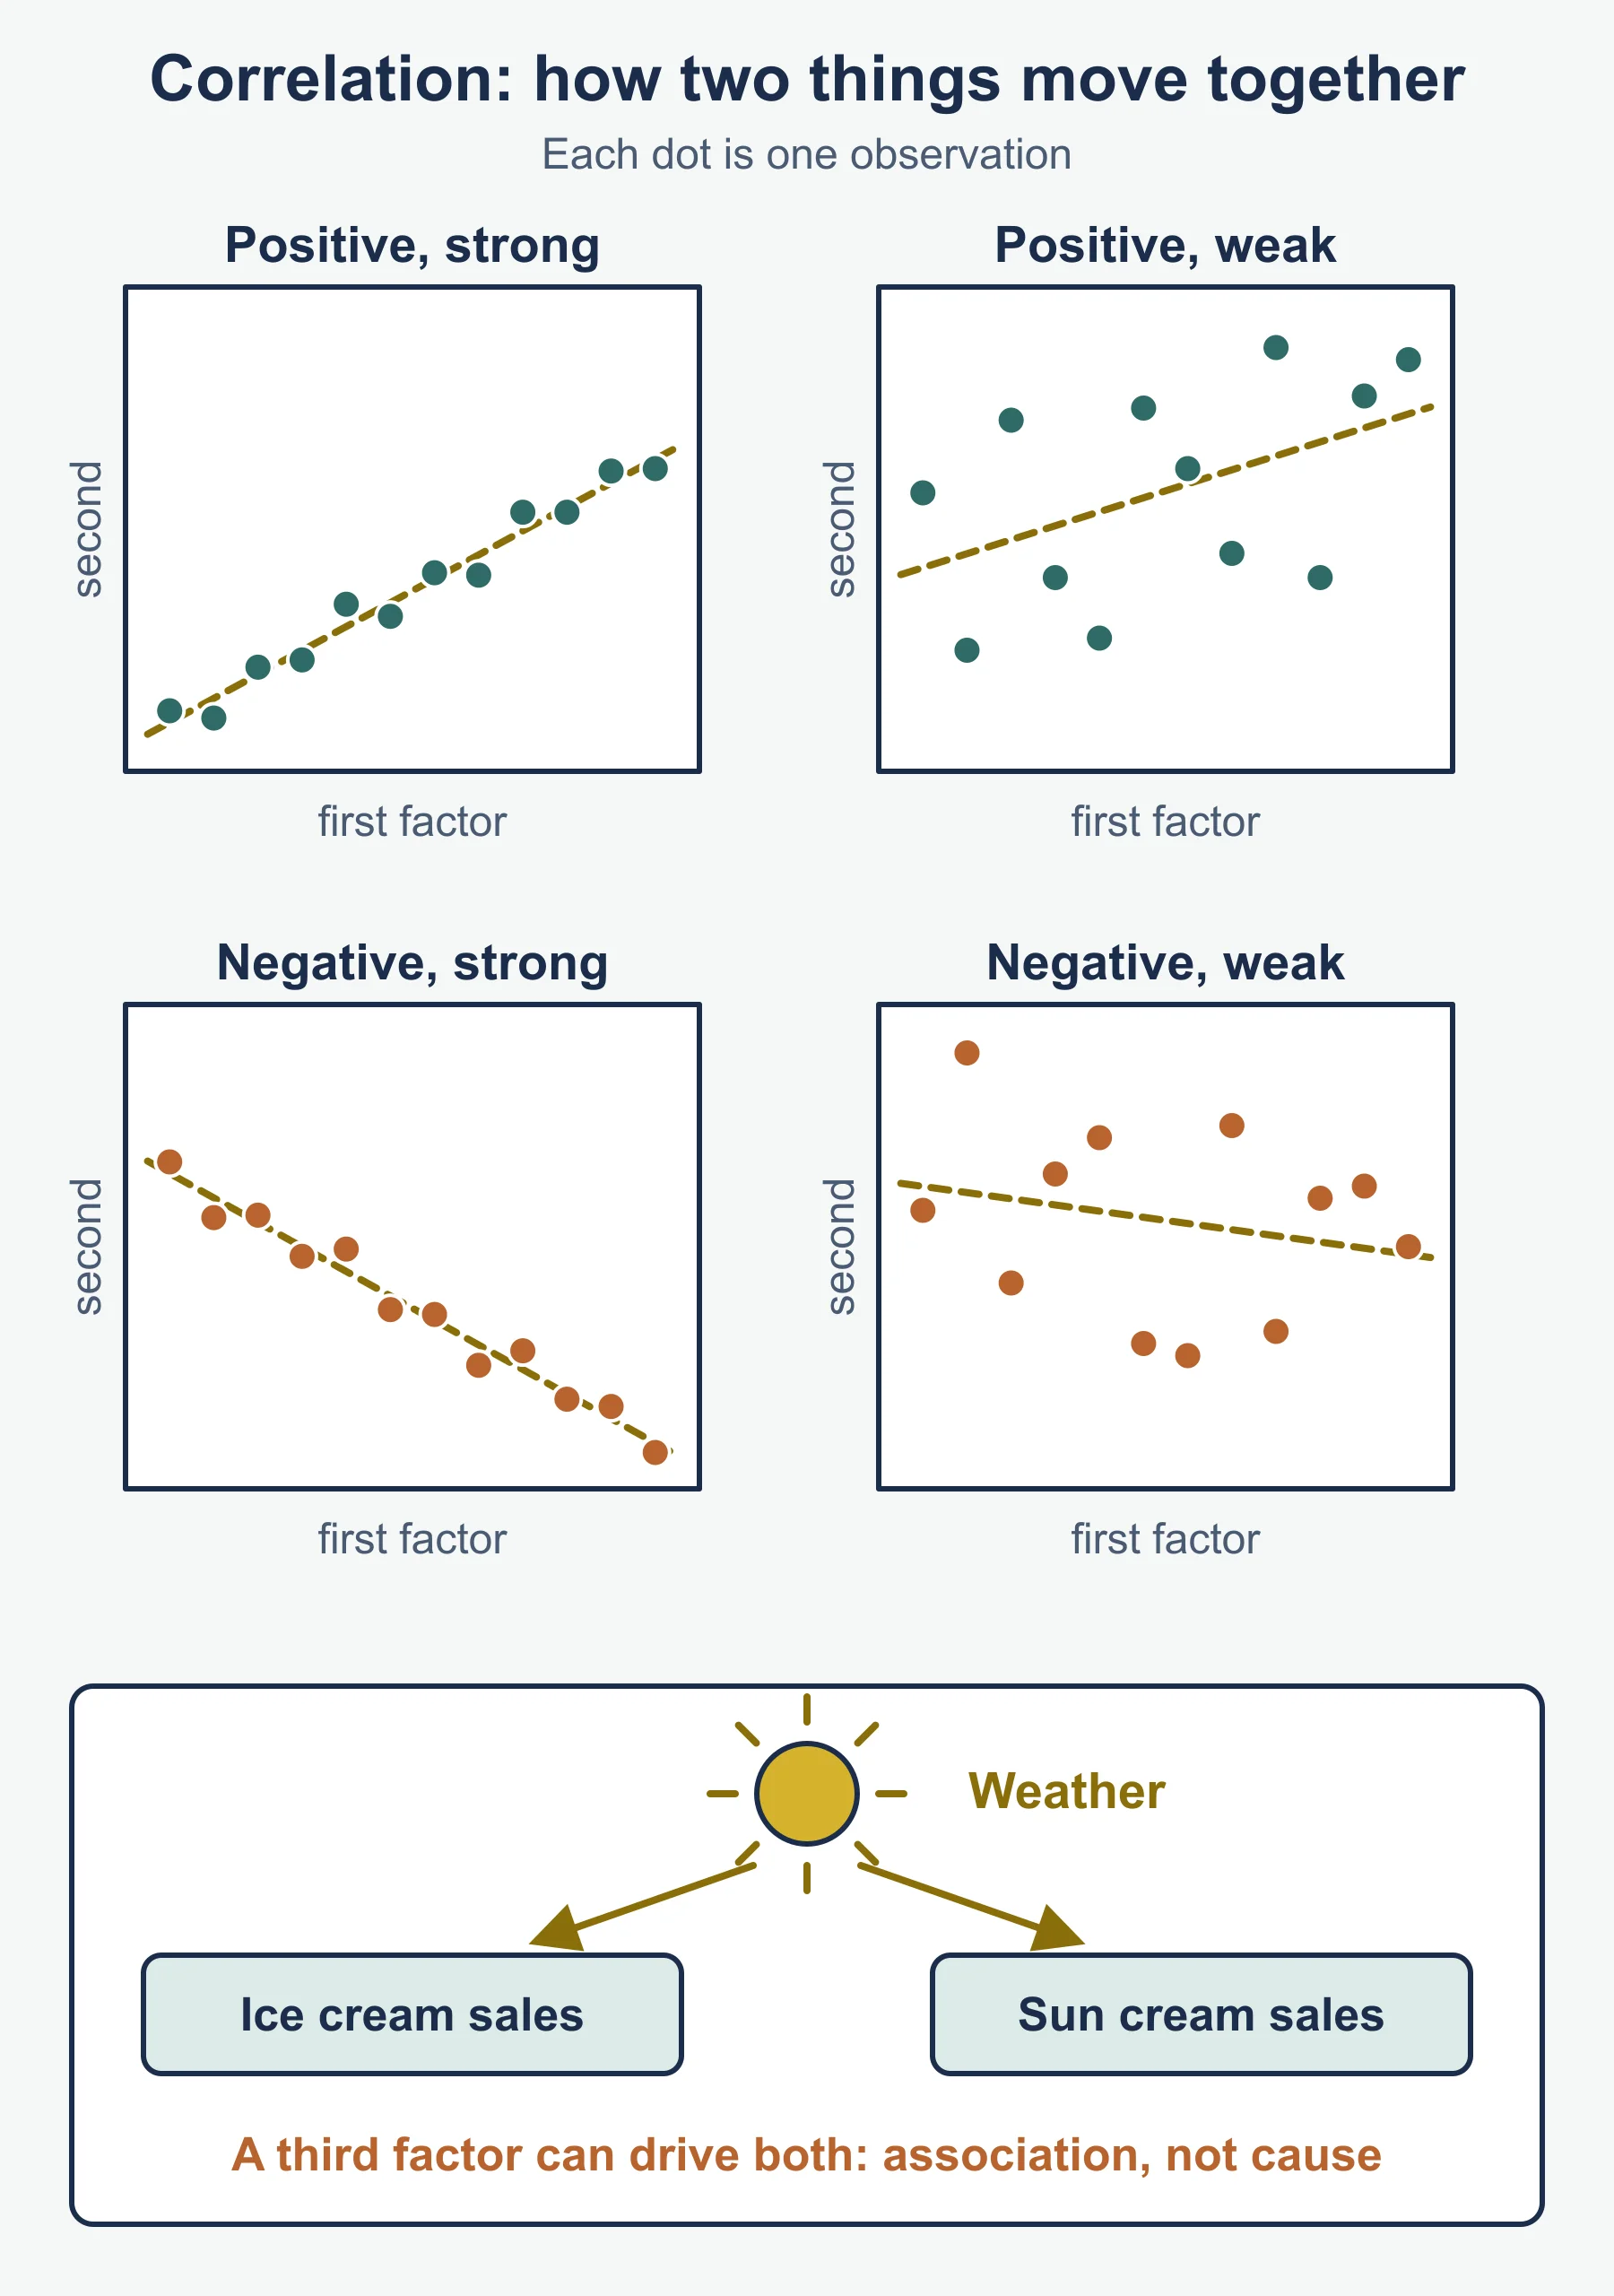
- Positive correlation: both variables rise together. Negative: one rises as the other falls. Strength: the nearer the points to a line, the stronger.
- Correlation is not causation. A third factor may explain both.
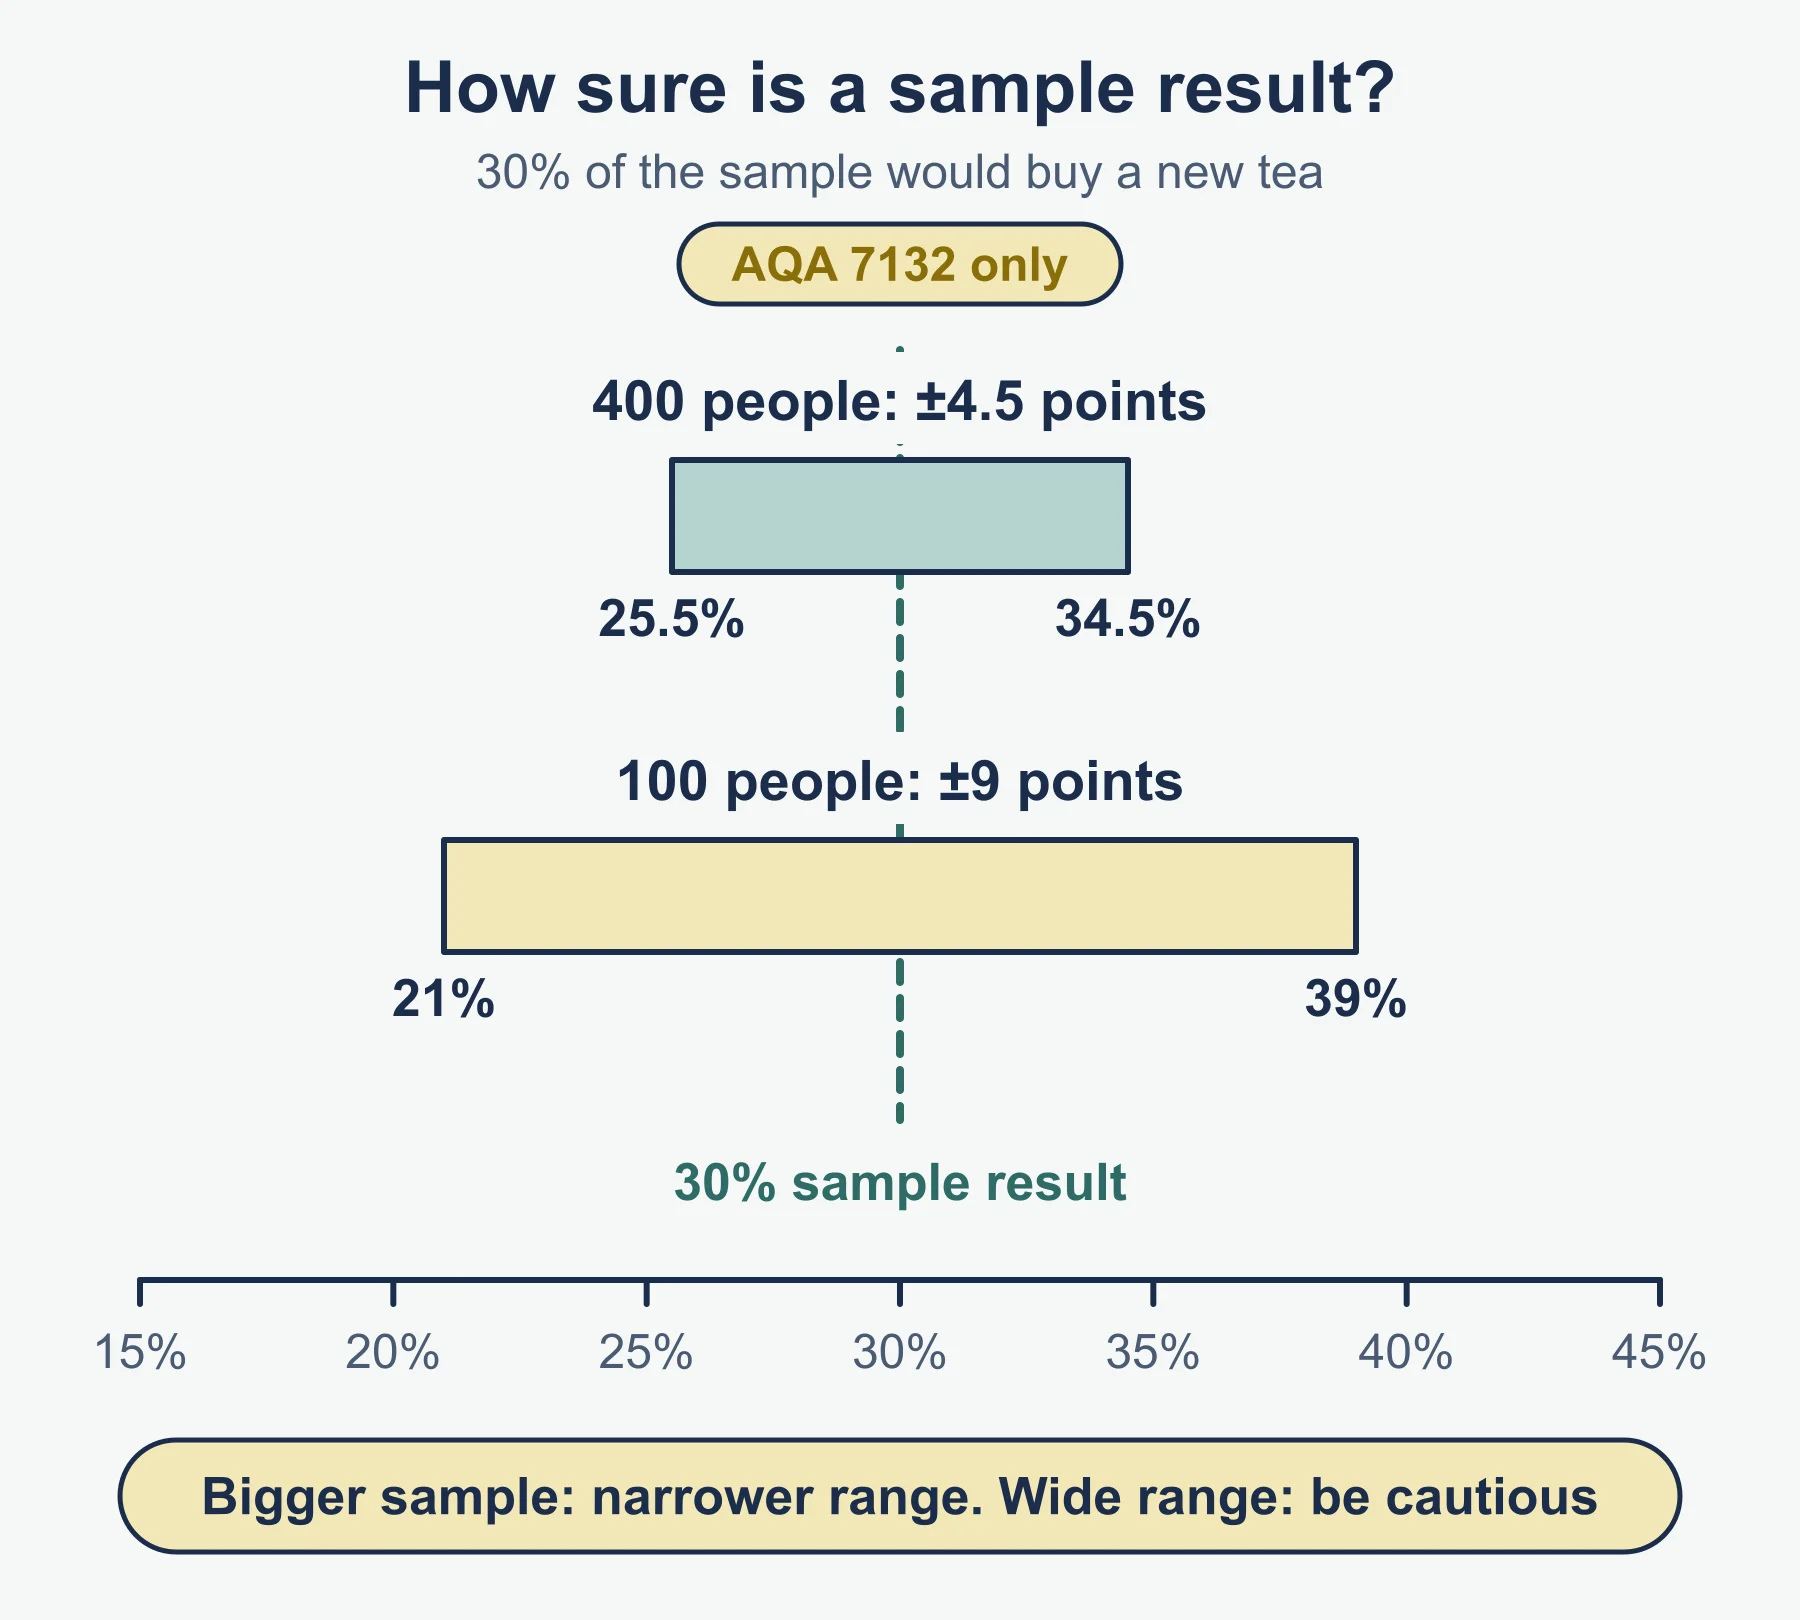
- Confidence intervals: a narrower range means more reliable data; a larger, representative sample narrows it. You need the concept only.
- Extrapolation: reliable only close to the existing data; trends bend, saturate or break.
- Technology: loyalty cards, website analytics, social media listening and large data sets give speed and detail; risks are cost, poor data quality and privacy concerns.
- Data in decisions: check age, sample size, bias, cost and relevance.
Elasticity interpretation
| Value | Meaning | Best price move for revenue |
|---|---|---|
| PED above 1 (ignoring sign) | Elastic | Cut price |
| PED below 1 | Inelastic | Raise price |
| YED above 0 | Normal good | Demand rises with income |
| YED above 1 | Luxury-type good | Demand rises faster than income |
| YED below 0 | Inferior good | Demand falls as income rises |
Elasticity helps pricing, forecasting and choosing which market to serve in a boom or a recession.
Reminder. A loaf of bread: PED −0.6 and a 5% price cut. Quantity rises 0.6 × 5 = 3%. Revenue is 0.95 × 1.03 = 0.9785 of the old figure, a fall of about 2.2%. With inelastic demand a cut loses revenue.
3.3.3 Segmentation, targeting, positioning
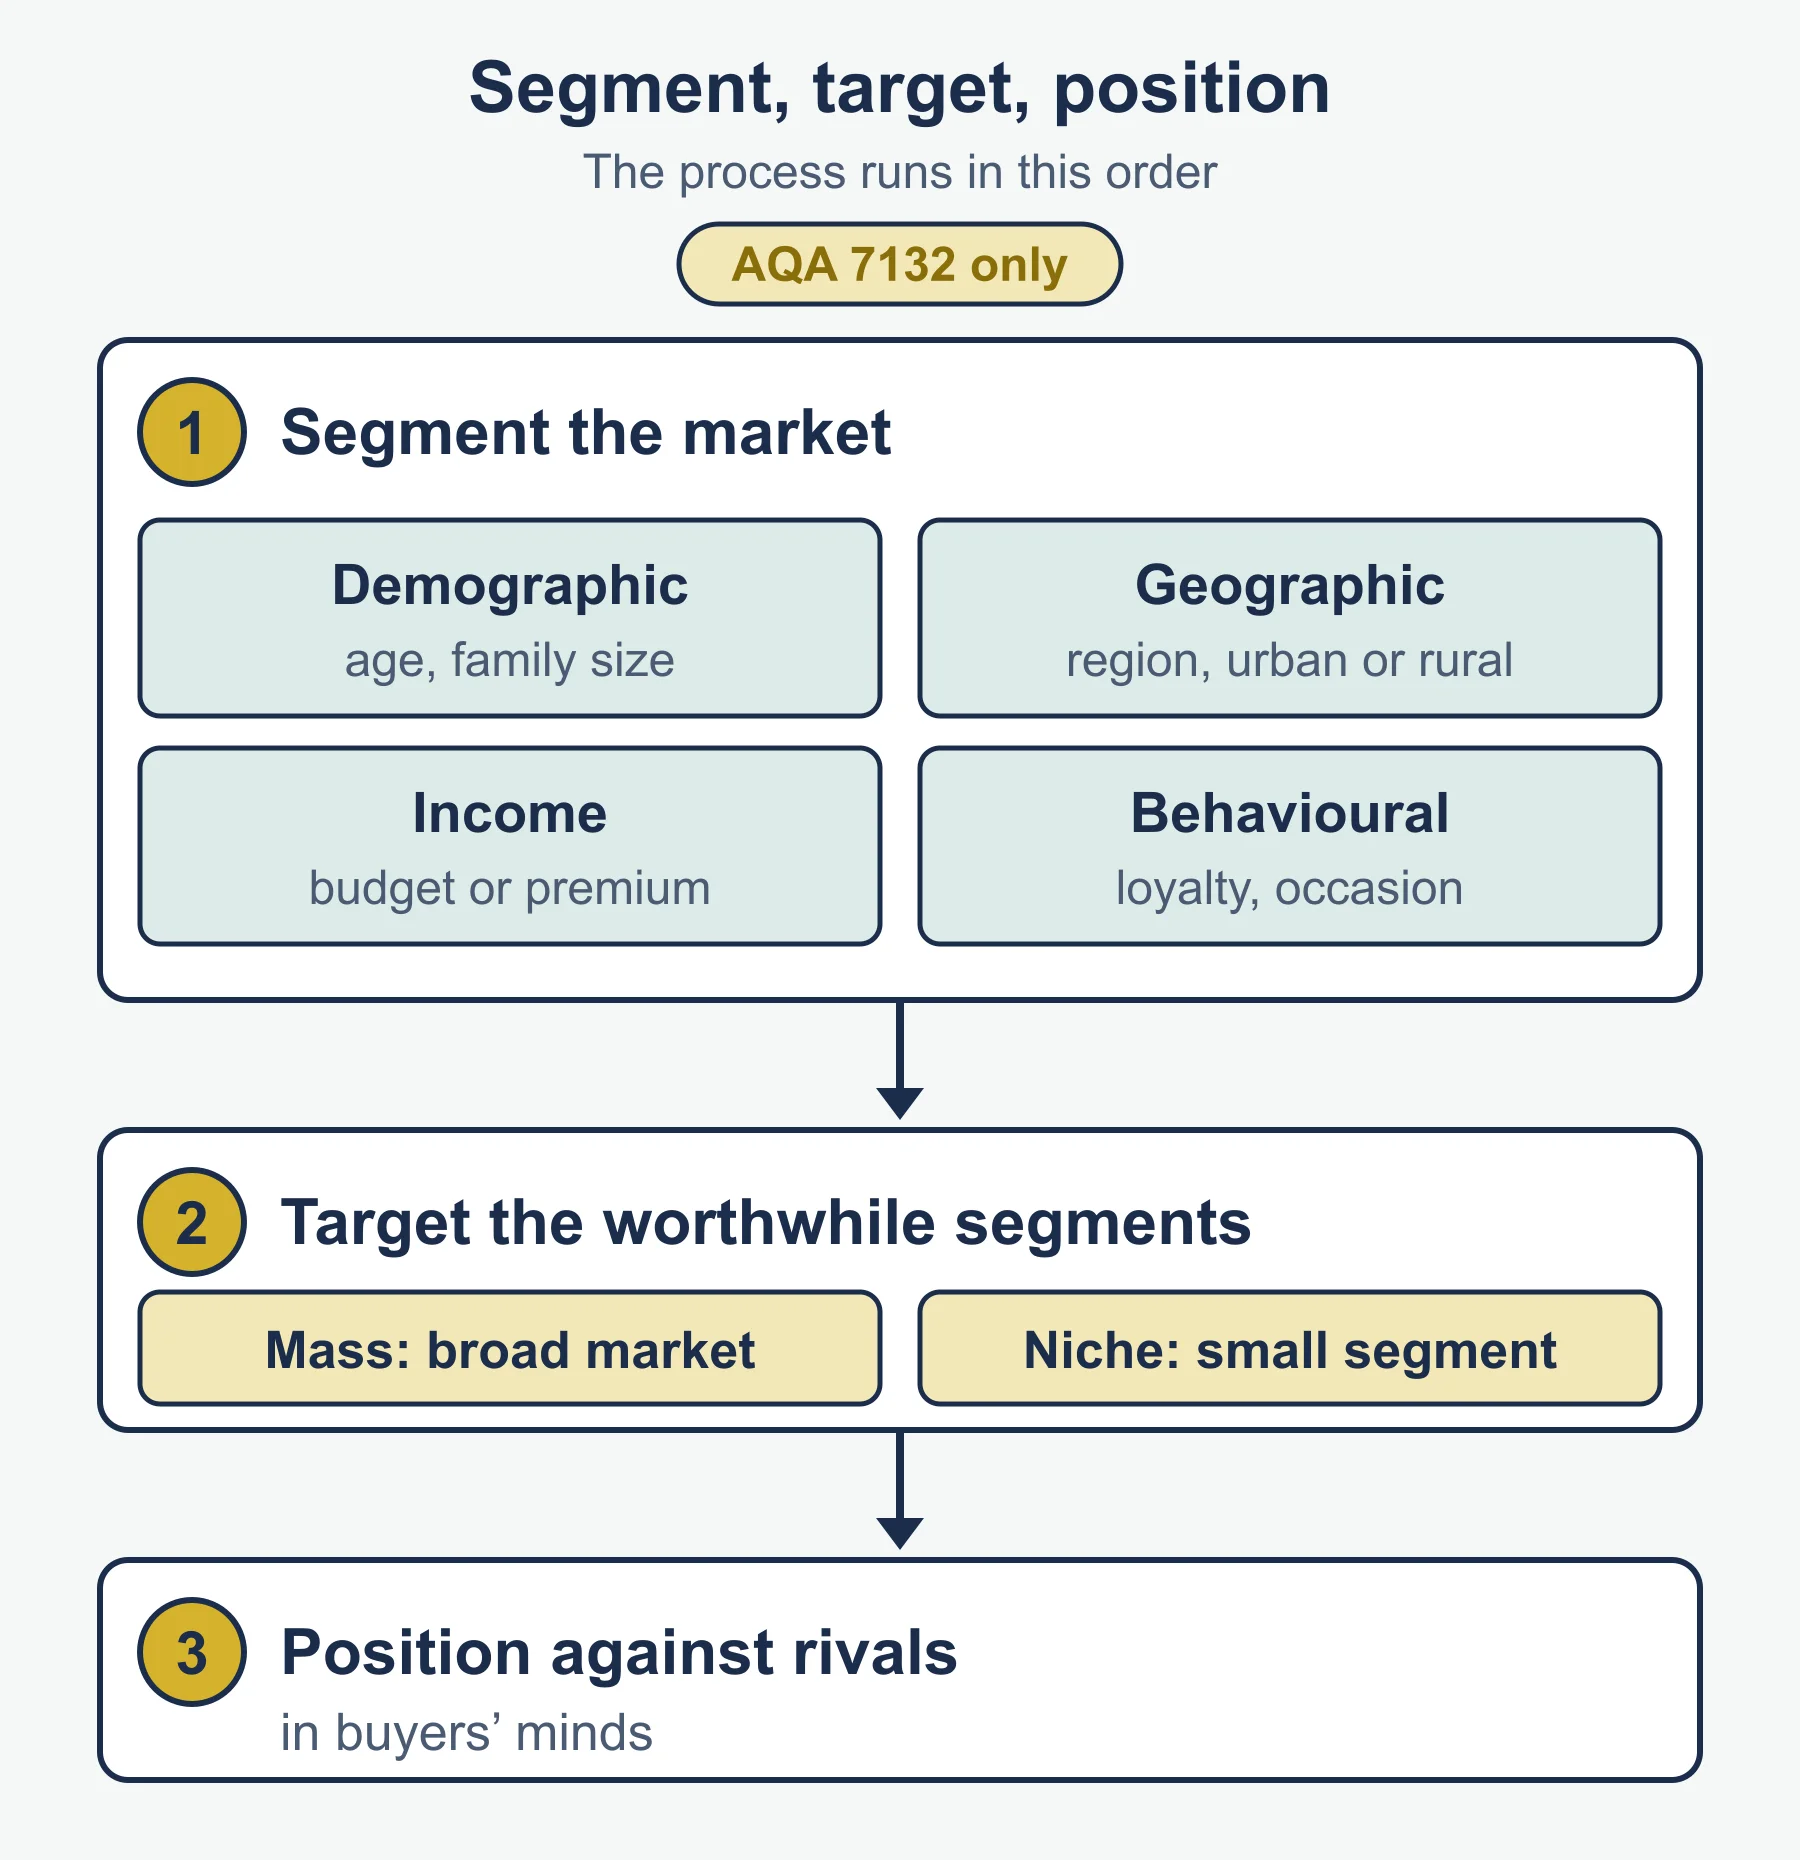
- Segment: split the market (demographic, geographic, income, behavioural).
- Target: choose segments; mass marketing (broad, one mix) or niche (small, specialised).
- Position: decide how buyers should see the product against rivals.
Influences on target and position: segment size, growth, profit potential, competitors, resources, brand image, objectives.
3.3.4 The marketing mix
| P | Key decisions and models |
|---|---|
| Product | Portfolio analysis and Boston Matrix; product life cycle and extension strategies; new product development |
| Price | Penetration, price skimming, cost-plus, competitor-based, dynamic pricing |
| Promotion | Promotional mix; value of branding |
| Place | Channels; multi-channel distribution |
| People | Staff skills and attitude |
| Process | How the service or order is delivered |
| Physical environment | Setting, layout, website, packaging |
Product types. Convenience: frequent, low-effort. Shopping: compared before buying. Specialty: loyal buyers search for the brand. Also consider goods and services, consumer and industrial.
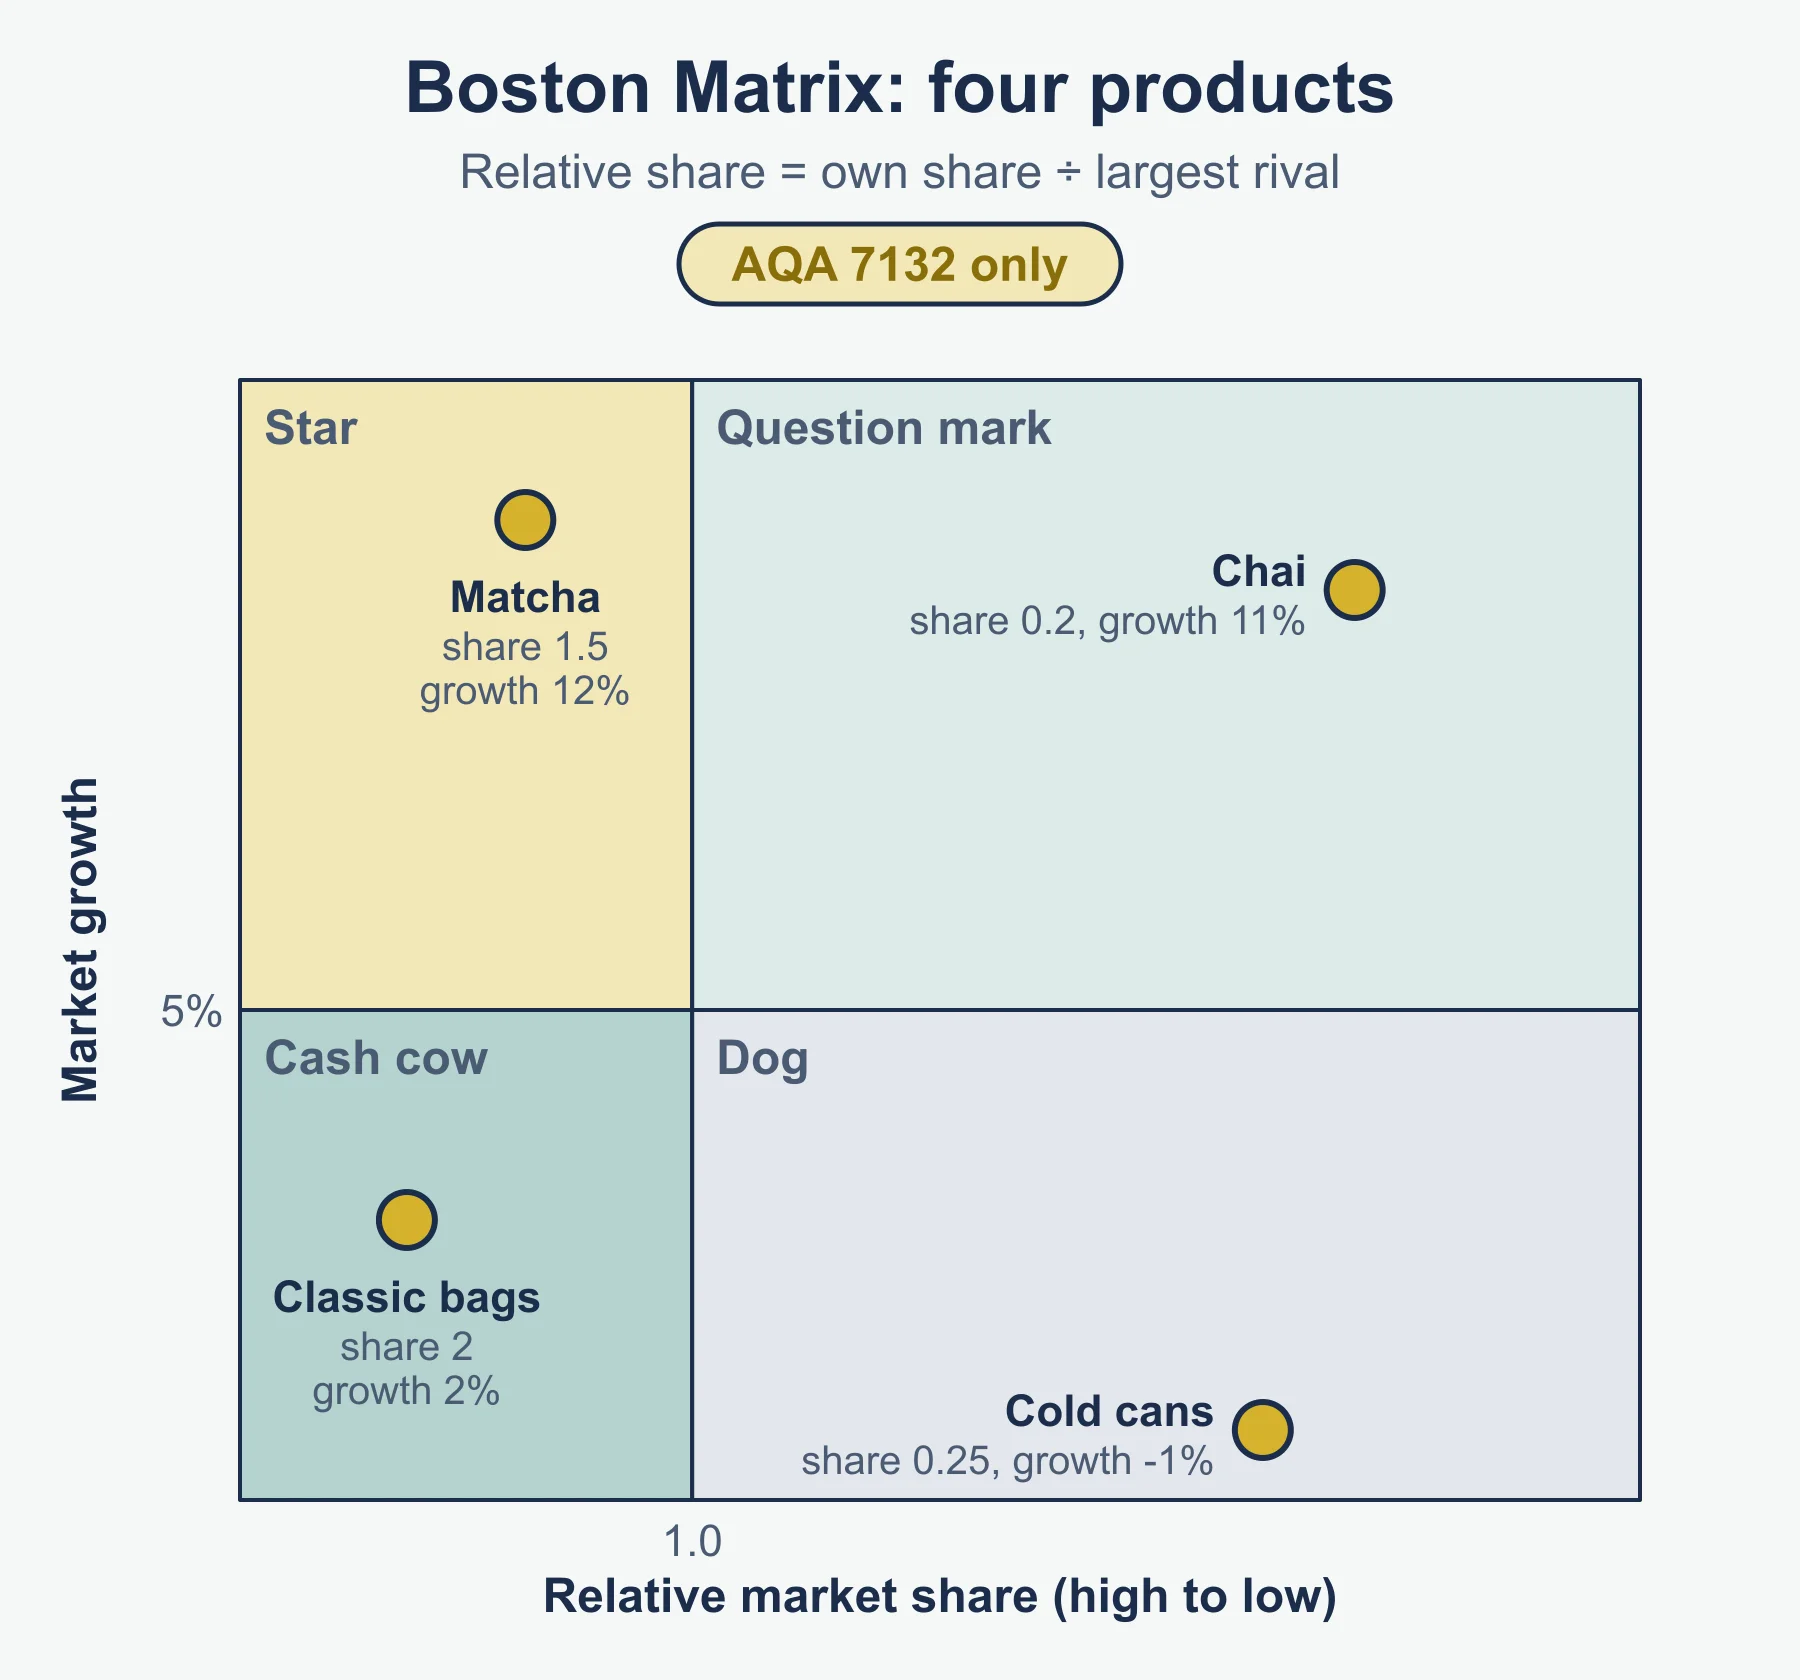
Boston Matrix (axes: market growth and relative market share). Relative share (standard form) = own share ÷ largest rival’s share.
| High relative share | Low relative share | |
|---|---|---|
| High growth | Star: invest | Question mark: build or drop |
| Low growth | Cash cow: harvest cash | Dog: consider withdrawal |
Reminder. Own share 18%, largest rival 12%: relative share 1.5. Own share 10%, rival 25%: relative share 0.4.
Product life cycle. Introduction, growth, maturity, decline. Extension strategies: new packaging, markets, uses, promotion, price or modifications.
Integration. The mix should fit the product life cycle position, Boston Matrix position, type of product, objectives, target market, competition and positioning.
Digital marketing and e-commerce. Value: reach, targeting, measurability, lower costs. Drawbacks: competition, delivery and returns, security, skills needed. Relationship marketing builds long-term loyalty.
Evaluation prompts
Use these to turn description into judgement in longer answers.
- Is the objective realistic given capacity, cash and competitors?
- How reliable is the data: sample size, age, bias, cost?
- Does the Boston Matrix result depend on how the market is defined?
- Will extension strategies cost more than the extra sales are worth?
- Does the price fit the positioning and the target market?
- Does the digital channel suit the age and habits of the customers?
- Which stakeholders gain or lose, and how might they respond?
- What are the effects on operations, finance and human resources?
Must-know distinctions
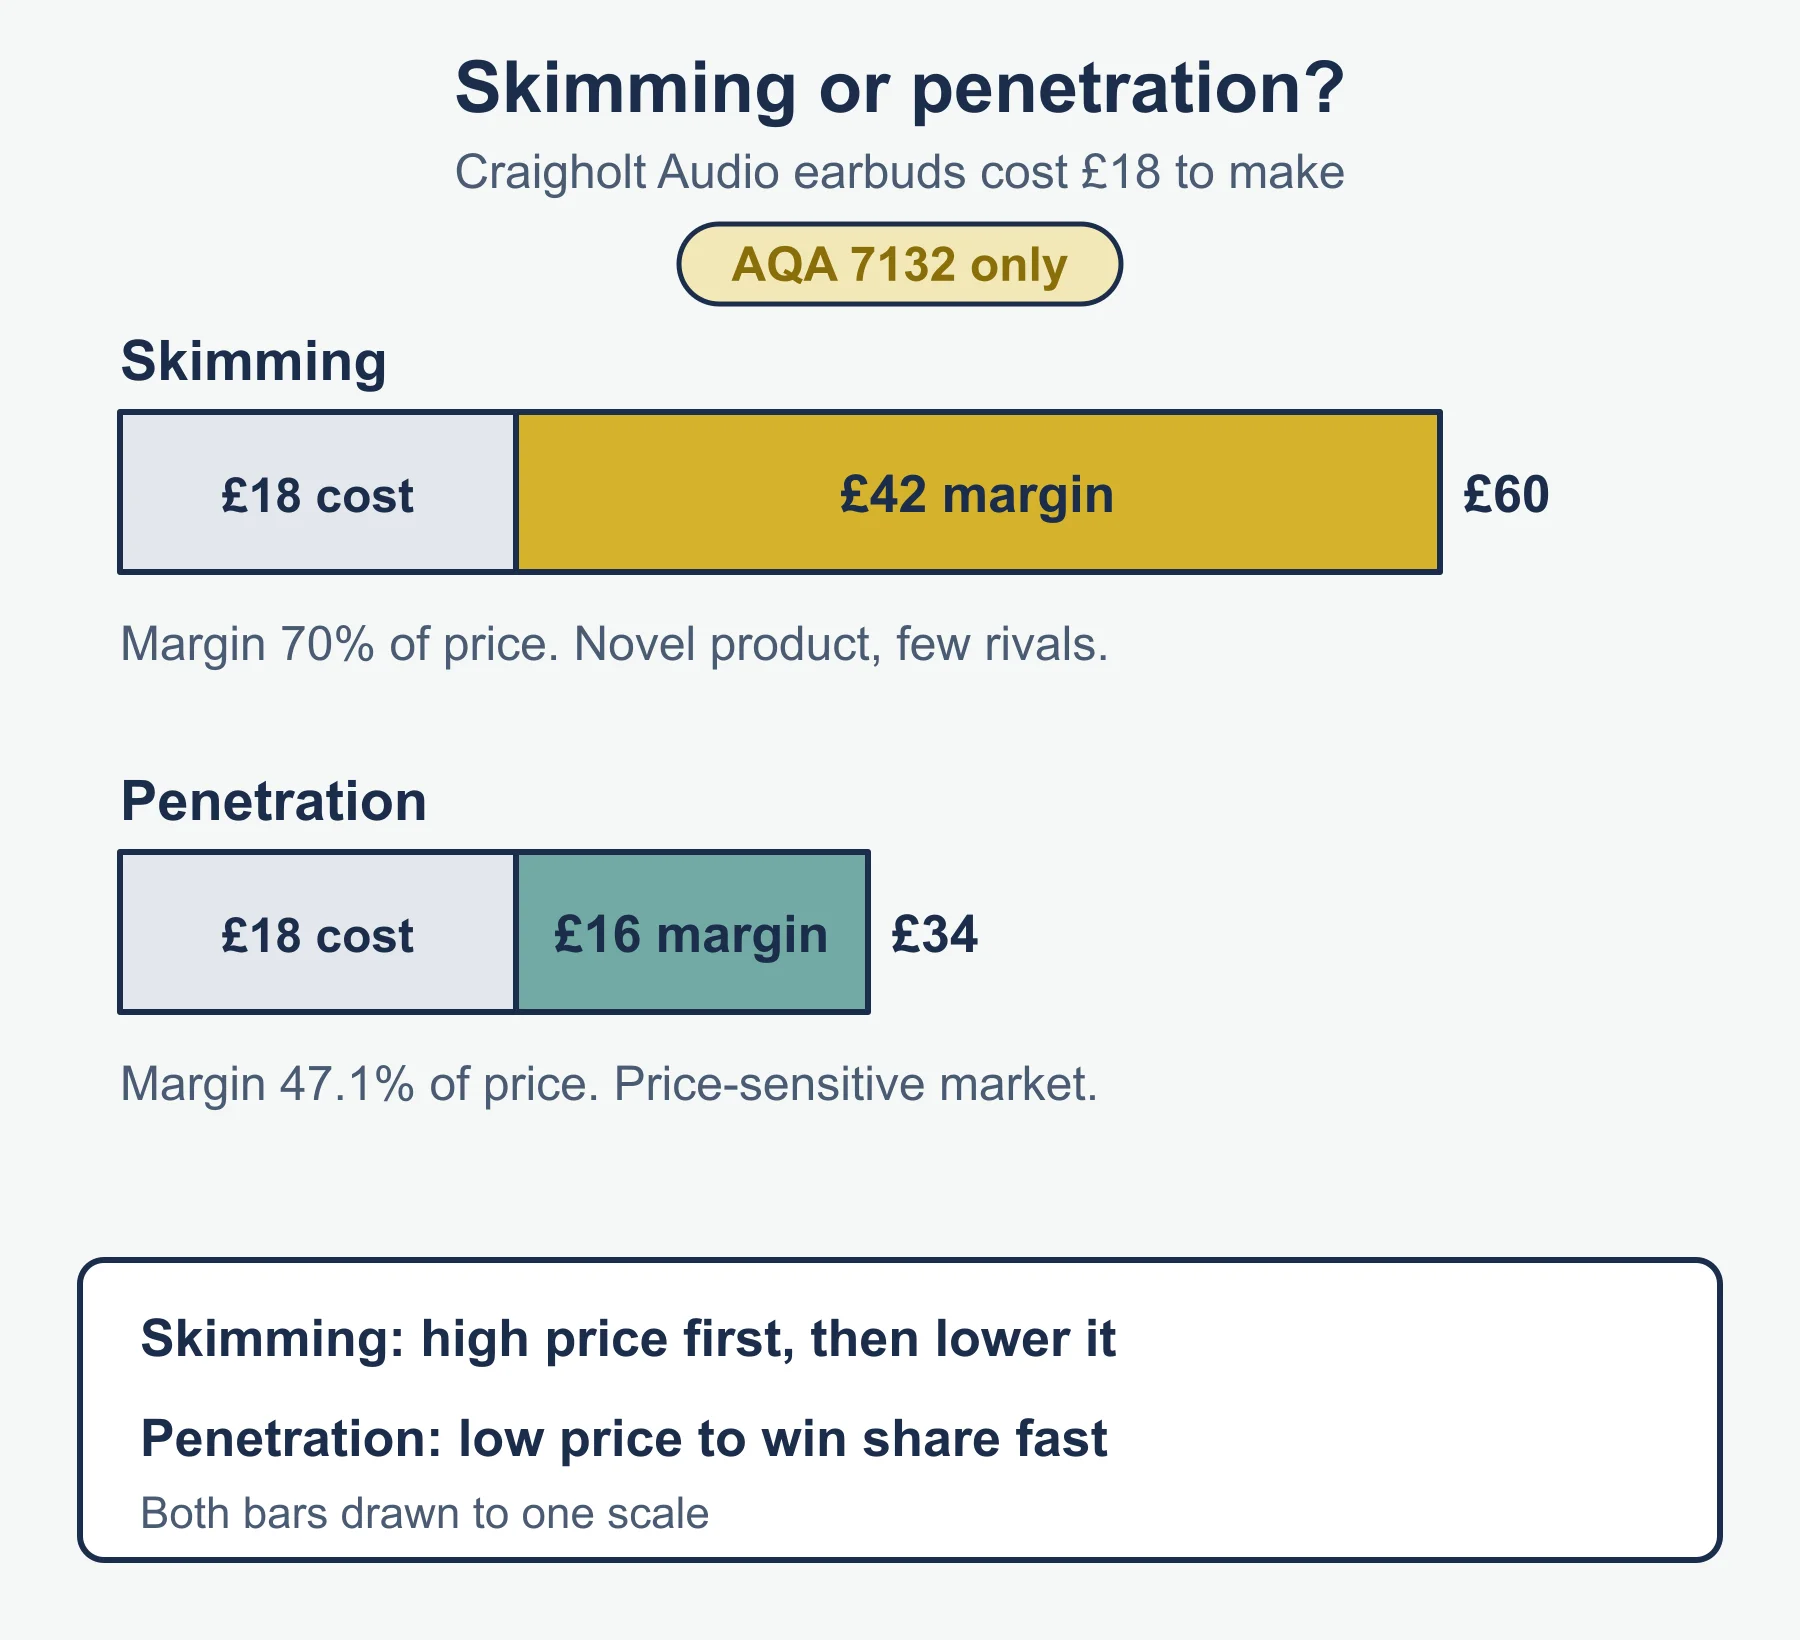
- Penetration vs skimming: low entry price for share against high entry price for margin from early adopters.
- Volume vs value: units against revenue.
- Market share vs relative market share: share of the whole market against share compared with the largest rival.
- Niche vs mass: small specialised segment against broad market.
- Primary vs secondary: new data against existing data.
- Qualitative vs quantitative: why against how many.
Quick self-test
- Define market share.
- Sales rose from £16m to £18.4m. Calculate sales growth.
- A firm has sales of £21m and a 7.5% share. Calculate the market size.
- Sales of £9.9m in a £165m market. Calculate market share.
- Name the four segmentation methods in the specification.
- PED is −1.5. Price rises 6%. Give the change in quantity and in revenue.
- YED is +2.2 and incomes rise 2.5%. Give the change in demand.
- Own share is 18%, the largest rival has 12% and market growth is 2%. Give the relative share and the Boston Matrix category.
- Give one reason a firm might choose price skimming.
- Why should you be cautious about extrapolation?
- Name the three Ps added to the traditional four.
- What does a wide confidence interval suggest?
Answers
- A firm’s sales as a percentage of total market sales.
- 2.4 ÷ 16 × 100 = 15%.
- £21m ÷ 0.075 = £280m.
- 9.9 ÷ 165 × 100 = 6%.
- Demographic, geographic, income, behavioural.
- Quantity falls 9%; revenue is 1.06 × 0.91 = 0.9646 of the old figure, a fall of about 3.5%.
- Demand rises 5.5%.
- Relative share is 1.5; high share, low growth, so a cash cow.
- A novel product with few rivals and buyers willing to pay a premium, or a need to recover high development costs quickly.
- The trend may not continue outside the range of data observed.
- People, process, physical environment.
- The sample result is imprecise (often a small sample), so decisions based on it carry more risk.
Where marks are usually lost
- Using the formula without units or without stating what the result means for the business.
- Treating market share and sales growth as the same thing.
- Dividing by the new figure rather than the original when calculating growth.
- Claiming correlation proves cause.
- Using absolute share instead of relative share on the Boston Matrix.
- Describing the 7Ps as a list with no link to the target market or the case.
- Giving the same recommendation for any elasticity value.
- Writing a one-sided evaluation of digital marketing with no judgement about the firm’s circumstances.
Frequently asked questions
What marketing objectives are listed in the AQA specification? Sales volume, sales value, market size, market growth, sales growth, market share and brand loyalty.
What are the four segmentation methods in AQA 7132? Demographic, geographic, income and behavioural segmentation.
Why should you be cautious about extrapolation? Extrapolation is reliable only close to the existing data, because trends can bend, saturate or break outside the range observed.
What does a wide confidence interval suggest? A wide confidence interval means the sample result is imprecise, often because the sample is small, so decisions based on it carry more risk. A larger, representative sample narrows the interval.
Official syllabus
AQA AS and A-level Business specification (7131 and 7132), section 3.3 Decision making to improve marketing performance, published by AQA.
Get free revision emails (optional)
Occasional emails with practice questions, worked explanations and links to free resources for the qualification and subjects you choose. No spam, and you can unsubscribe from any email. The free tools on this site never need an email.
Related resources
-
Study guides
AQA A-Level Business: Marketing management (7132)
Study guide to marketing management for AQA A-Level Business (7132): objectives, market data, segmentation and the 7Ps, with worked examples.
Business · AQA · A Level
Read guide -
Practice questions
AQA A-Level Business: Marketing management (7132) – Practice Questions
Original practice questions with worked answers on marketing management for AQA A-Level Business (7132): calculations, data, models and the mix.
Business · AQA · A Level
Try questions -
Study guides
AQA A-Level Business: Operational management (7132)
Study guide to operational management for AQA A-Level Business: objectives, productivity, capacity, lean, quality, inventory and supply chains.
Business · AQA · A Level
Read guide
Related articles
-
teaching
A Level tuition in Dubai: Cambridge or Pearson Edexcel International A Level?
Schools in Dubai and Abu Dhabi teach either Cambridge International AS & A Level or Pearson Edexcel International A Level. How the two are structured, why it matters for tuition, and how online classes from Lahore work.
9 October 2026
-
curriculum guides
Choosing subjects at IGCSE and A Level
How subject choices at 14 and 16 affect university options later, and how to keep pathways open without overloading a timetable.
28 July 2026
Studying this with a teacher
Working through Business A LEVELS?
This page is free and stays free. If you would rather be taught it, Marlbridge runs Business classes one-to-one and in small groups of up to 15, online in your own time zone. The first trial class is free. WhatsApp replies within an hour (8am–11pm Pakistan time, every day); email the same day.
AQA Business teachers at Marlbridge
