
Study Guides
AQA A-Level Business: Marketing management (7132)
Study guide to marketing management for AQA A-Level Business (7132): objectives, market data, segmentation and the 7Ps, with worked examples.
- Subject
- Business
- Level
- A LEVELS
- Topic
- Marketing management
- Author
- Marlbridge Academic Team
- Updated
- Reviewed by
- Salman Ahmad (what this means)
Aligned to AQA A Level Business (7132), For first teaching from September 2023. Official specification .
Syllabus page (what it covers and how it is assessed): AQA A Level Business.
Syllabus points this page covers
7132
- 3 Marketing management (whole topic)
Found an error? Report a correction.
Need help with this topic? Request a free trial class for A Level Business (7132).
This guide covers the whole marketing section of the AQA AS and A-level Business specification (7131/7132), numbered 3.3.1 to 3.3.4 in the specification text, for A-level Business (7132). The specification says each A-level paper assesses all the content, so marketing can appear on Paper 1, 2 or 3 in any question style. Where the specification gives no formula, this guide gives the standard form and says so.
Related pages: revision notes, practice questions, stakeholders, the AQA A-Level Business hub, the checklist and free diagnostics. The AS marketing guide follows a later specification text but is a useful second explanation.
Map of the topic
| Section | What you must cover |
|---|---|
| 3.3.1 Setting marketing objectives | Value of objectives; the five listed objectives; external and internal influences |
| 3.3.2 Understanding markets and customers | Primary and secondary research, qualitative and quantitative data, market mapping, calculations, sampling, correlation, confidence intervals, extrapolation, technology, elasticity, using data |
| 3.3.3 Segmentation, targeting, positioning | Process and value; four segmentation methods; niche and mass marketing; influences |
| 3.3.4 The marketing mix | 7Ps, product, price, promotion, place, people, process, physical environment, integration, digital marketing and e-commerce |
The specification asks you to consider five themes throughout: technology (digital marketing, social media, relationship marketing, dynamic pricing), ethical and environmental influences, market conditions and competition, competitiveness, and links with other functions.
3.3.1 Setting marketing objectives
Marketing objectives give the function a target, a way to judge success and a link to the corporate objectives. They let operations, finance and human resources plan for the demand marketing expects. The specification lists:
- sales volume (units sold) and sales value (revenue)
- market size (the total sales of all firms)
- market growth and sales growth
- market share (the firm’s percentage of the market)
- brand loyalty (repeat purchase and resistance to rivals).
External influences: competitors’ actions, economic conditions, technology, social and ethical attitudes, environmental concerns and legislation (in general terms). Internal influences: corporate objectives, finance available, production capacity, staff skills and the firm’s brand and product range.
Example. Ostrelby Teas wants share to rise from 8% to 10% in two years. The target is only realistic if operations can raise output and finance can fund the extra stock and promotion. A rival’s price war would be an external influence that could force a rethink.
3.3.2 Understanding markets and customers
Research and market mapping
Primary research is gathered first-hand (surveys, interviews, focus groups, trials). It fits the firm’s question but costs more and takes longer. Secondary research uses existing data (government statistics, trade reports, the firm’s sales records). It is cheaper and quicker but may be out of date or not quite relevant.
Quantitative data is numerical (sales, prices, percentages). Qualitative data explains attitudes and motives (why buyers prefer a brand). Good research uses both. Market mapping places brands on a chart with two scales (for example price and quality), showing where rivals cluster and where a gap lies.
Calculations
You must be able to calculate market growth, sales growth, market share and market size.
- Market growth (%) = change in market size ÷ original market size × 100
- Sales growth (%) = change in sales ÷ original sales × 100
- Market share (%) = firm’s sales ÷ total market sales × 100
- Market size = firm’s sales ÷ market share (rearranged)
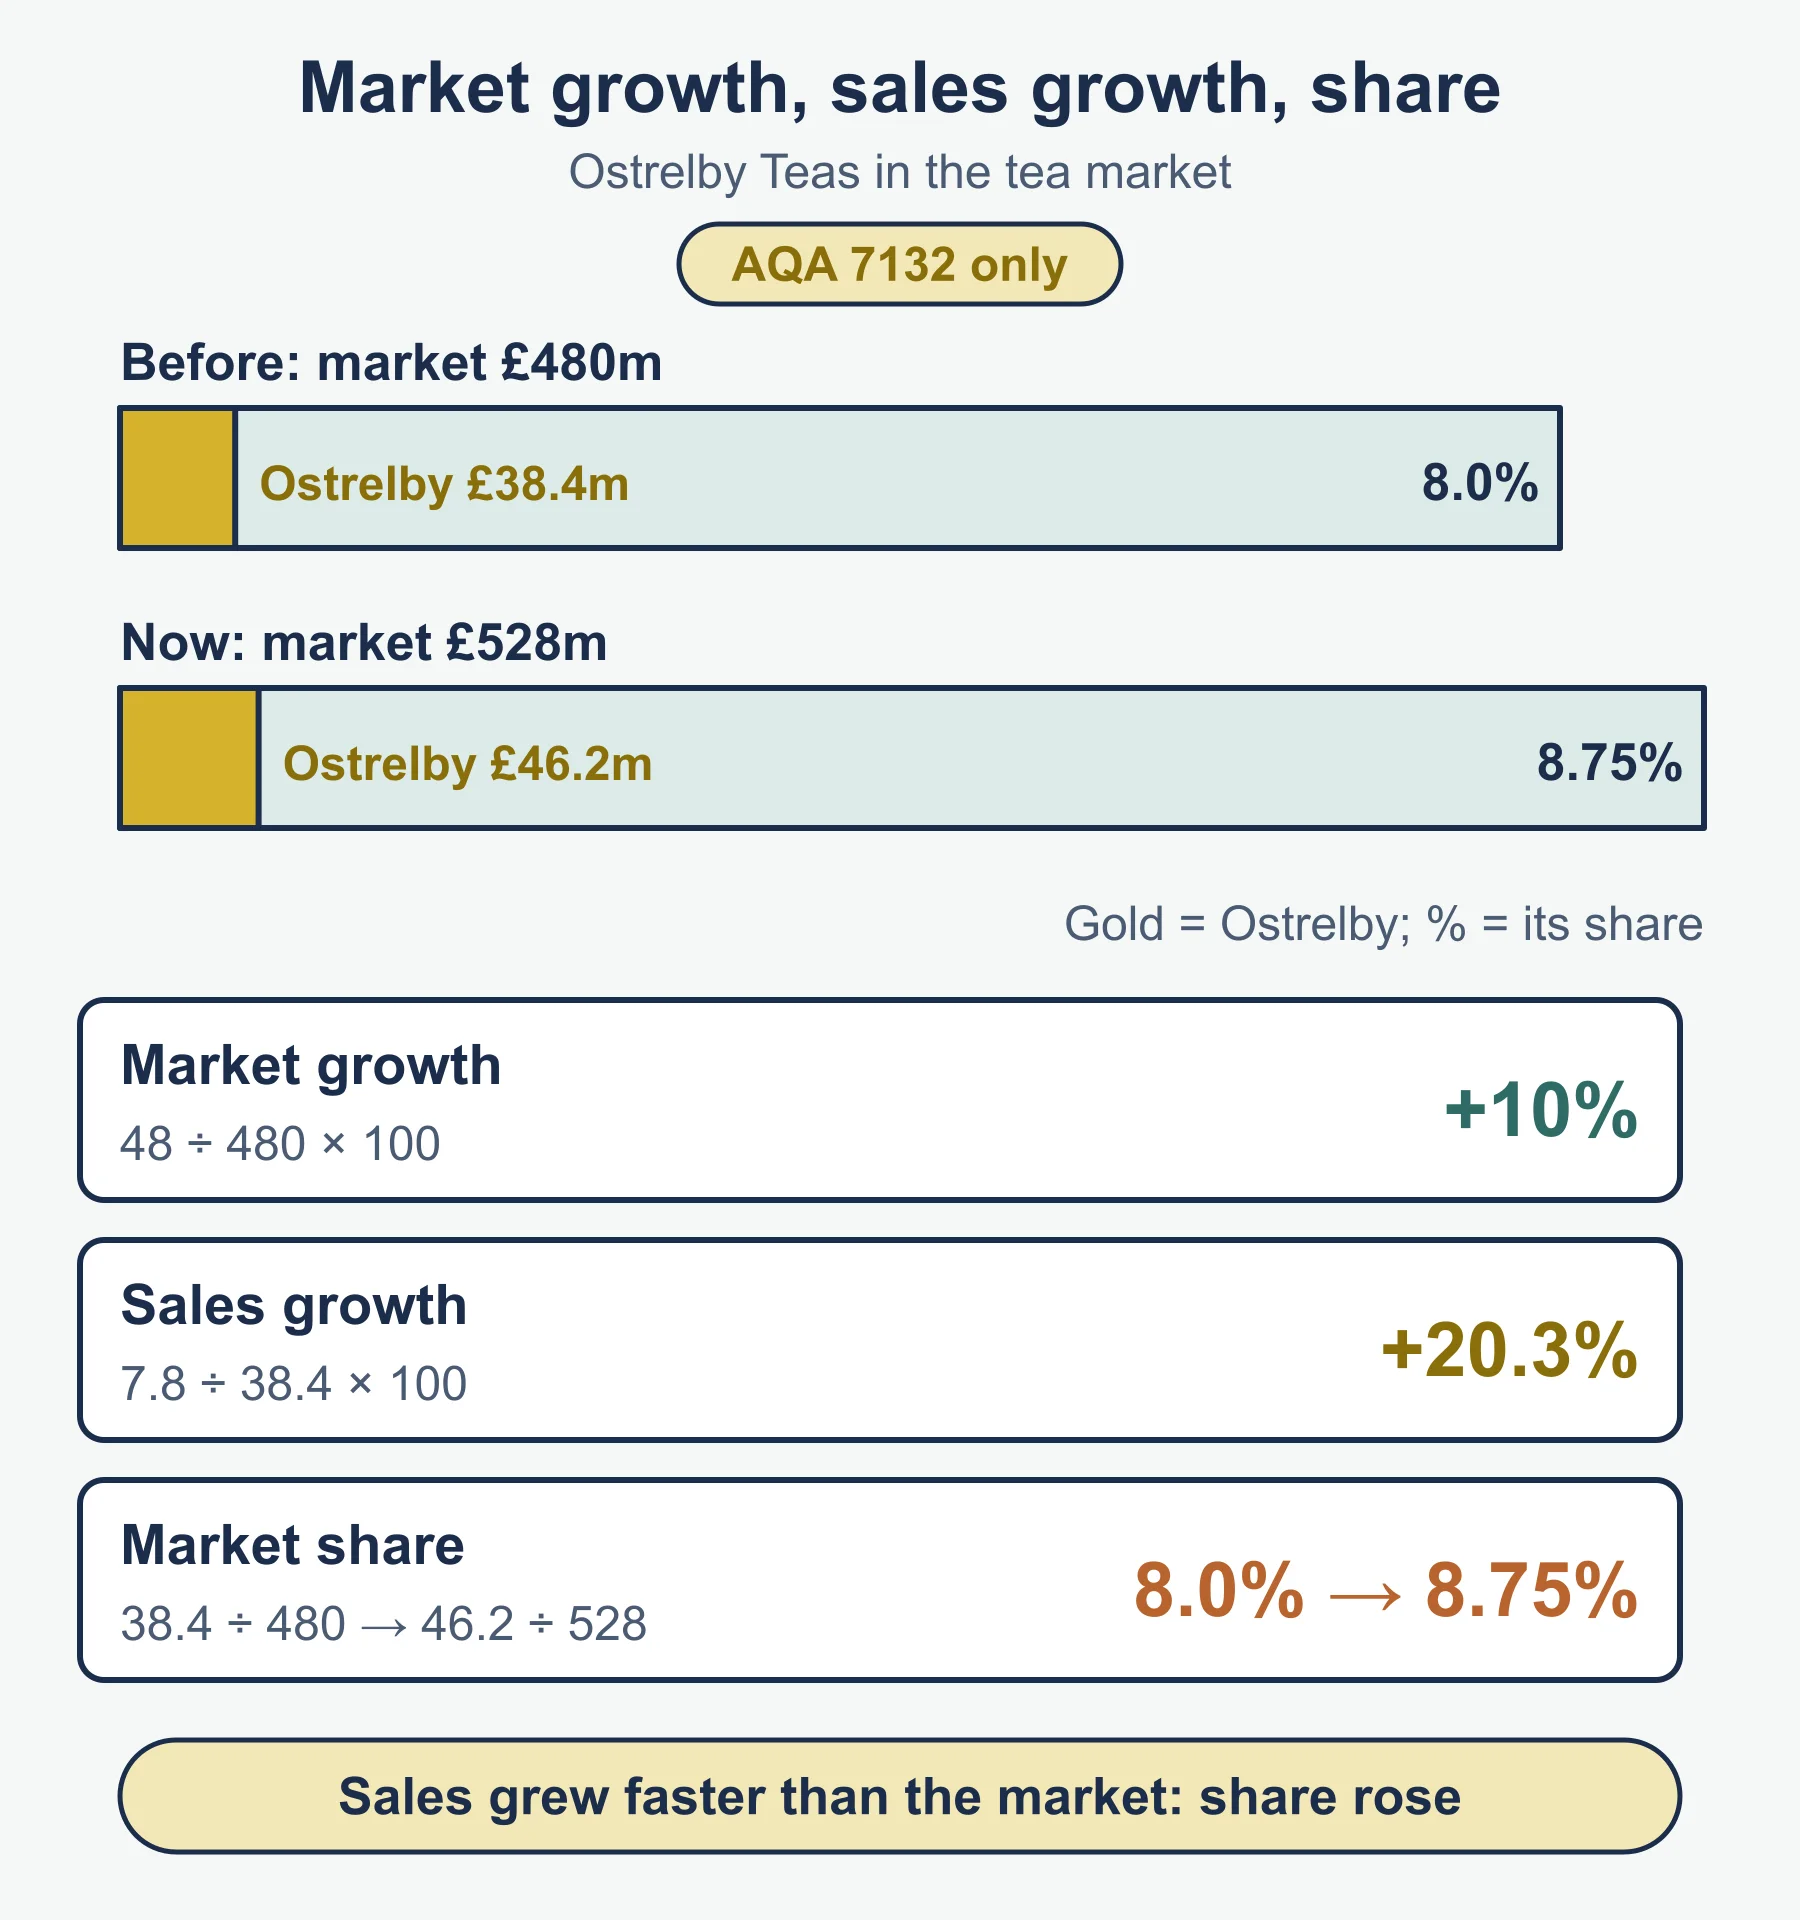
Worked example. The tea market grew from £480m to £528m. Ostrelby Teas sales rose from £38.4m to £46.2m.
- Market growth = 48 ÷ 480 × 100 = 10%.
- Sales growth = 7.8 ÷ 38.4 × 100 = 20.3%.
- Share was 38.4 ÷ 480 = 8.0%, now 46.2 ÷ 528 = 8.75%.
- Check: £46.2m ÷ 0.0875 = £528m.
Sales grew faster than the market, so share rose. Always compare the two growth rates.
Sampling, correlation, confidence intervals and extrapolation
Asking everyone is too costly, so firms use a sample. A sample is cheaper and faster, but it brings sampling error. A larger, representative sample narrows the error. Random, stratified and quota are common sampling methods.
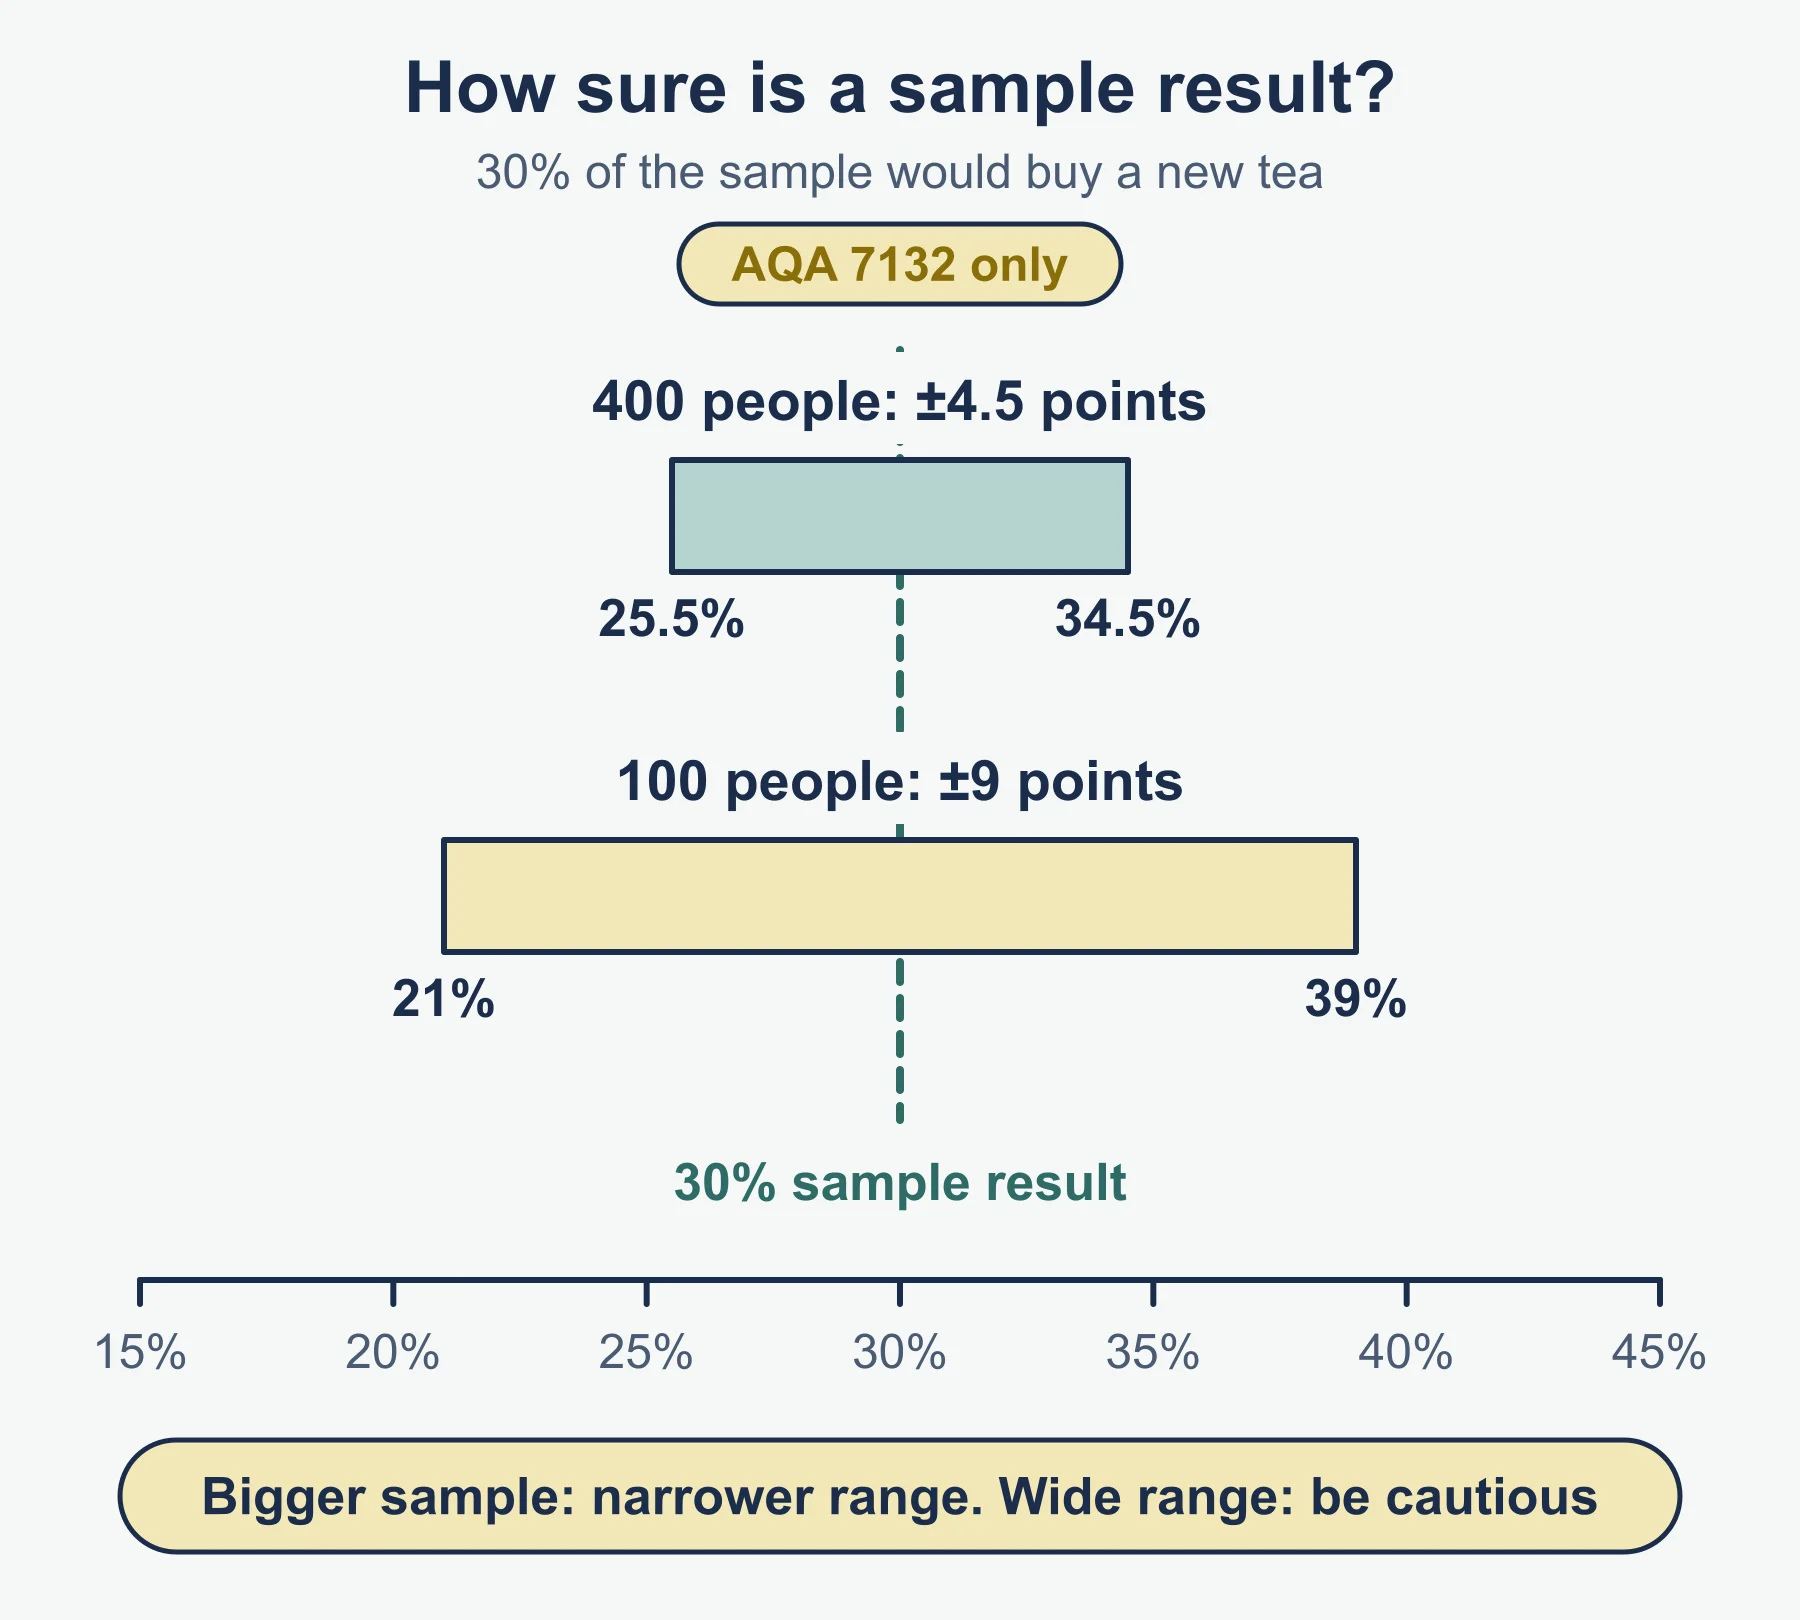
A confidence interval is a range around a sample result in which the true value probably lies. A sample of 400 finds that 30% would buy a new tea. A 95% interval of about plus or minus 4.5 percentage points gives 25.5% to 34.5%. With a sample of 100 the range is about plus or minus 9 points. You need the concept, not the calculation. A wide interval warns that the data cannot support a confident decision.
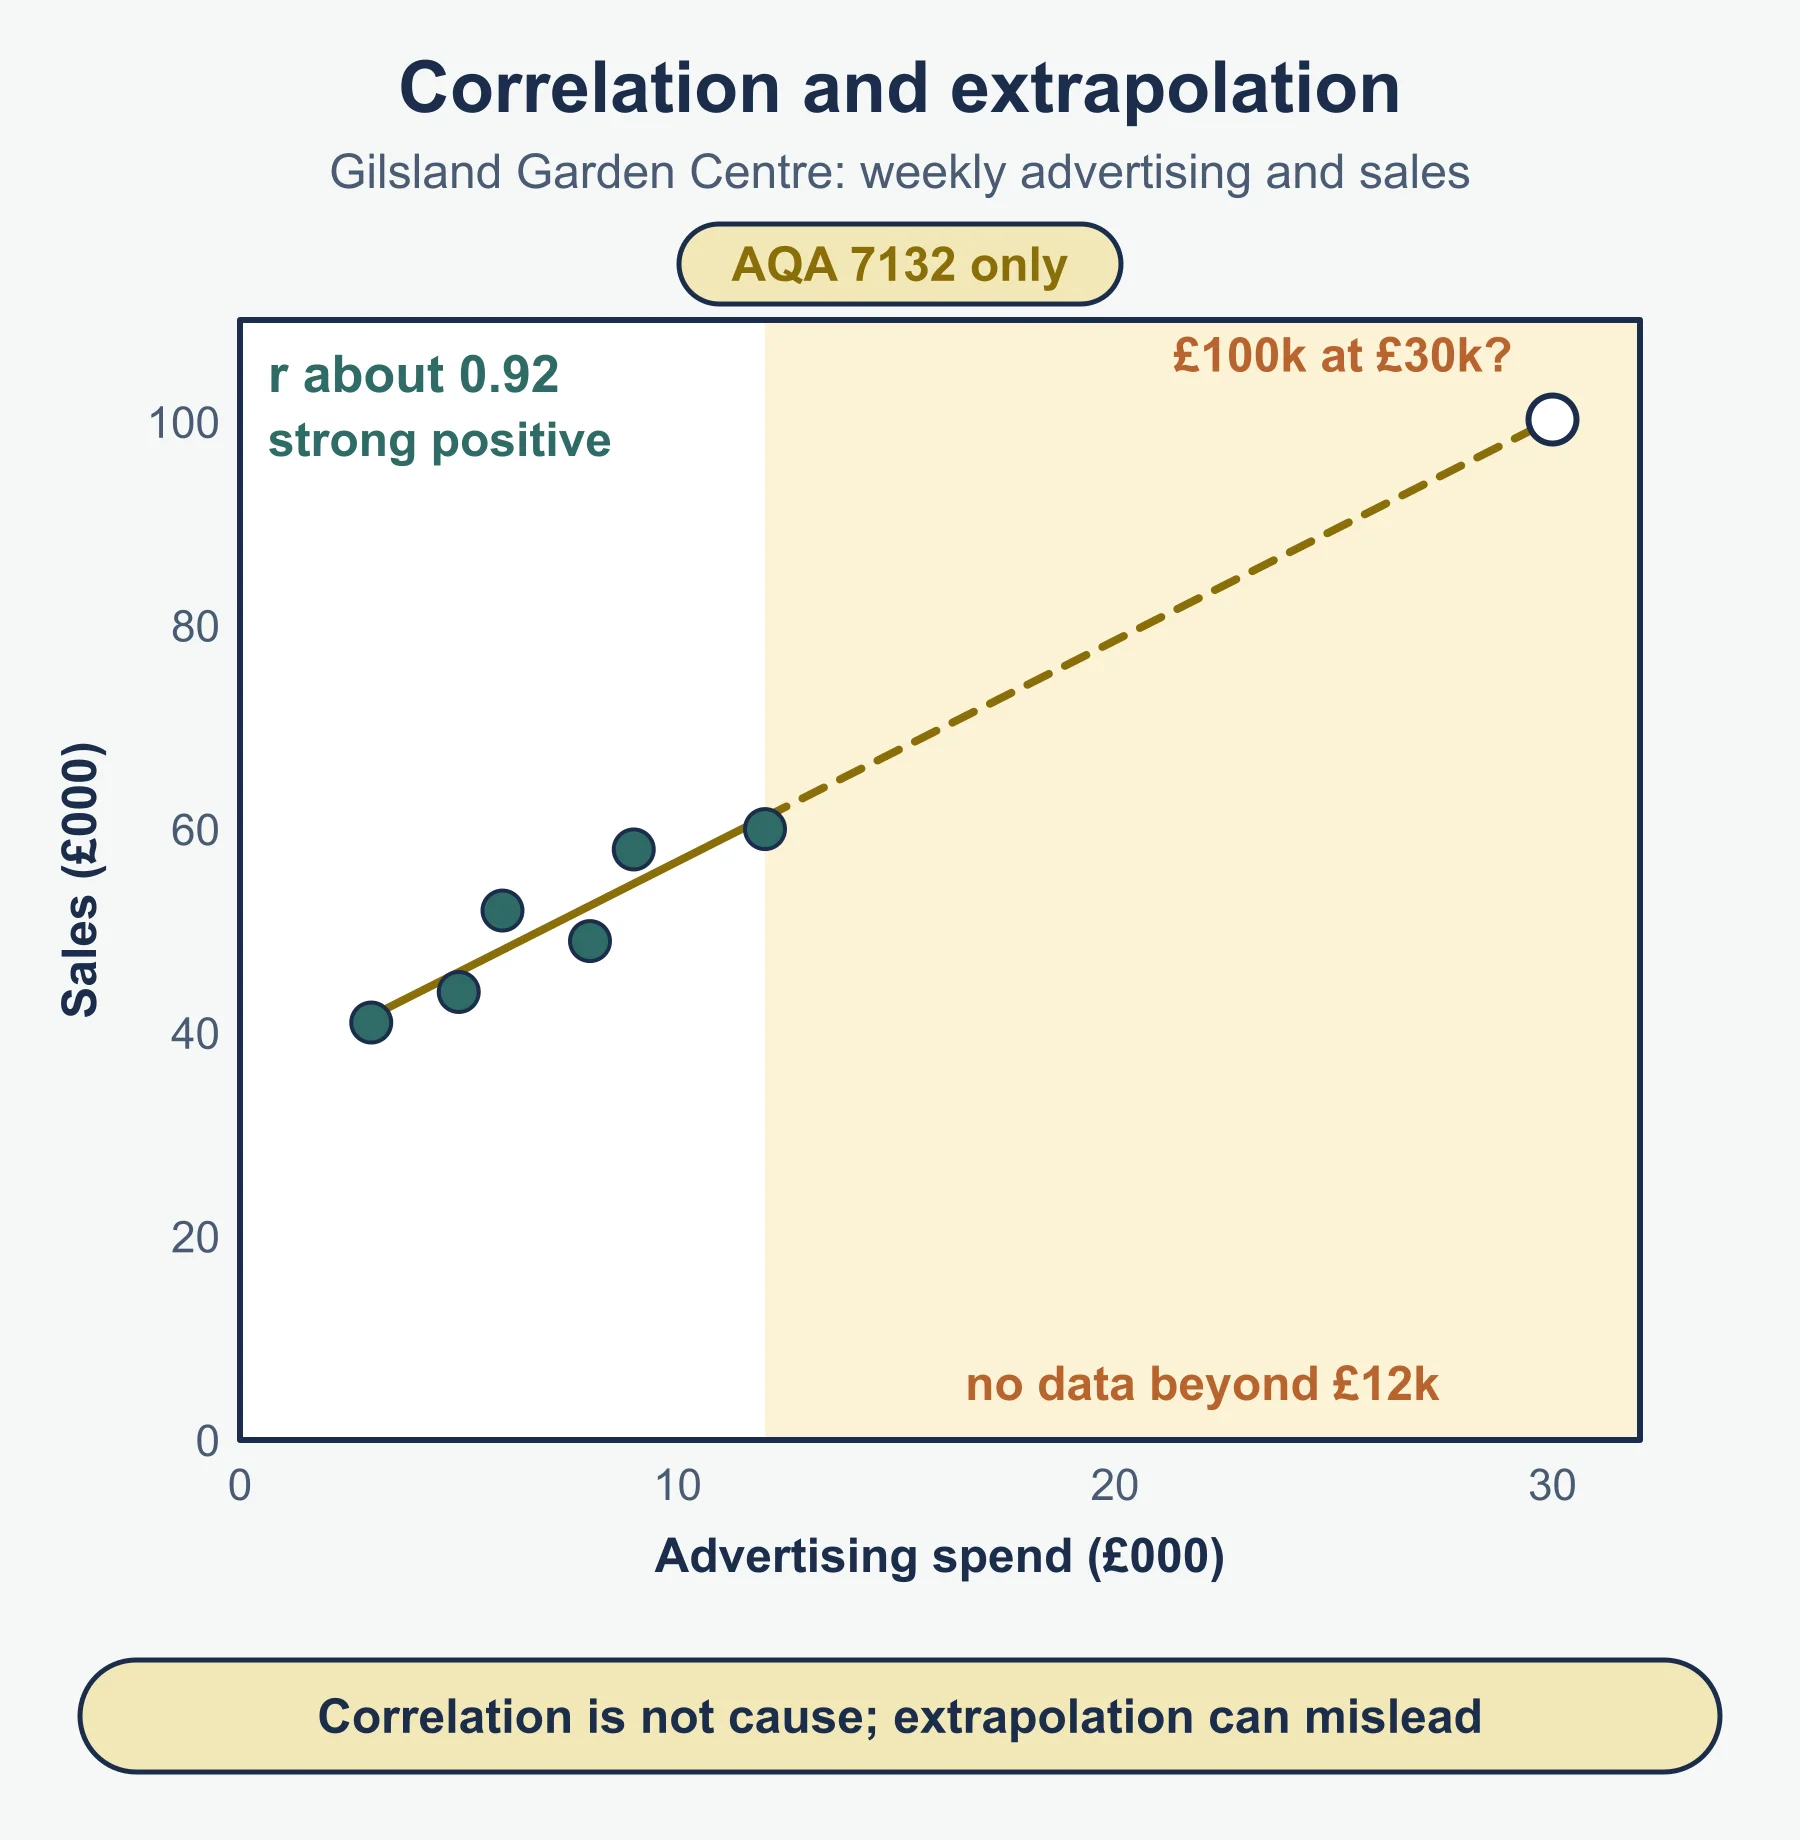
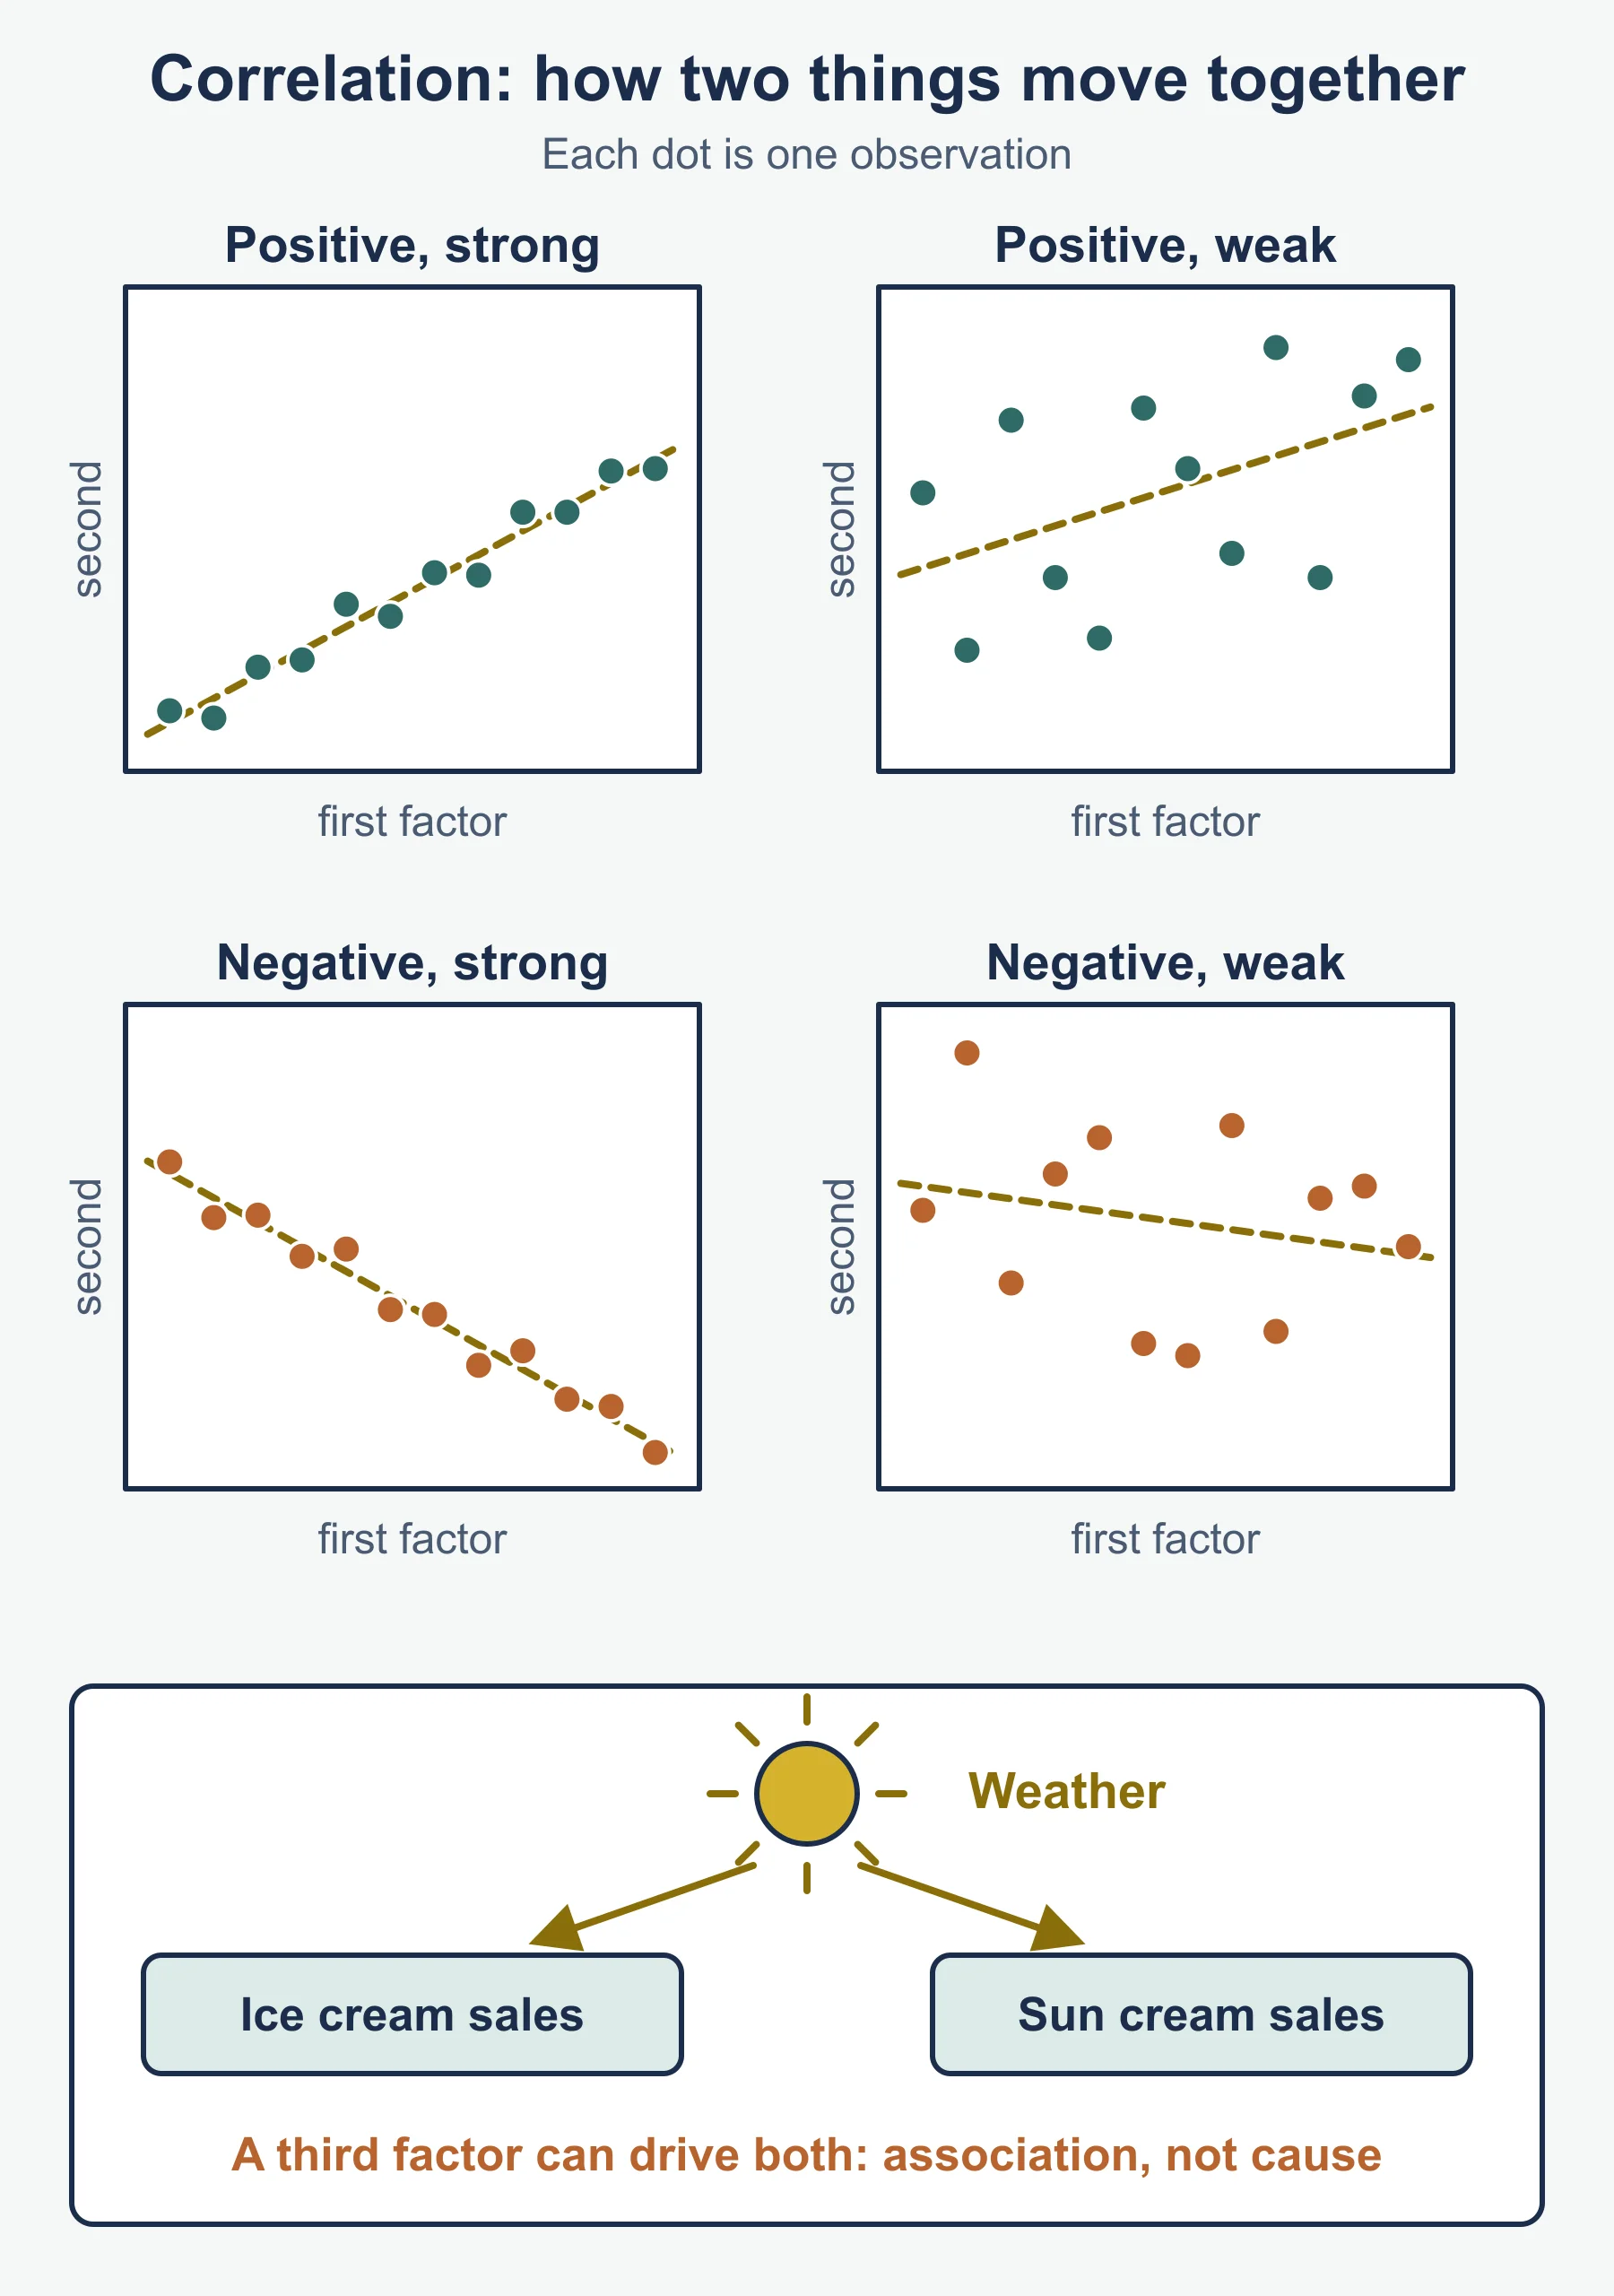
Correlation measures how two variables move together. Positive correlation: both rise together. Negative: one rises as the other falls. The closer the points lie to a line, the stronger the relationship. Gilsland Garden Centre recorded weekly advertising spend and sales (both £000):
| Advertising | 3 | 5 | 6 | 8 | 9 | 12 |
|---|---|---|---|---|---|---|
| Sales | 41 | 44 | 52 | 49 | 58 | 60 |
The points show strong positive correlation (a correlation coefficient of about 0.92). That does not prove advertising caused the sales: weather or a local event might be behind both.
Extrapolation extends a trend beyond the data. The fitted line suggests £100k of sales at £30k advertising, but the data stop at £12k. Diminishing returns or saturation may break the pattern, so treat extrapolated figures with caution, especially far from the data.
Technology and data
Technology gathers data (website analytics, loyalty cards, social media listening, online surveys) and analyses it (large data sets, customer relationship software). The value is speed, detail and the ability to target individuals. The risks are cost, poor-quality data, customer privacy concerns and data-protection duties (described in general terms here).
Elasticity
You must interpret price and income elasticity of demand and analyse the effect on revenue. The specification says you do not need to calculate them. For reference, the standard forms are:
- PED = % change in quantity demanded ÷ % change in price
- YED = % change in quantity demanded ÷ % change in income
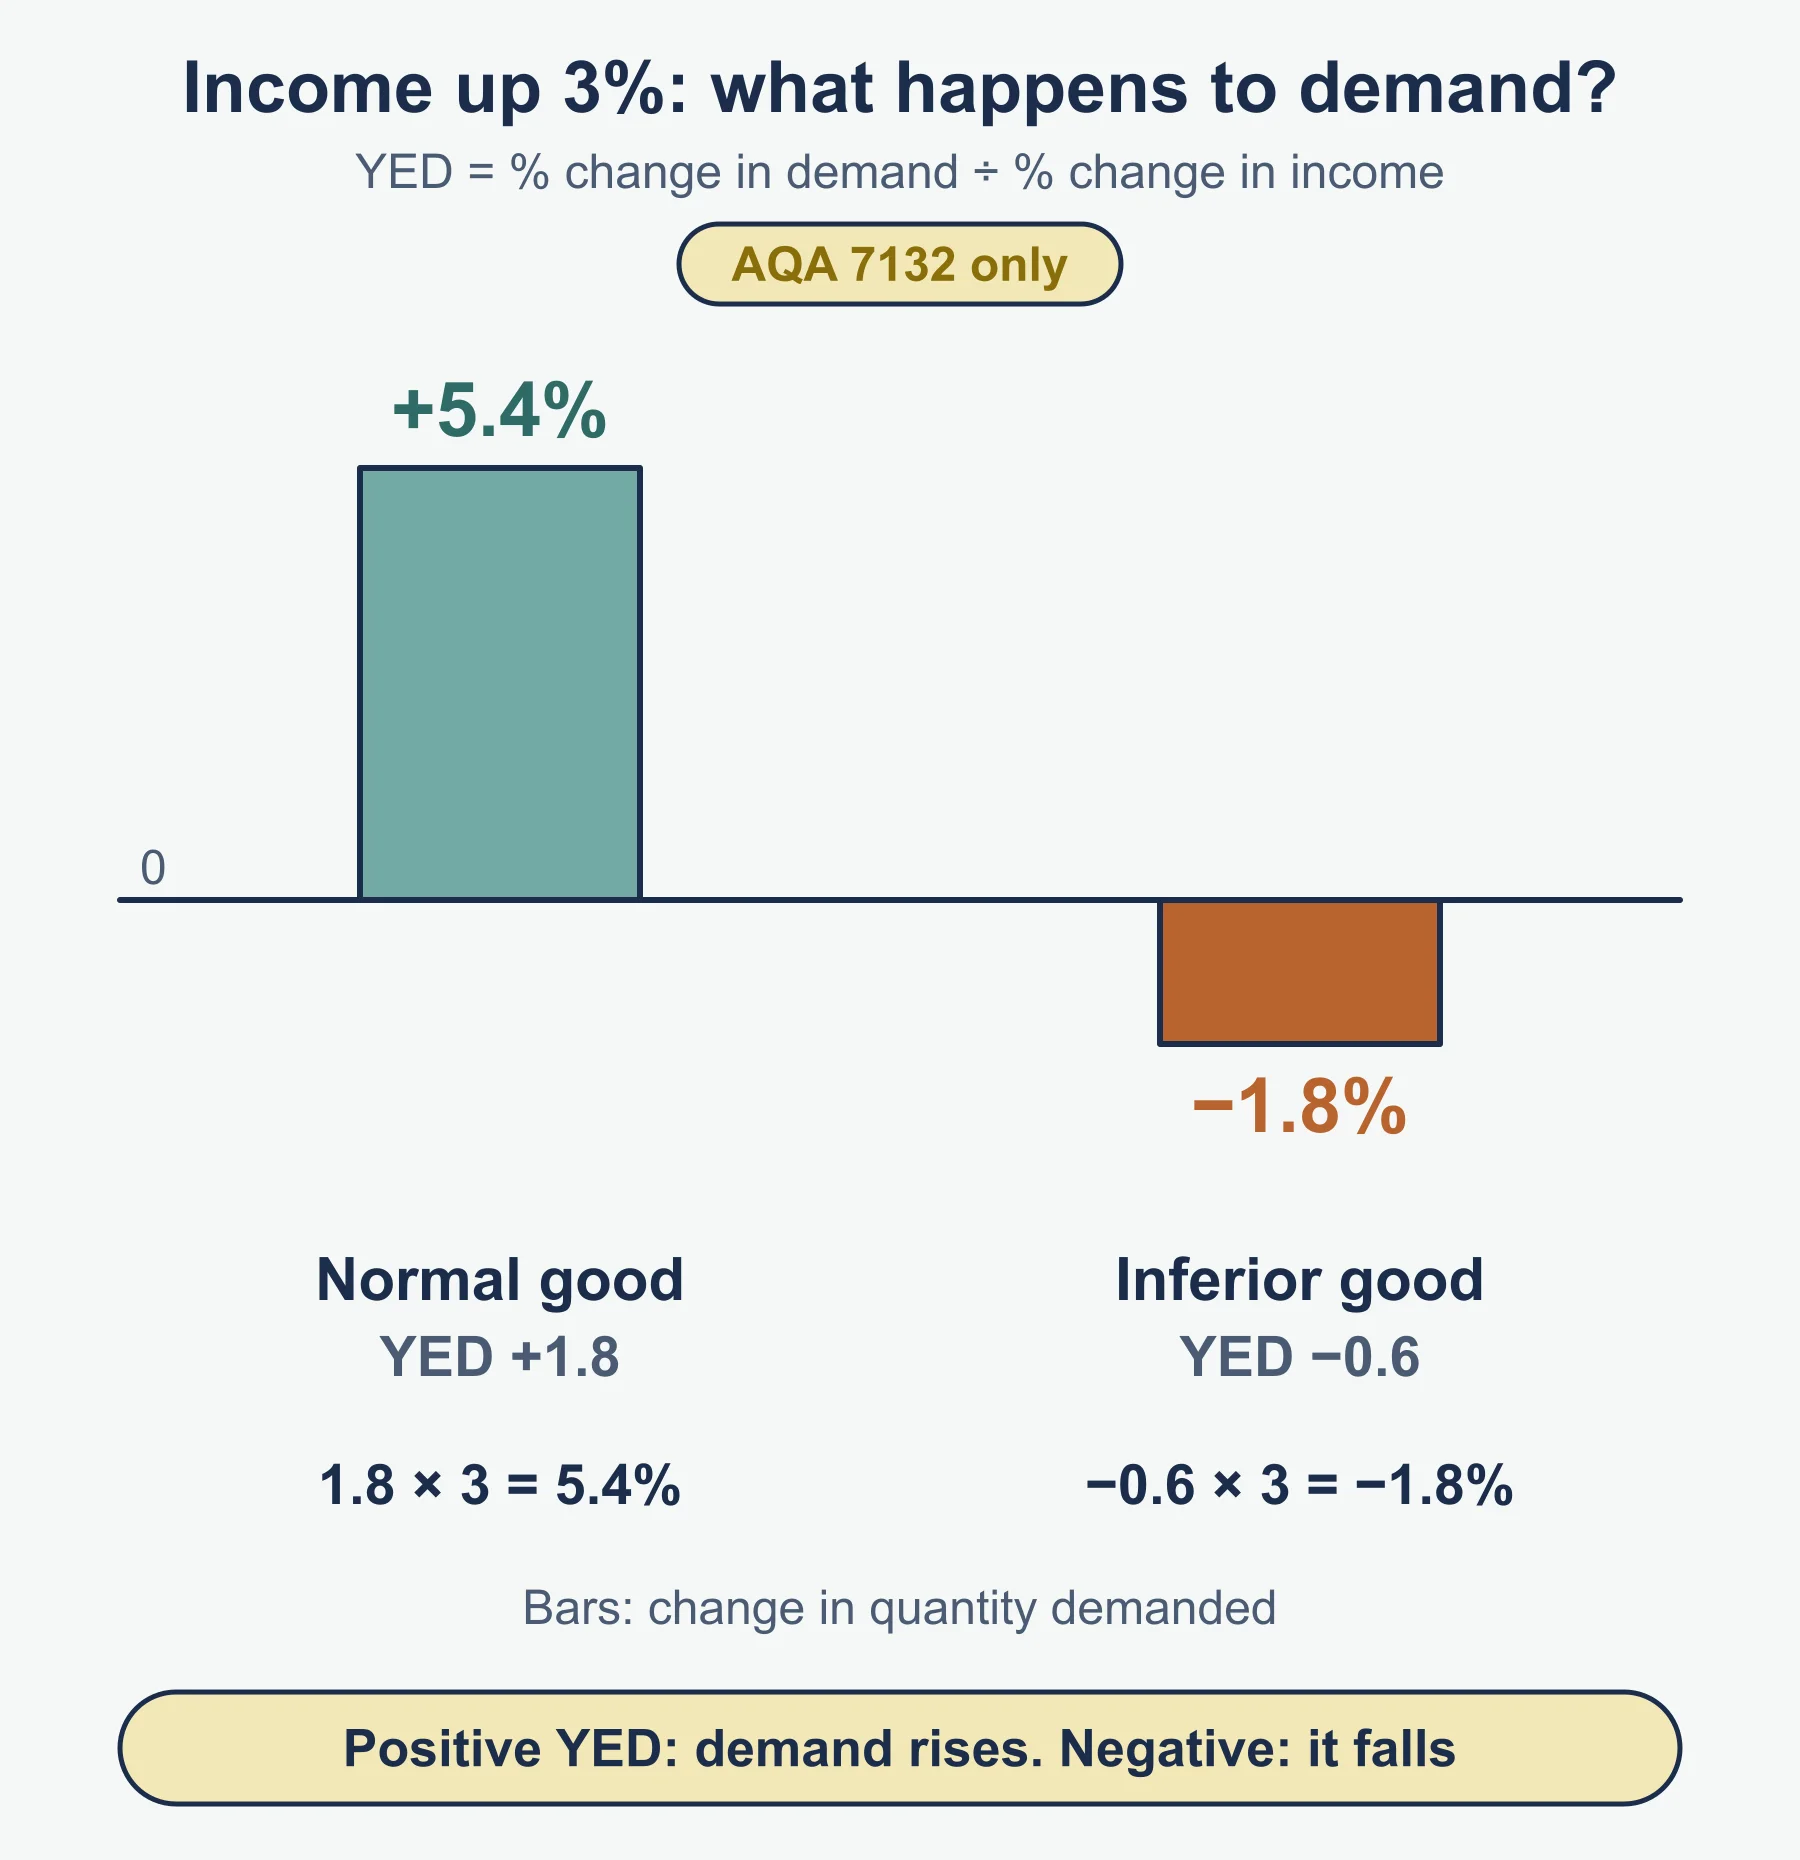
If PED ignoring the sign is above 1, demand is elastic: price changes lead to proportionately larger quantity changes. If below 1, demand is inelastic. A positive YED means a normal good, above 1 a luxury-type good; a negative YED means an inferior good.
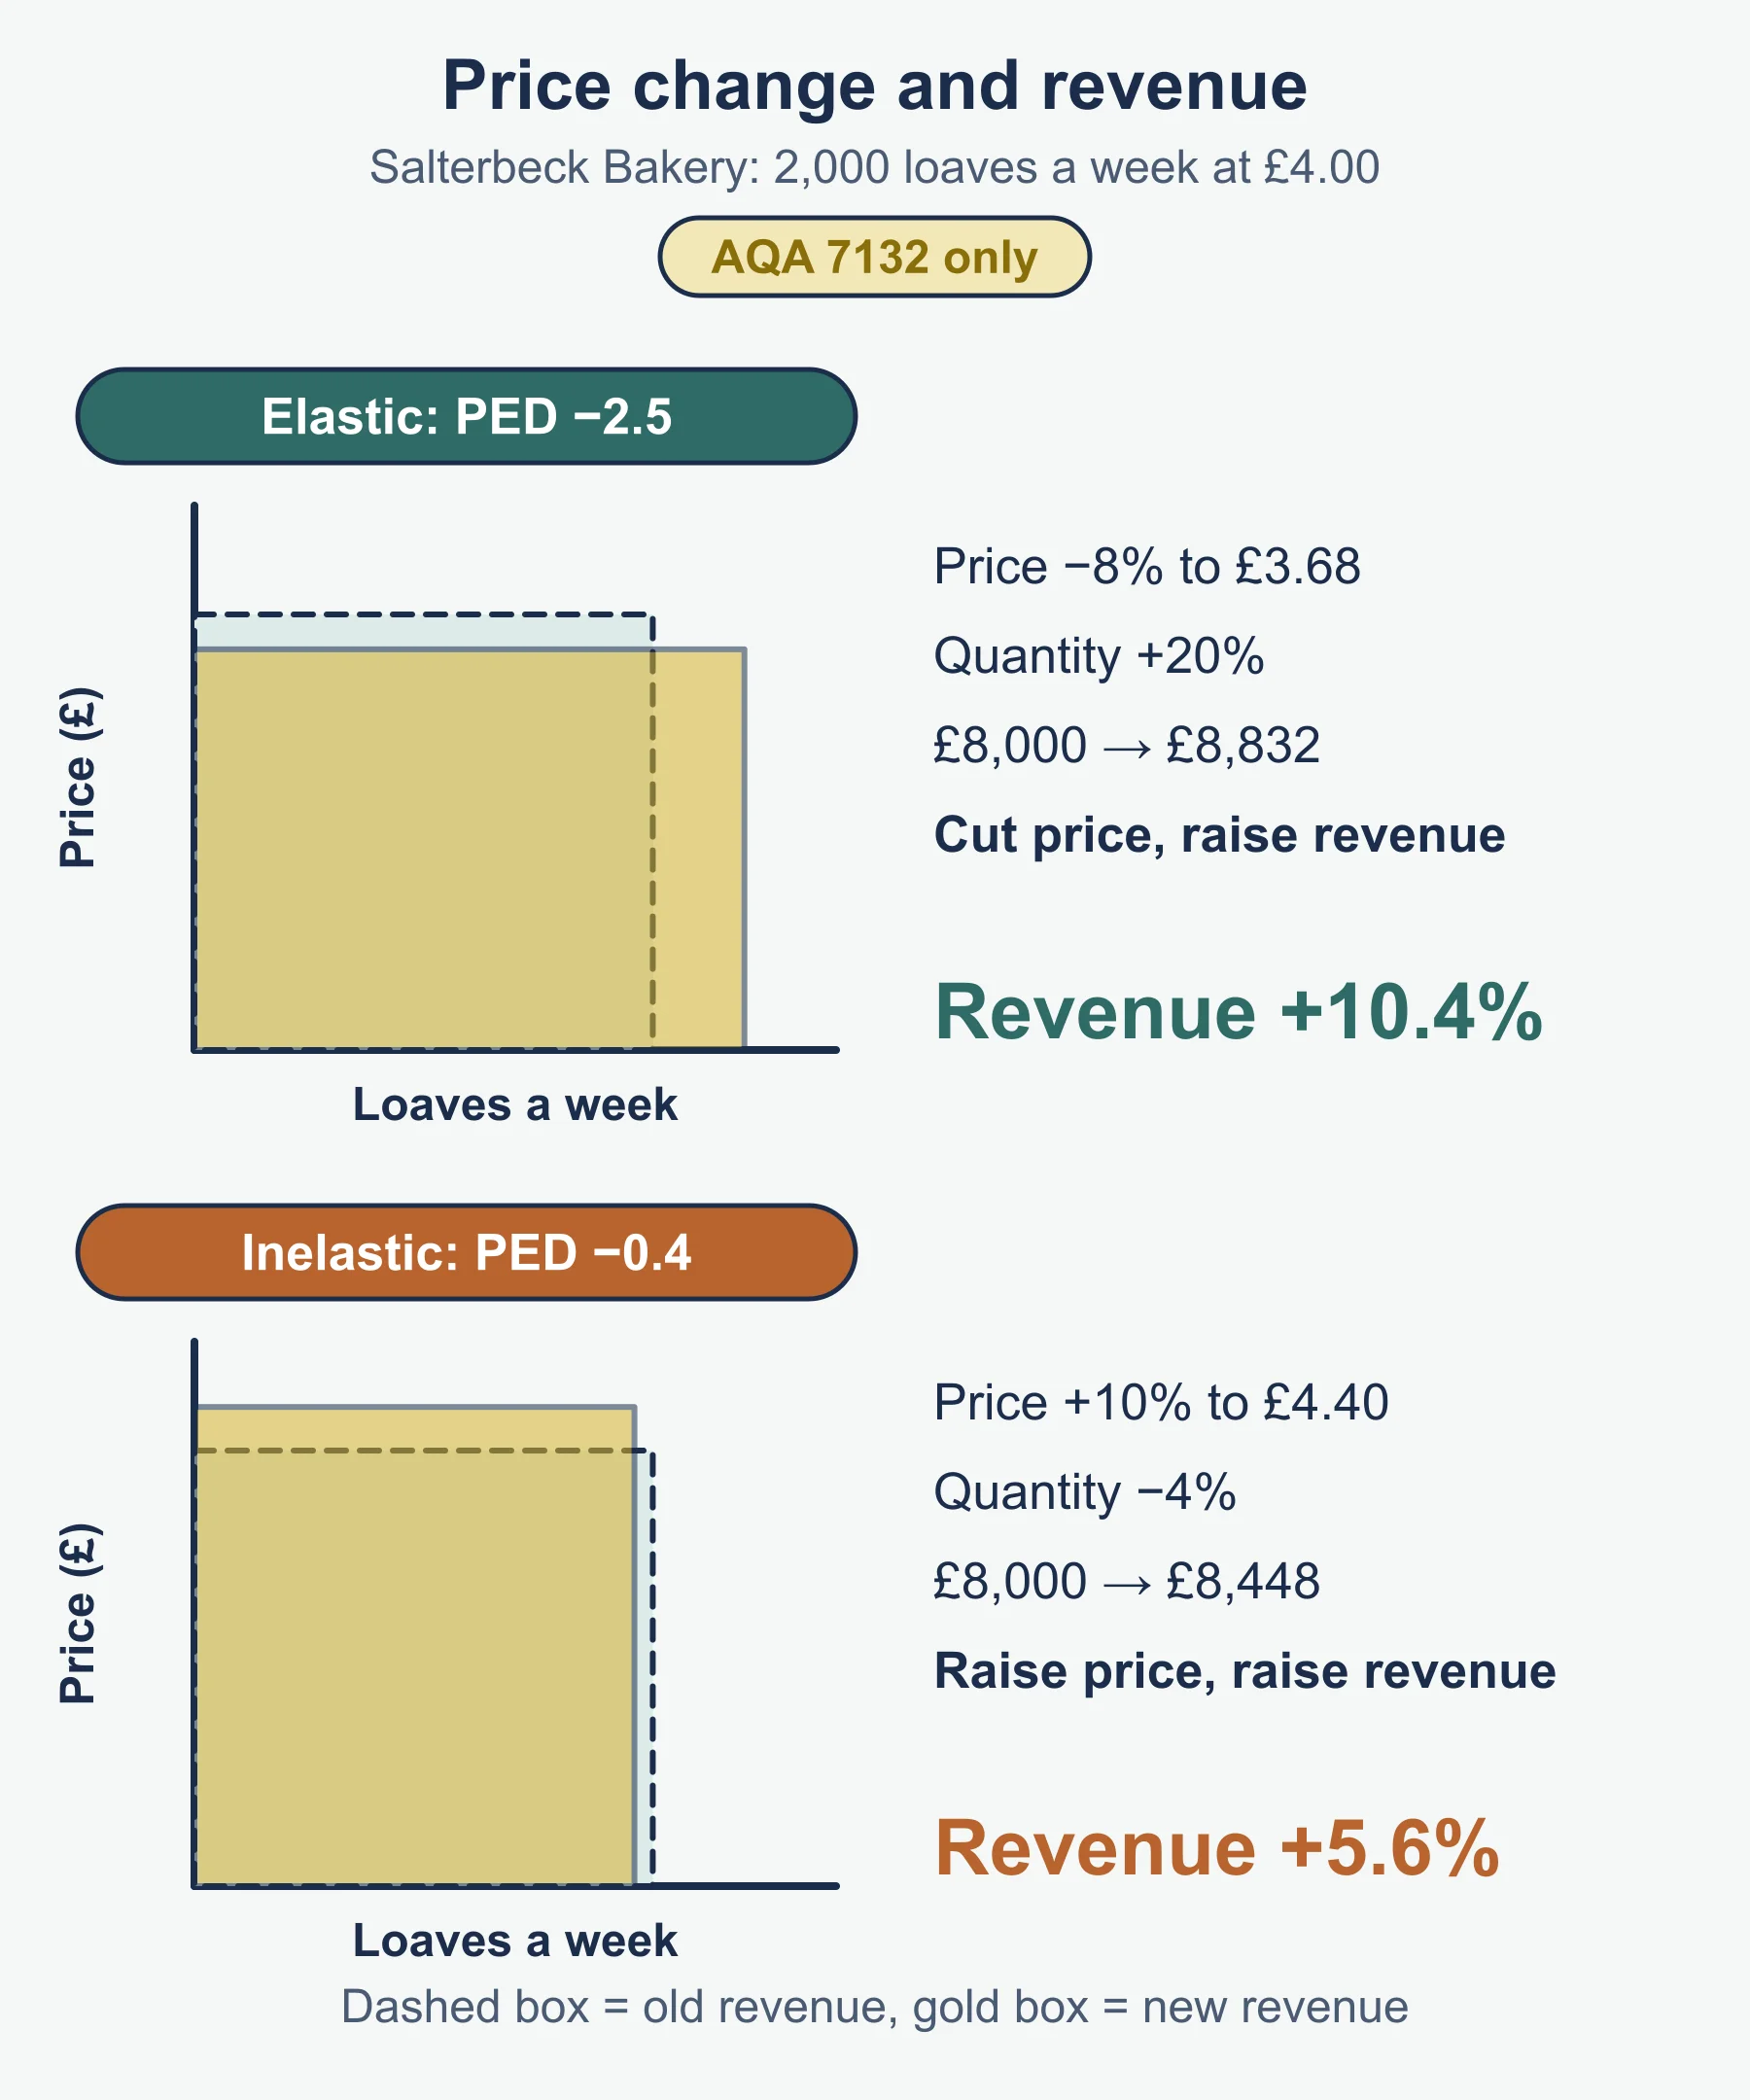
Worked example. Salterbeck Bakery sells 2,000 loaves a week at £4.00. Its research estimates PED of −2.5. A cut of 8% to £3.68 raises quantity by 20% to 2,400. Revenue goes from £8,000 to £8,832, up 10.4%. If PED were −0.4, a 10% rise to £4.40 would cut quantity by 4% to 1,920 and revenue would rise 5.6% to £8,448. So: elastic demand, cut price to raise revenue; inelastic demand, raising price raises revenue.
With a YED of +1.8, a 3% rise in incomes raises demand by 5.4%. With a YED of −0.6, demand for the inferior good falls 1.8%.
Using data in decisions. Data supports choices but is not the decision. Judge it on age, sample size, bias, cost and whether it measures what the firm needs.
3.3.3 Segmentation, targeting and positioning
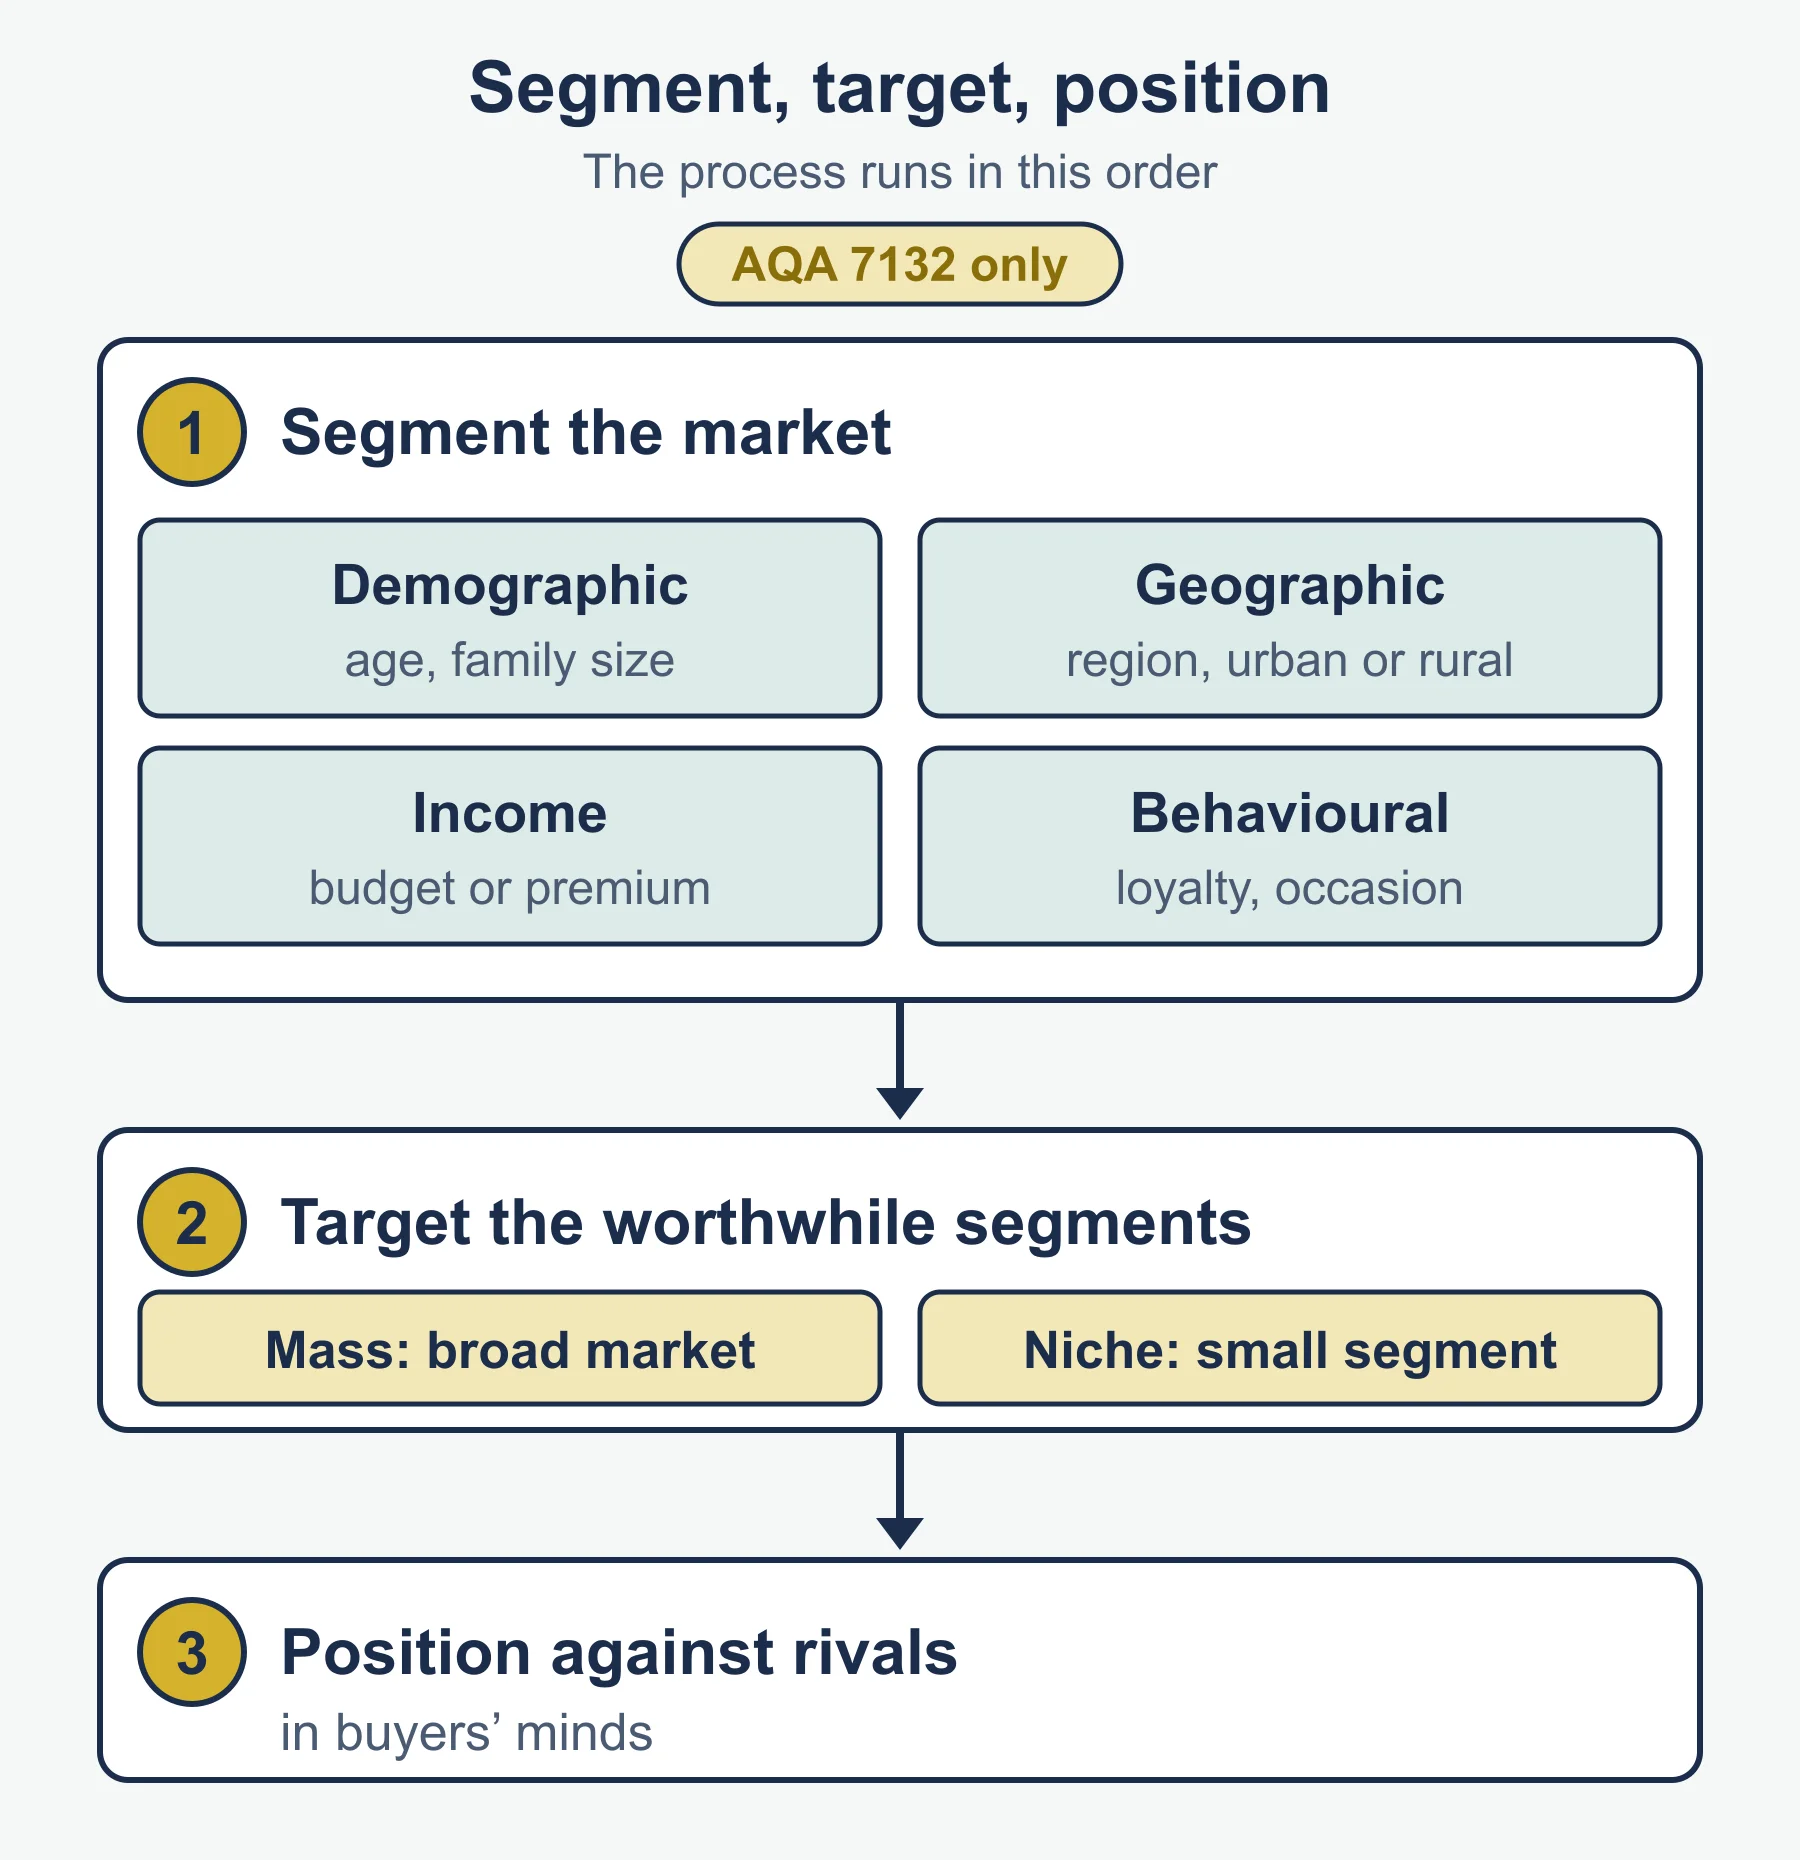
The process runs in order: segment the market into groups with similar needs; target the segments worth serving; position the product in buyers’ minds against rivals. The value is that the marketing mix can be matched to a defined group, which can raise sales and avoid wasted spending.
The specification lists four segmentation methods:
- Demographic: age, gender, family size, occupation.
- Geographic: region, city or country, urban or rural.
- Income: spending power, such as budget or premium buyers.
- Behavioural: how people buy or use (frequency, loyalty, occasion, benefits sought).
Targeting may be mass marketing (a broad market, one mix, low cost per customer, high competition) or niche marketing (a small specialised segment, often higher prices and less competition, but limited size and risk if tastes shift).
Influences on choosing a target and positioning include segment size, growth and profitability, competitors’ strength, the firm’s resources, its brand image and its objectives.
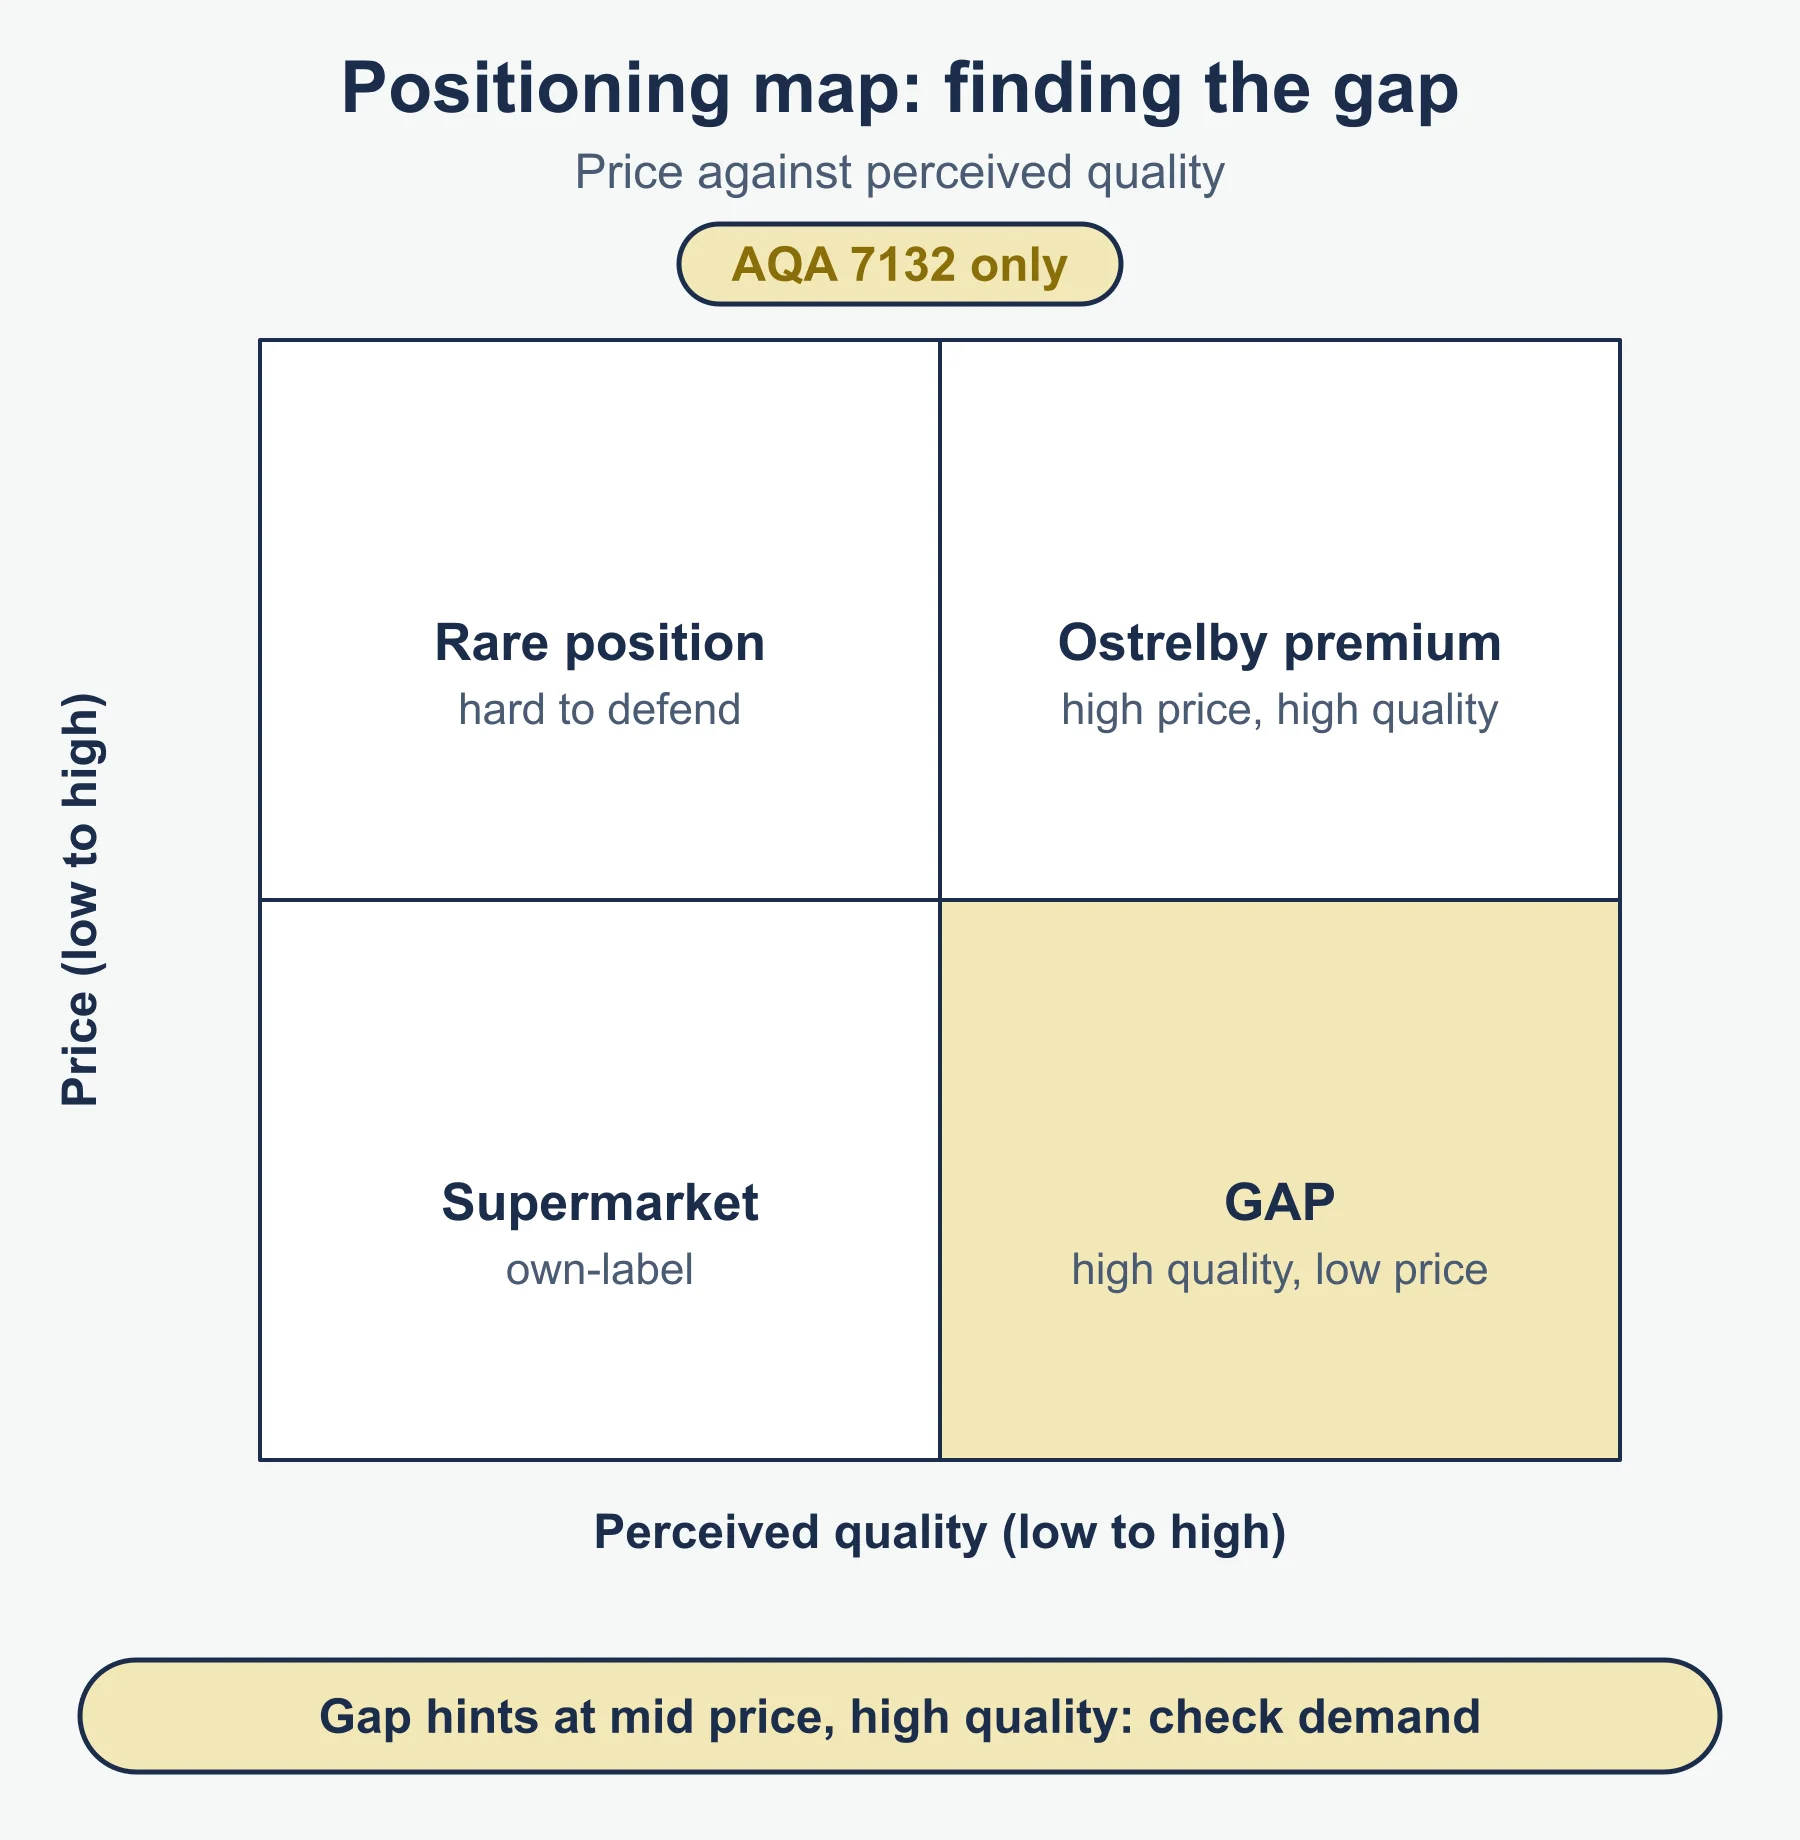
Positioning map (price against perceived quality):
| High quality | Low quality | |
|---|---|---|
| High price | Ostrelby Teas premium range | rare position (hard to defend) |
| Low price | gap in the market | supermarket own-label |
The gap suggests a mid-priced high-quality position, though the firm must check there is demand.
3.3.4 The marketing mix
The 7Ps are product, price, promotion, place, people, process and physical environment. The mix must work for goods and services, industrial and consumer buyers. Consumer goods include convenience (low price, frequent, little thought, such as bread), shopping (compared on price and quality before buying, such as a laptop) and specialty (strong brand loyalty, buyers will search or wait, such as a designer watch). Industrial buyers are firms; they value reliability, technical support and long-term contracts.
Product
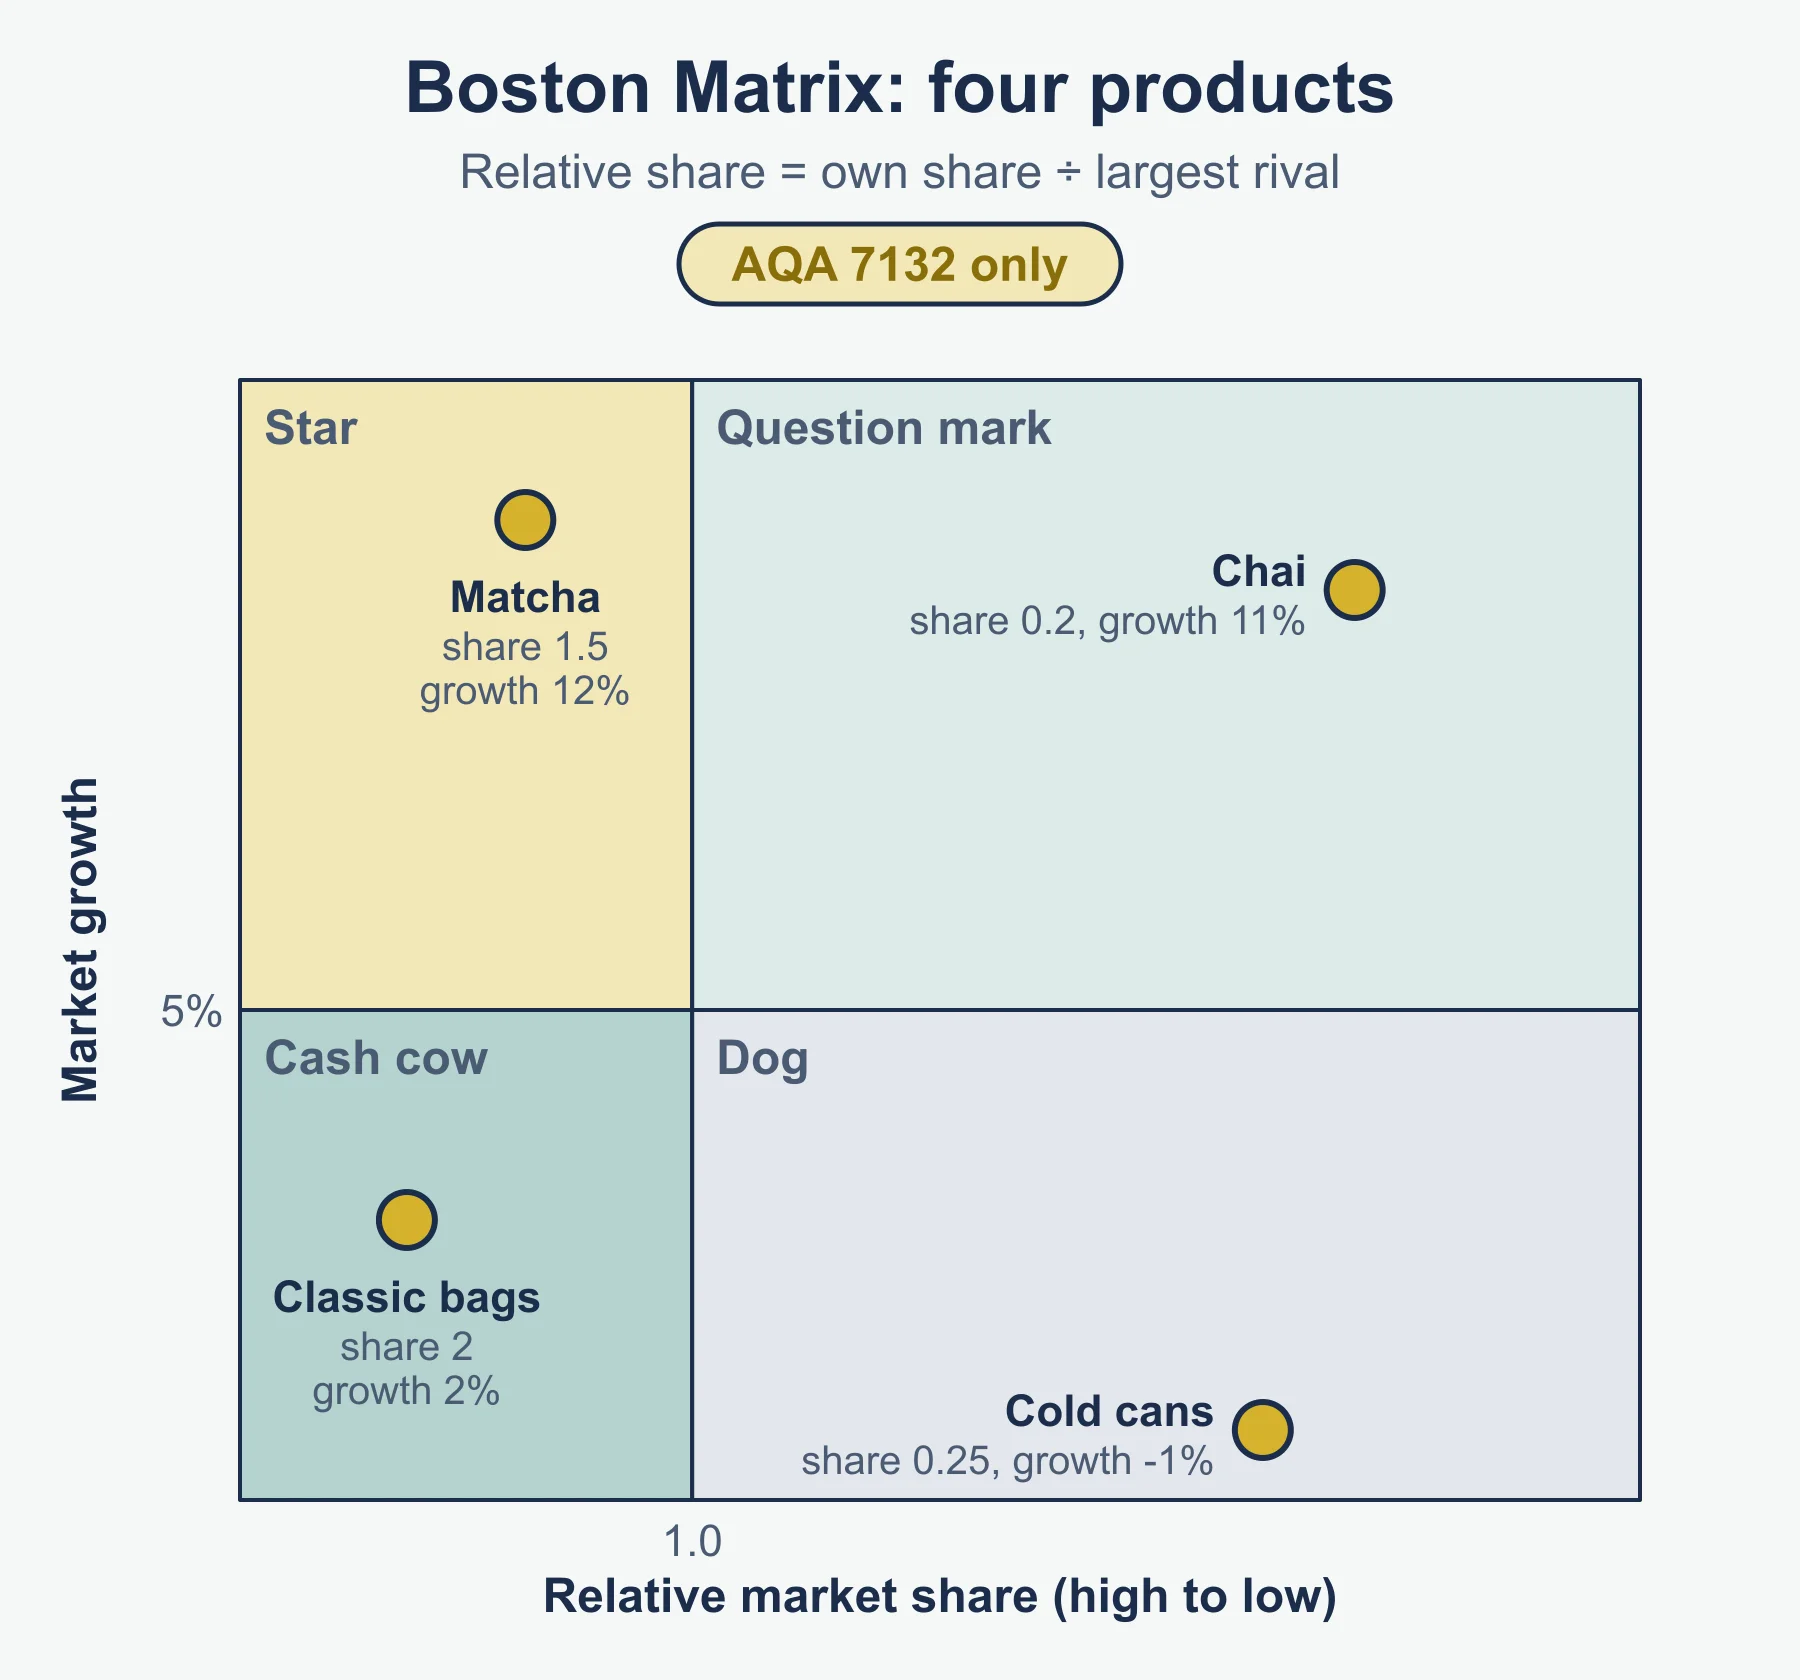
Product portfolio analysis helps manage the range. The Boston Matrix plots products by market growth (vertical) and relative market share (horizontal). Relative market share, in its standard form, is the firm’s share divided by the share of the largest rival.
| Ostrelby product | Own share | Largest rival | Relative share | Market growth |
|---|---|---|---|---|
| Classic bags | 30% | 15% | 2.0 | 2% |
| Matcha | 24% | 16% | 1.5 | 12% |
| Chai | 6% | 30% | 0.2 | 11% |
| Cold cans | 5% | 20% | 0.25 | −1% |
Classic bags: cash cow (high share, low growth) that funds others. Matcha: star (high share, high growth) needing investment. Chai: question mark (low share, high growth) to build or drop. Cold cans: dog (low share, low growth), a candidate for withdrawal. The value is a balanced portfolio. Its limit: results depend on how the market is defined.
The product life cycle has introduction, growth, maturity and decline. Sales and profit rise through growth, flatten in maturity and fall in decline. Extension strategies delay decline: new packaging, new markets, new uses, price changes or product modifications. The model assumes a set pattern that real products may not follow.
New product development is shaped by research findings, technology, competition, cost and the firm’s risk attitude. Its value is protecting the portfolio against decline, but it is costly and may fail.
Price
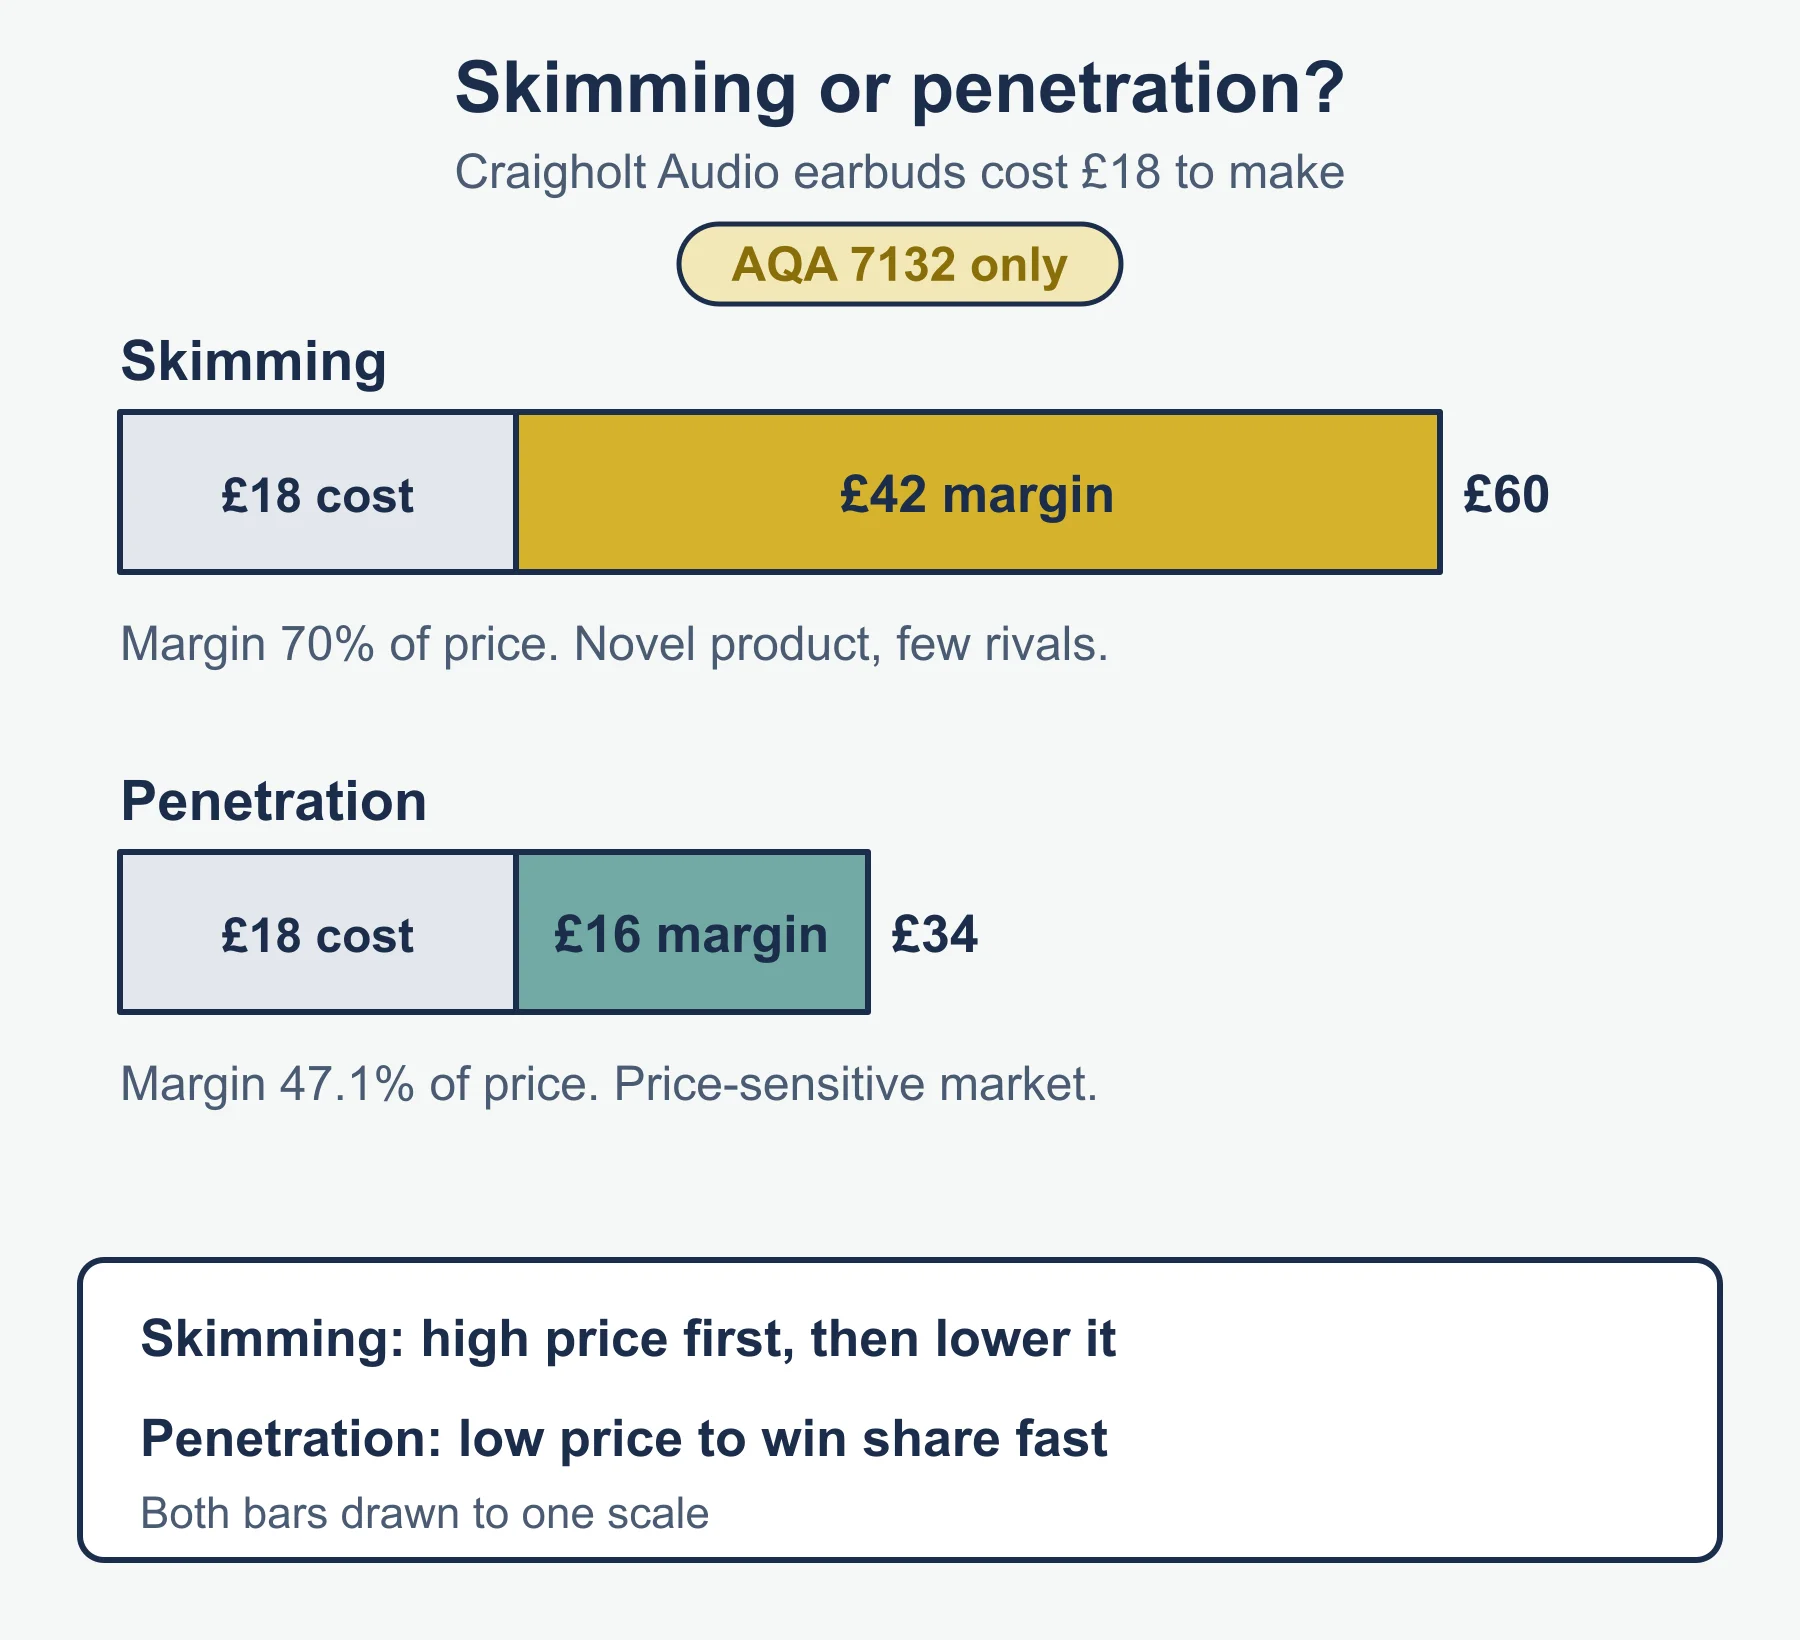
Penetration pricing sets a low price to win share fast. Price skimming sets a high price for early adopters, then lowers it. Craigholt Audio’s earbuds cost £18 to make. Skimming at £60 gives a margin of £42 (70%); penetration at £34 gives £16 (47.1%). Skimming suits novel products with few rivals; penetration suits price-sensitive markets and loyalty building. Other methods include cost-plus and competitor-based pricing. Dynamic pricing adjusts prices with demand in real time, using data.
Promotion
The promotional mix combines advertising, sales promotion, public relations, personal selling and digital and social media. Branding builds recognition, trust and loyalty, which can support higher prices and brand loyalty objectives. Choice depends on budget, target market and product type.
Place
Distribution choices include direct to customers or through wholesalers and retailers. Multi-channel distribution sells through several routes (shops, website, marketplaces), raising reach but adding complexity and the risk of channel conflict.
People, process and physical environment
For services especially: people (skills, attitude, training) shape experience; process is how the service is delivered (waiting time, online ordering); physical environment is the setting (layout, website design, packaging).
Integration, digital marketing and e-commerce
An integrated mix has elements that support one another. Influences are product life cycle position, the Boston Matrix, type of product, marketing objectives, target market, competition and positioning. A premium specialty brand cannot sell in a discount-style setting without damaging its position.
Digital marketing (social media, search, email) is targeted and measurable but needs skill and can be copied. E-commerce widens reach and cuts shop costs but brings delivery, returns and security costs. Relationship marketing builds long-term links, such as loyalty schemes.
Common errors
- Calculating share as a percentage of the firm’s own sales rather than the market.
- Saying correlation proves cause, or trusting extrapolation far beyond the data.
- Using absolute market share on the Boston Matrix axis instead of relative.
- Listing mix elements without linking them to the target market.
Frequently asked questions
What is the difference between primary and secondary research? Primary research is gathered first-hand, through surveys, interviews, focus groups or trials, and fits the firm’s question but costs more and takes longer. Secondary research uses existing data, such as government statistics or the firm’s sales records, and is cheaper and quicker but may be out of date.
What do the four Boston Matrix categories mean? A cash cow has high share in a low-growth market and funds other products, a star has high share in a high-growth market and needs investment, a question mark has low share in a high-growth market and must be built or dropped, and a dog has low share in a low-growth market and is a candidate for withdrawal.
What is the difference between penetration pricing and price skimming? Penetration pricing sets a low price to win market share fast. Price skimming sets a high price for early adopters and then lowers it.
When is demand price elastic? If PED, ignoring the sign, is above 1, demand is elastic, so a price change leads to a proportionately larger change in quantity. If it is below 1, demand is inelastic.
Which section of the AQA Business specification covers marketing? Section 3.3, Decision making to improve marketing performance, numbered 3.3.1 to 3.3.4, covering marketing objectives, markets and customers, segmentation, targeting and positioning, and the marketing mix.
Official syllabus
AQA AS and A-level Business specification (7131 and 7132), section 3.3 Decision making to improve marketing performance, published by AQA.
Get free revision emails (optional)
Occasional emails with practice questions, worked explanations and links to free resources for the qualification and subjects you choose. No spam, and you can unsubscribe from any email. The free tools on this site never need an email.
Related resources
-
Practice questions
AQA A-Level Business: Marketing management (7132) – Practice Questions
Original practice questions with worked answers on marketing management for AQA A-Level Business (7132): calculations, data, models and the mix.
Business · AQA · A Level
Try questions -
Revision notes
AQA A-Level Business: Marketing management (7132) – Revision Notes
Condensed revision notes for AQA A-Level Business (7132) marketing management: formulas, models, distinctions, a self-test and common lost marks.
Business · AQA · A Level
Revise topic -
Study guides
AQA A-Level Business: Operational management (7132)
Study guide to operational management for AQA A-Level Business: objectives, productivity, capacity, lean, quality, inventory and supply chains.
Business · AQA · A Level
Read guide
Related articles
-
teaching
A Level tuition in Dubai: Cambridge or Pearson Edexcel International A Level?
Schools in Dubai and Abu Dhabi teach either Cambridge International AS & A Level or Pearson Edexcel International A Level. How the two are structured, why it matters for tuition, and how online classes from Lahore work.
9 October 2026
-
curriculum guides
Choosing subjects at IGCSE and A Level
How subject choices at 14 and 16 affect university options later, and how to keep pathways open without overloading a timetable.
28 July 2026
Studying this with a teacher
Working through Business A LEVELS?
This page is free and stays free. If you would rather be taught it, Marlbridge runs Business classes one-to-one and in small groups of up to 15, online in your own time zone. The first trial class is free. WhatsApp replies within an hour (8am–11pm Pakistan time, every day); email the same day.
AQA Business teachers at Marlbridge
