
Study Guides
AQA AS-Level Business: Financial management (7137)
Study guide to financial management for AQA AS Business (7137), sub-topic 3.1.4: objectives, budgets, break-even, profitability, cash flow and finance.
- Subject
- Business
- Level
- AS LEVEL
- Topic
- What is business? Managing marketing and finance
- Author
- Marlbridge Academic Team
- Updated
- Reviewed by
- Salman Ahmad (what this means)
Aligned to AQA AS Level Business (7137), For first teaching from September 2026. Official specification .
Syllabus page (what it covers and how it is assessed): AQA AS Level Business.
Syllabus points this page covers
7137
- 3.1.4 Financial management
Found an error? Report a correction.
Need help with this topic? Request a free trial class for AS Level Business (7137).
This guide covers 3.1.4 Financial management in Unit 3.1 of AQA AS Business (7137), for first teaching from September 2026. It was checked on 5 November 2026 against AQA’s AS and A-level Business specification (7137/7138), Version 1.1, November 2025, including its annex of formulae. That specification groups the content under managing finance, internal and external sources of finance, break-even, profit, budgets, cash flow and liquidity, financial reporting, and assessing financial position and performance. Each is taught here with a worked example; formulas follow the specification’s annex.
Use it with the course structure guide, the 3.1.1 and 3.1.2 guide (for business objectives in general), the revision notes and the practice questions. The course hub is AQA AS Business, the printable list is the checklist, and all free 10-minute diagnostics will show which parts need work.
What the sub-topic asks of you
| Area | You must be able to |
|---|---|
| Managing finance (section 1) | Meaning and significance of financial objectives (profit, profitability, cash flow, liquidity, levels of borrowing); influences on them; links with other functions; effect on competitiveness |
| Budgets and cash flow forecasts (2) | Purpose and value of budgeting, including zero-based budgeting; calculate budget variances; complete and interpret cash flow forecasts |
| Break-even (3) | Calculate costs, revenue, contribution, break-even output and margin of safety; interpret break-even charts and show the effect of changes; purpose and value of the technique |
| Profit and financial reporting (4) | Gross profit, operating profit and profit for the year; profit versus cash and versus profitability; margins, ROCE, return on investment and gearing; interpret and amend an income statement and a statement of financial position; limitations |
| Cash flow and liquidity (5) | Payables and receivables; current ratio, acid test ratio, payables days and receivables days |
| Sources of finance (6) | Advantages, disadvantages and suitability of the listed internal and external sources |
| Improving cash flow and profit (7) | The listed ways of improving cash flow; increasing revenue or cutting costs to raise gross and operating profit |
| Assessing performance (8) | Judge profits, ROCE, ROI, liquidity, gearing, dividends, break-even and variances against objectives, competitors and context |
Ethics in finance (tax avoidance and payment terms) is A-level only (7138), so it is not covered here.
1. Managing finance: financial objectives
Objectives give managers targets and let owners judge success. The specification names five kinds of financial objective: profit, profitability (profit relative to revenue or capital), cash flow, liquidity (the ability to pay short-term debts) and levels of borrowing.
Cash flow and profit are different things. Cash flow is the movement of money into and out of the business. Profit is revenue minus costs, whether or not the money has moved yet. A business can sell on credit, record a profit and still run out of cash before customers pay.
Three profit measures appear in the specification:
- Gross profit = revenue − cost of sales.
- Operating profit = gross profit − operating expenses.
- Profit for the year = operating profit + profit from other activities − net finance costs (such as loan interest) − tax.
Examples of objectives: a target operating profit margin (profitability), never letting the bank balance fall below a set figure (cash flow), keeping the current ratio above 1.5 (liquidity), or keeping gearing below 40% (levels of borrowing).
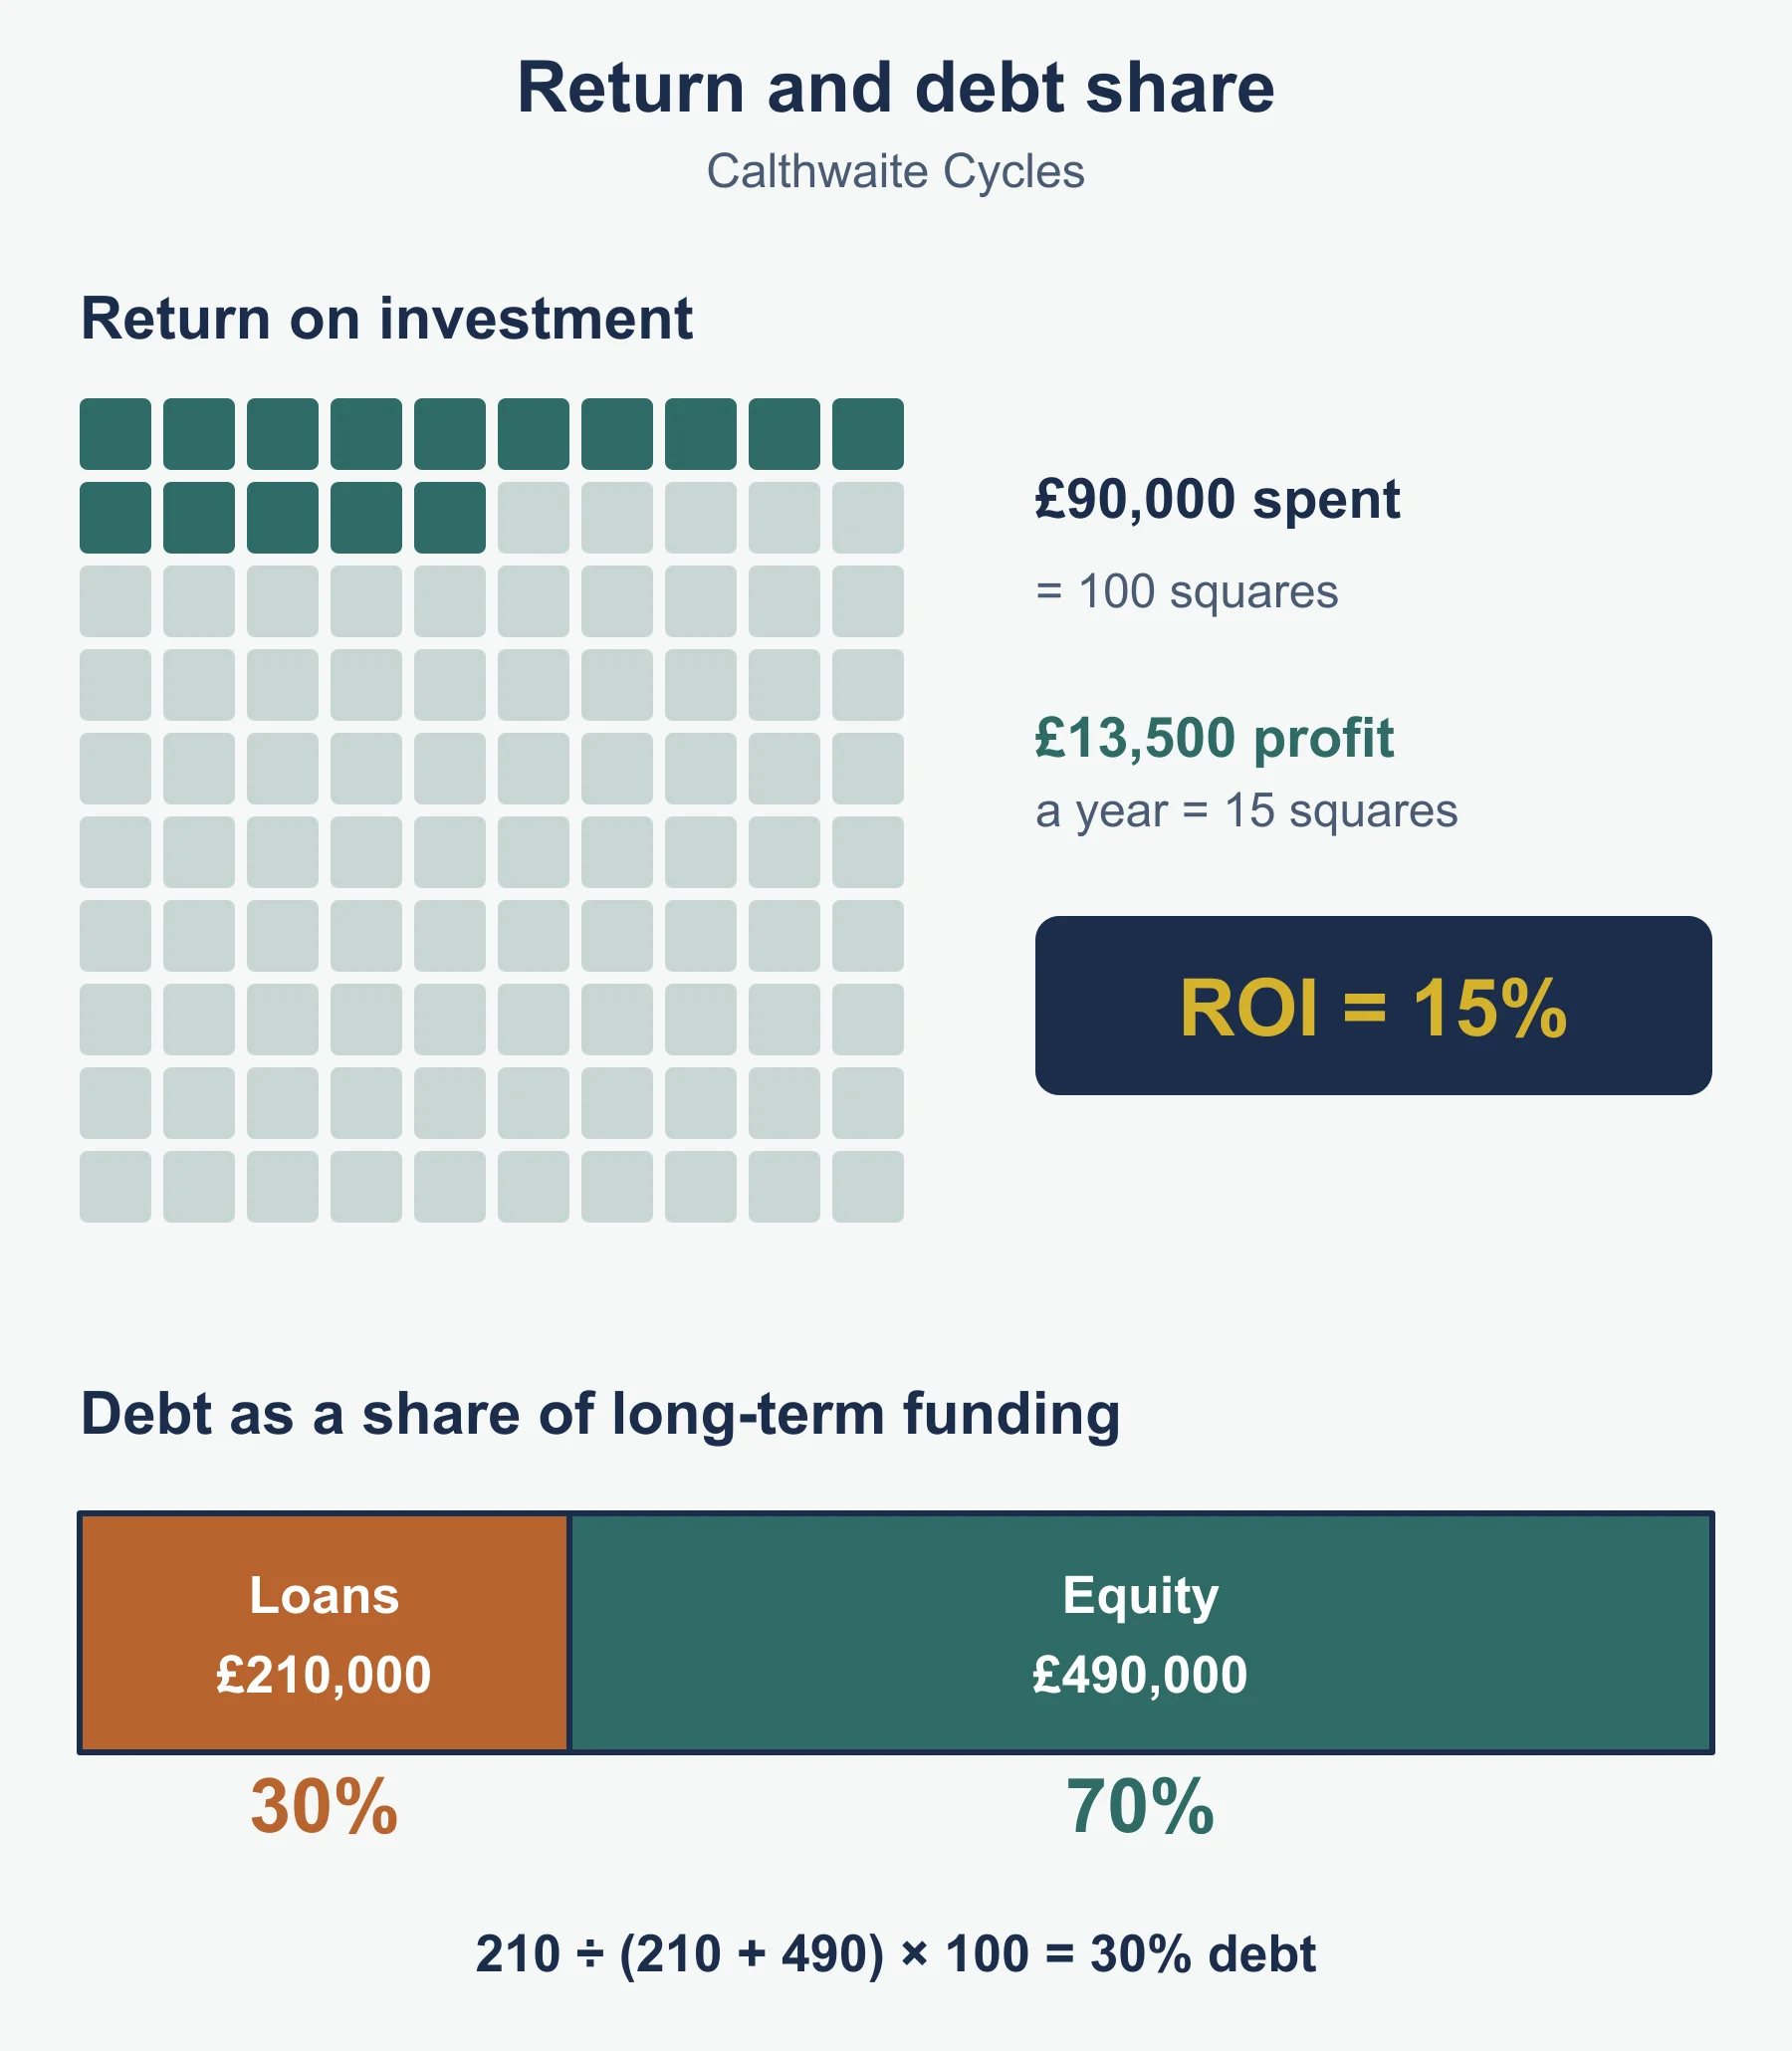
Return on investment (ROI) compares the profit from an investment with its cost: ROI (%) = profit from the investment ÷ cost of the investment × 100.
Gearing measures how much of the long-term funding is borrowed: gearing (%) = non-current liabilities ÷ (total equity + non-current liabilities) × 100. Total equity plus non-current liabilities is the capital employed.
Worked example 1. Calthwaite Cycles spends £90,000 on a workshop extension that adds £13,500 of profit a year. ROI = 13,500 ÷ 90,000 × 100 = 15%. Its long-term funding is £210,000 of loans (non-current liabilities) and £490,000 of equity, so gearing = 210,000 ÷ 700,000 × 100 = 30%.
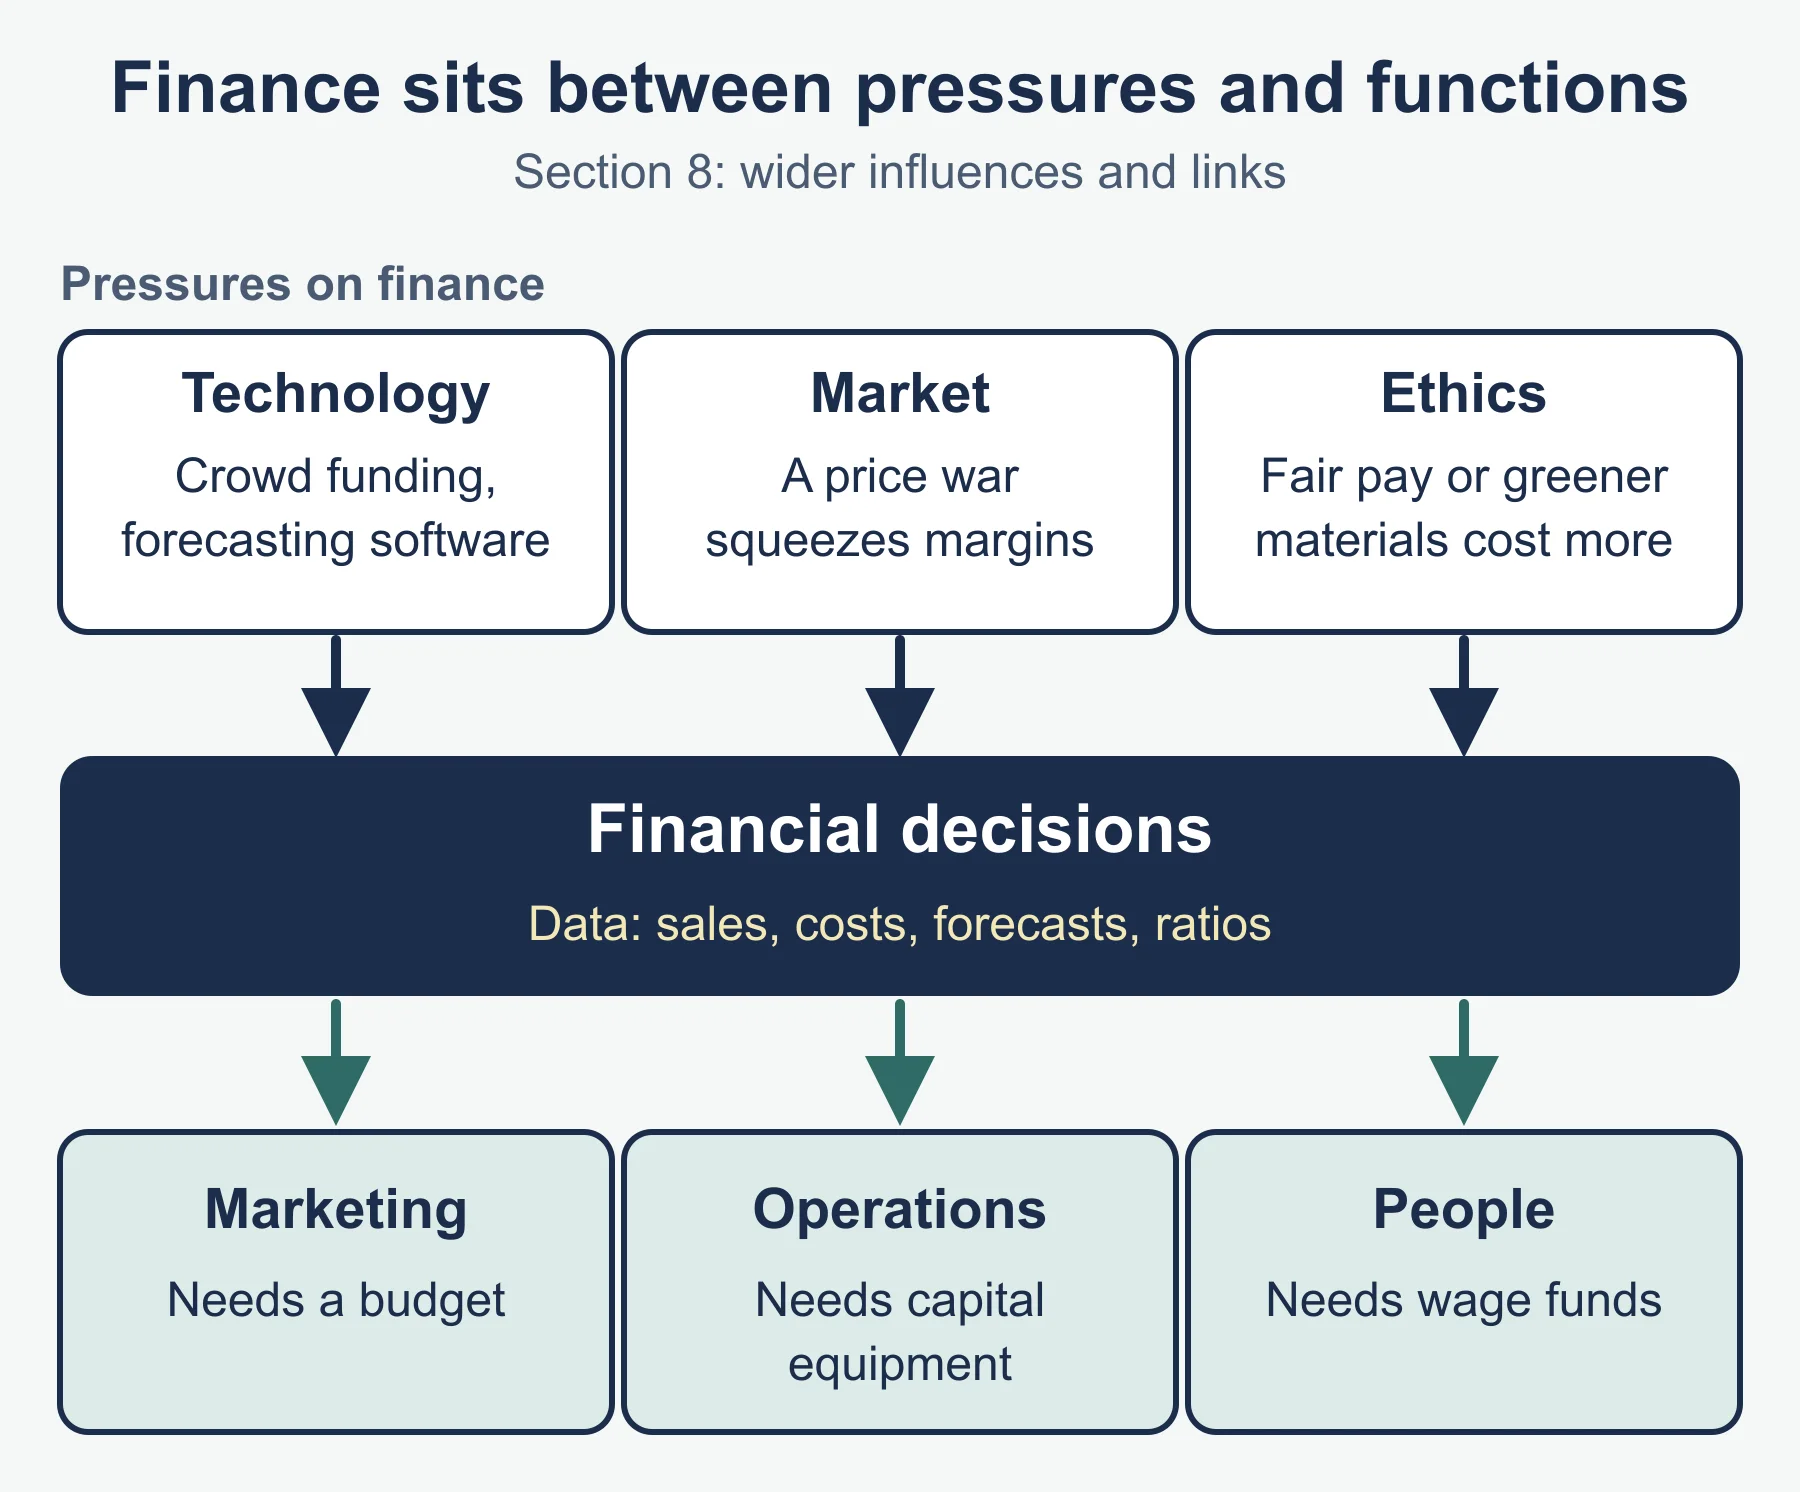
Influences on objectives. Internal: owners’ attitude to risk, the size of the business, available cash, and what other functions need (a marketing campaign costs money). External: interest rates, competitors’ prices, the economic climate, lenders’ conditions and ethical expectations from customers.
Links and competitiveness. Financial decisions and other functions depend on each other: marketing needs a budget, operations needs capital equipment and people management needs wage funds. Finance improves competitiveness when it funds better products or lower unit costs, and weakens it when cash shortages or heavy borrowing hold the business back.
2. Budgets and cash flow forecasts
A budget is a financial plan for income and spending over a period. Its value lies in setting targets, controlling spending, giving managers clear responsibility, coordinating departments and spotting problems early. Weaknesses: forecasts can be wrong and rigid budgets discourage change.
Zero-based budgeting starts every budget from zero, so each item of spending must be justified afresh rather than rolled forward from last year with an adjustment. It removes spending that is no longer needed, but it takes much more management time.
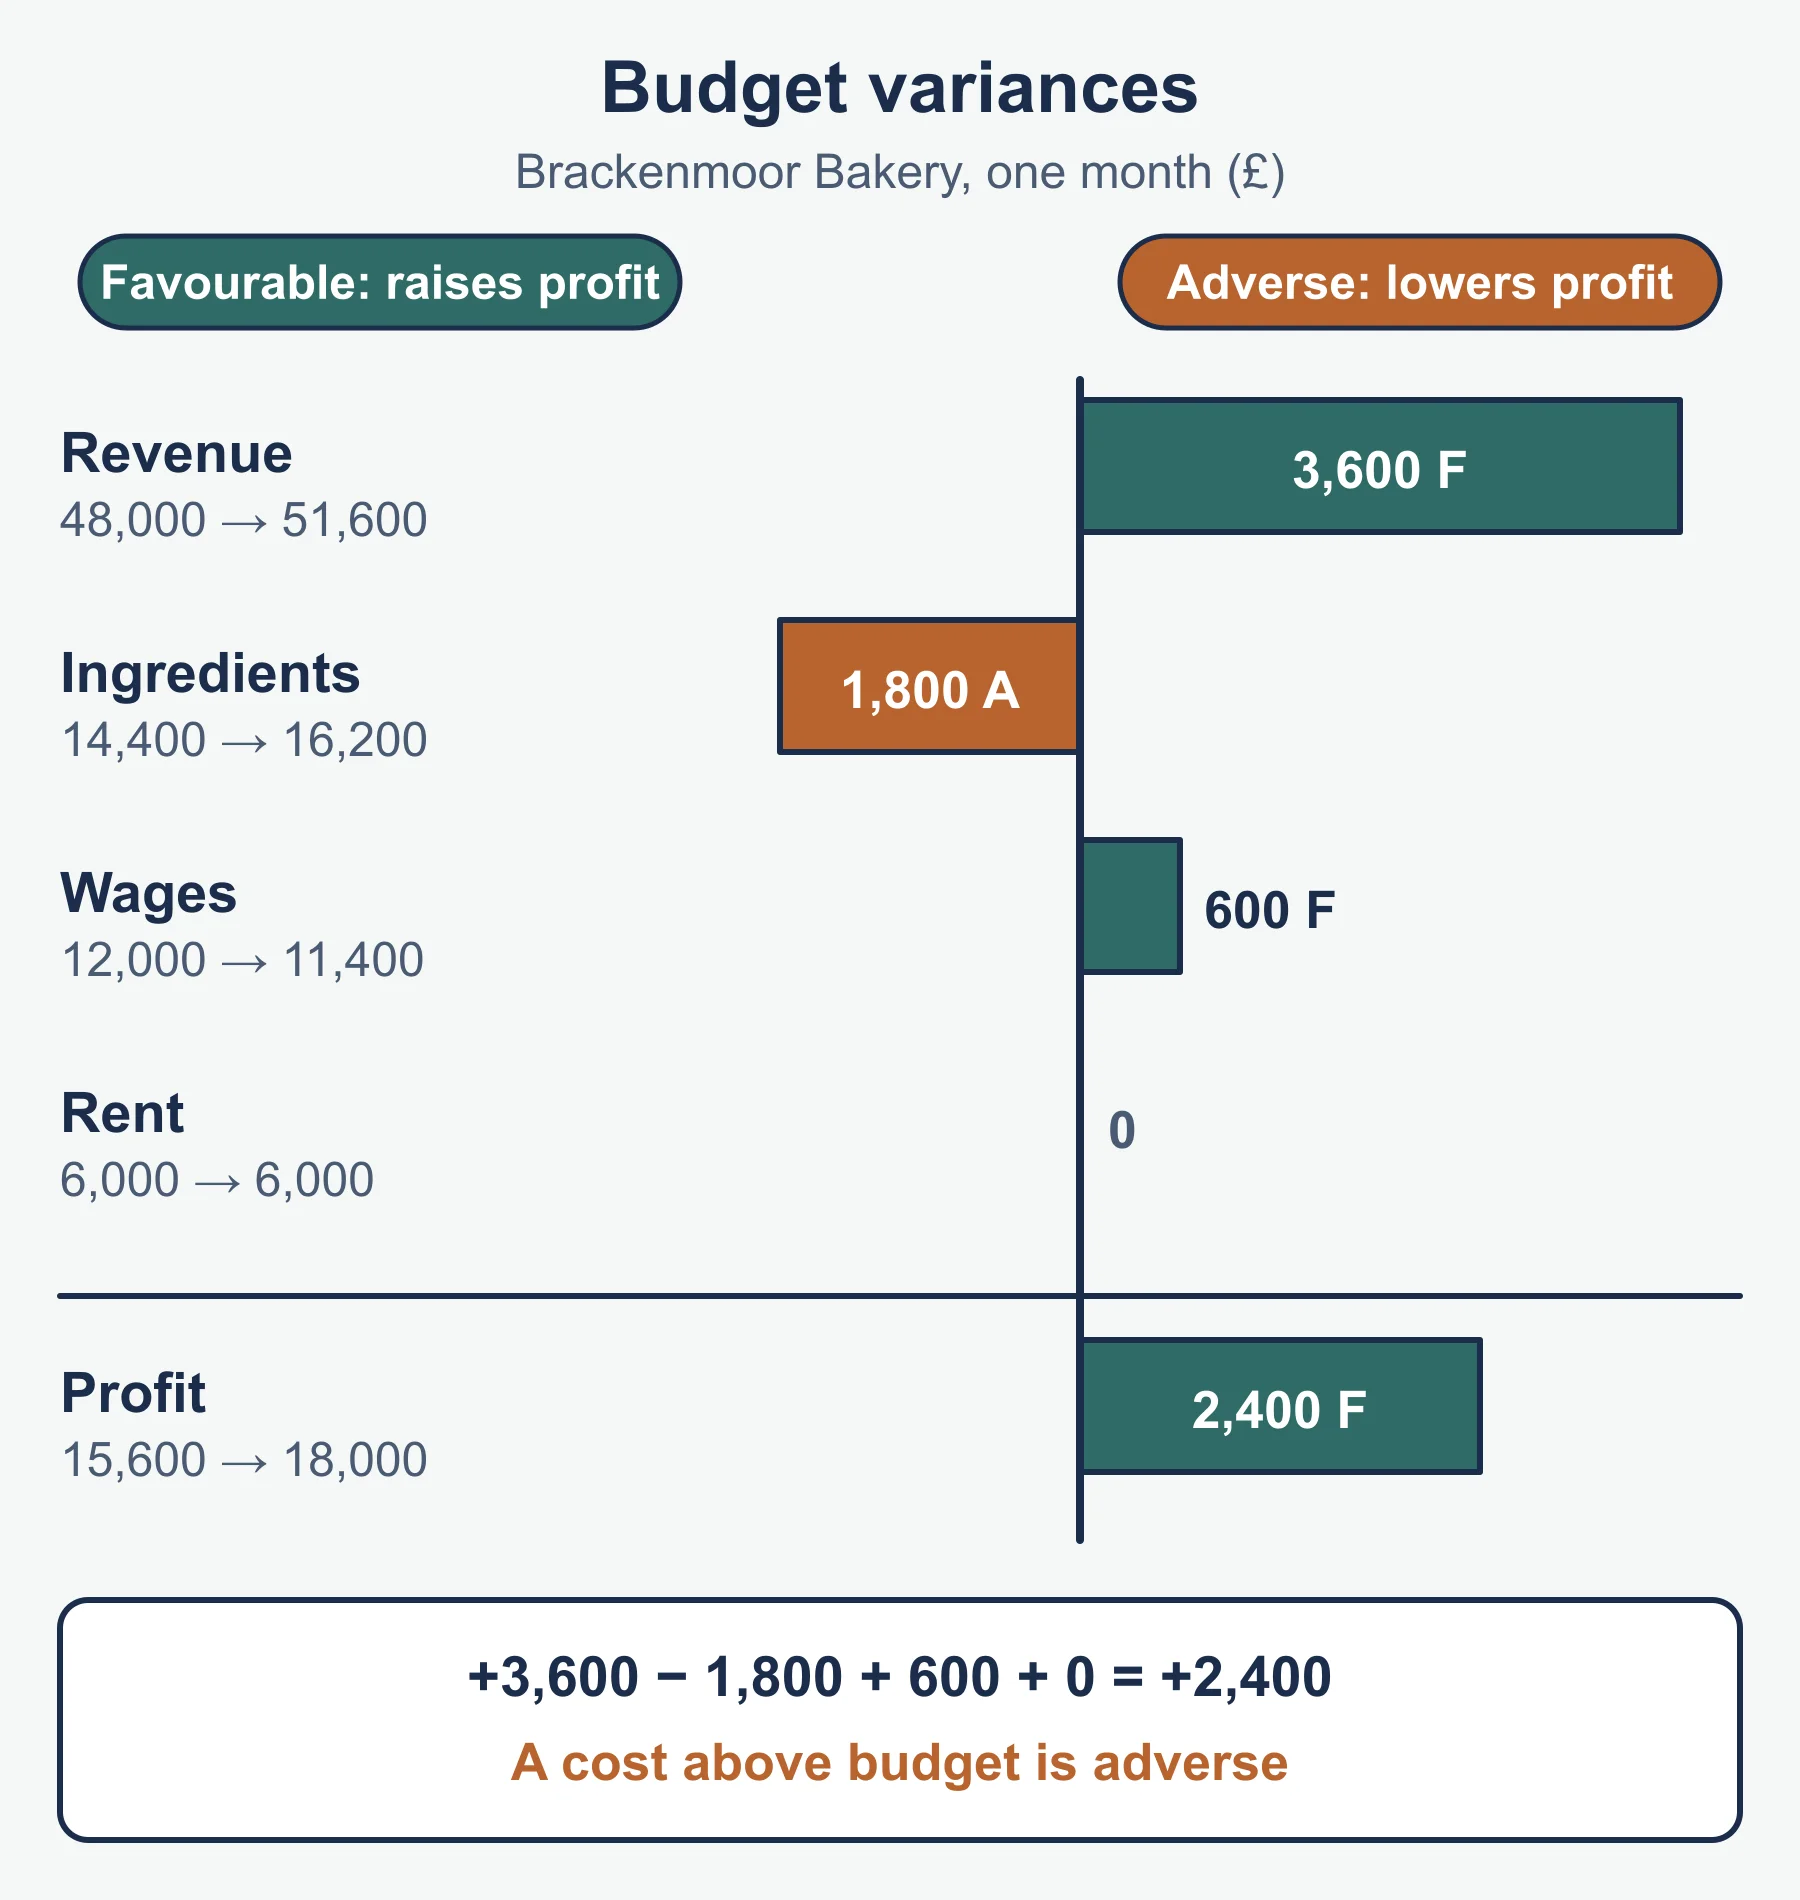
Variance analysis compares actual figures with budget: budget variance = budgeted figure − actual figure. Label each variance by its effect on profit, not by its sign: it is favourable if it improves profit (higher revenue or lower cost) and adverse if it reduces profit.
Worked example 2. Pilchbeck Candles budgeted for one month as shown.
| Item | Budget (£) | Actual (£) | Variance (£) | Type |
|---|---|---|---|---|
| Revenue | 50,000 | 46,000 | 4,000 | Adverse |
| Materials | 20,000 | 22,500 | 2,500 | Adverse |
| Labour | 12,000 | 11,400 | 600 | Favourable |
| Overheads | 8,000 | 8,000 | 0 | None |
Budgeted profit was 50,000 − 20,000 − 12,000 − 8,000 = £10,000. Actual profit was 46,000 − 22,500 − 11,400 − 8,000 = £4,100. The profit variance is £5,900 adverse. Materials ran 12.5% over budget, so a good analysis asks why.
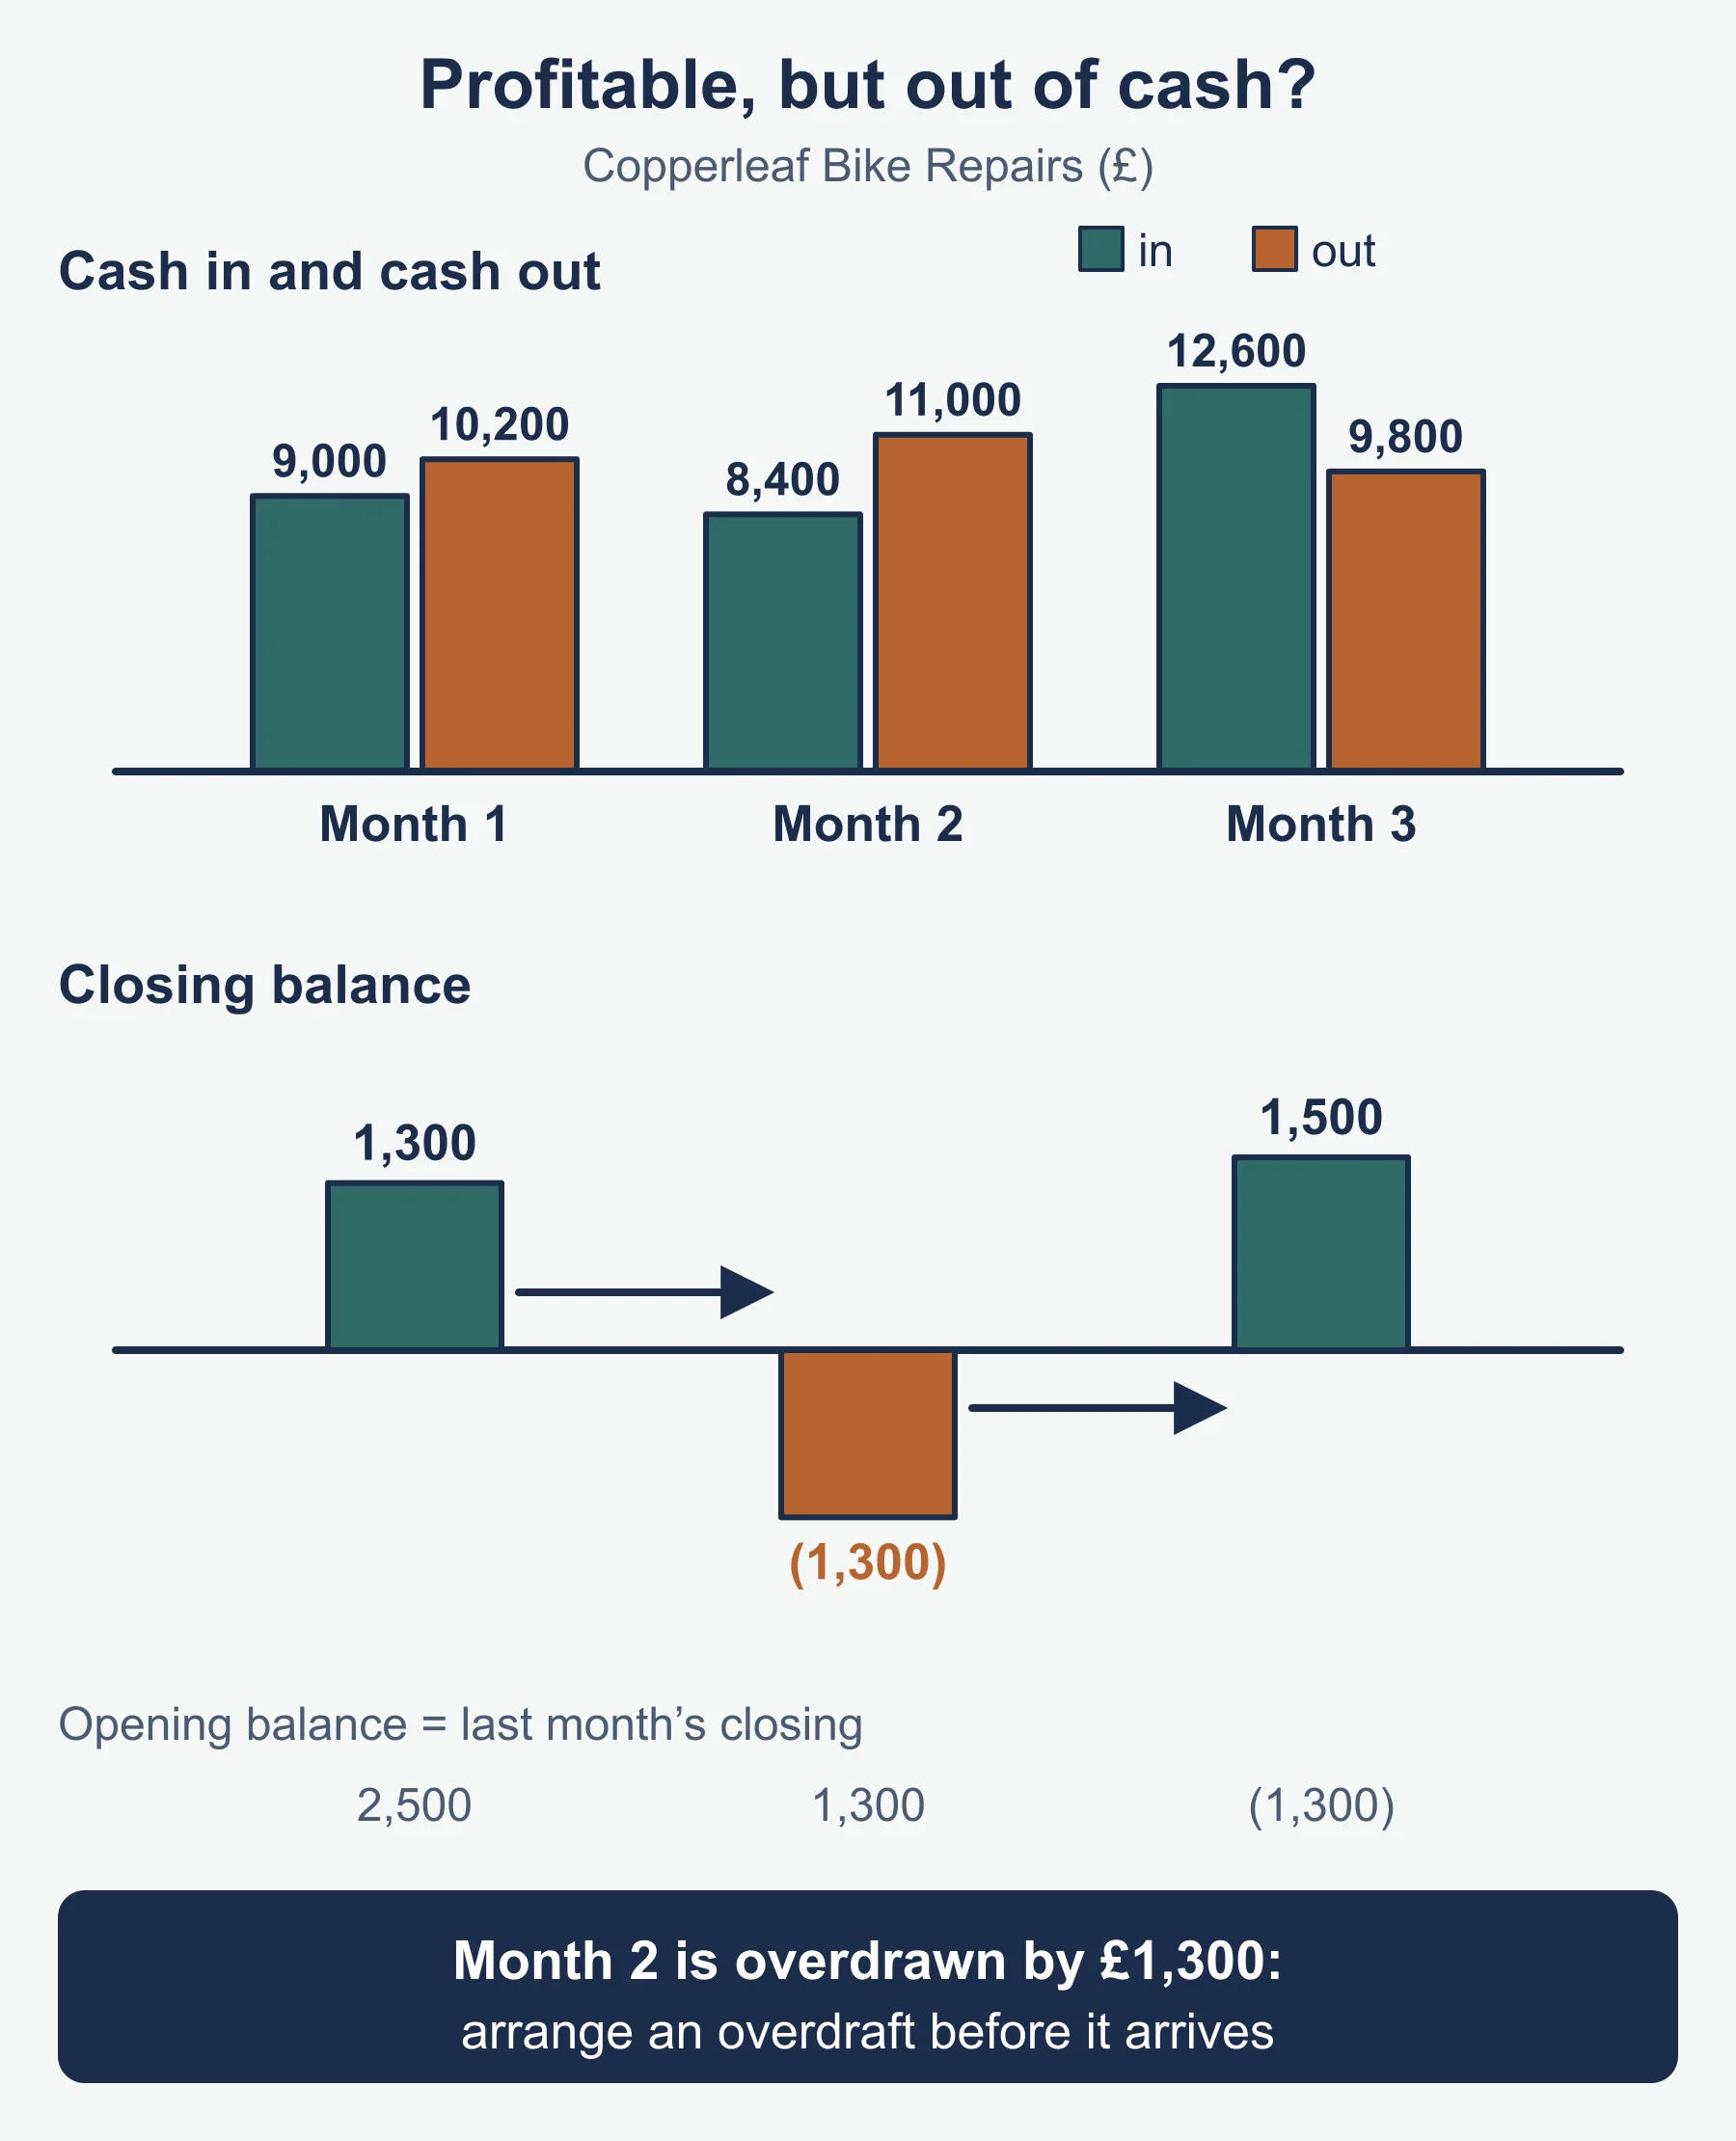
A cash flow forecast lists expected cash inflows and outflows month by month. Net cash flow = inflows − outflows; closing balance = opening balance + net cash flow, and carries to next month’s opening balance.
Worked example 3. Pilchbeck Candles starts January with £2,000.
| Jan | Feb | Mar | |
|---|---|---|---|
| Opening balance | 2,000 | −500 | −1,500 |
| Cash in | 18,000 | 21,000 | 24,000 |
| Cash out | 20,500 | 22,000 | 21,500 |
| Net cash flow | −2,500 | −1,000 | 2,500 |
| Closing balance | −500 | −1,500 | 1,000 |
The owner needs short-term funding for January and February (about £1,500 at the peak).
3. Break-even analysis
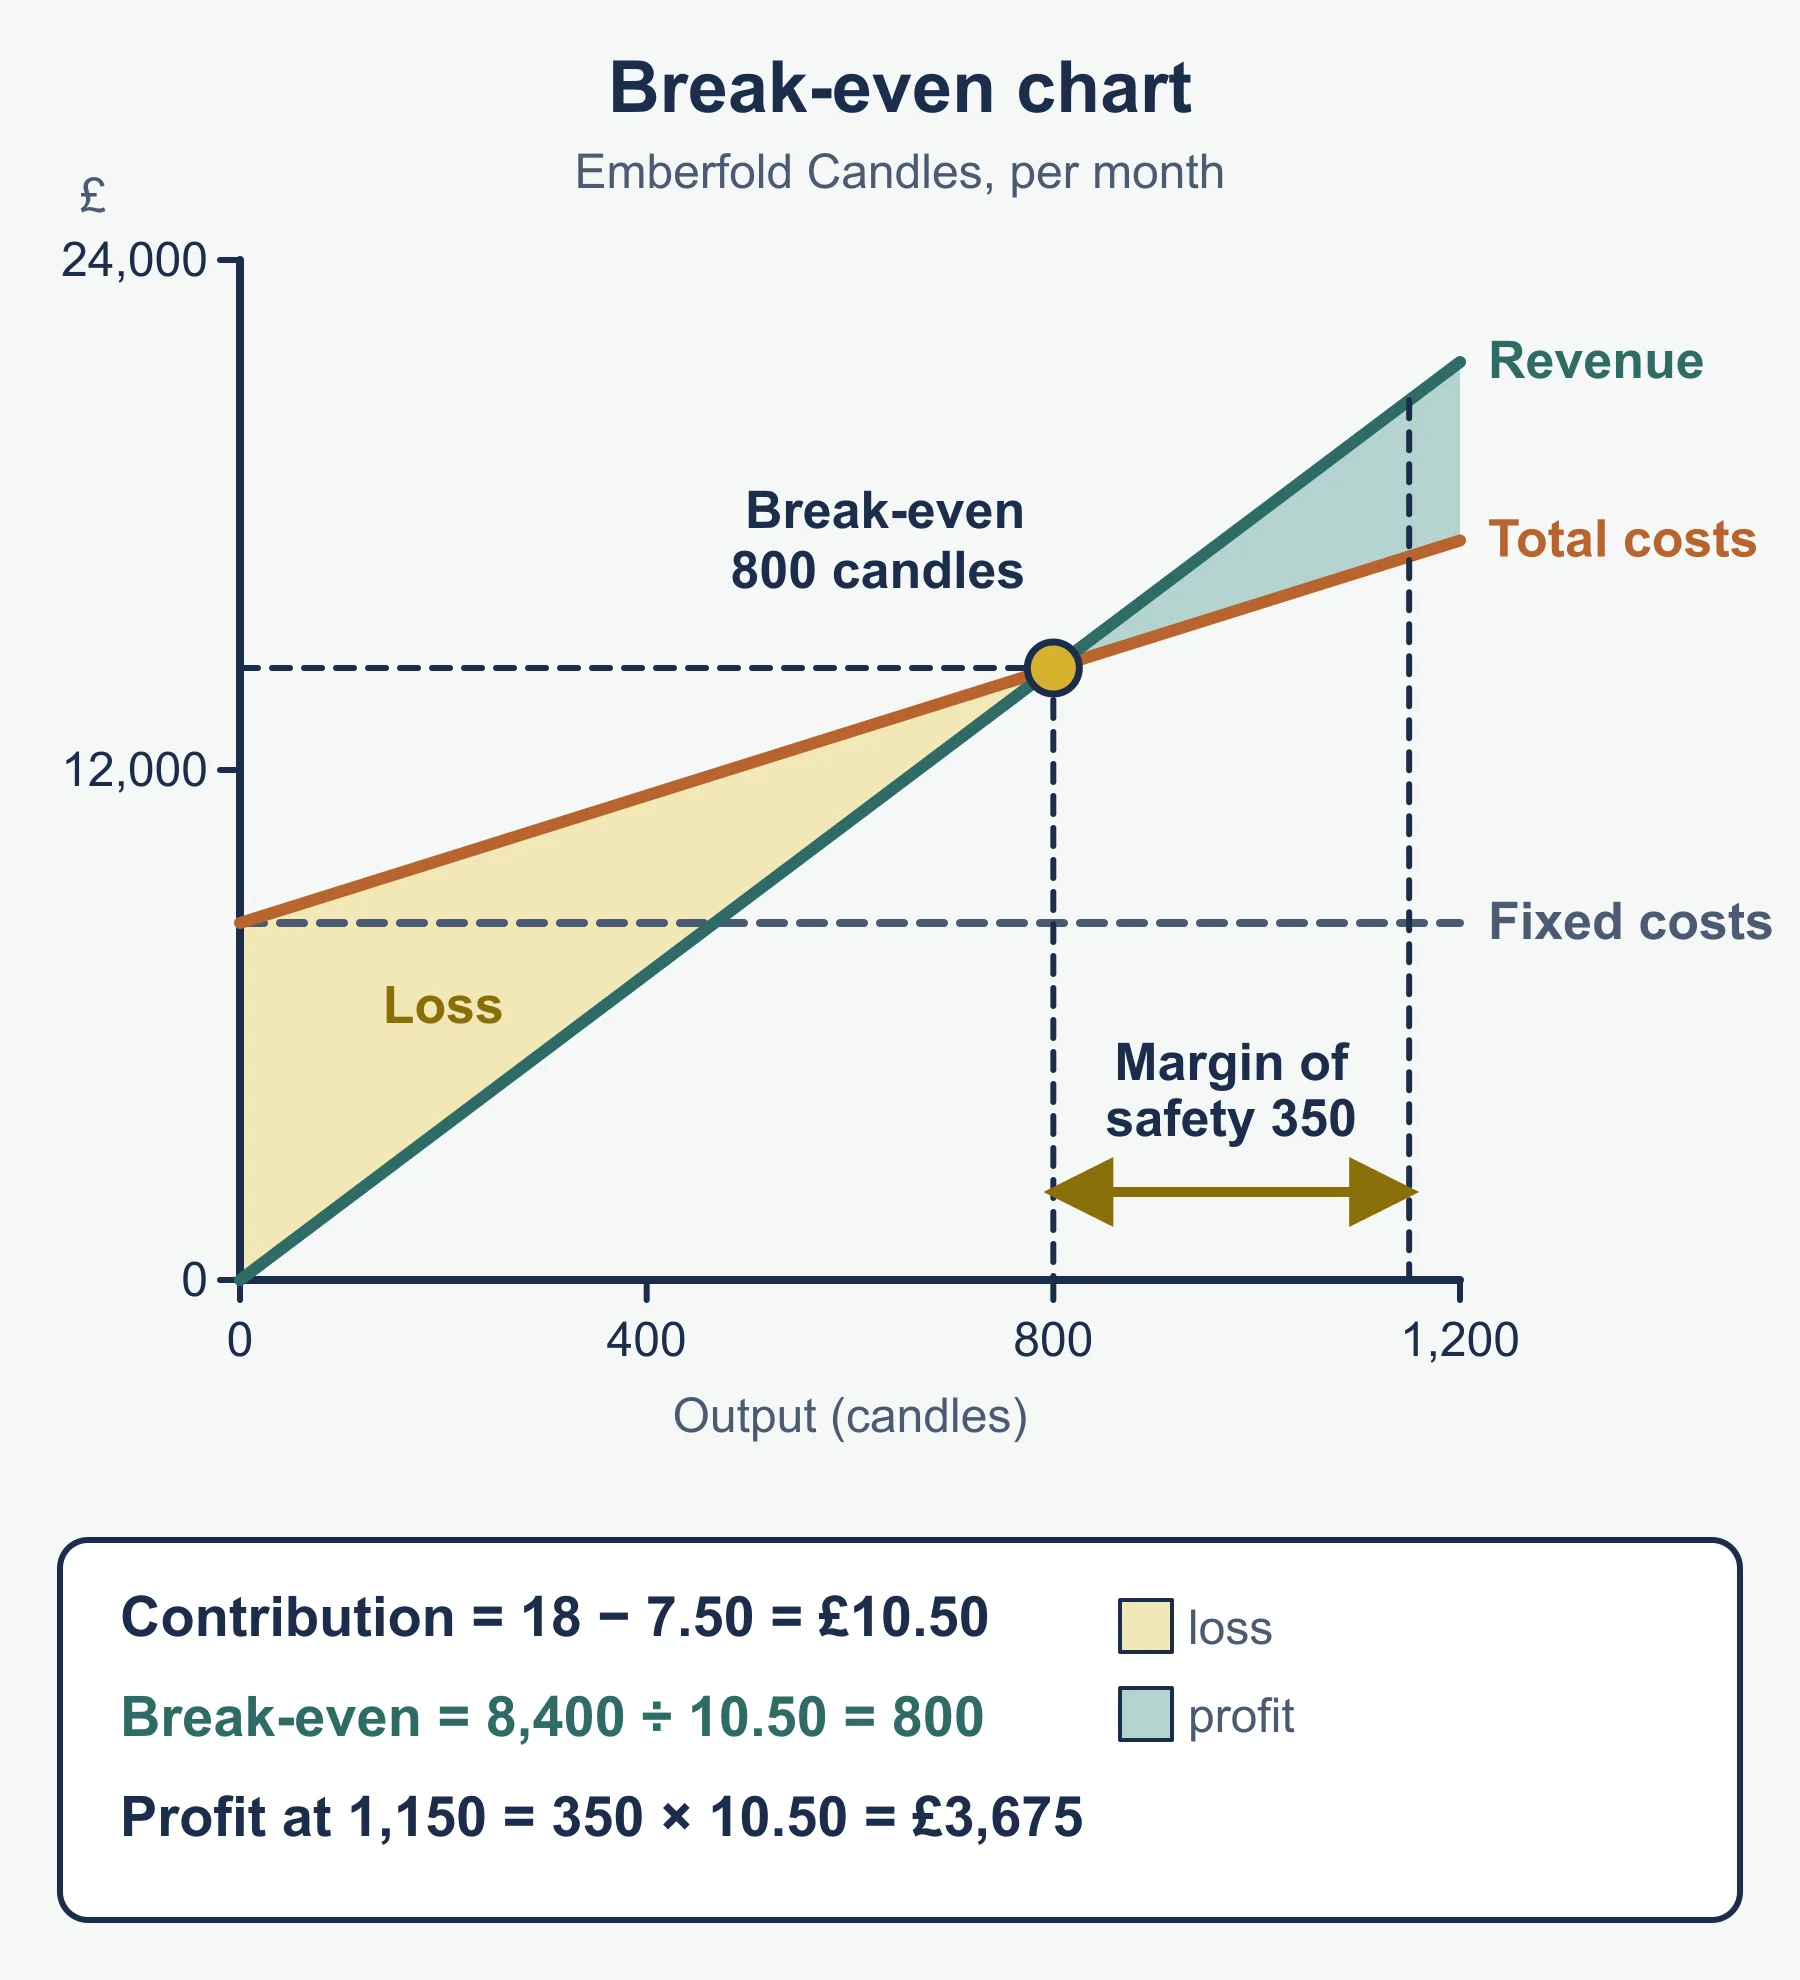
Break-even is the output where total revenue equals total costs. Total costs are fixed costs plus variable costs. The formulas below are the standard forms.
- Contribution per unit = selling price − variable cost per unit.
- Break-even output = fixed costs ÷ contribution per unit.
- Margin of safety = actual (or planned) output − break-even output.
- Total contribution = contribution per unit × output.
- Profit = total contribution − fixed costs.
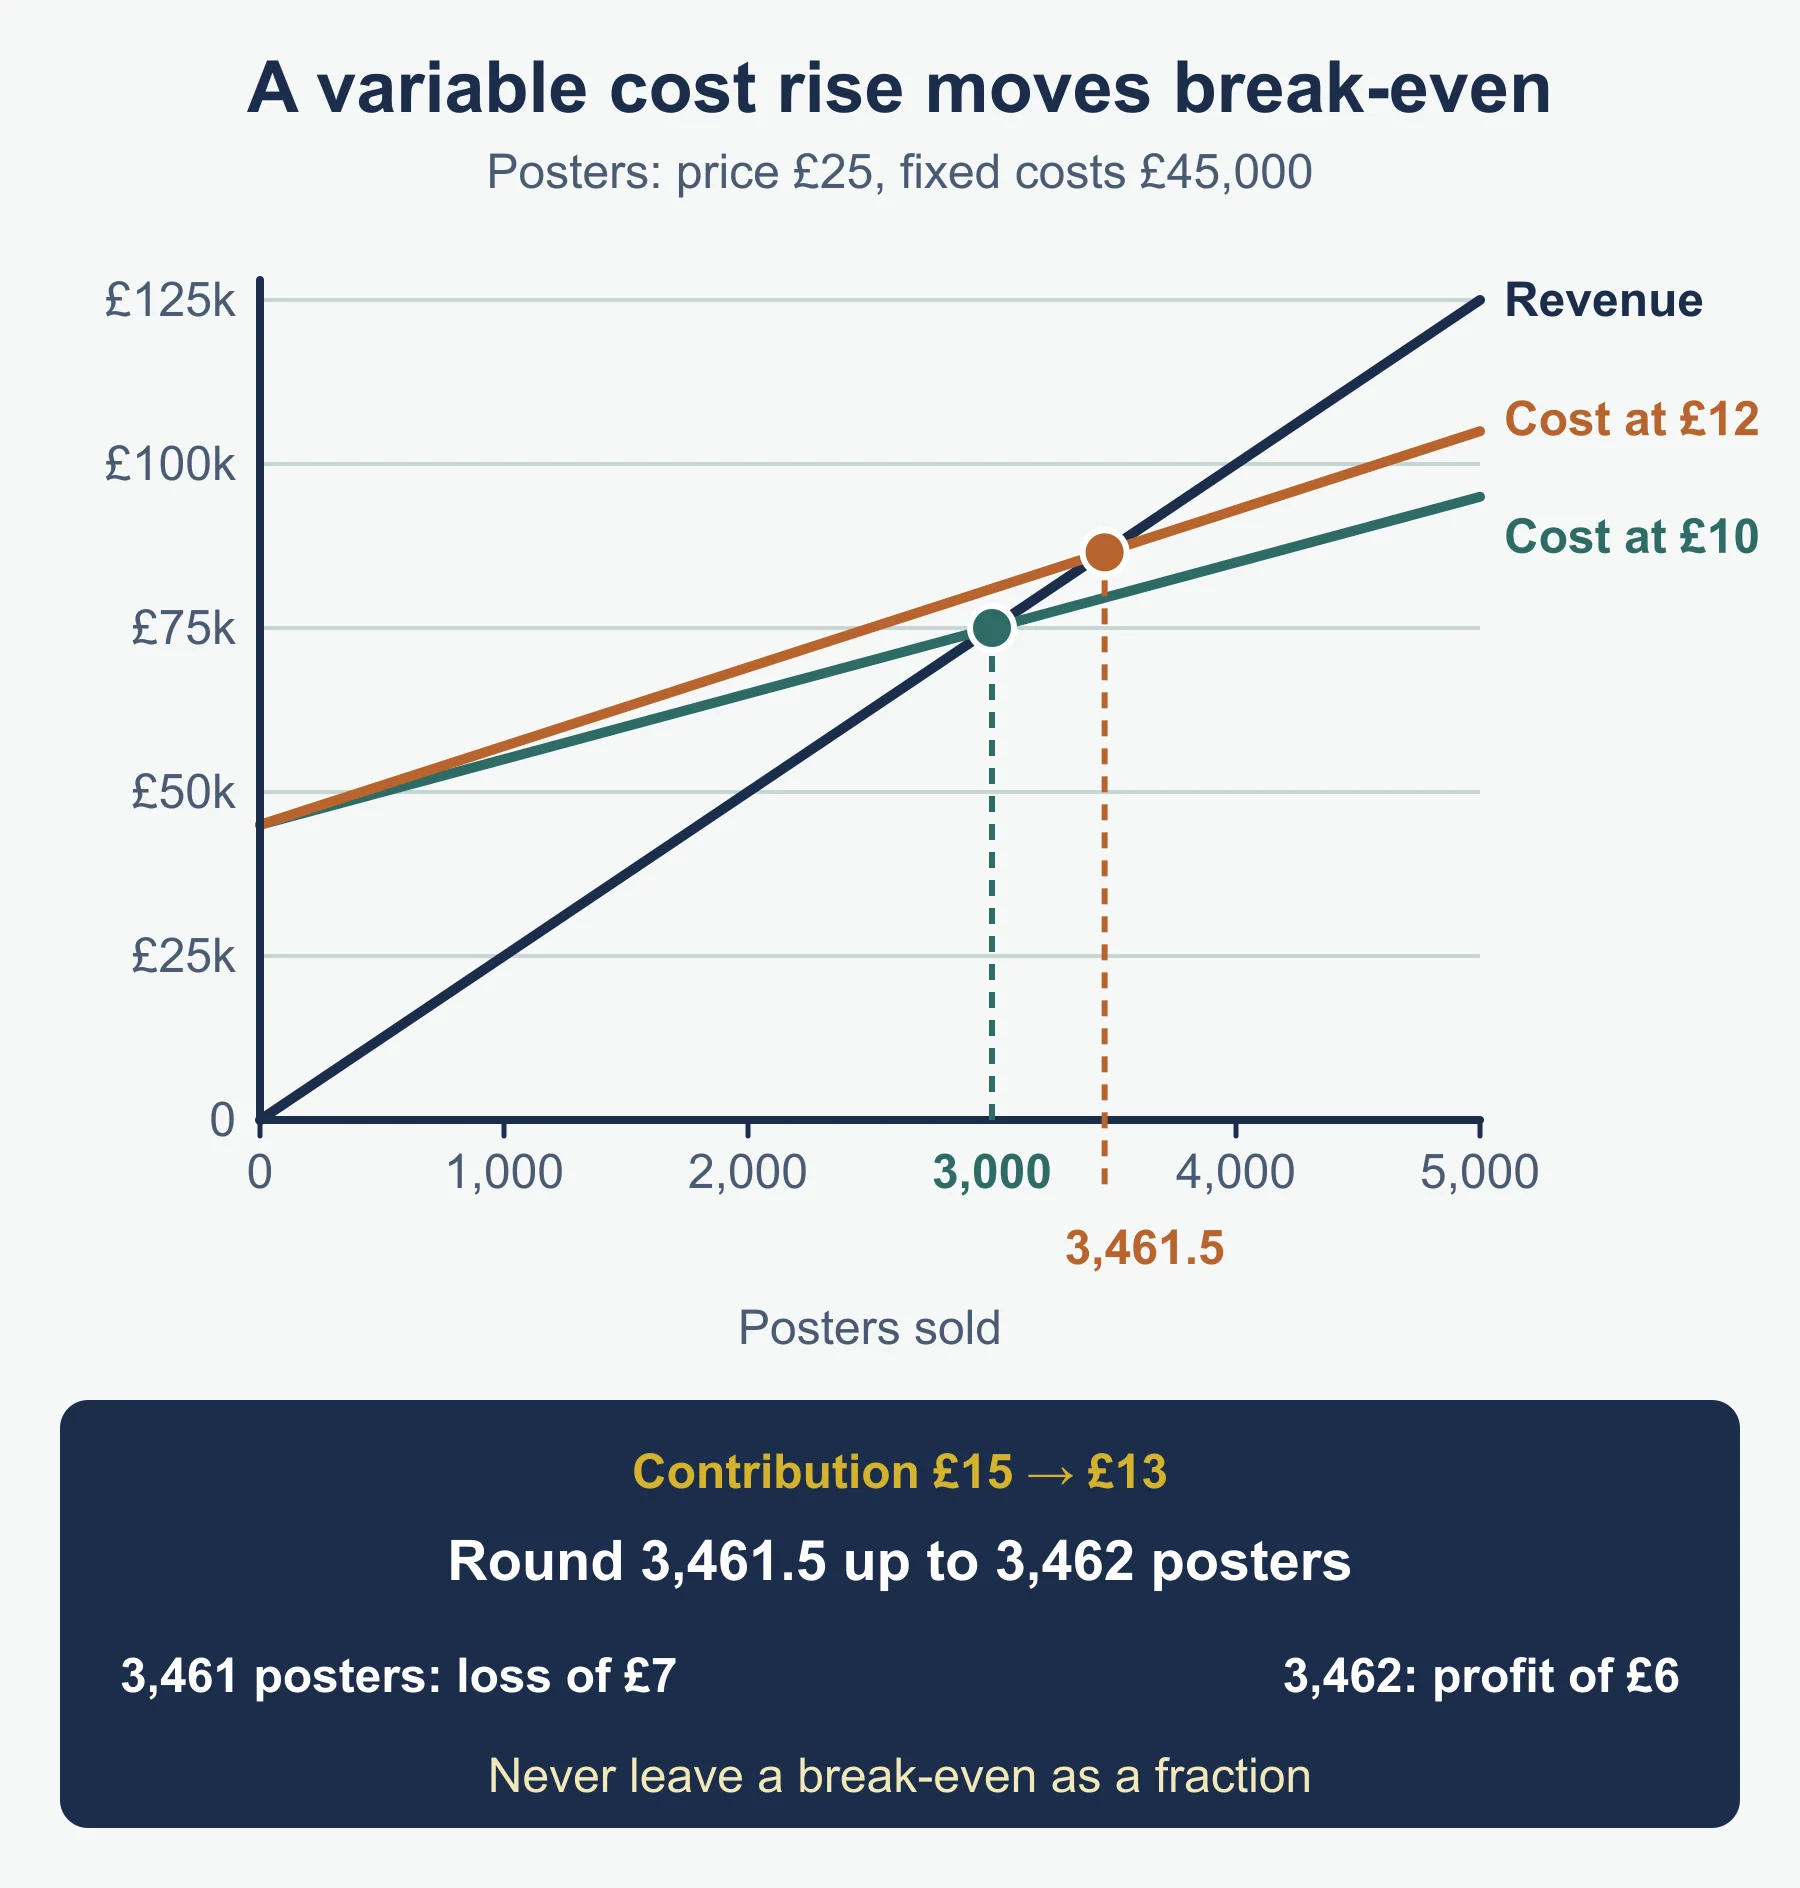
Building the chart. Put output on the horizontal axis and money on the vertical axis. Draw a flat line for fixed costs, a total cost line that starts at the fixed cost level and rises with output, and a revenue line from the origin. Break-even is where revenue and total cost cross. Profit lies right of that point and loss left of it. The margin of safety is the horizontal distance from break-even to the planned output.
Worked example 4. Dunsgate Printing sells posters at £25, with variable costs of £10 and fixed costs of £45,000. It plans to sell 4,000.
- Contribution per unit = 25 − 10 = £15.
- Break-even output = 45,000 ÷ 15 = 3,000 posters.
- Margin of safety = 4,000 − 3,000 = 1,000 posters (25% of planned output).
- Total contribution = 4,000 × 15 = £60,000; profit = 60,000 − 45,000 = £15,000.
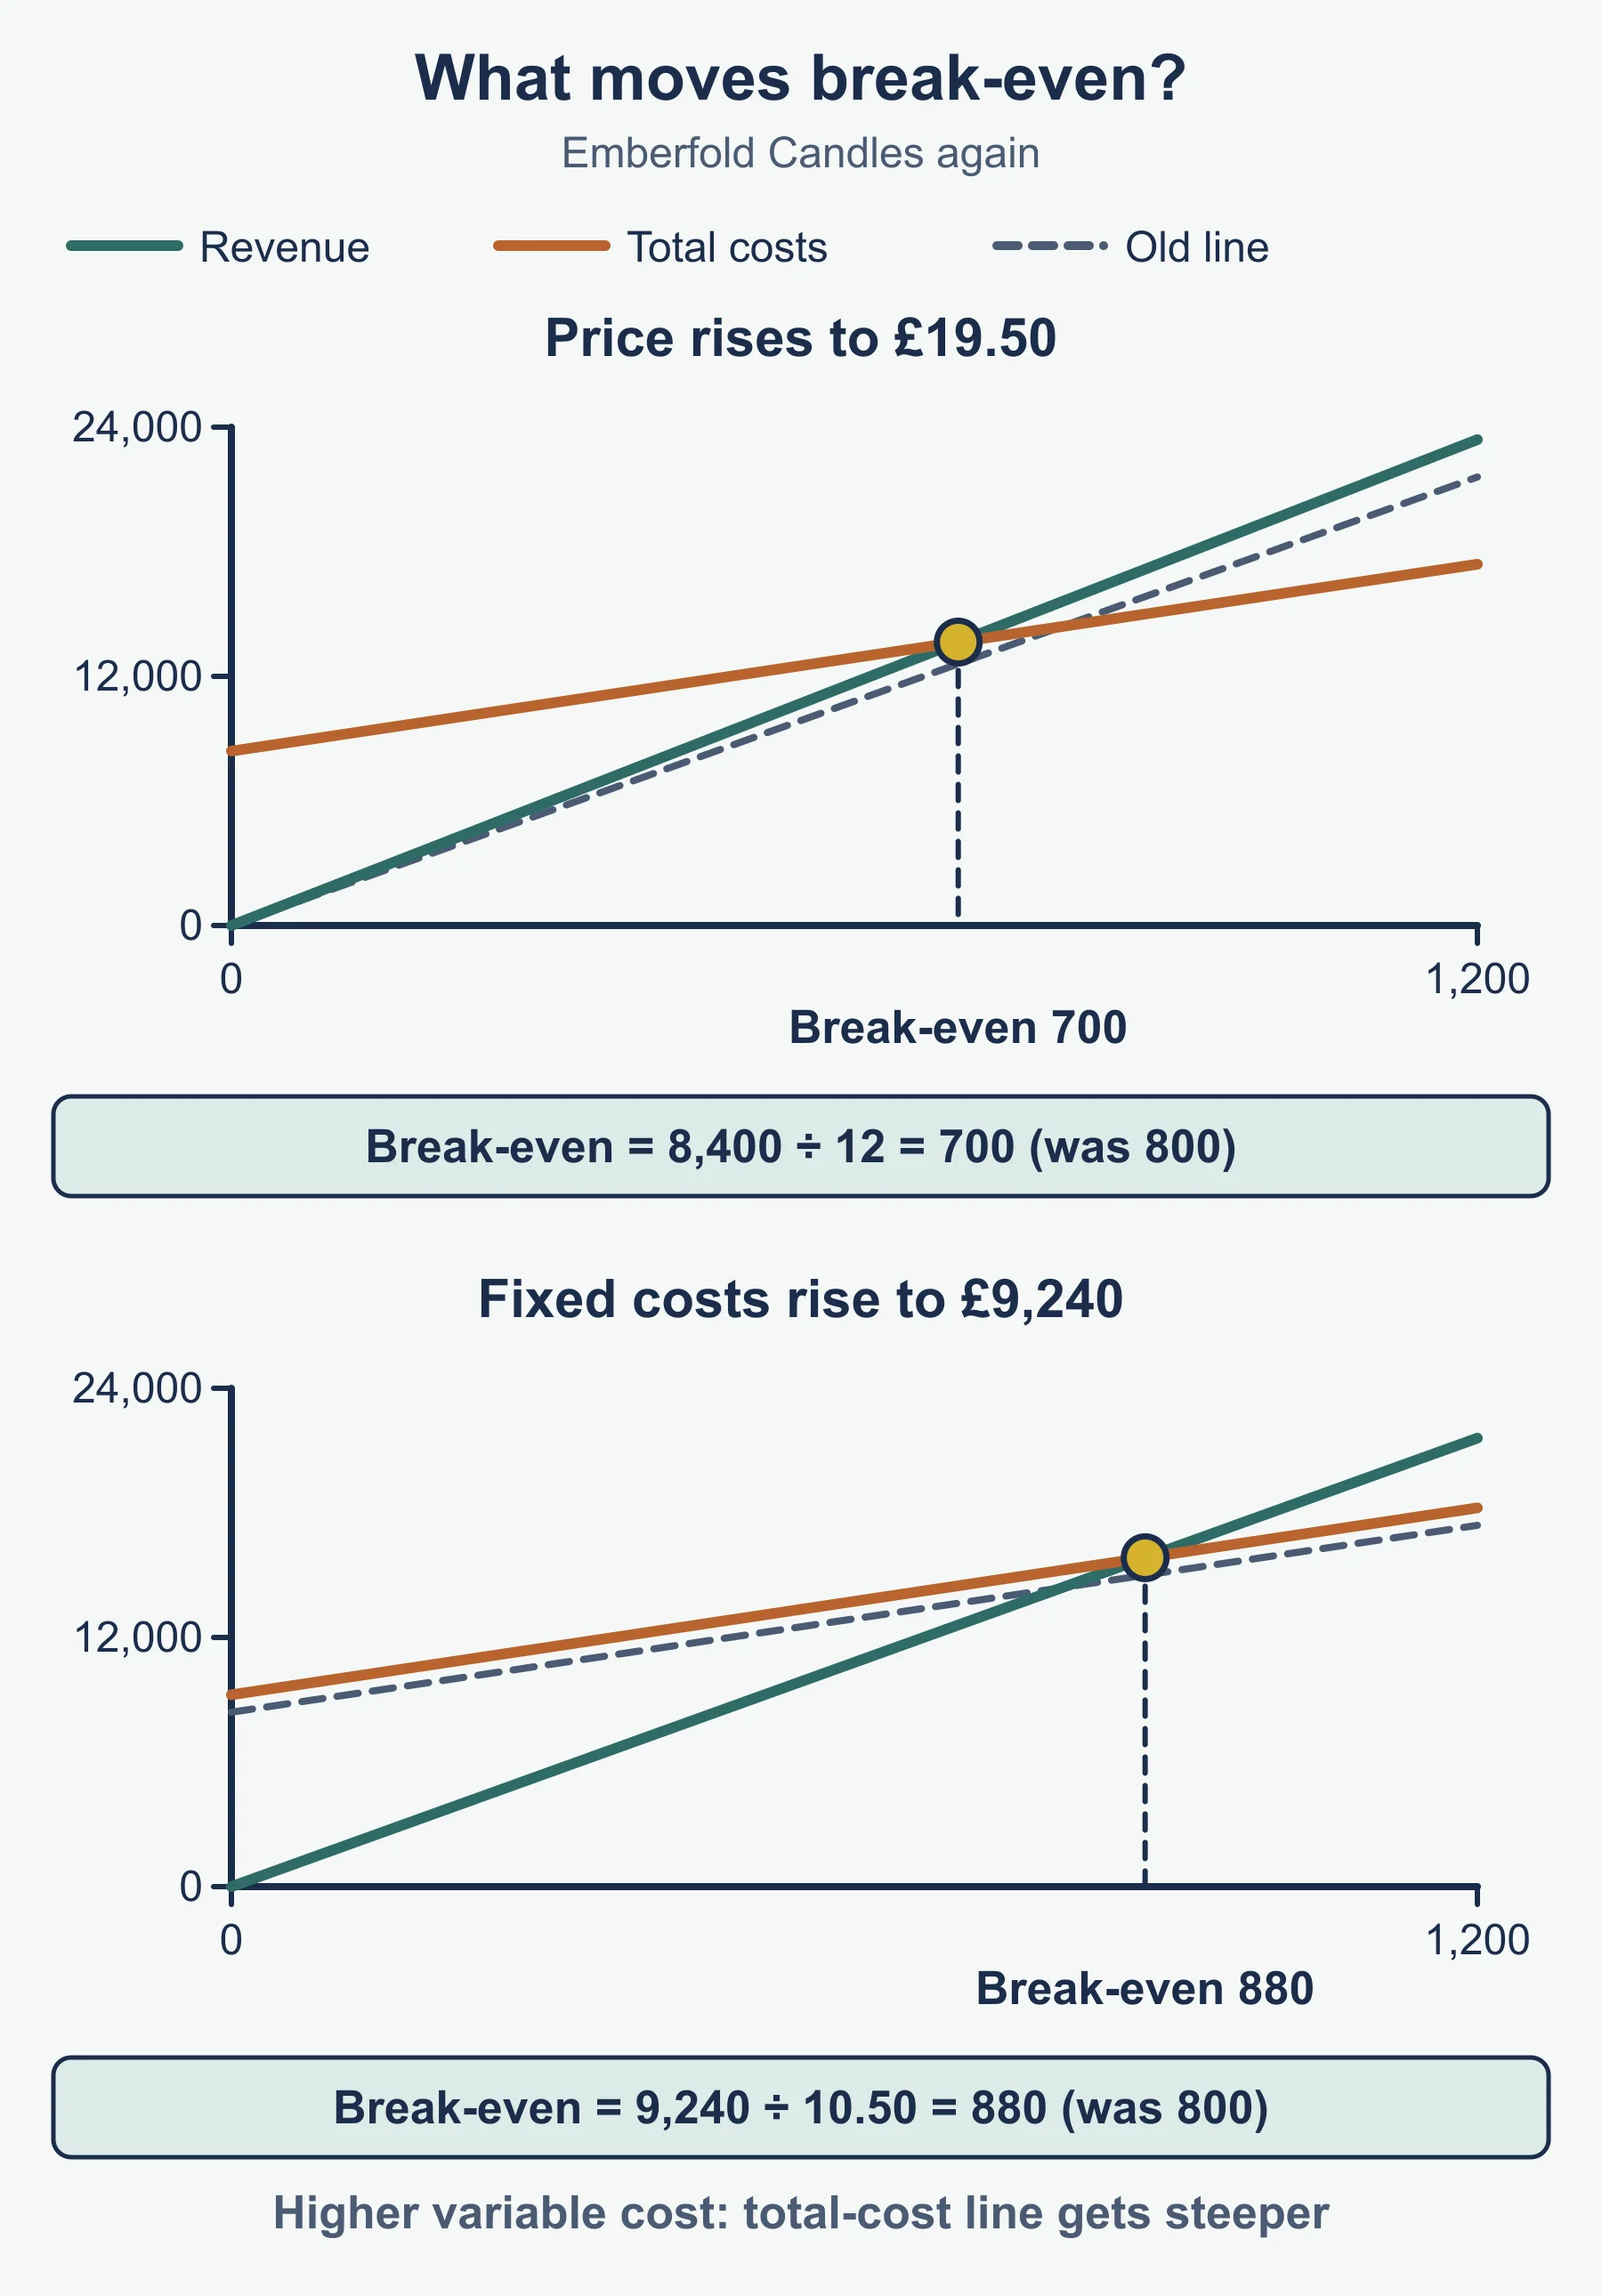
Effects of changes (each from the original figures):
- Price rises to £28: contribution £18, so break-even falls to 45,000 ÷ 18 = 2,500. On the chart the revenue line is steeper.
- Variable cost rises to £12: contribution £13, so break-even rises to 3,461.5, which is 3,462 whole posters. The total cost line is steeper.
- Fixed costs rise to £51,000: break-even rises to 51,000 ÷ 15 = 3,400. The total cost line starts higher but keeps the same slope.
- Planned output changes: break-even stays put, but the margin of safety and profit change.
Value of break-even. It is quick and helps judge risk and pricing. It assumes all output is sold at a constant price, that costs move in straight lines, and ignores demand changing when price changes.
4. Profit and financial reporting
Profit, cash and profitability. Profit is not cash (section 1). Profit is also not profitability: profit is an amount in pounds, while profitability sets it against revenue or capital, so a bigger business can earn more profit and still be less profitable.
You must be able to interpret, and amend, an income statement (revenue down to profit for the year) and a statement of financial position (assets, liabilities and equity at one date). The specification’s ratios are:
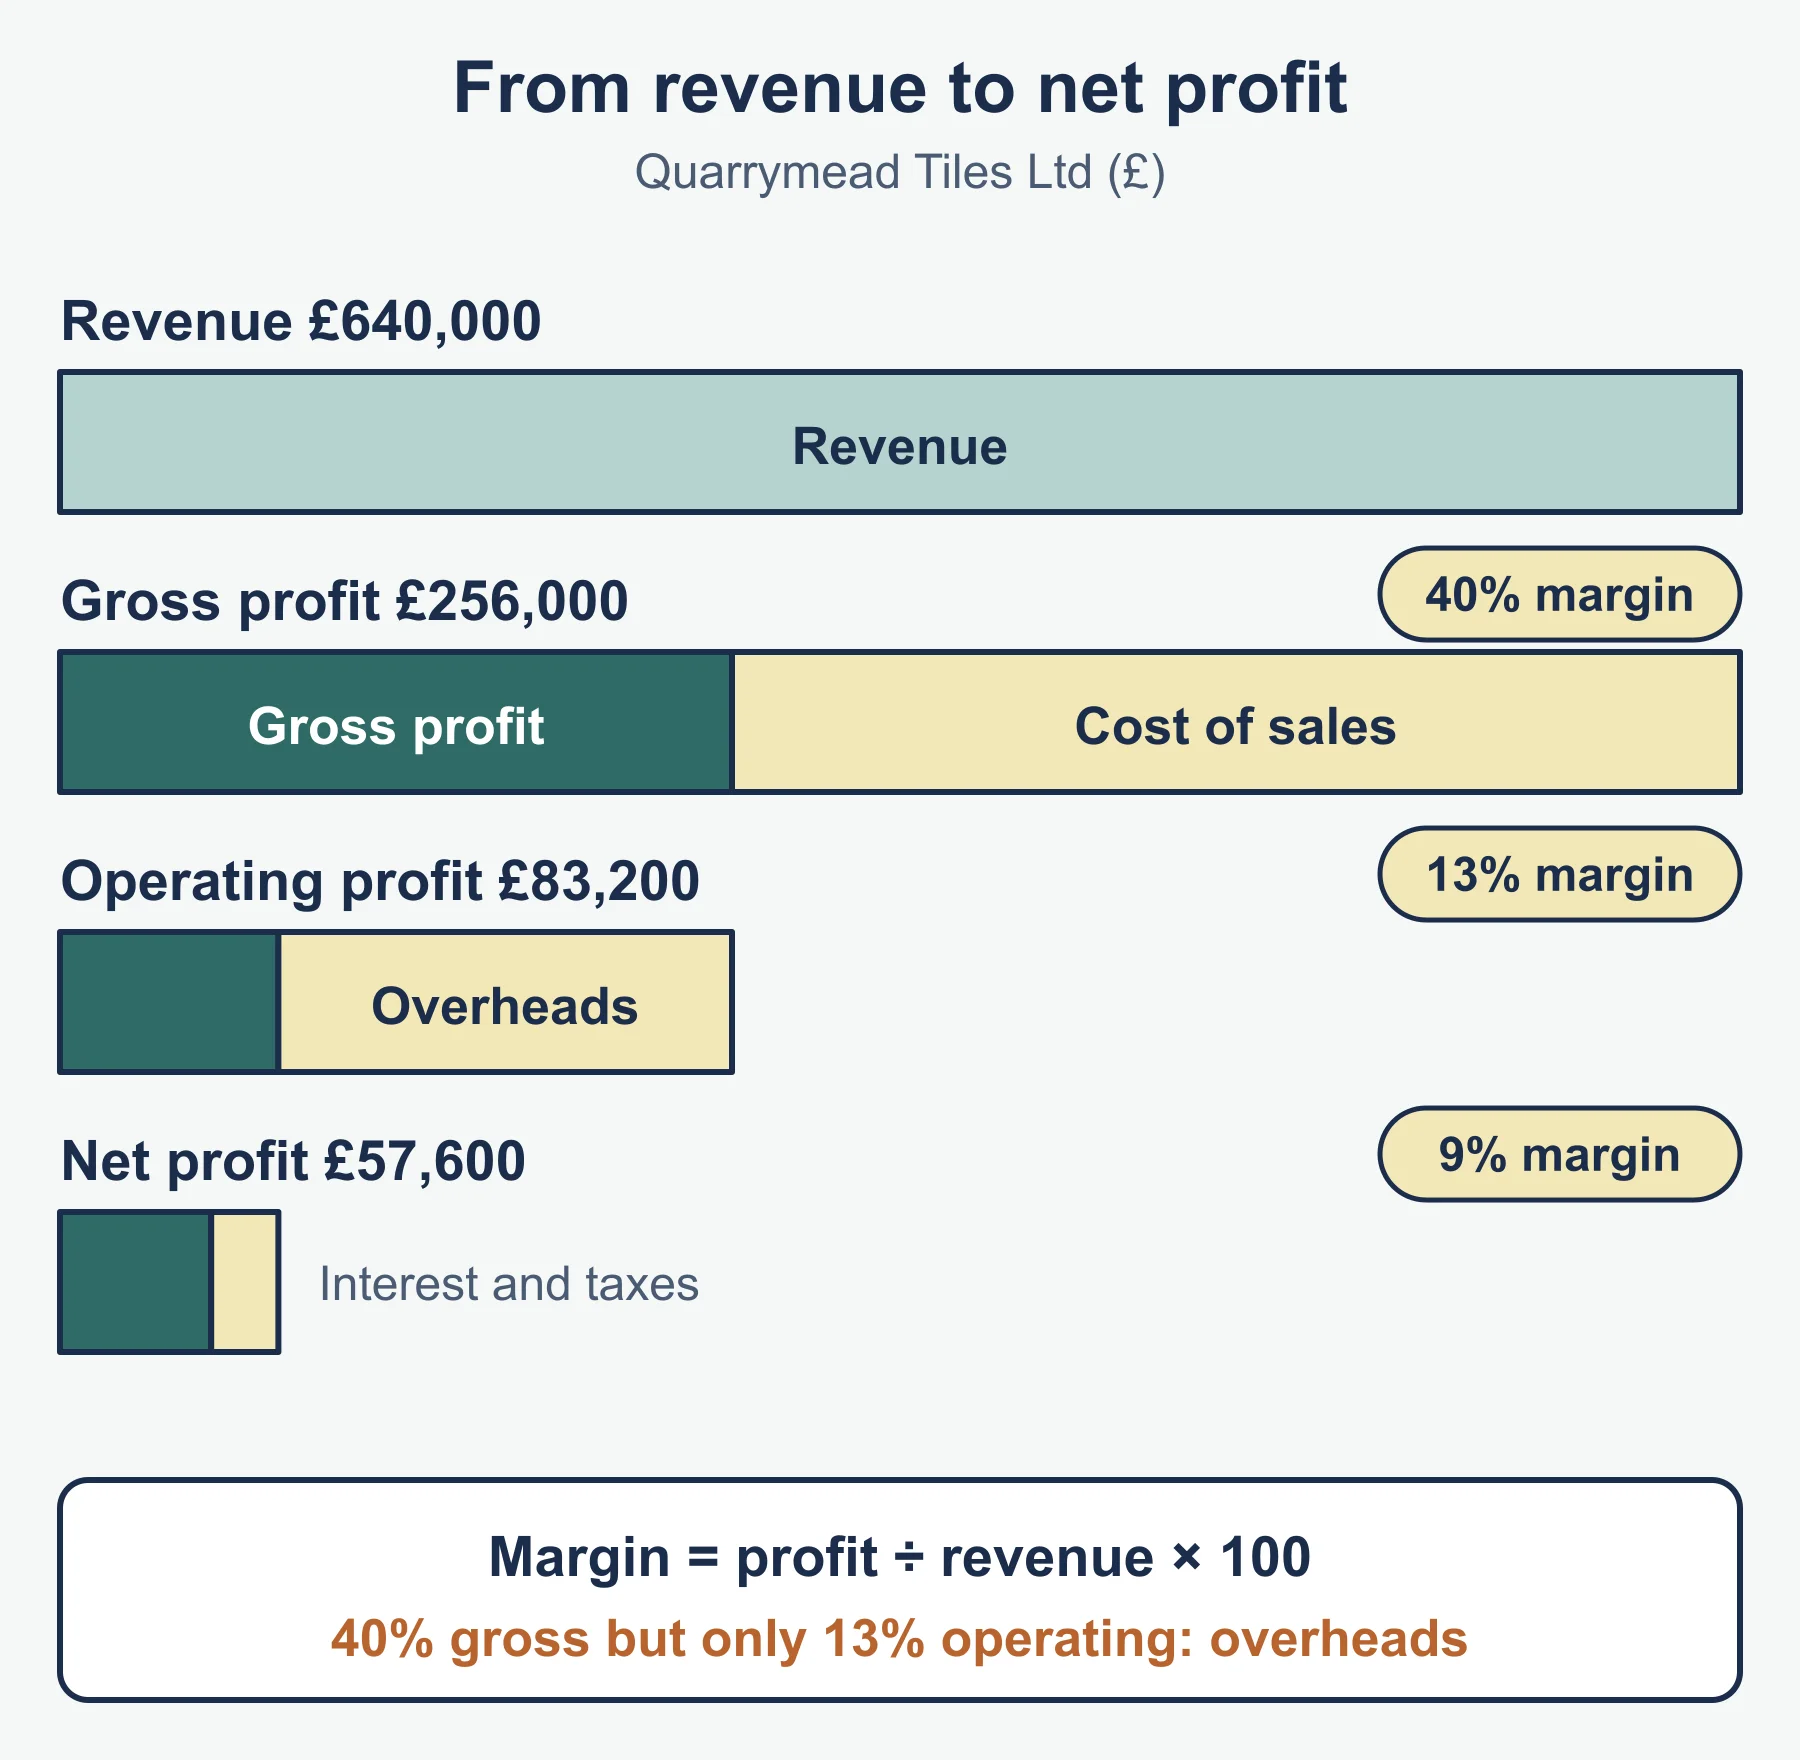
- Gross profit margin (%) = gross profit ÷ revenue × 100.
- Operating profit margin (%) = operating profit ÷ revenue × 100.
- Profit for the year margin (%) = profit for the year ÷ revenue × 100.
- Return on capital employed, ROCE (%) = operating profit ÷ (total equity + non-current liabilities) × 100.
- Return on investment and gearing, as in section 1.
Worked example 5. Calthwaite Cycles has revenue £640,000, cost of sales £416,000, operating expenses £164,000 and finance costs £14,000, with tax at 20% of profit before tax.
| Measure | £ | Margin |
|---|---|---|
| Gross profit | 224,000 | 35.0% |
| Operating profit | 60,000 | 9.4% |
| Profit before tax | 46,000 | |
| Tax | 9,200 | |
| Profit for the year | 36,800 | 5.8% |
The drop from 35.0% to 9.4% shows operating expenses absorb most of the gross profit; finance costs and tax matter less. With the capital employed from worked example 1 (£490,000 equity + £210,000 non-current liabilities = £700,000), ROCE = 60,000 ÷ 700,000 × 100 = 8.6%.
Using the results. A ratio means little alone: compare it with earlier years (the trend), with competitors (benchmarking) and with the business’s objectives, and allow for the business environment. Index numbers and percentage changes help show trends. Limitations of financial reporting: the figures are historic, and they leave out non-financial factors such as staff morale, brand reputation and environmental impact.
5. Cash flow and liquidity: payables, receivables and ratios
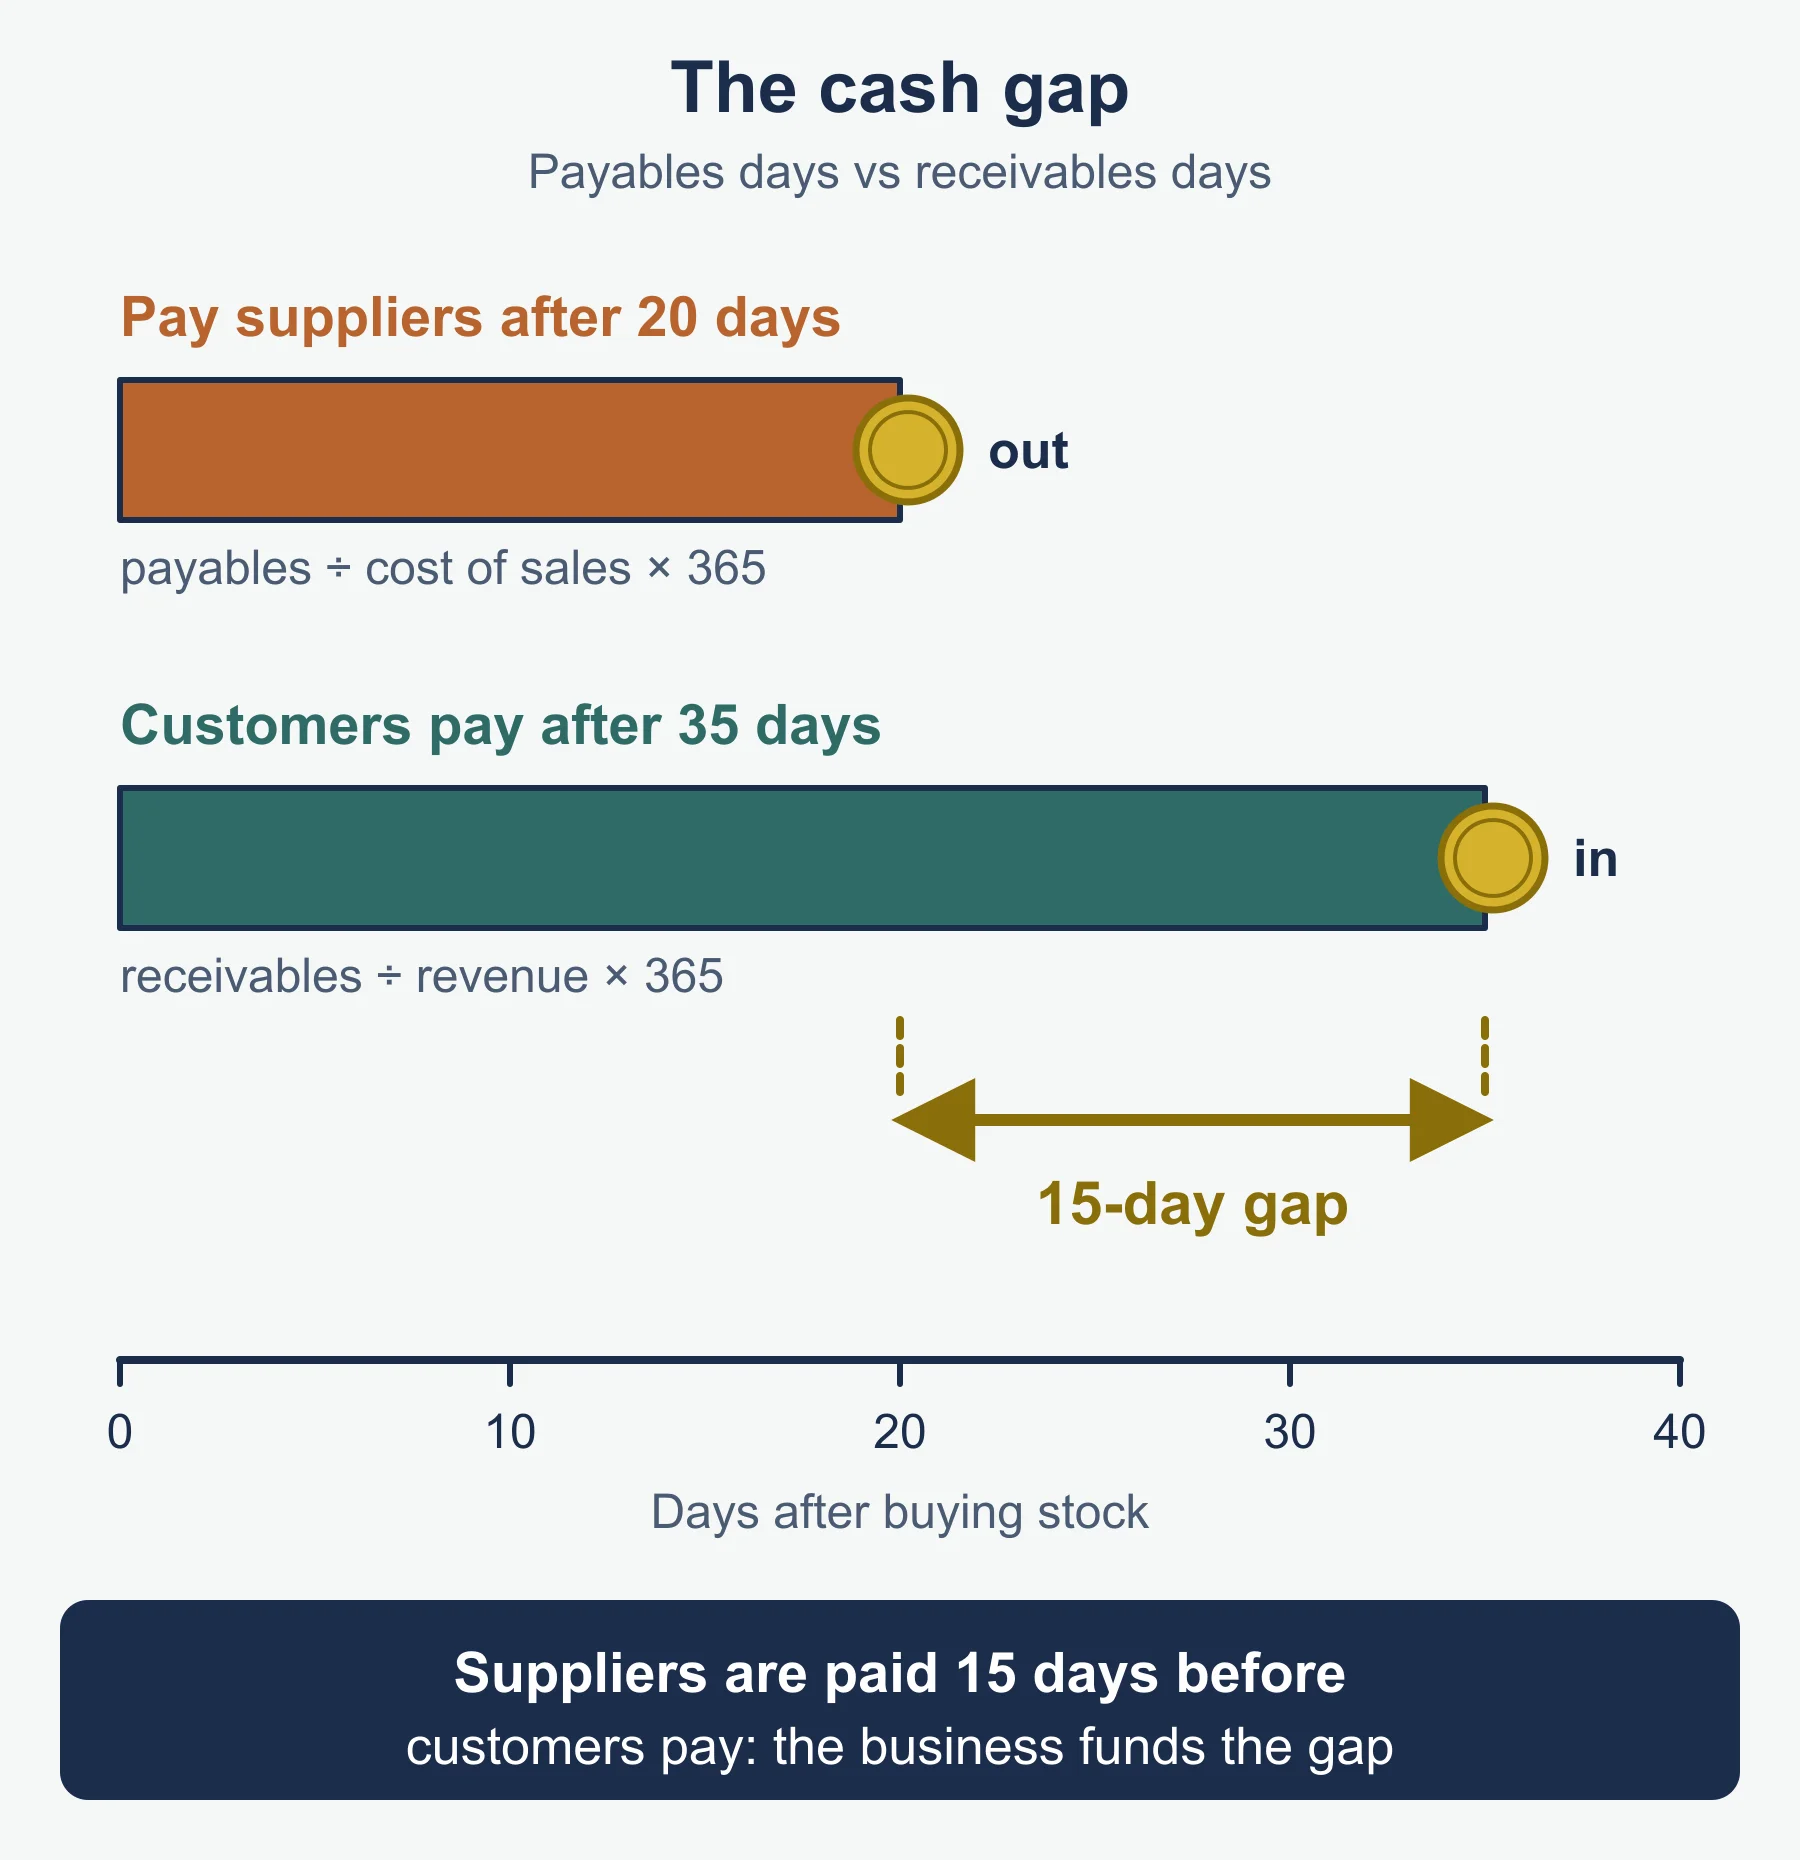
Receivables are customers who owe the business money for goods already supplied on credit. Payables are suppliers the business owes. Cash problems often come from a mismatch: paying payables quickly while waiting for receivables.
Worked example 6. Naylorth Foods buys ingredients costing £26,000 a month on 30 days’ credit but sells £40,000 of goods a month to retailers who pay after 60 days. Each month the business pays its supplier one month after buying, yet waits two months for the matching receipts. It must fund a gap of about a month’s purchases (£26,000) for as long as the pattern continues, even though each month’s sales are profitable.
Ways to shorten the gap are in section 7.
Liquidity ratios (formulas from the specification’s annex):
- Current ratio = current assets ÷ current liabilities.
- Acid test ratio = (current assets − inventory) ÷ current liabilities.
- Payables days = payables ÷ cost of sales × 365.
- Receivables days = receivables ÷ revenue × 365.
Worked example 7. Over a year Naylorth has revenue of £480,000 and cost of sales of £312,000. At the year end it holds inventory £15,000, receivables £80,000 and cash £5,000 (current assets £100,000), and owes payables £26,000 and an overdraft of £14,000 (current liabilities £40,000).
- Current ratio = 100,000 ÷ 40,000 = 2.5.
- Acid test ratio = (100,000 − 15,000) ÷ 40,000 = 2.1 (to one decimal place).
- Receivables days = 80,000 ÷ 480,000 × 365 = 61 days; payables days = 26,000 ÷ 312,000 × 365 = 30 days.
The ratios look comfortable, but customers take about a month longer to pay than Naylorth takes to pay its suppliers, which is why it needs the overdraft.
6. Sources of finance
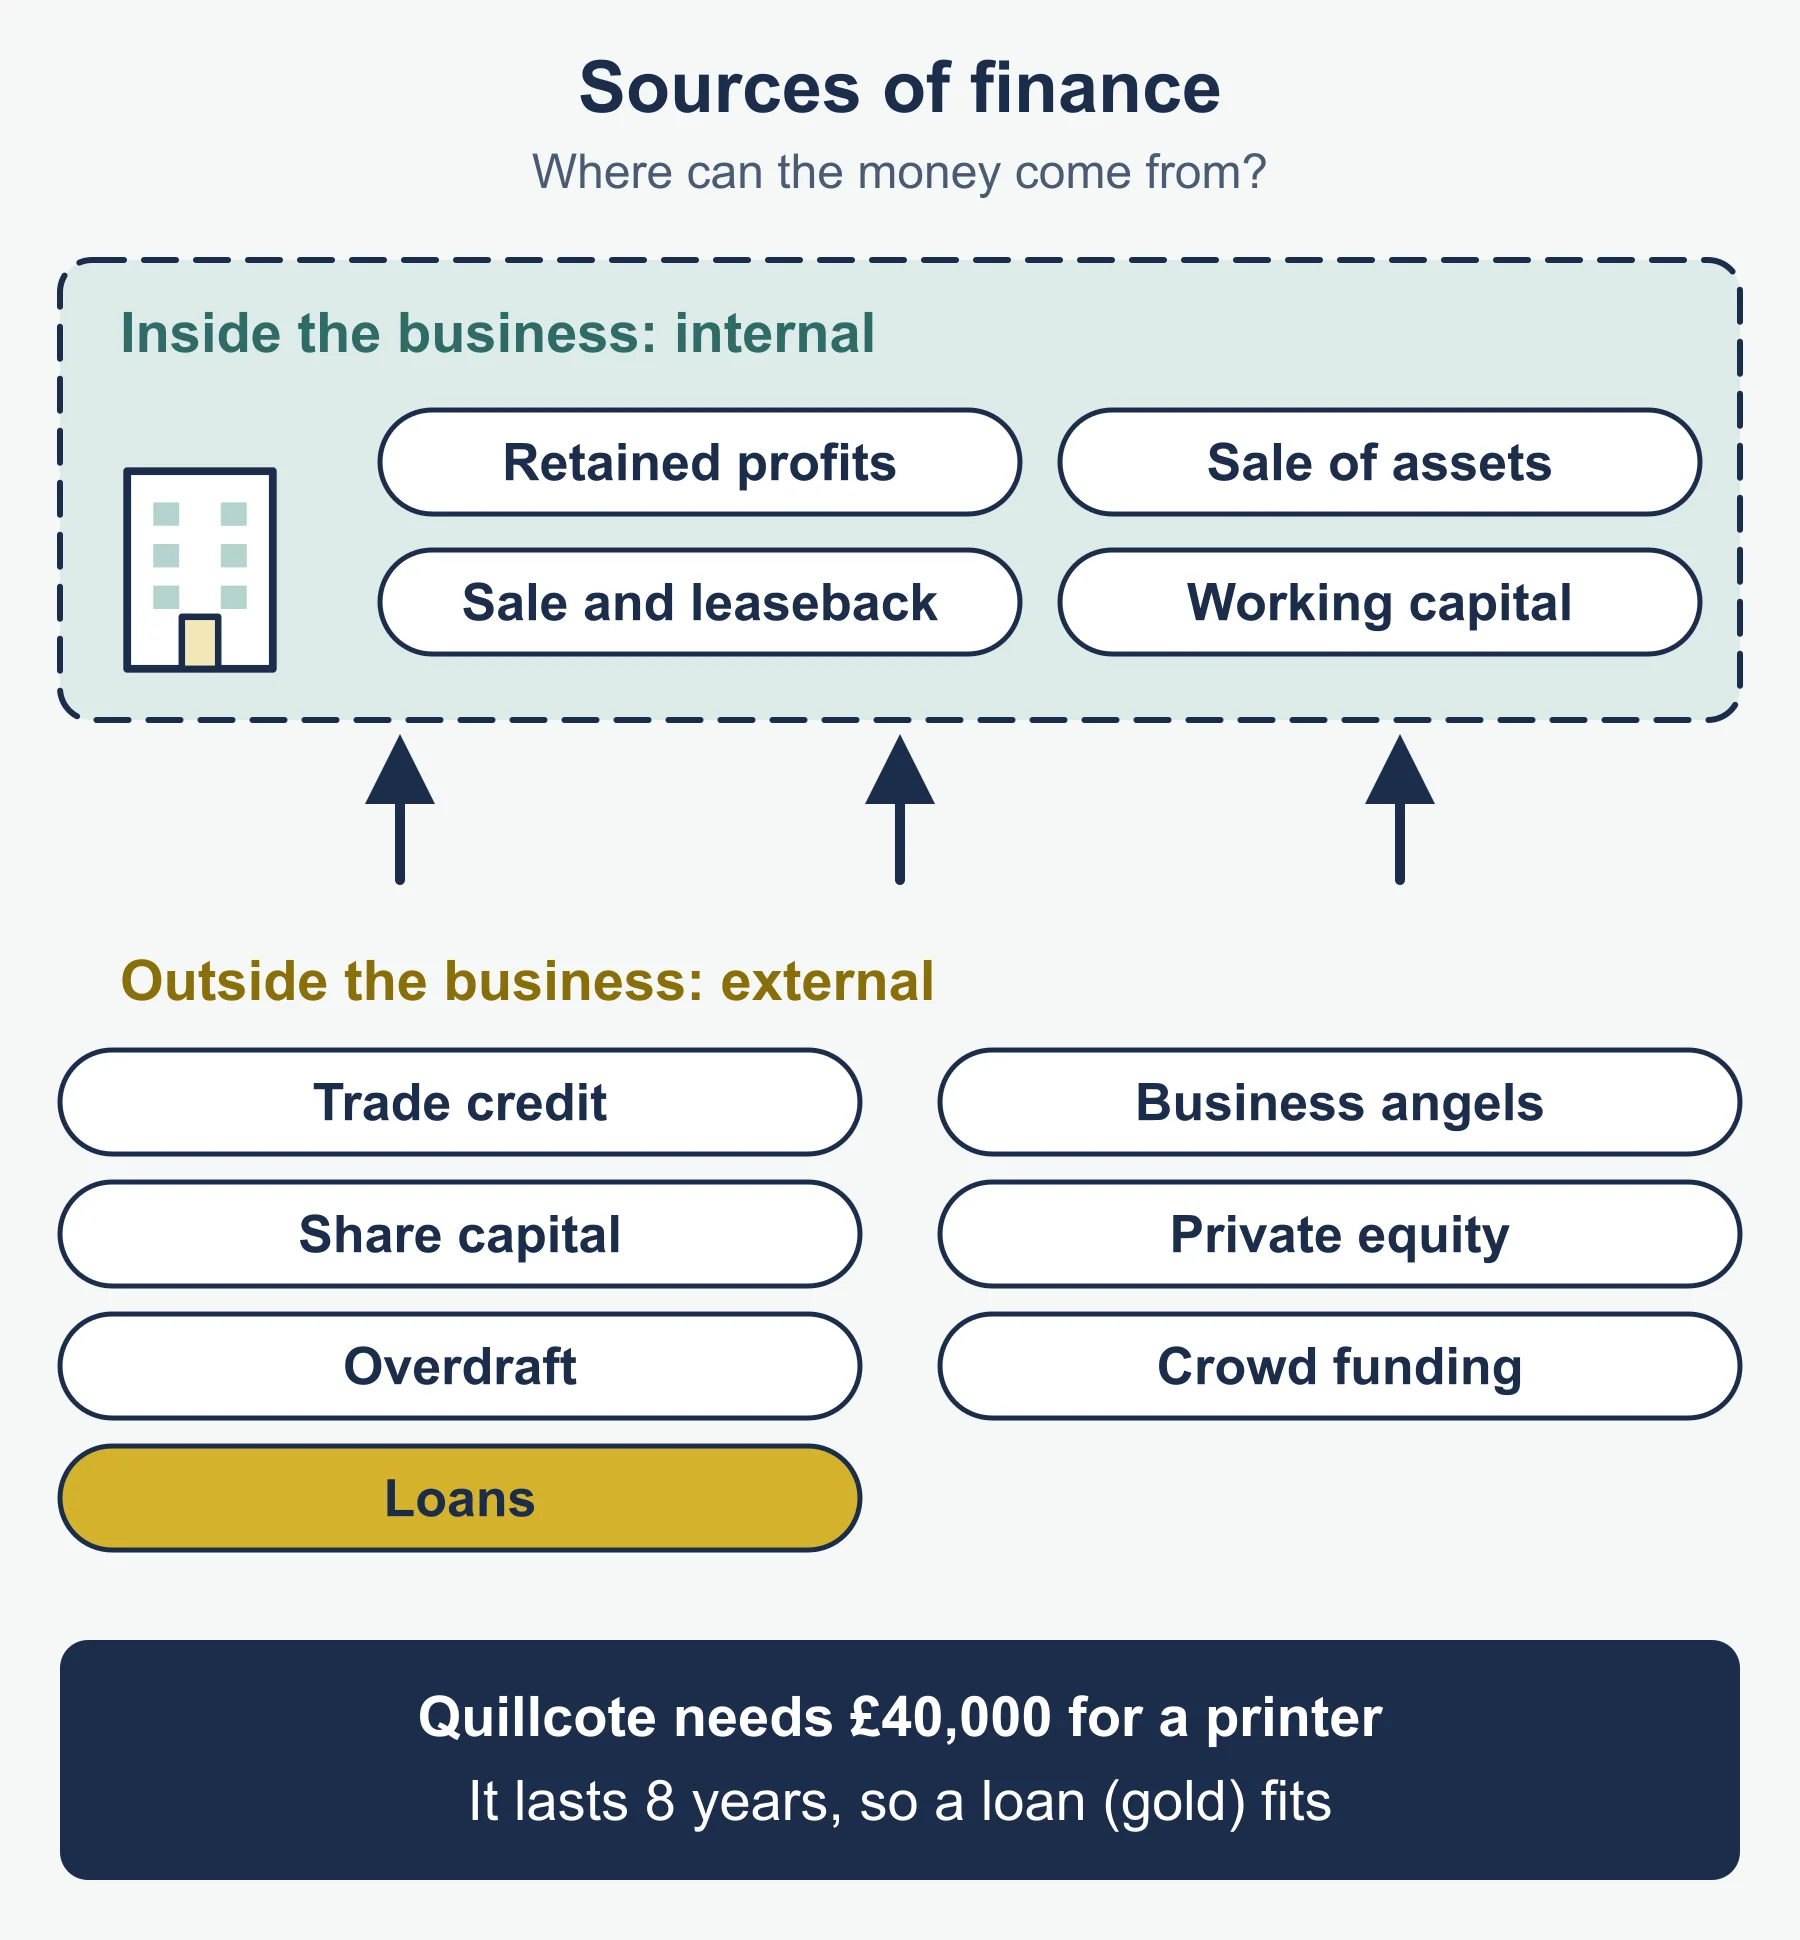
Internal sources come from within the business. External sources come from outside it. These are the sources the specification lists.
| Source | Type | Points to weigh |
|---|---|---|
| Owners’ investment | Internal | No interest or repayment; limited by the owners’ own wealth |
| Retained profits | Internal | No interest and no outsiders; limited by past profits and reduces what owners take out |
| Sale of assets | Internal | Turns unused assets into cash; the asset is gone and a quick sale may fetch a low price |
| Sale and leaseback | Internal | Releases cash from an asset the business still uses; lease payments continue and the asset no longer belongs to it |
| Working capital | Internal | Running down inventory or collecting receivables faster frees cash; too little can leave the business unable to meet orders or bills |
| Trade credit | External | Buy now and pay suppliers later at no direct cost; late payment harms supplier relations |
| Share capital | External | No repayment and no interest; dilutes ownership and dividends may be expected |
| Overdraft | External | Flexible and quick for short gaps; interest on the amount used; can be withdrawn and is dear if left long |
| Loans | External | Predictable repayments for long-term assets; interest is a fixed commitment and security may be required |
| Business angels | External | Wealthy individuals who invest in small firms and offer advice; they take a share of ownership |
| Private equity | External | Large sums from investment firms for growth or buy-outs; investors expect a high return and a say in running the business |
| Crowd funding | External | Many small sums raised online, often with publicity value; it takes effort, platforms charge fees and a target may be missed |
Match source to need and context: a short-term gap suits an overdraft or trade credit; a long-term asset suits a loan or share capital; a risky start-up may only attract owners’ investment, business angels or crowd funding.
7. Improving cash flow and profit
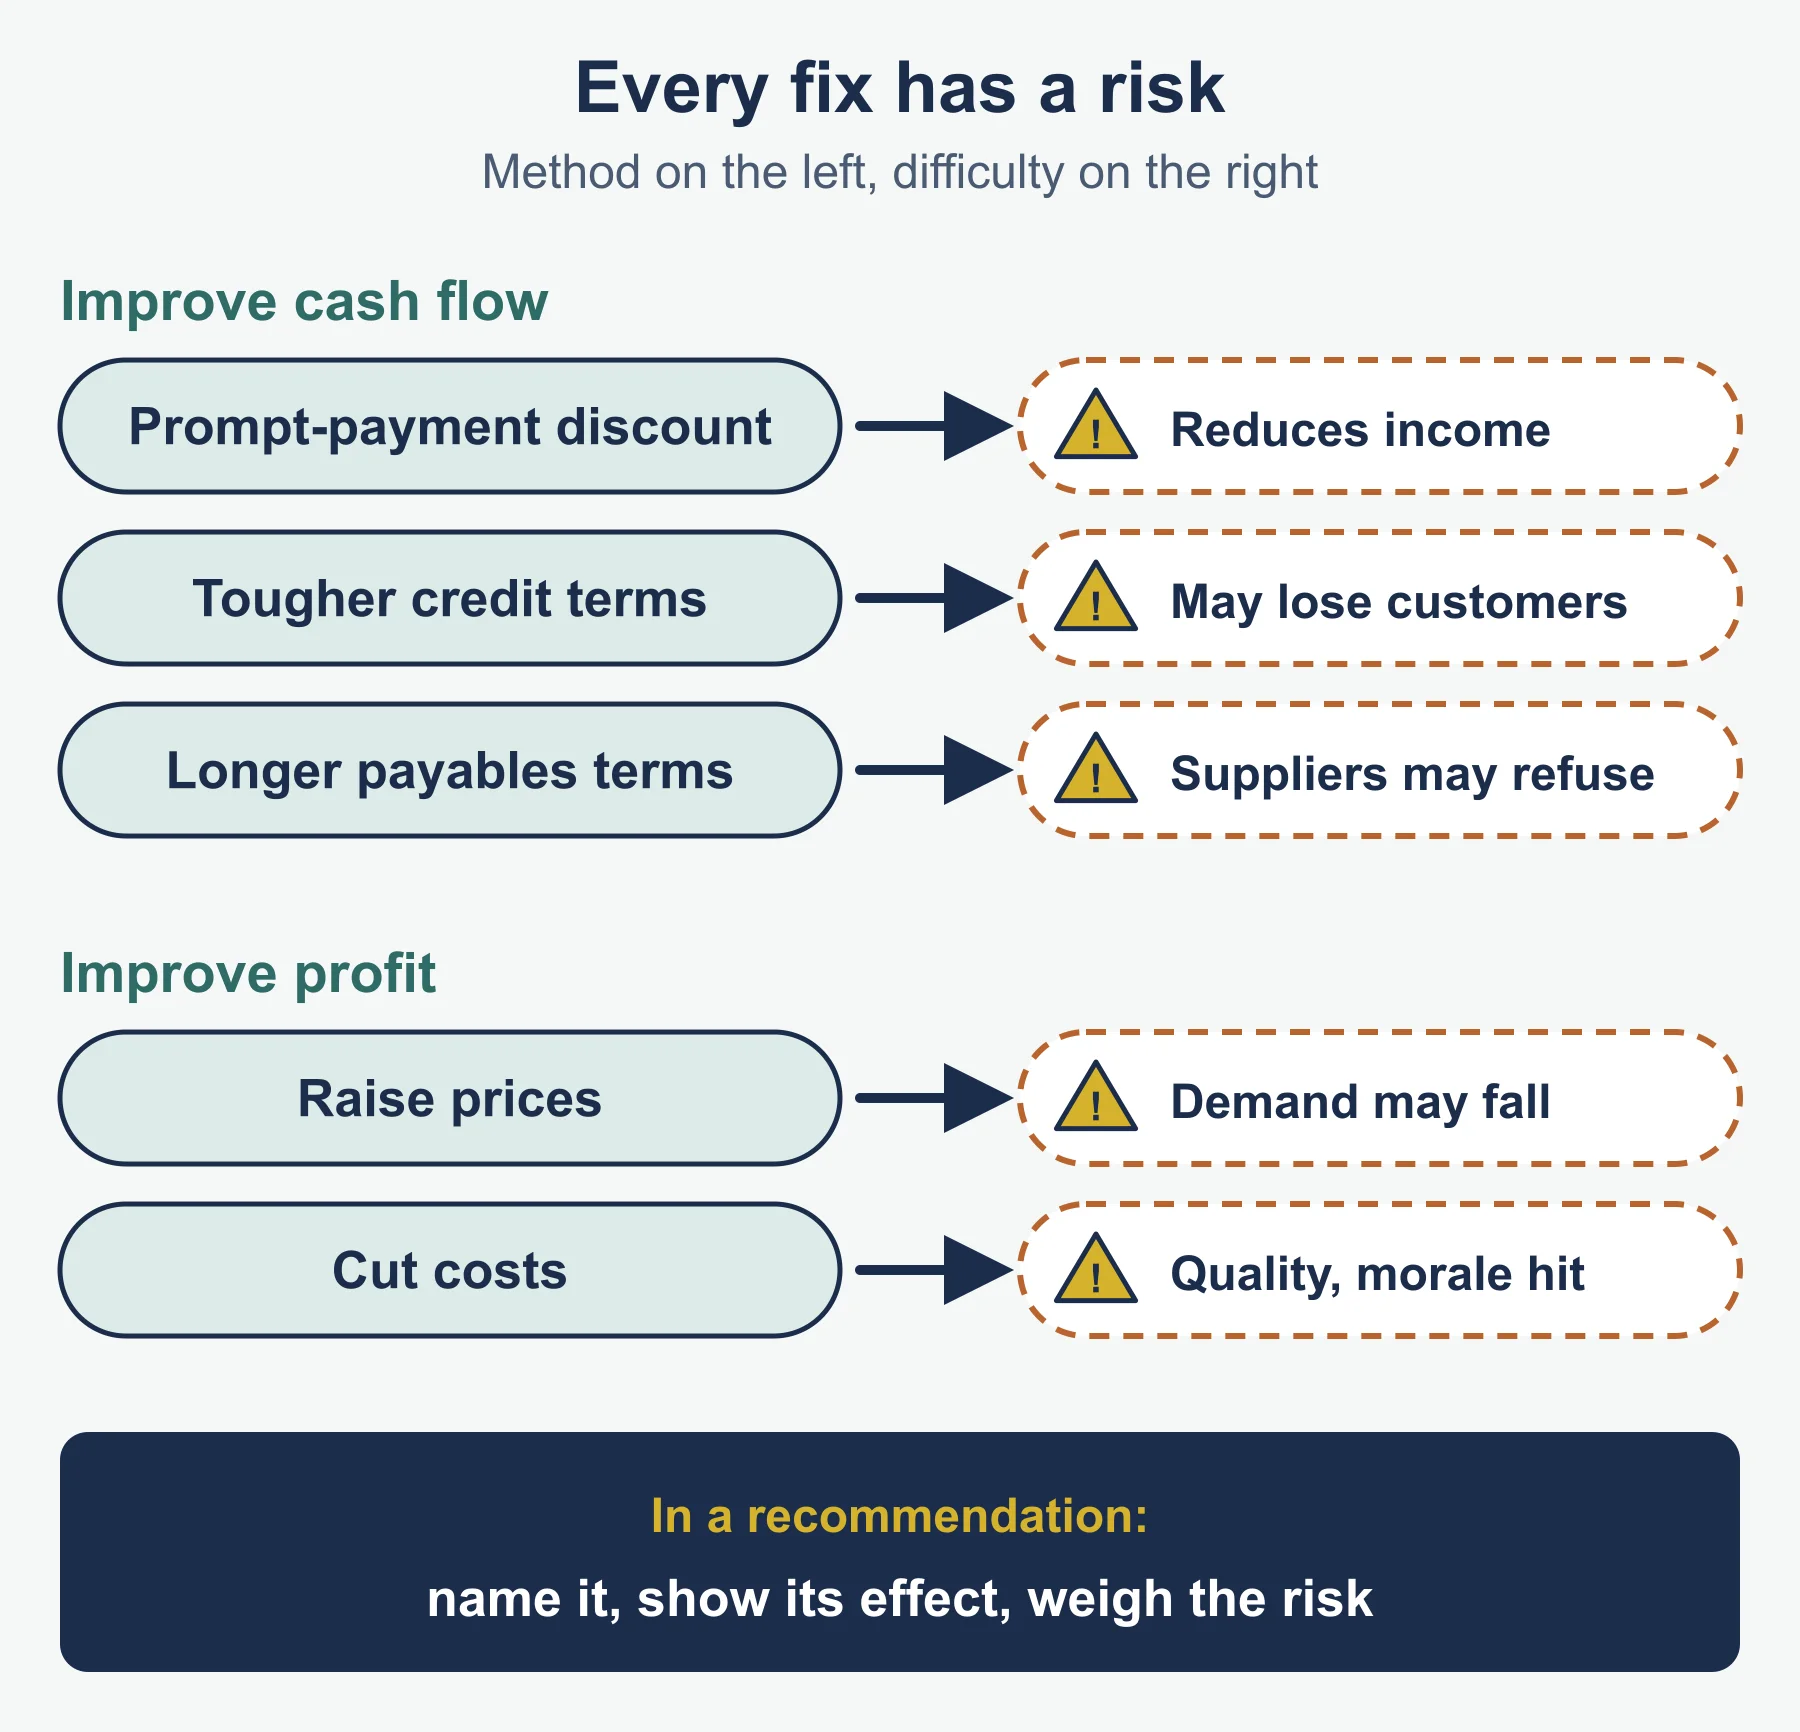
Ways of improving cash flow named in the specification:
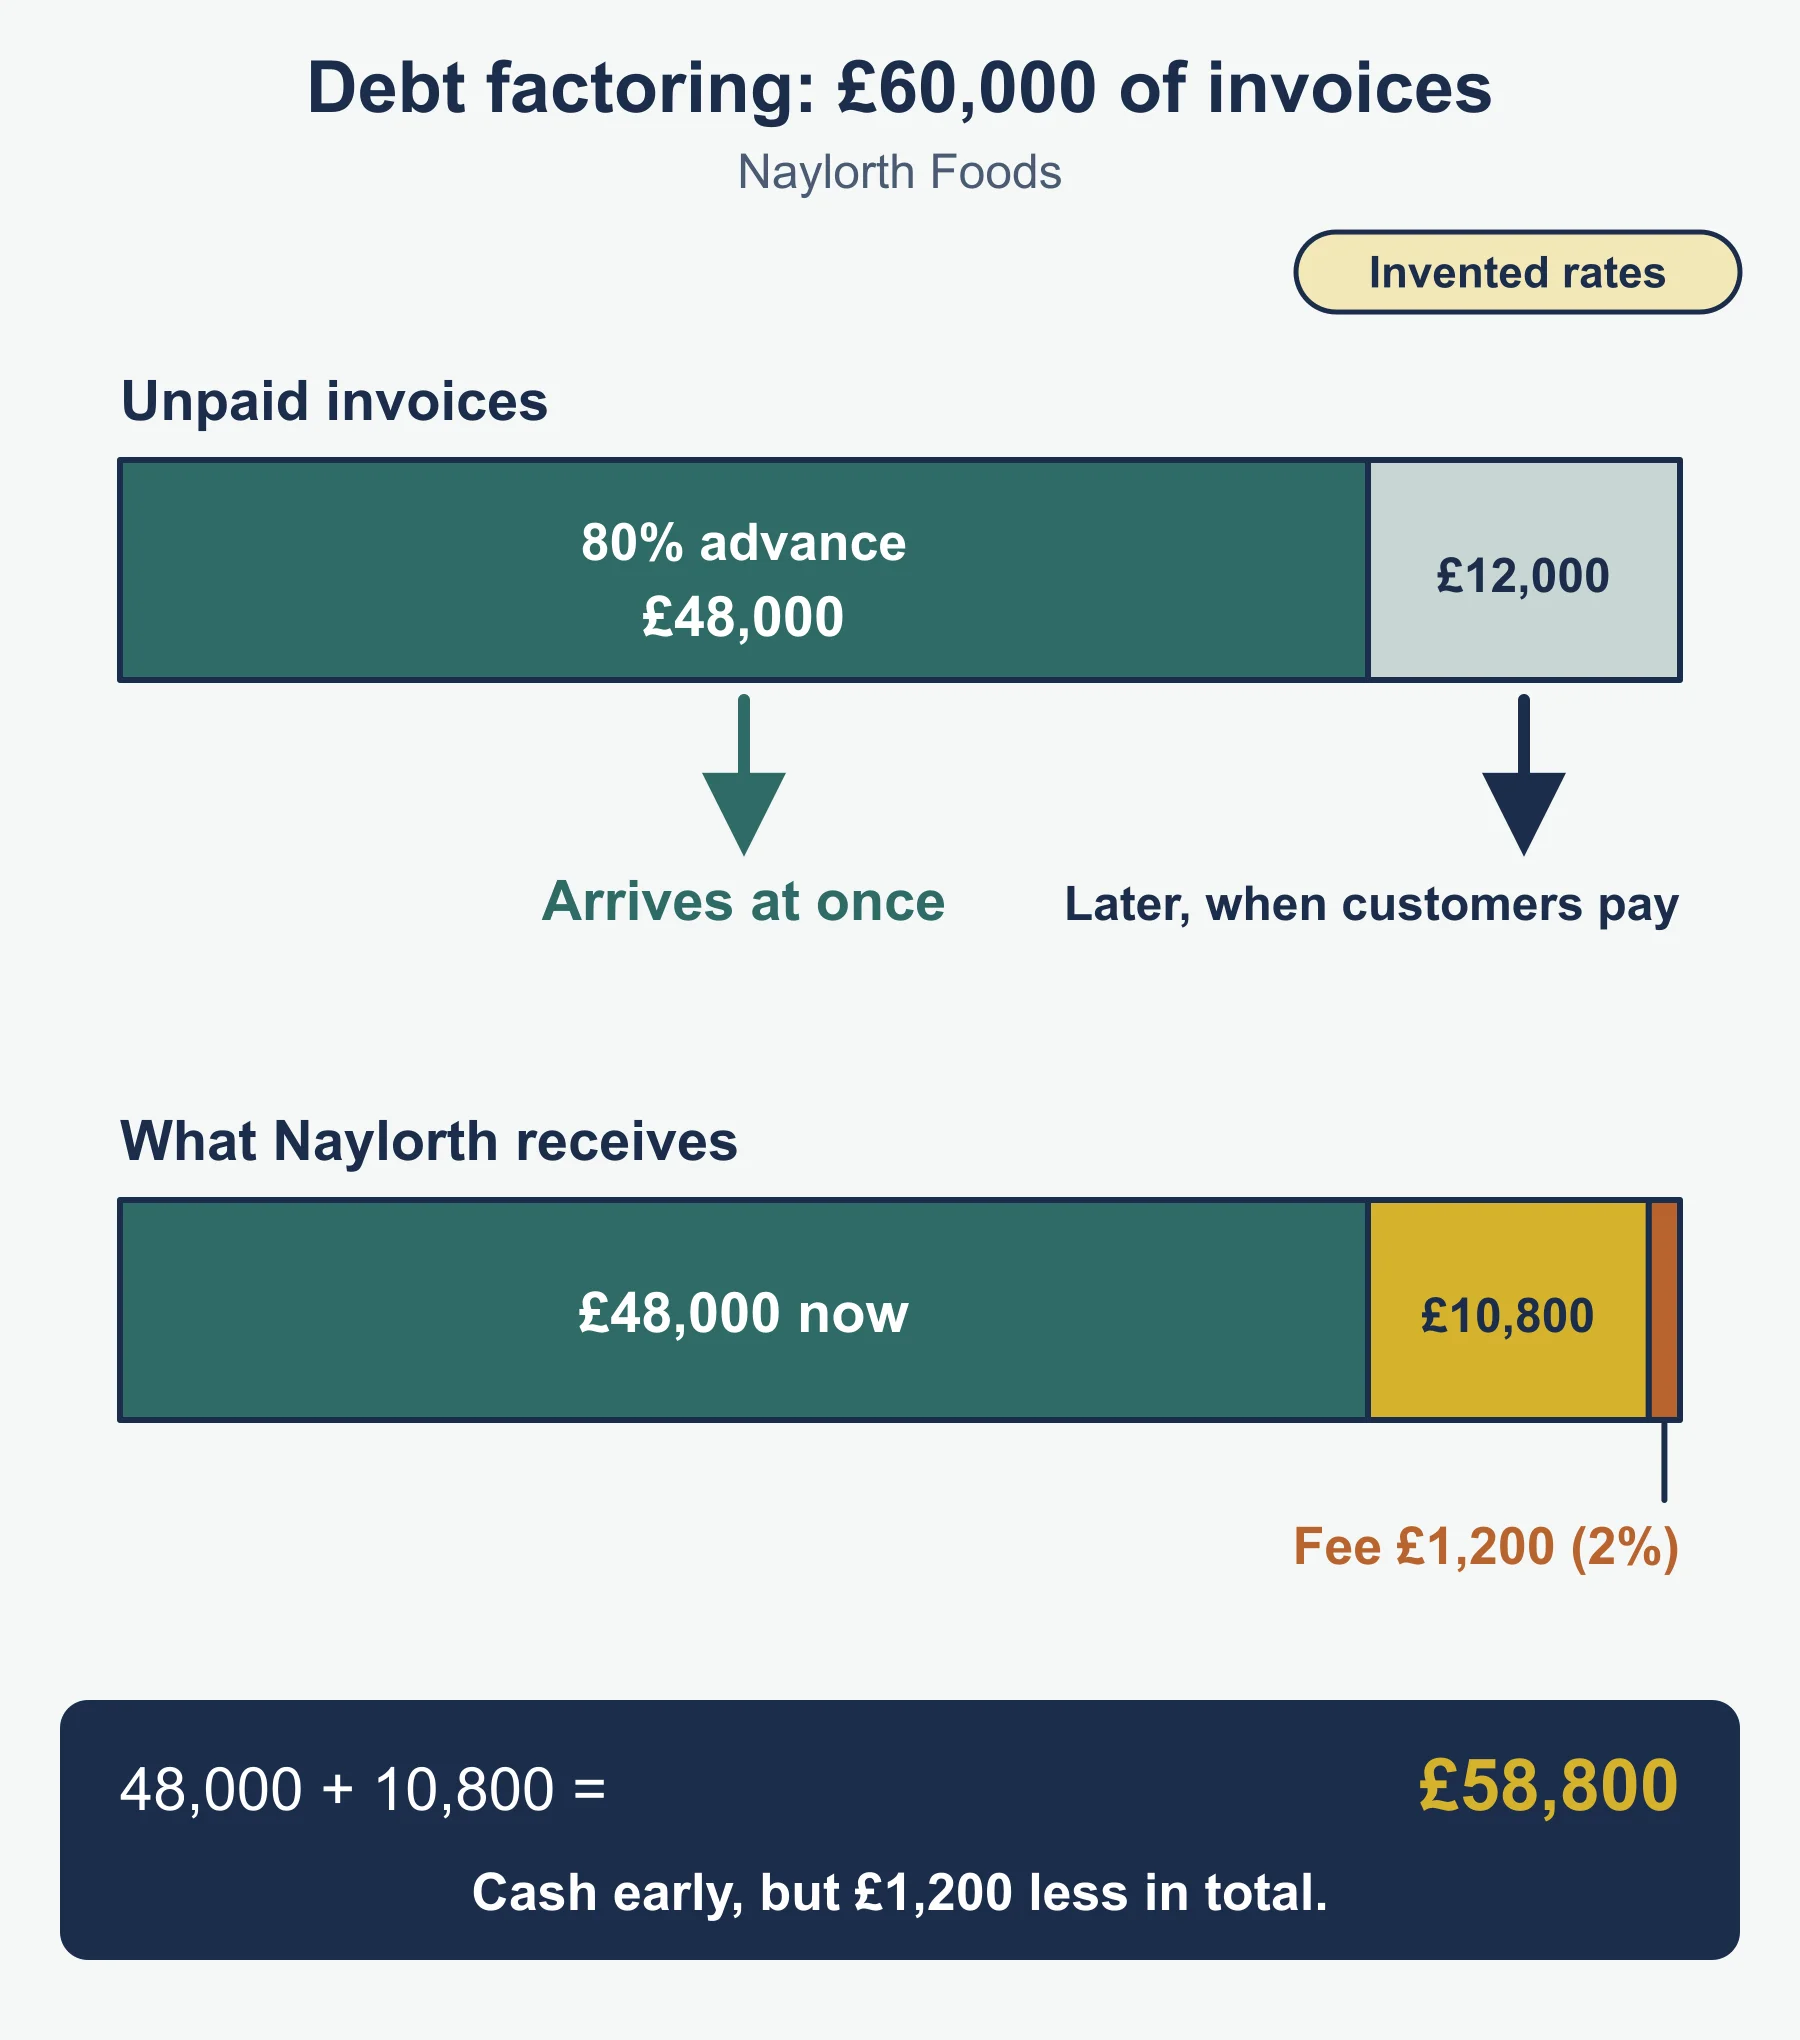
- Debt factoring: selling unpaid invoices to a factor for most of their value at once; a fee is charged and the factor deals with customers.
- Shortening payment time from customers: cash arrives sooner, but customers may go to rivals offering longer credit.
- Early payment incentives: a discount for prompt payment speeds up cash but reduces income.
- Credit checks: checking a customer before giving credit cuts bad debts and late payers, but takes time and may turn some customers away.
- Increasing payment time to suppliers: cash stays in the business longer, but suppliers may refuse or offer worse terms.
- Reducing outgoings: cutting or delaying spending saves cash, but may harm quality, staff or growth.
- Better invoice management: sending accurate invoices promptly and chasing overdue ones costs little, but needs staff time or software.
Worked example 8. Naylorth Foods factors £60,000 of invoices (the 80% advance and 2% fee are invented for this example, not typical rates). The factor advances 80% (£48,000) at once and charges 2% of the invoice value (£1,200). When customers pay, the factor passes on the remaining £12,000 less the fee: £10,800. Naylorth receives £58,800 in total, but £48,000 of it arrives immediately.
Increasing gross and operating profit means increasing revenue (higher prices or more sales) and/or decreasing costs (cheaper supplies, less waste, higher productivity, lower overheads). Challenges: price rises may cut demand; cost cuts may harm quality, staff morale or supplier relations. For a recommendation, name the method, show its effect with a figure, then weigh the risk.
8. Assessing financial position and performance
The specification asks you to assess a business’s financial position and performance using profits and profit margins, ROCE, return on investment, cash flow and liquidity, gearing, break-even output, margin of safety and budget variances, and shareholder rewards:
- Dividend per share = total dividend paid ÷ number of ordinary shares in issue.
- Dividend yield (%) = dividend per share (pence) ÷ share price (pence) × 100.
Worked example 9. A plc pays total dividends of £24,000 on 400,000 ordinary shares, so dividend per share = 24,000 ÷ 400,000 = £0.06 = 6p. With a share price of 150p, dividend yield = 6 ÷ 150 × 100 = 4%.
Judge each measure relative to the business’s objectives, its competitors, its business plan and its context. Say how reliable the data is: forecasts and one year’s figures can mislead.
Common errors
- Treating profit and cash as the same thing.
- Not rounding break-even output up to whole units.
- Using total, not per-unit, variable cost in the contribution formula.
- Answering “evaluate” with a list and no judgement.
Frequently asked questions
What is zero-based budgeting? Zero-based budgeting starts every budget from zero, so each item of spending must be justified afresh rather than rolled forward from the previous budget.
How do you calculate profit for the year in AQA AS Business? Profit for the year = operating profit + profit from other activities − net finance costs (such as loan interest) − tax, where operating profit = gross profit − operating expenses.
How do you calculate dividend yield? Dividend yield (%) = dividend per share ÷ share price × 100, with both in the same units, and dividend per share = total dividend paid ÷ number of ordinary shares in issue.
What ways of improving cash flow does the AQA AS specification name? Debt factoring, shortening payment time from customers, early payment incentives, credit checks, increasing payment time to suppliers, reducing outgoings and better invoice management.
Is ethics in finance part of AQA AS Business? No. Ethics in finance, such as tax avoidance and payment terms, is A-level only (7138), so it is not part of the AS course.
Official syllabus
AQA AS and A-level Business (7137, 7138) specification, Version 1.1 (November 2025), for first teaching from September 2026: section 3.1.4 Financial management and Annex 7, Formulae and key data. Checked against this page on 5 November 2026.
Get free revision emails (optional)
Occasional emails with practice questions, worked explanations and links to free resources for the qualification and subjects you choose. No spam, and you can unsubscribe from any email. The free tools on this site never need an email.
Related resources
-
Practice questions
AQA AS-Level Business: Financial management (7137) – Practice Questions
Thirteen original practice questions with worked answers on financial management for AQA AS Business (7137) 3.1.4: calculations, short answers and cases.
Business · AQA · AS Level
Try questions -
Revision notes
AQA AS-Level Business: Financial management (7137) – Revision Notes
Condensed revision notes for AQA AS Business (7137) 3.1.4 financial management: formulas, methods, key distinctions and a self-test with answers.
Business · AQA · AS Level
Revise topic -
Study guides
AQA AS-Level Business: Marketing management (7137)
Study guide to marketing management in AQA AS-Level Business (7137), section 3.1.3: market research, data calculations, demand, segmentation and the mix.
Business · AQA · AS Level
Read guide
Related articles
-
teaching
A Level tuition in Dubai: Cambridge or Pearson Edexcel International A Level?
Schools in Dubai and Abu Dhabi teach either Cambridge International AS & A Level or Pearson Edexcel International A Level. How the two are structured, why it matters for tuition, and how online classes from Lahore work.
9 October 2026
-
curriculum guides
Choosing subjects at IGCSE and A Level
How subject choices at 14 and 16 affect university options later, and how to keep pathways open without overloading a timetable.
28 July 2026
Studying this with a teacher
Working through Business AS LEVEL?
This page is free and stays free. If you would rather be taught it, Marlbridge runs Business classes one-to-one and in small groups of up to 15, online in your own time zone. The first trial class is free. WhatsApp replies within an hour (8am–11pm Pakistan time, every day); email the same day.
AQA Business teachers at Marlbridge
