
Revision Notes
AQA AS-Level Business: Marketing management (7137) – Revision Notes
Revision notes for AQA AS-Level Business (7137) section 3.1.3 Marketing management: research, data formulas, elasticity, segmentation and the mix.
- Subject
- Business
- Level
- AS LEVEL
- Topic
- What is business? Managing marketing and finance
- Author
- Marlbridge Academic Team
- Updated
- Reviewed by
- Salman Ahmad (what this means)
Aligned to AQA AS Level Business (7137), For first teaching from September 2026. Official specification .
Syllabus page (what it covers and how it is assessed): AQA AS Level Business.
Syllabus points this page covers
7137
- 3.1.3 Marketing management
Found an error? Report a correction.
Need help with this topic? Request a free trial class for AS Level Business (7137).
Quick recall for section 3.1.3 Marketing management in the AQA AS and A-level Business specification (7137 and 7138, version 1.1, November 2025). Start with the study guide for reasoning and worked cases, then attempt the practice questions. Also useful: the AQA AS Business hub, the checklist, the What is business? notes and the free diagnostics. International marketing and ethical issues in marketing are marked “(A-level only)” in the specification and are not covered.
Customer needs
| Idea | Recall |
|---|---|
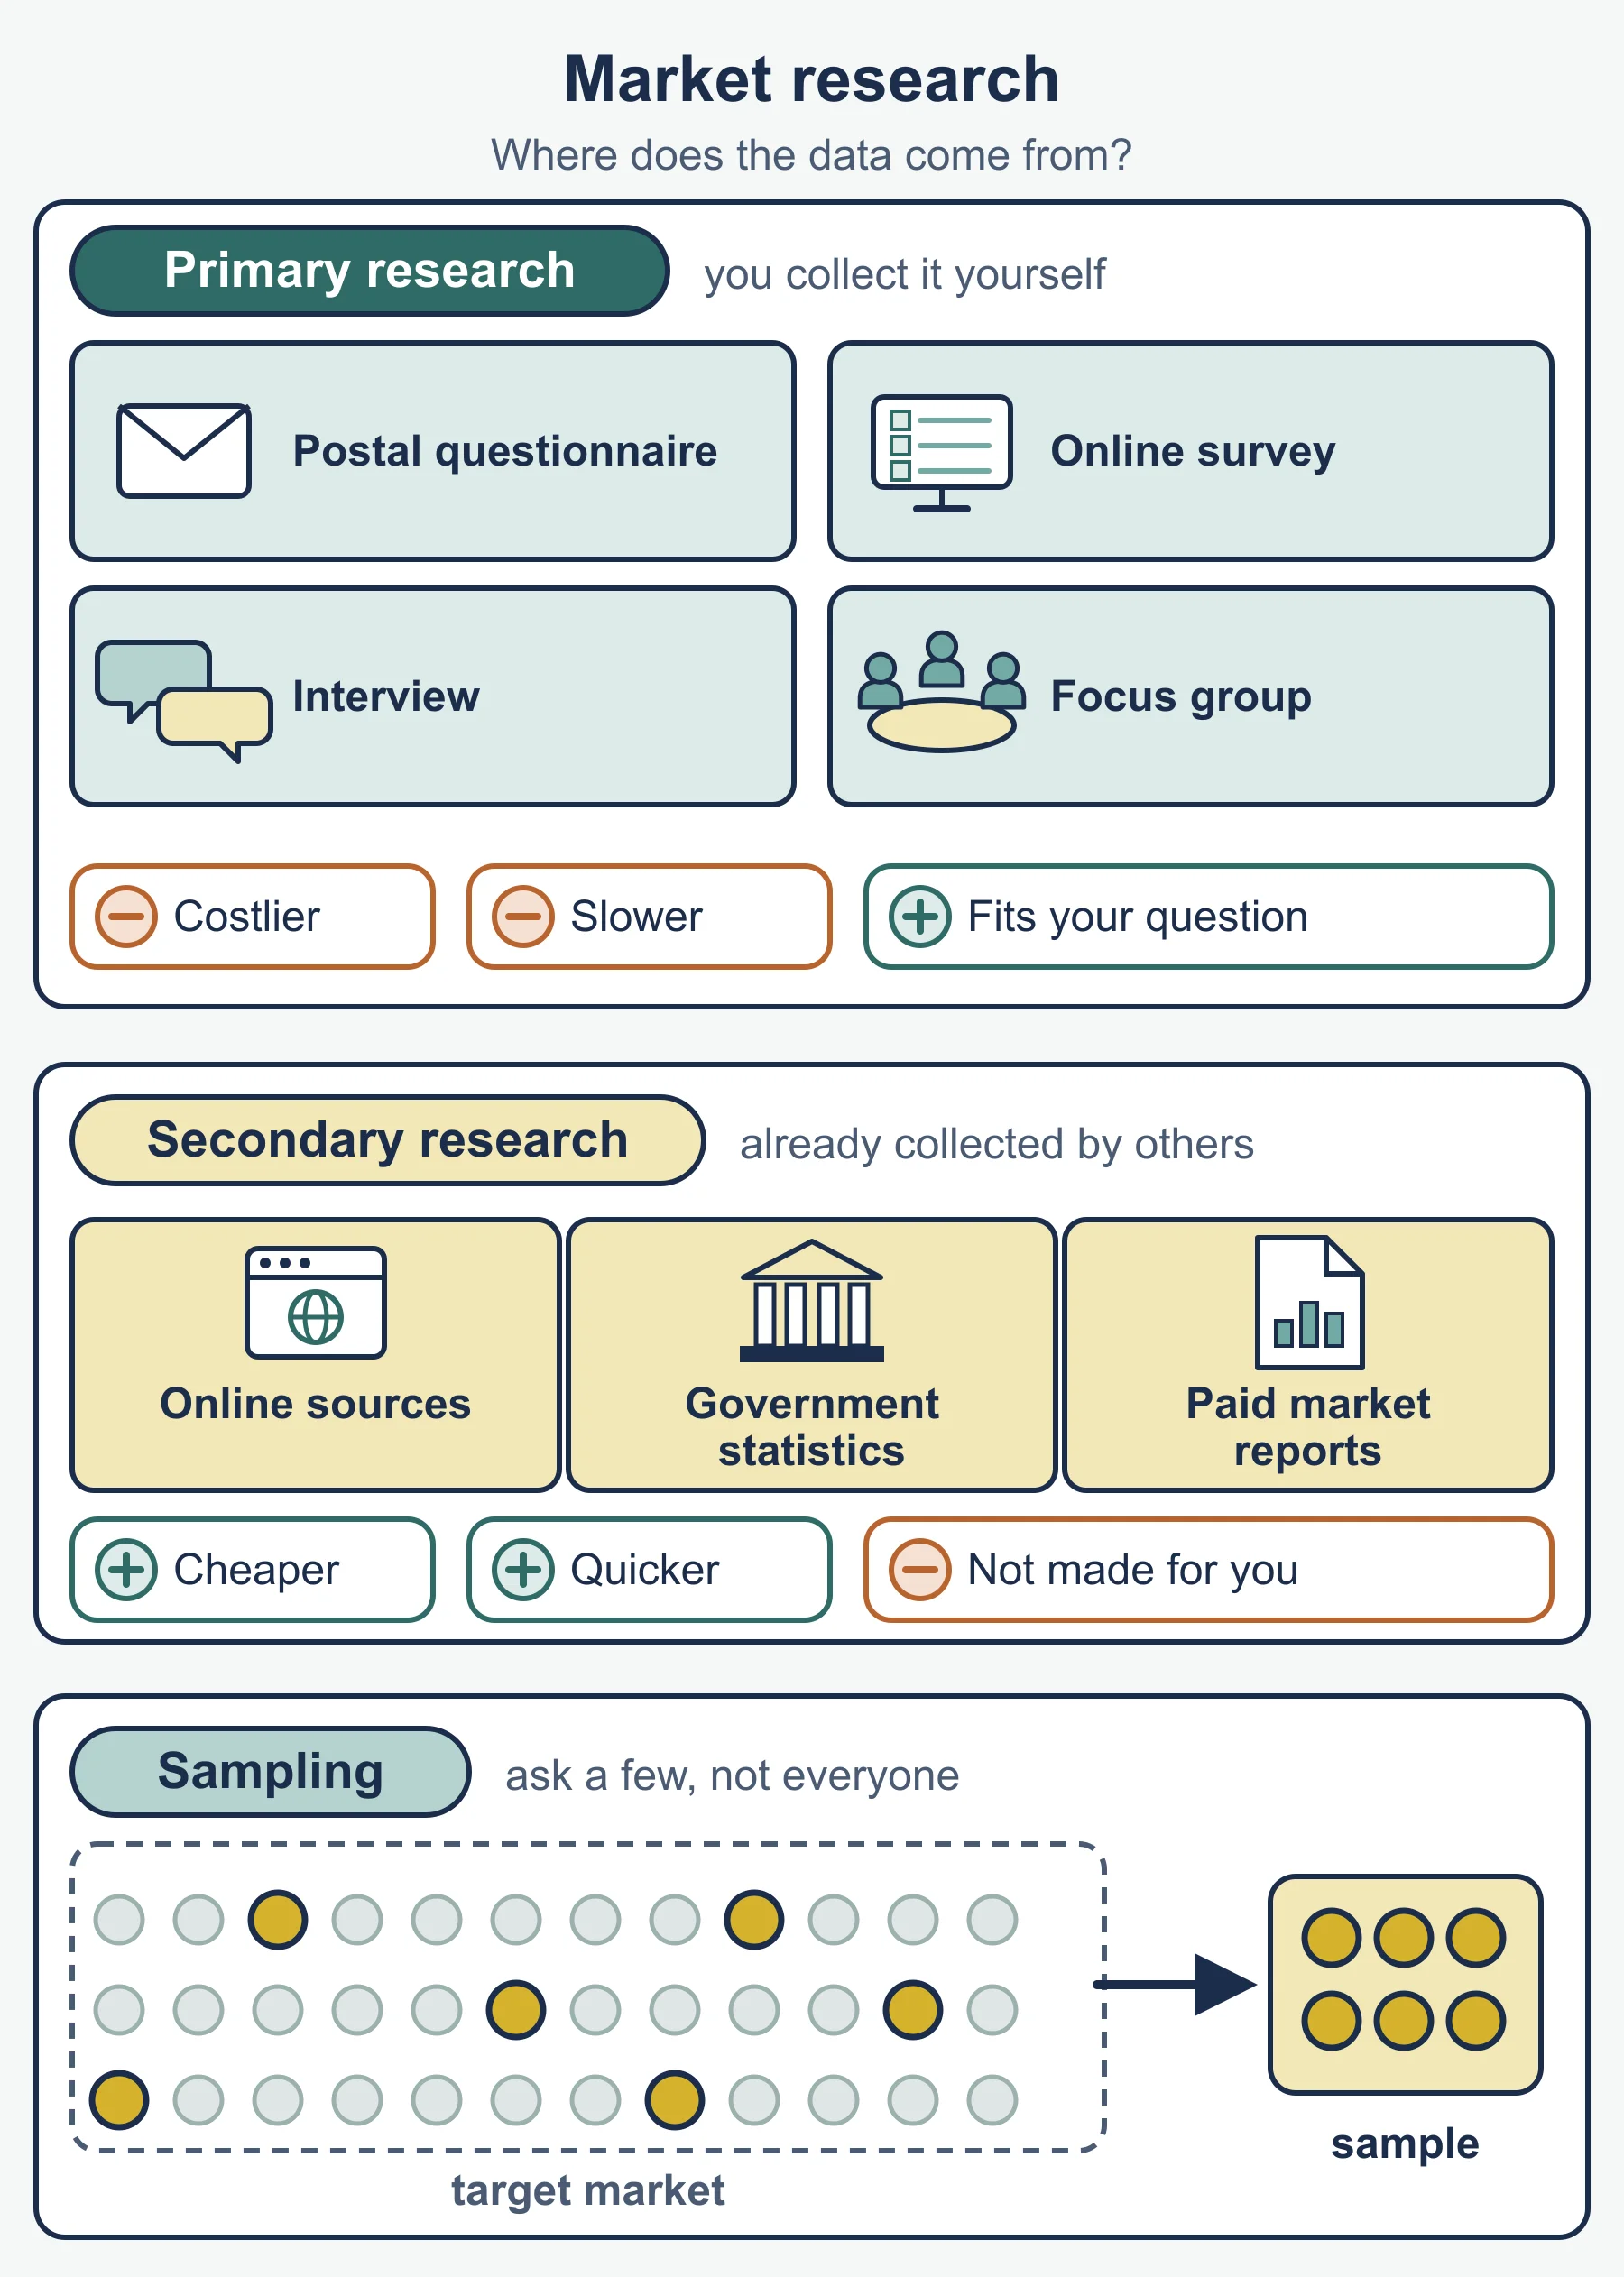
| Purpose of market research | Reduce risk; understand and anticipate customer needs |
| Primary | First-hand, specific; slower and costlier |
| Secondary | Existing data; cheap and quick; may be dated |
| Quantitative | Numbers, easy to compare |
| Qualitative | Opinions and reasons; explains why |
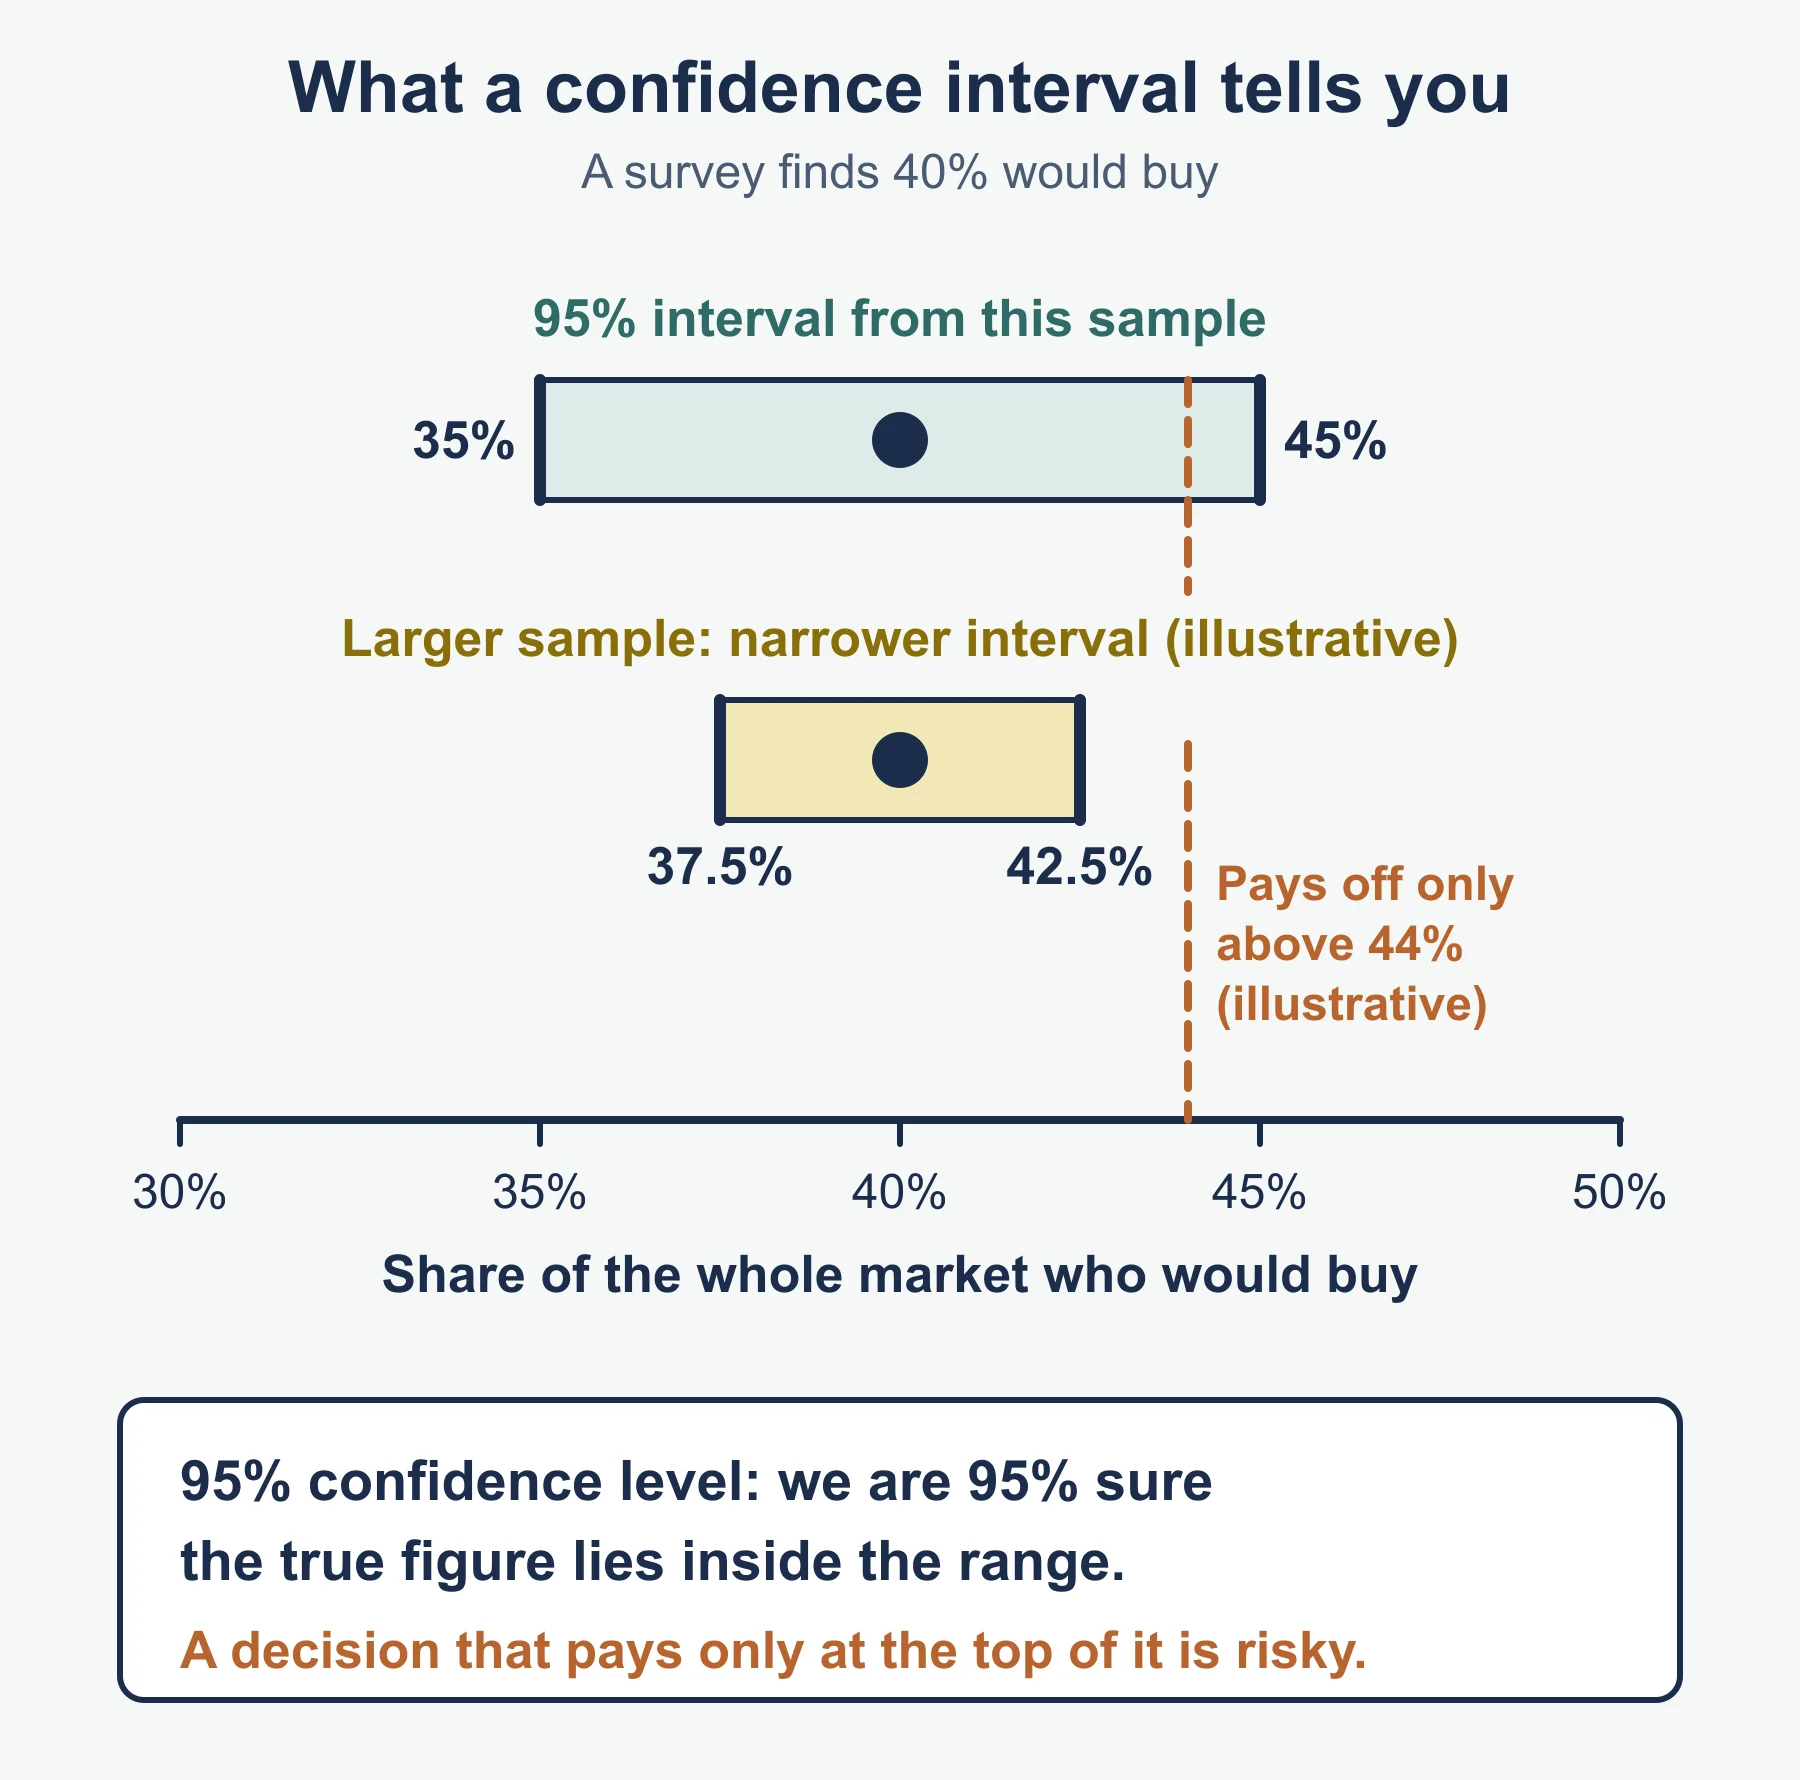
| Confidence interval | Range likely to hold the true figure; narrower means more precise |
| Confidence level | How sure we are the range holds it (for example 95%) |
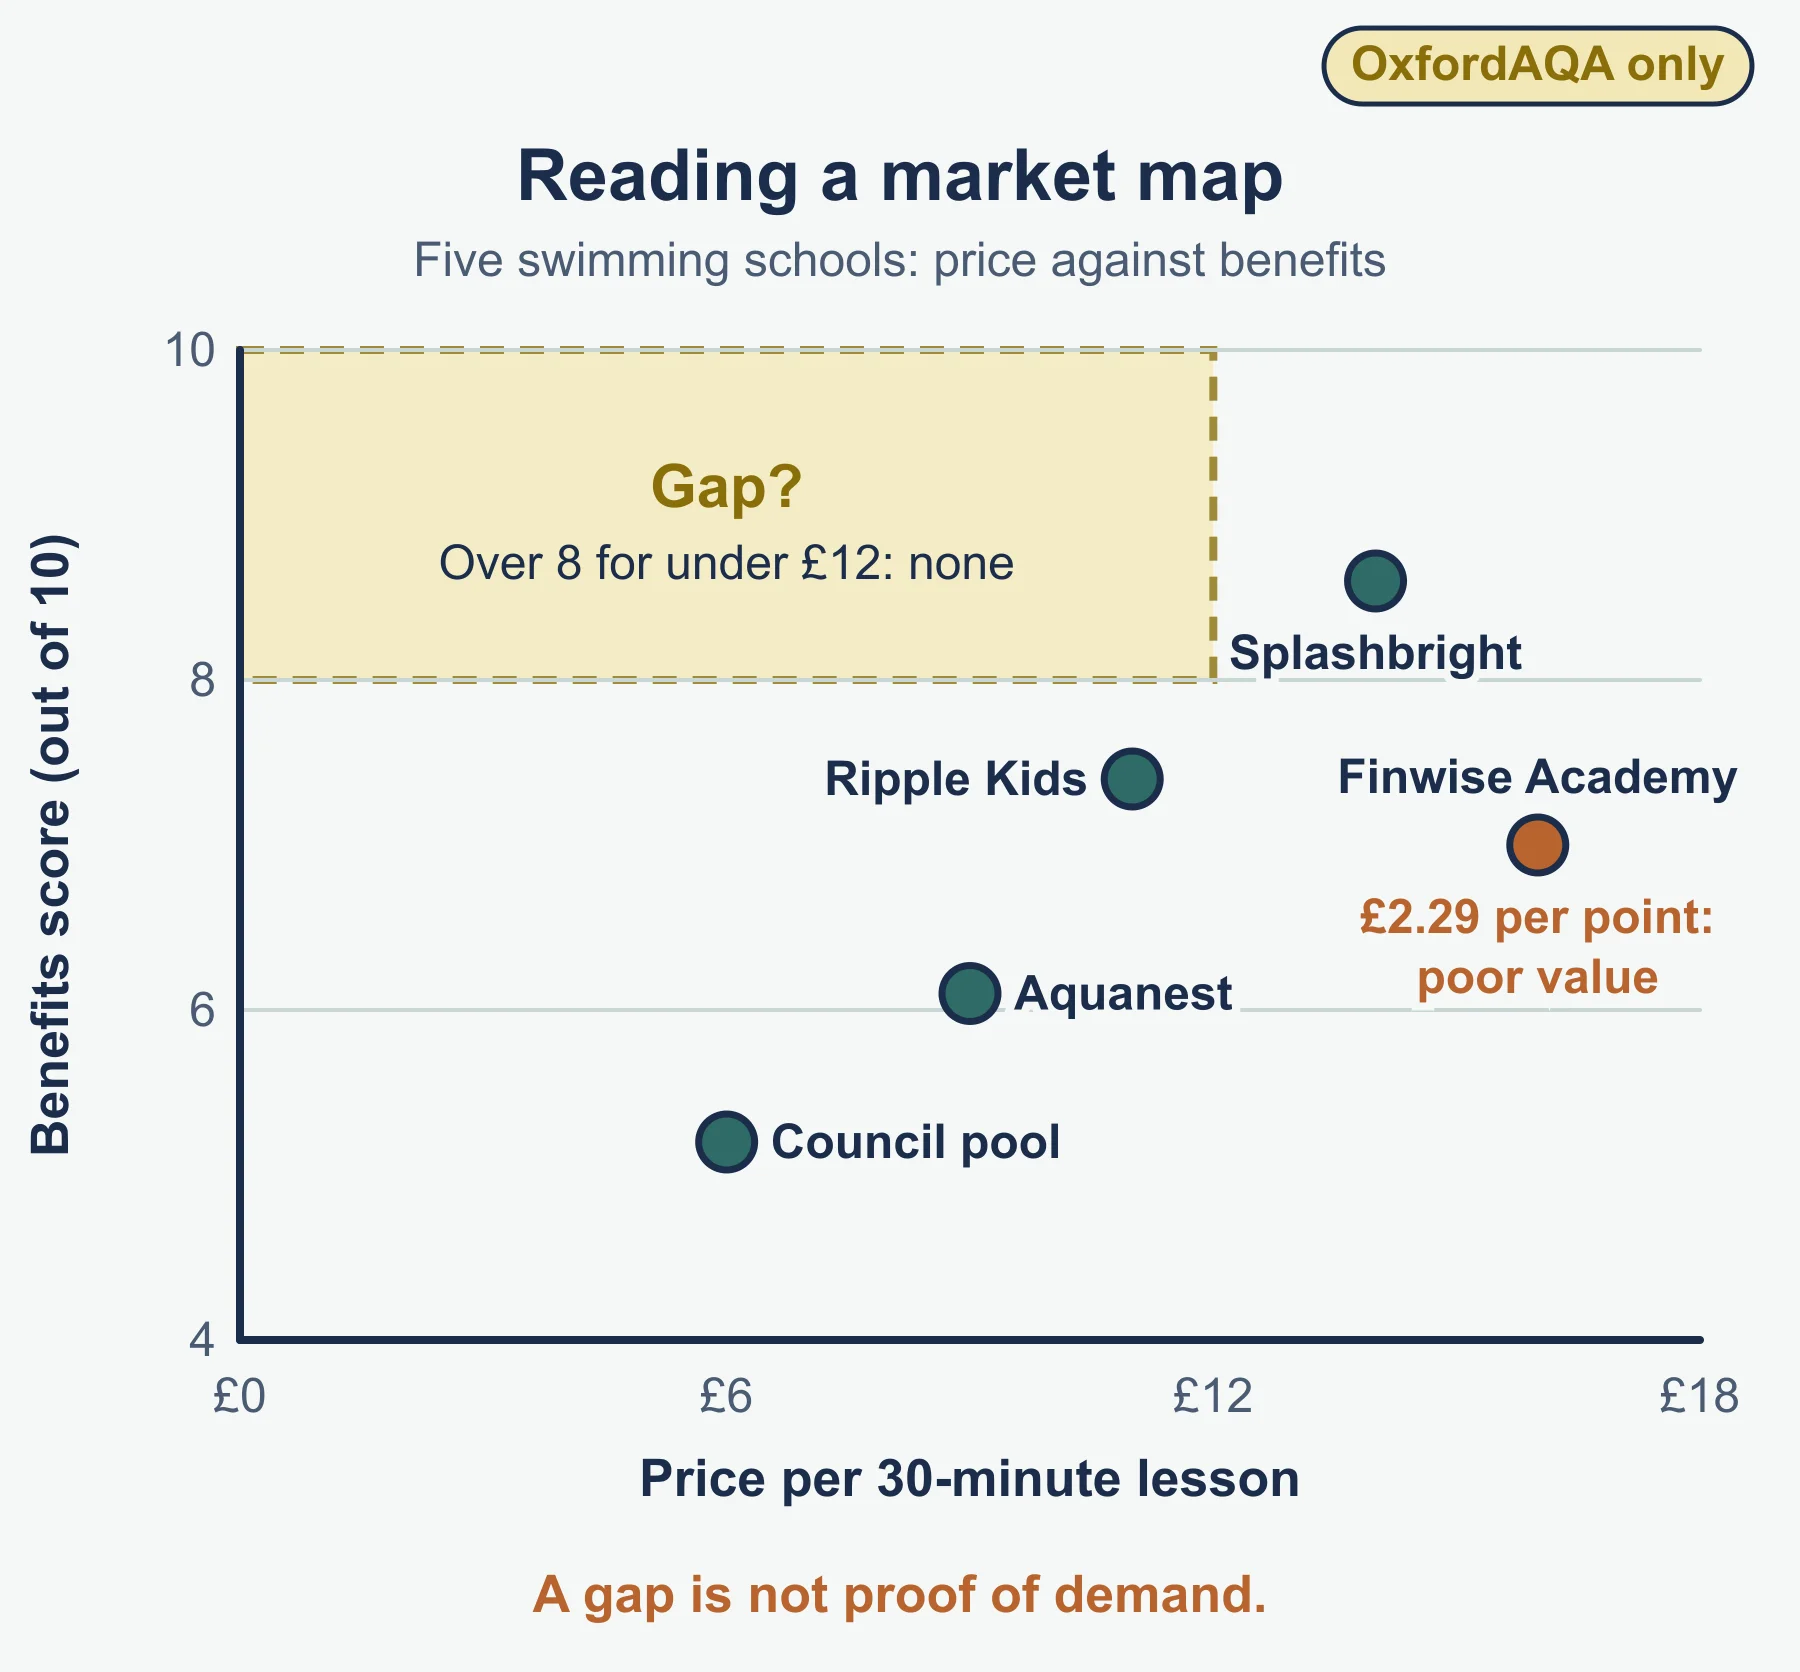
| Market mapping | Brands plotted on two features; shows rivals and gaps |
Influences on how research is done: risk, cost, time, need for reliability. A larger sample usually narrows the interval but costs more.
Markets and data
Types of market: B2B (few, large buyers; account managers), B2C (many buyers; branding), C2C (individuals trading, often online), goods (tangible) against services (intangible; people, process and environment matter more).
Market conditions: degree of competition, competitive behaviour (price cutting, promotion), market growth.
| Measure | Form |
|---|---|
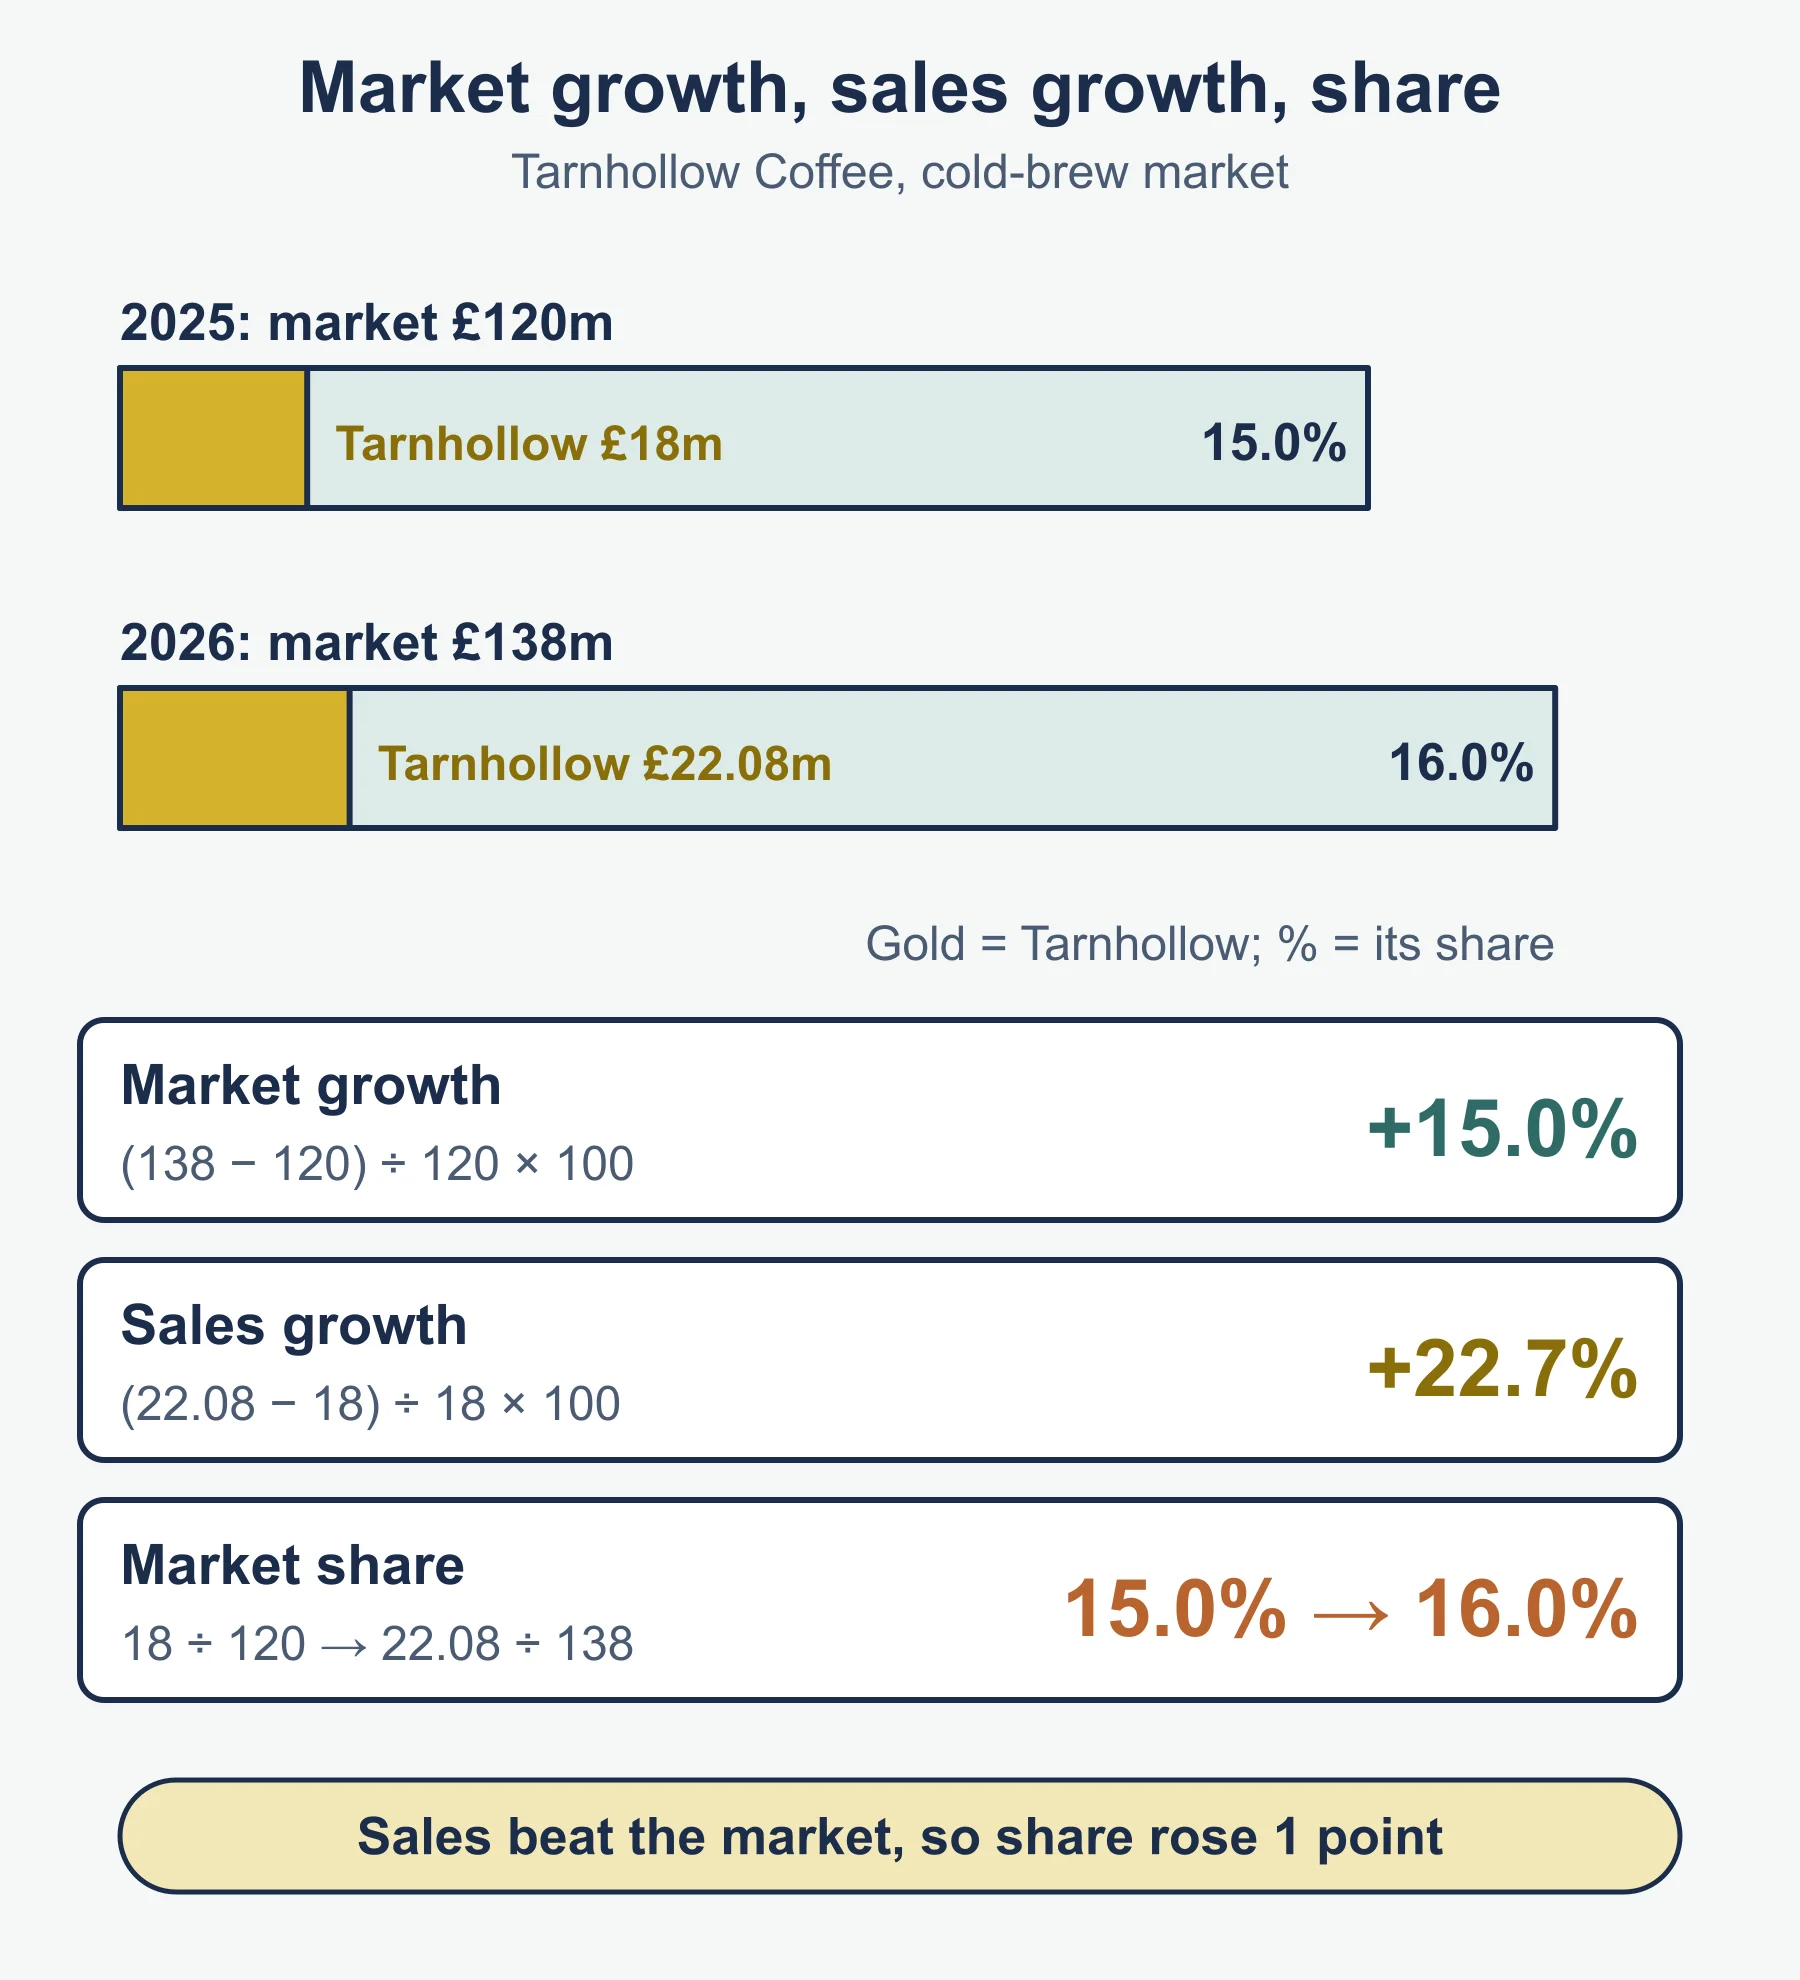
| Market share (%) | one firm’s sales ÷ sales of whole market × 100 |
| Market growth (%) | change in size of market ÷ its original size × 100 |
| Sales growth (%) | change in sales ÷ original sales × 100 (standard form) |
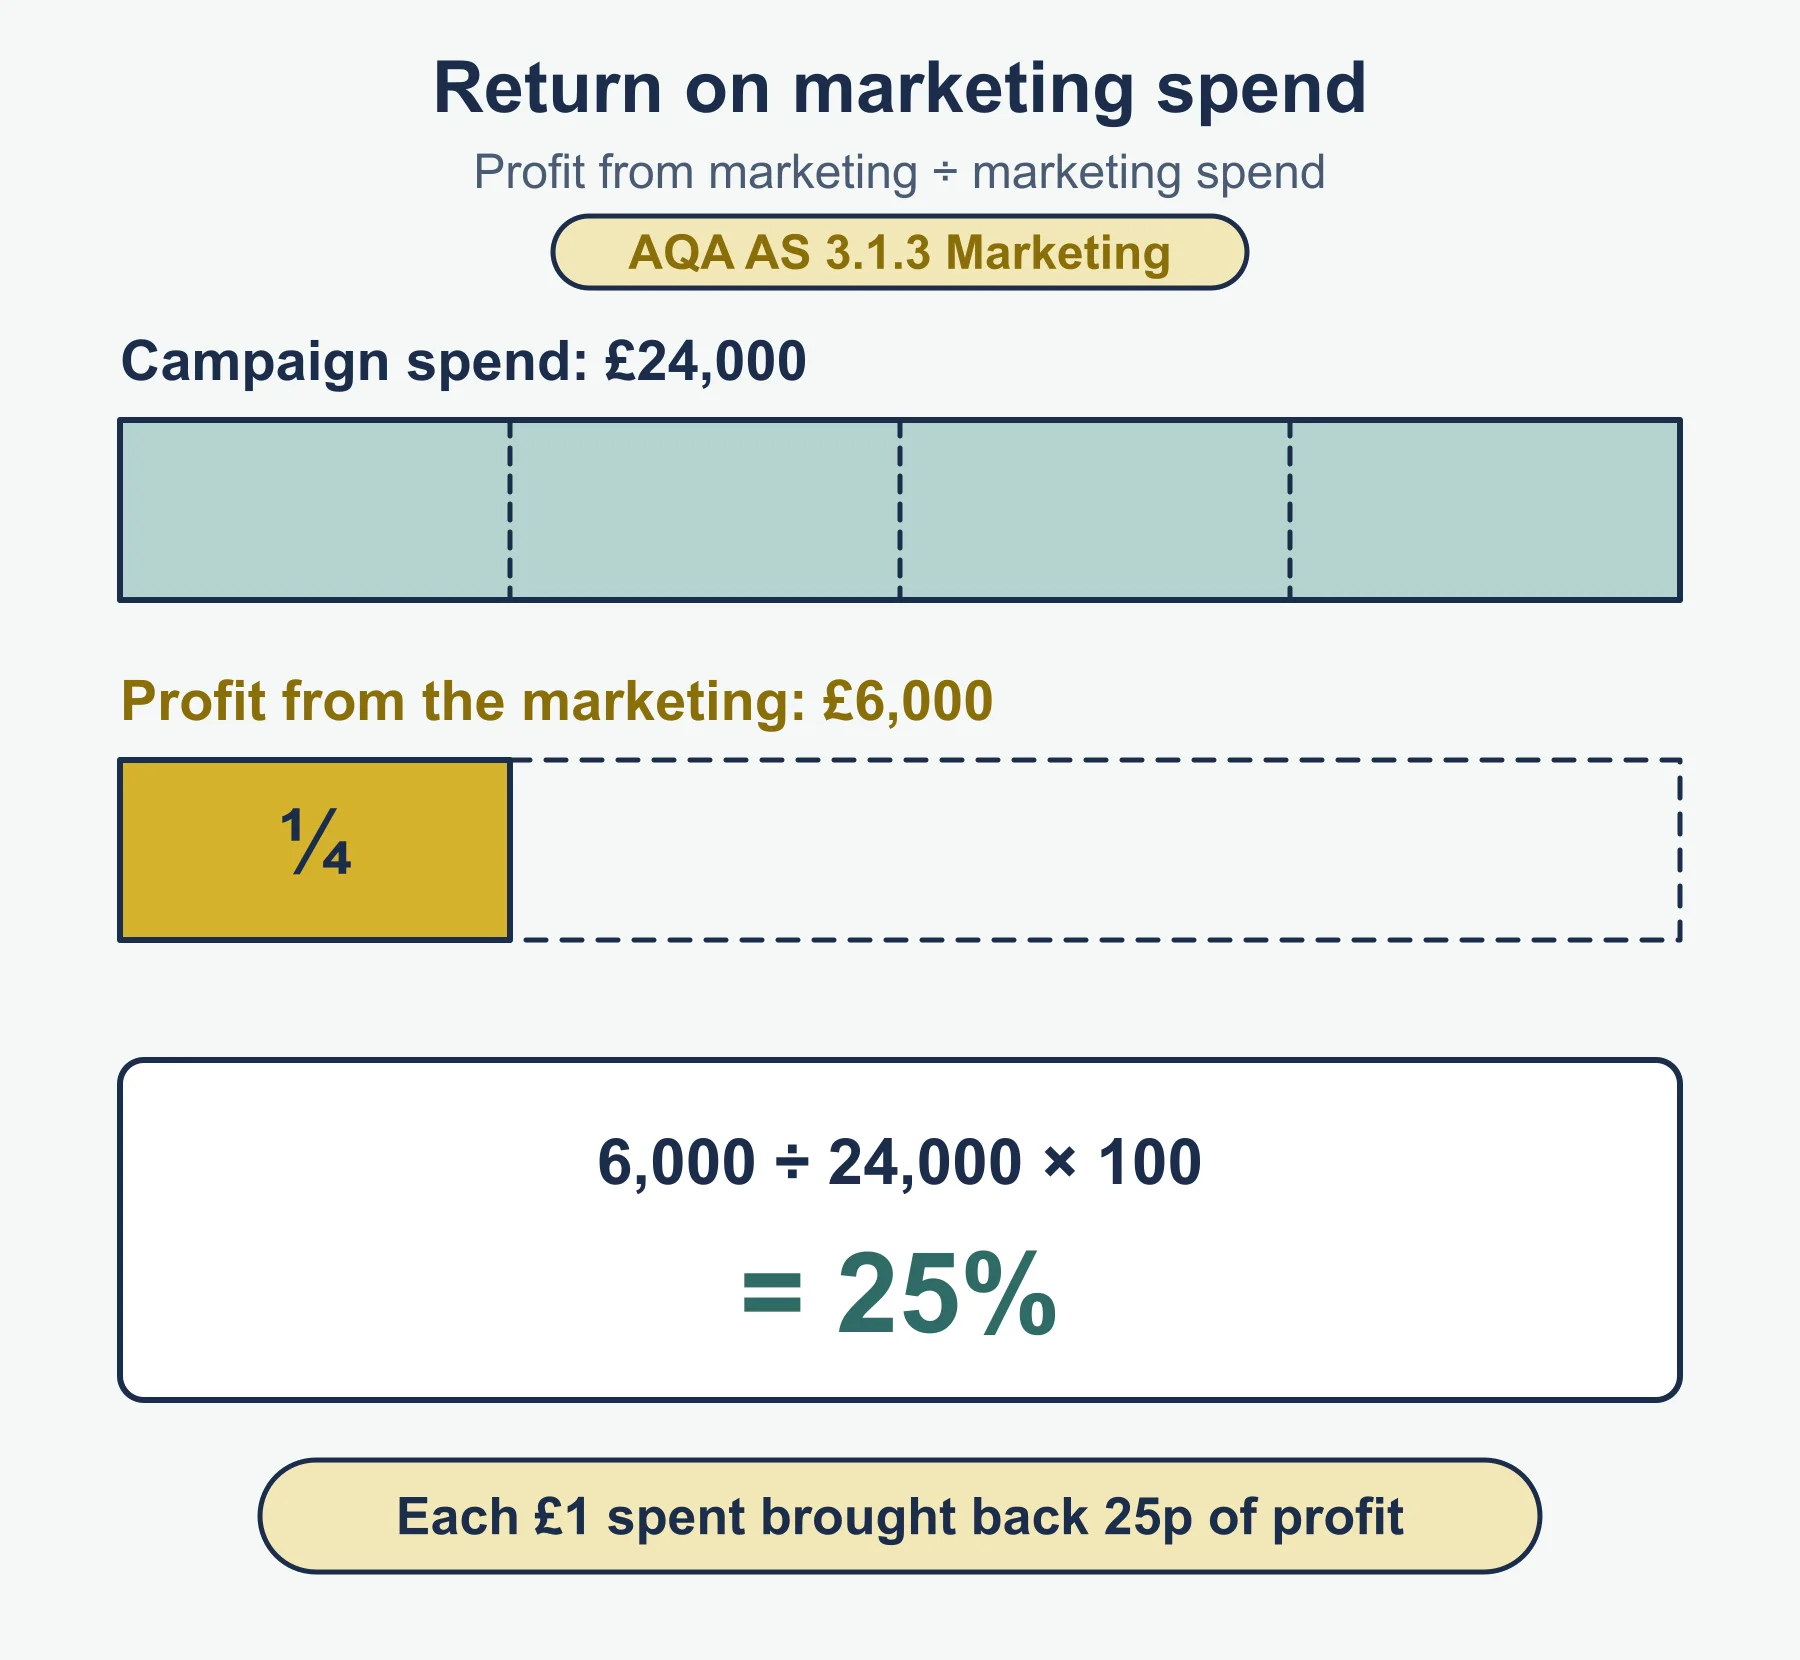
| Return on marketing spend (%) | profit from marketing activities ÷ marketing spend × 100 (standard form) |
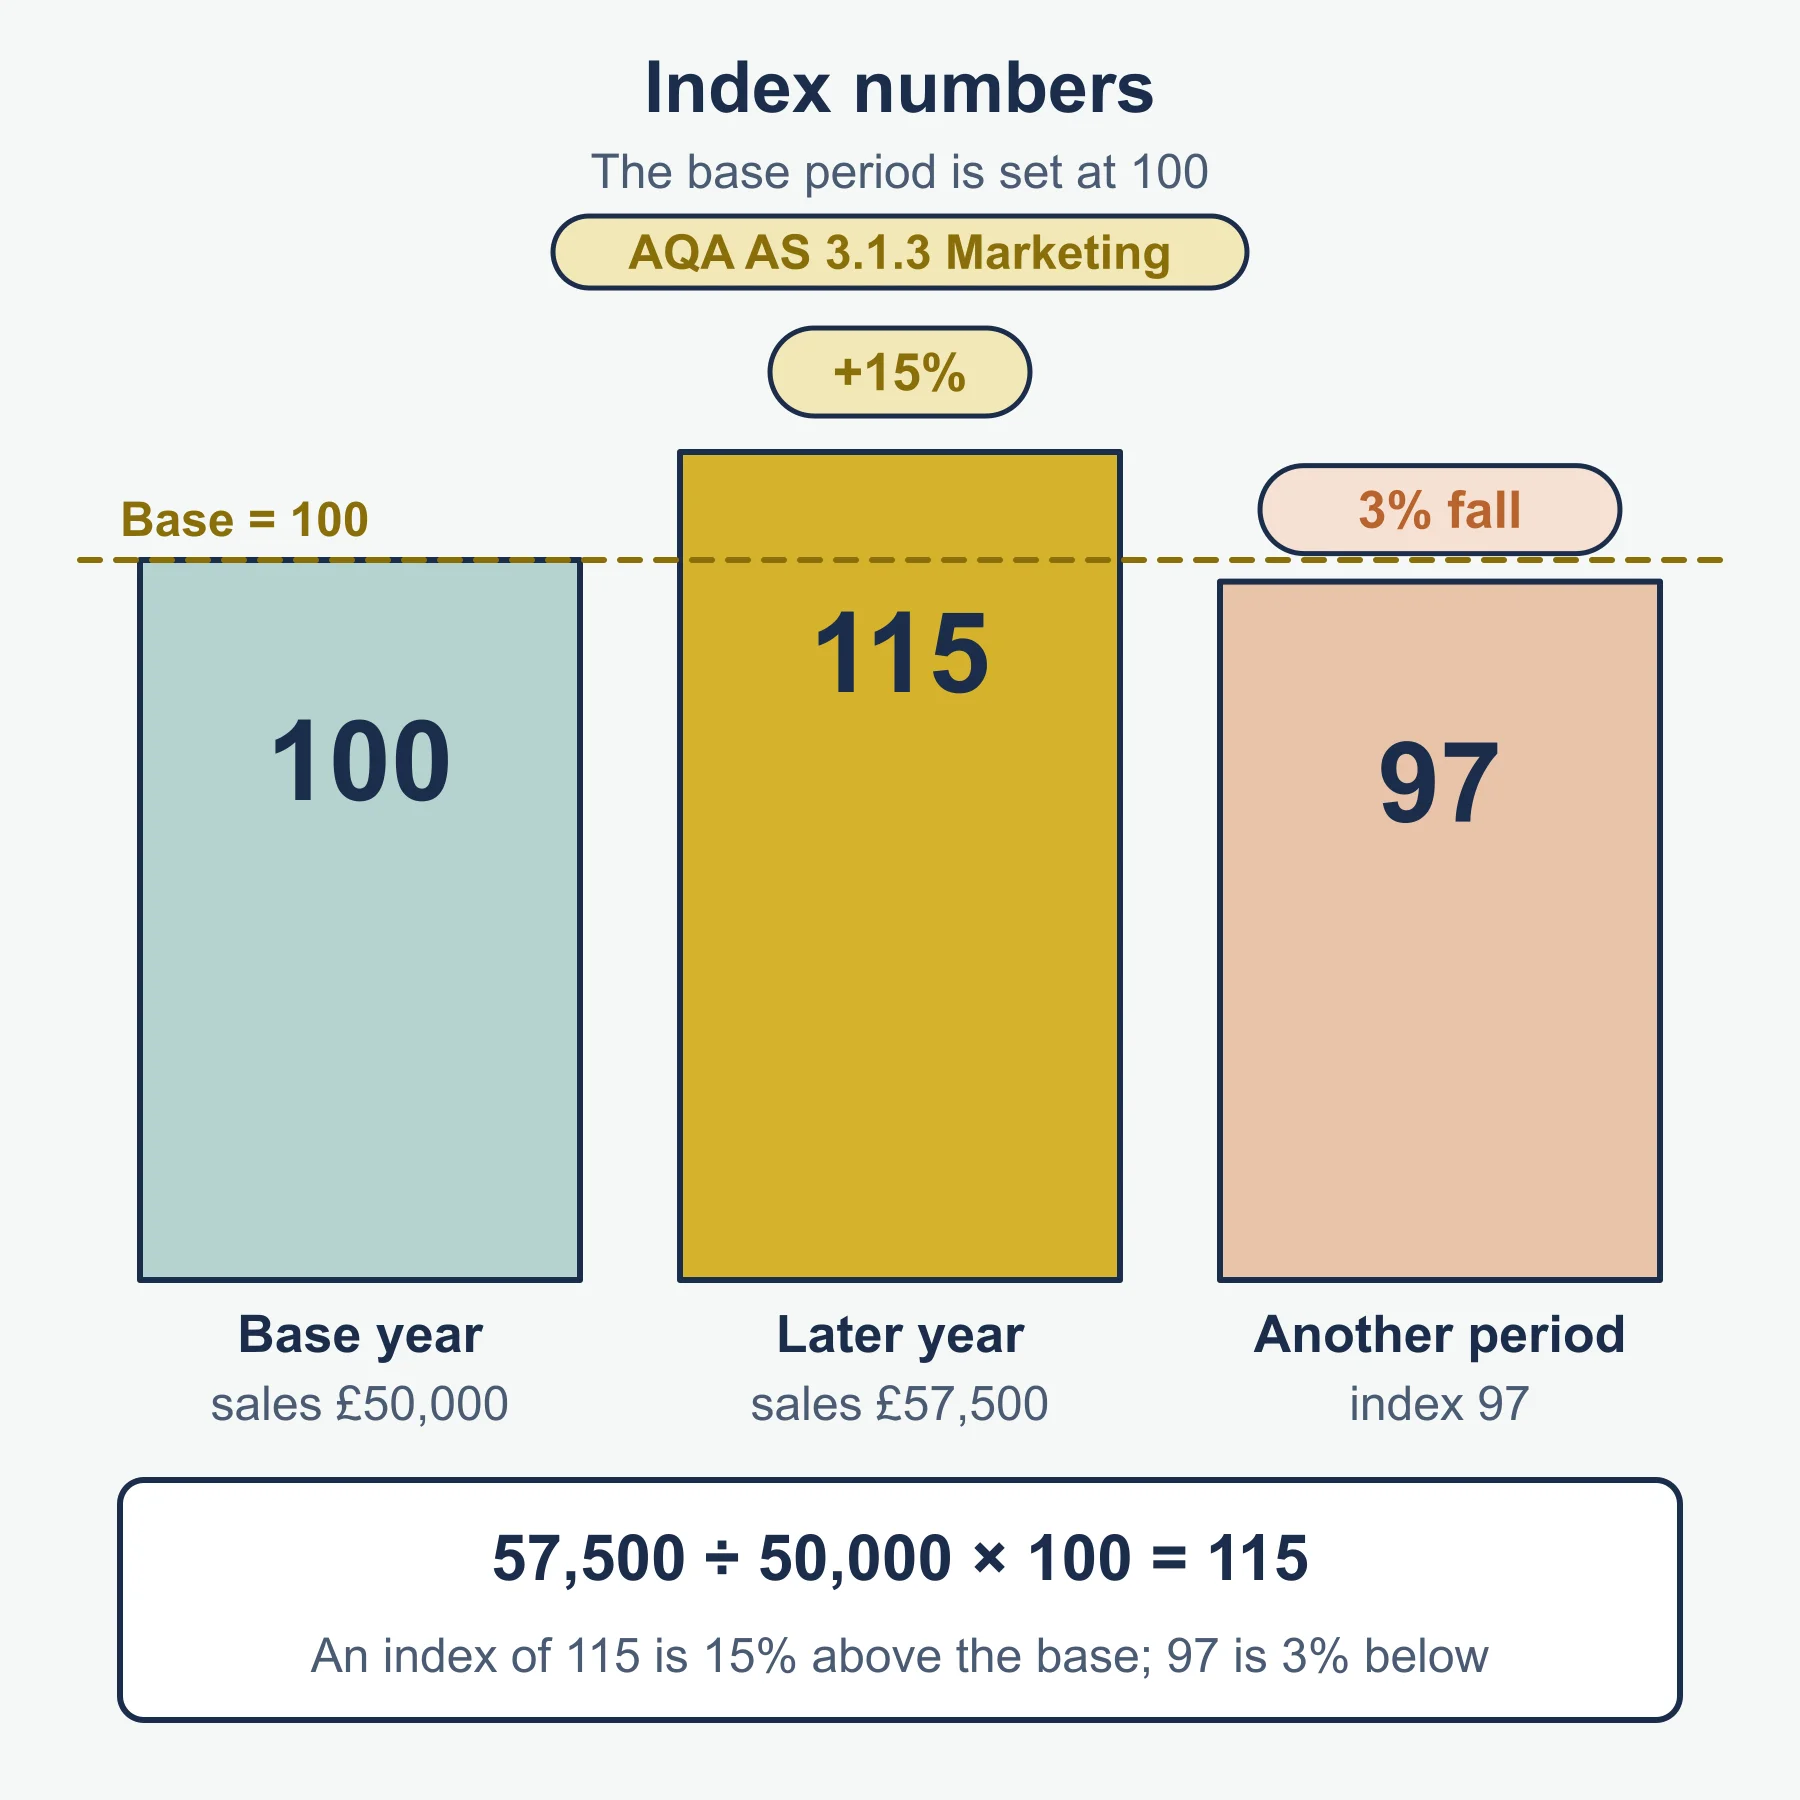
| Index number | value ÷ base value × 100 (standard form) |
| Percentage change | change ÷ original × 100 (standard form) |
Steps: write the formula, substitute with the correct year in each place, calculate, add the unit, then comment.
- Sales per region, product or store: compare using percentages or an index so size differences do not mislead.
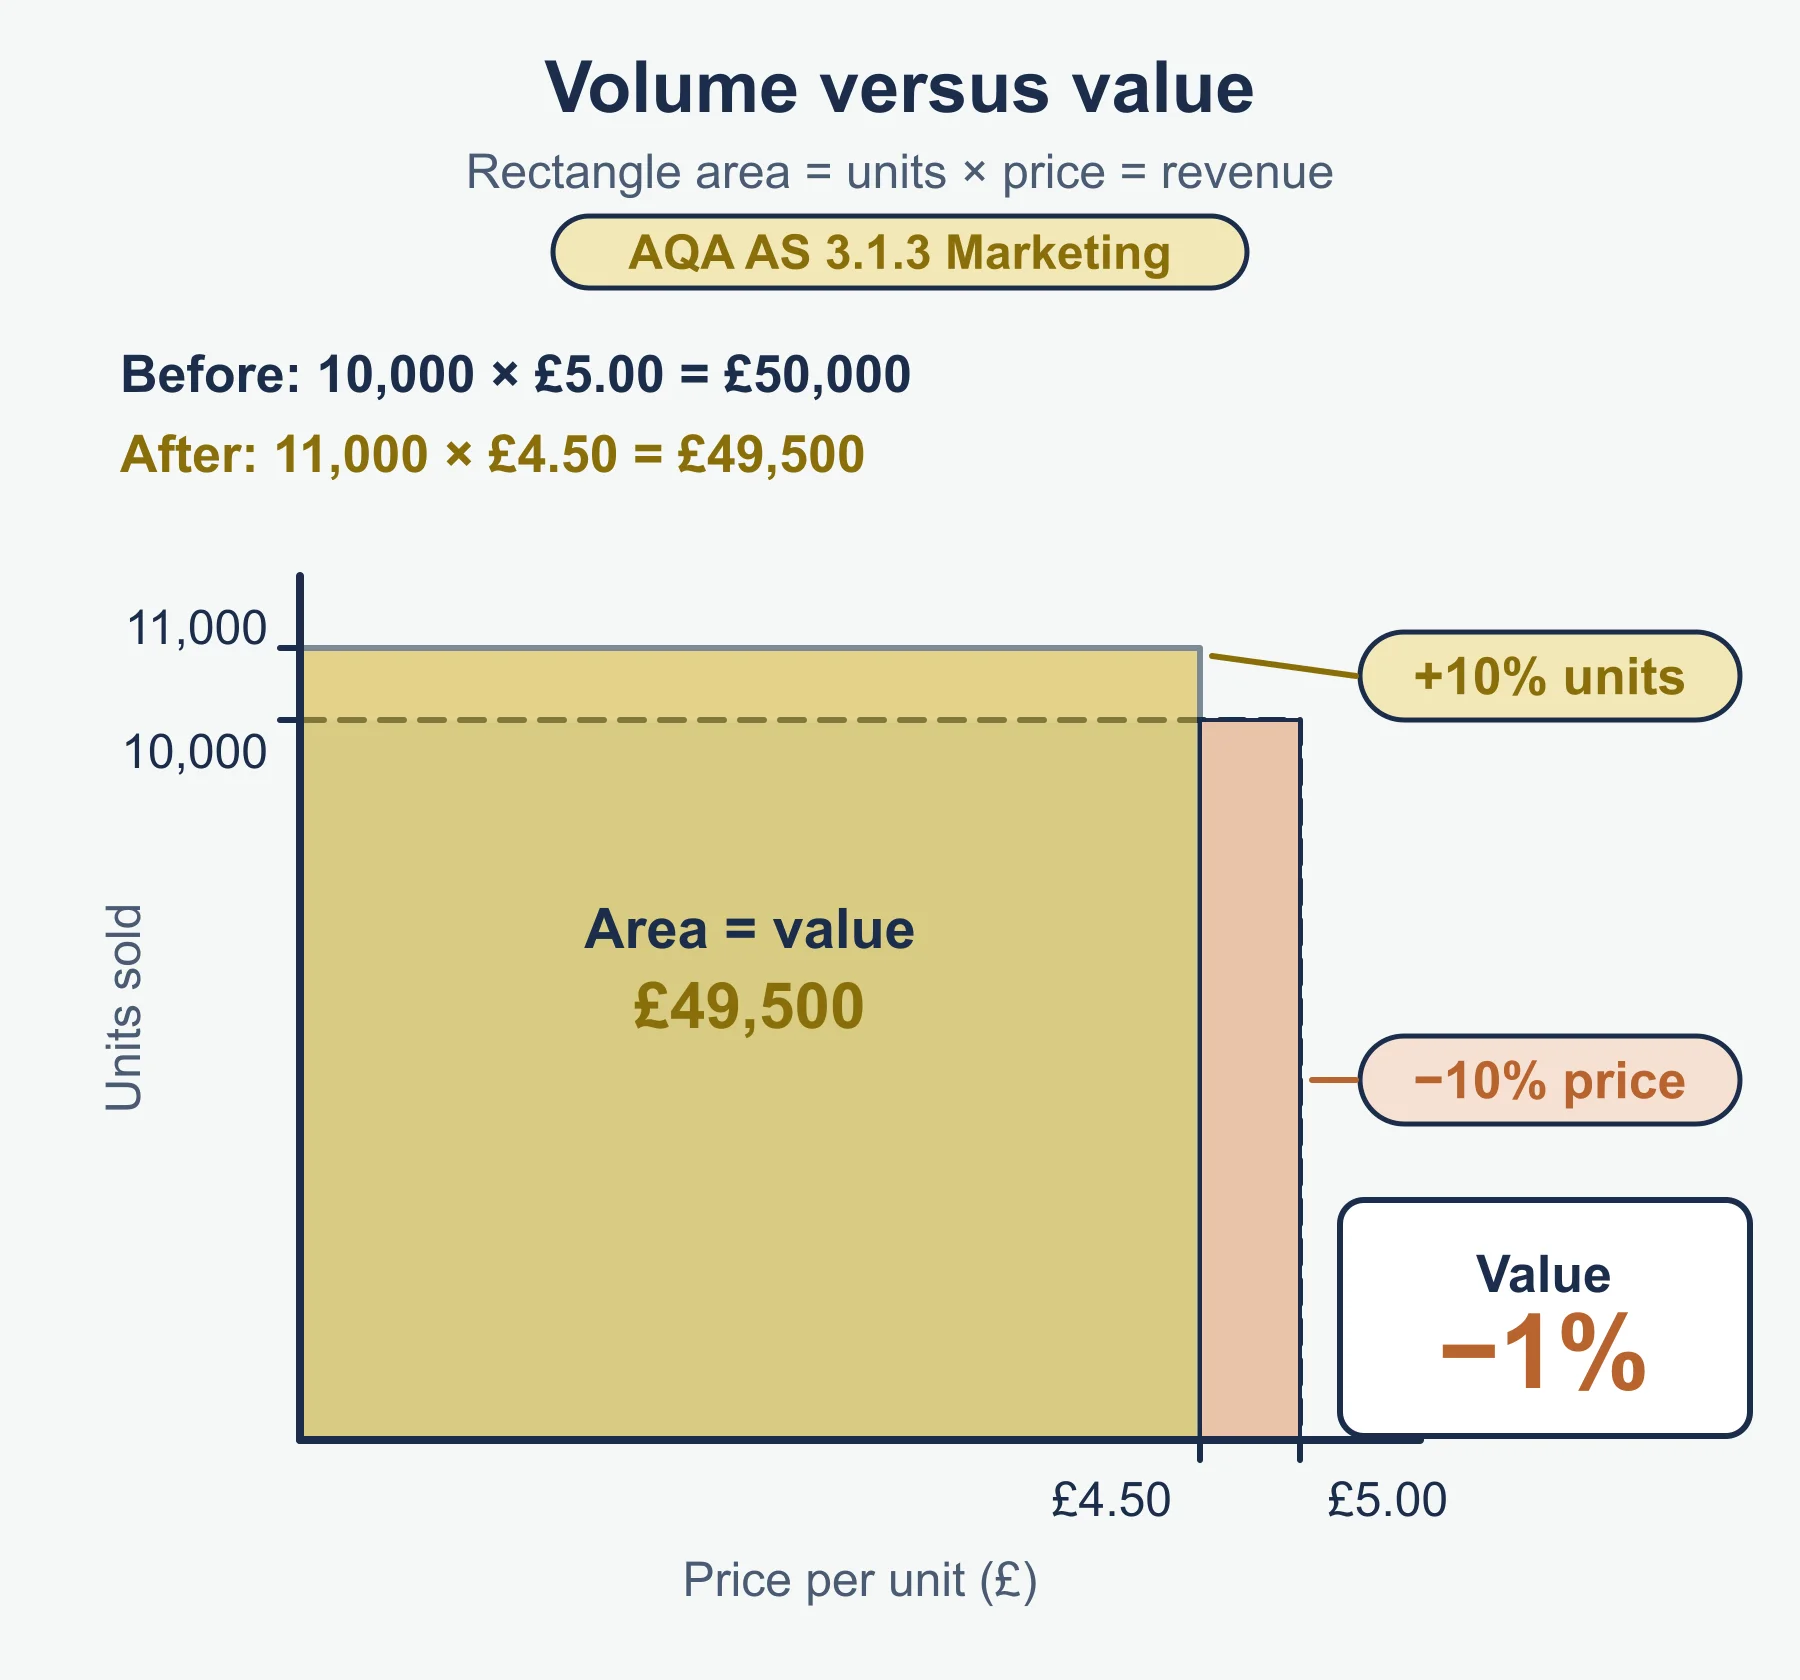
- Volume (units) can rise while value (revenue) falls if prices fall.
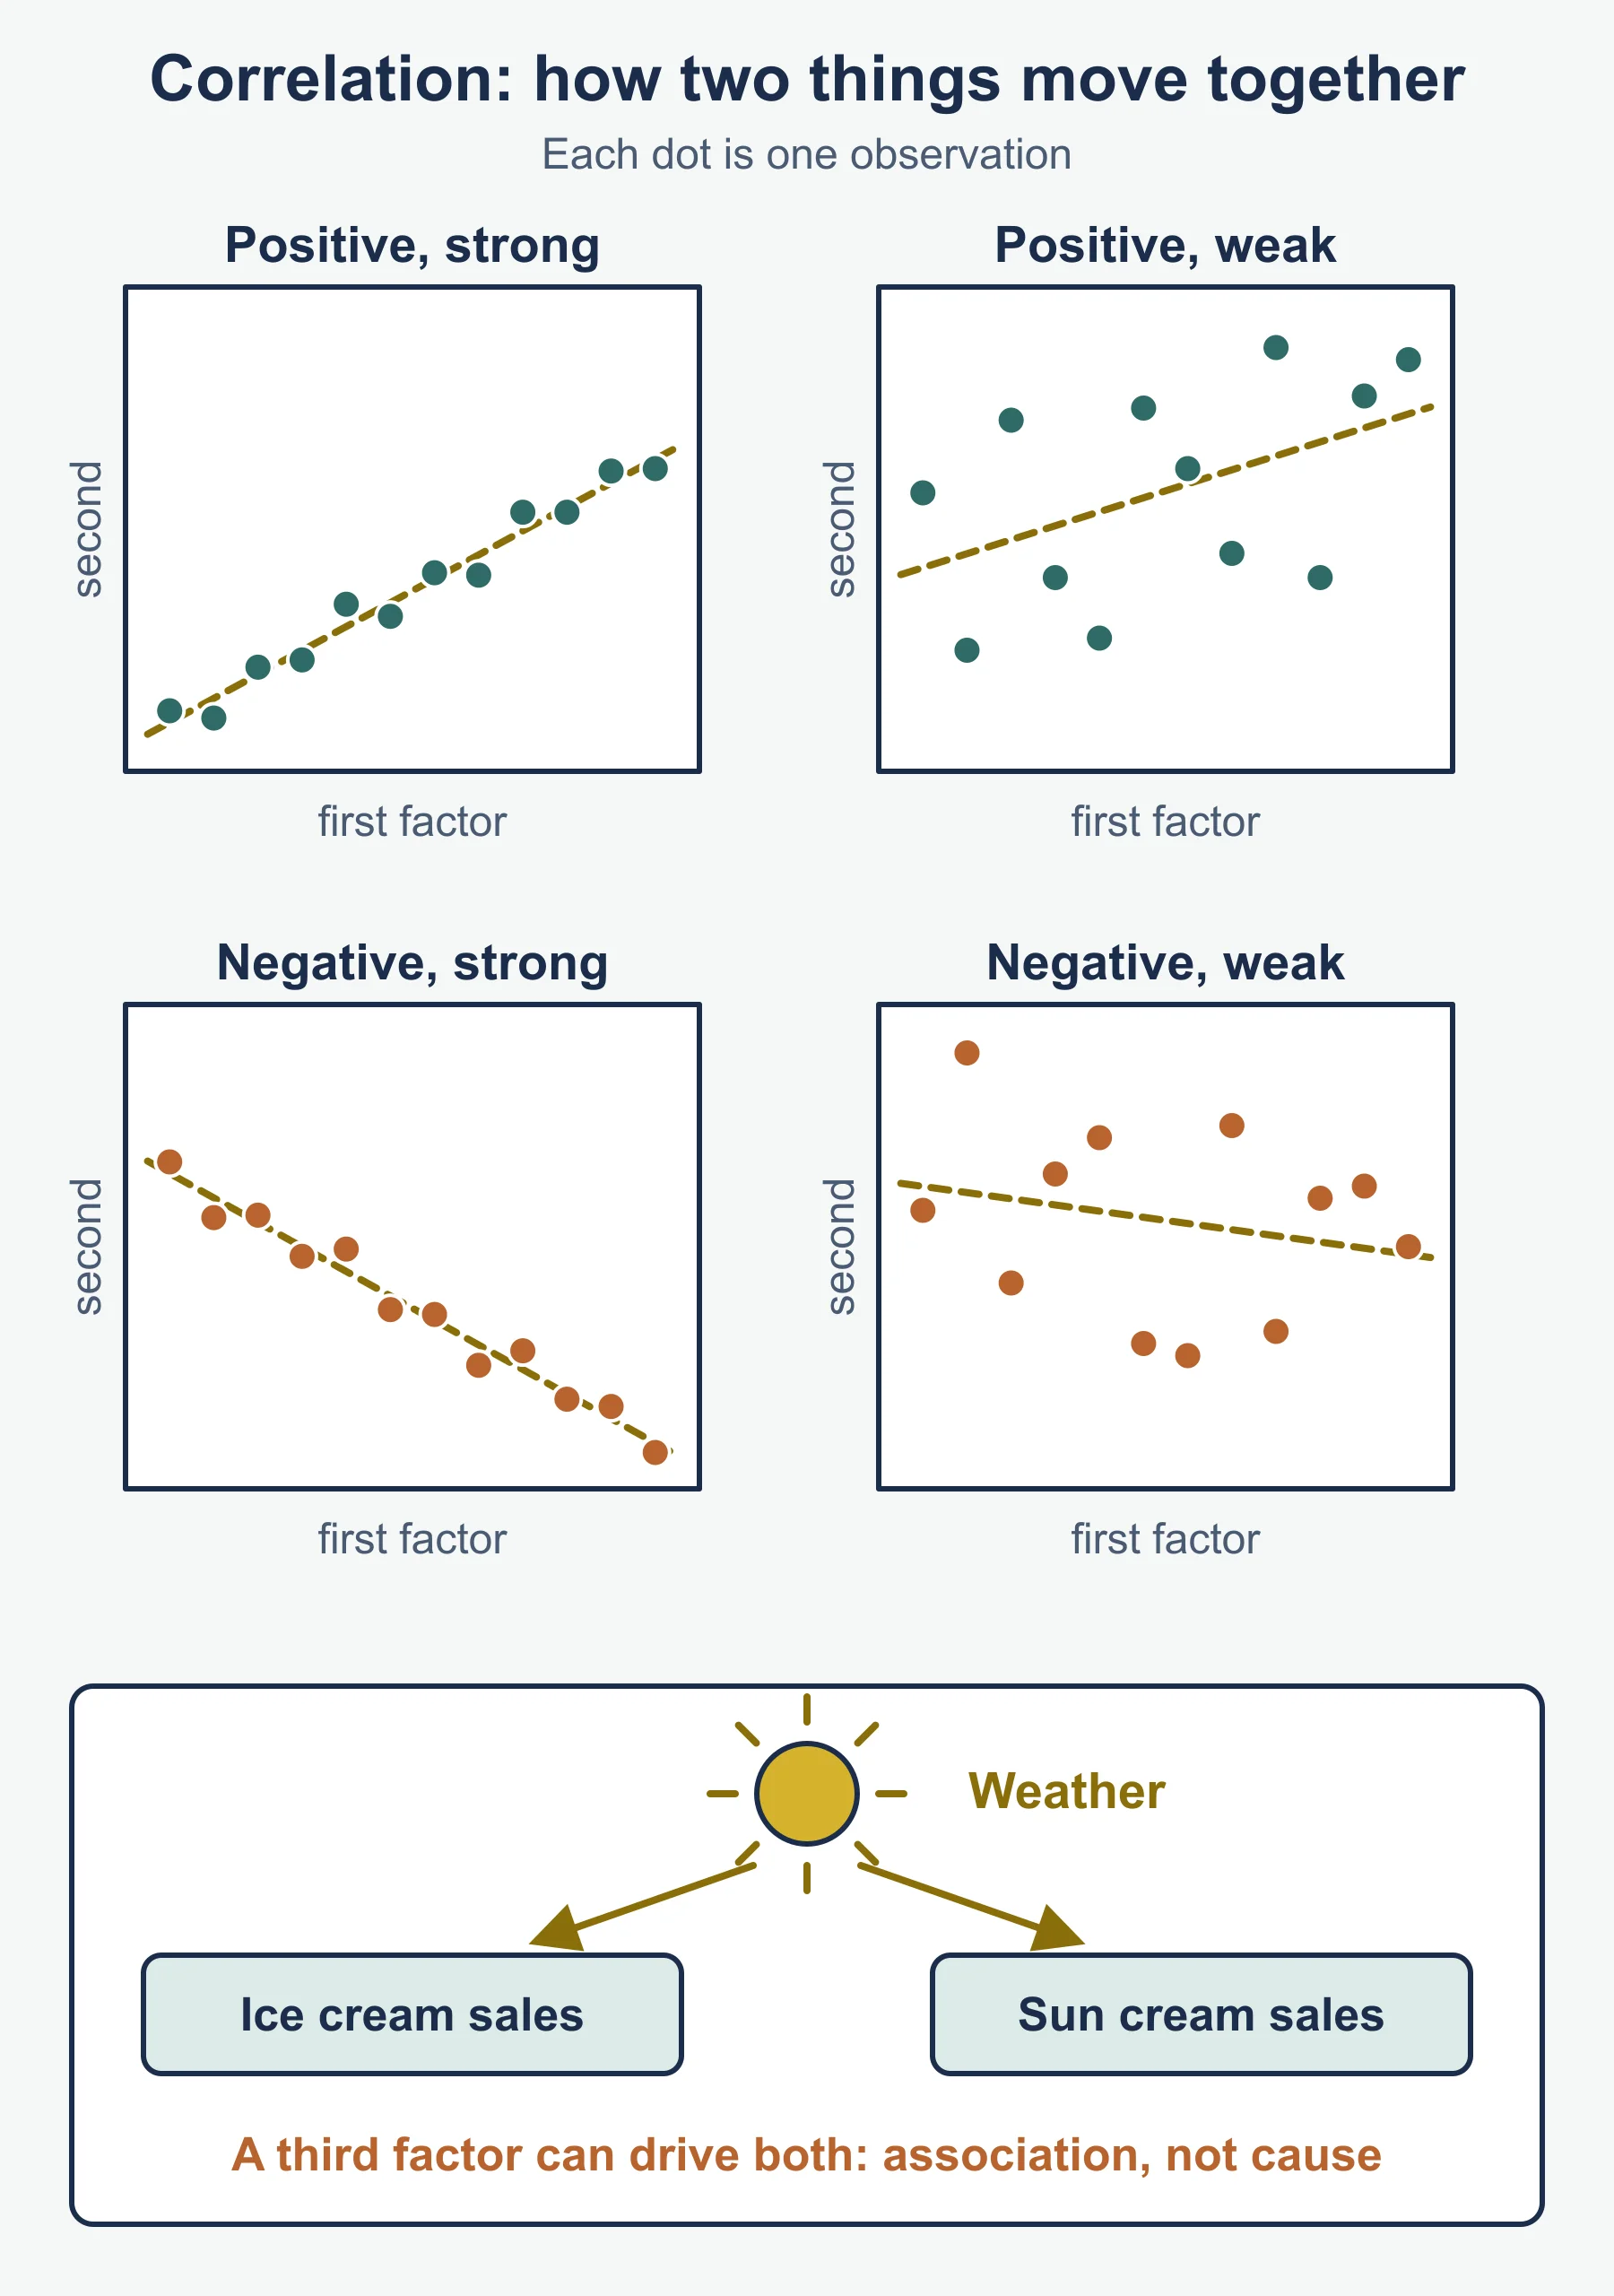
- Correlation: positive, negative, strong, weak. It shows association, not cause.
Reminder. The market rises from £250m to £275m: growth 10%. A firm with £27.5m sales in the later year has share 27.5 ÷ 275 × 100 = 10%.
Demand
Influences: price, incomes, tastes, substitutes, complements, advertising, number of buyers.
| Measure | Formula |
|---|---|
| PED | percentage change in quantity ÷ percentage change in price |
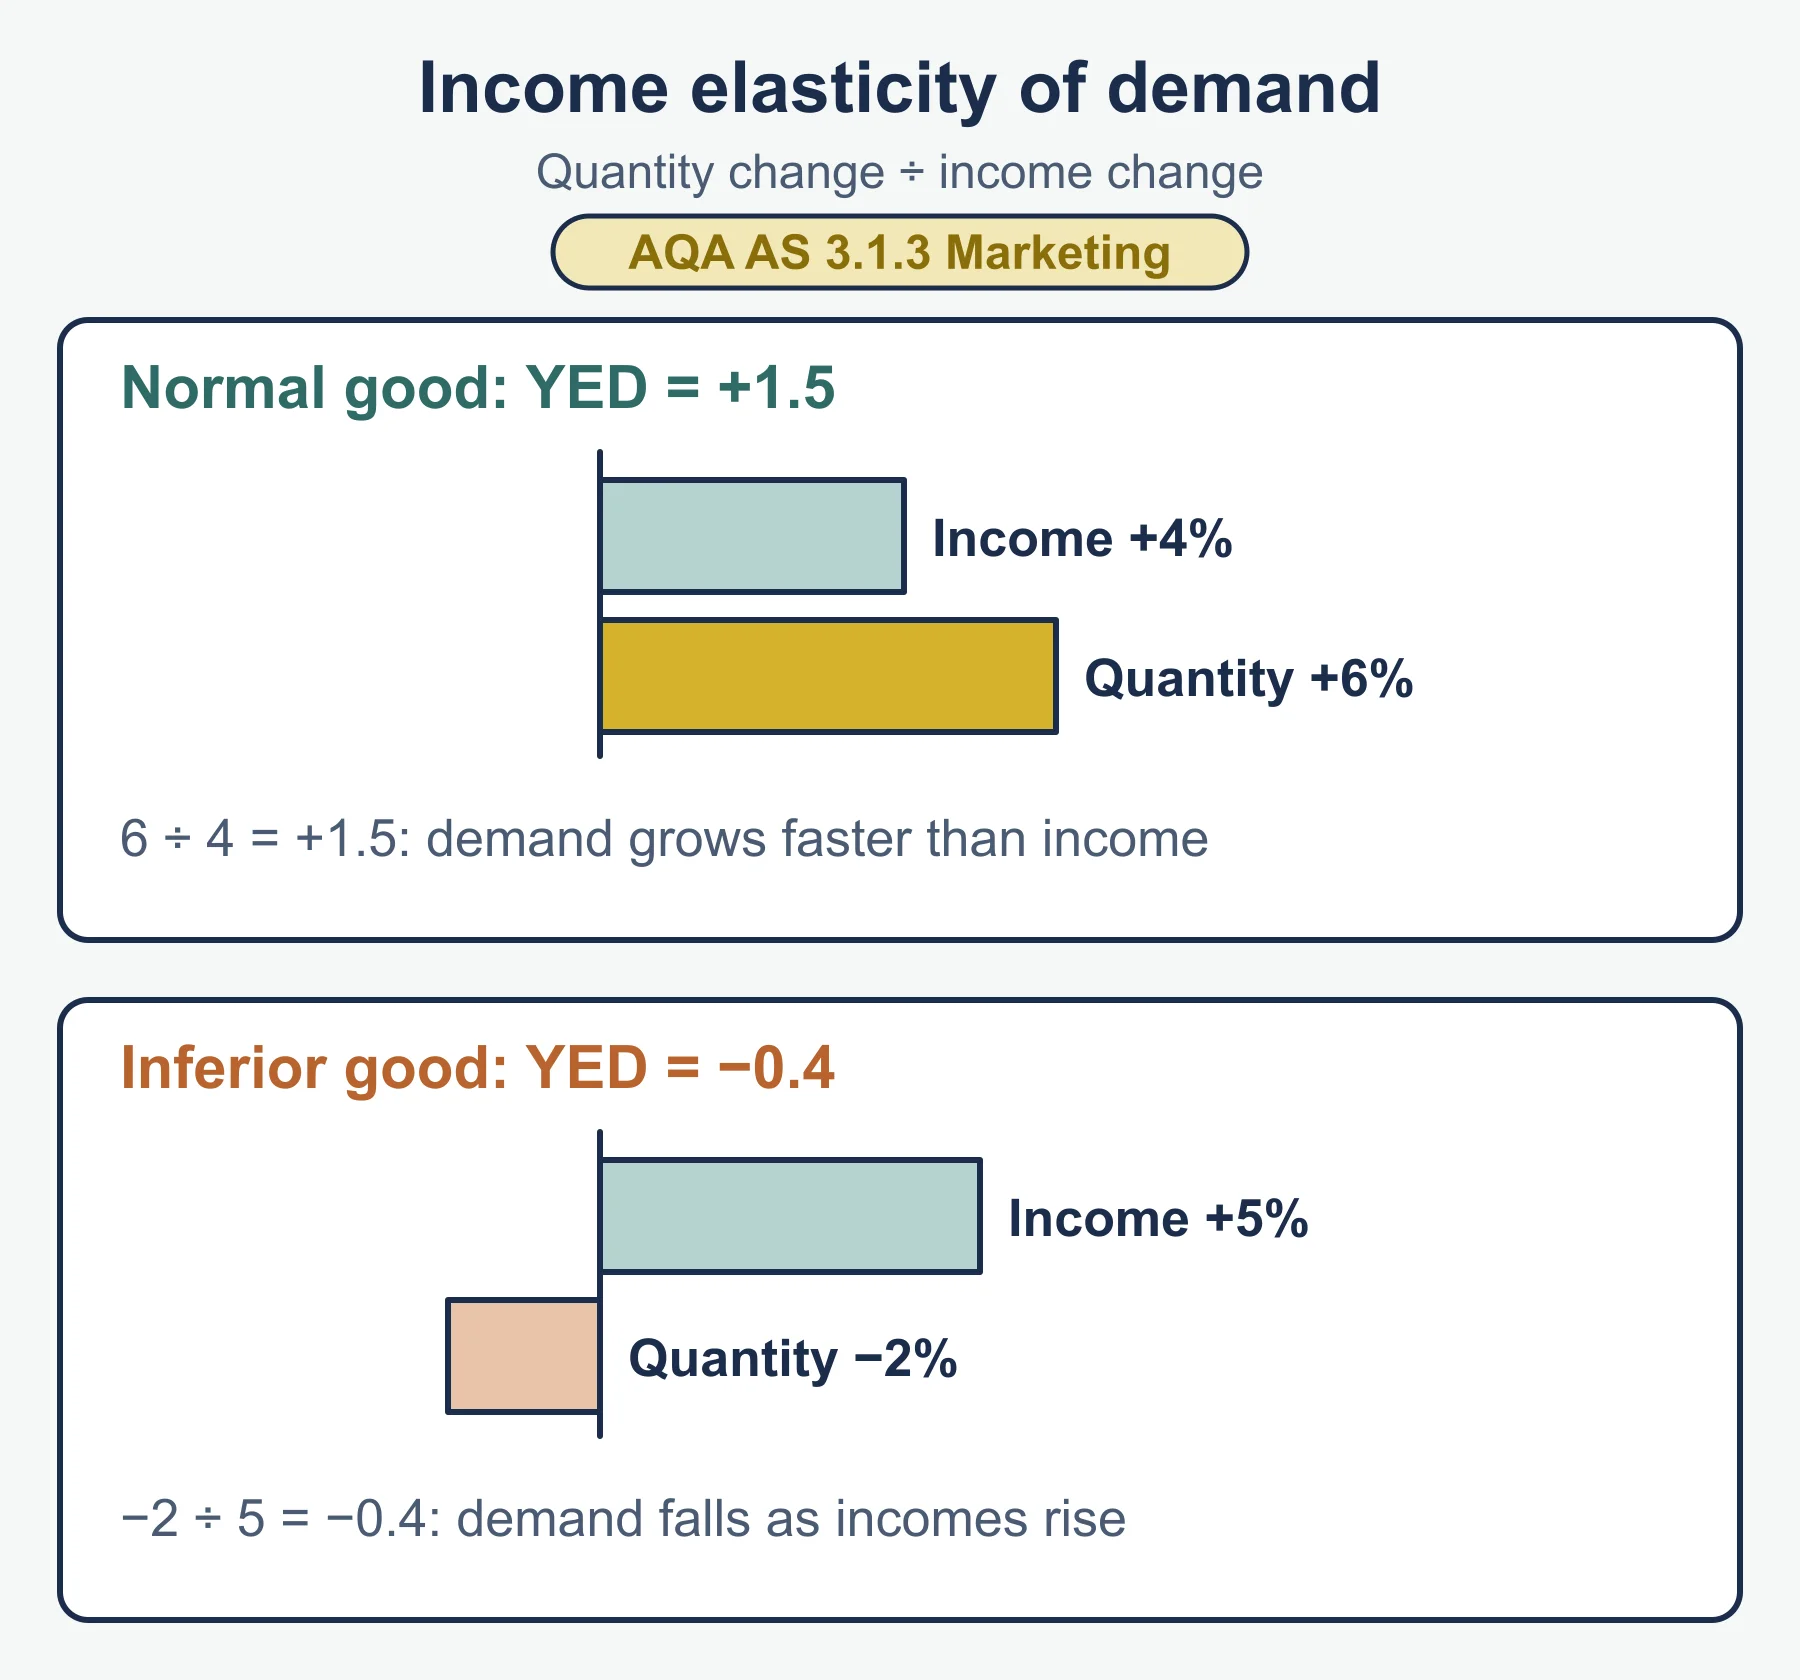
| YED | percentage change in quantity ÷ percentage change in income |
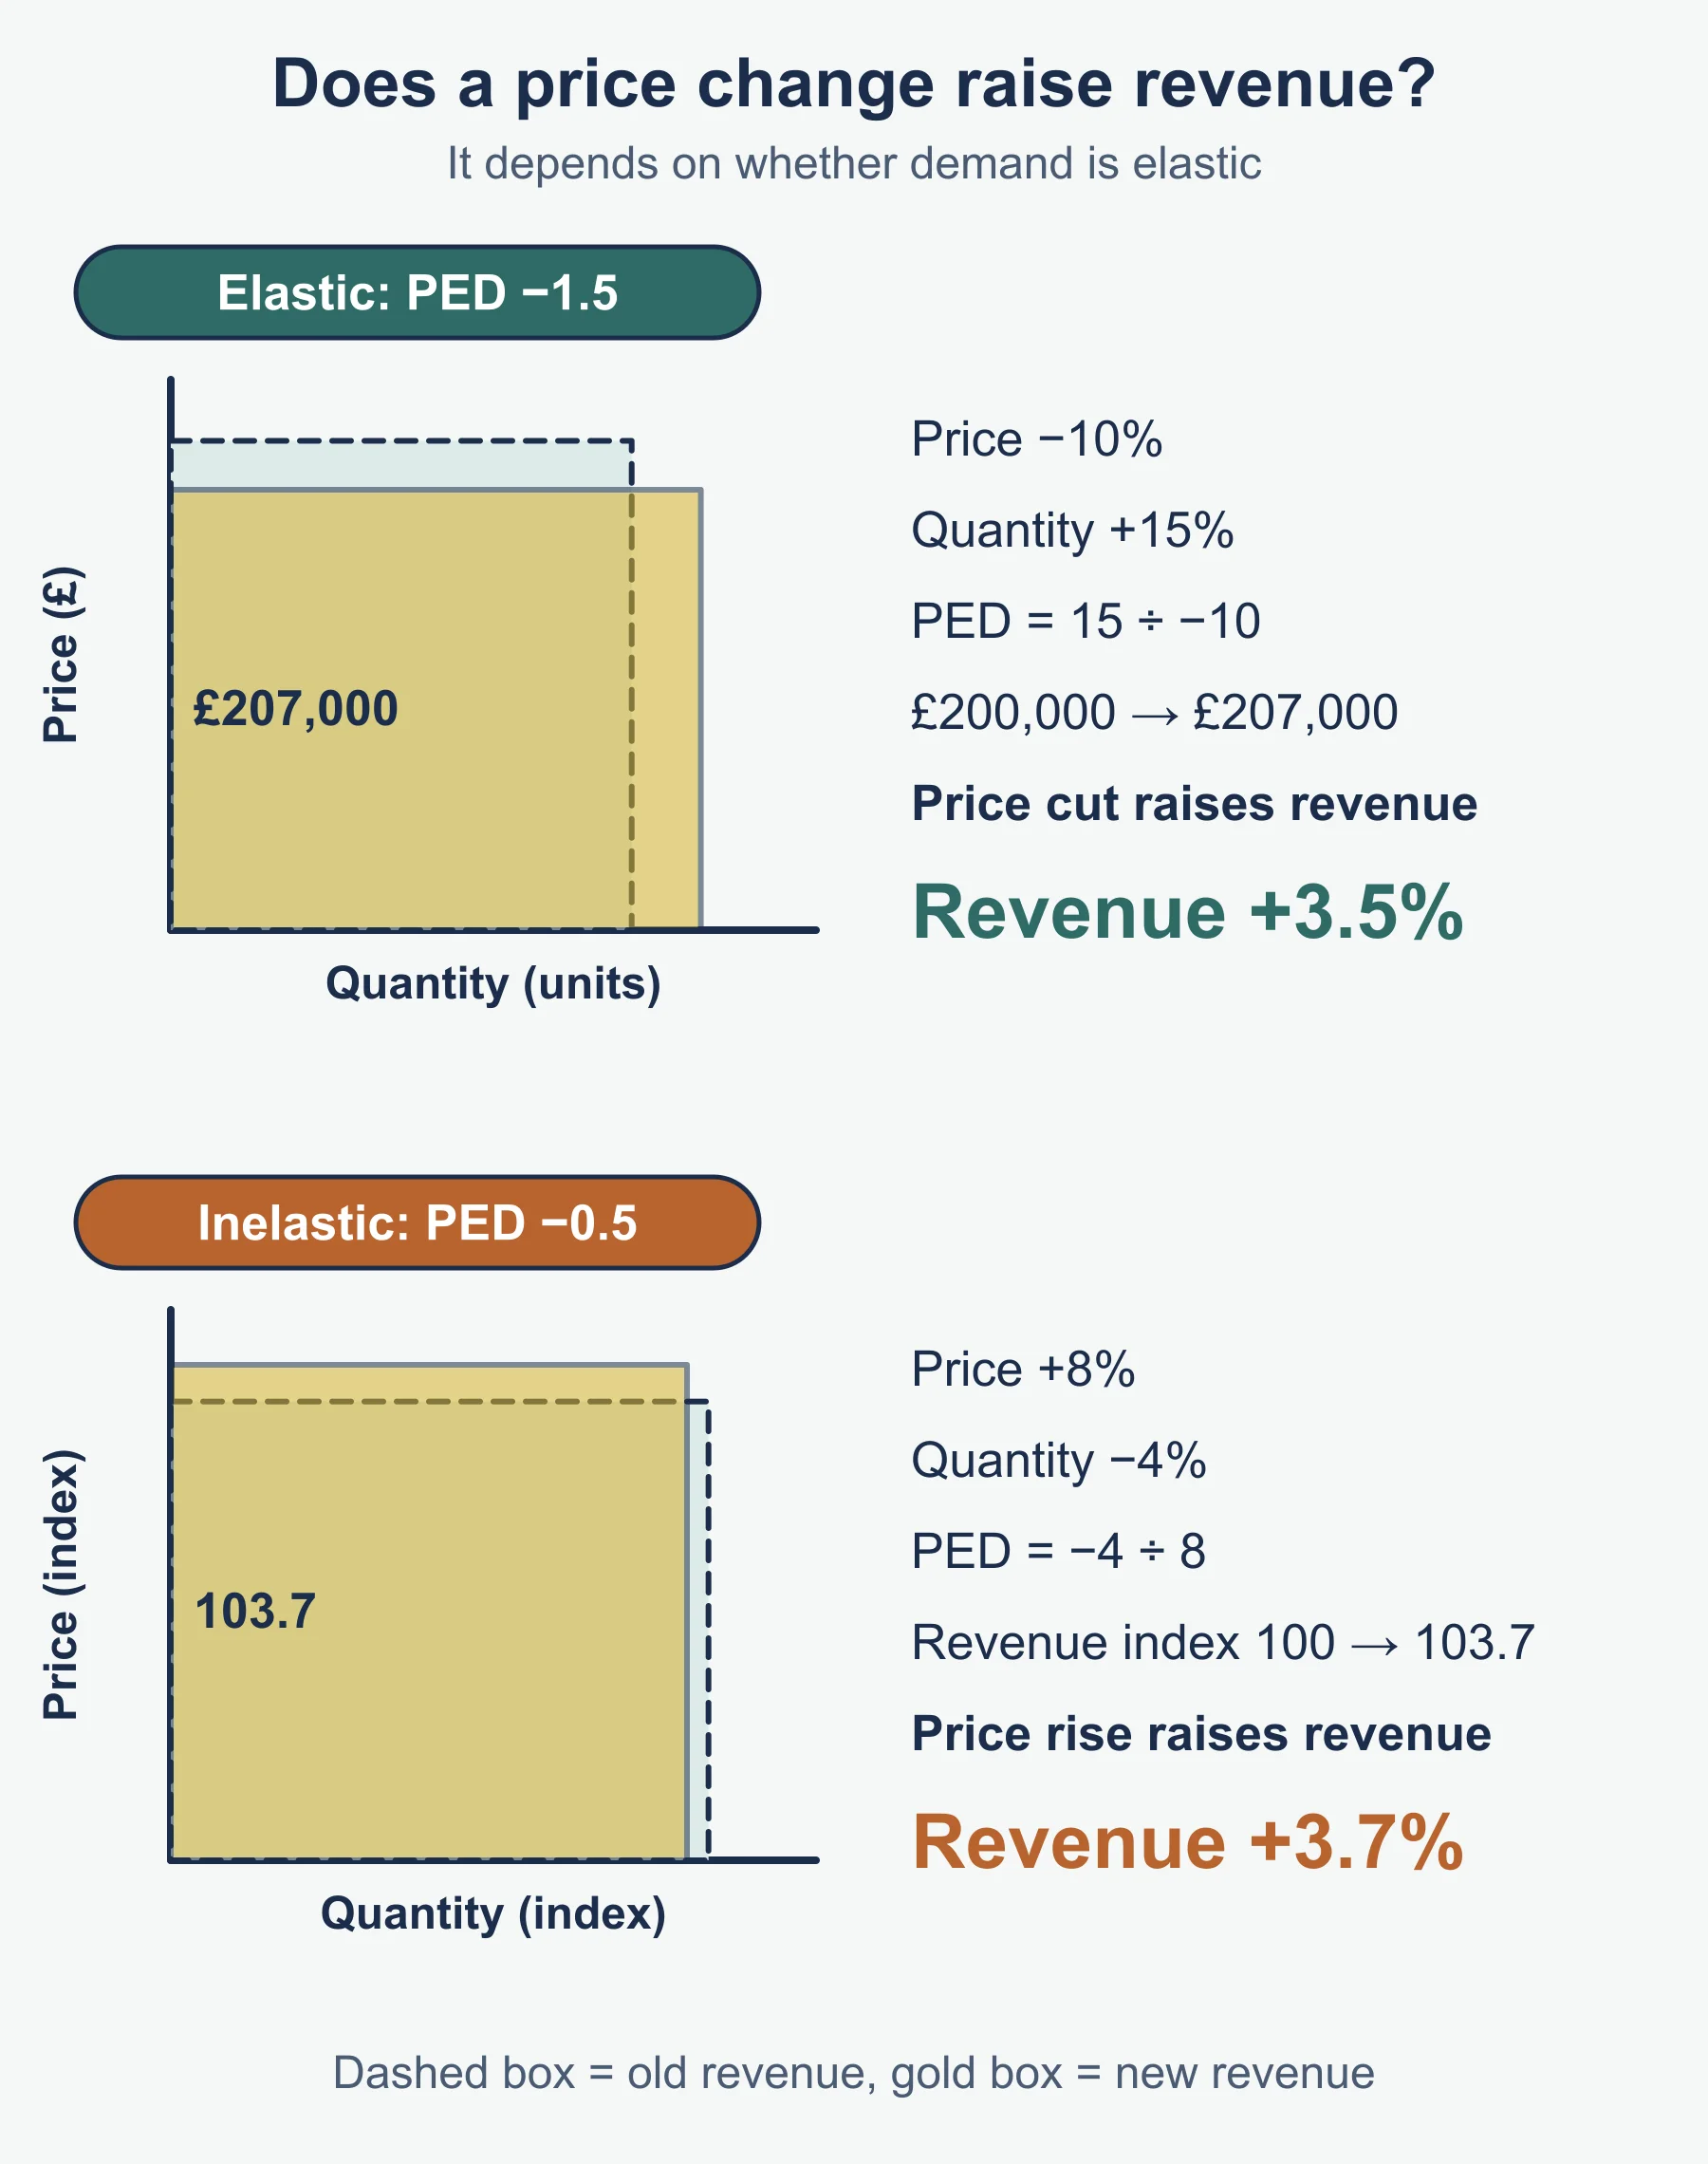
- PED, disregarding sign: size above 1 elastic, below 1 inelastic.
- Elastic: a price cut raises revenue; a price rise lowers it.
- Inelastic: a price rise raises revenue; a price cut lowers it.
- YED positive: normal good (above 1, demand grows faster than income). YED negative: inferior good.
Reminder. Price up 5%, quantity down 2%: PED = −2 ÷ 5 = −0.4, inelastic, so revenue rises (1.05 × 0.98 = 1.029 of the original).
Target market
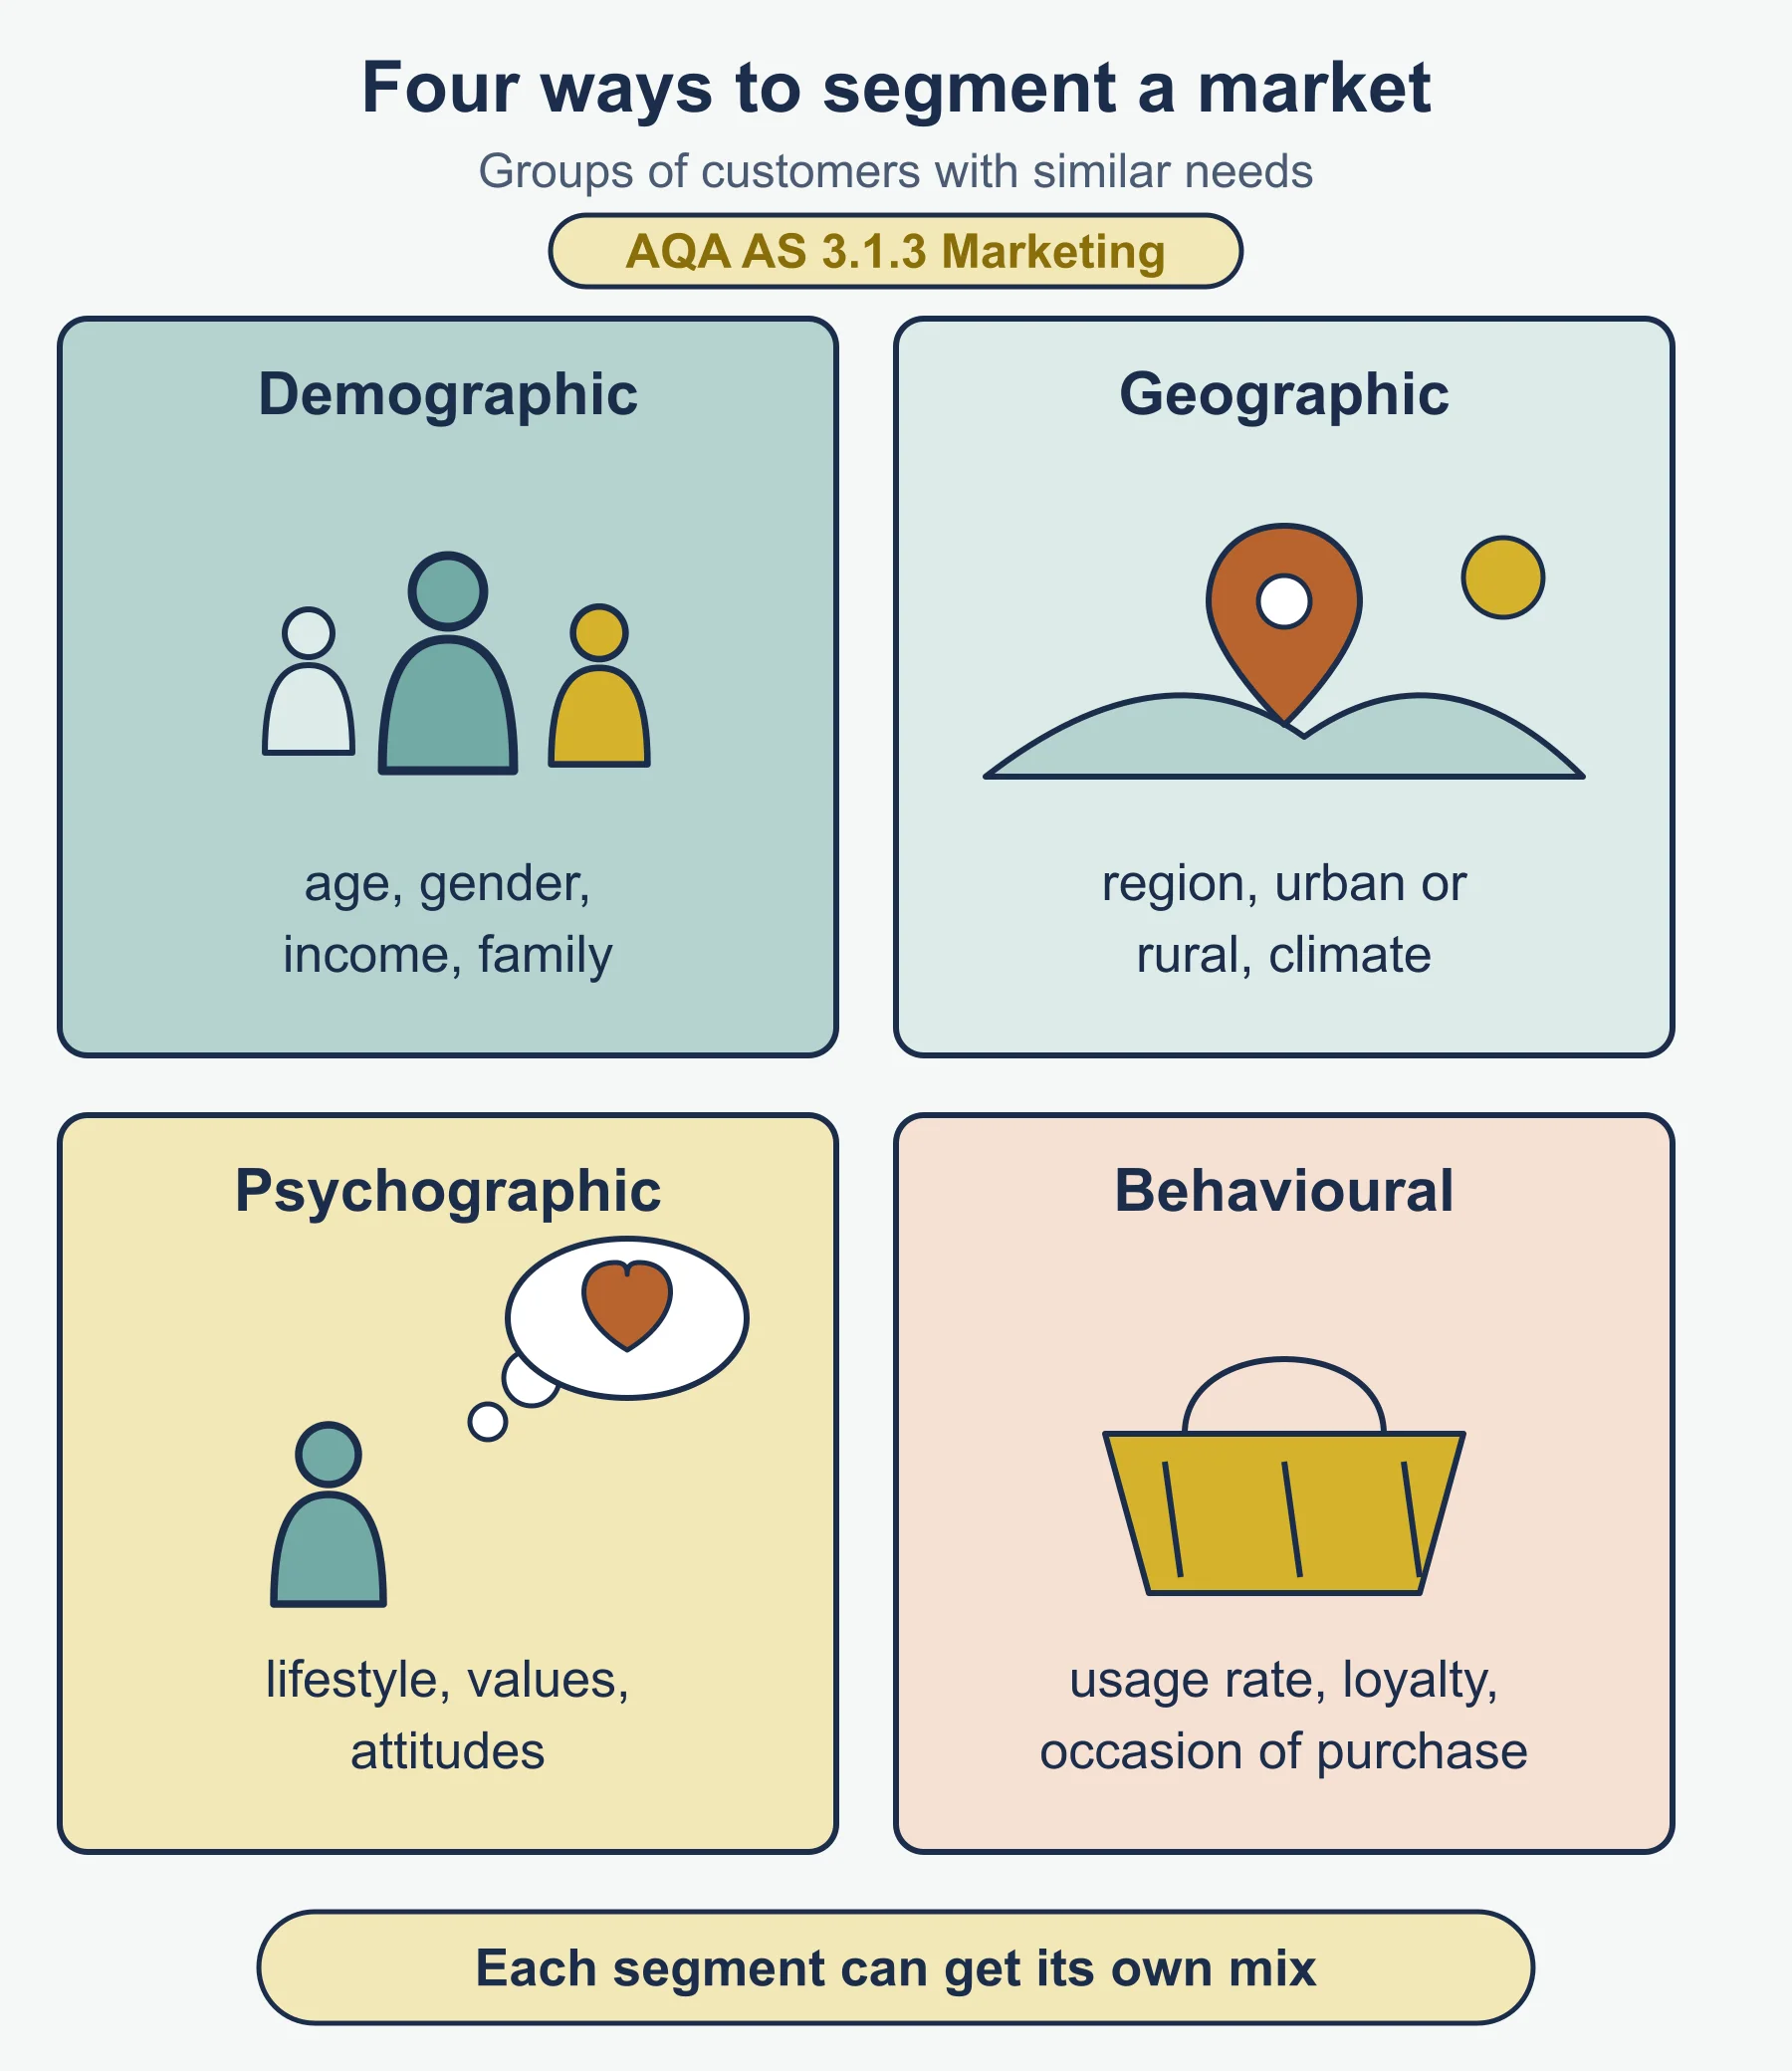
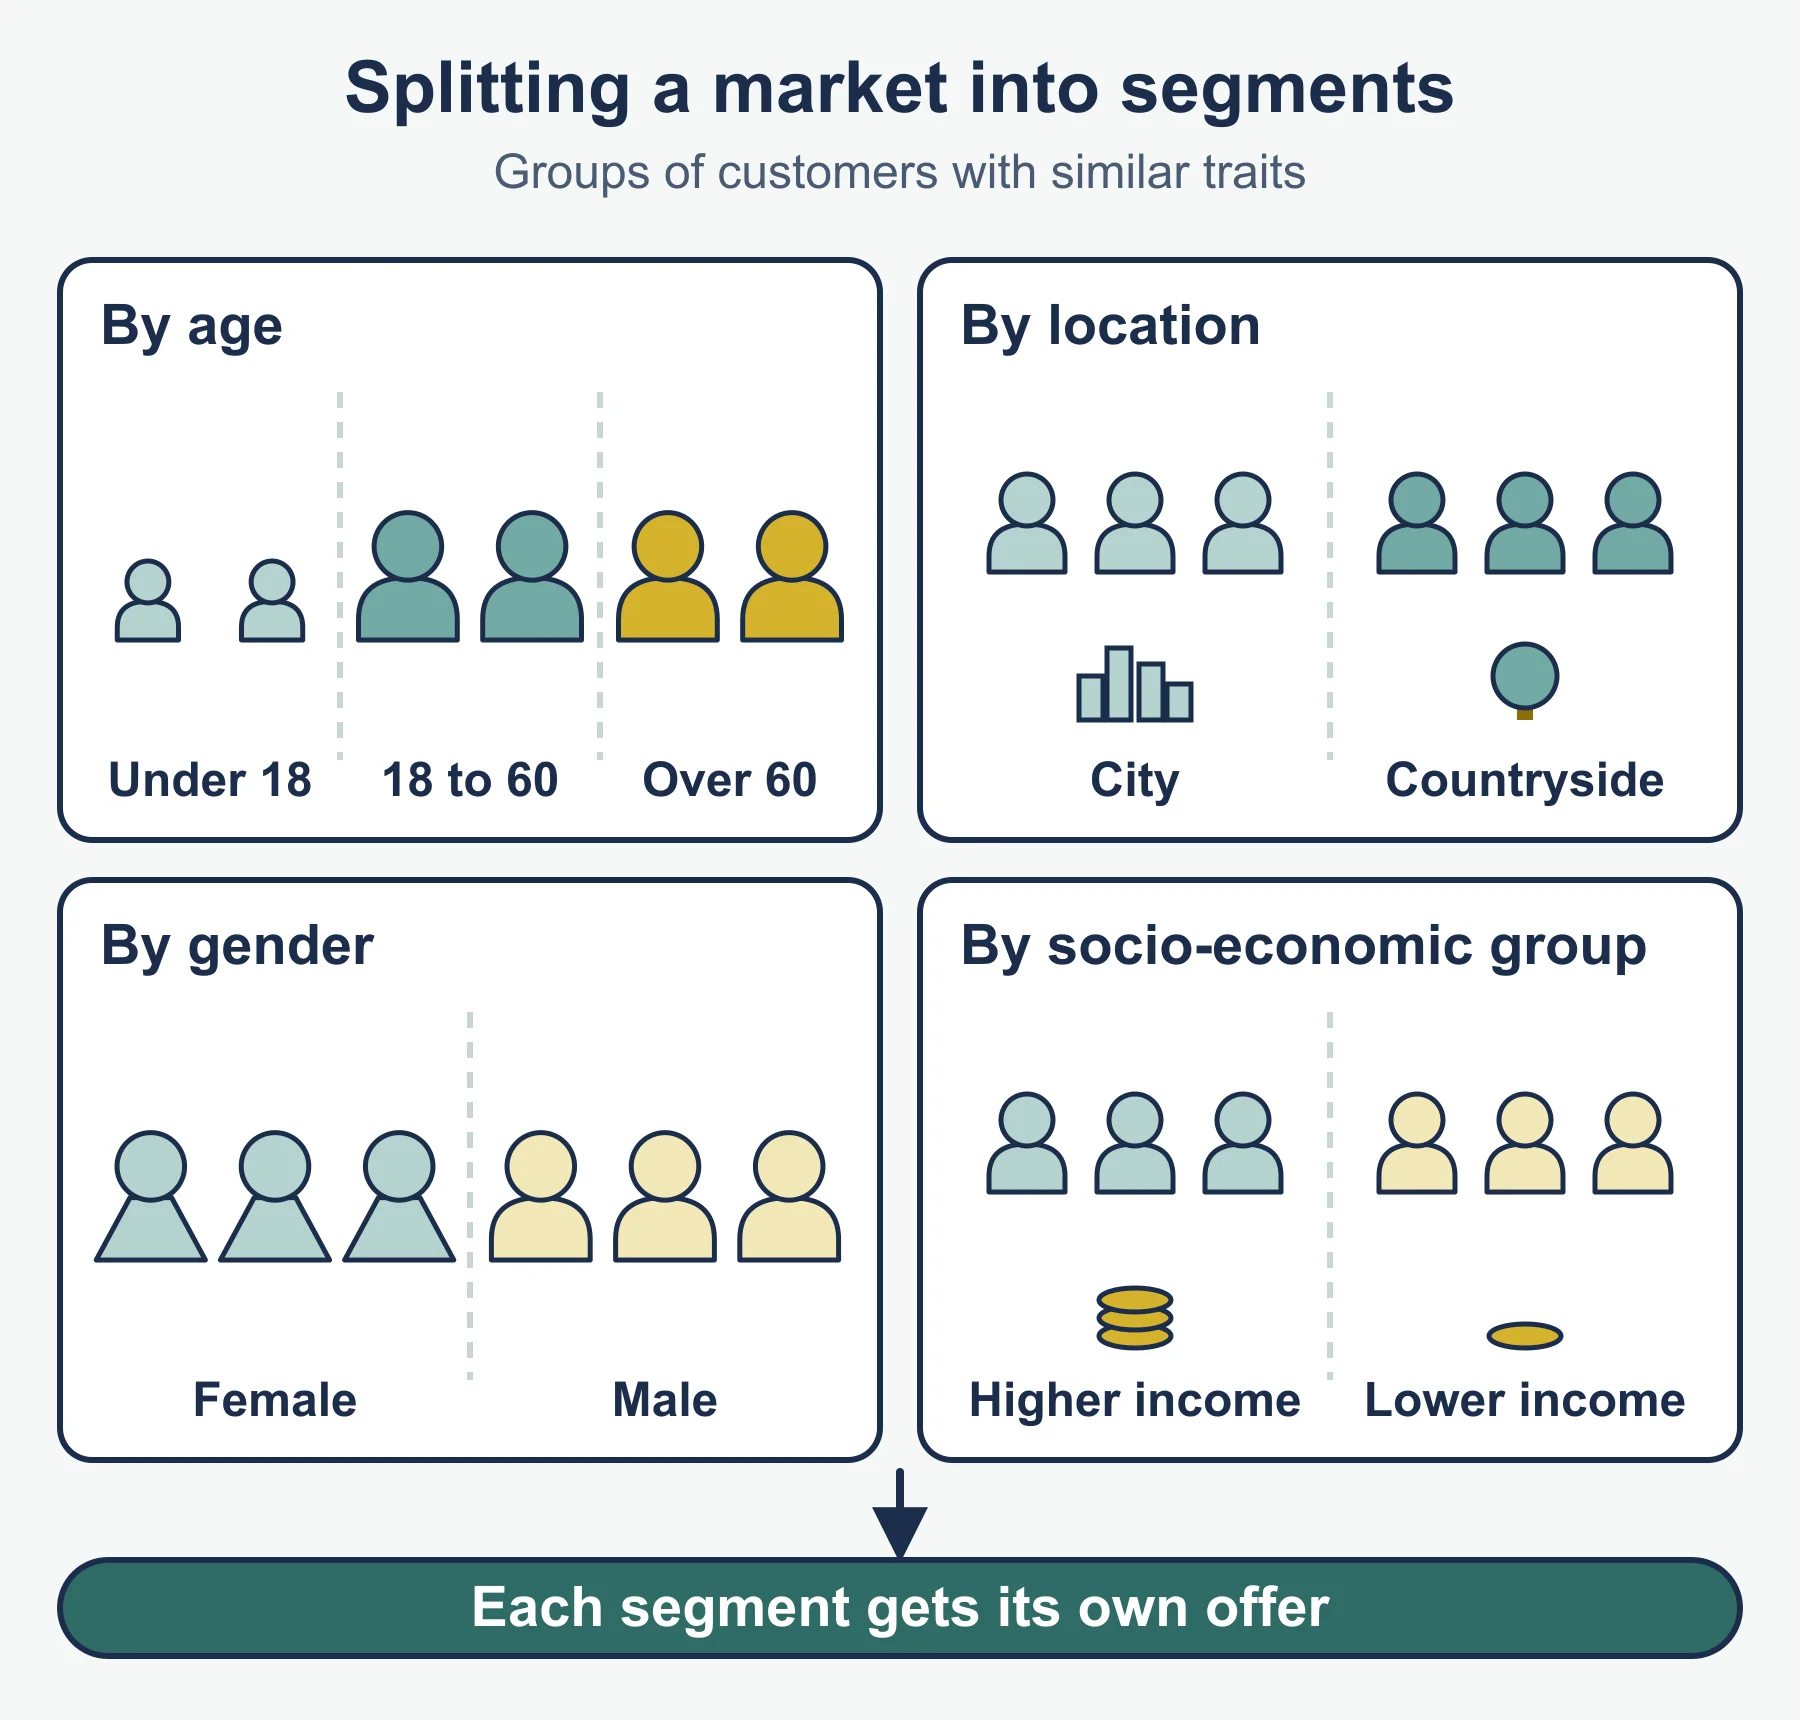
- Segmentation bases: demographic, geographic, psychographic, behavioural.
- Influences on choosing and entering a target market: segment size and growth, competition, resources and brand, objectives, entry cost.
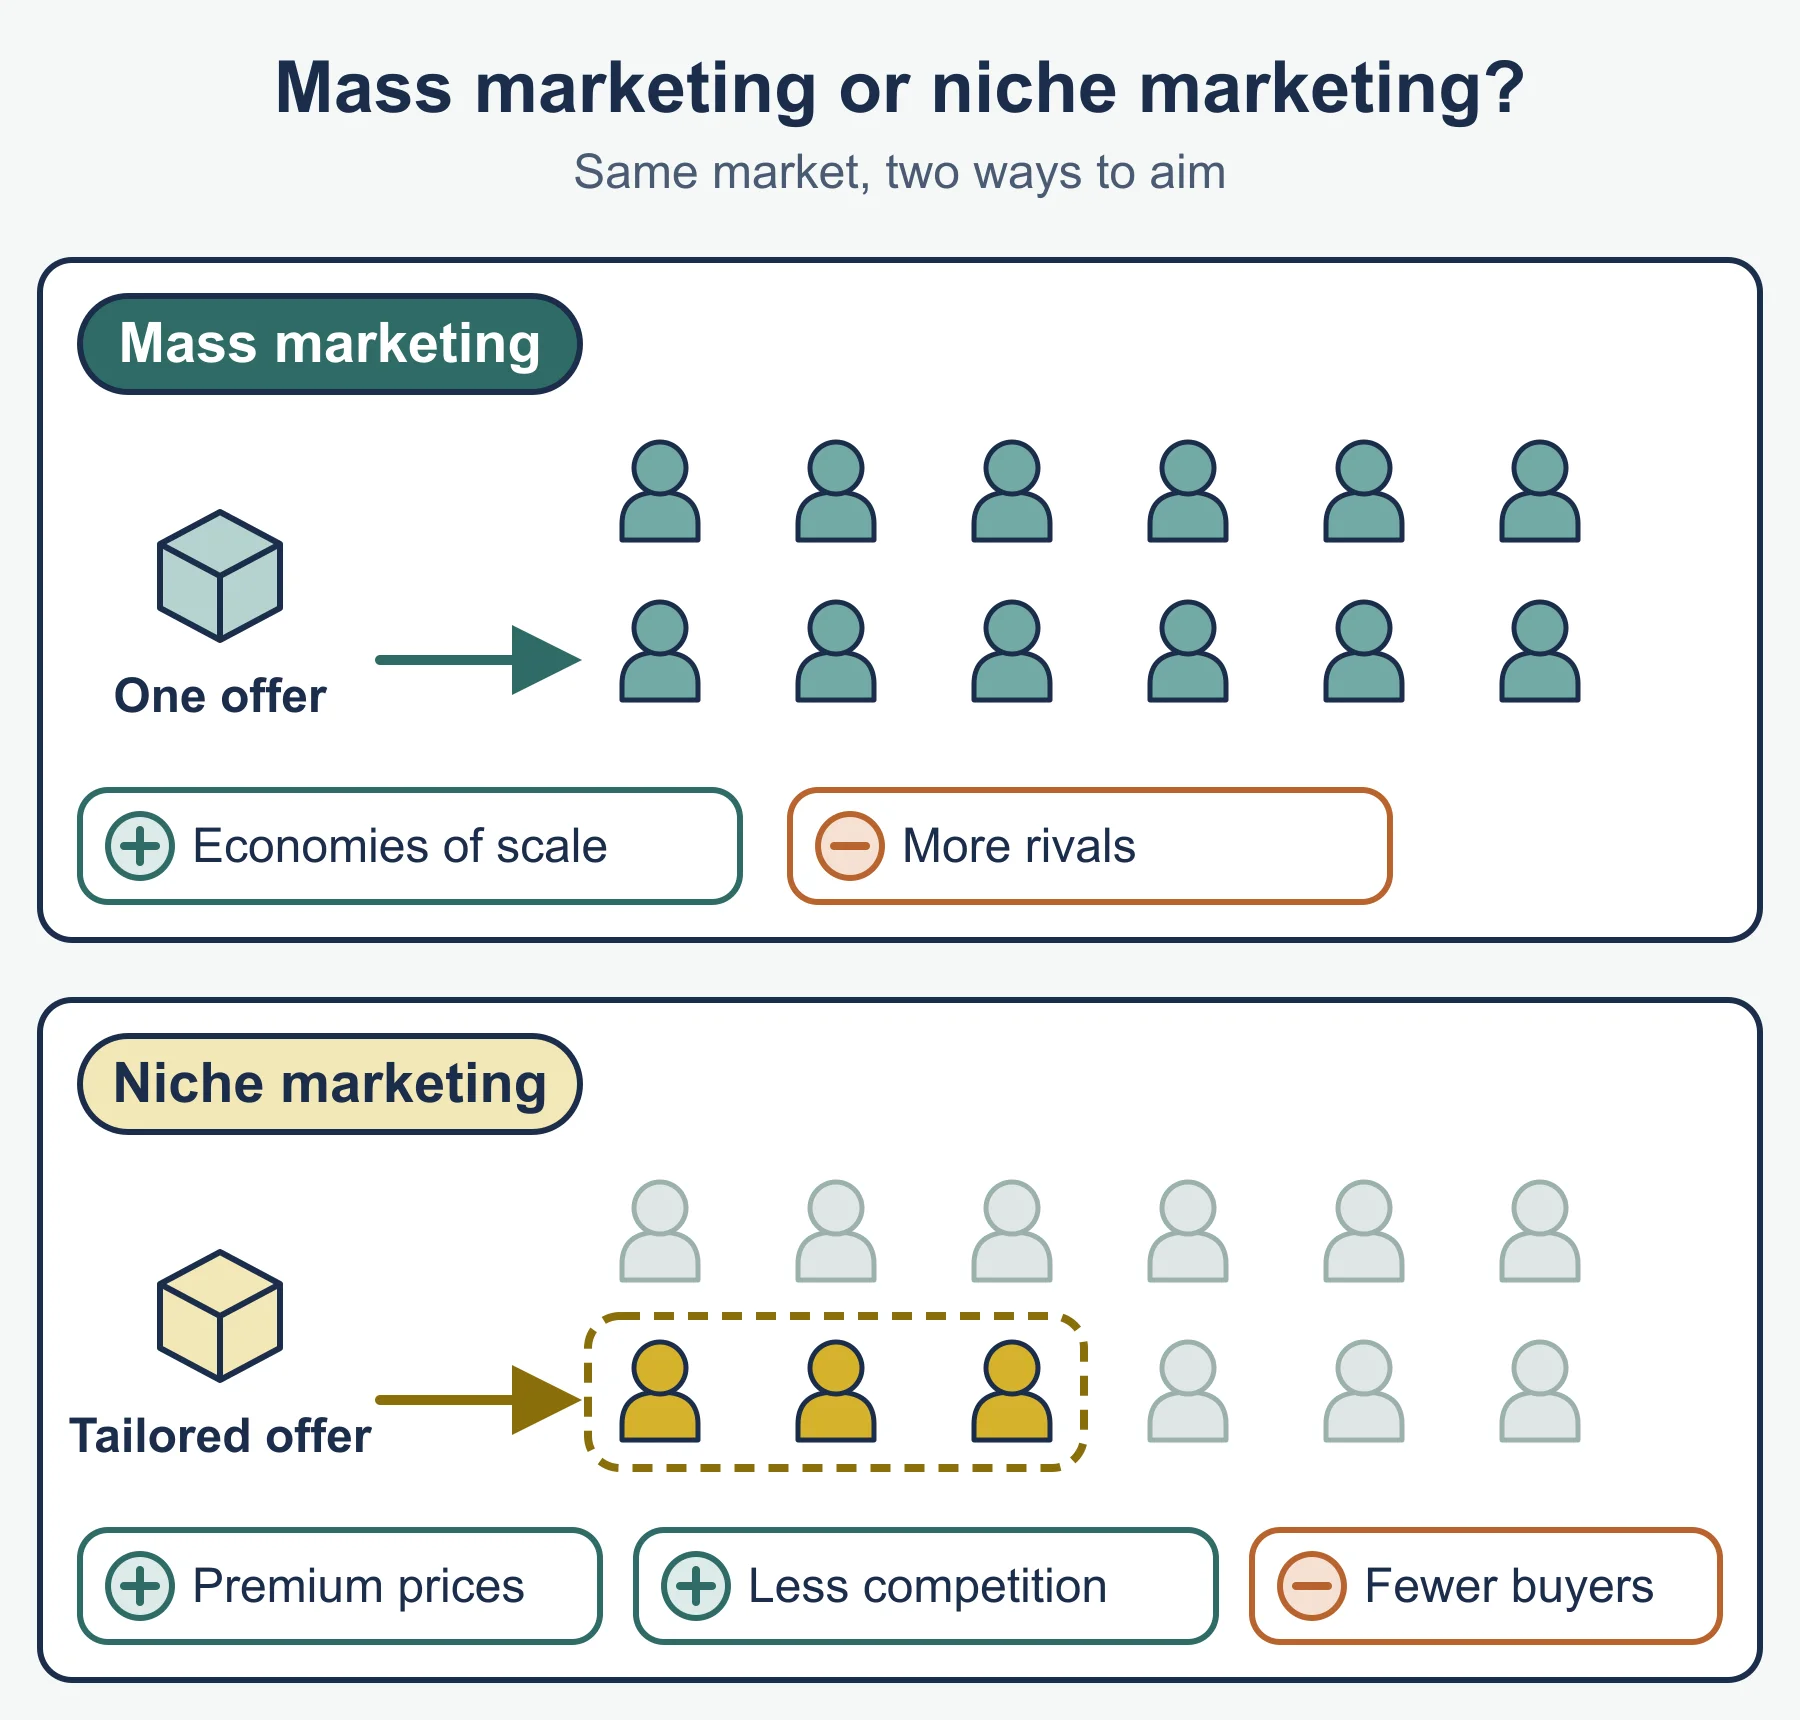
- Niche: small, specialised; less competition, higher prices possible; limited sales, vulnerable if the segment shrinks. Mass: larger sales; more rivals, less tailored.
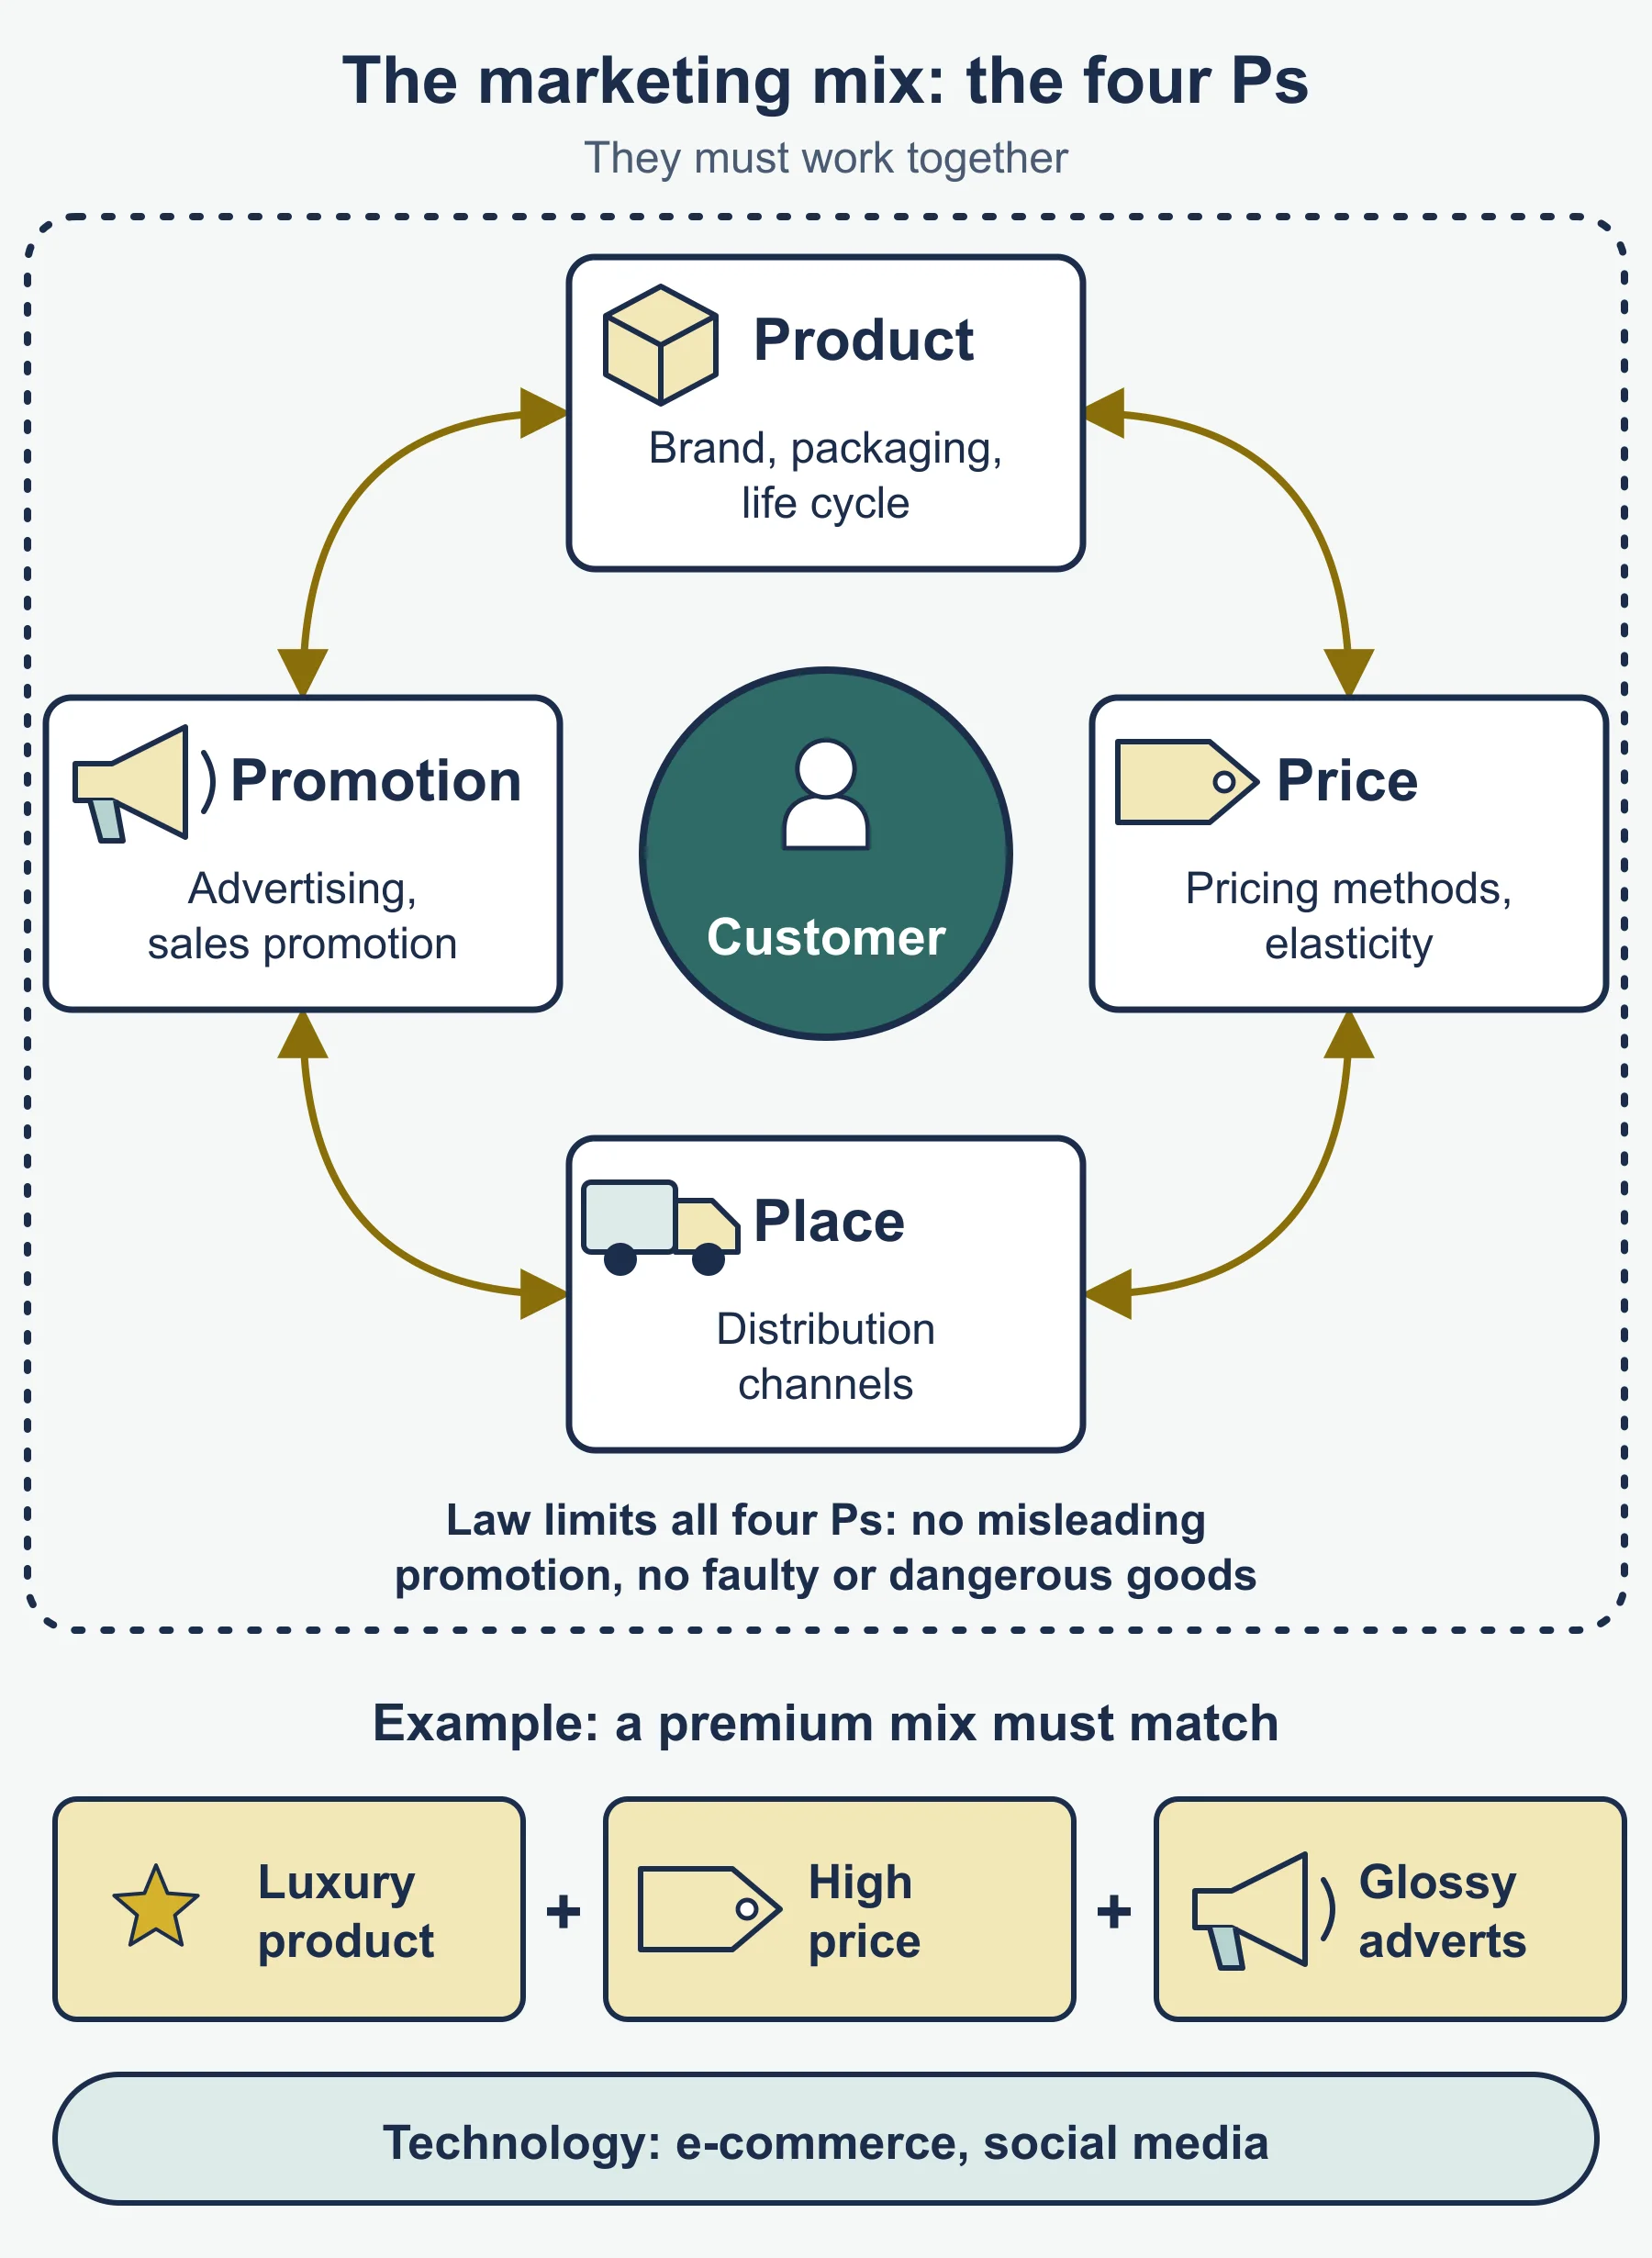
- Adapt the whole mix to the target market so every element fits.
Objectives and planning
- Marketing objectives: lead generation, sales, market share, brand awareness, customer retention, engagement, conversion.
- Influences on objectives: corporate objectives, finance, capacity, rivals, market conditions.
- Budget: influenced by revenue, profit, objectives, rivals and cash; significance is that it limits what can be done.
- Demand changes: rise (capacity, stock), fall (promotion, price, product), cyclical (follows the economy), seasonal (repeats in the year).
- Links: operations (capacity), finance (budget, cash), people (skills).
- Competitiveness: marketing decisions that make the offer more attractive or build loyalty relative to rivals.
Marketing mix
Product
| Tool | Recall |
|---|---|
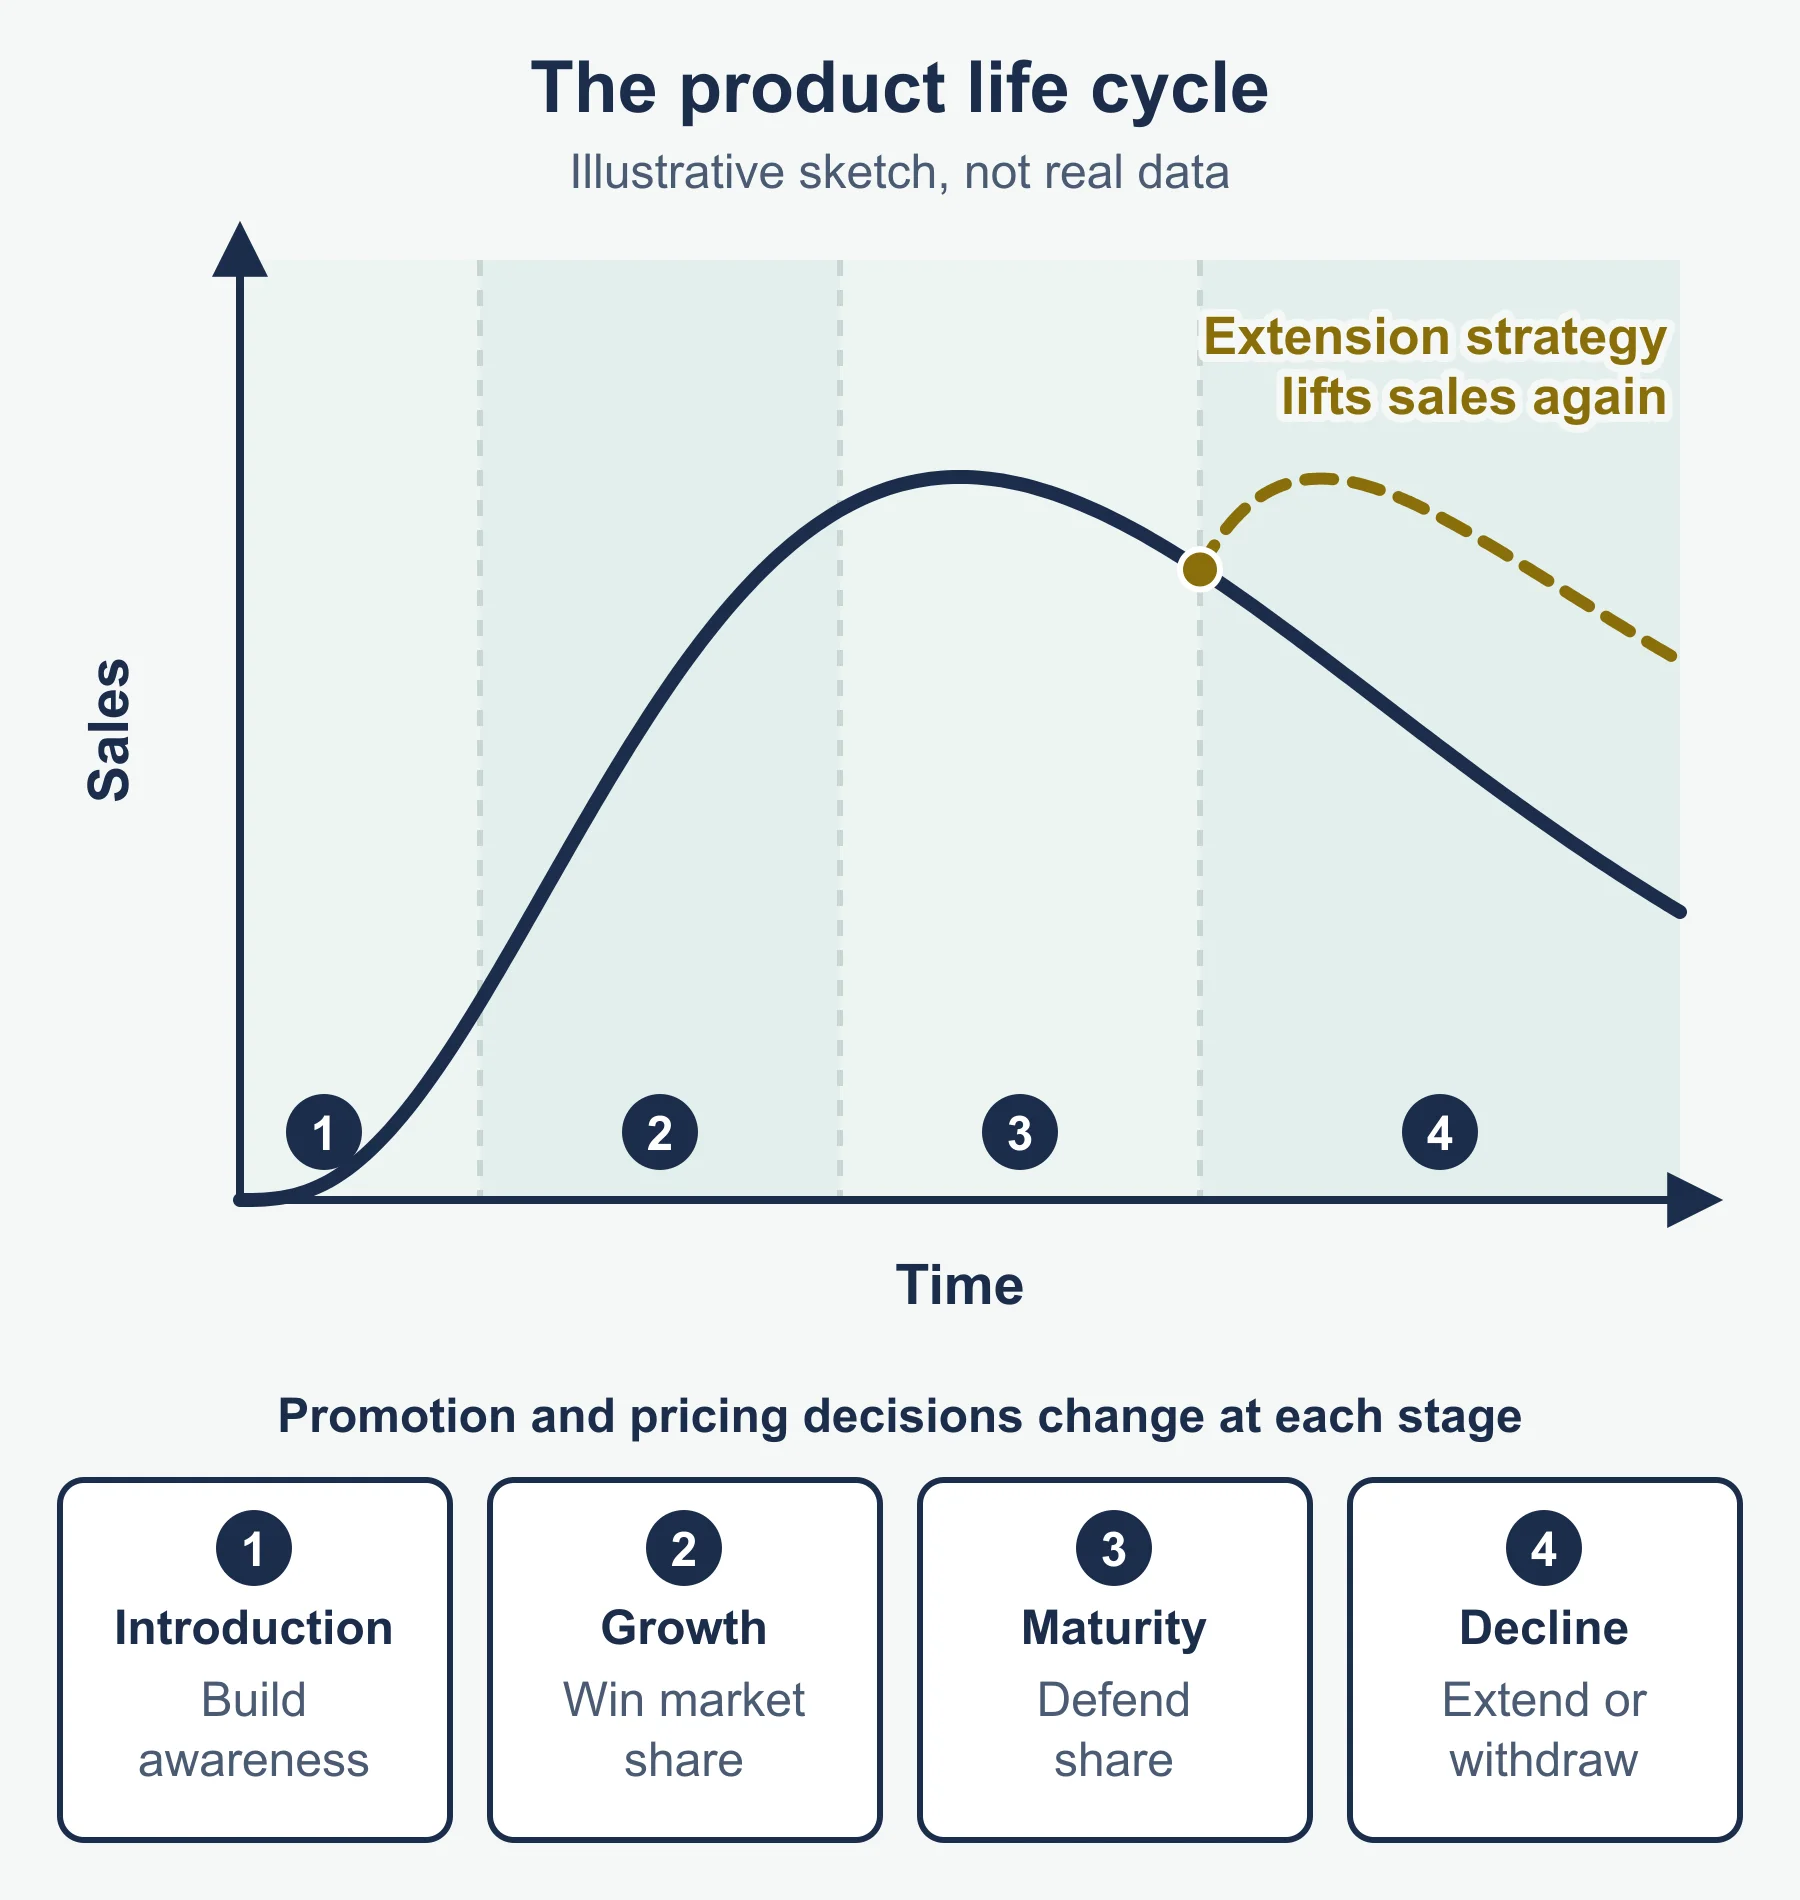
| Product life cycle | Development, introduction, growth, maturity, decline |
| Extension strategies | Advertising, rebranding, lowering the price, adapting the product |
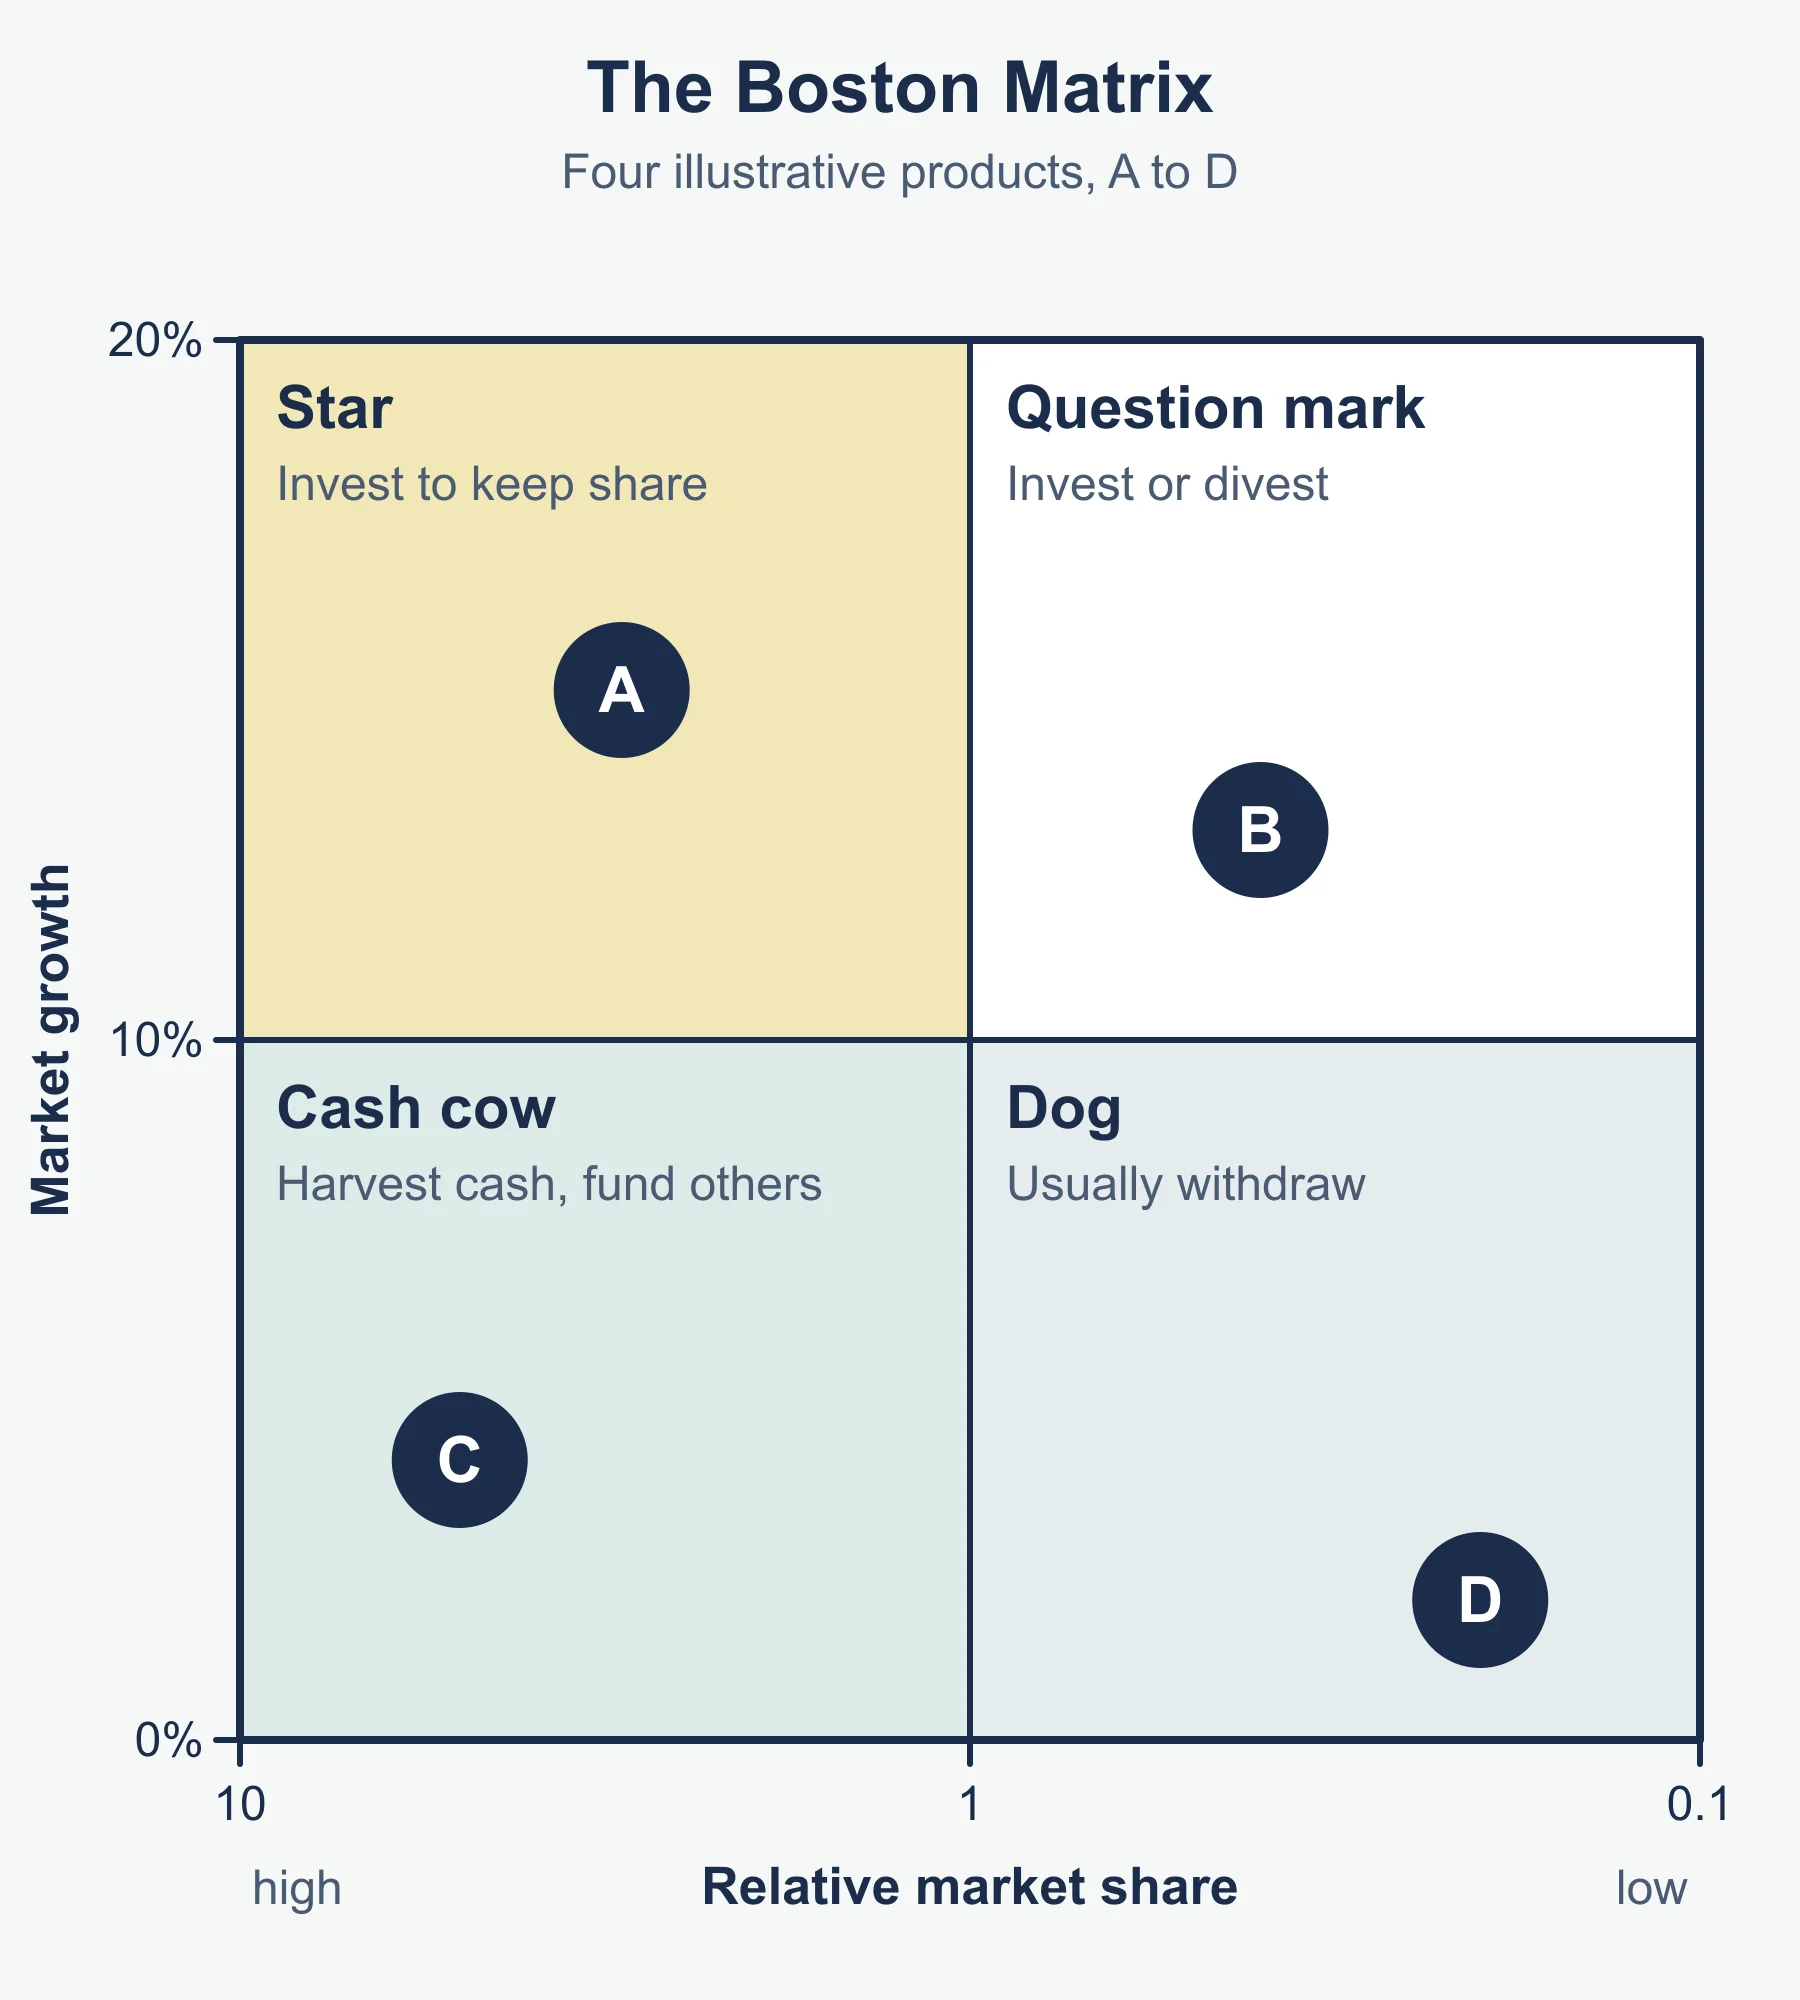
| Boston Matrix | Stars (high share, high growth; invest); cash cows (high share, low growth; fund others); question marks (low share, high growth; invest or withdraw); dogs (low share, low growth; consider dropping) |
| New product development | Purpose: renew range, gain advantage. Challenges: cost, time, failure |
The Boston Matrix looks at many products at one moment; the life cycle follows one product over time.
Price
- Influences: objectives, target market, demand, PED, costs, competitors, rest of the mix.
- Impact on volume, revenue and profit margins: a cut may lift volume but lowers margin per unit.
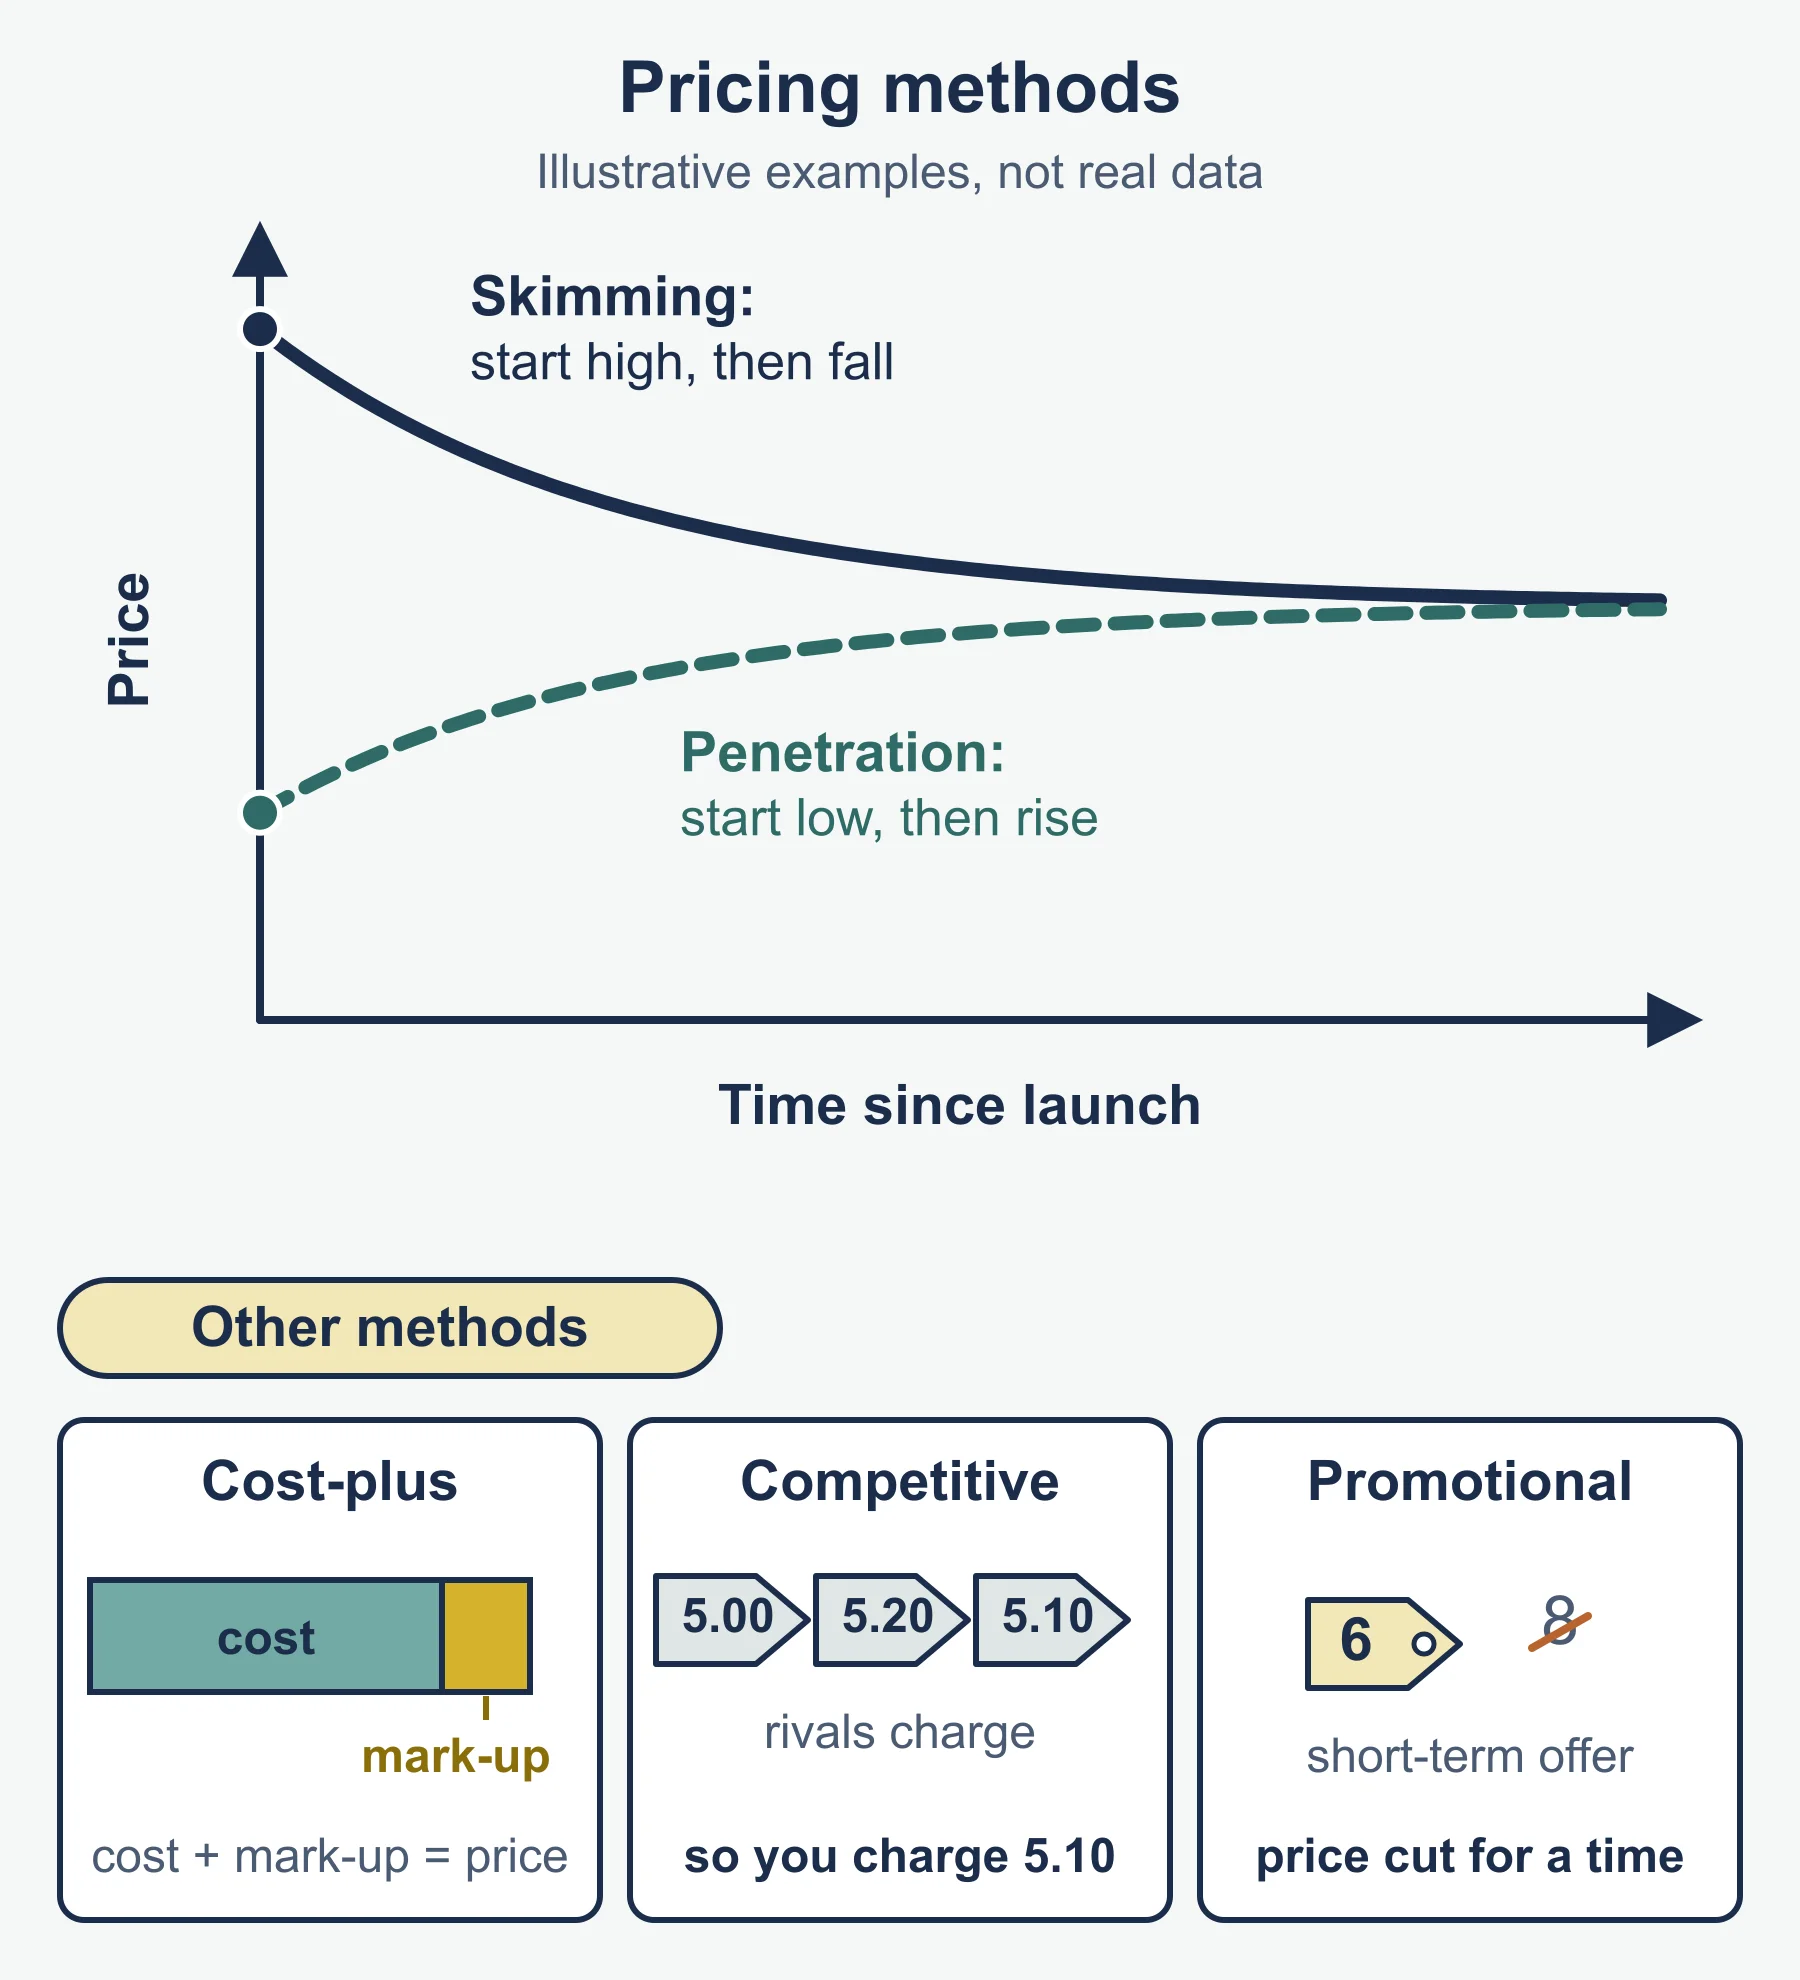
- Cost-based. Demand-based: penetration, price skimming, dynamic pricing. Competition-based: premium, going rate, discount.
Place
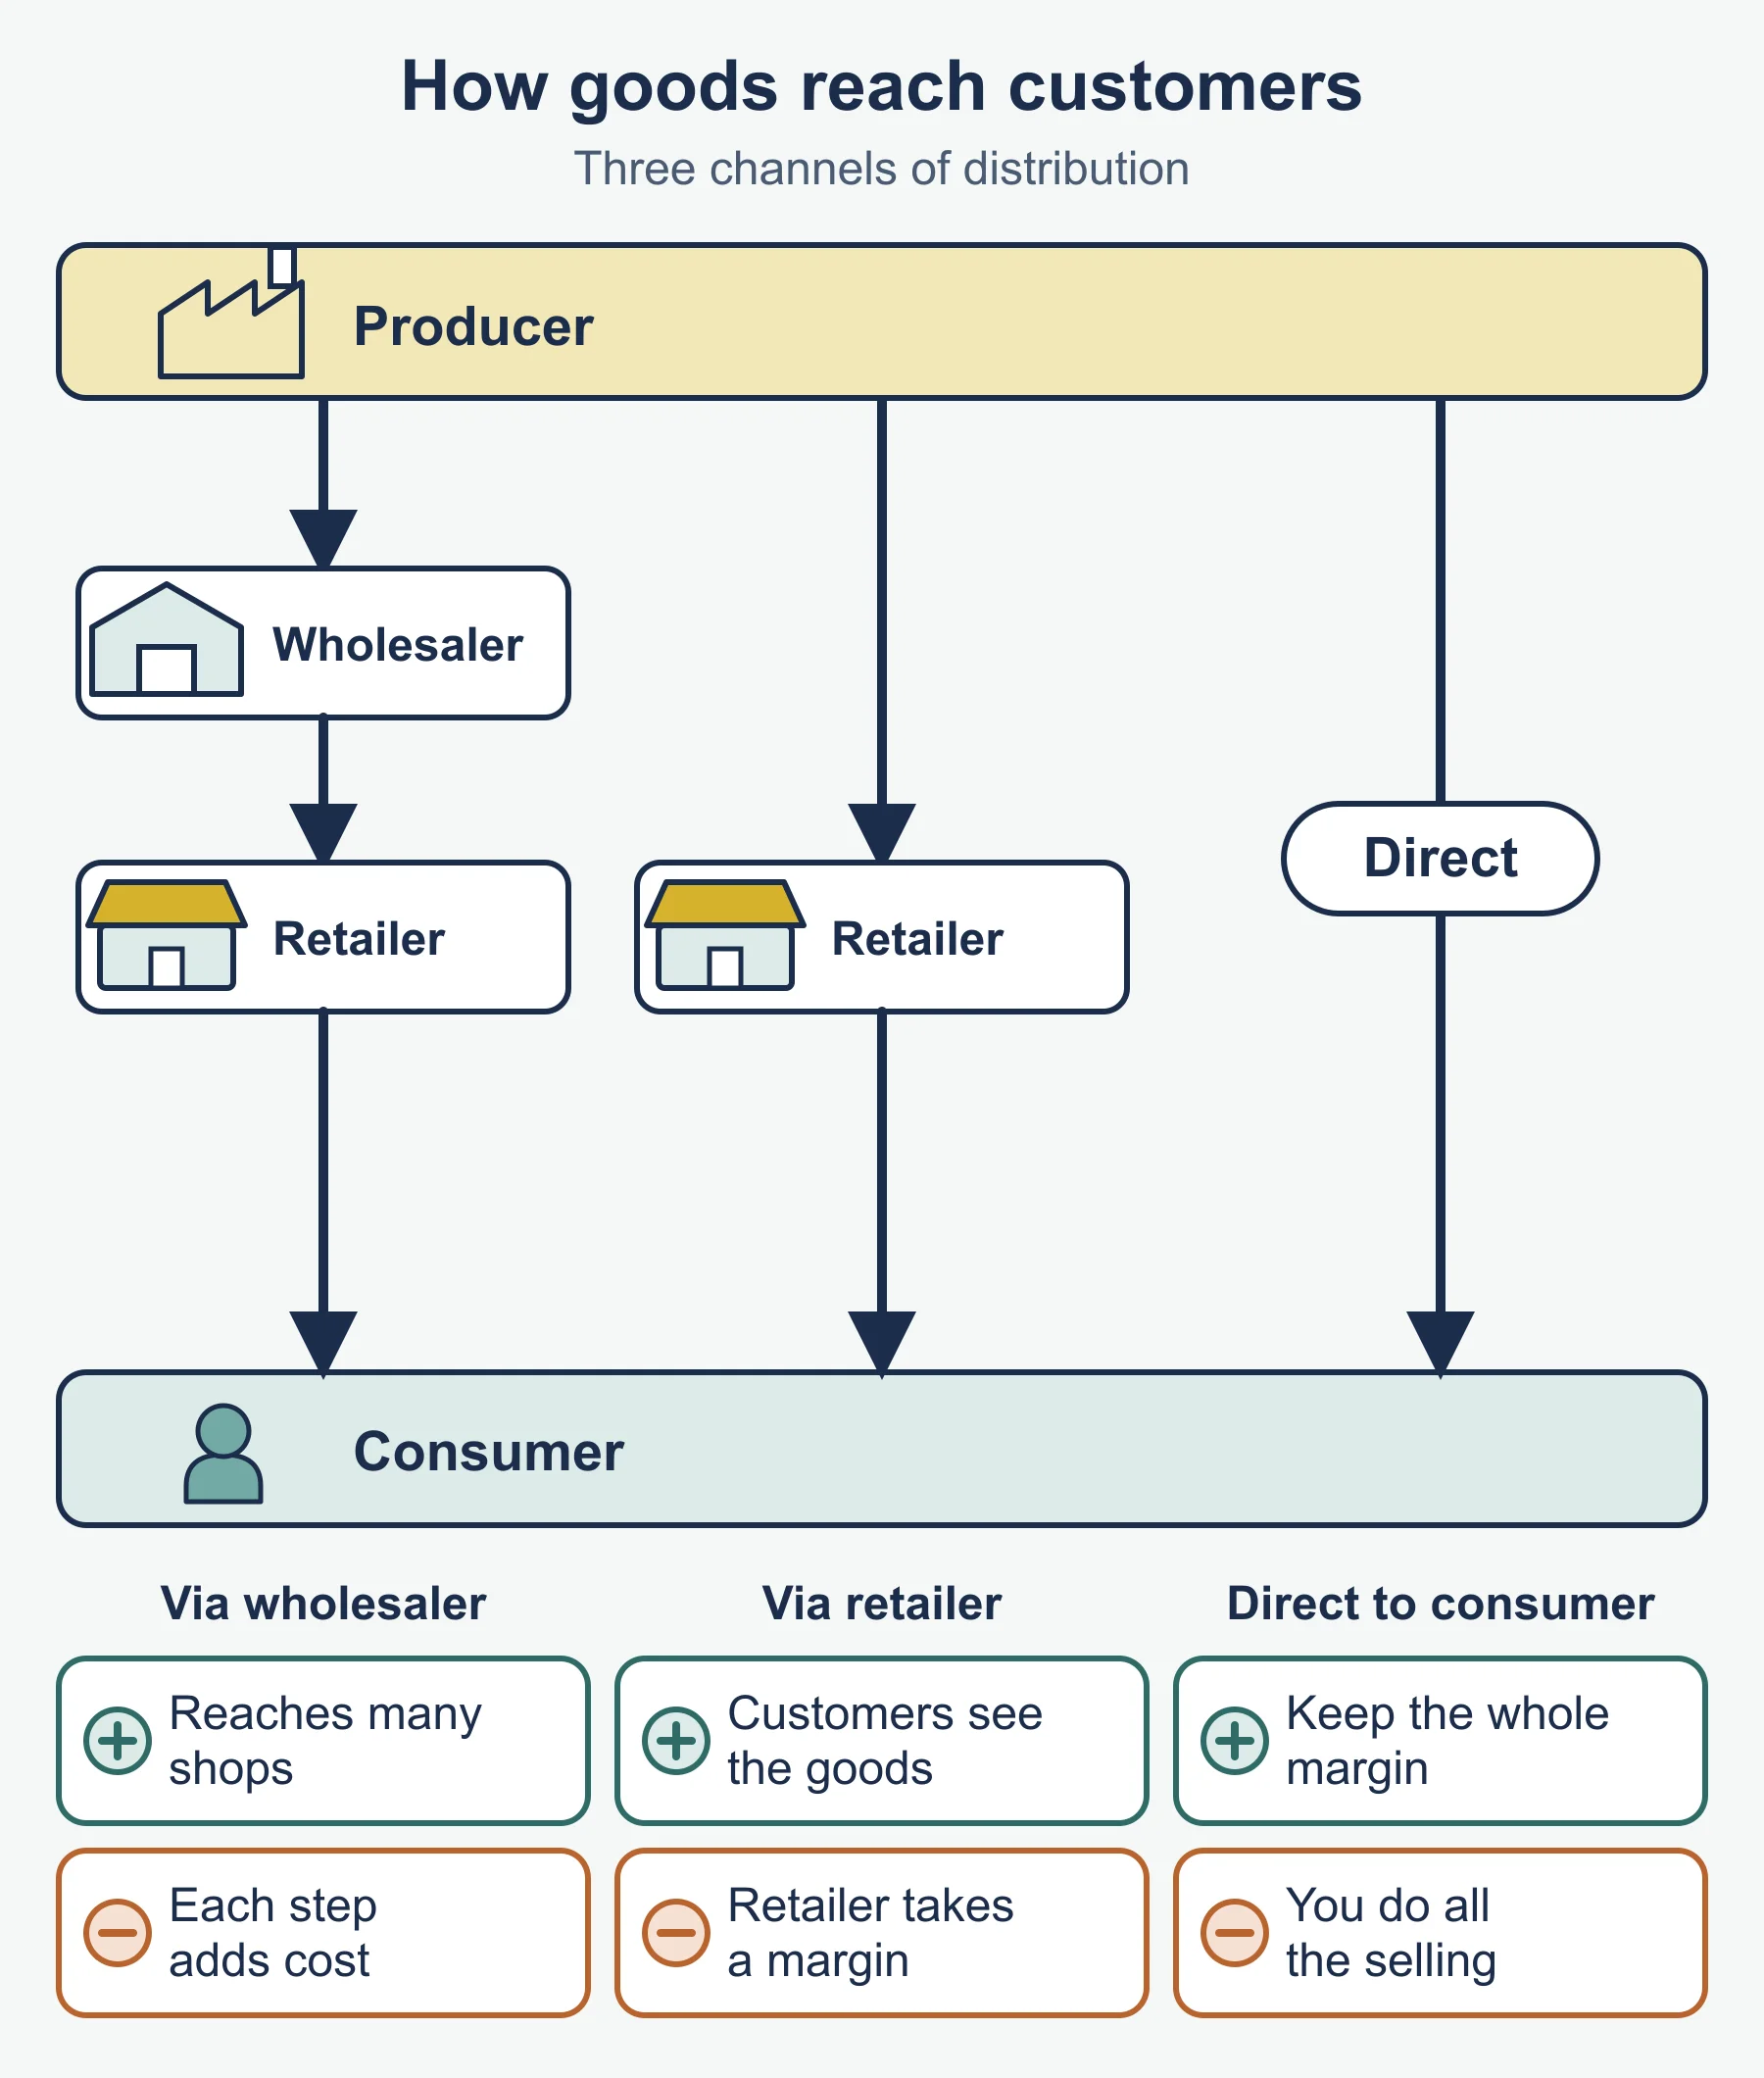
Direct distribution (including e-commerce): control, data, full margin; own delivery costs. Intermediaries (wholesalers, retailers): reach, storage; margin lost, less control. Multi-channel: wider reach; complexity and conflict.
Promotional mix
| Tool | Value | Limit |
|---|---|---|
| Advertising | Wide reach | Cost |
| Social media, influencers | Targeted, interactive | Control, reputation |
| Sales promotions | Short-run sales | Customers wait for deals |
| Sponsorship | Awareness, association | Cost, indirect |
| Personal selling, account managers | Relationships in B2B | Cost per contact |
| Branding, loyalty, own label | Recognition, premium price, retailer margin | Cost; limited outlets for own label |
Influences on the mix: budget, target market, product, objectives, rivals.
Digital technology
- Uses (including AI): social media campaigns, content marketing, SEO, PPC, website cookies.
- Measures of success: search performance, click-through rates, time on site, conversion rates, users or subscribers, advertising revenue.
- CRM: customer acquisition, retention, lead generation, pipeline management.
- Data analytics: segmentation, campaign tracking, personalisation, predictions, dynamic pricing.
- Competitiveness: lower cost per customer and faster response, against set-up cost, poor data and privacy concerns.
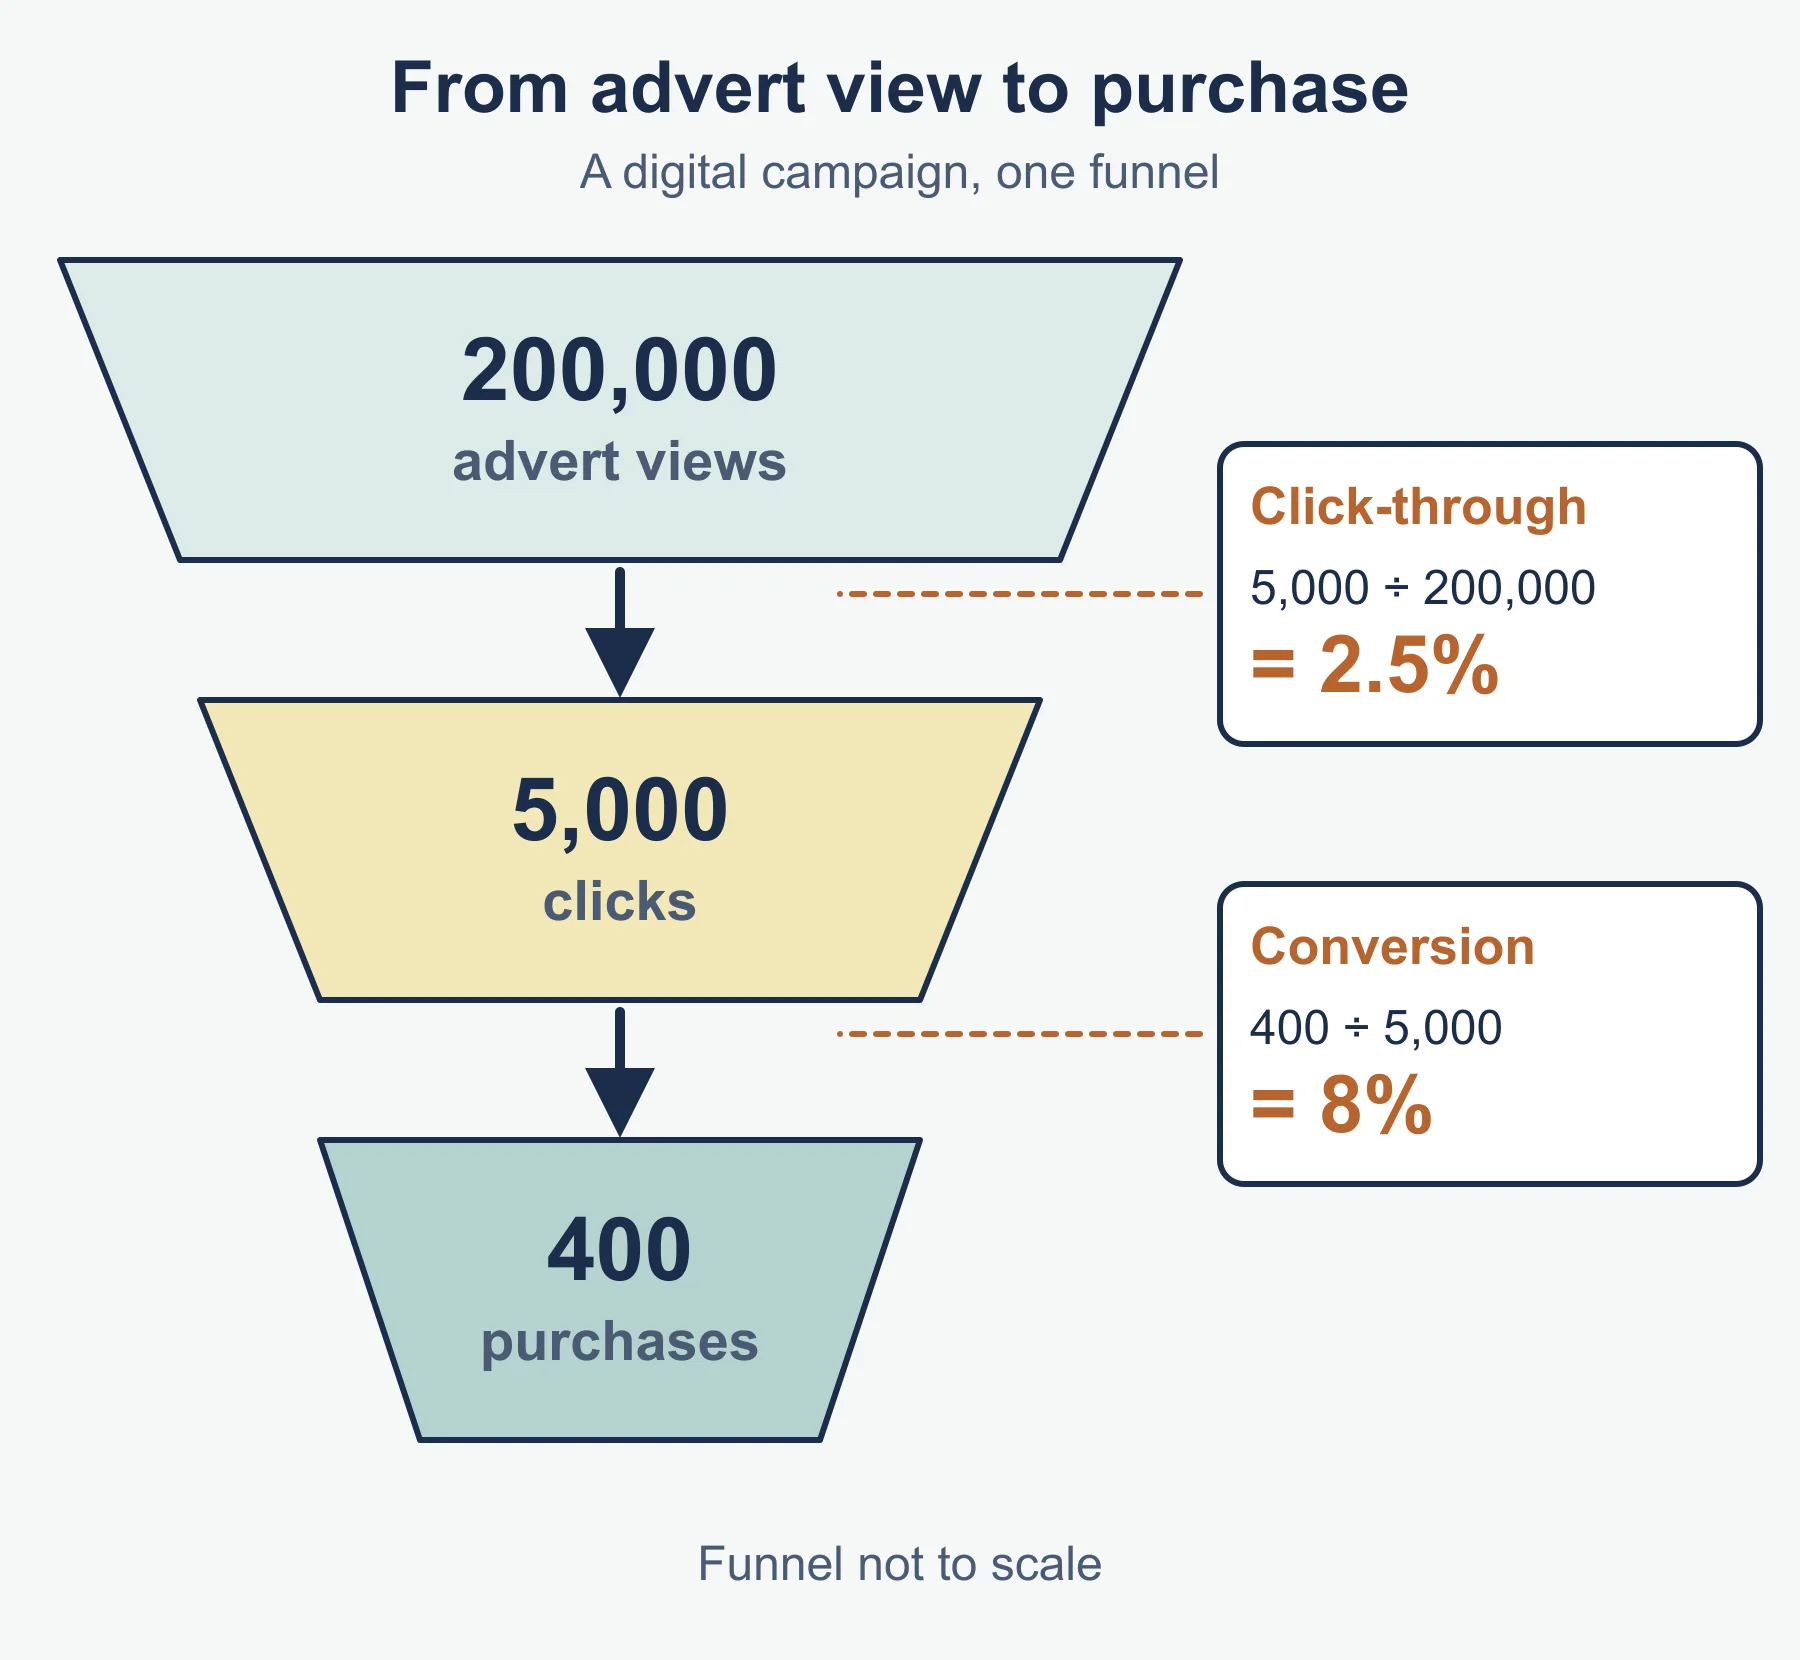
Standard forms: click-through rate = clicks ÷ views × 100; conversion rate = buyers ÷ visitors or clicks × 100.
Must-know distinctions
- Market growth, sales growth and market share: three different measures, so a firm can grow sales yet lose share if the market grows faster.
- Primary and secondary research; quantitative and qualitative data.
- Sales volume and sales value.
- Elastic and inelastic; PED and YED; normal and inferior goods.
- Niche and mass marketing; penetration and price skimming.
- Direct distribution and distribution through intermediaries.
- Corporate objectives and marketing objectives: the second supports the first.
Second reminder set
- Index: a store sells 80 units in the base month and 92 now. Index = 92 ÷ 80 × 100 = 115, so sales are 15% above the base.
- Elastic case: price down 4%, quantity up 10%, PED = 10 ÷ −4 = −2.5. Revenue is 0.96 × 1.10 = 1.056 of the original, up 5.6%.
- Volume and value: units up 6%, price down 8%. Value is 1.06 × 0.92 = 0.9752 of the original, down about 2.5%.
- Digital: 50,000 views, 1,000 clicks, 50 sales. Click-through rate = 2%; conversion rate on clicks = 5%.
Case-study technique
Quantitative questions in the assessment overview are worth 9 or 15 marks and ask you to use the result in analysis and evaluation. For any longer answer: state the point, apply it to the named business with data, explain the effect on sales, share, cost or reputation, weigh it against a limit or an alternative, then close with a judgement that names its conditions (segment size, cash or rivals).
Quick self-test
- Name the four segmentation bases.
- Sales rise from £8m to £9.2m. Calculate sales growth.
- A region’s sales index is 92 against a base of 100. What does it show?
- YED is −0.3. What does it show?
- A campaign cost £8,000 and the profit from marketing activities was £10,000. Calculate return on marketing spend.
- Give one value and one limit of an intermediary.
- Name three digital success measures.
- Why might a wide confidence interval make a launch decision risky?
- Identify the Boston Matrix category with high share in a slow-growing market.
- State two extension strategies.
Answers
- Demographic, geographic, psychographic, behavioural.
- (9.2 − 8) ÷ 8 × 100 = 15%.
- Sales are 8% below the base period.
- Inferior good: demand falls as income rises.
- 10,000 ÷ 8,000 × 100 = 125%.
- Value: reach or storage. Limit: takes a margin or loses control.
- Any three from search performance, click-through rate, time on site, conversion rate, users or subscribers, advertising revenue.
- The true figure could lie anywhere in a wide range, including a level too low to pay.
- Cash cow.
- Any two from advertising, rebranding, lowering the price, adapting the product.
Where marks are lost
- Wrong base year in percentage change, share or index.
- Quoting an elasticity value without saying what it means for revenue.
- Describing the Boston Matrix without a decision.
- Applying the mix without linking it to the target market.
- An evaluation that repeats advantages and disadvantages with no reasoned judgement.
Frequently asked questions
What are the four segmentation bases in AQA AS Business 7137? Demographic, geographic, psychographic and behavioural segmentation.
How does price elasticity affect revenue? If demand is elastic, a price cut raises revenue and a price rise lowers it. If demand is inelastic, a price rise raises revenue and a price cut lowers it.
What is the difference between the Boston Matrix and the product life cycle? The Boston Matrix looks at many products at one moment, while the product life cycle follows one product over time.
How do you calculate click-through rate and conversion rate? Click-through rate = clicks ÷ views × 100. Conversion rate = buyers ÷ visitors or clicks × 100.
What marketing objectives are listed in AQA AS Business? Lead generation, sales, market share, brand awareness, customer retention, engagement and conversion.
Official syllabus
AQA AS and A-level Business (7137, 7138) specification, version 1.1, November 2025: section 3.1.3 Marketing management, the assessment overview and the Annex on quantitative skills and formulae.
Get free revision emails (optional)
Occasional emails with practice questions, worked explanations and links to free resources for the qualification and subjects you choose. No spam, and you can unsubscribe from any email. The free tools on this site never need an email.
Related resources
-
Study guides
AQA AS-Level Business: Financial management (7137)
Study guide to financial management for AQA AS Business (7137), sub-topic 3.1.4: objectives, budgets, break-even, profitability, cash flow and finance.
Business · AQA · AS Level
Read guide -
Practice questions
AQA AS-Level Business: Financial management (7137) – Practice Questions
Thirteen original practice questions with worked answers on financial management for AQA AS Business (7137) 3.1.4: calculations, short answers and cases.
Business · AQA · AS Level
Try questions -
Revision notes
AQA AS-Level Business: Financial management (7137) – Revision Notes
Condensed revision notes for AQA AS Business (7137) 3.1.4 financial management: formulas, methods, key distinctions and a self-test with answers.
Business · AQA · AS Level
Revise topic
Related articles
-
teaching
A Level tuition in Dubai: Cambridge or Pearson Edexcel International A Level?
Schools in Dubai and Abu Dhabi teach either Cambridge International AS & A Level or Pearson Edexcel International A Level. How the two are structured, why it matters for tuition, and how online classes from Lahore work.
9 October 2026
-
curriculum guides
Choosing subjects at IGCSE and A Level
How subject choices at 14 and 16 affect university options later, and how to keep pathways open without overloading a timetable.
28 July 2026
Studying this with a teacher
Working through Business AS LEVEL?
This page is free and stays free. If you would rather be taught it, Marlbridge runs Business classes one-to-one and in small groups of up to 15, online in your own time zone. The first trial class is free. WhatsApp replies within an hour (8am–11pm Pakistan time, every day); email the same day.
AQA Business teachers at Marlbridge
